
Design of Smart Cable for Distributed Cable Force Measurement in Cable Dome Structures and Its Application

1
State Key Lab of Offshore and Coastal Engineering, Dalian University of Technology, Dalian 116024, China
2
China Construction Eighth Engineering Division Corp. Ltd., Dalian 116000, China
*
Author to whom correspondence should be addressed.
Buildings 2023, 13(9), 2186; https://doi.org/10.3390/buildings13092186
Submission received: 5 August 2023
/
Revised: 20 August 2023
/
Accepted: 24 August 2023
/
Published: 28 August 2023
(This article belongs to the Topic Development of Monitoring, Analysis and Maintenance Technics of Infrastructures)
Abstract
:The stay cable is one of the most critical structural components of a cable dome structure. However, during its service life, it may lose its stiffness due to environmental factors and metal fatigue, thus making the structure a safety hazard. As the most important mechanical physical parameter of the cable, it is necessary to create a health-monitoring method to ensure the safety of the structure. In this study, a smart cable with a fiber optic Bragg grating (FBG) sensor is proposed. The sensor is embedded in the Z-shaped cable of the stay cable to ensure the simultaneous deformation of the sensor and cable. The monitoring of the cable force can be achieved after obtaining the relationship coefficient between the sensor and the cable force. In the rest of the paper, the sensing principle and fabrication procedure are described. A series of tests are conducted to verify the sensing performance of the smart cable. Finally, the dynamic monitoring and long-term monitoring of the cable force in the cable-supported grid system of Dalian Suoyuwan Football Stadium are carried out by using the smart cable, and the stability and safety of the structure are evaluated by the monitoring results.
1. Introduction
The cable dome structure is a new type of long-span space structure developed by American engineer Geiger in the 1980s on the basis of the Fuller tensioner structure. It is a tensioner integrated system based on the principle of tension and compression coexistence, which connects continuous cables with discontinuous rods. During the tensile phase of the structure, pre-stressing the cable is required to provide the necessary stiffness. In the operation phase of the structure, the cable plays the role of stabilizing the structural stiffness, maintaining the tensile shape of the structure and providing the load-bearing capacity of the structure. However, at this stage, the structure usually loses stiffness due to adverse factors, such as vibration [1,2], corrosion [3,4,5], impact [6,7], crack [8,9], etc. [10]. Wind load is the main control load of the flexible structure formed by the cable and support [11], and the response of the structure under load is very sensitive. In recent years, the failure cases of some long-span cable-supported structures under wind load have fully shown that the cable is the main control and bearing element of the structure, and the cable force is an important control parameter in the tension and operation stage of the structure, which is of great significance to the shape and safety of the structure. Real-time dynamic monitoring of the cable force is of great significance to the safe construction and operation of the structure.
At present, the main methods of cable-force monitoring include oil pressure gauge measurement [12], magnetic flux measurement [13] and vibration measurement [14]. Oil pressure gauge method is usually used in the tension stage of the structure, using the oil pressure gauge and adjusting the pre-stressed jack to measure the cable force. Although this method is very mature and has a highly costly performance, it can only be monitored in the tensioning stage and cannot meet the needs of cable-force monitoring in the operation stage.
Magnetic flux method is a method that uses a small electromagnetic sensor placed on the cable to measure the change of magnetic flux and calculates the cable force according to the relationship between the cable force, temperature and the change of magnetic flux [15]. The defect of this method is that it is easily affected by electromagnetic interference, and the magnetism of ferromagnetic materials is easily affected by chemical composition, organizational structure, impurities, defects, non-uniformity of materials, temperature, wire twisting, etc., resulting in uneven measurement zero points and the need to correct the temperature. Therefore, although its precision is suitable for the cable-force monitoring of cable-stayed bridges, its measurement accuracy cannot meet the requirements of cable-force monitoring in cable dome structures under a complex environment.
The method of vibration measurement of the vibration frequency is to use the mechanical parameters of the cable, establish the structural model of the cable, carry out modal analysis to obtain the relationship between the frequency [16] and the cable force, and convert the cable force by measuring the natural vibration frequency of the cable according to the different excitation methods for measuring the cable vibration; the frequency method can be divided into artificial excitation method and random excitation method. When the artificial excitation method is used to measure the vibration frequency of the cable, the method of artificial excitation should be used to make the cable vibrate at a single fundamental frequency. The random vibration method is used to measure the vibration frequency of the cable by the wind, bridge floor vibration and other random excitation sources. Then, the vibration signal of the cable under artificial excitation and random excitation is obtained by the acceleration sensor [17], and the frequency spectrum of the vibration signal is analyzed by the spectrum analyzer to obtain the fundamental frequency of the cable, or the fundamental frequency is calculated by the first several orders of the vibration frequency of the cable. The frequency method can only be an artificial and temporary measurement and cannot realize the long-term real-time monitoring of the cable. Meanwhile, the measurement results are easily interfered by various external factors. This method is often affected by sag, slope and other factors related to cable force measurement results. The results of cable force measurement by frequency method are related to the installation position of the vibrator, whether the cable vibrates or not, the span, sag, slope and boundary conditions of the cable, etc. The signal processing is also relatively complicated and cannot achieve all-weather real-time monitoring. In addition, due to the complexity of cable connections in the cable dome structure, the distribution of cable forces before and after the cable clamps is different, so in order to ensure the safety of the cable dome structure, a real-time dynamic and distributed cable-force monitoring method is needed.
Fiber Bragg Grating (FBG) sensors have been widely used for practical engineering in the past two decades over the world [18]. The periodic grating inside the FBG changes the wavelength of the reflected light according to the surrounding environment, and this property is used to measure the change of physical quantities in the axial direction of the fiber. In addition, due to its small size, lightweight property, shape malleability, high sensitivity, corrosion resistance, and resistance to electromagnetic interference, this technology can achieve real-time, dynamic, and long-term measurements of various physical quantities [19]. However, since the FBG sensor cannot be mounted on the cable without a support structure [20], in order to synchronize the deformation of the sensor with the object to be measured, it is necessary to weld or bond the sensor to the object to be measured by means of a base. Based on the above information, in this paper, the authors have innovatively used the method of embedding the FBG sensor into the Z-shaped cable of the stay cable to achieve a consistent deformation of the FBG sensor with the stay cable.
In this paper, a novel, smart stay cable based on FBG sensors is proposed. The smart cable is designed so as to achieve the simultaneous deformation of the sensor and the diagonal cable by embedding FBG sensors into the Z-shaped cable with an inscribed groove. The second section describes, in detail, the sensing principle and manufacturing process of the smart cable. The third section verifies the performance of the smart cable through calibration tests and accuracy tests. Finally, the application case of cable-force monitoring in Dalian Suoyuwan Football Stadium proves that the smart cable meets the needs of a real-time, dynamic and long-term monitoring of the cable force by the cable support grid system.
2. Fabrication Procedure of Smart Cable
In this section, the measurement principle and structural design of the smart cable were described. The implementation of the distributed measurement of the cable force by smart cables is also described in detail.
2.1. Measurement Principle of Smart Cable
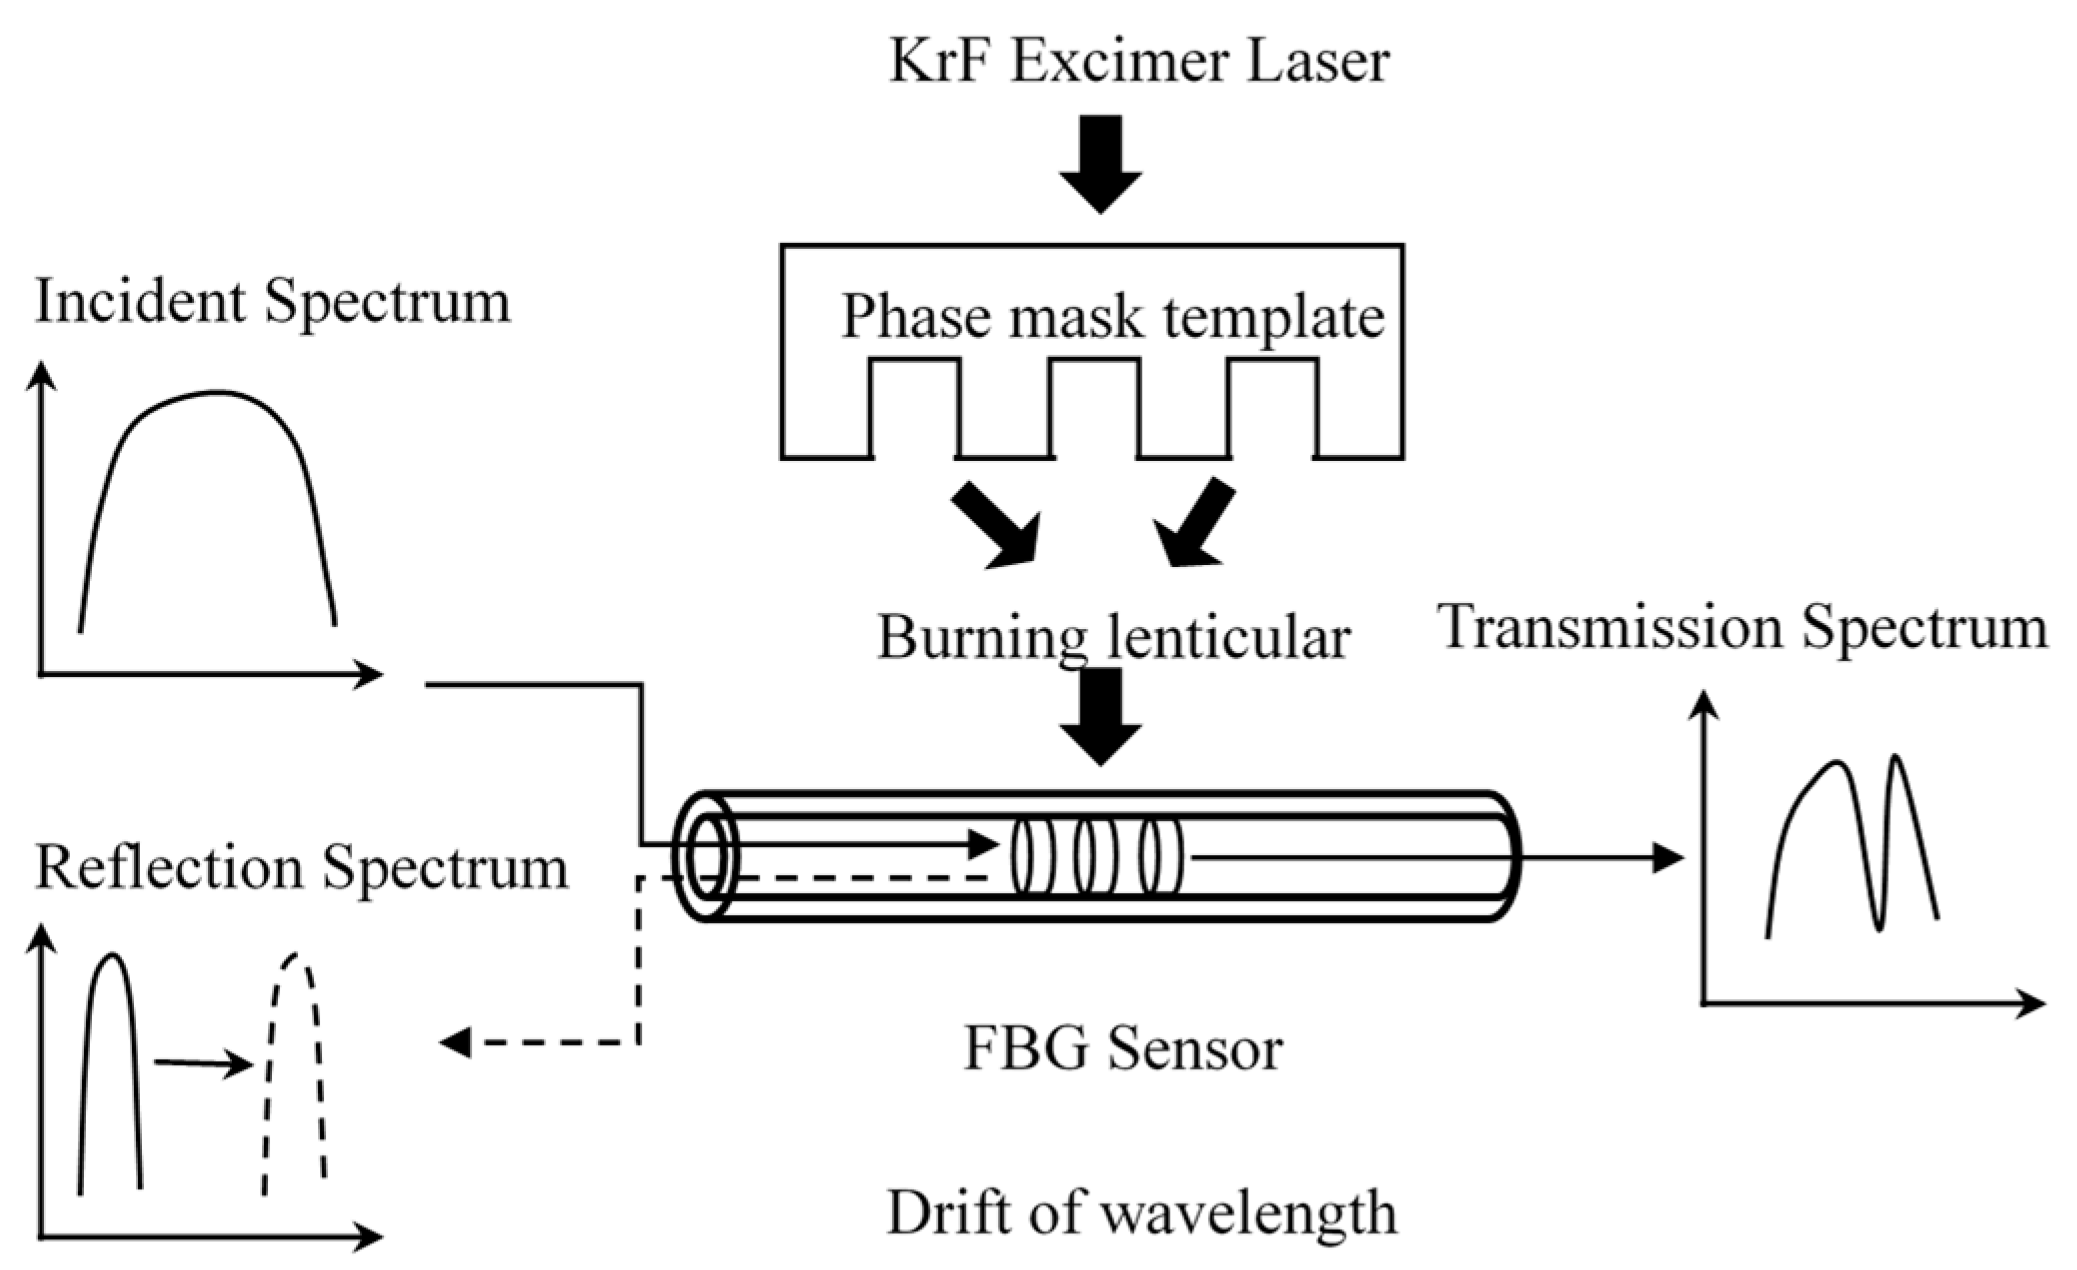
FBG sensors are sensed by modulation of the central wavelength of the FBG by external variables. According to the FBG diffraction principle, when a beam of light enters the grating, only a specific wavelength of light is reflected, and the rest of the wavelength continues to travel through the FBG without loss, as shown in Figure 1.
The wavelength λ at the peak of the reflected light wave is:
In Equation (1) [21], n is the refractive index of the fiber core to the central wavelength in free space, and Λ is the period of the phase mask grating. The initial wavelength λ0 of the FBG sensor can be measured using a fiber grating demodulator. When the strain εg changes, the elasto-optical effect causes a change in the refractive index and period stretching of the grating. The FBG strain ε is related to the strain εm of the monitored substrate (steel strand) by the strain transfer rate β. The difference between the initial wavelength and the central wavelength is the wavelength drift of the FBG Δλ. The relationship between the strain and the wavelength drift is as follows:
In Equation (2) [21], Kε is the FBG strain sensitivity, and Kε’ is the FBG monitoring strain sensitivity, which can be determined by calibration. The relationship between the strain εm of the monitored substrate and the cable force F is εm = F/EA, where E and A are the modulus of elasticity and cross-sectional area of the monitored substrate, respectively. Therefore, the relationship between Δλ and F can be obtained as follows:
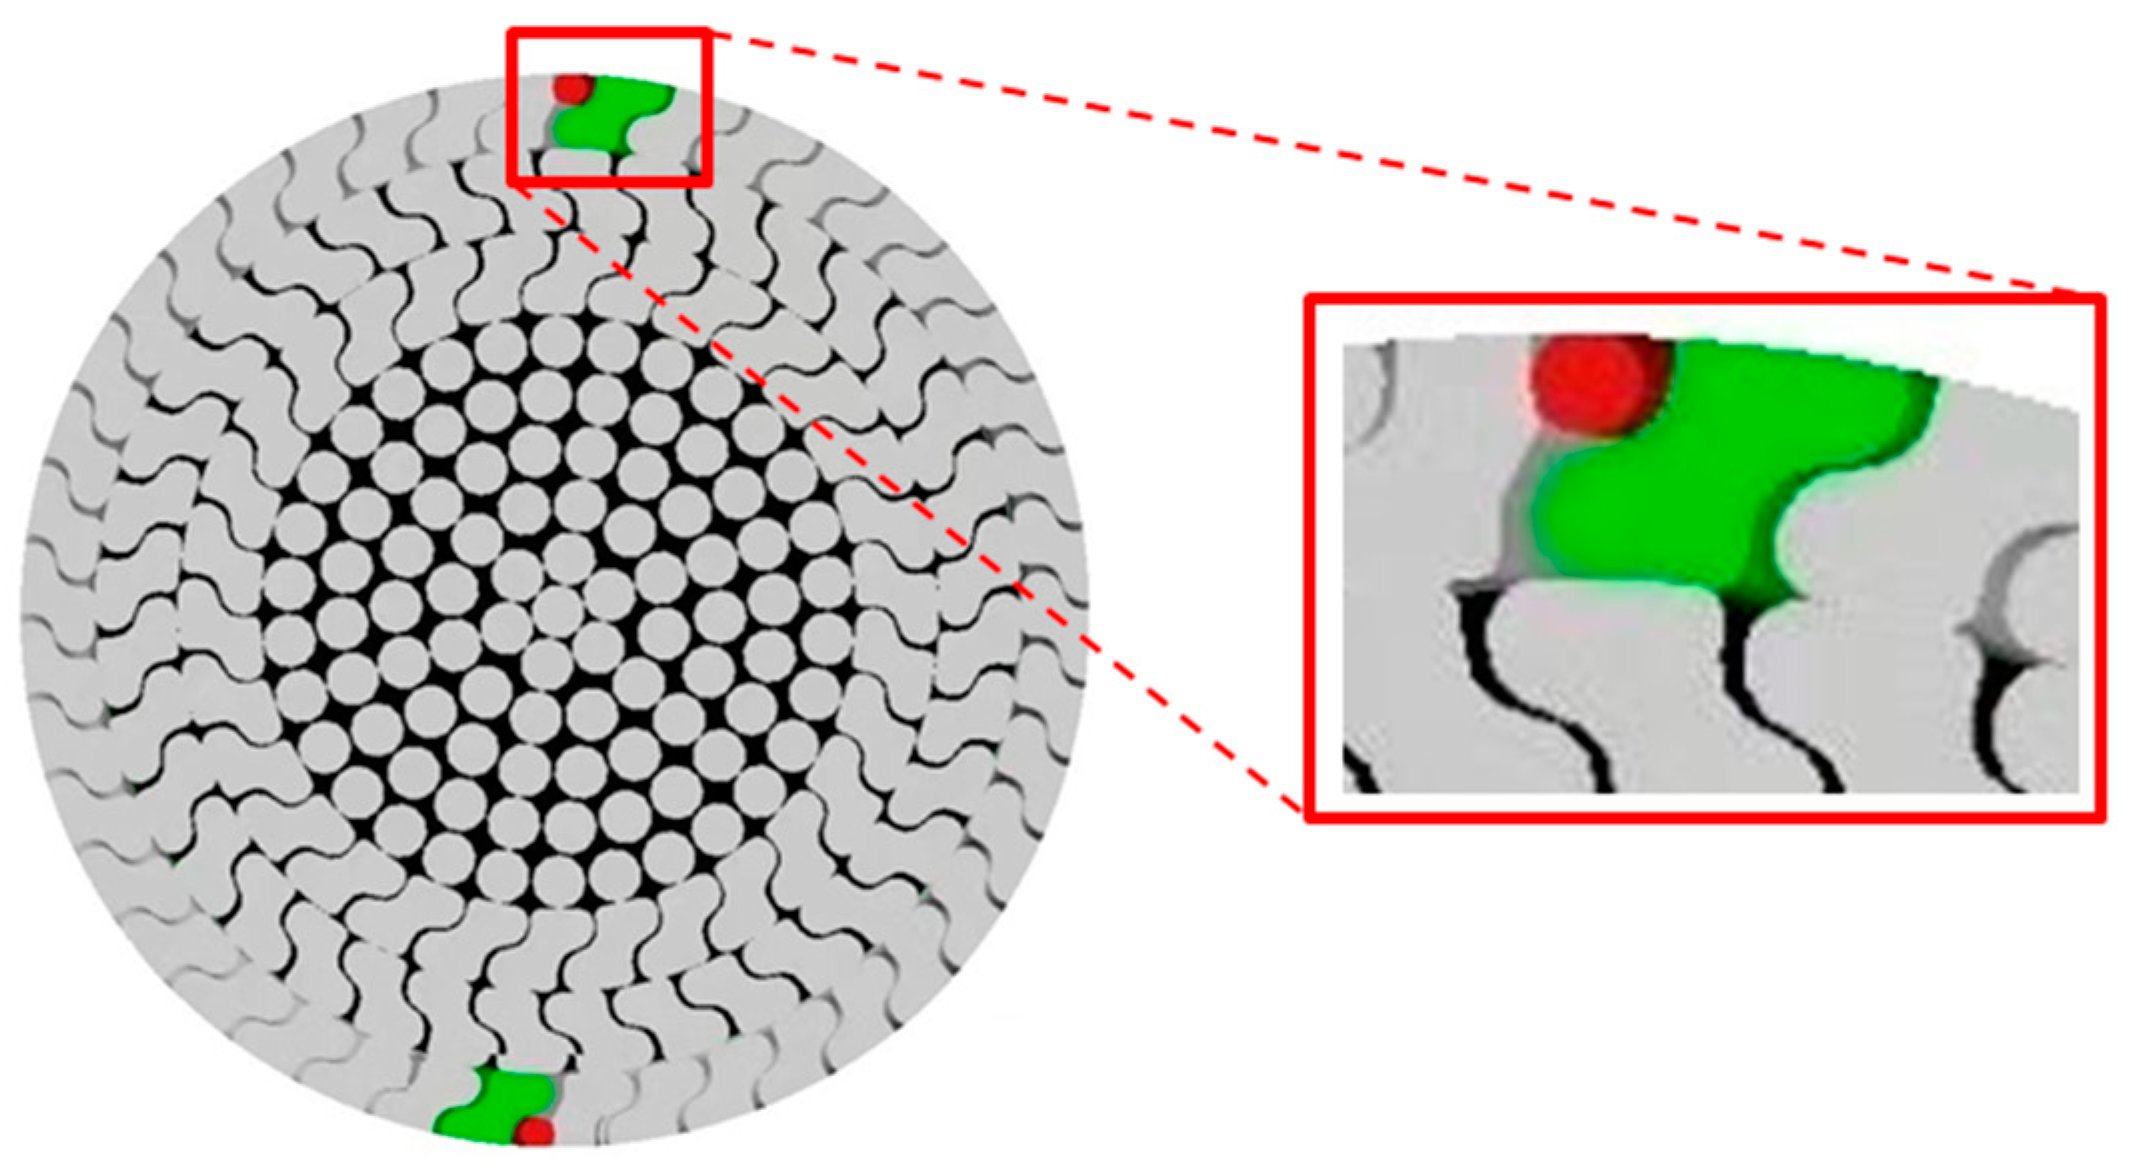
In Equation (3) [21], the synchronized deformation of the FBG sensor and the cable is the key to measuring the cable force using the sensor. Since the cable is made of the circular center wire shown in Figure 2 and the external Z-shaped cable stranded into a wire, one only needs to fix the sensor to the external Z-shaped cable through epoxy resin to achieve the synchronous force and common deformation of the sensor and the cable. Please note that the red circle in Figure 3 shows the sensor.
Based on the above theory, this paper develops a notched-embedded smart cable. The smart cable generates a strain under external load, which is transmitted to the FBG sensor embedded in the cable of the strand, causing a change in λB. For calibration, Kε′ is known using the known F and Δλ. In use, F is calculated from Equation (3) based on the Δλ monitored by the FBG sensor to realize the monitoring of the cable force.
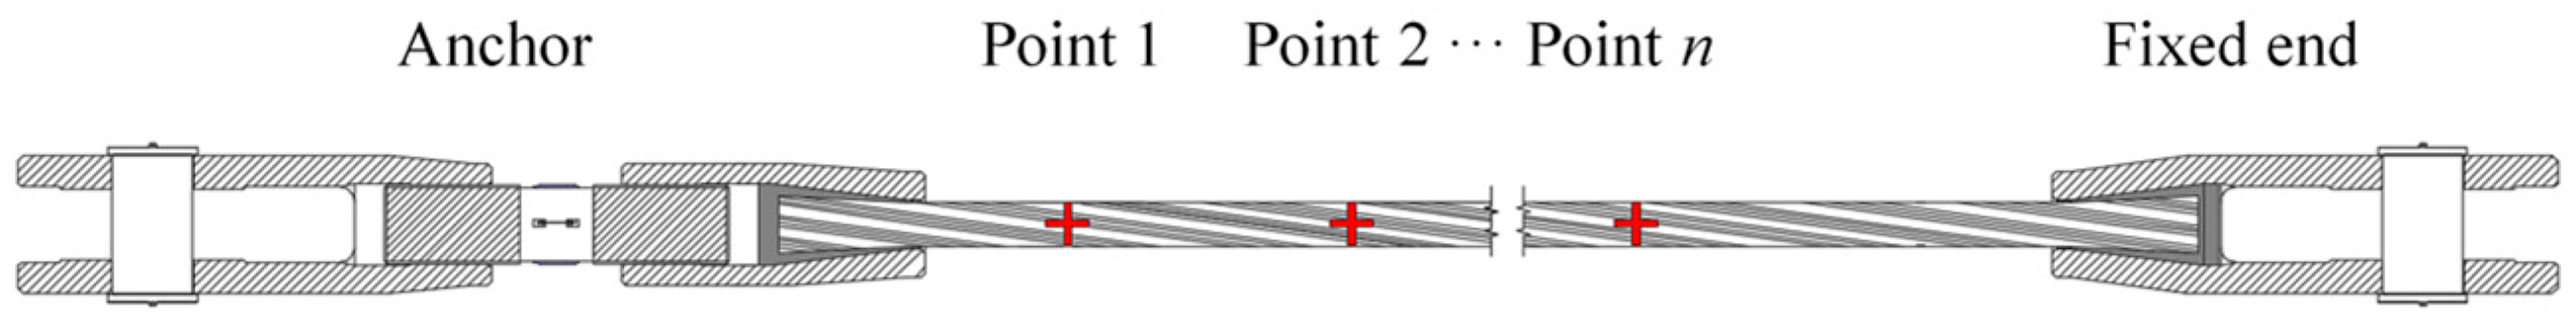
In addition, since there are many components connected to the stay cable of the cable dome structure, a cable will have a different cable force distribution after passing through the connected components, so obtaining the distributed cable force of the cable is the key to ensuring the safety of the structure. As shown in Figure 3, the smart cable developed in this paper only needs to increase the number of sensors in the cable according to the demand of realizing the distributed cable-force monitoring of the cable.
2.2. Structural Design of Smart Cable
The fabrication procedure of the smart cable can be described as follows:
- (1).
- Before twisting the high vanadium full-locked coil cable, two symmetrical Z-shaped cables are selected for grooving. The grooving specifications were a 200 mm groove length, 1 mm groove depth and 0.4 mm groove width.
- (2).
- Twist the Z-shaped cords with grooves to shape them with other cords. After filling the groove with epoxy resin, put the FBG sensor into the groove ring along the length and fill it with epoxy resin.
- (3).
- As the epoxy resin is susceptible to weathering and ageing under the sun and high temperatures, it loses its stress-transfer performance. Therefore, a coating layer is added on the outside of the epoxy resin for protection. This process can solve the problems of an easy fall off and low survival rate of fiber grating and can achieve a large amount of range monitoring.
- (4).
- The smart cable is fabricated and ready for the calibration test. The strain and wavelength change values measured at each measurement point are fitted, and if the data of each fitted curve are all linear with linear correlation coefficients greater than 0.9999 and no hysteresis, this indicates that the smart cable has a high stability and accuracy, the strain sensitivity Κεm of the Z-shaped cable derived from calibration has confidence, and the smart cable can be used for the measurement of the cable force according to Equation (3).
3. Performance Testing of Smart Cable
In this section, laboratory tests are carried out to verify the smart cable’s sensing performance, including a calibration test, repeatability test and accuracy test.
3.1. Calibration Test
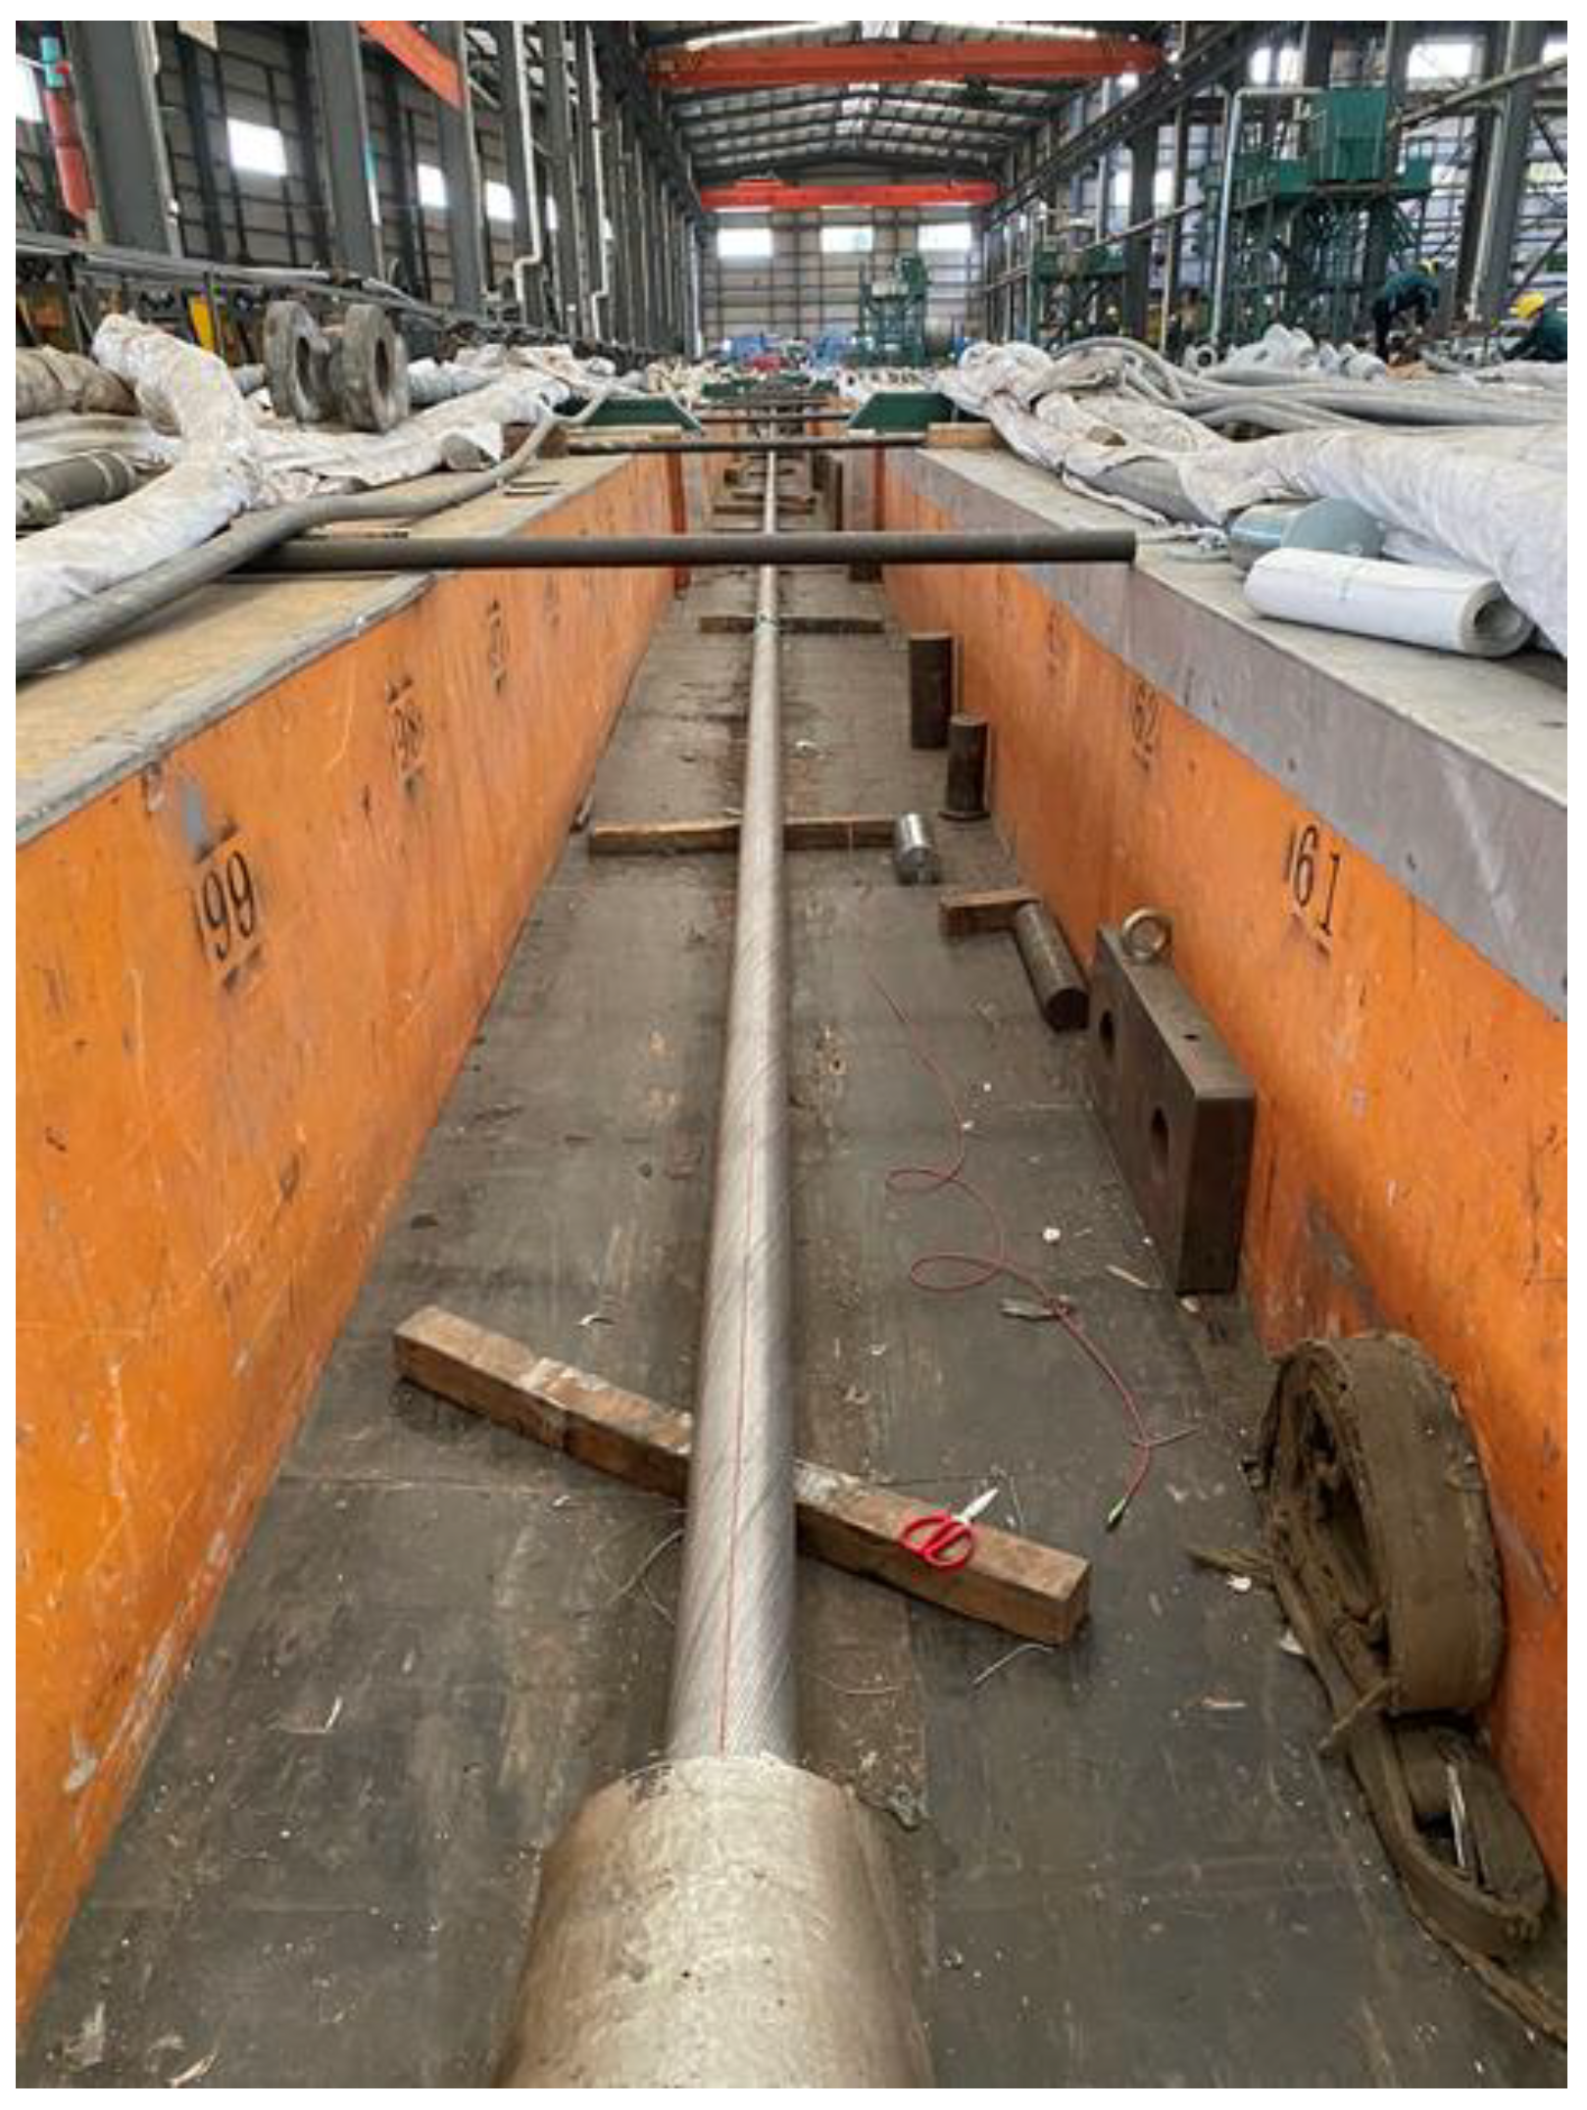
The smart cable proposed in this paper needs to be calibrated to obtain the strain sensitivity of the Z-shaped cable in order to achieve real-time cable force measurement. As shown in Figure 4 and Figure 5, the calibration test is performed at the cable factory. Multiple gantry cranes are used together to put the smart cable into the over-tensioning test tank by lifting and installing the safety bolts. The tensile machine specification adopts a 4000 tons tensile machine, one end of the smart cable is connected with the anchor head of the tensile machine, and the other end is connected with the fixed end of the slot tail. The fiber optic sensor of the smart cable is connected to the multi-channel data acquisition instrument through the extension cable connector to ensure that the data-processing system converts the strain information into real-time cable-force information. The calibration test was carried out by means of graded loading of the tensile machine. The smart cable is loaded continuously from 0 kN to 1600 kN at intervals of 400 kN, with constant loading for 30 s after reaching the specified pulling force.
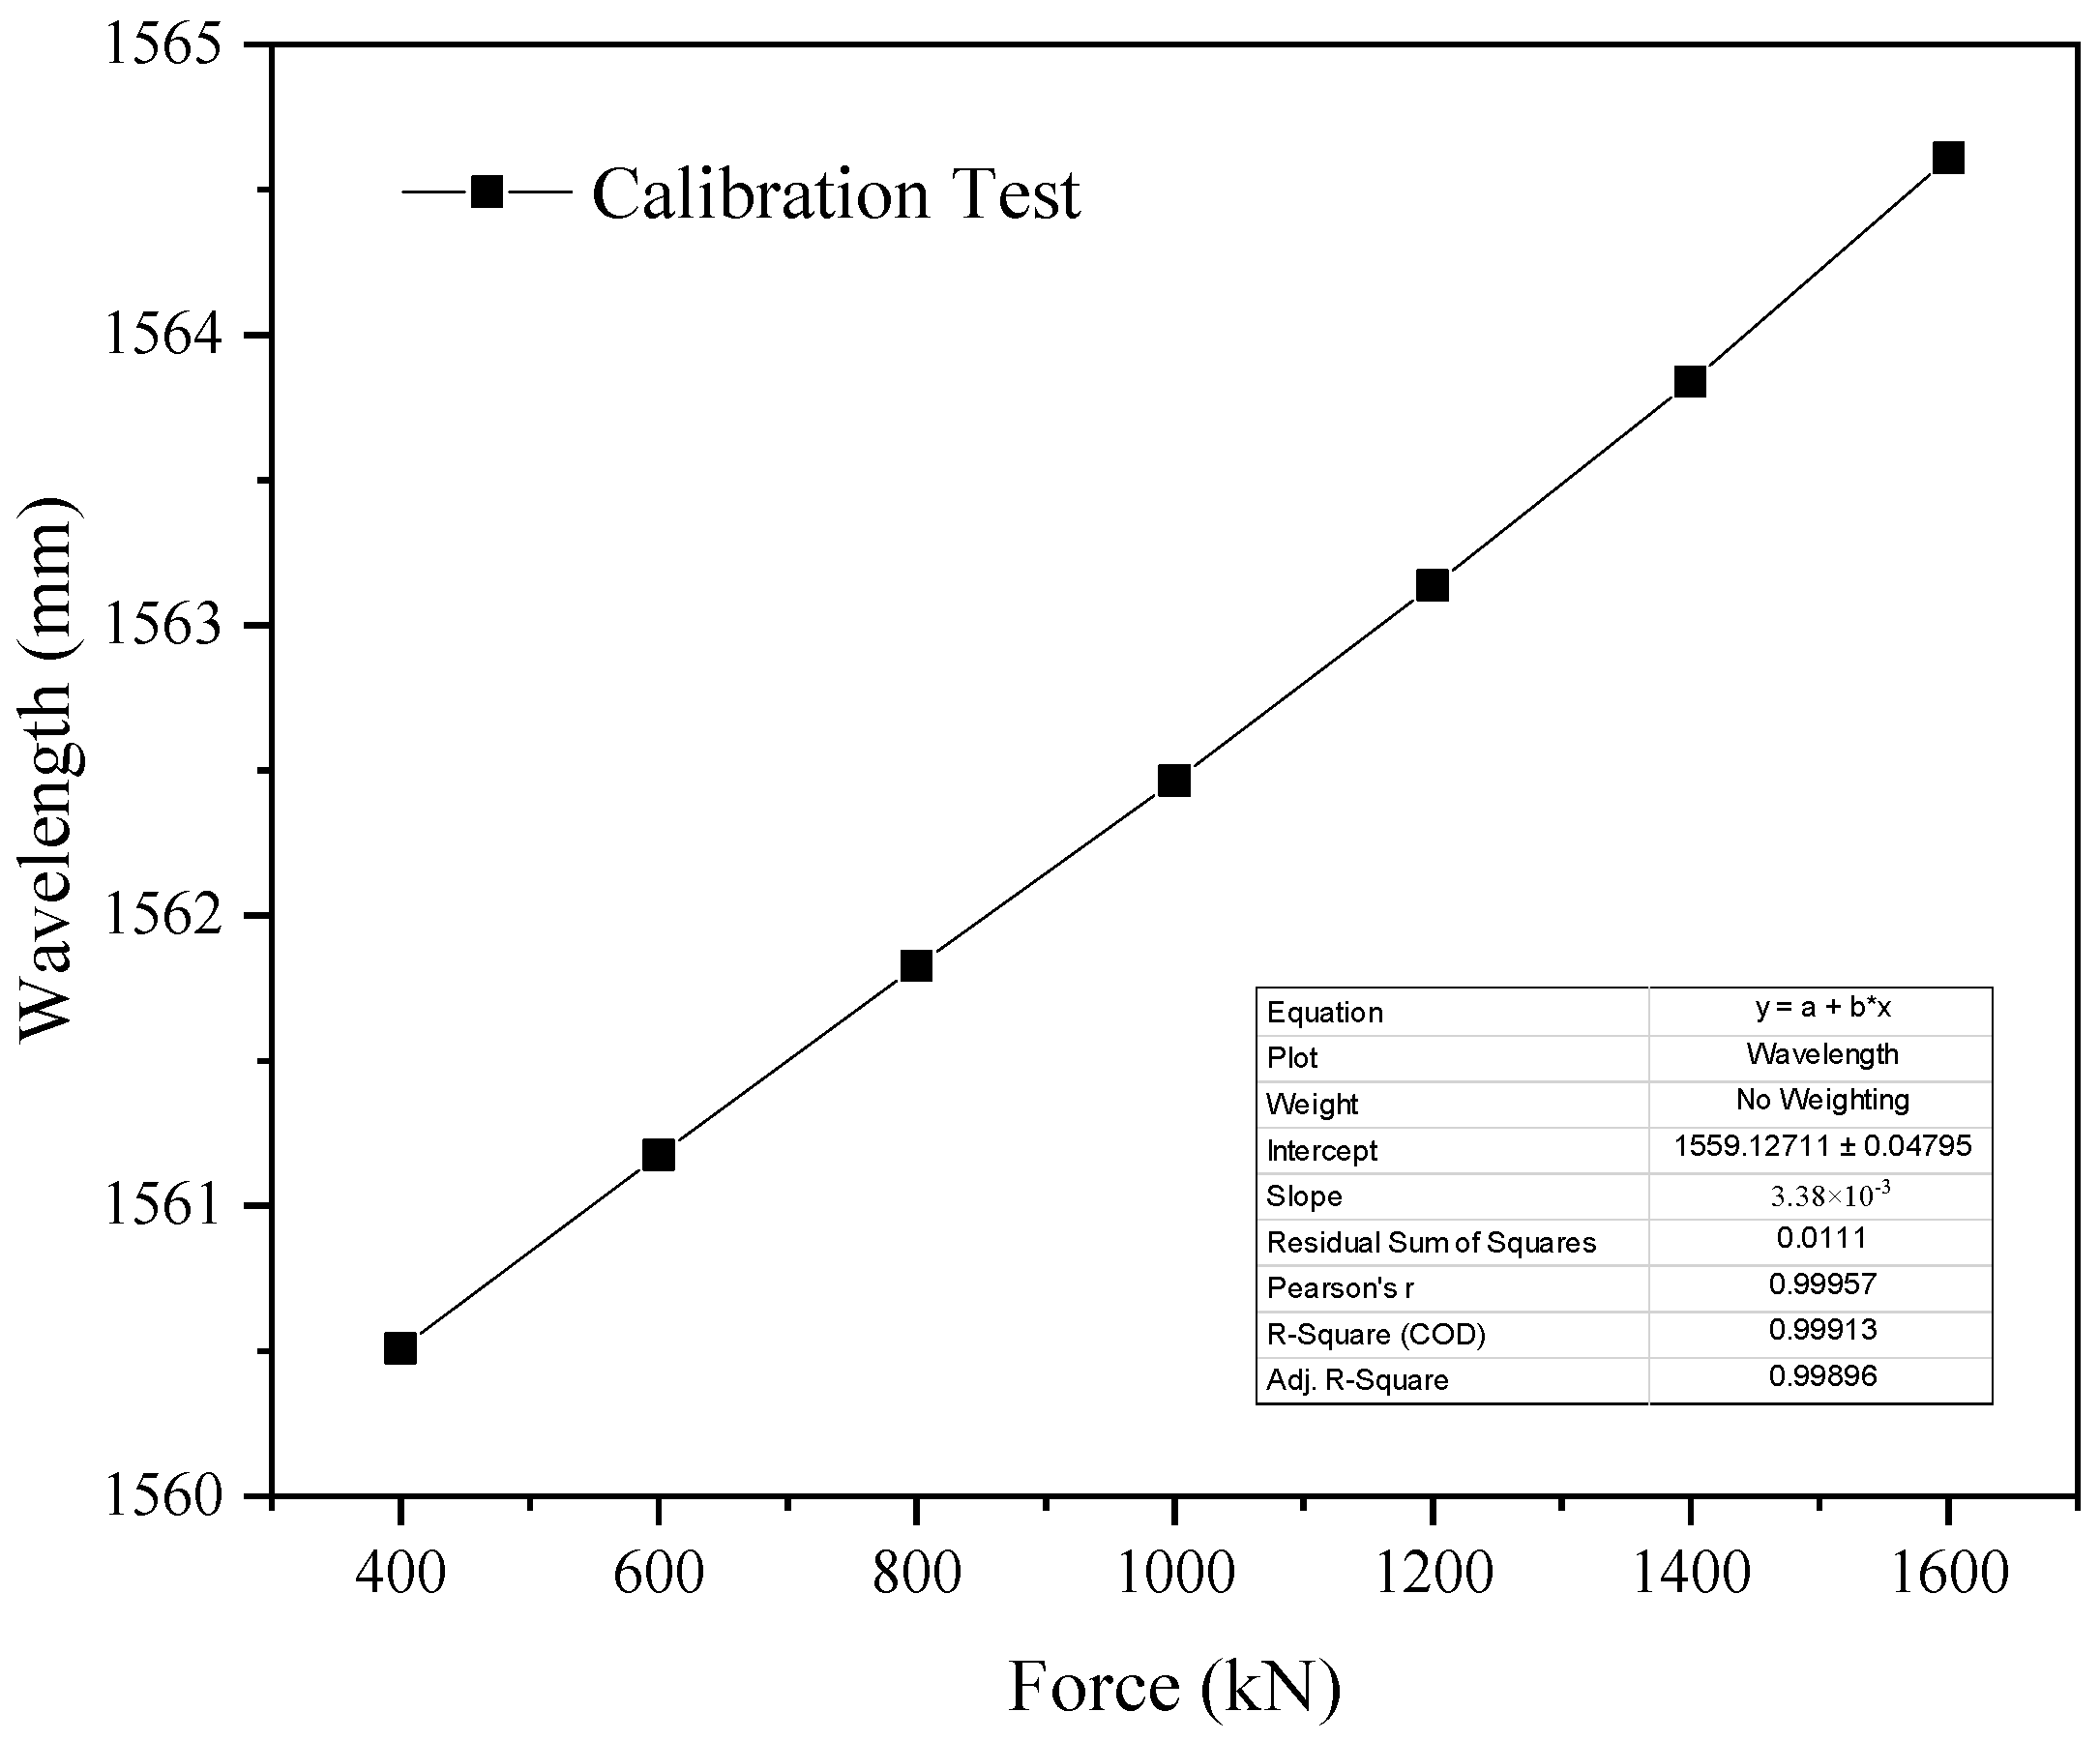
The change of wavelength of the smart cable and the pulling force of the tensile machine are recorded throughout the whole process, and the linear relationship between the wavelength and the pulling force is plotted in Figure 6.
The correlation coefficient R2 between the wavelength and force is obtained by performing a general linear fit on them. The correlation coefficient R2 reaches 0.9999, indicating a linear correlation between the wavelength of sensors and the force of the stay cables. The calibration test not only proved the feasibility of measuring the tensile force by the wavelength of the FBG sensor but also obtained the correlation coefficient between the wavelength and tensile force.
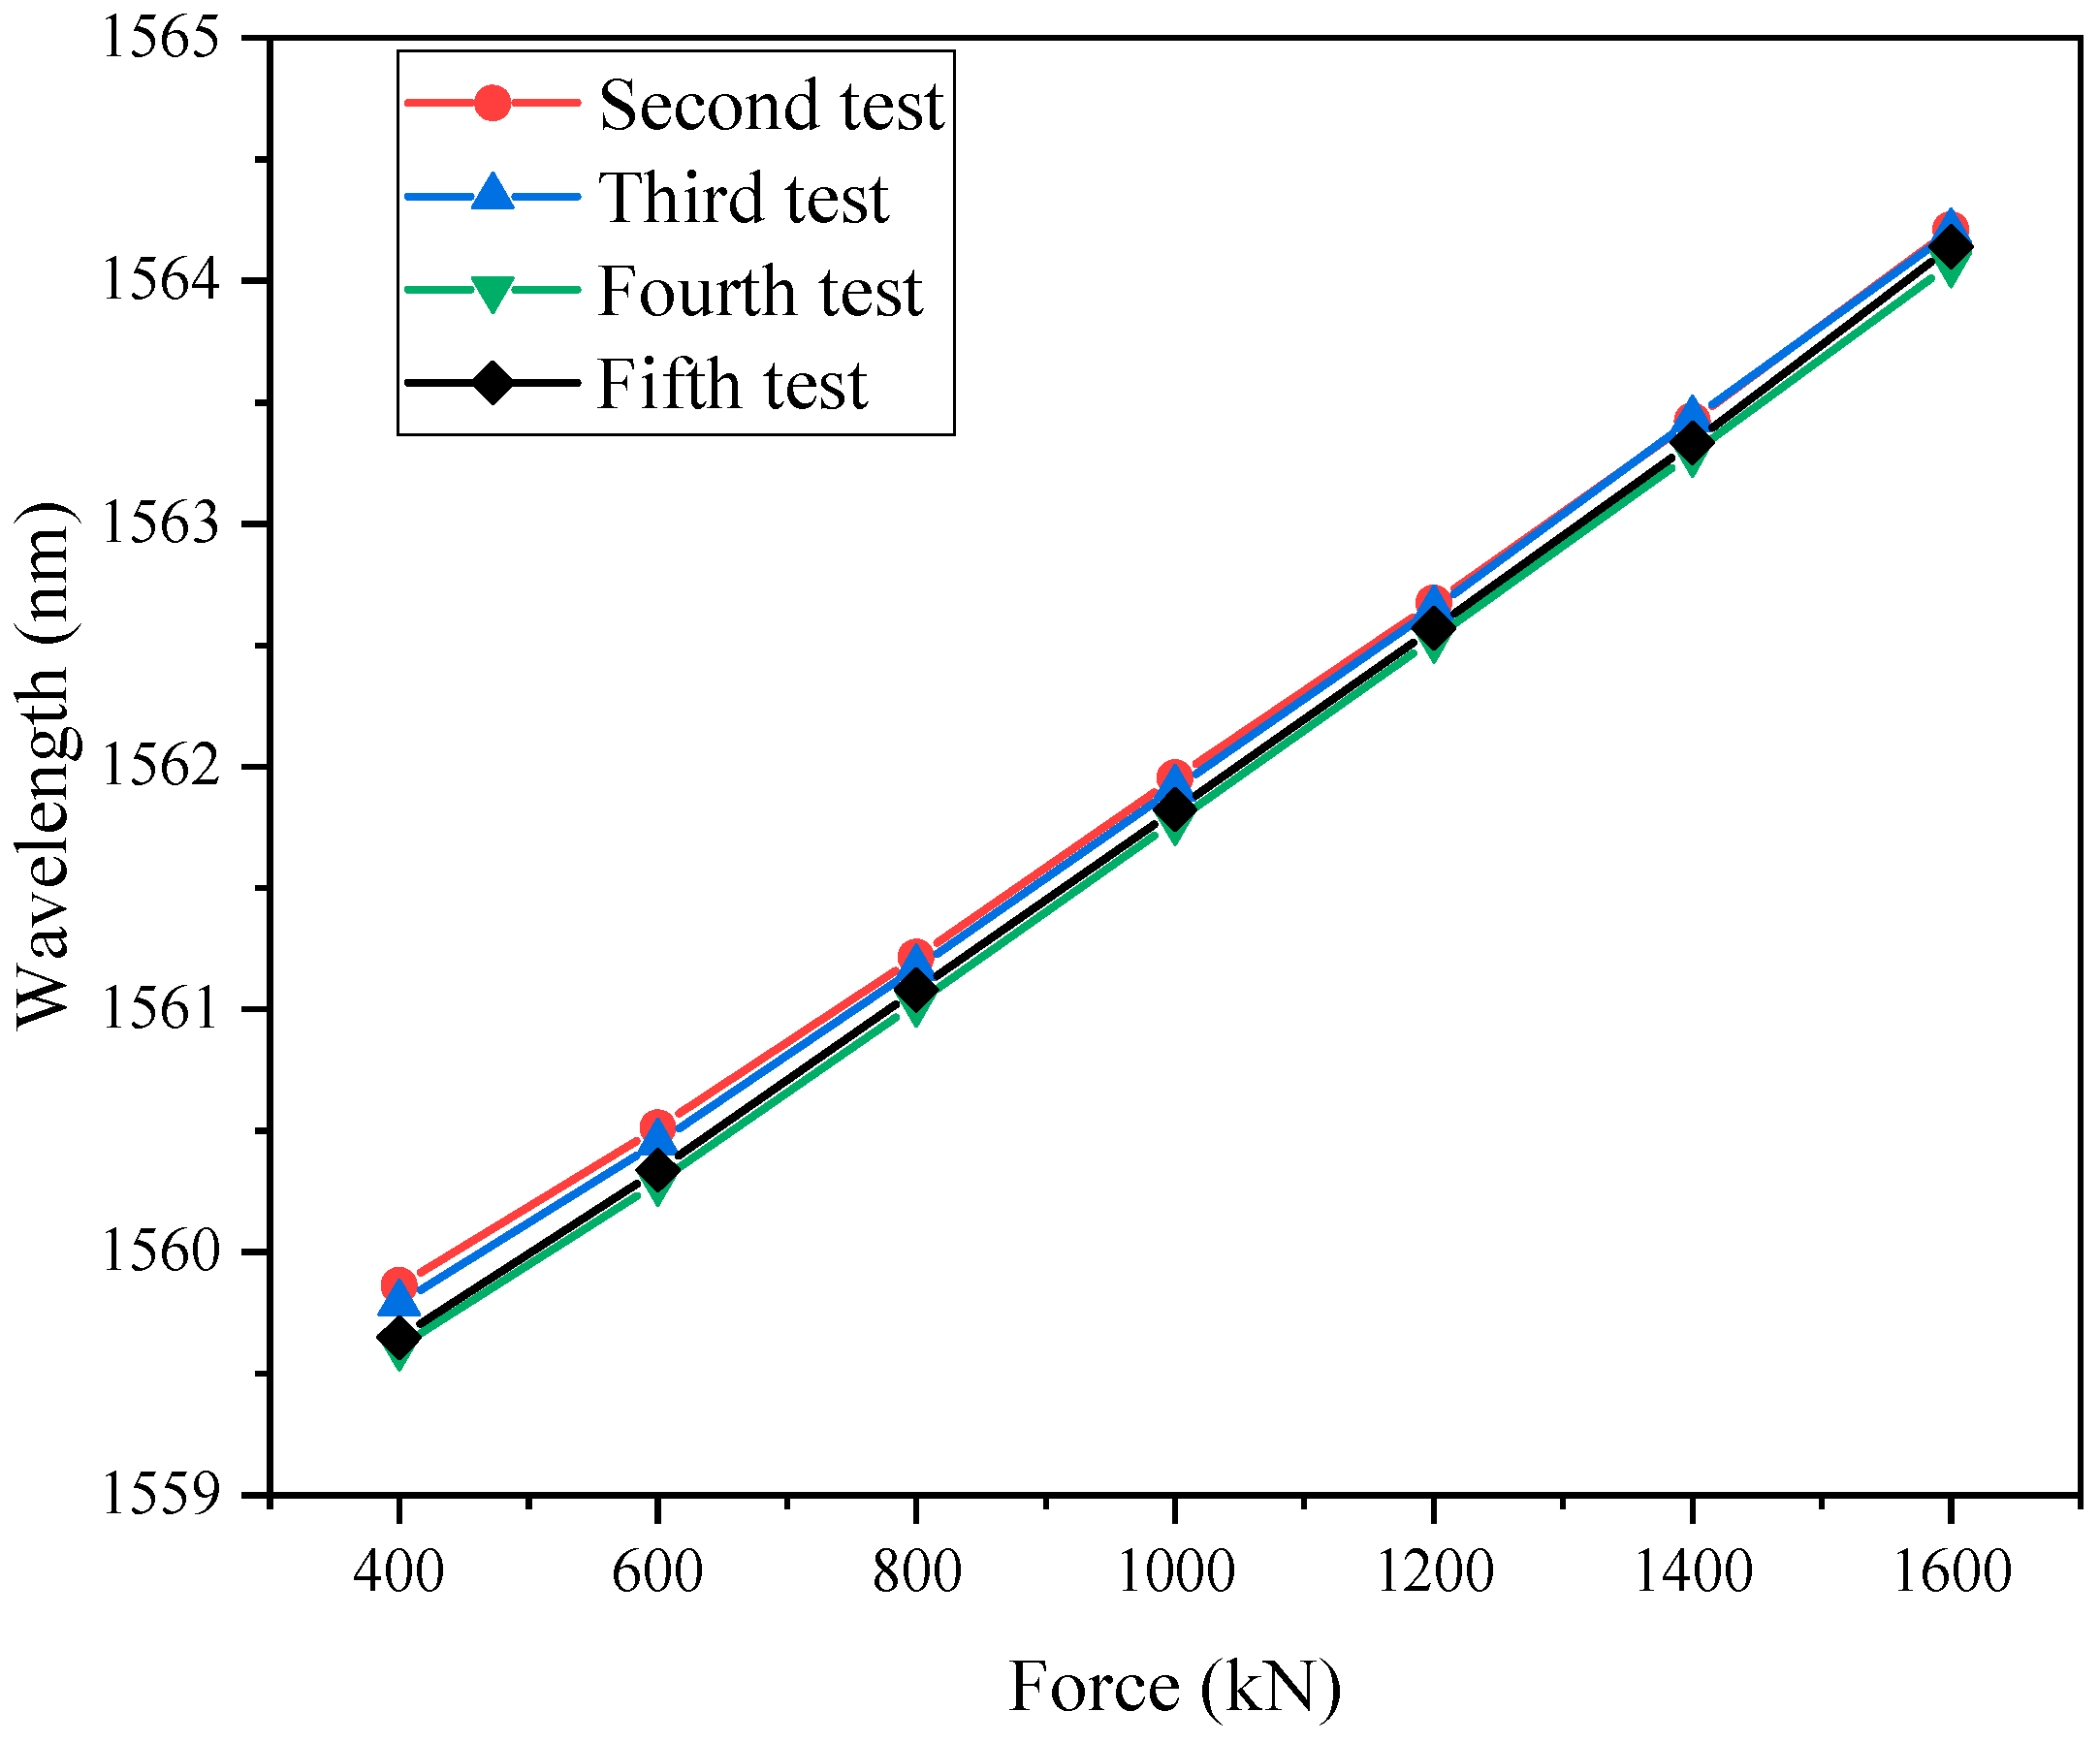
The residual stresses generated in the steel structure under the influence of external loads may affect the measurement accuracy of the smart cable. To verify the measurement stability of the smart cable, the calibration test was repeated five times. The test setup and loading conditions were the same as for the first calibration test, and the trend of the sensor wavelength during the change of external load from 400 kN to 1600 kN in the five tests was recorded; the data of the five tests are plotted in Figure 7 and Figure 8, and the detailed data at each working condition level are shown in Table 1.
In the five calibration tests, the change of wavelength is about 4.4 nm at the pulling force change of 1600 kN, which indicates that the residual stress has less influence on the measurement accuracy and that the stability of the smart cable is good, which meets the requirements of a stable, accurate and real-time monitoring of the cable force in the cable support grid system.
3.2. Accuracy Test
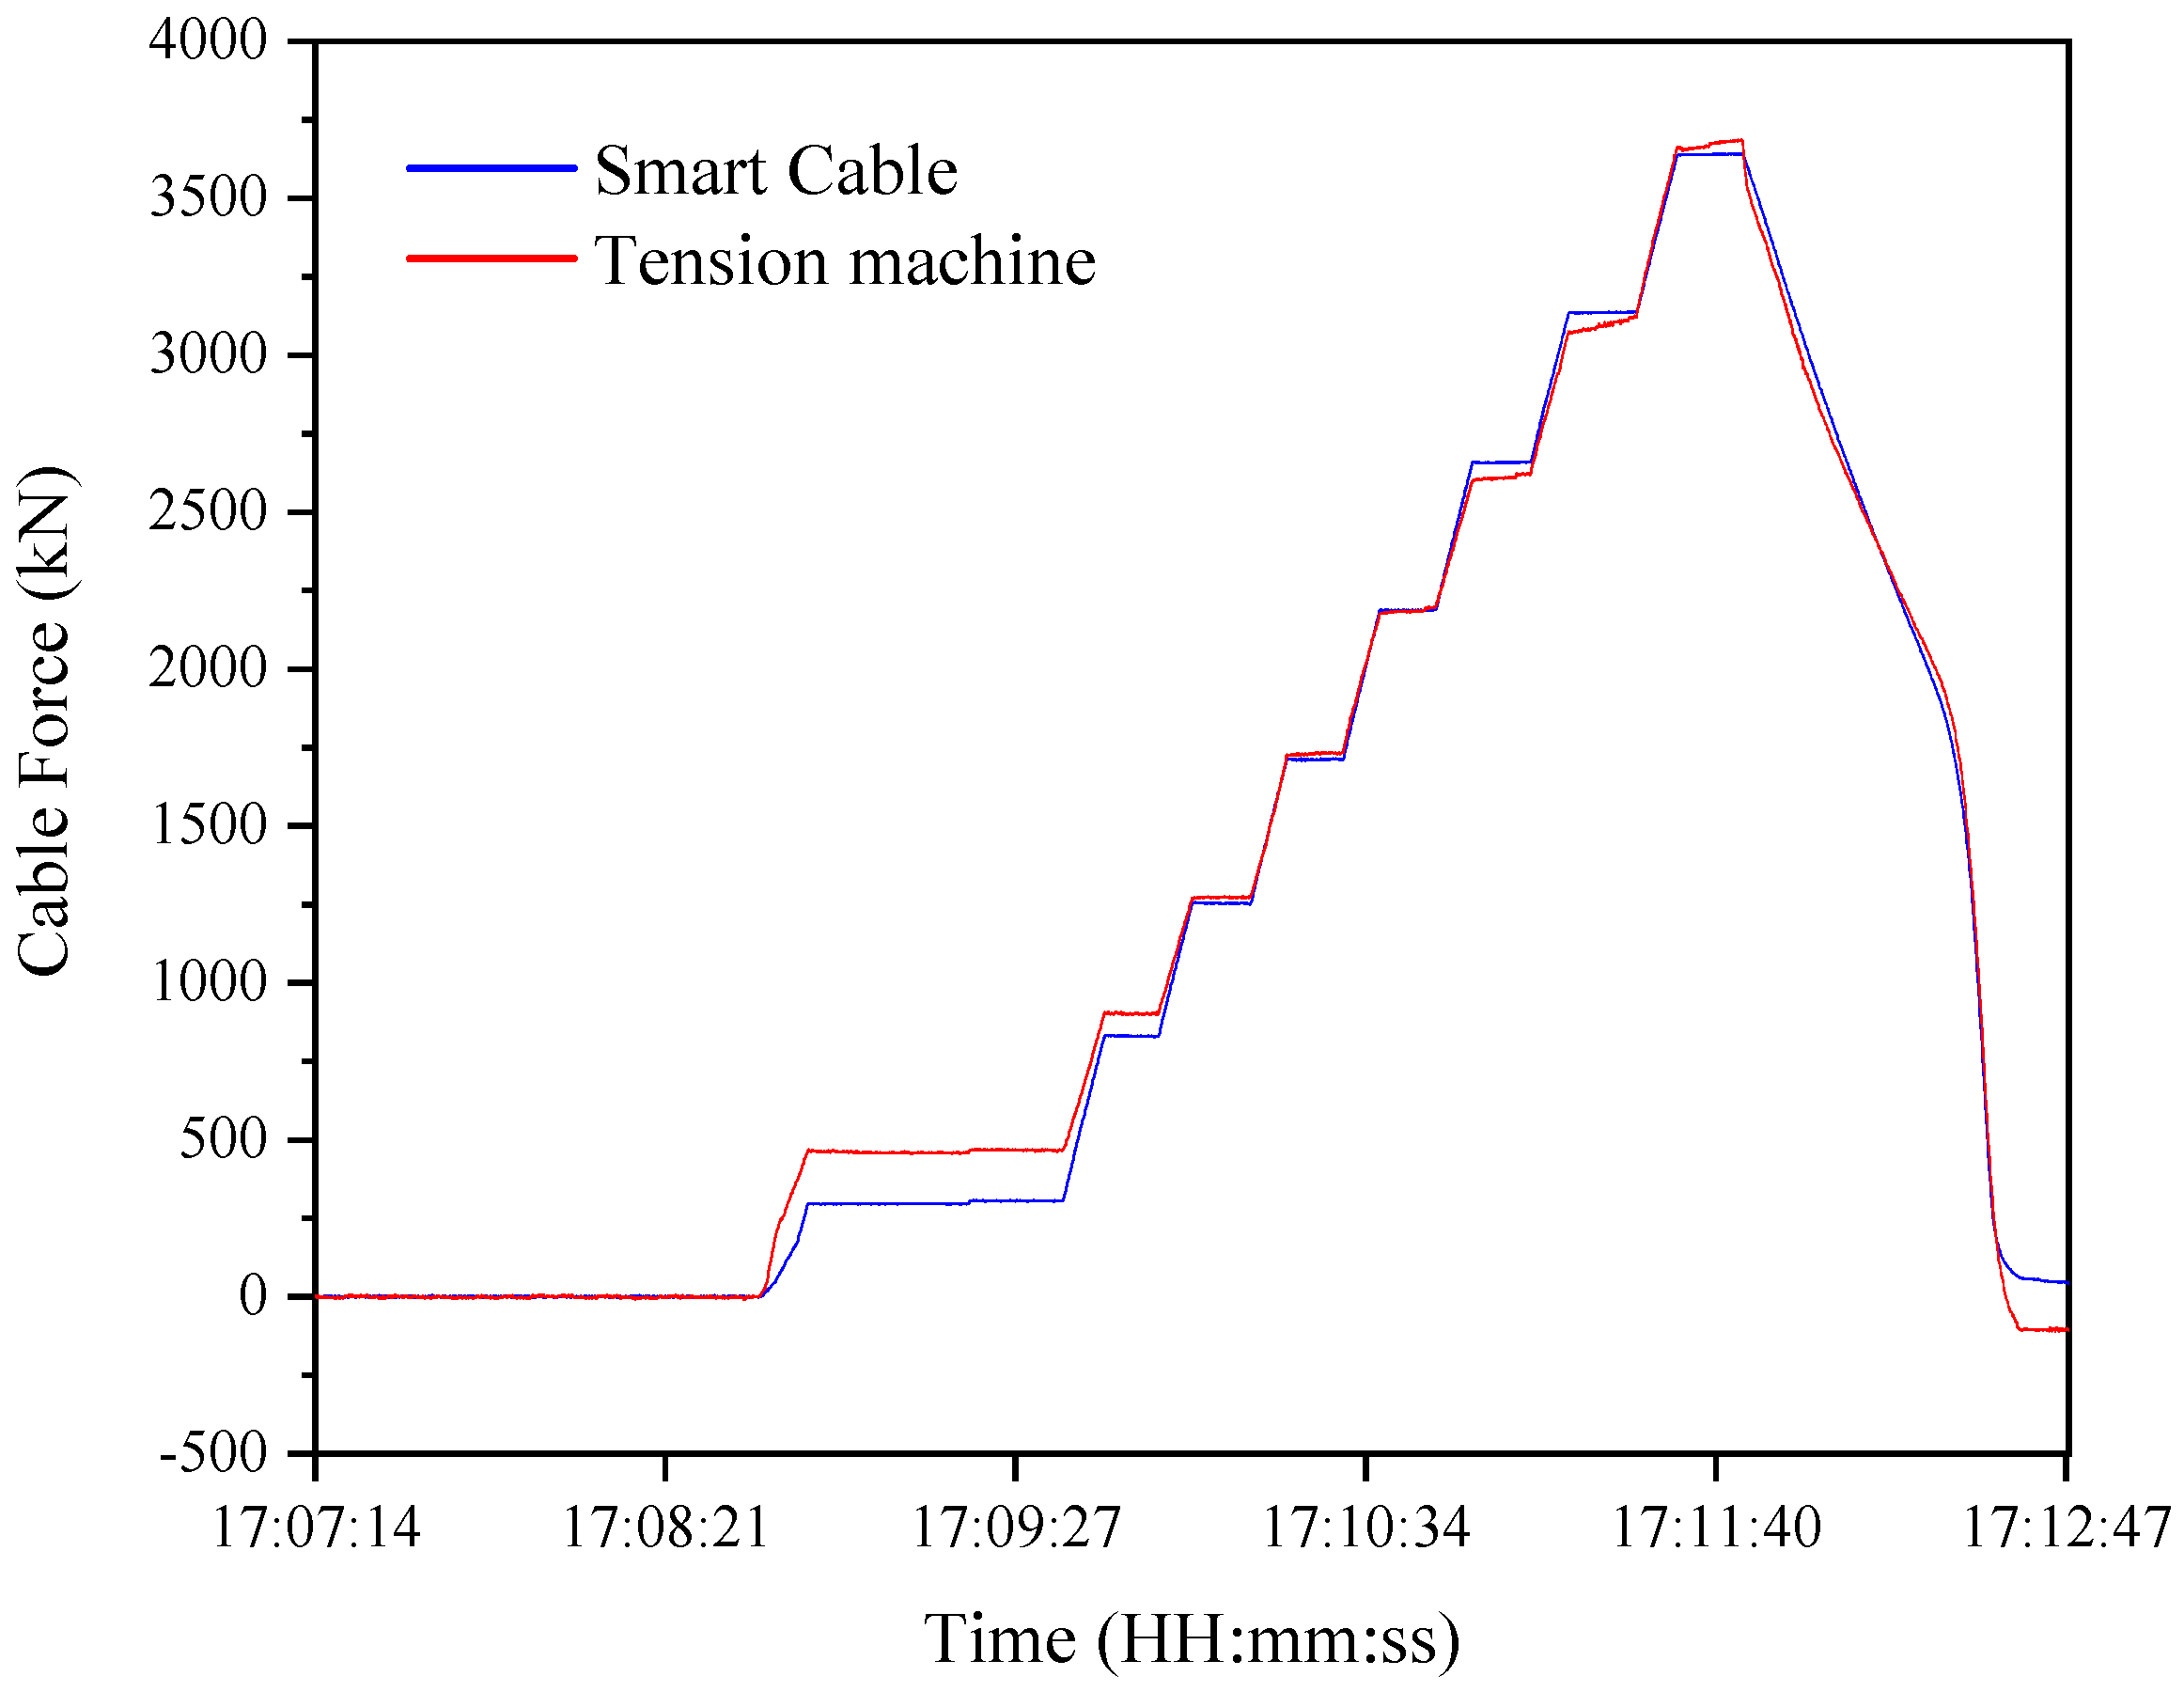
According to the specification, the quality of smart cables must be checked by over-tensioning tests before they leave the factory. With the help of a 4000 kN over-tensioning test, the accuracy test of the smart cable was carried out. The test setup and the smart cable are installed in the same way as for the previous calibration test. The comparison curve between the measured cable force of the smart cable and the real-time tensile force of the tensile machine is shown in Figure 6, and detailed data for the accuracy test are shown in Table 2.
The reason for the large difference in the first stage is that the cable will produce deflection under its own gravity load, and the pulling force of the tensile machine in the early stage of loading is used to offset this deflection, which makes the error. In addition to this, the average error rate for the remaining loading stages is only 0.2%, which indicates that the smart cable meets the requirements of the cable support grid system for real-time, dynamic and accurate monitoring of the cable force.
4. Field Application of the Smart Cable
As mentioned above, as the main component of the roof, the stay cable plays a critical role in ensuring the integrity and safety of the cable support grid system. The smart cable can record the time history of the cable force. Thus, the health status of the stay cables can be diagnosed by the collected time history of the cable force.
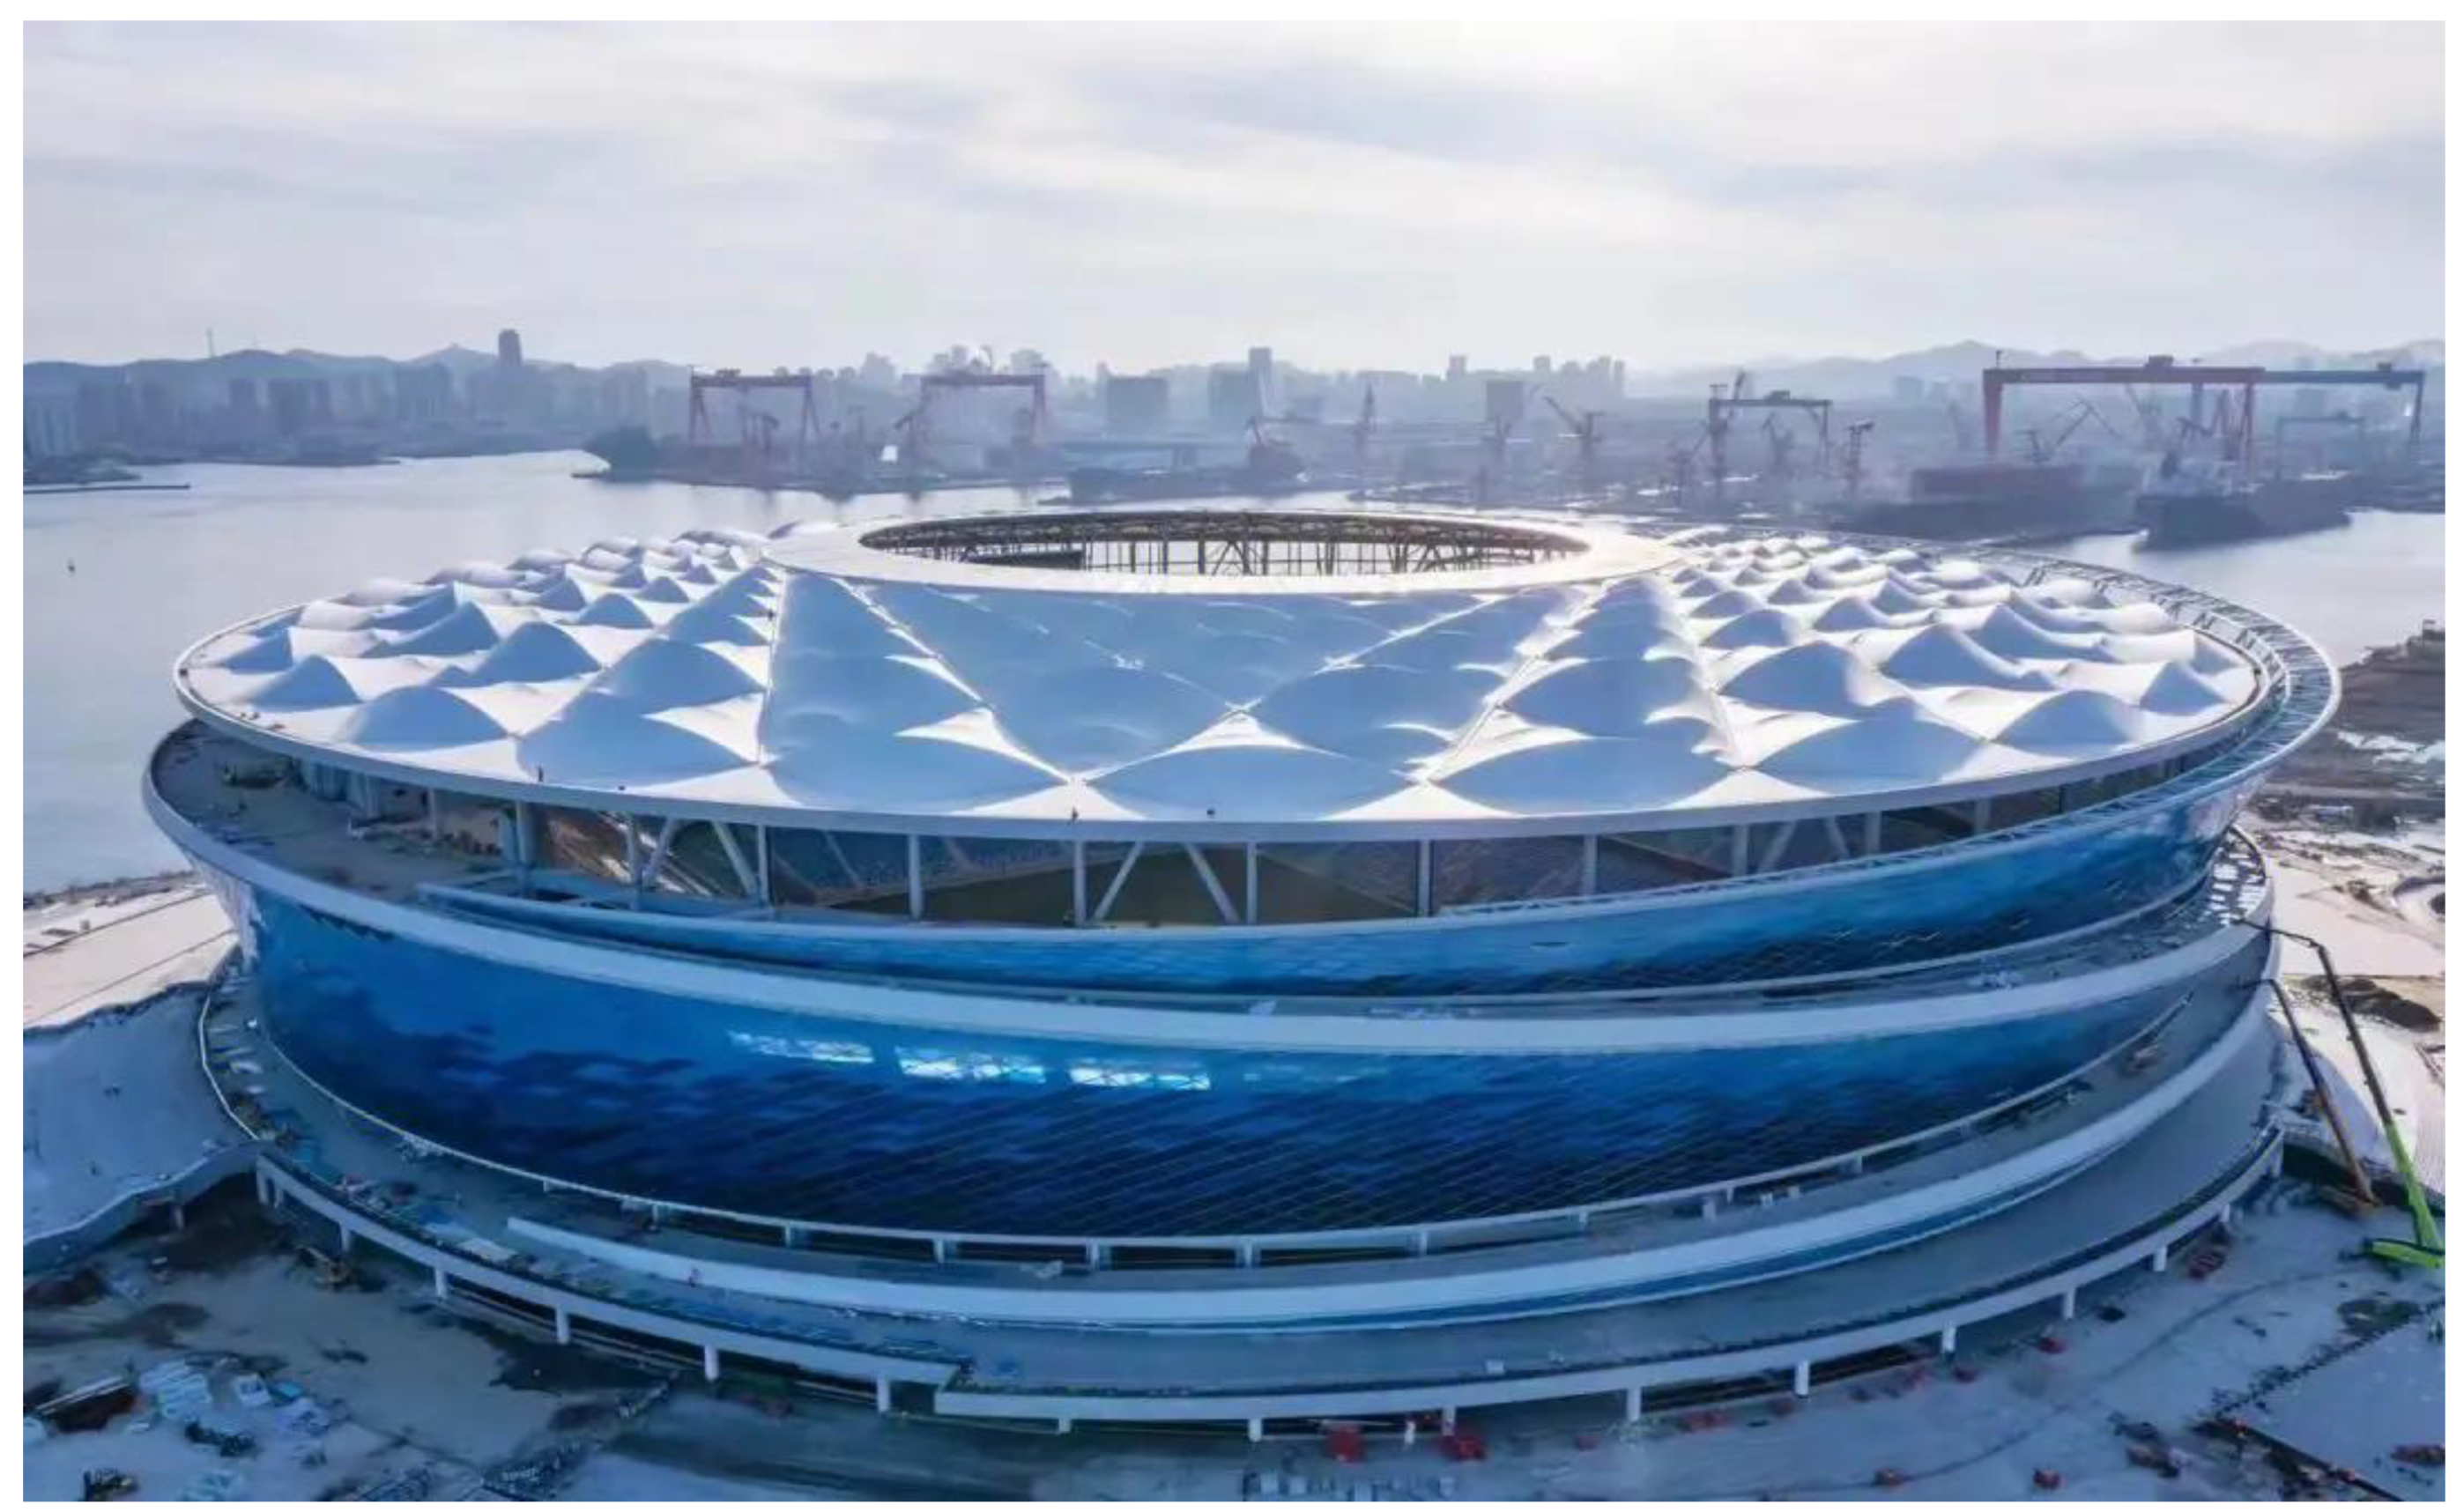
4.1. Description of the Dalian Suoyuwan Football Stadium
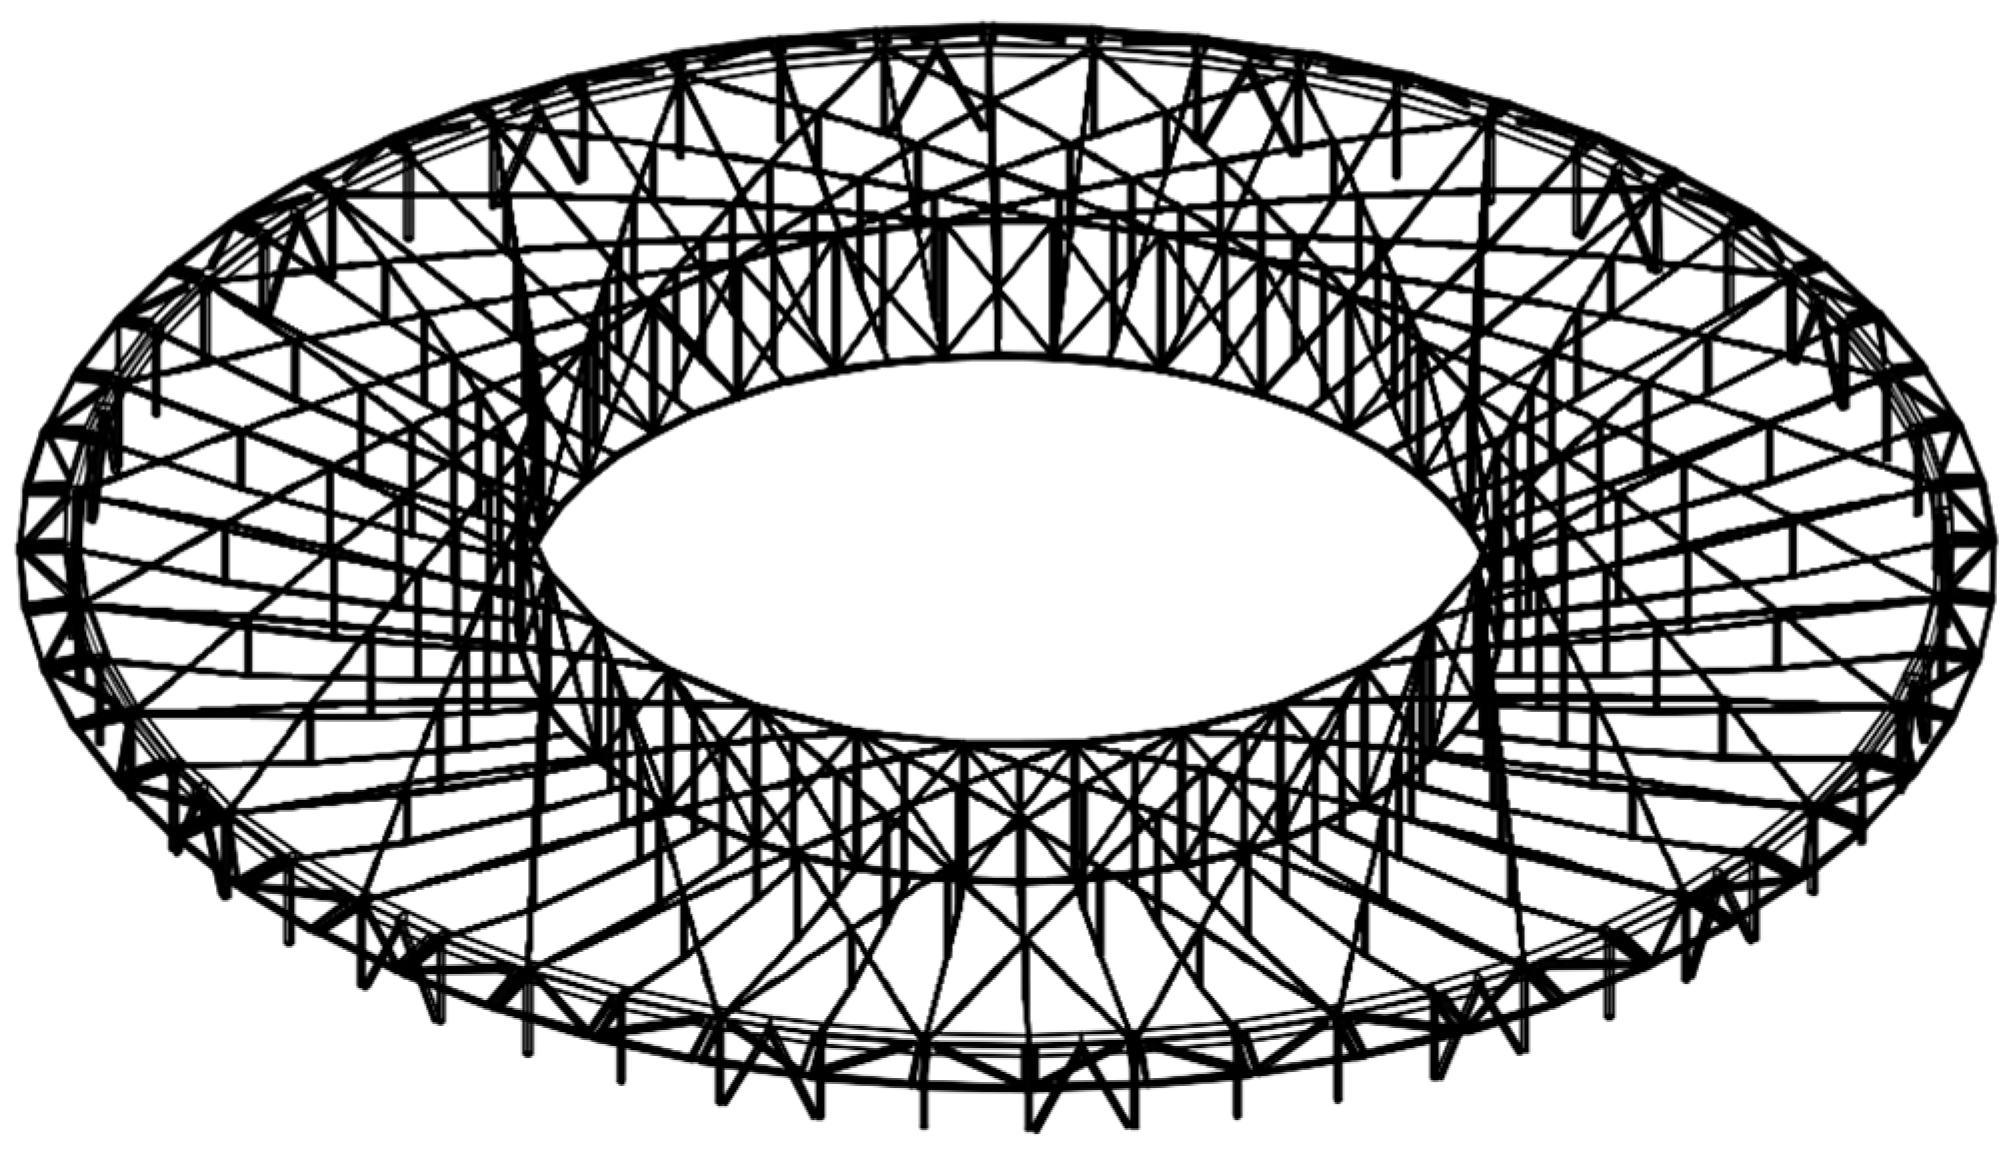
The Dalian Suoyuwan Football Stadium, as shown in Figure 9, is the first stadium to be surrounded by the sea on three sides in China. The total construction area is approximately 136,000 m2, with 63,000 seats. As shown in Figure 10, the roof structure is a cable support grid system with stay cables as the main components. The upper layer is an oblique cross-stabilized cable, and the lower layer is a radial load-bearing cable.
4.2. Result of Monitoring
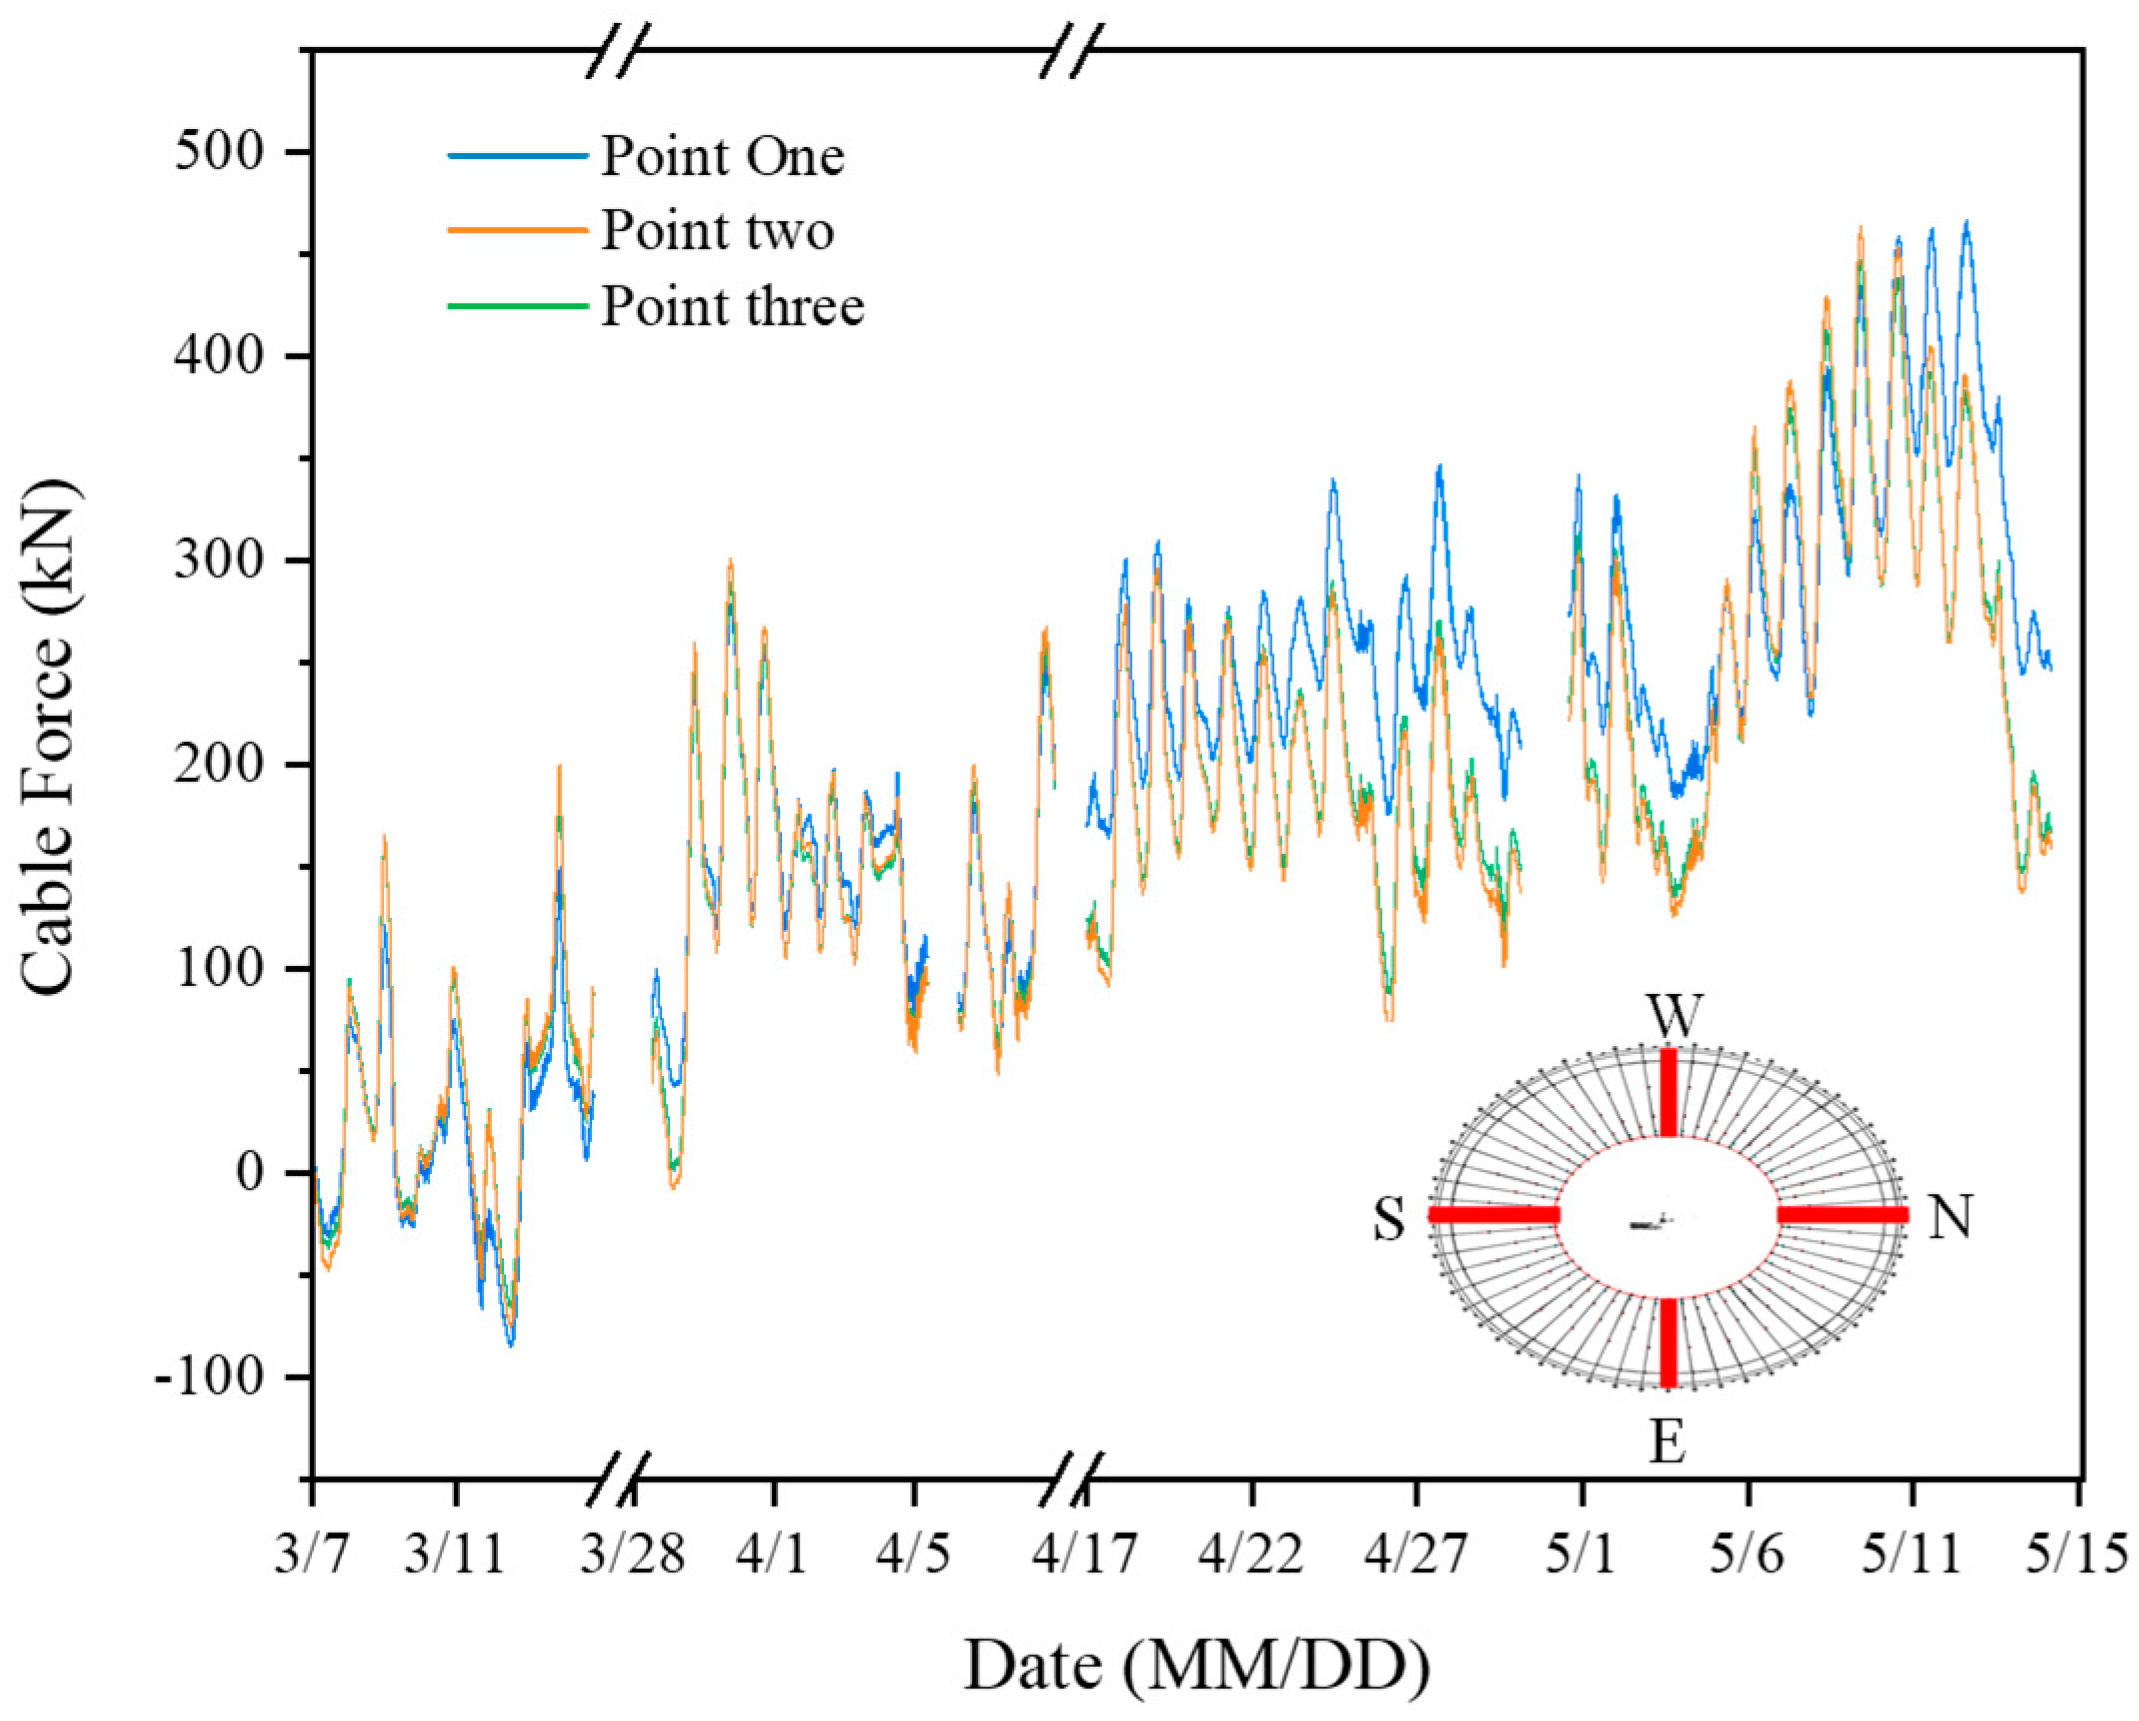
As shown in Figure 11, the smart cables are placed at the lower chord radial cables in the four directions of the roof structure: due east, due west, due south and due north. The change in the cable force of the smart cable located due north from 7 March to 15 May is selected for plotting.
Since the steel structure is cross-sensitive to temperature and load, the diurnal variation of temperature causes real cable force due to the thermal expansion effect. The long-term monitoring results in Figure 12 show that the cable force varies cyclically with the daily temperature change. The maximum value of temperature-induced cable force variation is about 450 kN, accounting for 3.1% of the cable breaking force of 14,500 kN, which is within the safety threshold. This indicates that the mechanical state of the structure is stable in the operation stage and that the influence of temperature on the structure is within a safe and controllable range.
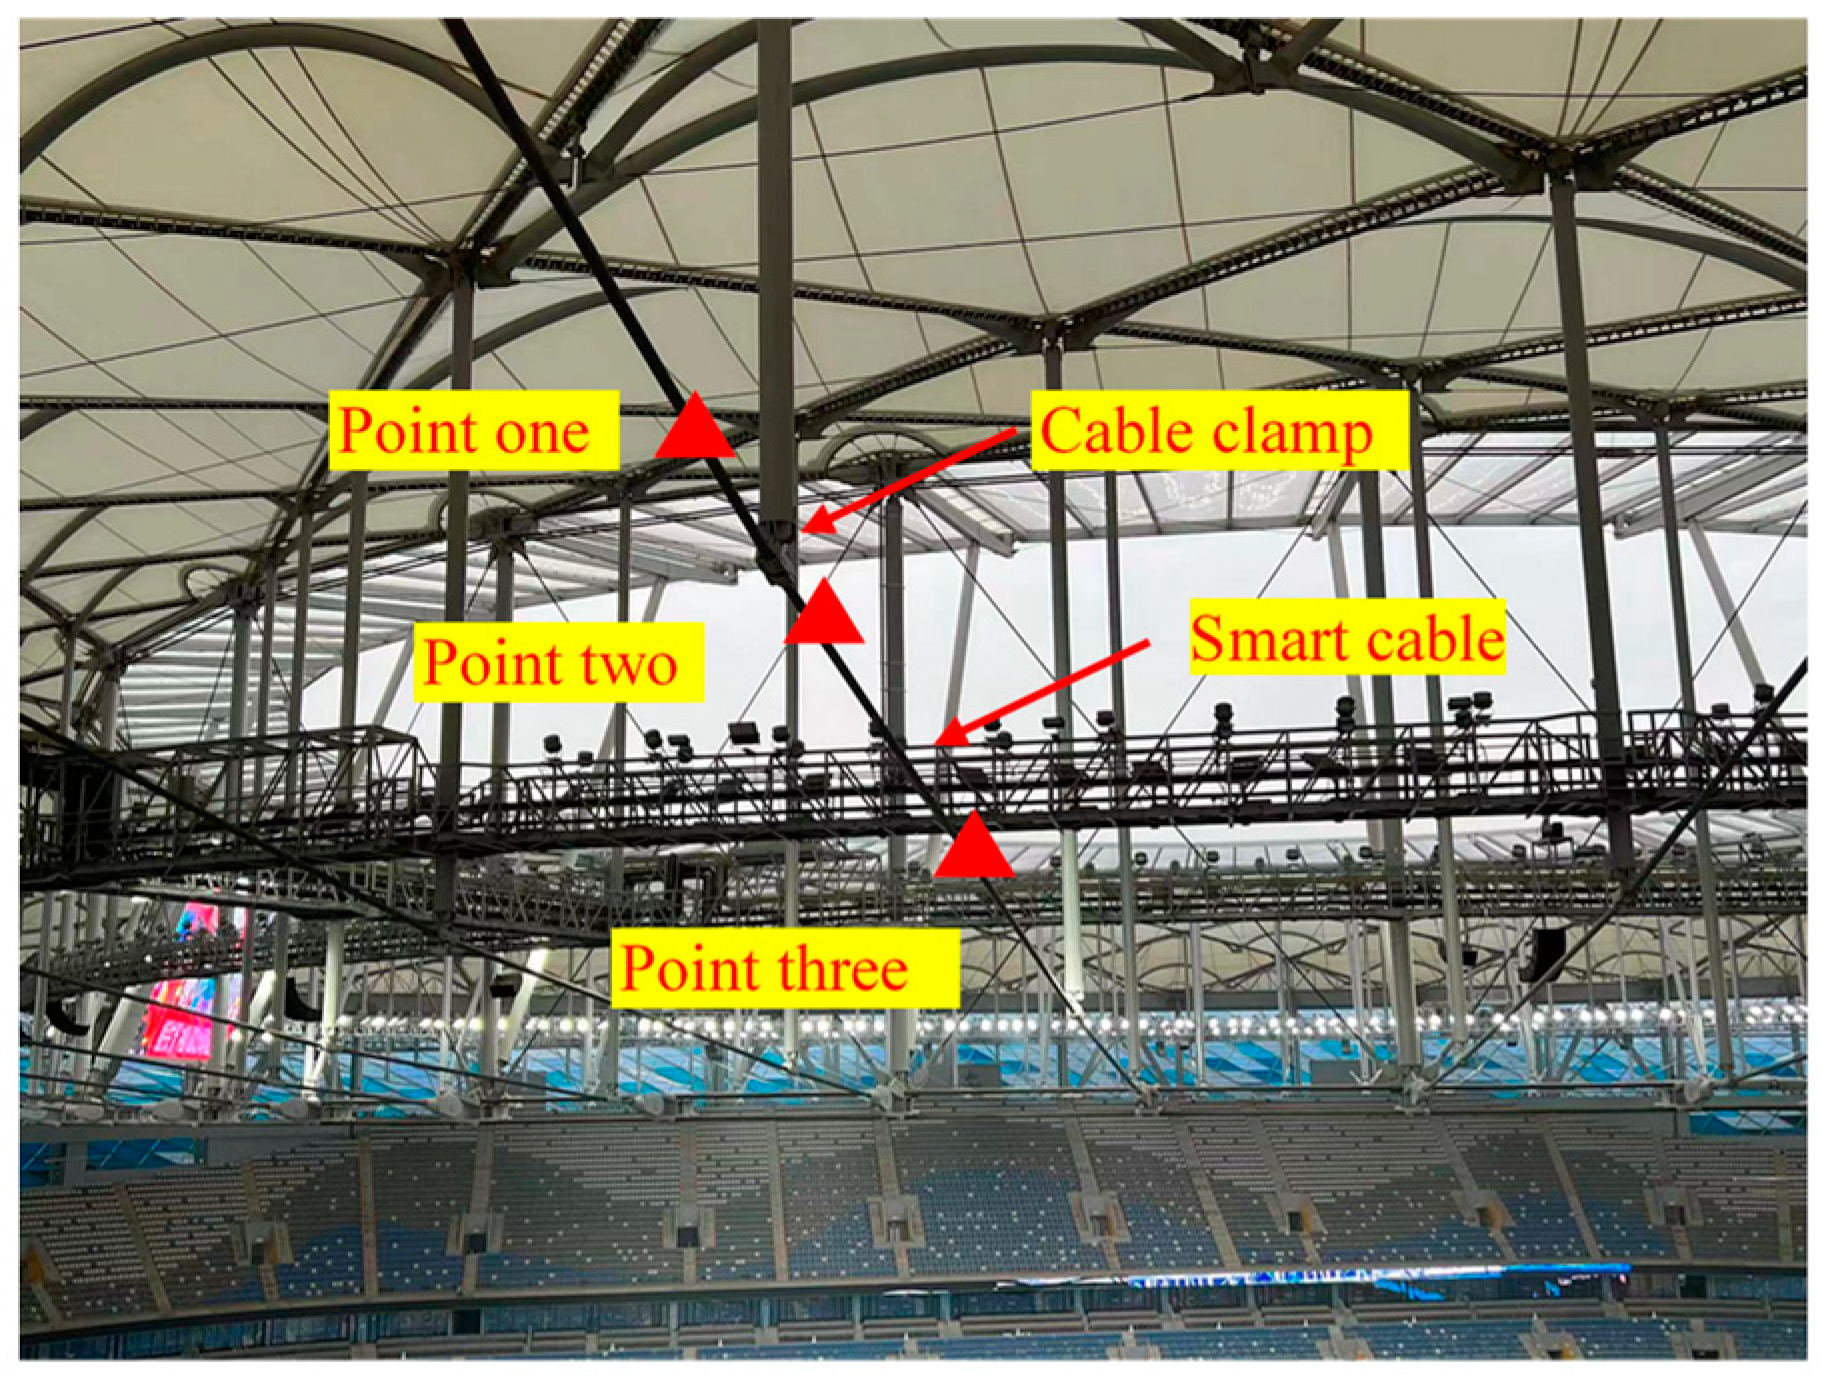
The specific locations of measurement point one, point two, and point three are shown in Figure 13. From the change of the curve, it can be seen that the distribution of the cable force of the cable will have different changes after the cable clamp; furthermore, the trend of the change of the cable force in different locations is the same, but the amount of change is not the same. This further demonstrates the importance of a smart cable that can measure the distributed cable force.
In summary, the smart cable meets the demand of the real-time monitoring and long-term monitoring of the cable force for cable dome structures.
5. Conclusions
The function of cables in cable dome structures serving in open-air environments includes bearing loads and transmitting loads, which results in cables that are prone to metal fatigue, leading to reduced stiffness and even cases involving cable-breakage accidents. The current stage of monitoring methods cannot meet the real-time, dynamic, long-term monitoring of the distributed cable force.
To solve this problem, a smart cable based on FBG sensors is proposed, and its application in Dalian Suoyuwan Football Stadium is presented. The following conclusions were obtained from this study: The conversion coefficient between the sensor wavelength and the force on the cable was extracted by calibration tests. The stability and reliability of its measurement were verified by repetition tests, and the accuracy of its measurement was verified by accuracy tests.
The dynamic and long-term monitoring results of Dalian Suoyuwan Football Stadium show that the smart cable based on an FBG sensor can meet the requirements of an accurate, dynamic and long-term monitoring of the cable force of the cable dome structure. In addition, its unique design provides a distributed monitoring of the force of cables.
Author Contributions
Conceptualization, G.Z. and Z.Z.; methodology, G.Z.; software, Z.Z.; validation, L.R., D.L. and X.Z.; formal analysis, L.R.; investigation, Z.Z.; resources, X.Z.; data curation, G.Z.; writing—original draft preparation, G.Z.; writing—review and editing, Z.Z.; visualization, L.R.; supervision, G.Z.; project administration, G.Z.; funding acquisition, L.R. All authors have read and agreed to the published version of the manuscript.
Funding
This research was funded by the National Natural Science Foundation of China, grant number 52027811 (Head: Hong-nan Li/ H.-N.L.).
Data Availability Statement
The data that support the findings of this study are available on request from the corresponding author. The data are not publicly available due to privacy or ethical restrictions.
Conflicts of Interest
The authors declare no conflict of interest.
References
- Wang, W.; Wang, X.; Hua, X.; Song, G.; Chen, Z. Vibration control of vortex-induced vibrations of a bridge deck by a single-side pounding tuned mass damper. Eng. Struct. 2018, 173, 61–75. [Google Scholar] [CrossRef]
- Yin, X.; Liu, Y.; Song, G.; Mo, Y. Suppression of bridge vibration induced by moving vehicles using pounding tuned mass dampers. J. Bridge Eng. 2018, 23, 04018047. [Google Scholar] [CrossRef]
- Huo, L.; Li, C.; Jiang, T.; Li, H. Feasibility study of steel bar corrosion monitoring using a piezoceramic transducer enabled time reversal method. Appl. Sci. 2018, 8, 2304. [Google Scholar] [CrossRef]
- Peng, J.; Hu, S.; Zhang, J.; Cai, C.; Li, L. Influence of cracks on chloride diffusivity in concrete: A five-phase mesoscale model approach. Constr. Build. Mater. 2019, 197, 587–596. [Google Scholar] [CrossRef]
- Peng, J.; Xiao, L.; Zhang, J.; Cai, C.; Wang, L. Flexural behavior of corroded HPS beams. Eng. Struct. 2019, 195, 274–287. [Google Scholar] [CrossRef]
- Sitton, J.; Story, B.; Zeinali, Y. Bridge impact detection and classification using artificial neural networks. In Proceedings of the 11th IWSHM 2017—11th International Workshop on Structural Health Monitoring, Stanford, CA, USA, 12–14 September 2017; pp. 1261–1267. [Google Scholar]
- Song, G.; Olmi, C.; Gu, H. An over height vehicle-bridge collision monitoring system using piezoelectric transducers. Smart Mater. Struct. 2007, 16, 462–468. [Google Scholar] [CrossRef]
- Kong, Q.; Robert, R.H.; Silva, P.; Mo, Y. Cyclic crack monitoring of a reinforced concrete column under simulated pseudo-dynamic loading using piezoceramic-based smart aggregates. Appl. Sci. 2016, 6, 314. [Google Scholar] [CrossRef]
- Zhou, L.; Zheng, Y.; Song, G.; Chen, D. Identification of the structural damage mechanism of BFRP bars reinforced concrete beams using smart transducers based on time reversal method. Constr. Build. Mater. 2019, 220, 615–627. [Google Scholar] [CrossRef]
- Komary, M.; Komarizadehasl, S.; Tosic, N.; Segura, I.; Lozano-Galant, J.A.; Turmo, J. Low-Cost Technologies Used in Corrosion Monitoring. Sensors 2022, 23, 1309. [Google Scholar] [CrossRef] [PubMed]
- Hu, J.; Chen, W.; Zhang, S.; Yin, Y.; Yang, D. Thermal characteristics and comfort assessment of enclosed large-span membrane stadiums. Appl. Energy 2018, 229, 728–735. [Google Scholar] [CrossRef]
- Cox, C.; Deaton, T.; Webb, S. A deep-sea differential pressure gauge. J. Atmos. Ocean. Technol. 1984, 1, 237–246. [Google Scholar] [CrossRef]
- Doubov, A. Development of a metal magnetic memory method. Chem. Pet. Eng. 2012, 47, 837–839. [Google Scholar] [CrossRef]
- Fu, Z.; Ji, B.; Wang, Q. Cable force calculation using vibration frequency methods based on cable geometric parameters. J. Perform. Constr. Facil. 2017, 31, 04017021. [Google Scholar] [CrossRef]
- Pang, C.; Zhou, J.; Zhao, R. Research on internal force detection method of steel bar in elastic and yielding stage based on metal magnetic memory. Materials 2019, 12, 1167. [Google Scholar] [CrossRef] [PubMed]
- Komarizadehasl, S.; Huguenet, P.; Lozano, F.; Lozano-Galant, J.; Turmo, J. Operational and Analytical Modal Analysis of a Bridge Using Low-Cost Wireless Arduino-Based Accelerometers. Sensors 2022, 22, 9808. [Google Scholar] [CrossRef] [PubMed]
- Ju, M.; Park, C.; Kim, G. Structural Health Monitoring (SHM) for a cable stayed bridge under typhoon. KSCE J. Civ. Eng. 2015, 19, 1058–1068. [Google Scholar] [CrossRef]
- Ren, L.; Jiang, T.; Jia, Z. Pipeline corrosion and leakage monitoring based on the distributed optical fiber sensing technology. Measurement 2018, 122, 57–65. [Google Scholar] [CrossRef]
- Chen, M.; Sharma, A.; Bhola, J.; Nguyen, T.V.T.; Truong, C.V. Multi-agent task planning and resource apportionment in a smart grid. Int. J. Syst. Assur. Eng. Manag. 2022, 13, 444–455. [Google Scholar] [CrossRef]
- Kersay, A.D.; Davis, M.A.; Patrick, H.J. Fiber grating sensors. J. Light. Technol. 1997, 15, 1442–1463. [Google Scholar] [CrossRef]
- Ren, L. The Application of Fiber Bragg Grating Technology in Structure Health Monitoring. Ph.D. Thesis, Dalian University of Technology, Dalian, China, 2008. [Google Scholar]
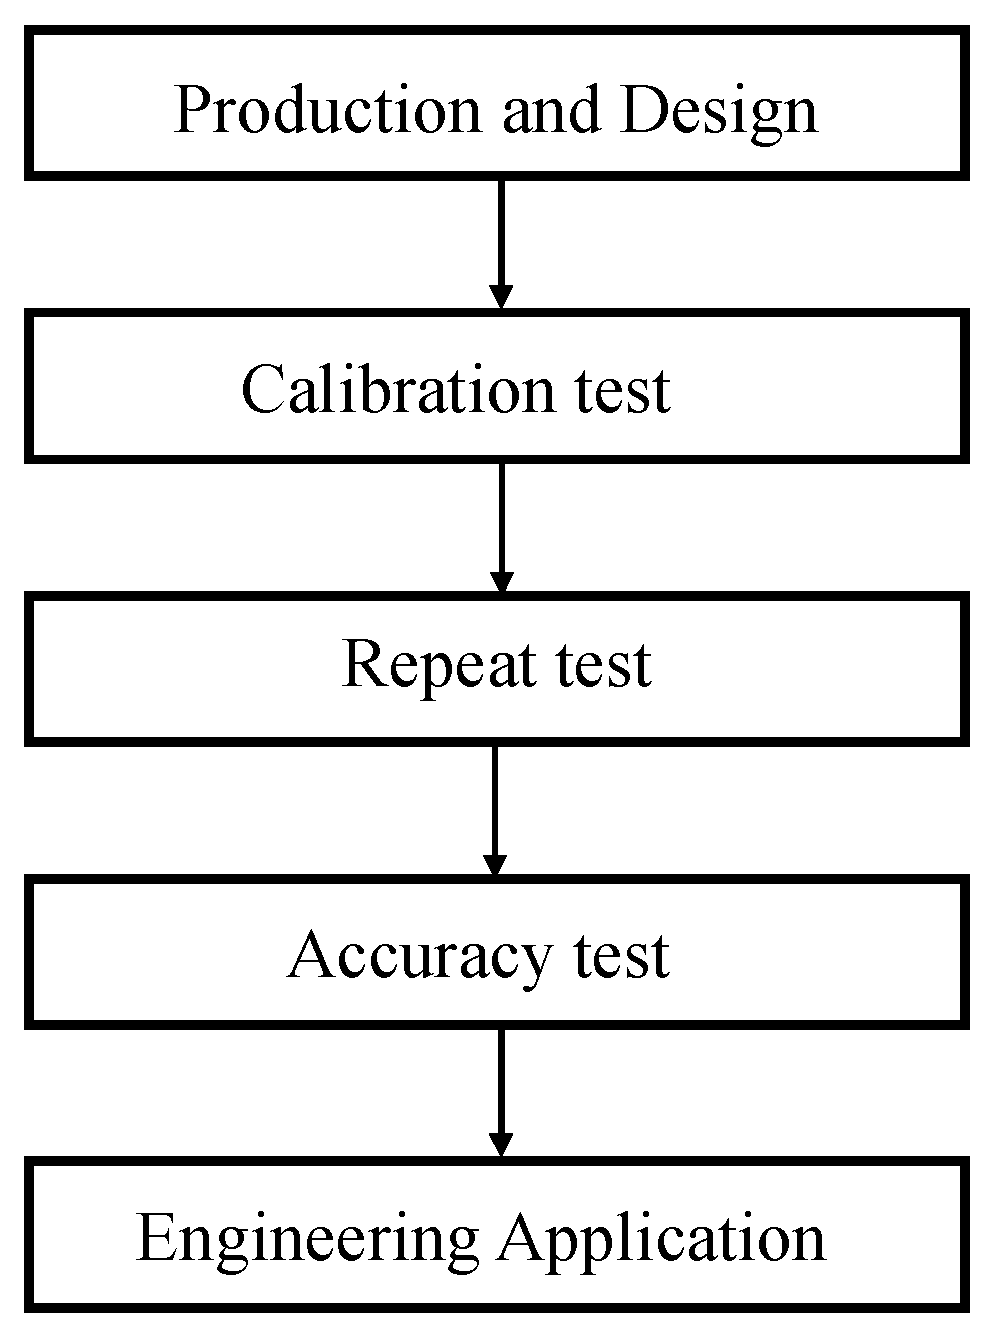
Figure 1.
Flowchart of the study process.

Figure 2.
Fiber grating structure and light transmission principle.

Figure 3.
Section of closed cable.

Figure 4.
Schematic of distributed measurement points.

Figure 5.
Calibration test set-up diagram.

Figure 6.
Smart cable in the safety slot.

Figure 7.
Results of calibration test.

Figure 8.
Result of calibration tests.

Figure 9.
Result of accuracy test.

Figure 10.
Design sketch of Dalian Suoyuwan Football Stadium.

Figure 11.
Structural drawing of steel structural roof.

Figure 12.
Results of the solicitation monitoring.

Figure 13.
Locations of measurement points.


Table 1.
Detailed data for calibration test.
| Force/[kN] | First Test/[nm] | Second Test/[nm] | Third Test/[nm] | Fourth Test/[nm] | Fifth Test/[nm] |
|---|---|---|---|---|---|
| 400 | 1560.509 | 1559.862 | 1559.790 | 1559.610 | 1559.648 |
| 600 | 1561.176 | 1560.513 | 1560.452 | 1560.289 | 1560.338 |
| 800 | 1561.826 | 1561.215 | 1561.169 | 1561.026 | 1561.080 |
| 1000 | 1562.465 | 1561.953 | 1561.910 | 1561.775 | 1561.821 |
| 1200 | 1563.137 | 1562.672 | 1562.648 | 1562.527 | 1562.568 |
| 1400 | 1563.839 | 1563.423 | 1563.430 | 1563.290 | 1563.333 |
| 1600 | 1564.609 | 1564.211 | 1564.201 | 1564.072 | 1564.141 |
Table 2.
Detailed data for accuracy test.
| Load Level | Smart Screw/[kN] | Smart Cable/[kN] |
|---|---|---|
| 1 | 460 | 296 |
| 2 | 902 | 830 |
| 3 | 1273 | 1252 |
| 4 | 1729 | 1711 |
| 5 | 2181 | 2179 |
| 6 | 2657 | 2618 |
| 7 | 3120 | 3092 |
| 8 | 3660 | 3639 |
Disclaimer/Publisher’s Note: The statements, opinions and data contained in all publications are solely those of the individual author(s) and contributor(s) and not of MDPI and/or the editor(s). MDPI and/or the editor(s) disclaim responsibility for any injury to people or property resulting from any ideas, methods, instructions or products referred to in the content. |
© 2023 by the authors. Licensee MDPI, Basel, Switzerland. This article is an open access article distributed under the terms and conditions of the Creative Commons Attribution (CC BY) license (https://creativecommons.org/licenses/by/4.0/).
Share and Cite
MDPI and ACS Style
Zhou, G.; Zhang, Z.; Ren, L.; Li, D.; Zhao, X. Design of Smart Cable for Distributed Cable Force Measurement in Cable Dome Structures and Its Application. Buildings 2023, 13, 2186. https://doi.org/10.3390/buildings13092186
AMA Style
Zhou G, Zhang Z, Ren L, Li D, Zhao X. Design of Smart Cable for Distributed Cable Force Measurement in Cable Dome Structures and Its Application. Buildings. 2023; 13(9):2186. https://doi.org/10.3390/buildings13092186
Chicago/Turabian StyleZhou, Guangyi, Zhaobo Zhang, Liang Ren, Dongfang Li, and Xuefeng Zhao. 2023. "Design of Smart Cable for Distributed Cable Force Measurement in Cable Dome Structures and Its Application" Buildings 13, no. 9: 2186. https://doi.org/10.3390/buildings13092186
Note that from the first issue of 2016, this journal uses article numbers instead of page numbers. See further details here.