
Effects of Particle Shape and Packing Density on the Mechanical Performance of Recycled Aggregates for Construction Purposes


Abstract
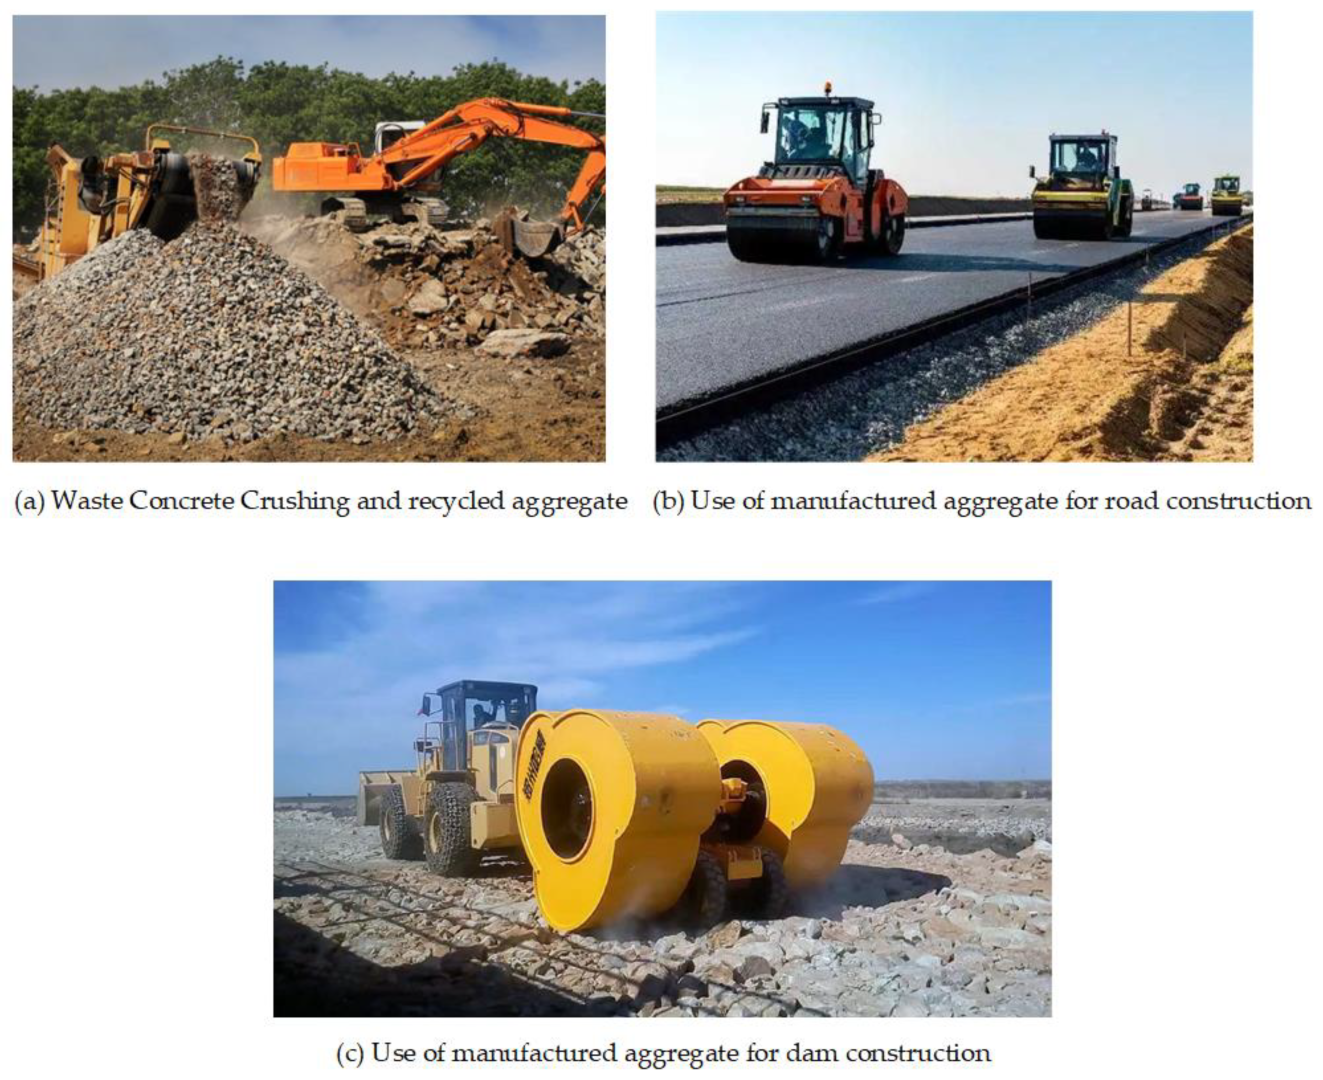
:1. Introduction
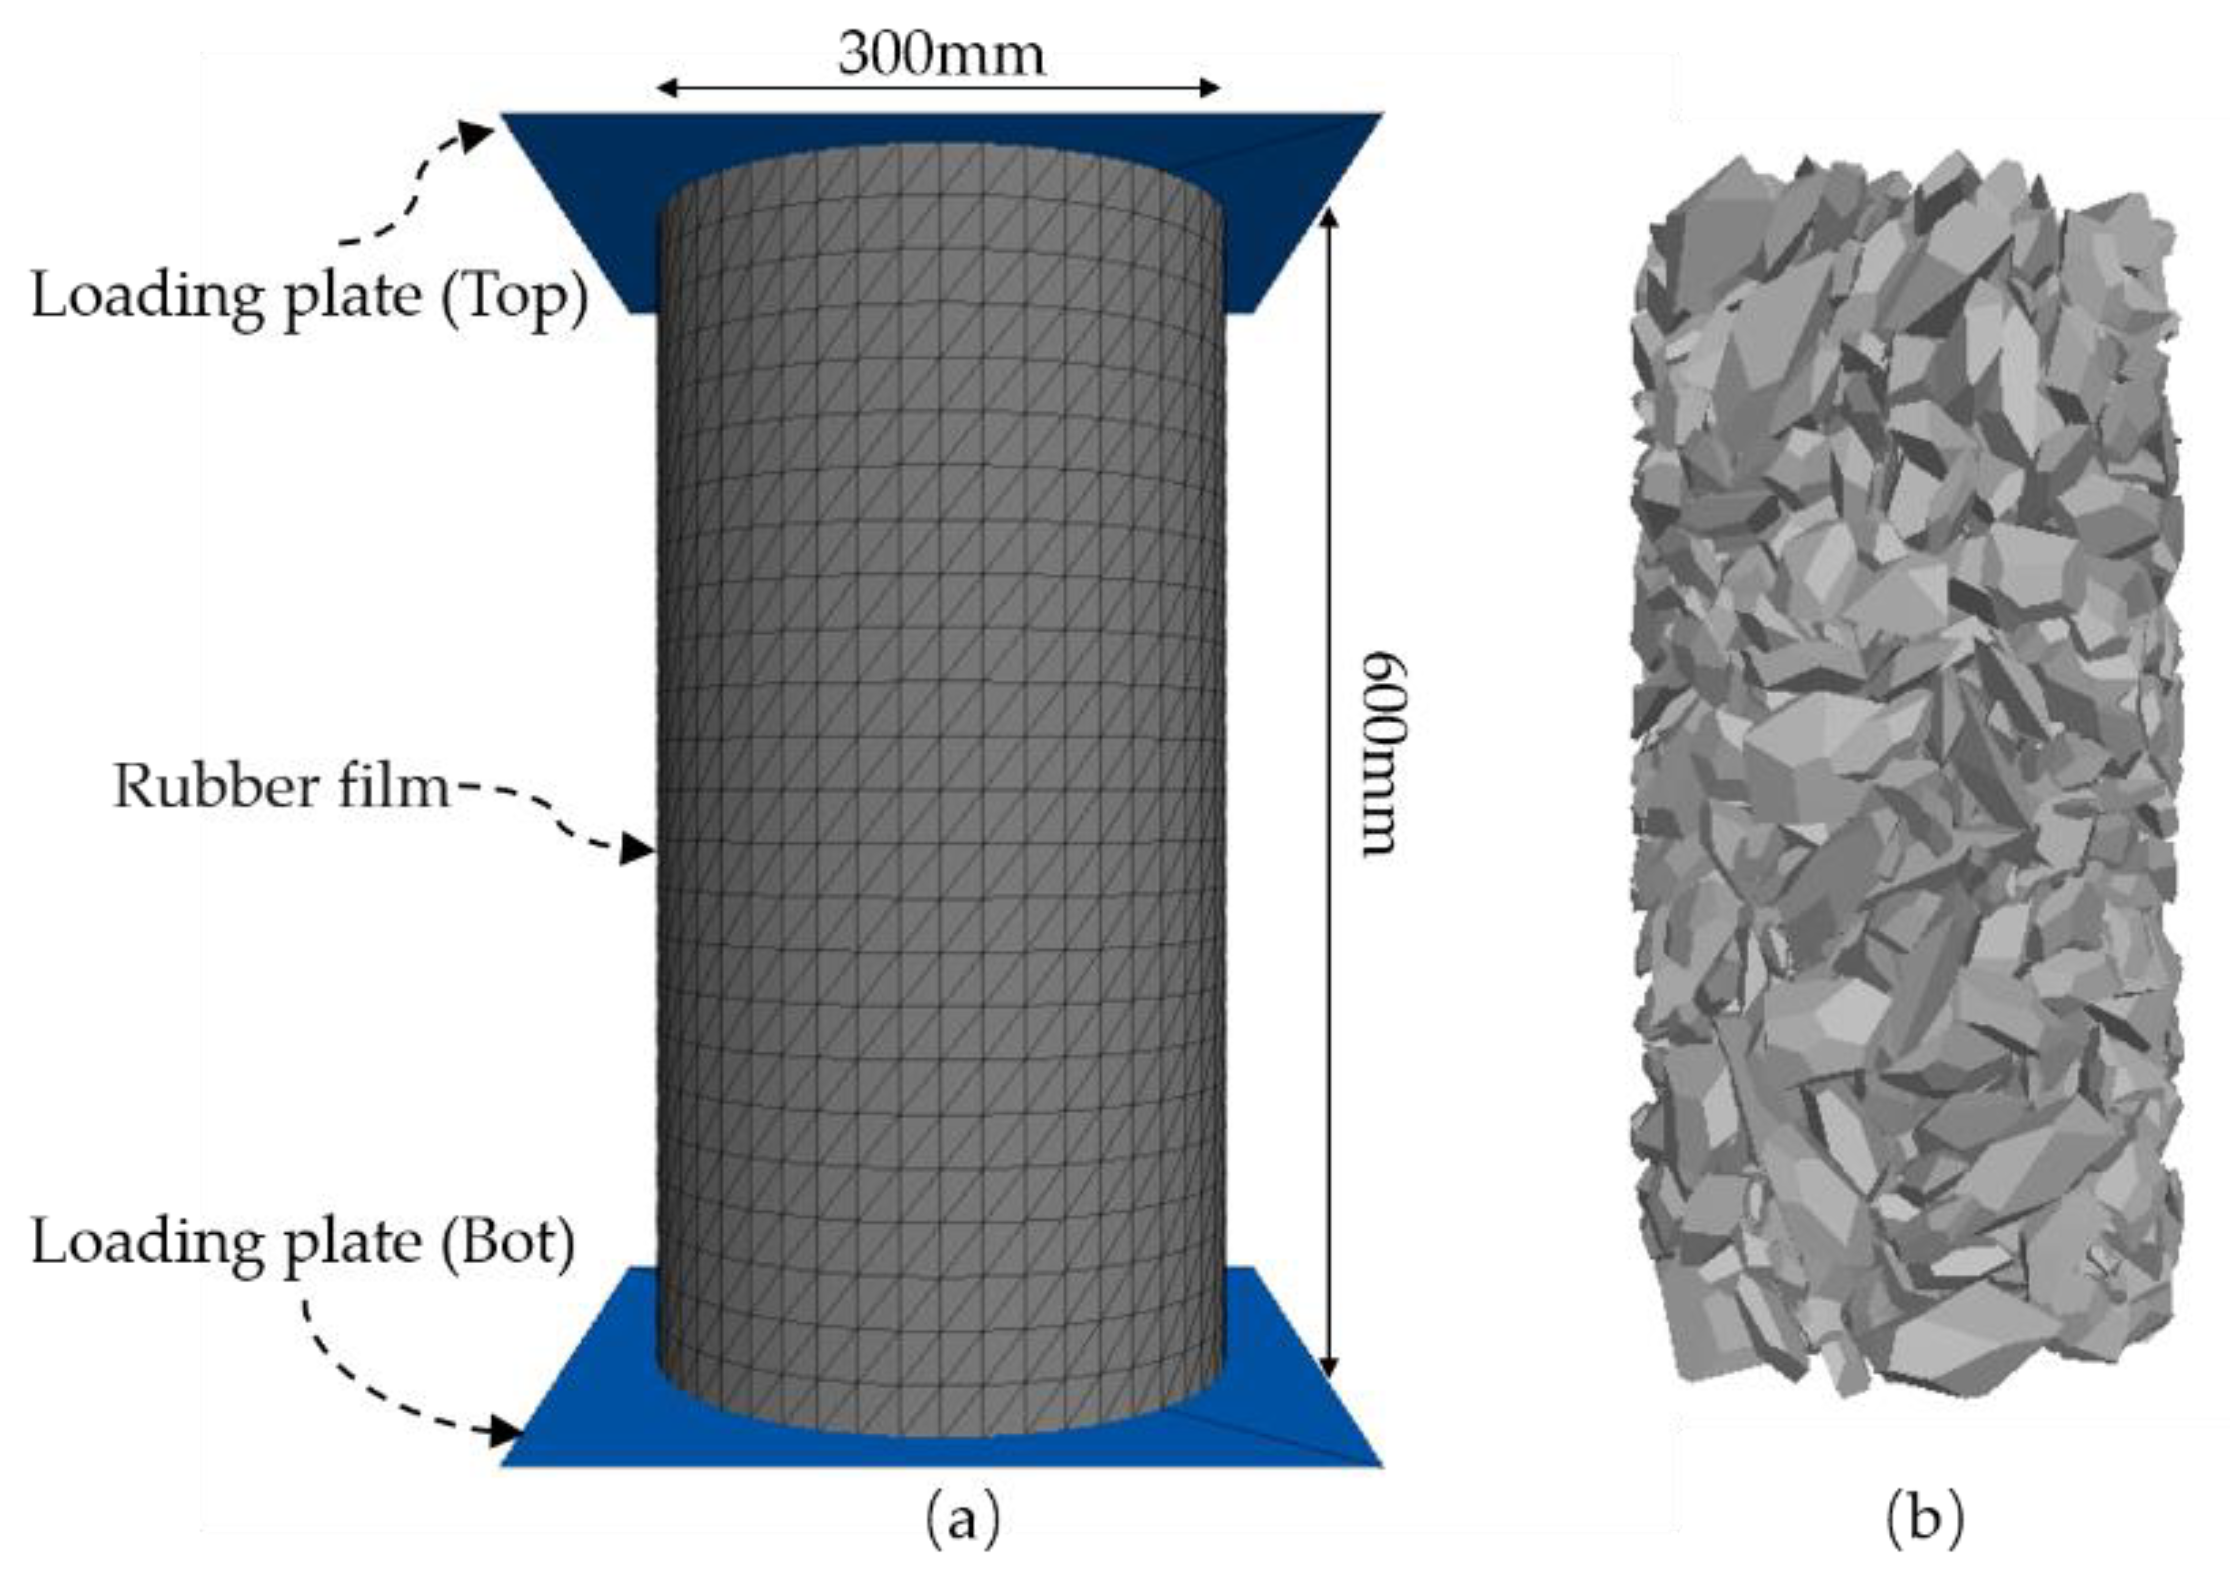
2. DEM Models
3. Mechanical Property
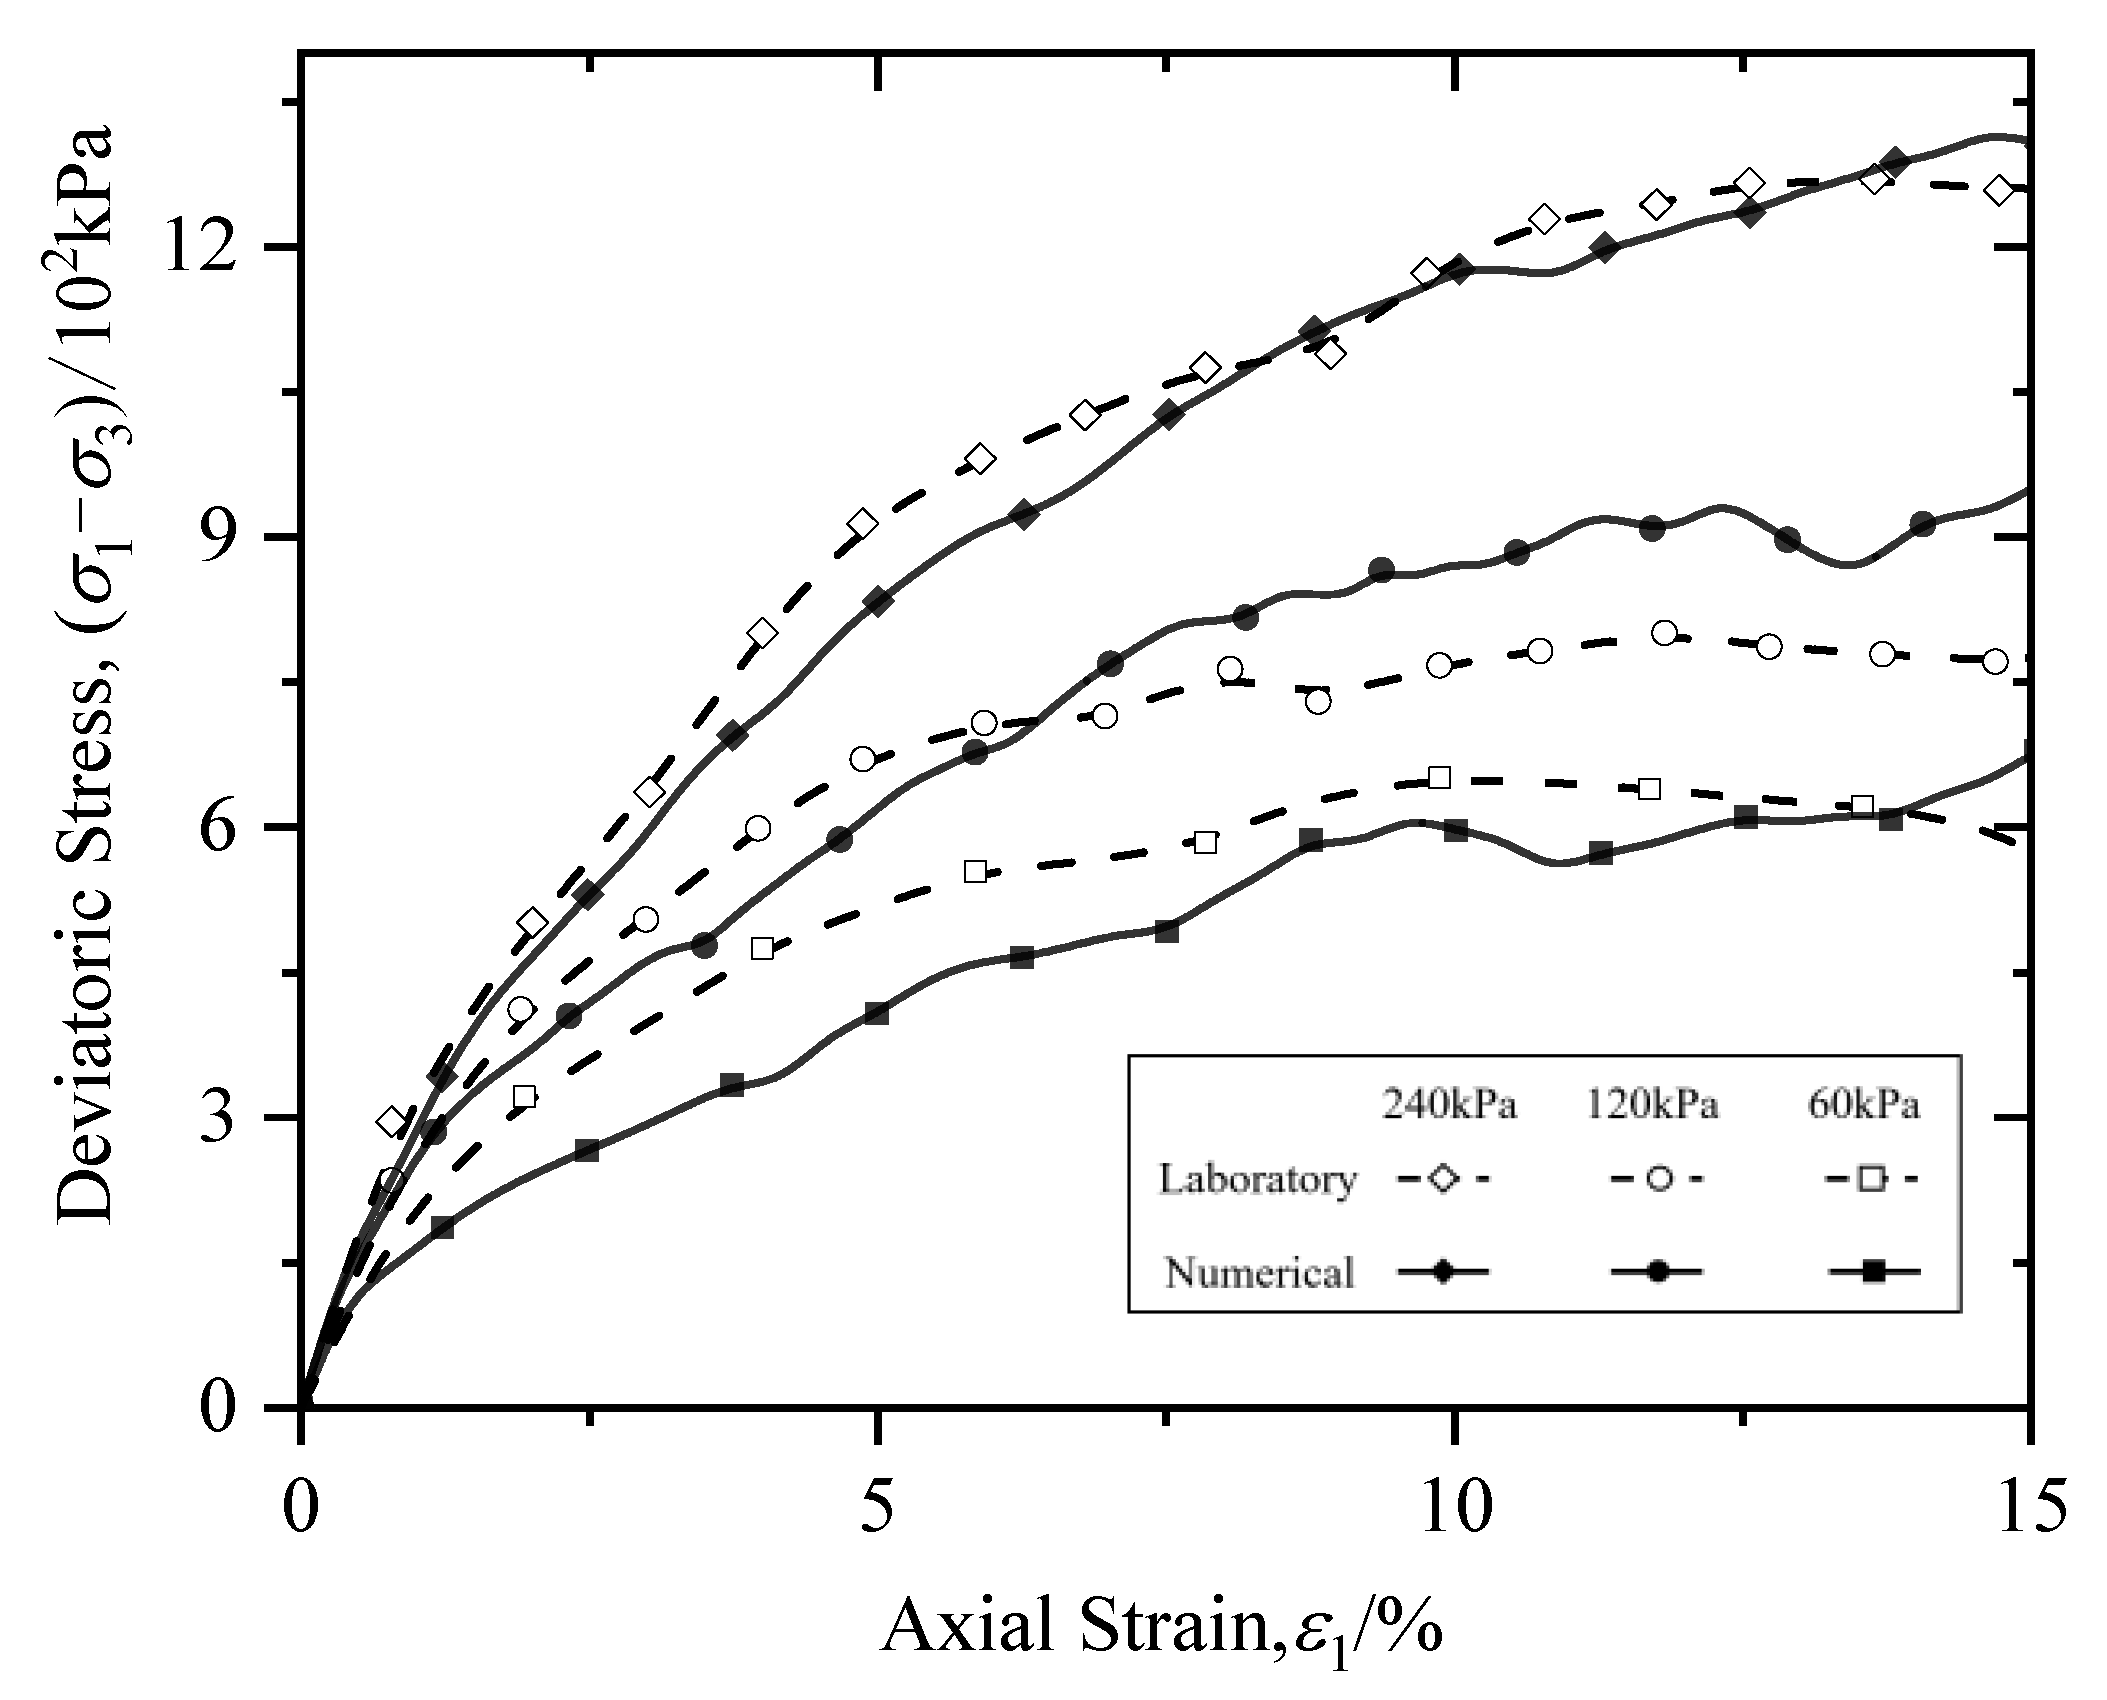
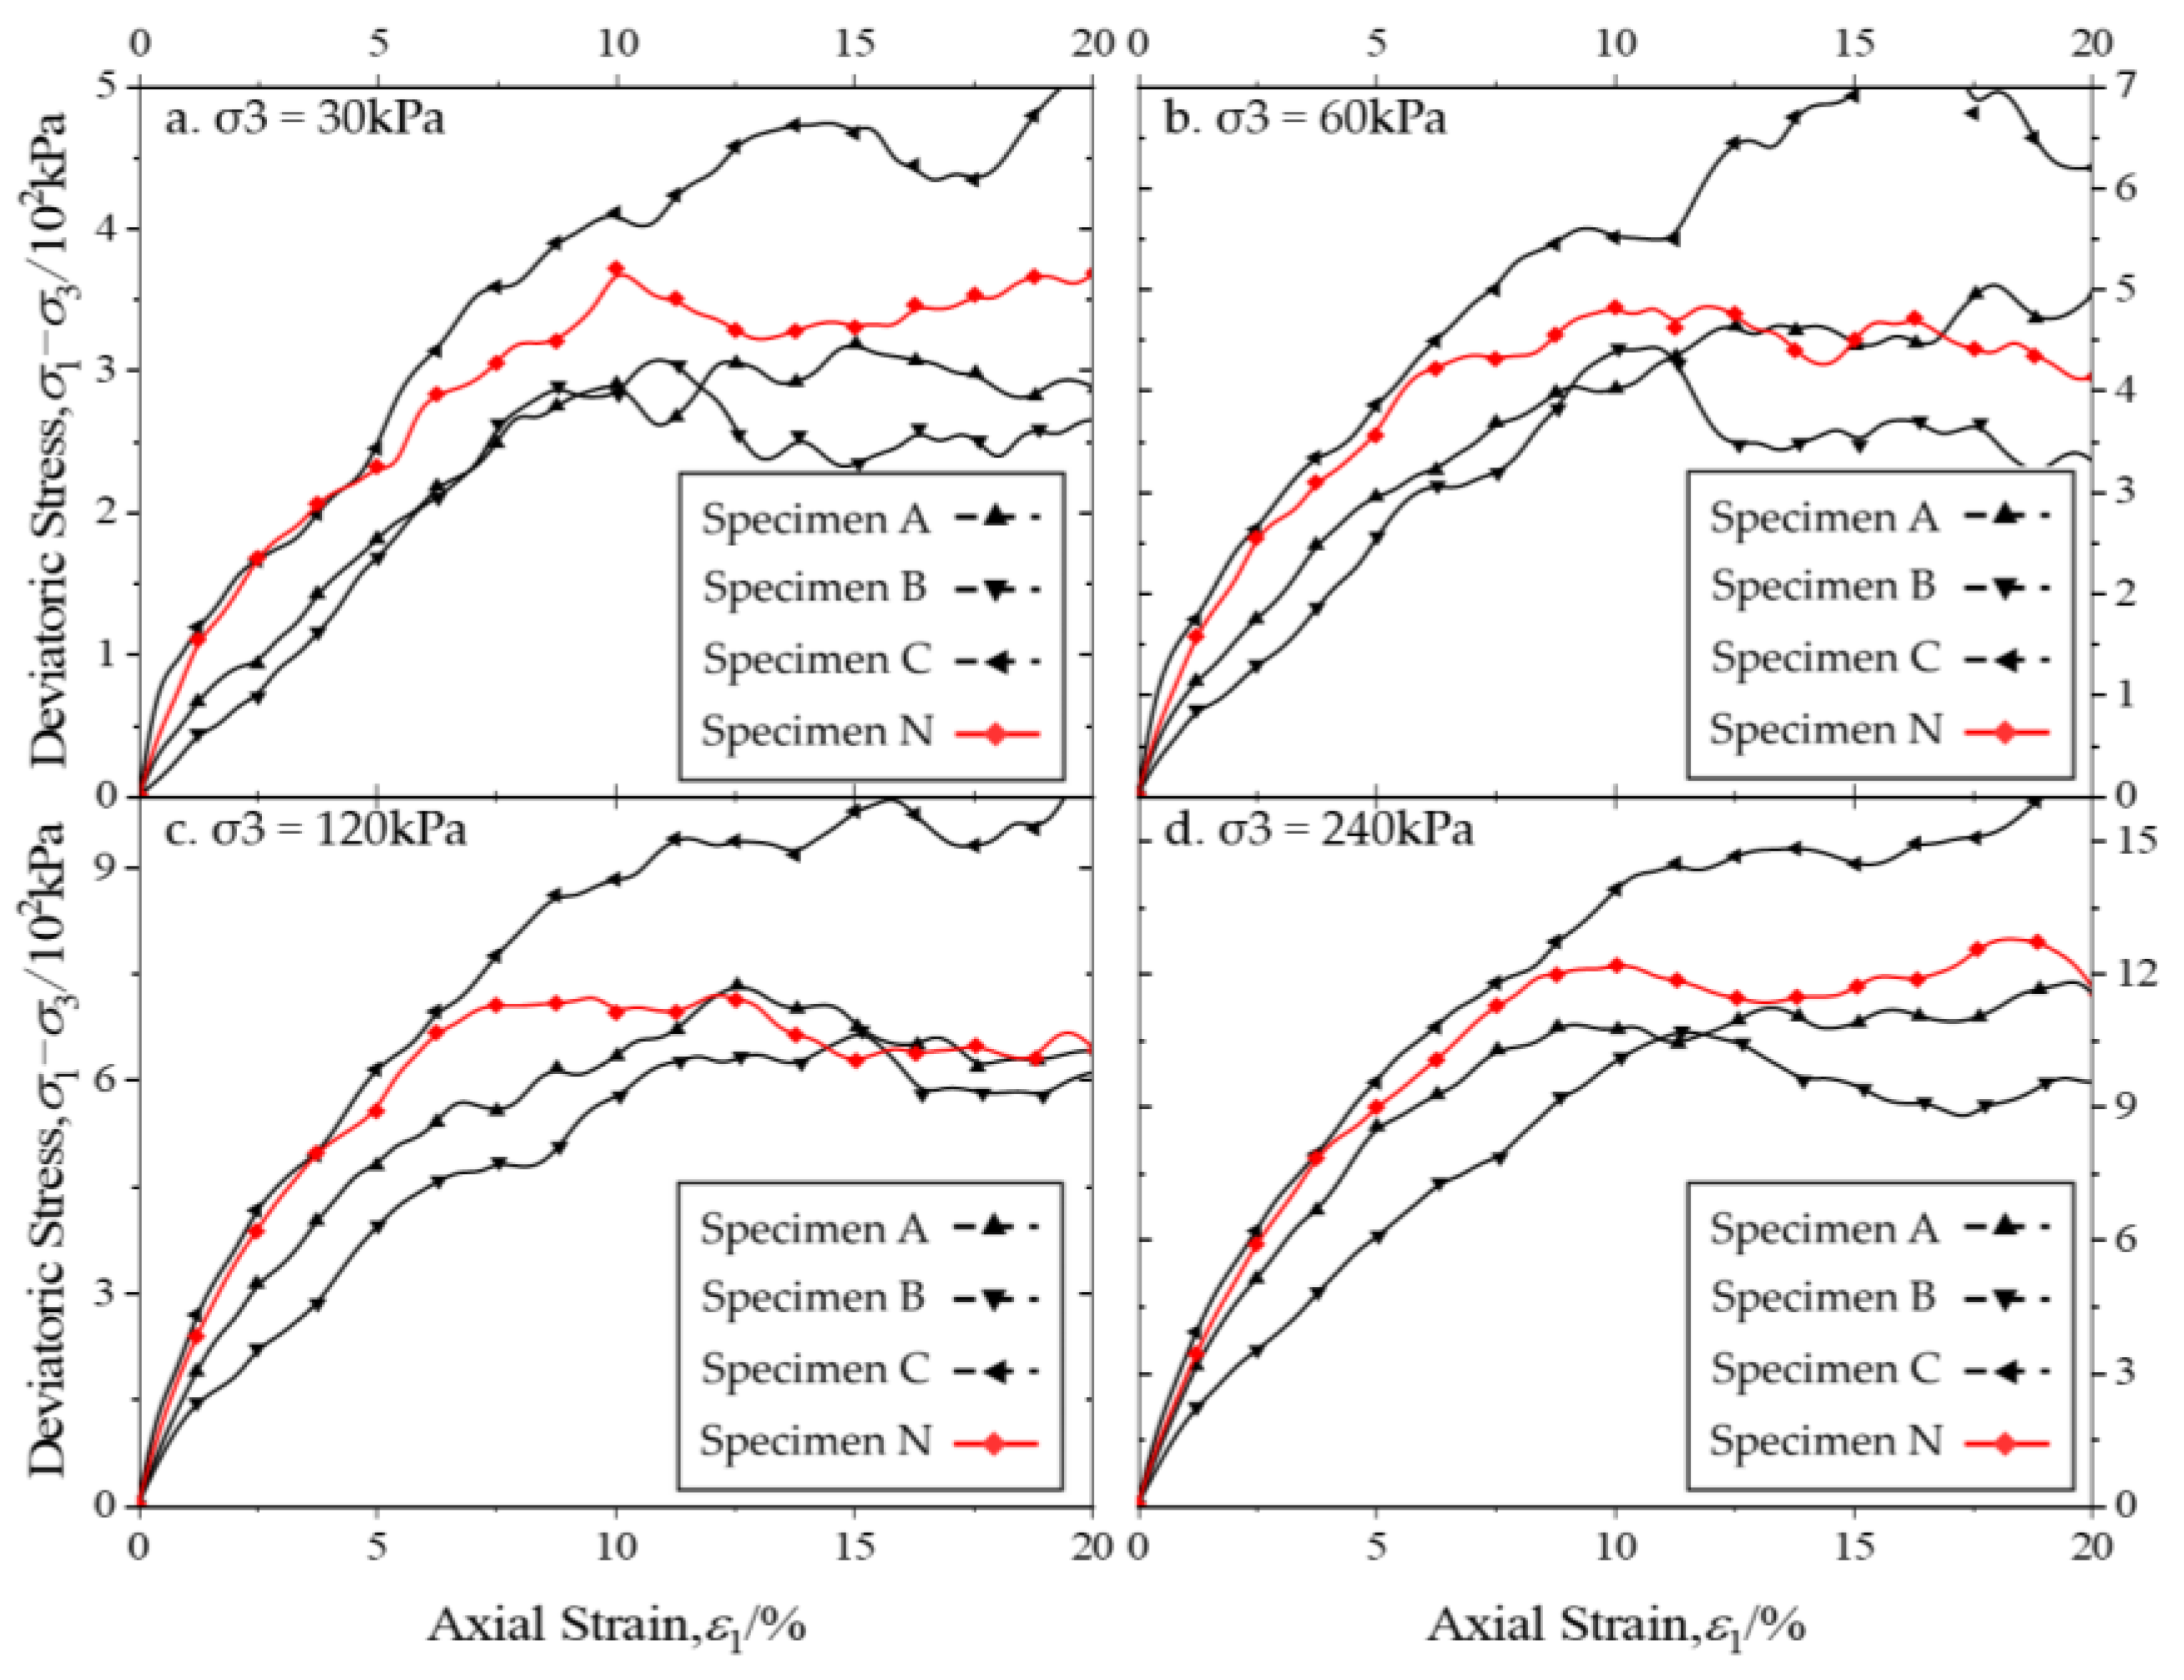
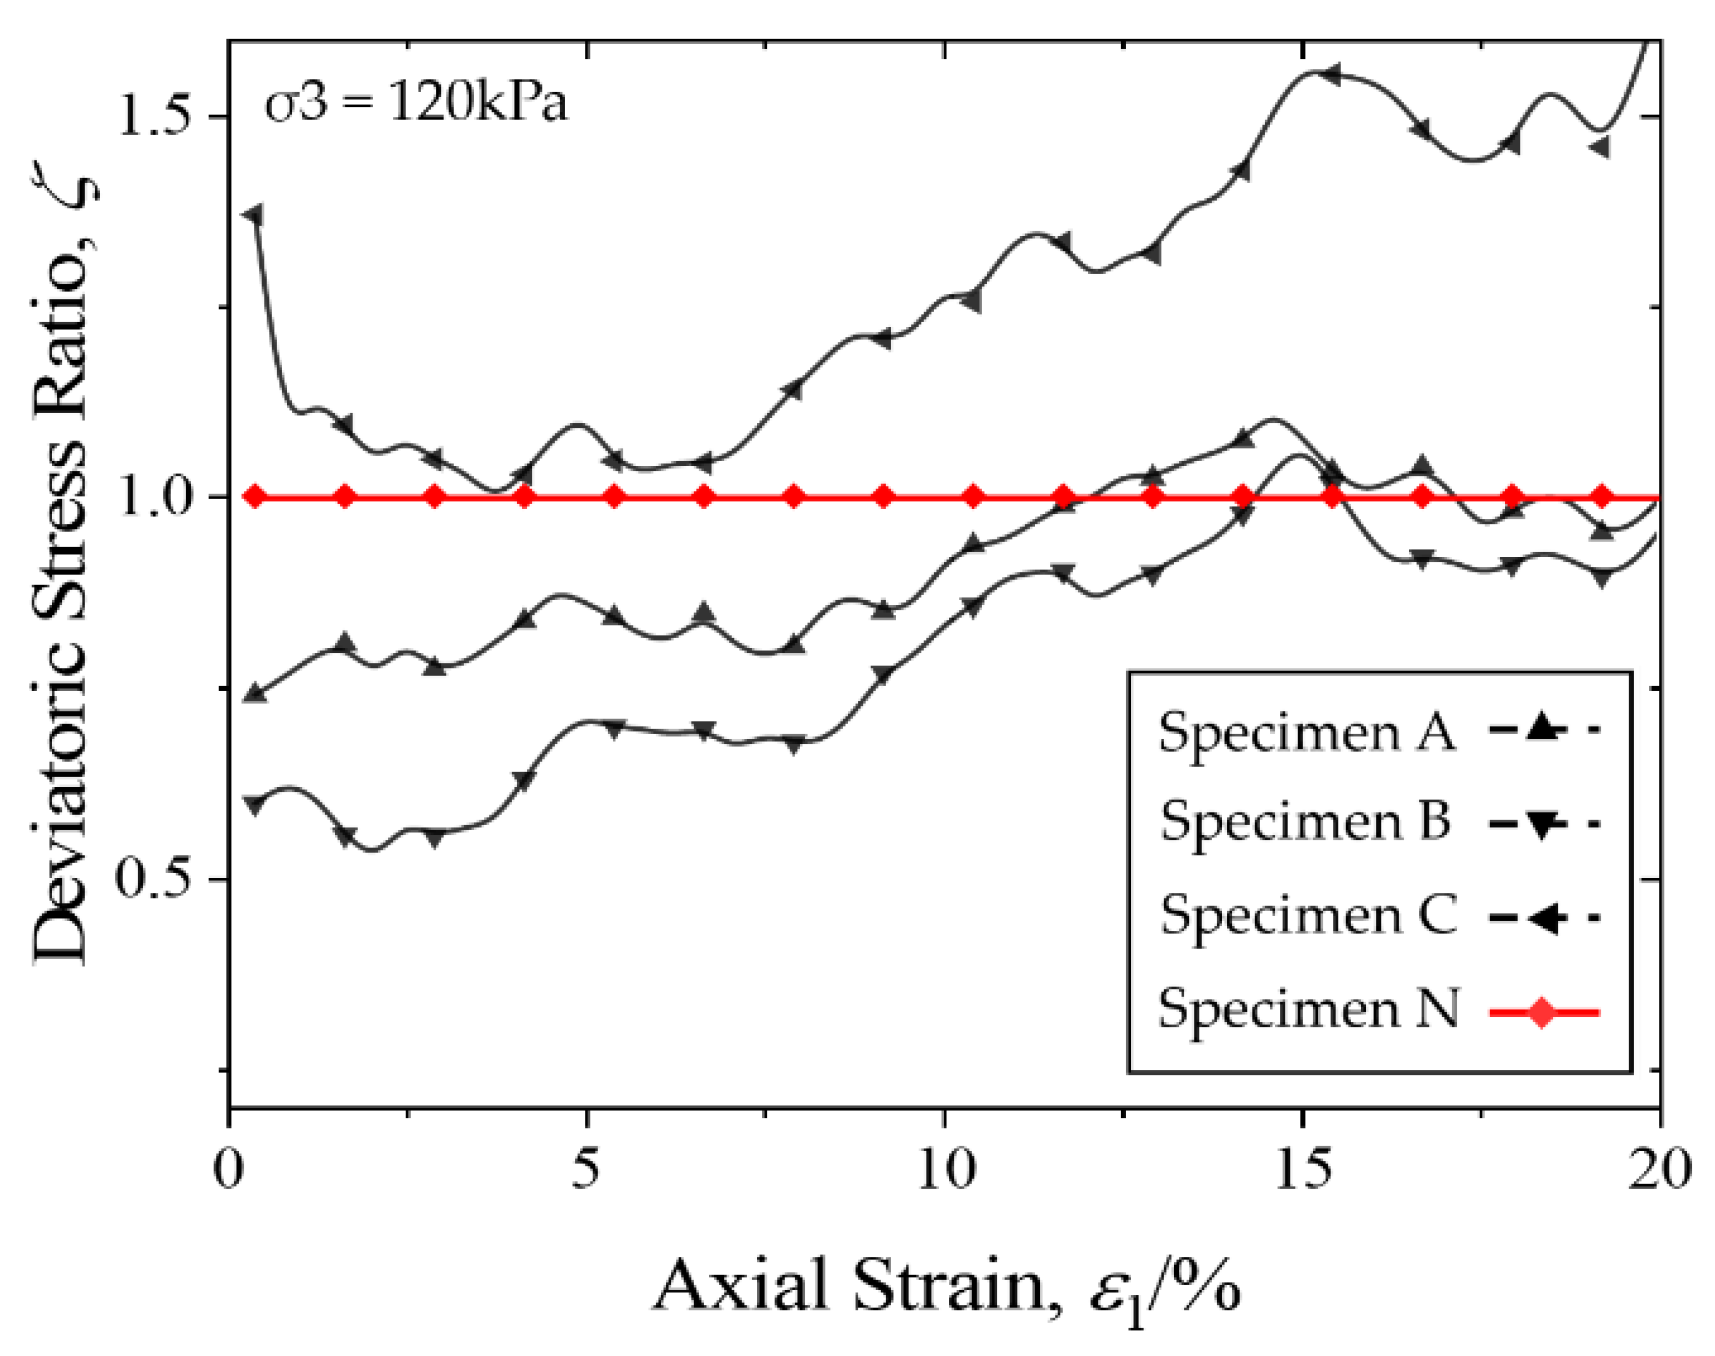
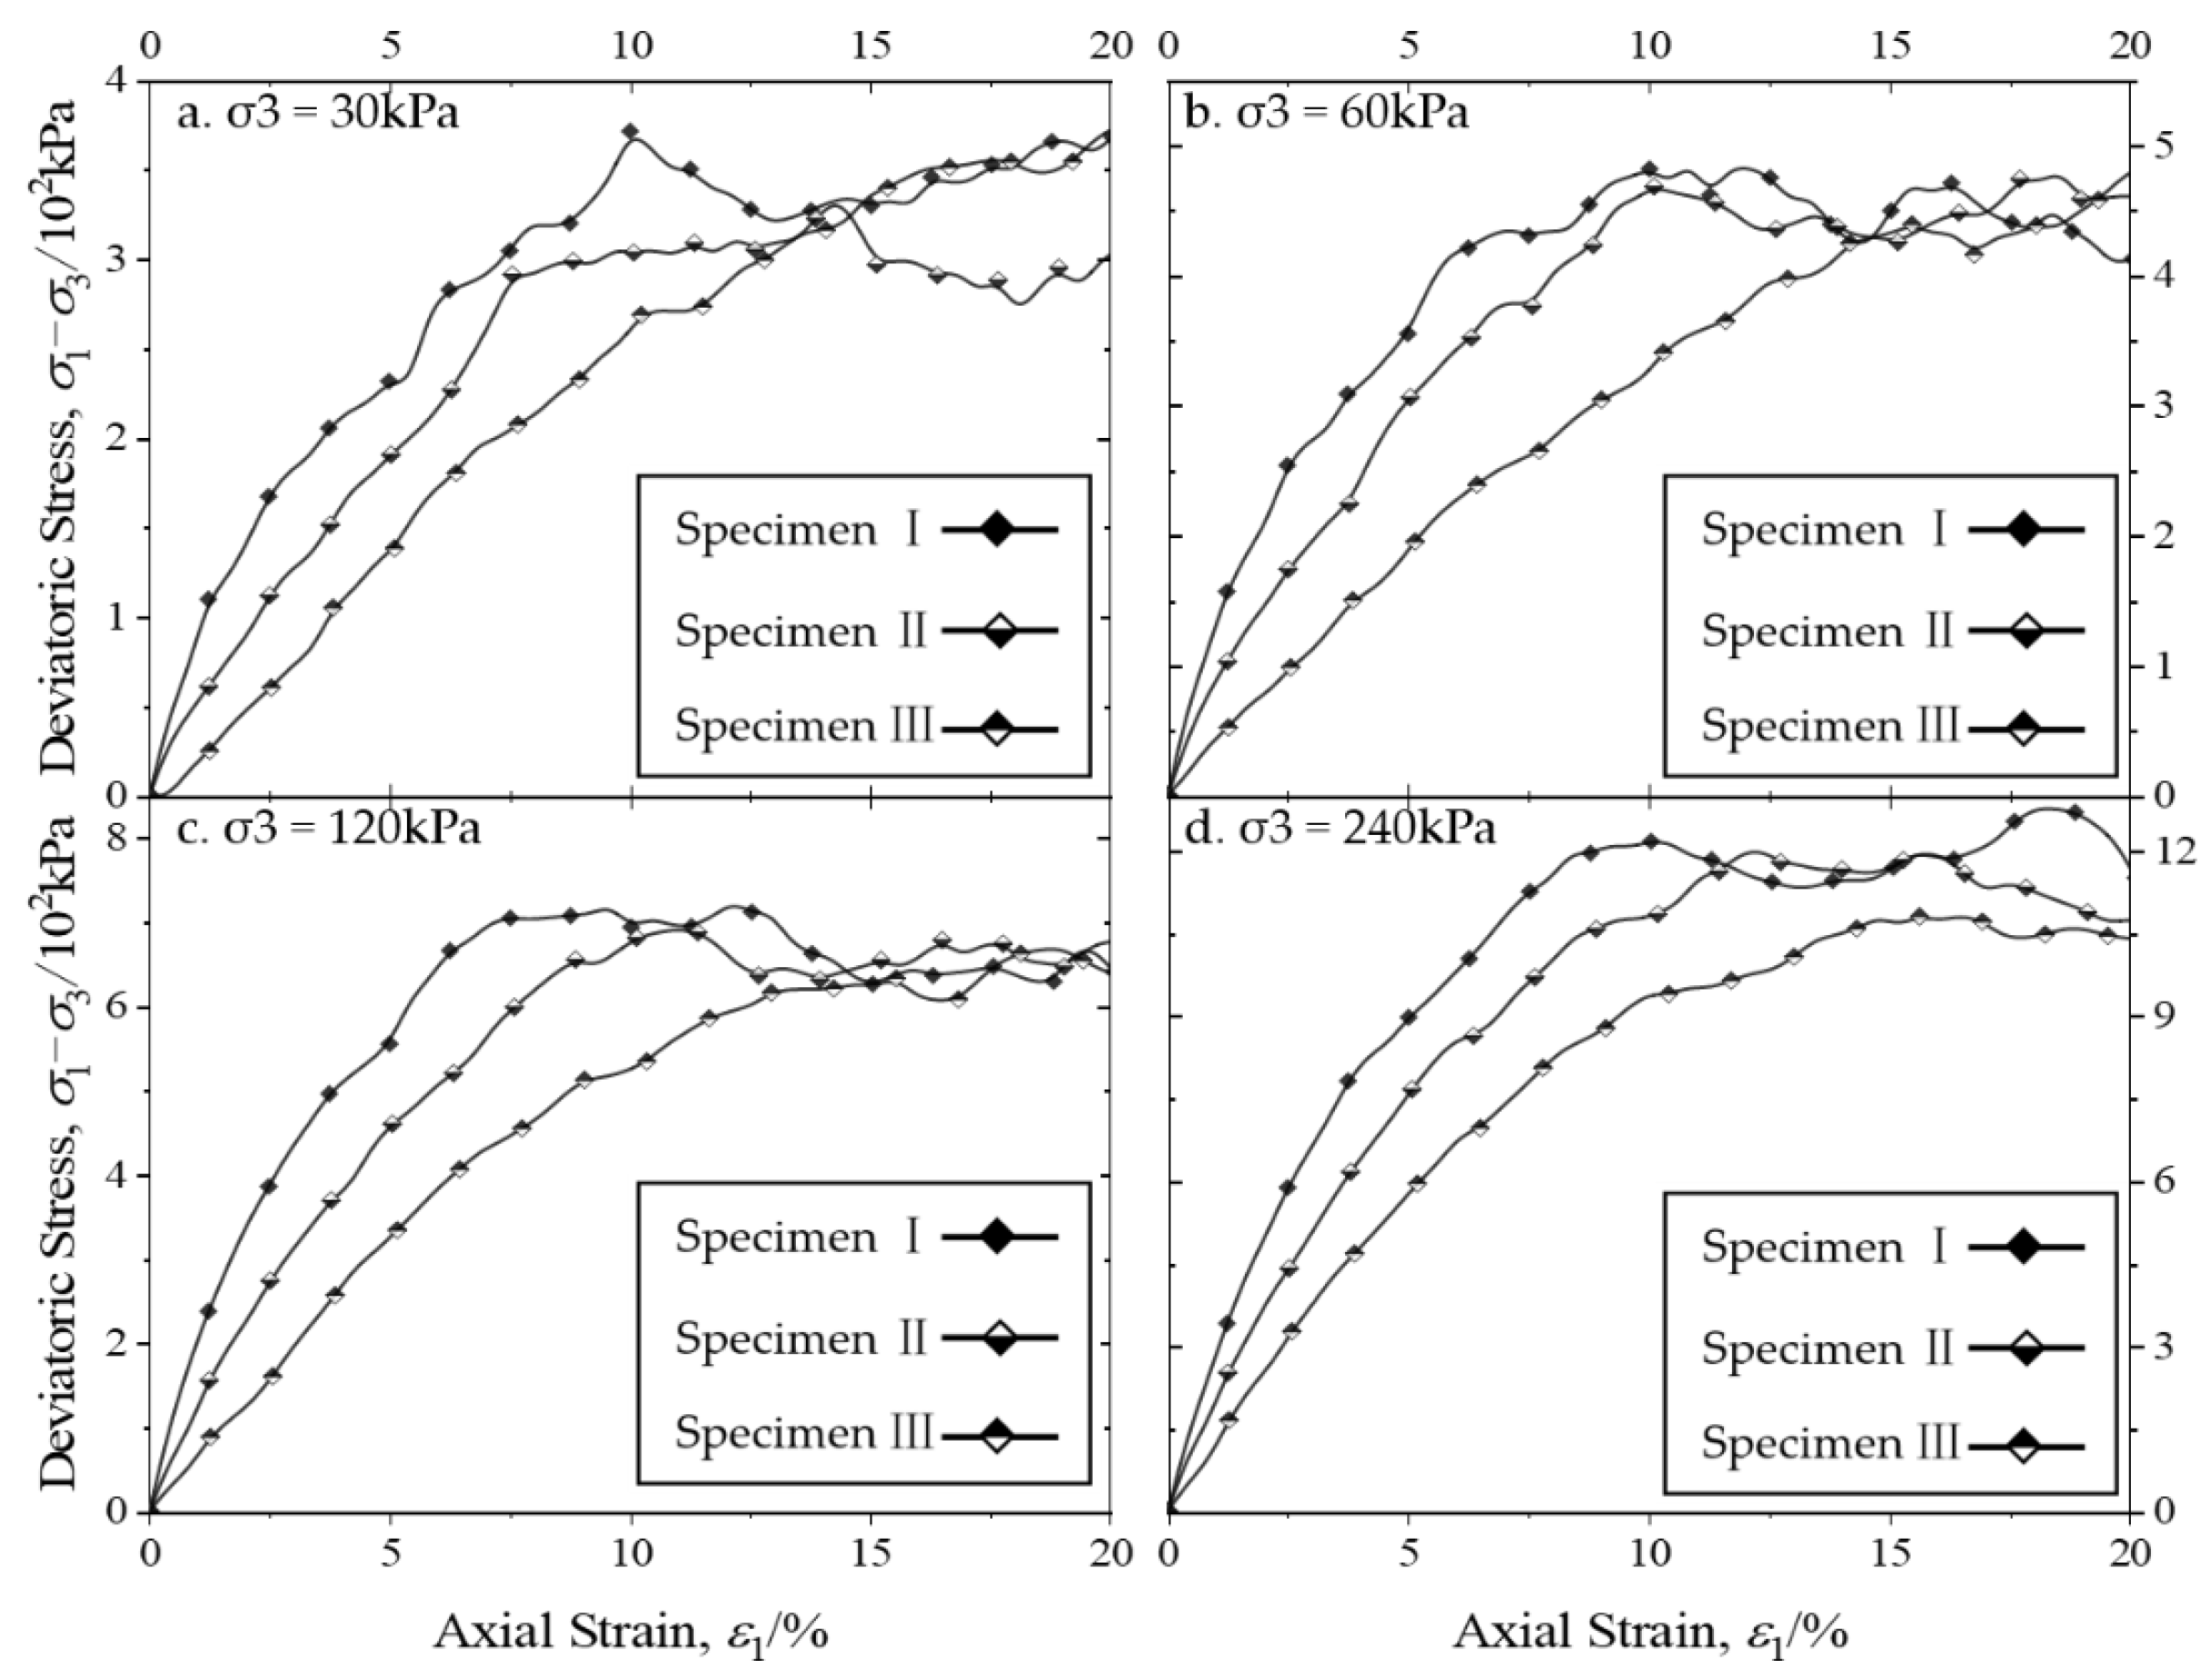
3.1. Stress–Strain Curve
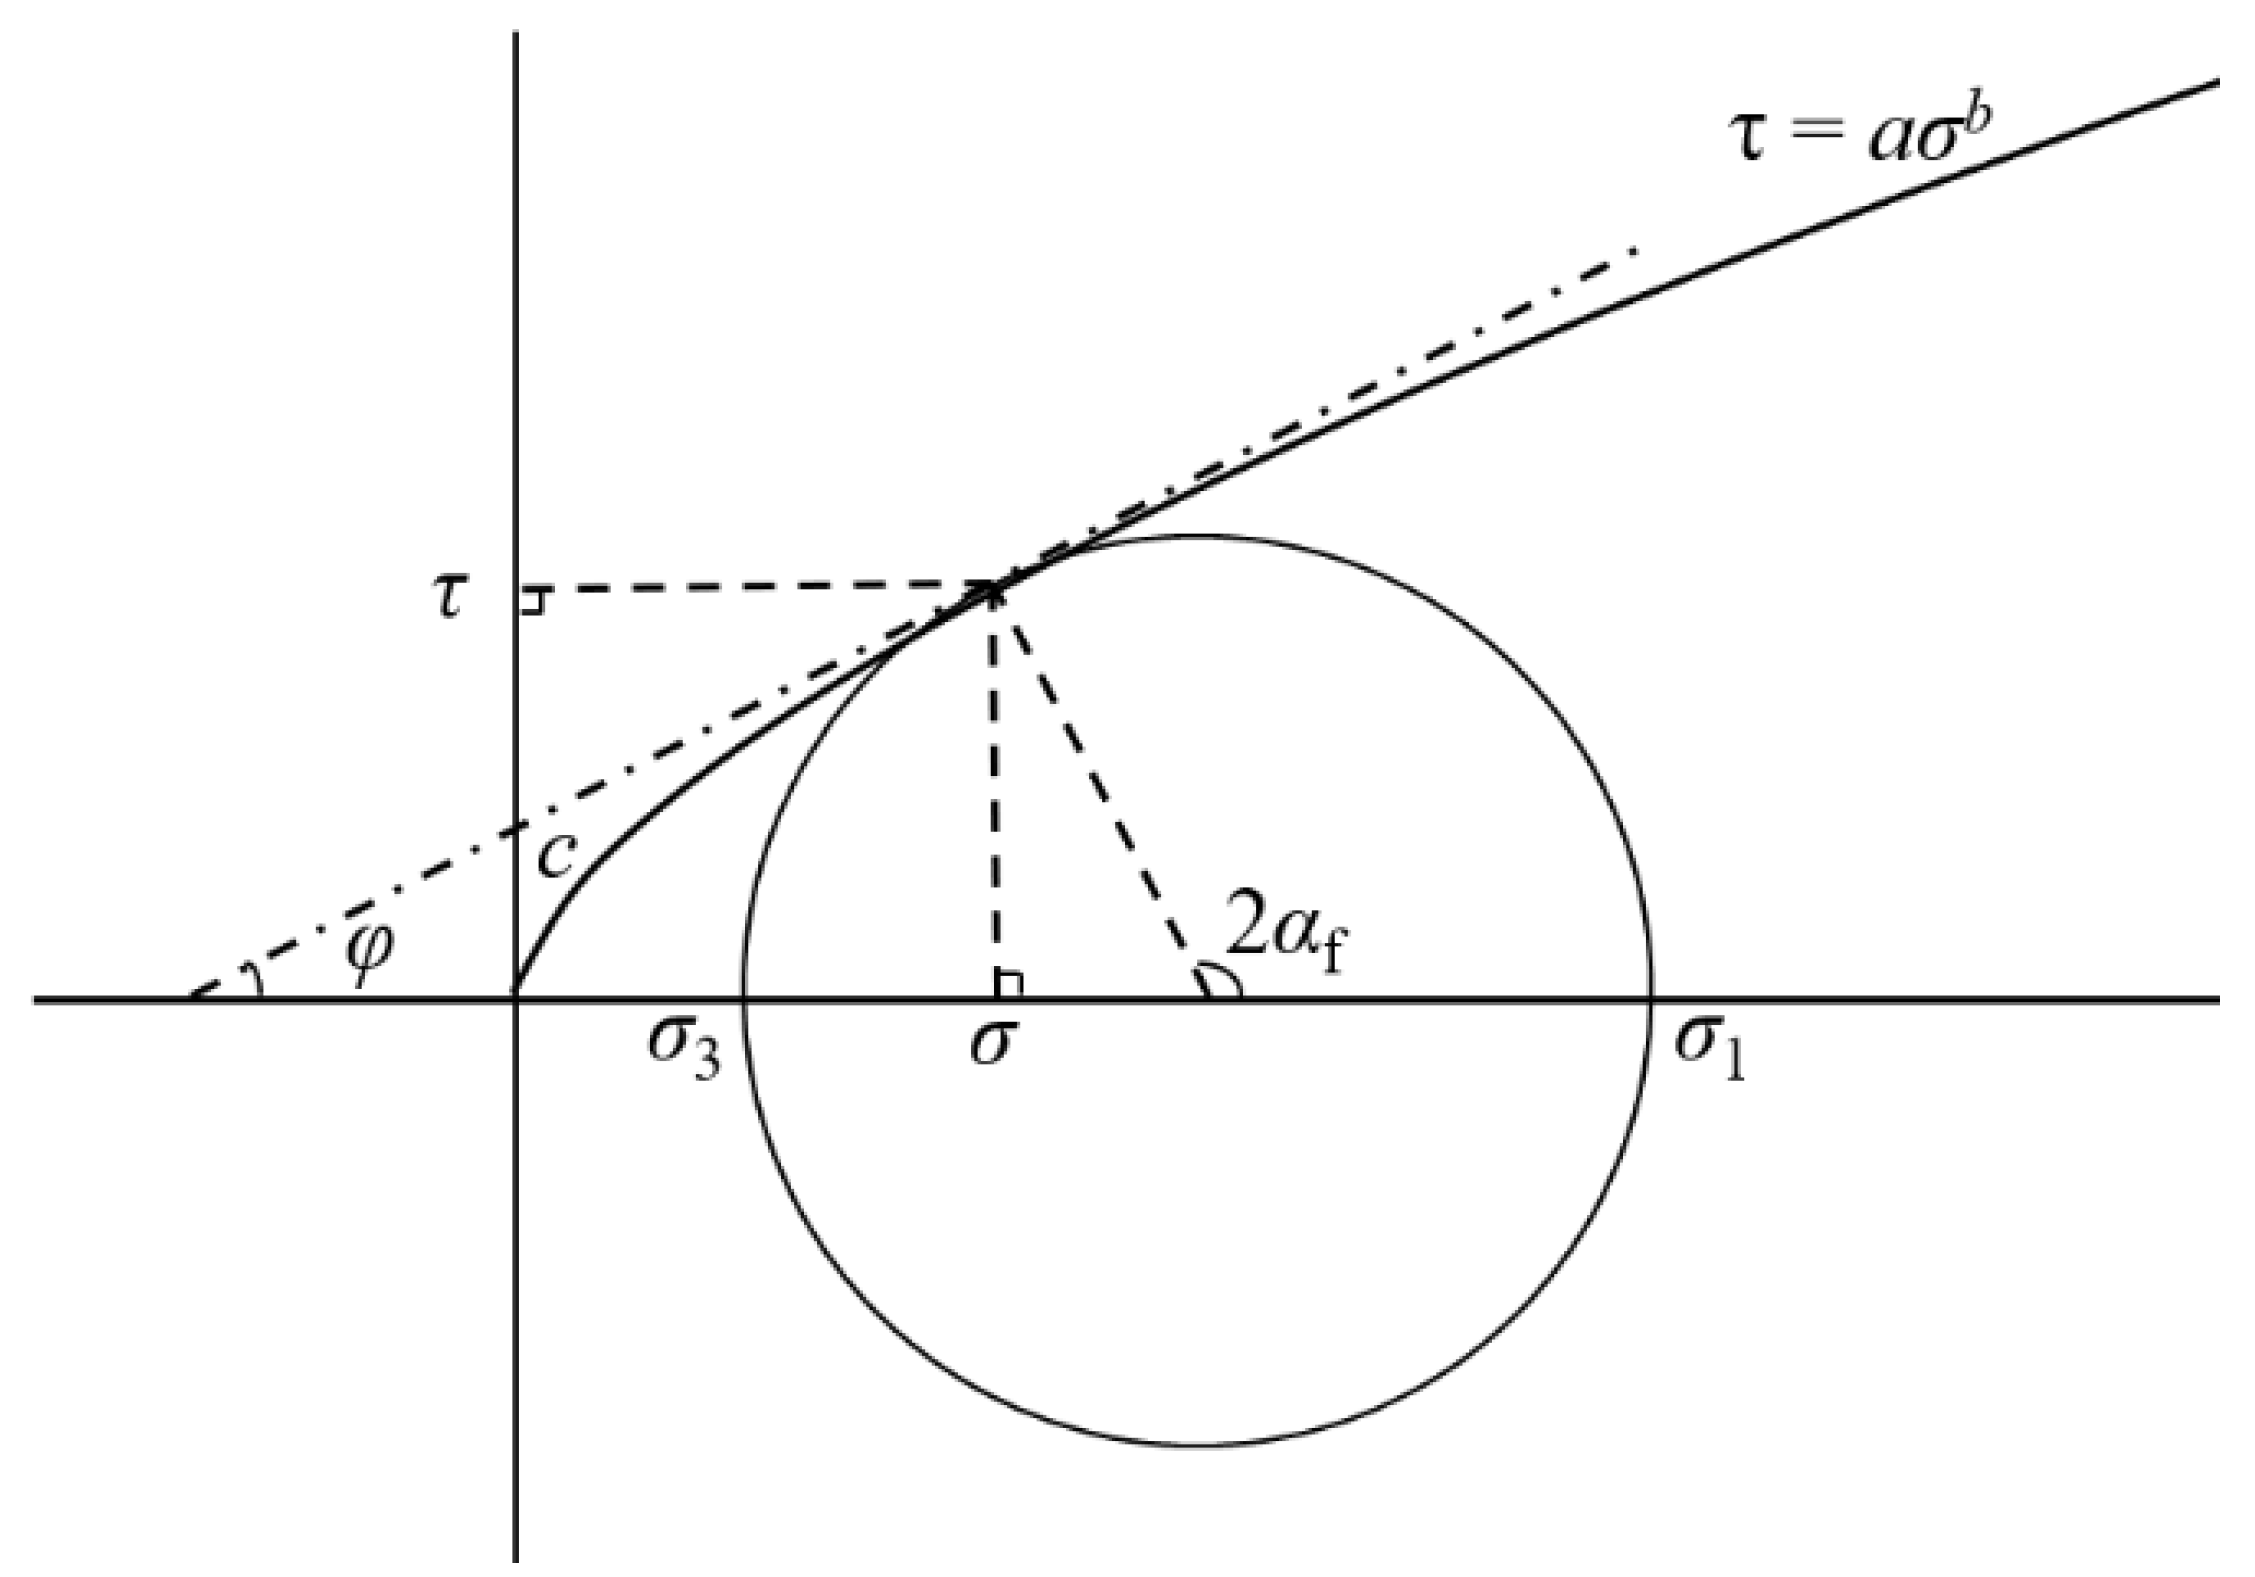
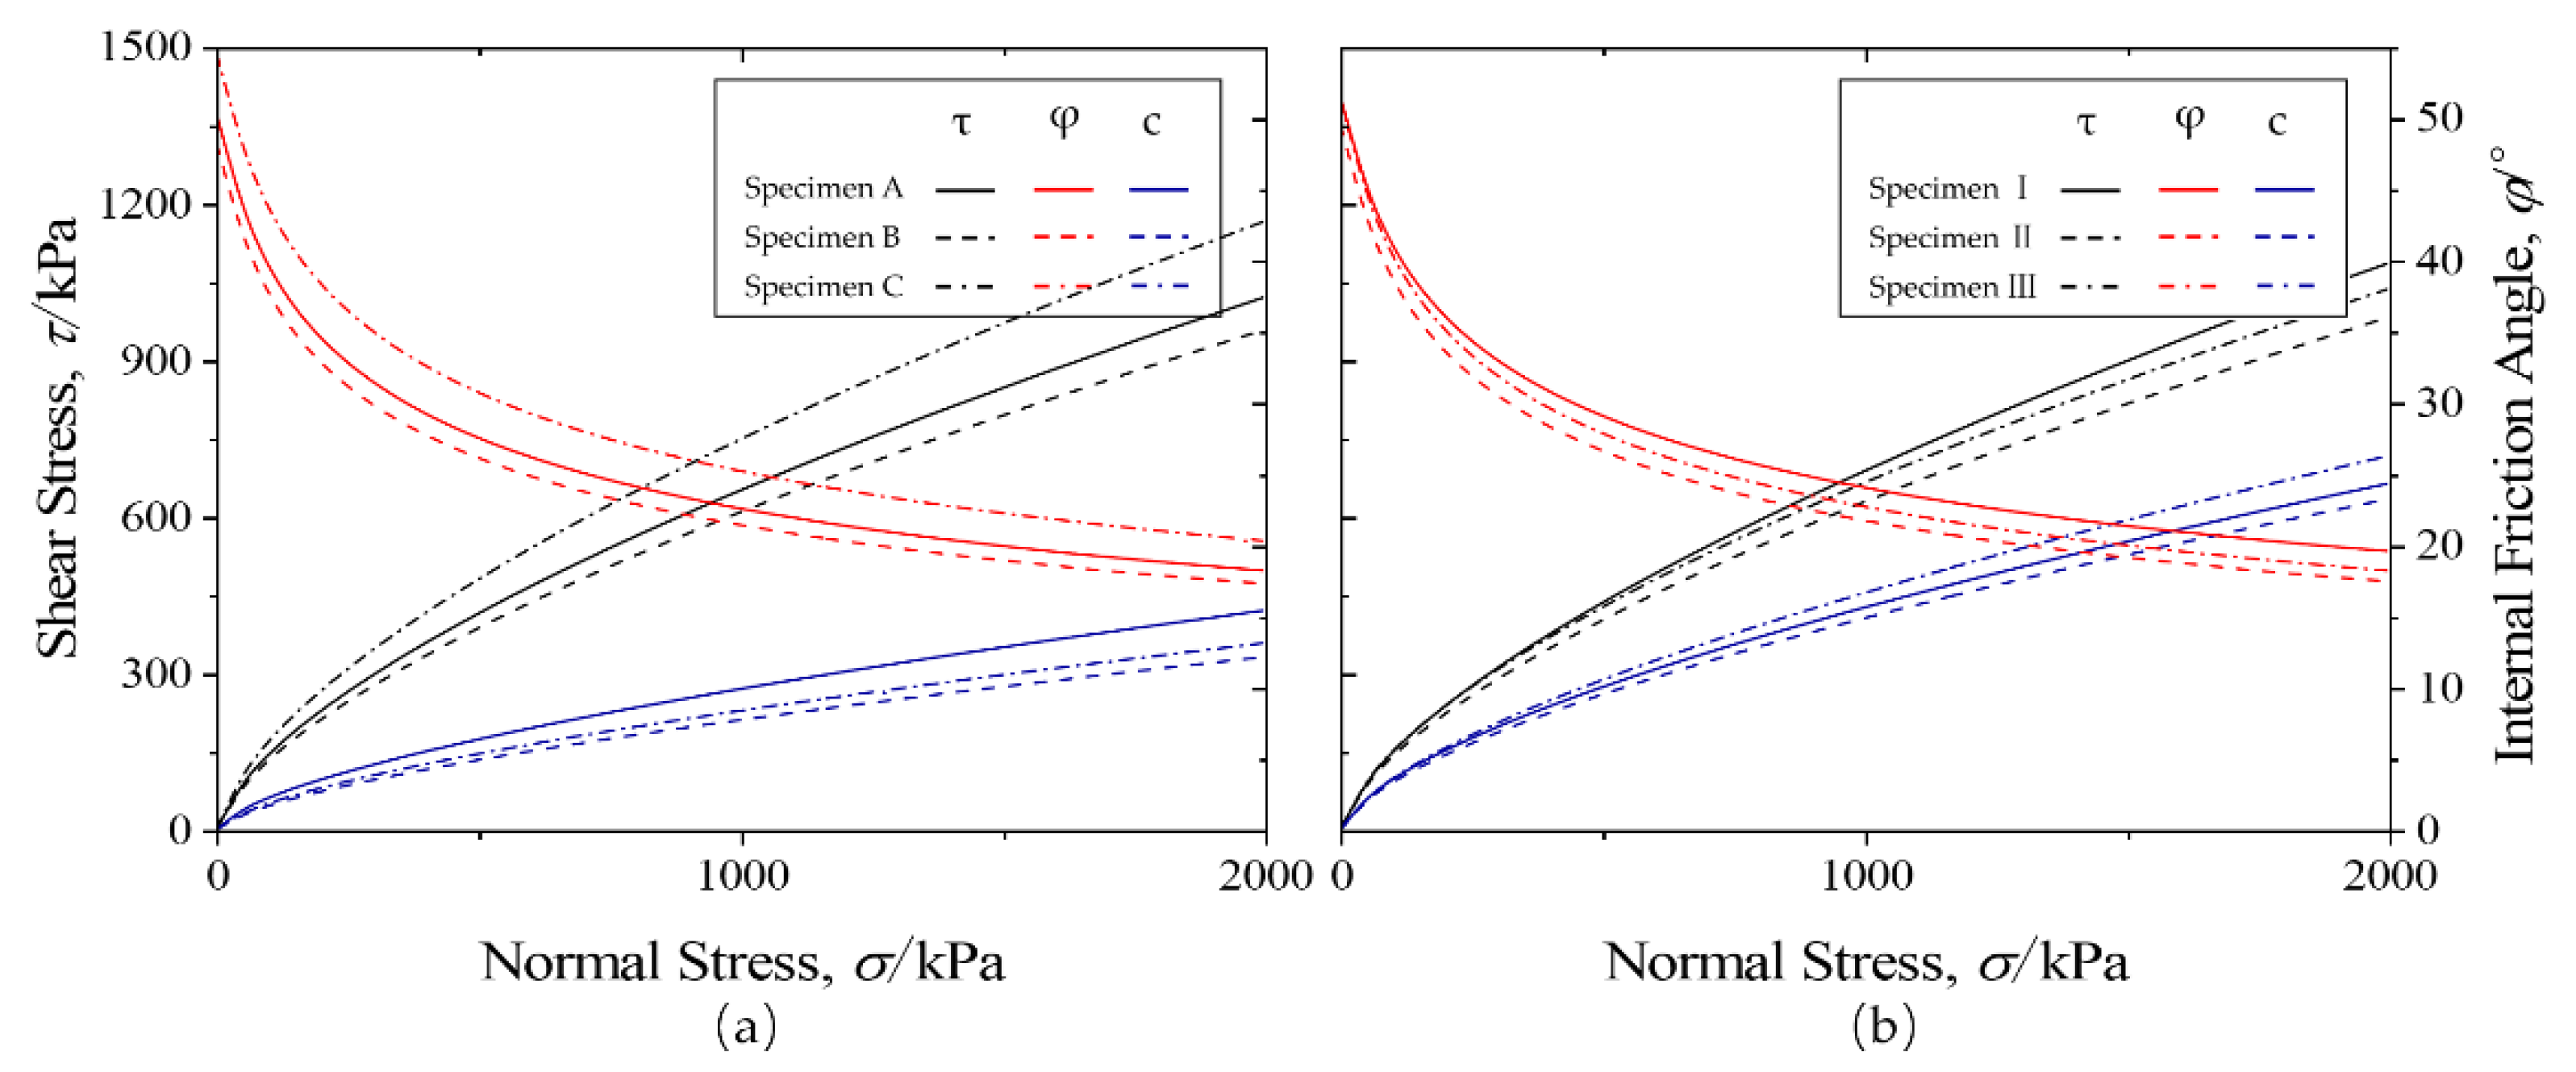
3.2. Shear Strength
- The surface friction coefficient, φμ;
- The additional work needed due to the deformation of the specimen, φv;
- The rearrangement and fragmentation of gravel particles, φb.
4. Deformation Property
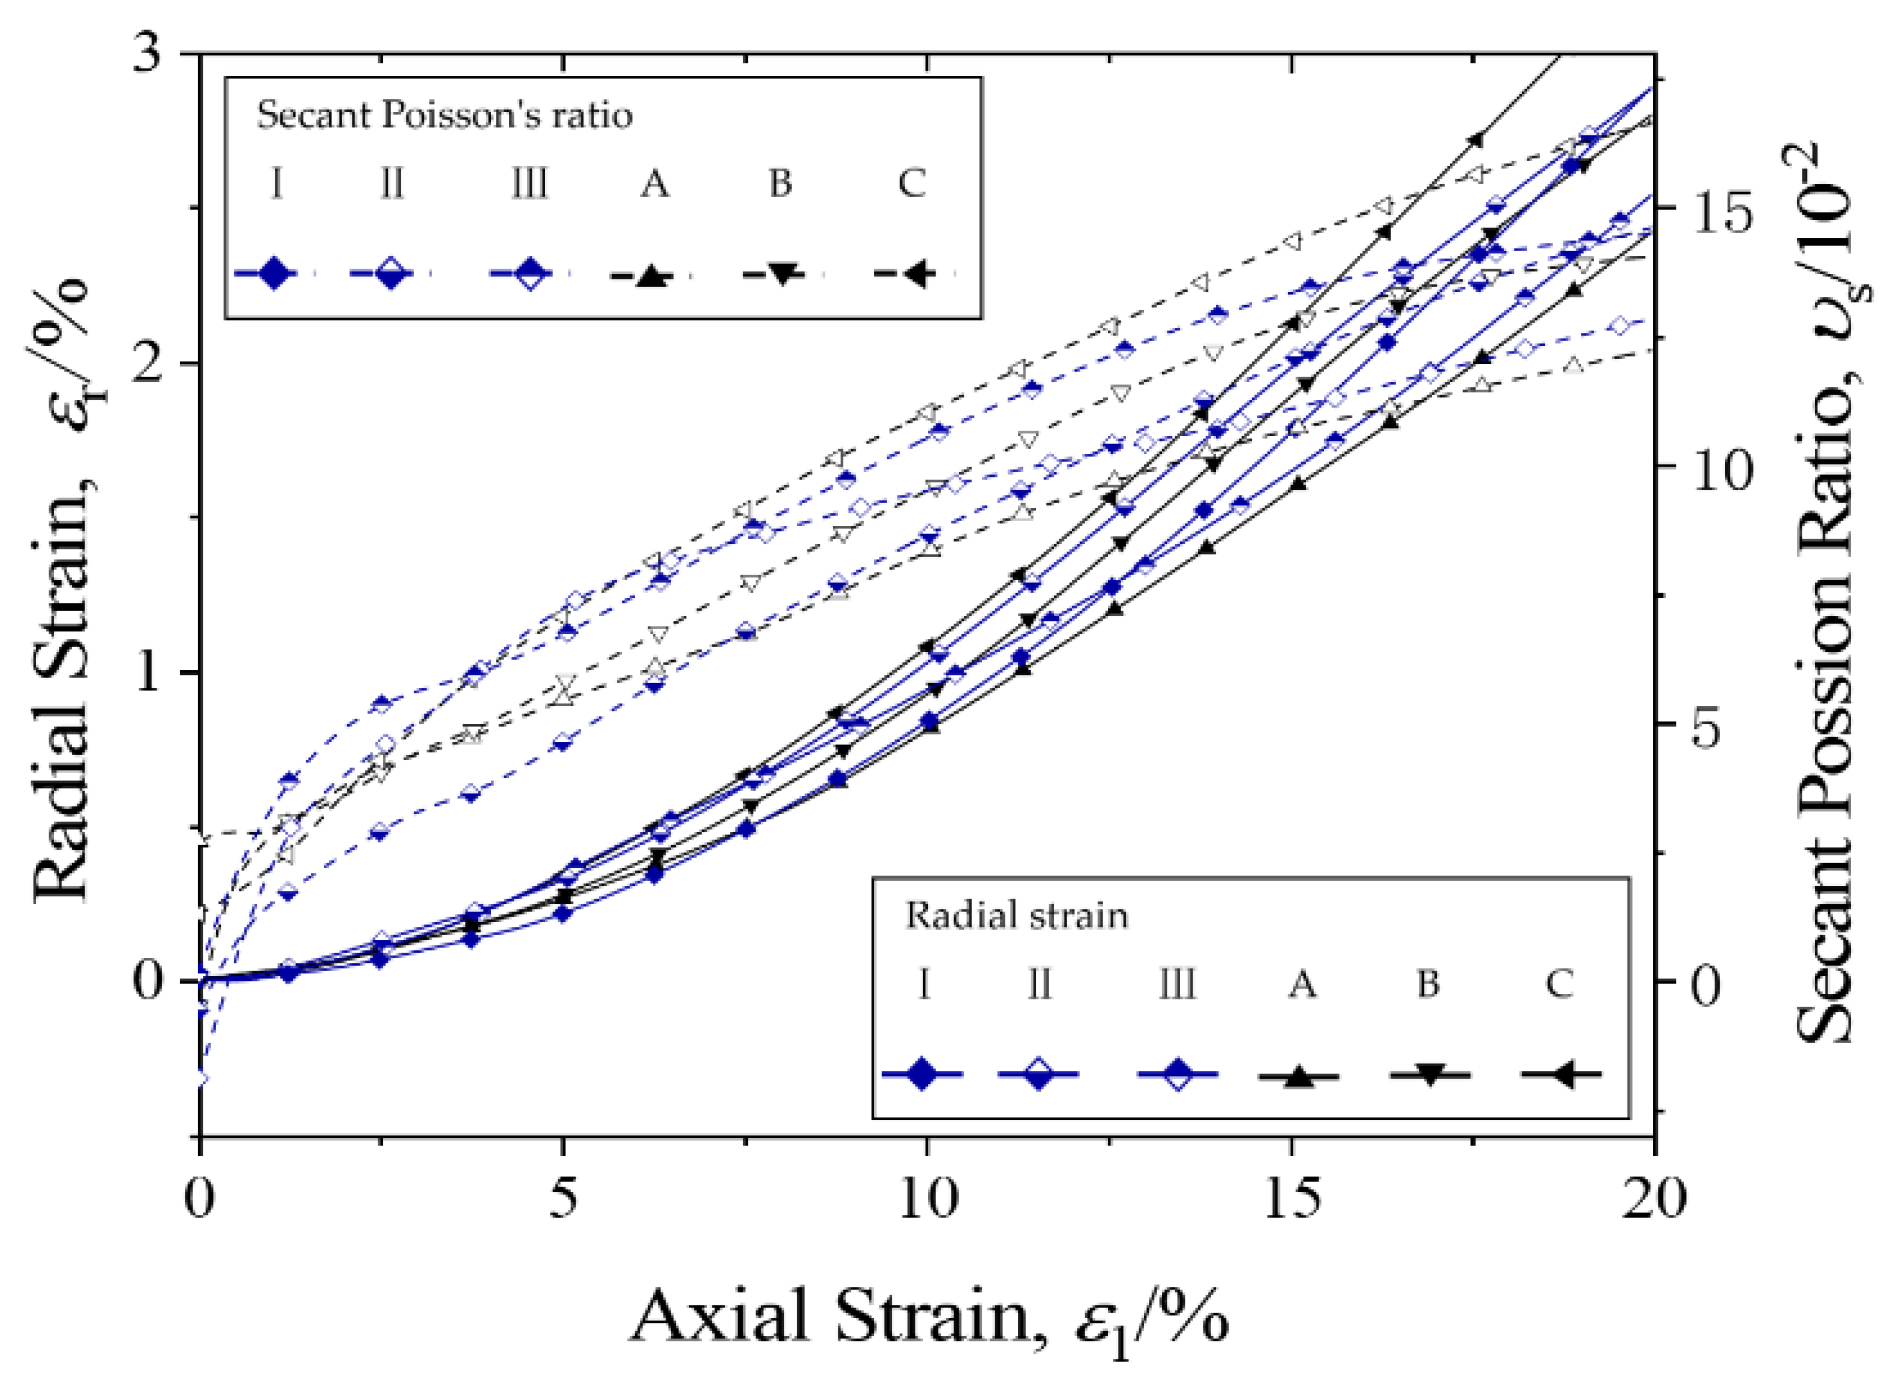
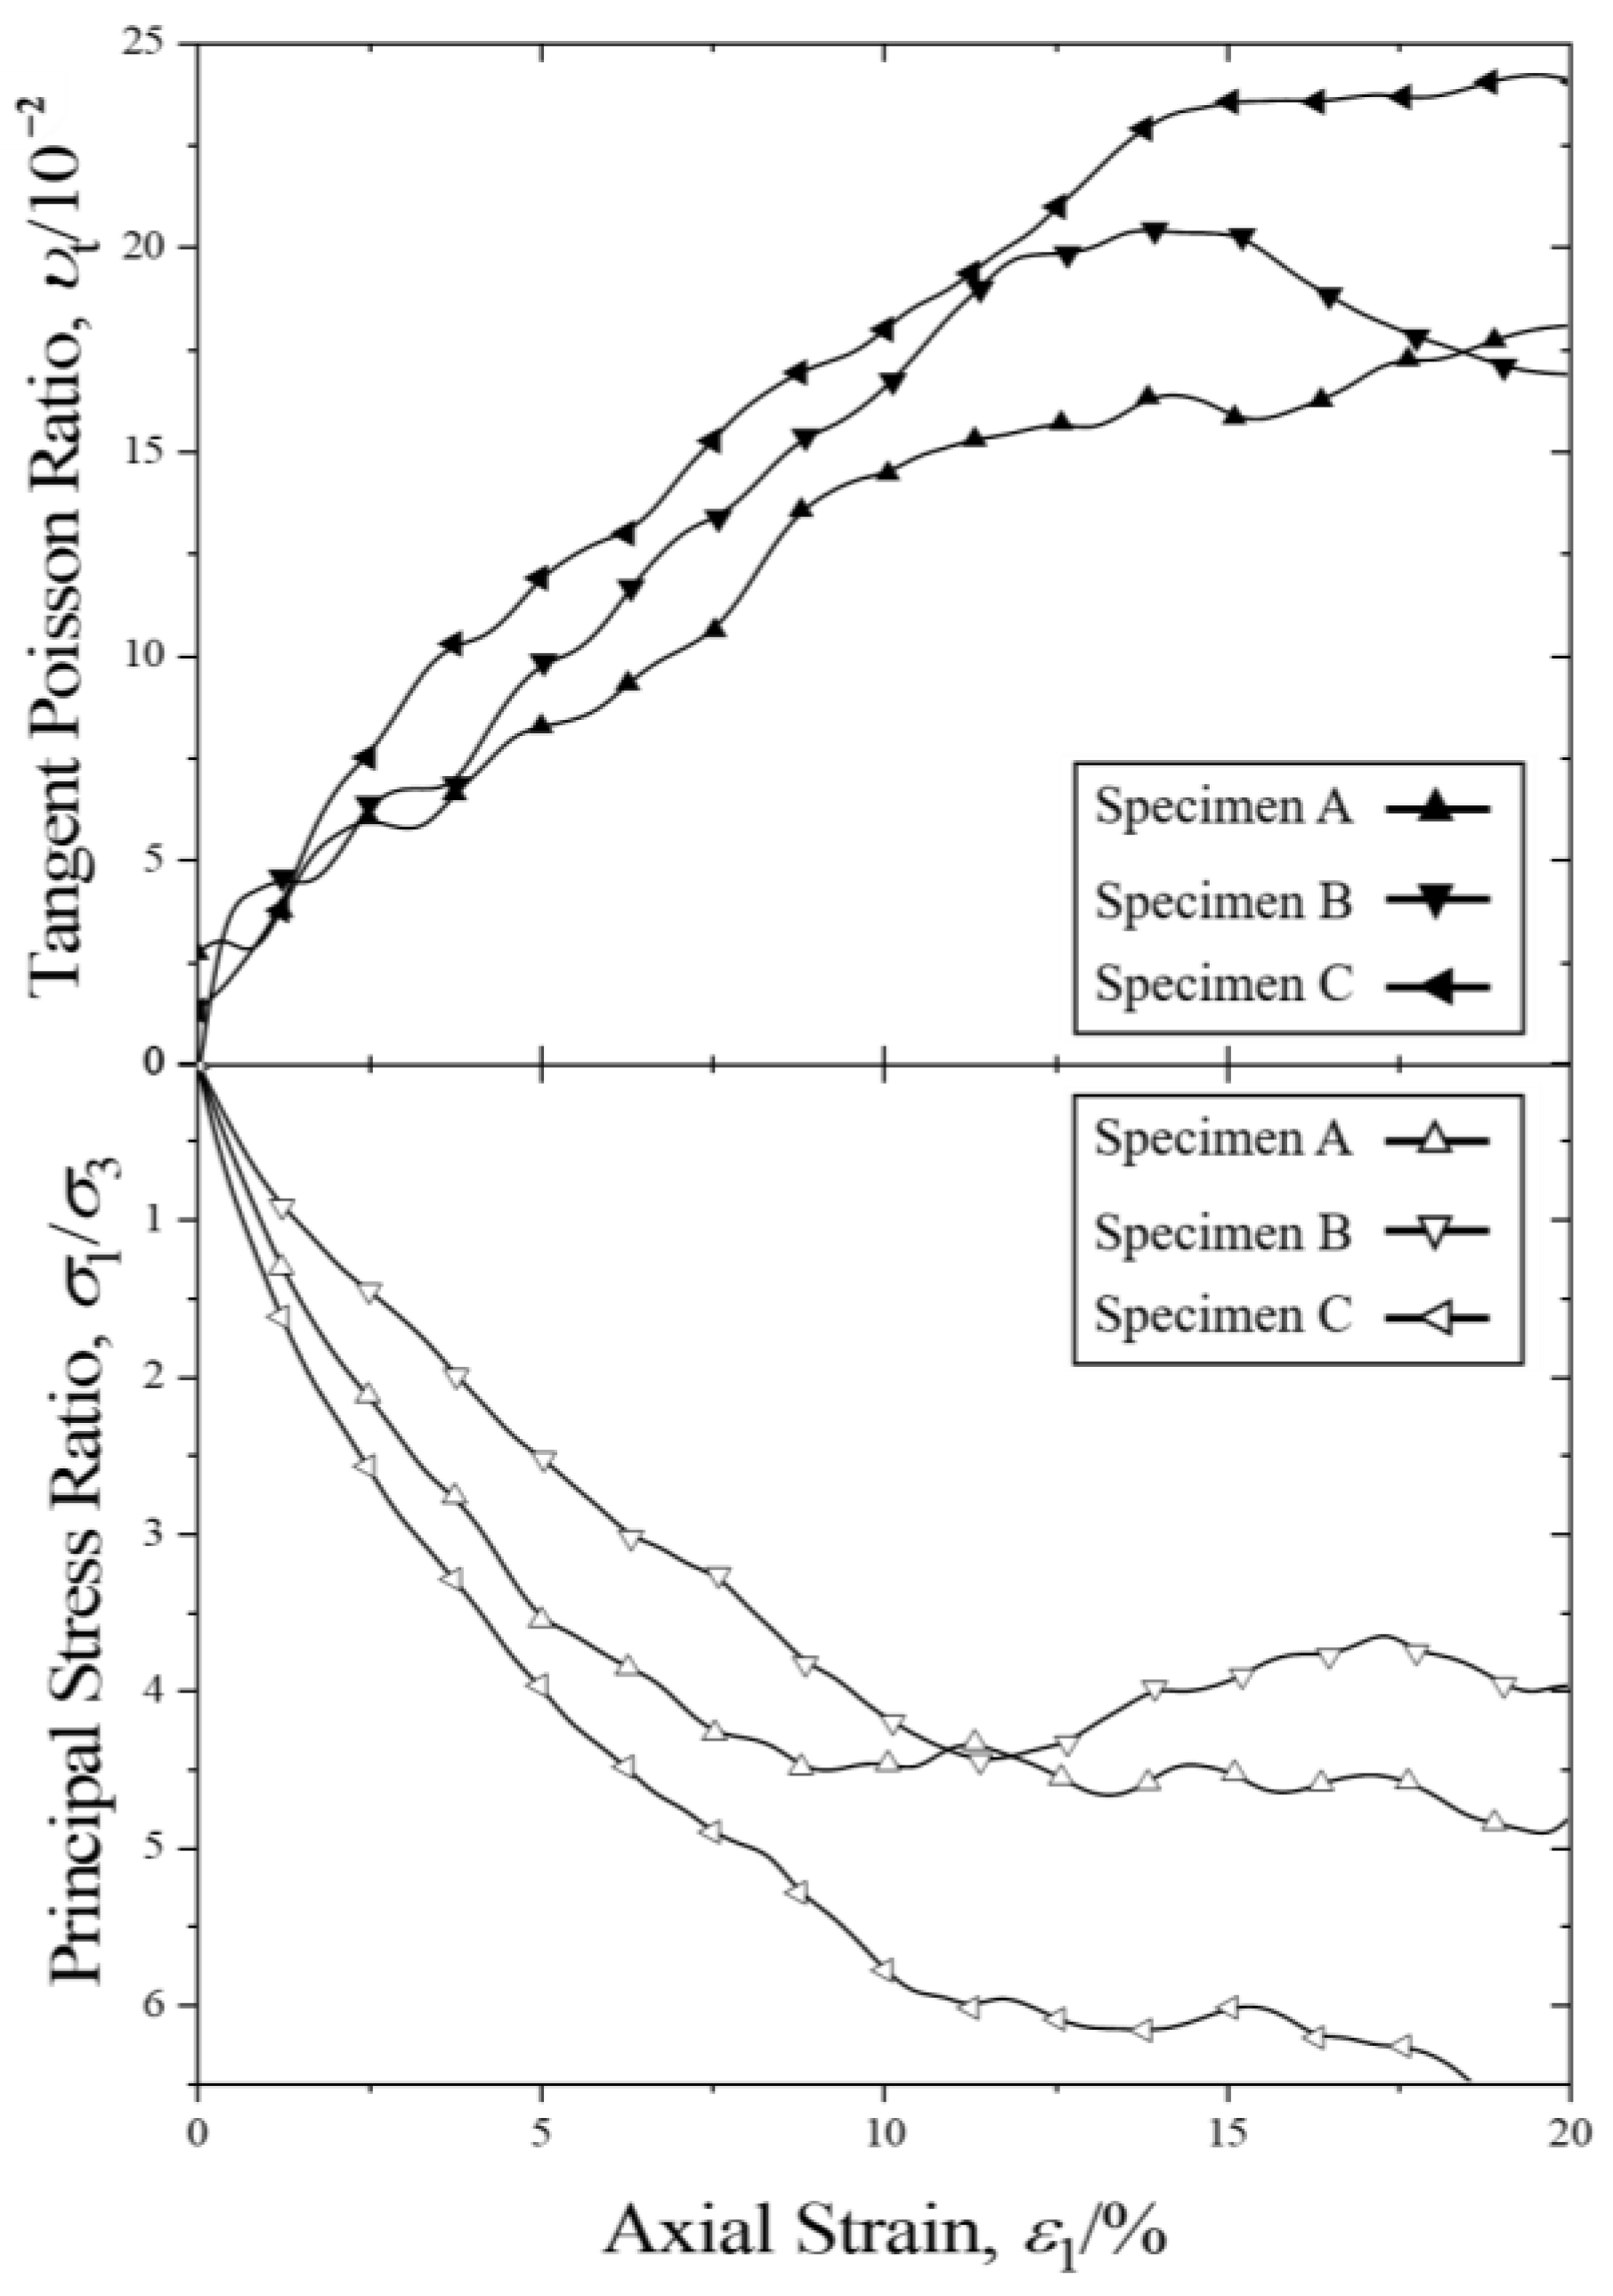
4.1. Poisson Ratio
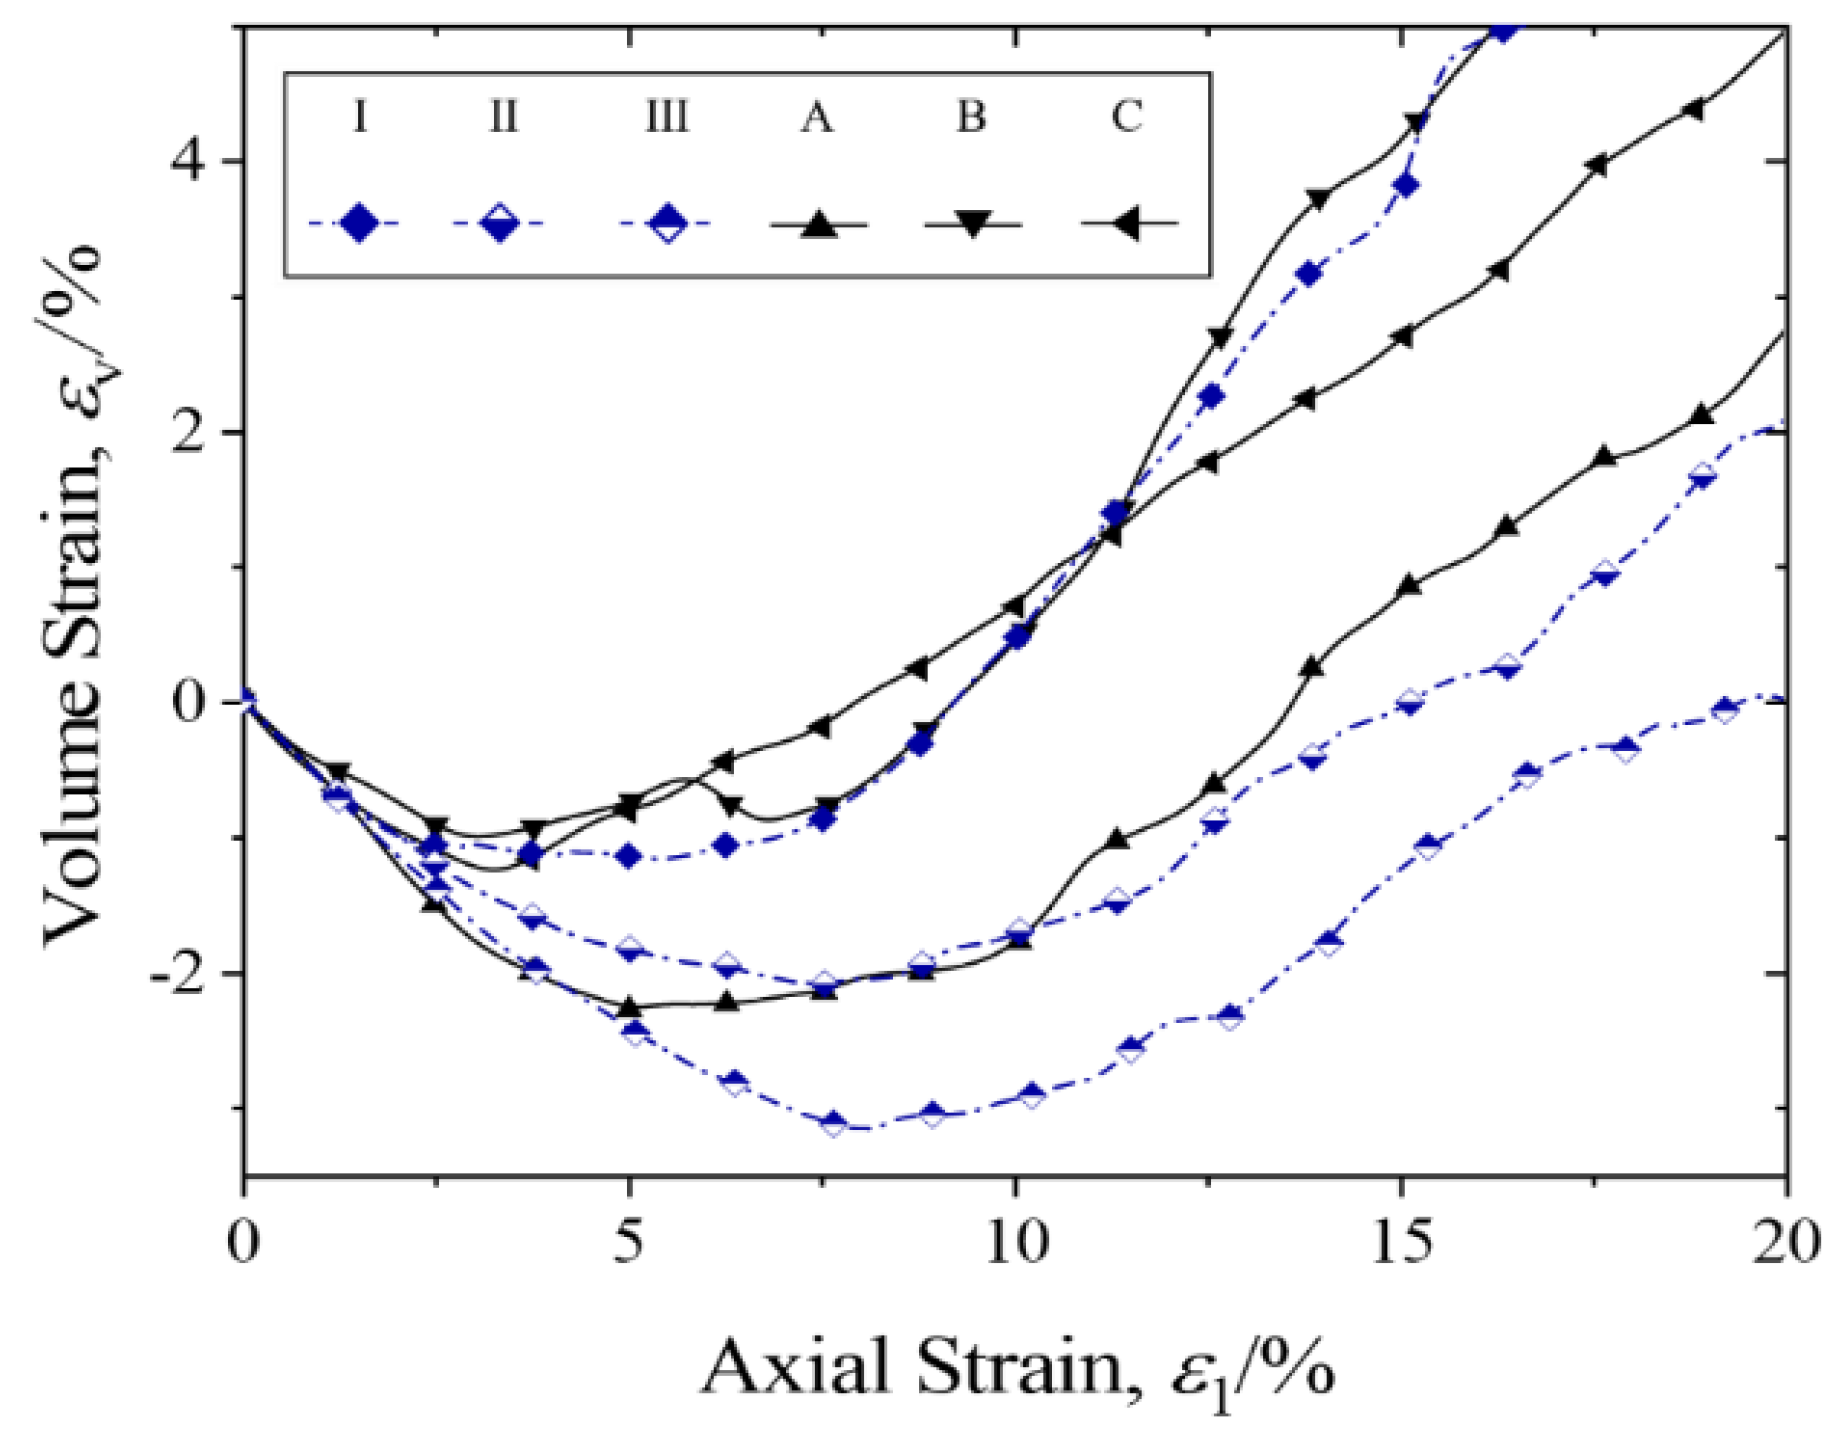
4.2. Volume Strain
5. Conclusions
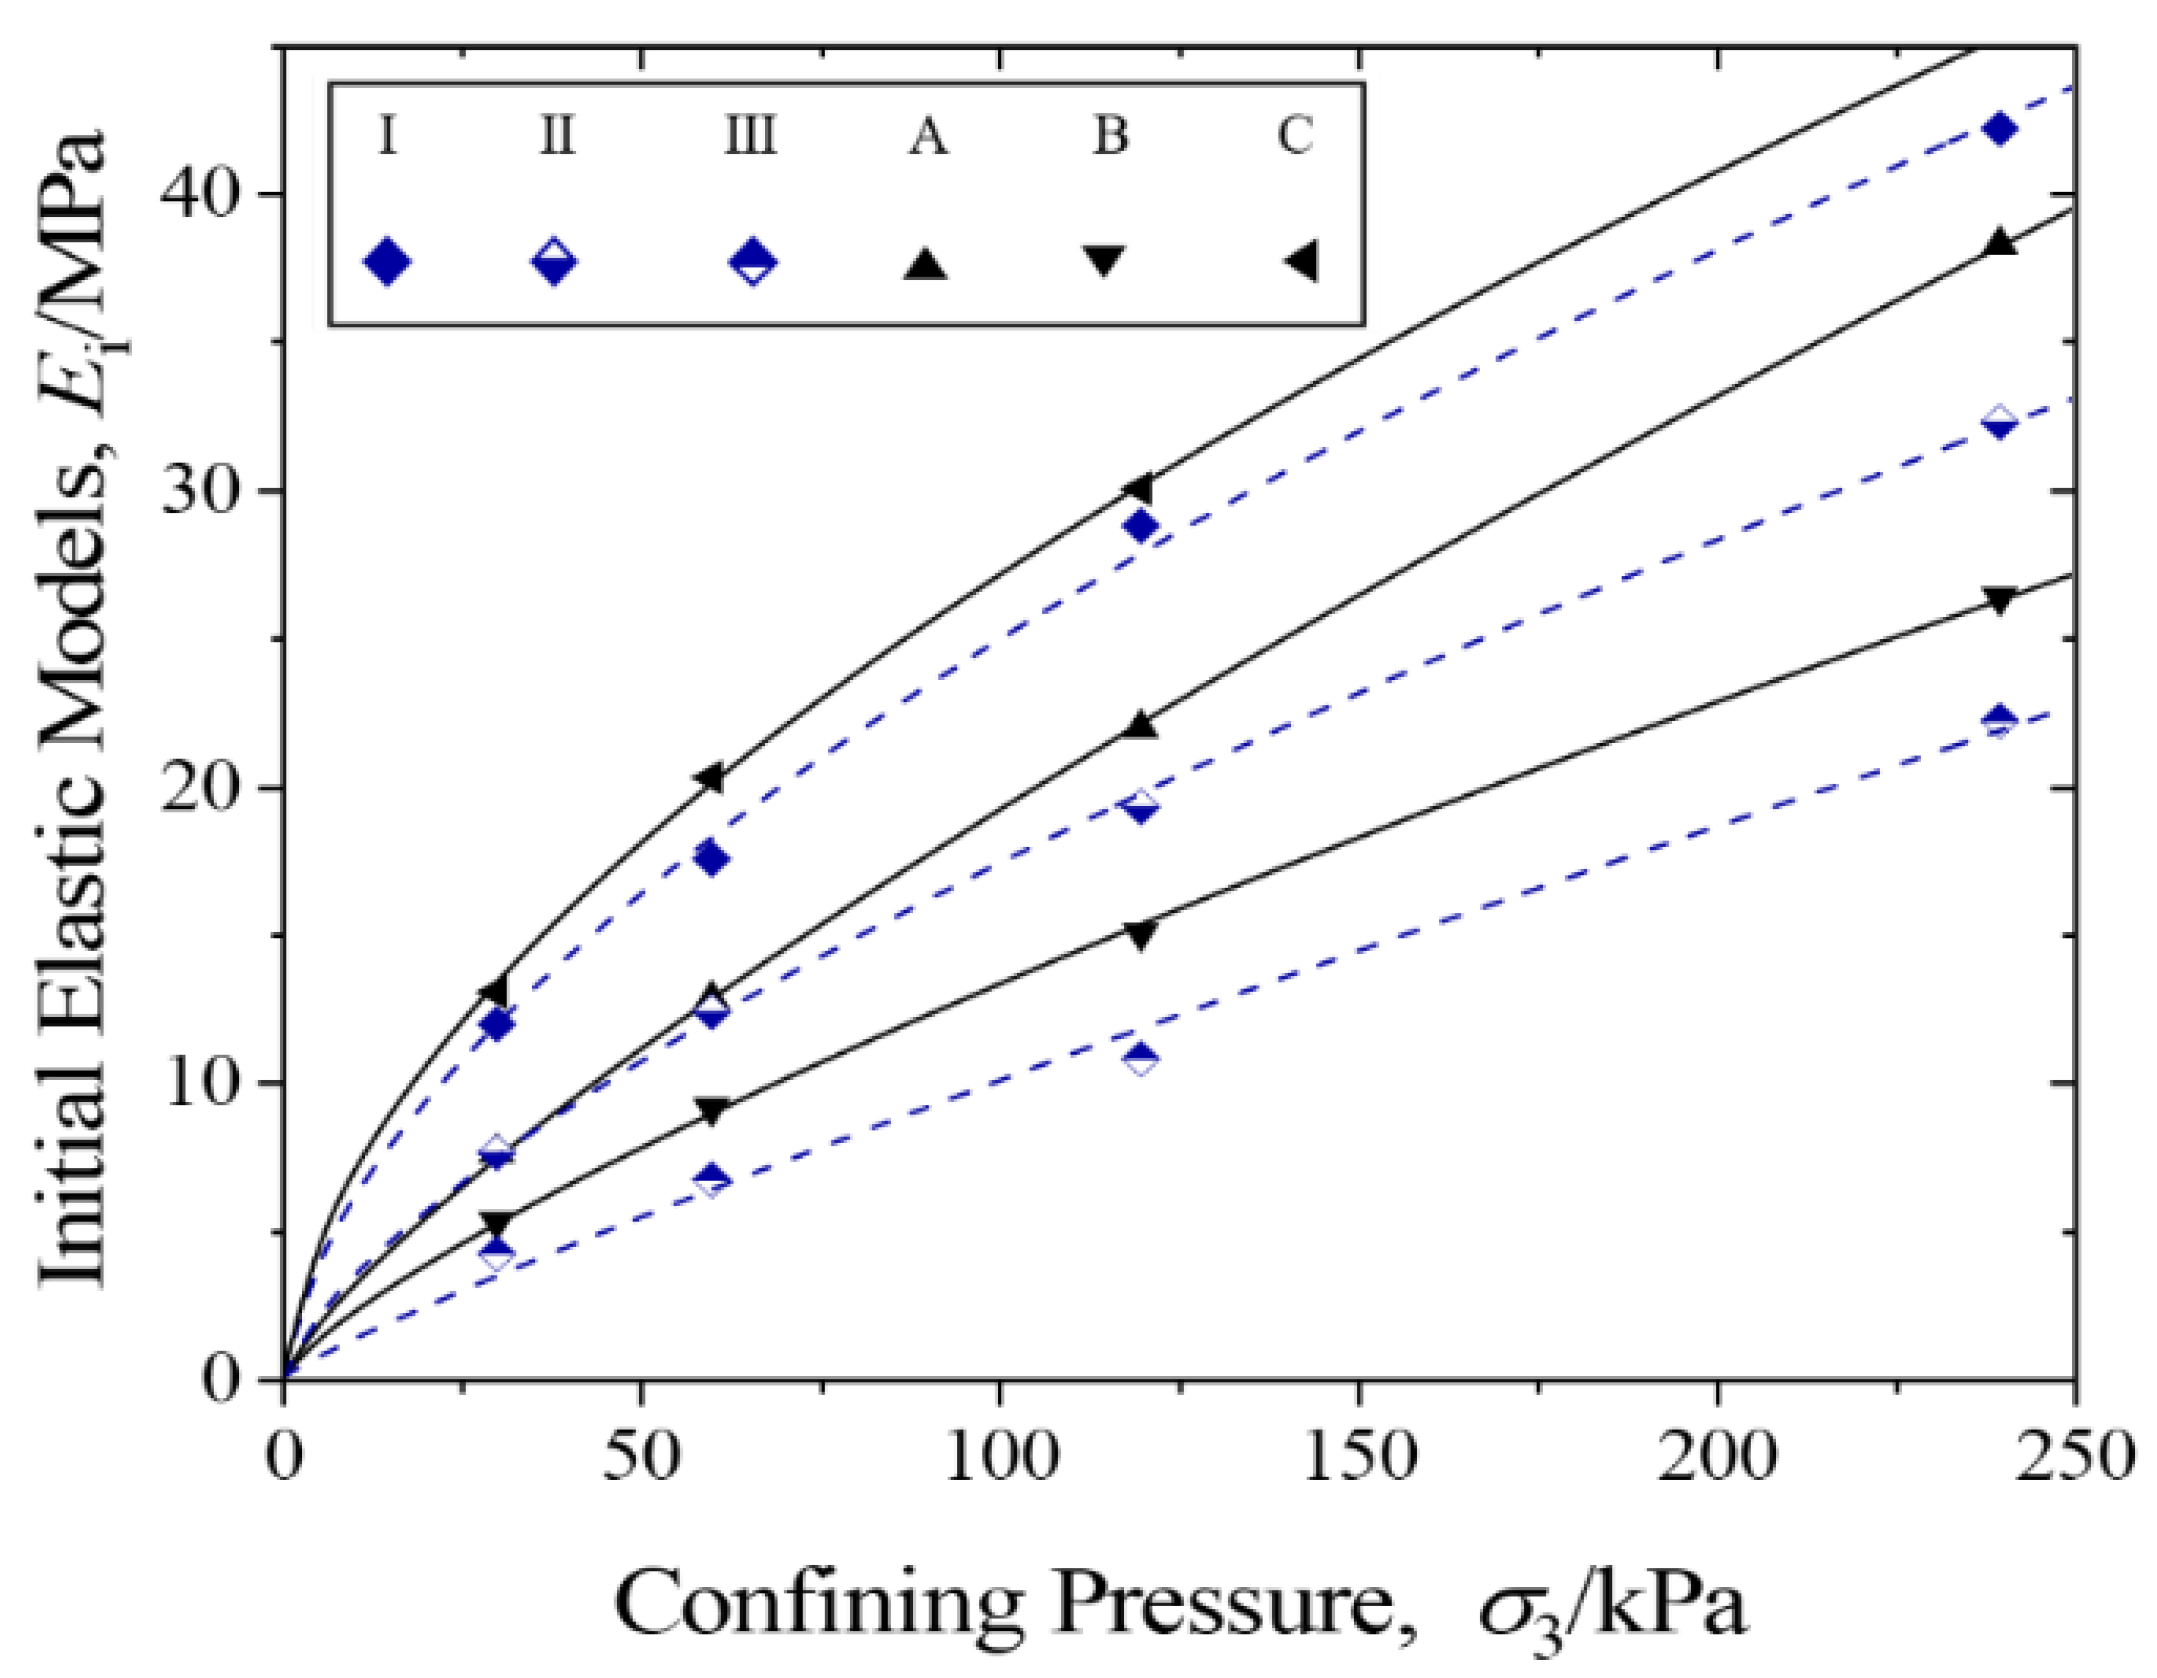
- The maximum deviatoric stress and the shear strength of the samples with higher angularities were significantly larger than those with medium and low angularities, while the final deviatoric stresses of samples with different gradations were nearly the same. Meanwhile, the initial elastic modulus increased when the curvature coefficient of the gradation curves became larger.
- The variation patterns of pseudo-cohesion and the internal friction angle with the perimeter pressure for either group of samples were in accordance with the power function relationship proposed in earlier studies. At the same time, these two mechanical indexes also changed with the transformation of grain shape and gradation. The internal friction angle and cohesion increased with the enhancement of angularities and the curvature coefficient.
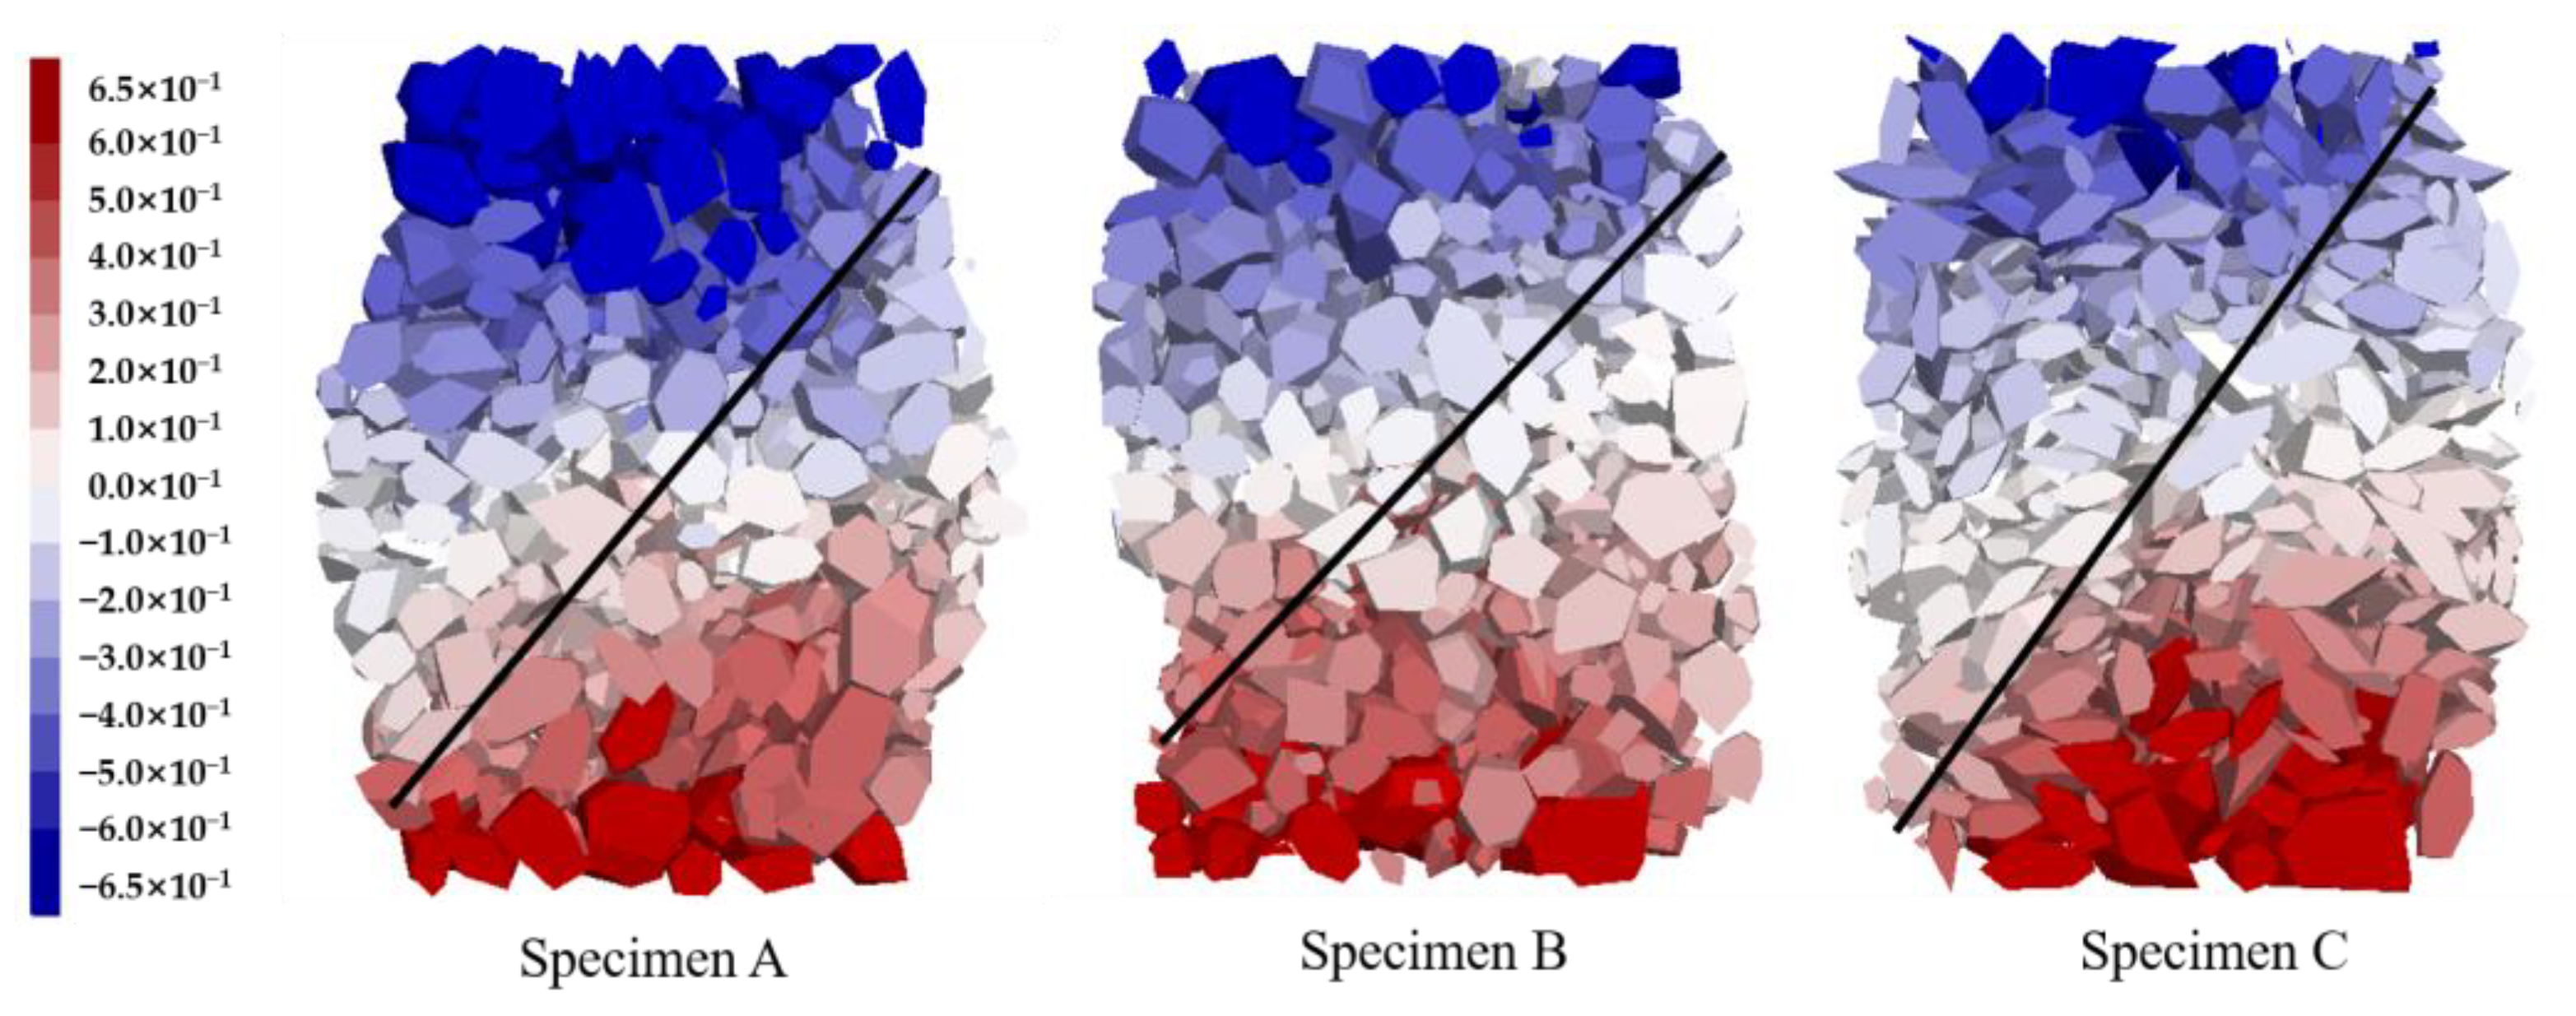
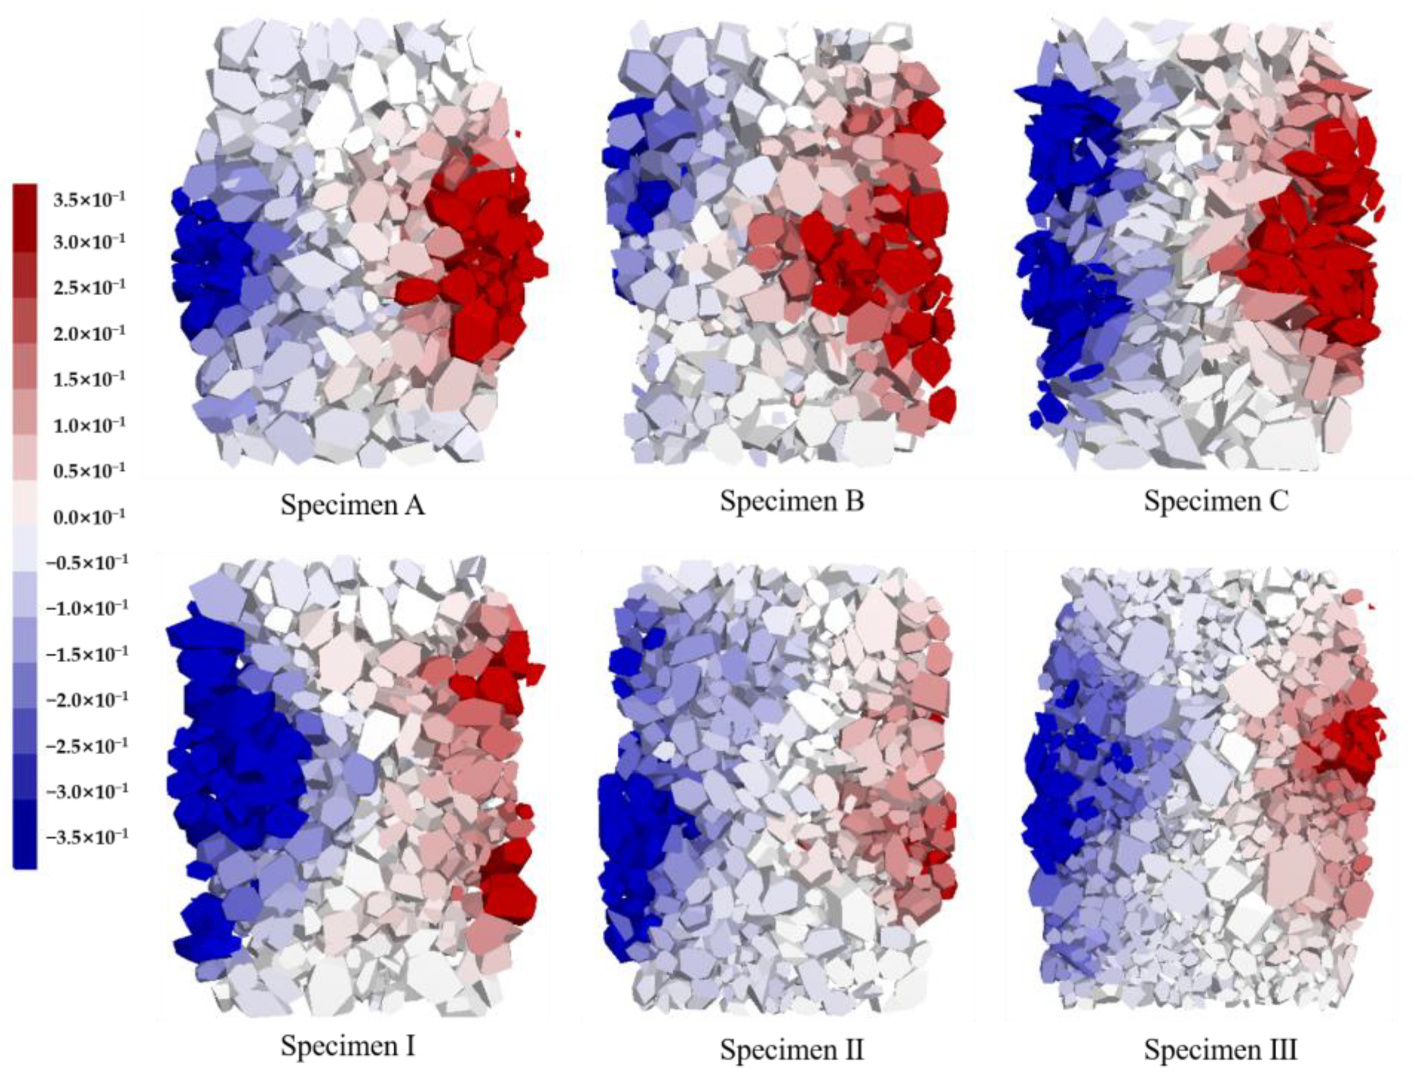
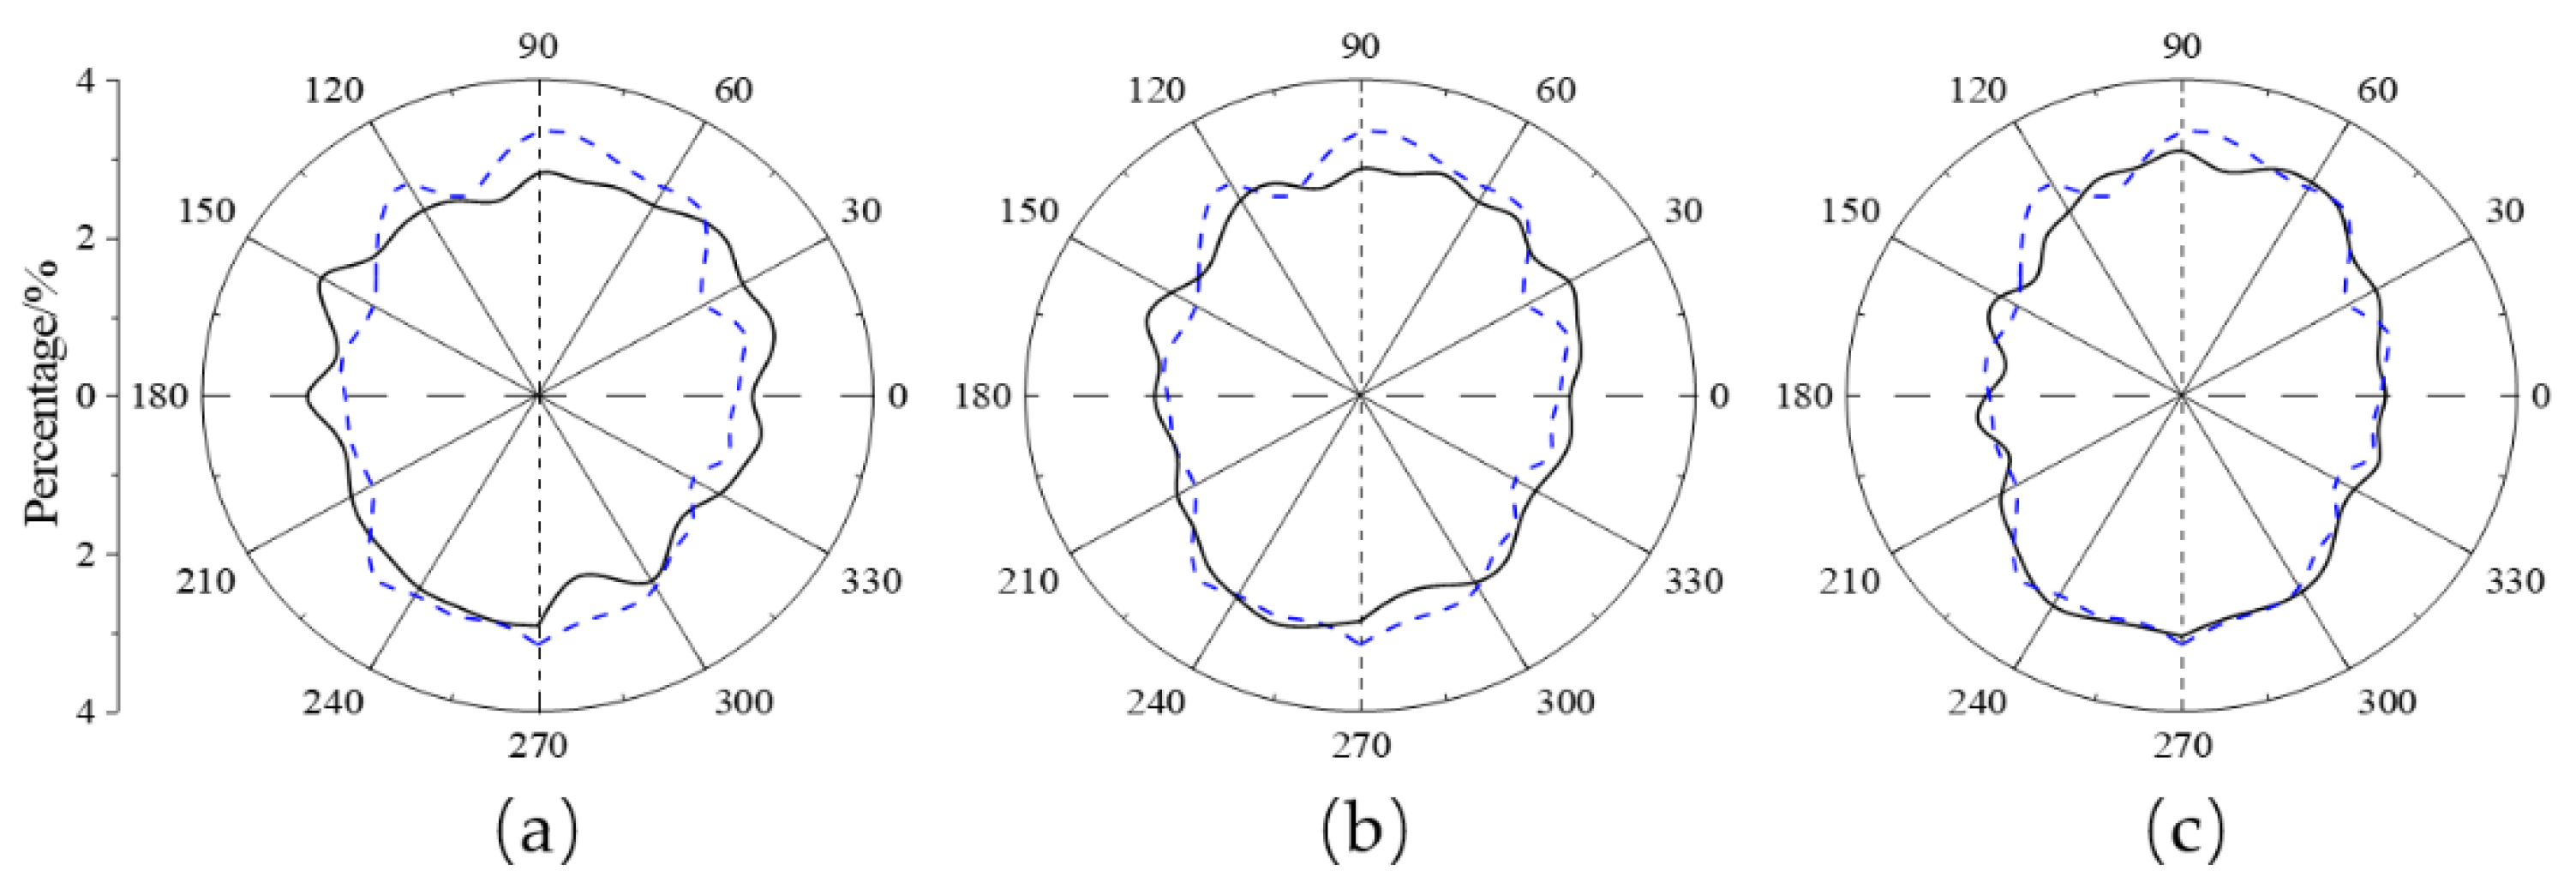
- Clearly, all samples here showed a deformation trend with the greatest displacement seen in the middle, and the damage surface a diagonal line running through the specimen. However, it is obvious that the lateral deformation and the maturity of the damage surface are different between different groups of samples. Furthermore, it can be found from the axial strain and volume strain curves of different samples that the ones with higher angularities and higher curvature coefficients possess a better deformation capacity.
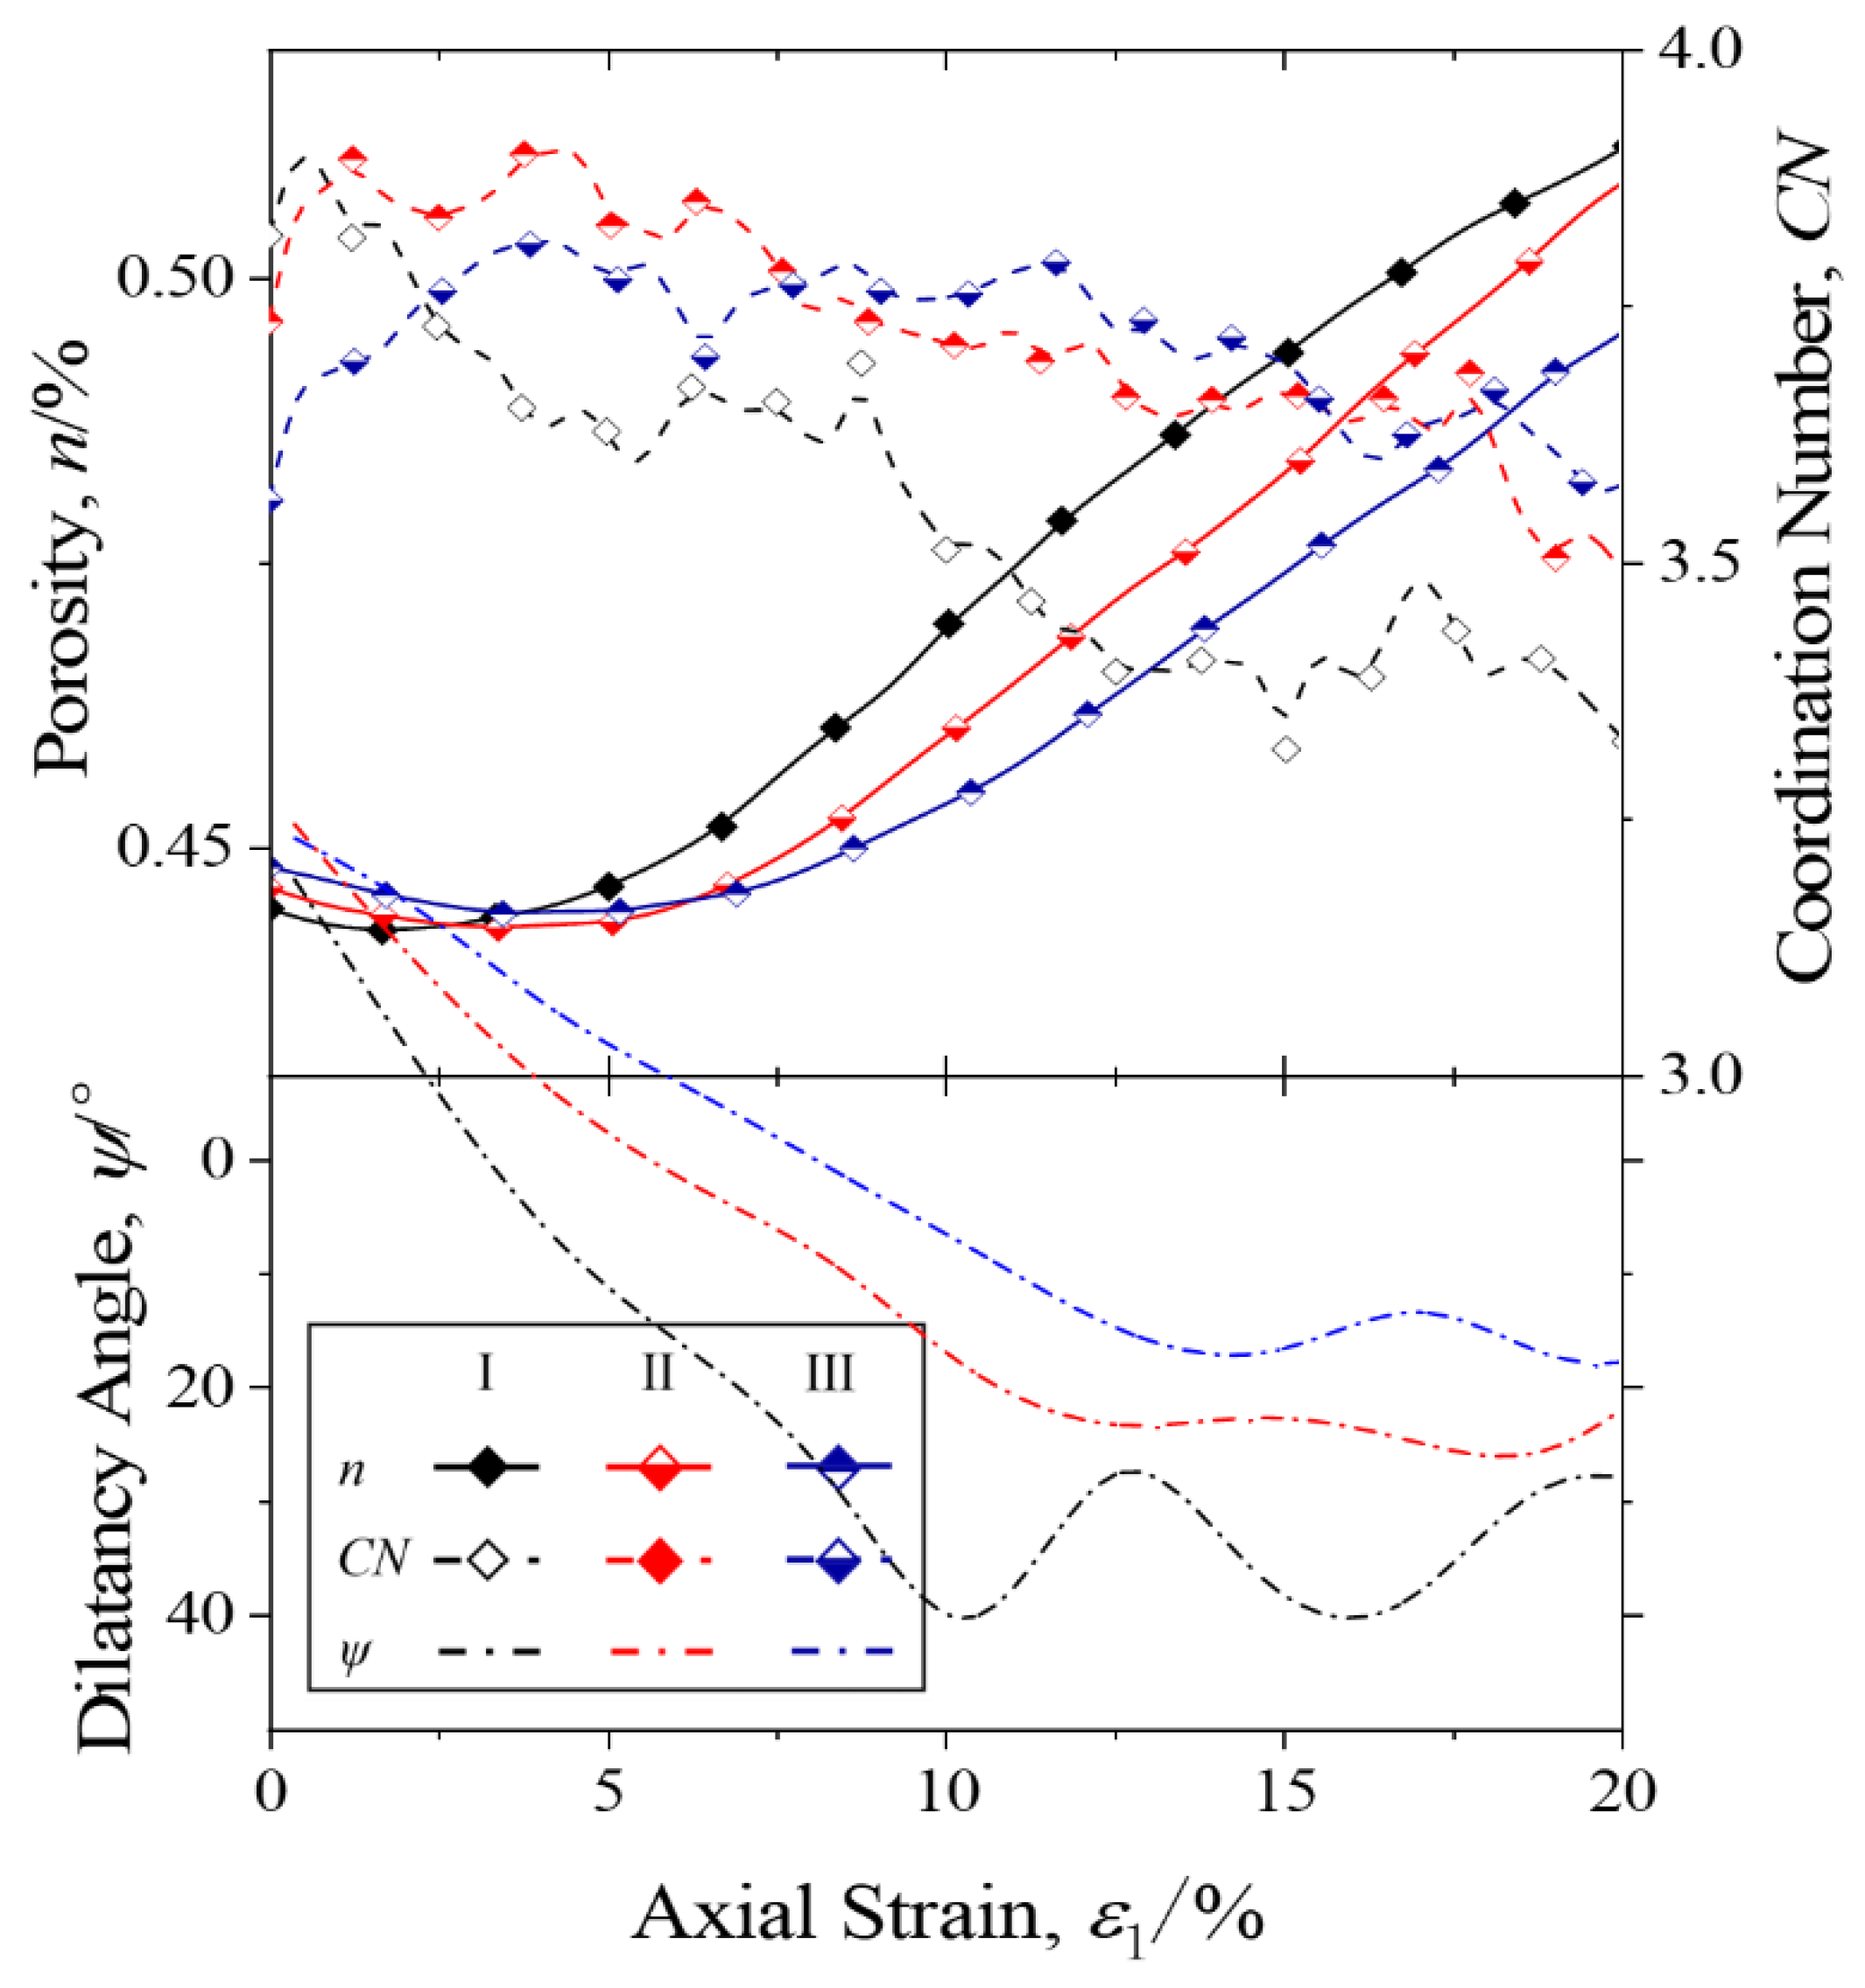
- The changes of porosity (n), coordination number (CN), and shear expansion angle (ψ) during the compression tests were compared. It was found that the coordination number is the most sensitive microscopic index, which usually reached the maximum value and started to decrease when the axial strain was about 2–3%. On the contrary, in the other two cases, the axial strain corresponding to the extreme value was often greatly delayed. Therefore, it can be conjectured that the contact force and the number of particles was the fundamental reason for the difference in the mechanical behavior of different samples. This is also proven by the fabric changes of the samples.
Author Contributions
Funding
Data Availability Statement
Conflicts of Interest
References
- Bribián, I.Z.; Usón, A.A.; Scarpellini, S. Life cycle assessment in buildings: State-of-the-art and simplified LCA methodology as a complement for building certification. Build. Environ. 2009, 44, 2510–2520. [Google Scholar] [CrossRef]
- Shaban, W.M.; Elbaz, K.; Amin, M.; Ashour, A. A new systematic firefly algorithm for forecasting the durability of reinforced recycled aggregate concrete. Front. Struct. Civ. Eng. 2022, 16, 329–346. [Google Scholar] [CrossRef]
- Amin, M.; Hakeem, I.Y.; Zeyad, A.M. Influence of recycled aggregates and carbon nanofibres on properties of ultra-high-performance concrete under elevated temperatures. Case Stud. Constr. Mater. 2022, 16, e01063. [Google Scholar] [CrossRef]
- Younis, M.; Amin, M.; Tahwia, A.M. Durability and mechanical characteristics of sustainable self-curing concrete utilizing crushed ceramic and brick wastes. Case Stud. Constr. Mater. 2022, 17, e01251. [Google Scholar] [CrossRef]
- Hakeem, I.Y.; Alharthai, M.; Amin, M.; Zeyad, A.M.; Tayeh, B.A.; Agwa, I.S. Properties of sustainable high-strength concrete containing large quantities of industrial wastes, nanosilica and recycled aggregates. J. Mater. Res. Technol. 2023, 24, 7444–7461. [Google Scholar] [CrossRef]
- Srikanth, K.S.; Lalitha, G. Mechanical performance of sustainable ternary blended self compacting concrete with waste crushed glass. Mater. Today Proc. 2022, 60, 394–398. [Google Scholar] [CrossRef]
- Başaran, B.; Aksoylu, C.; Özkılıç, Y.O.; Karalar, M.; Hakamy, A. Shear behaviour of reinforced concrete beams utilizing waste marble powder. Structures 2023, 54, 1090–1100. [Google Scholar] [CrossRef]
- Lan, W.W.; Zhong, R.F.; Lv, B.; Gan, J.Y.; Ying, J.W. Compressive strength of artificial sand recycled concrete with different content of stone powder. Appl. Mech. Mater. 2014, 578–579, 464–468. [Google Scholar] [CrossRef]
- Lee, M.G.; Lo, S.L.; Kan, Y.C.; Chiang, C.H.; Chang, J.H.; Yu-Min, S.; Yatsenko, E.A.; Hu, S.-H. Water quenched slag from incinerator ash used as artificial stone. Case Stud. Constr. Mater. 2022, 16, e00827. [Google Scholar] [CrossRef]
- Dongyu, C.; Meizhu, C.; Yuanhang, S.; Shaopeng, W.; Xintao, Z.; Chen, W. Sustainable use of recycled cement concrete with gradation carbonation in artificial stone: Preparation and characterization. Constr. Build. Mater. 2023, 364, 129867. [Google Scholar] [CrossRef]
- Ting, J.M.; Meachum, L.; Rowell, J.D. Effect of particle shape on the strength and deformation mechanisms of ellipse-shaped granular assemblages. Eng. Comput. 1995, 12, 99–108. [Google Scholar] [CrossRef]
- Alshibli, K.A.; Cil, M.B. Influence of particle morphology on the friction and dilatancy of sand. J. Geotech. Geoenvironmental Eng. 2018, 144, 04017118. [Google Scholar] [CrossRef]
- Lim, M.S.; Wijeyesekera, D.C.; Zainorabidin, A.; Bakar, I. The effects of particle morphology (shape and sizes) characteristics on its engineering behaviour and sustainable engineering performance of sand. Int. J. Integr. Eng. 2012, 4, 27–37. [Google Scholar]
- Abbireddy, C.O.R.; Clayton, C.R.I. The impact of particle form on the packing and shear behaviour of some granular materials: An experimental study. Granul. Matter 2015, 17, 427–438. [Google Scholar] [CrossRef]
- Wadell, H.A. Volume, shape and roundness of rock particles. J. Geol. 1932, 40, 443–451. [Google Scholar] [CrossRef]
- Rittenhouse, G.; Thorp, E.M. Heavy minerals in sediment-transportation studies. Eos Trans. Am. Geophys. Union 1943, 24, 524. [Google Scholar] [CrossRef]
- Powers, M.C. A new roundness scale for sedimentary particles. J. Sedimentray Res. 1953, 23, 117–119. [Google Scholar]
- Krumbein, W.C.; Sloss, L.L. Stratigraphy and Sedimentation; W. H. Freeman: New York, NY, USA, 1955. [Google Scholar]
- Swanson, P.A.; Vetter, A.F. The Measurement of Abrasive Particle Shape and Its Effect on Wear. ASLE Trans. 1985, 28, 225–230. [Google Scholar] [CrossRef]
- Zheng, J.; Hryciw, R.D. Traditional soil particle sphericity, roundness and surface roughness by computational geometry. Géotechnique 2015, 65, 494–506. [Google Scholar] [CrossRef]
- Mitchell, J.K. Fundamentals of soil behavior. Soil Sci. Soc. Am. J. 1976, 40, 827–866. [Google Scholar]
- Frankel, K.L.; Dolan, J.F. Characterizing arid region alluvial fan surface roughness with airborne laser swath mapping digital topographic data. J. Geophys. Res. Earth Surf. 2007, 112, F02025. [Google Scholar] [CrossRef]
- Ouhbi, N.; Voivret, C.; Perrin, G.; Roux, J.N. 3D particle shape modelling and optimization through proper orthogonal decomposition. Granul. Matter 2017, 19, 86. [Google Scholar] [CrossRef]
- Coop, M.R.; Altuhafi, F.N. Changes to particle characteristics associated with the compression of sands. Géotechnique 2011, 61, 459–471. [Google Scholar]
- Li, Y. Effects of particle shape and size distribution on the shear strength behavior of composite soils. Bull. Eng. Geol. Environ. 2013, 72, 371–381. [Google Scholar] [CrossRef]
- Cresswell, A.; Powrie, W. Triaxial tests on an unbonded locked sand. Géotechnique 2004, 54, 107–115. [Google Scholar] [CrossRef]
- Mair, K.; Frye, K.M.; Marone, C. Influence of grain characteristics on the friction of granular shear zones. J. Geophys. Res. 2002, 107, ECV 4-1–ECV 4-9. [Google Scholar] [CrossRef]
- Feng, Z.K.; Xu, W.J.; Lubbe, R. Three-dimensional morphological characteristics of particles in nature and its application for DEM simulation. Powder Technol. 2020, 364, 635–646. [Google Scholar] [CrossRef]
- Xin, T.; Zhengbo, H.; Changfu, C.; Minghua, Z. 3D DEM-FDM Coupled Analysis of the Behavior of an Isolated Geogrid-Encased Stone Column under Axial Loading. J. Geotech. Geoenvironmental Eng. 2021, 147, 04021028. [Google Scholar]
- Xin, T.; Zhengbo, H.; Ming, C.; Changfu, C. 3D discrete element simulation of a geotextile-encased stone column under uniaxial compression testing. Comput. Geotech. 2020, 126, 103769. [Google Scholar]
- Xin, T.; Zhengbo, H.; Longjian, F.; Minghua, Z. Three-dimensional discrete-continuous coupled numerical simulation of a single stone column in soft soils. Chin. J. Geotech. Eng. 2021, 43, 347–355. [Google Scholar]
- Xin, T.; Zhengbo, H.; Weng, L.; Suhua, Z.; Tenglong, L. Micromechanical Numerical Modelling on Compressive Failure of Recycled Concrete using Discrete Element Method (DEM). Materials 2020, 13, 4329. [Google Scholar] [CrossRef]
- Stahl, M.; Konietzky, H. Discrete element simulation of ballast and gravel under special consideration of grain-shape, grain-size and relative density. Granul. Matter 2010, 13, 417–428. [Google Scholar] [CrossRef]
- Meixiang, G.; Jie, H.; Minghua, Z.H. Three-dimensional DEM analysis of single geogrid-encased stone columns under unconfined compression: A parametric study. Acta Geotech. 2017, 12, 559–572. [Google Scholar]
- Indraratna, B.; Ngo, N.T.; Rujikiatkamjorn, C.; Sloan, S.W. Coupled discrete element–finite difference method for analysing the load-deformation behaviour of a single stone column in soft soil. Comput. Geotech. 2015, 63, 267–278. [Google Scholar] [CrossRef]
- Mengmeng, W.; Zhangqi, X.; Jianfeng, W. Constitutive modelling of idealised granular materials using machine learning method. J. Rock Mech. Geotech. Eng. 2023, 15, 1038–1051. [Google Scholar]
- Ma, Q.; Shu, H.; Xiao, H.; Liu, Y. Analysis of direct shear test of incineration slag reinforced with waste tire strips by discrete element method. Constr. Build. Mater. 2023, 398, 132534. [Google Scholar] [CrossRef]
- Li, M.; Zuo, J.; Hu, D.; Shao, J.; Liu, D. Experimental and numerical investigation of microstructure effect on the mechanical behavior and failure process of brittle rocks. Comput. Geotech. 2020, 125, 103639. [Google Scholar] [CrossRef]
- Wu, K.; Sun, W.; Liu, S.; Zhang, X. Study of shear behavior of granular materials by 3D DEM simulation of the triaxial test in the membrane boundary condition. Adv. Powder Technol. 2021, 32, 1145–1156. [Google Scholar] [CrossRef]
- Indraratna, B.; Ionescu, D.; Christie, H.D. Shear Behavior of Railway Ballast Based on Large-Scale Triaxial Tests. J. Geotech. Geoenvironmental Eng. 1998, 124, 439–449. [Google Scholar] [CrossRef]


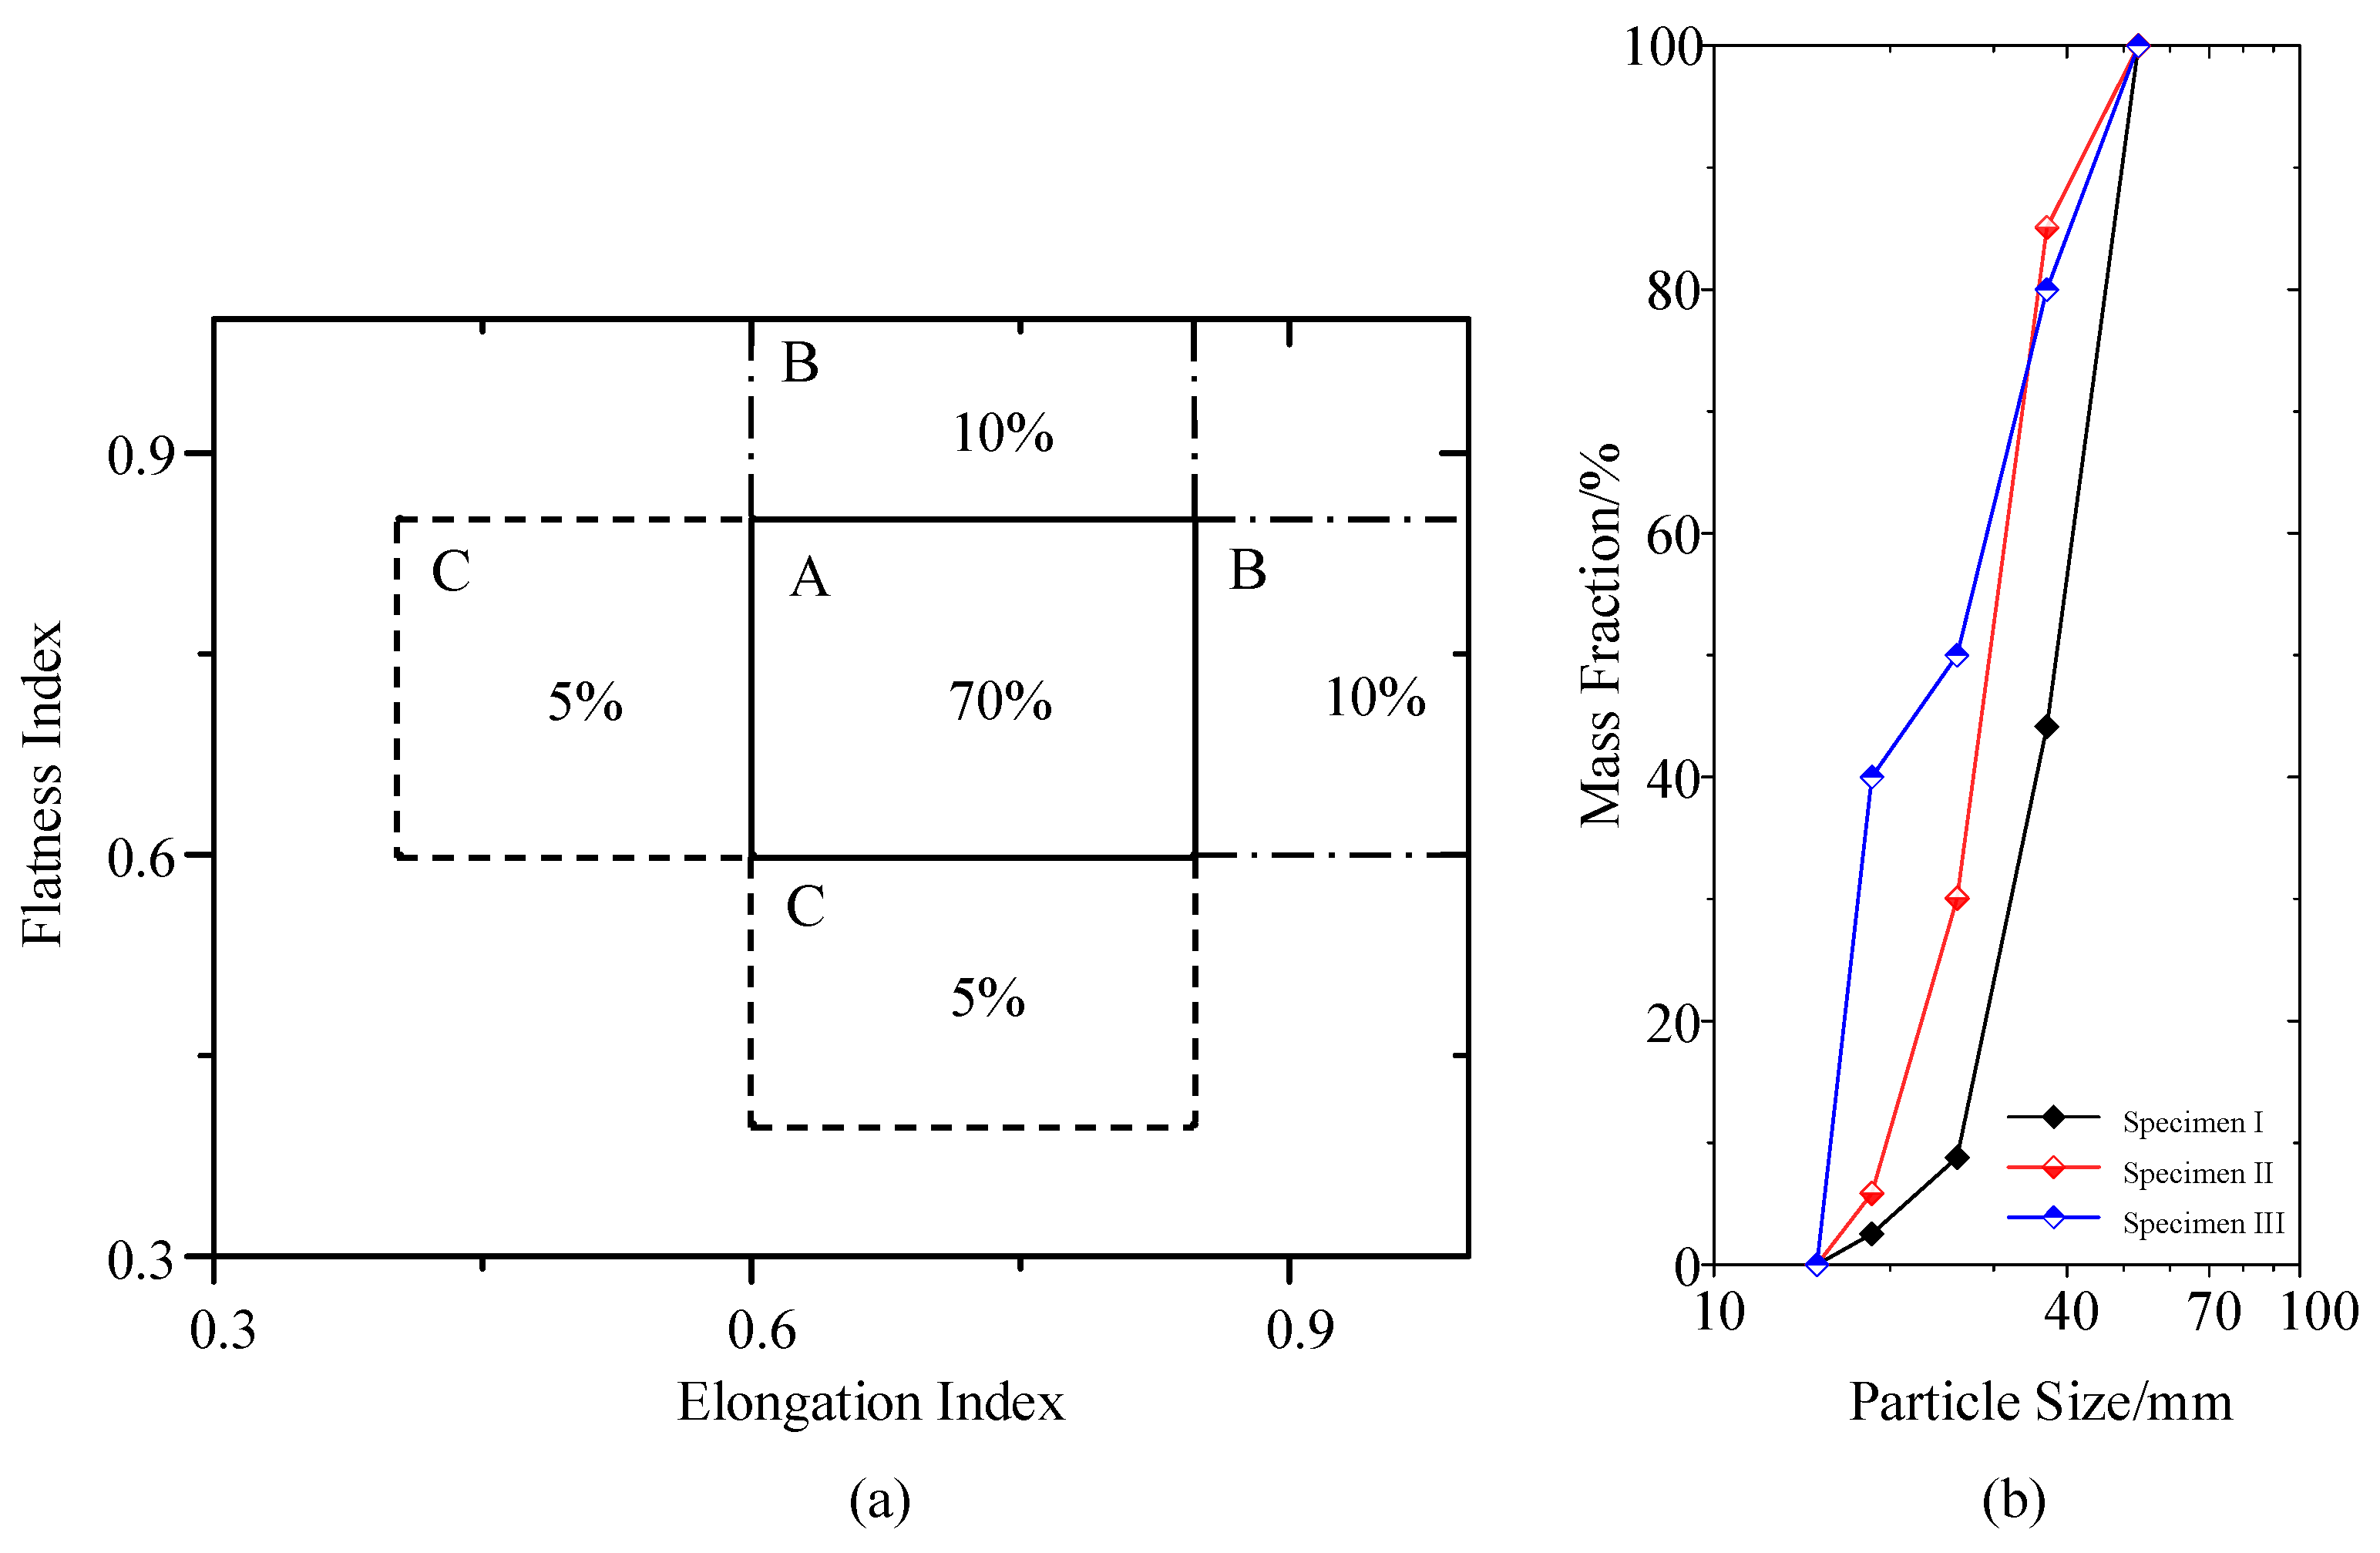
| Grading ID | d60 | d30 | d10 | Cu | Cc |
|---|---|---|---|---|---|
| Ⅰ | 31 | 26 | 19 | 1.63 | 1.15 |
| Ⅱ | 41 | 32 | 26 | 1.58 | 0.96 |
| Ⅲ | 29 | 17 | 15 | 1.93 | 0.66 |
| Test ID | 30 kPa | 60 kPa | 120 kPa | 240 kPa |
|---|---|---|---|---|
| Ⅰ | 11.90 | 17.50 | 28.75 | 42.17 |
| Ⅱ | 7.58 | 12.33 | 19.25 | 32.25 |
| Ⅲ | 4.17 | 6.67 | 10.75 | 22.17 |
| A | 7.58 | 12.75 | 21.92 | 38.25 |
| B | 5.25 | 9.08 | 15.00 | 26.33 |
| C | 13.00 | 20.25 | 30.00 | 45.67 |
| Parameters | Ⅰ | Ⅱ | Ⅲ | A | B | C |
|---|---|---|---|---|---|---|
| K | 247 | 172 | 100 | 190 | 132 | 269 |
| n | 0.61 | 0.70 | 0.89 | 0.79 | 0.78 | 0.59 |
Disclaimer/Publisher’s Note: The statements, opinions and data contained in all publications are solely those of the individual author(s) and contributor(s) and not of MDPI and/or the editor(s). MDPI and/or the editor(s) disclaim responsibility for any injury to people or property resulting from any ideas, methods, instructions or products referred to in the content. |
© 2023 by the authors. Licensee MDPI, Basel, Switzerland. This article is an open access article distributed under the terms and conditions of the Creative Commons Attribution (CC BY) license (https://creativecommons.org/licenses/by/4.0/).
Share and Cite
Tan, X.; Qiu, Z.; Yin, X.; Hu, Y.; Liu, X.; Zeng, L. Effects of Particle Shape and Packing Density on the Mechanical Performance of Recycled Aggregates for Construction Purposes. Buildings 2023, 13, 2153. https://doi.org/10.3390/buildings13092153
Tan X, Qiu Z, Yin X, Hu Y, Liu X, Zeng L. Effects of Particle Shape and Packing Density on the Mechanical Performance of Recycled Aggregates for Construction Purposes. Buildings. 2023; 13(9):2153. https://doi.org/10.3390/buildings13092153
Chicago/Turabian StyleTan, Xin, Zhaohui Qiu, Xin Yin, Yuegang Hu, Xiaoming Liu, and Lei Zeng. 2023. "Effects of Particle Shape and Packing Density on the Mechanical Performance of Recycled Aggregates for Construction Purposes" Buildings 13, no. 9: 2153. https://doi.org/10.3390/buildings13092153