
Applicability of CMOD to Obtain the Actual Fracture Toughness of Rightly-Cracked Fibrous Concrete Beams


 and
and
Abstract
:1. Introduction
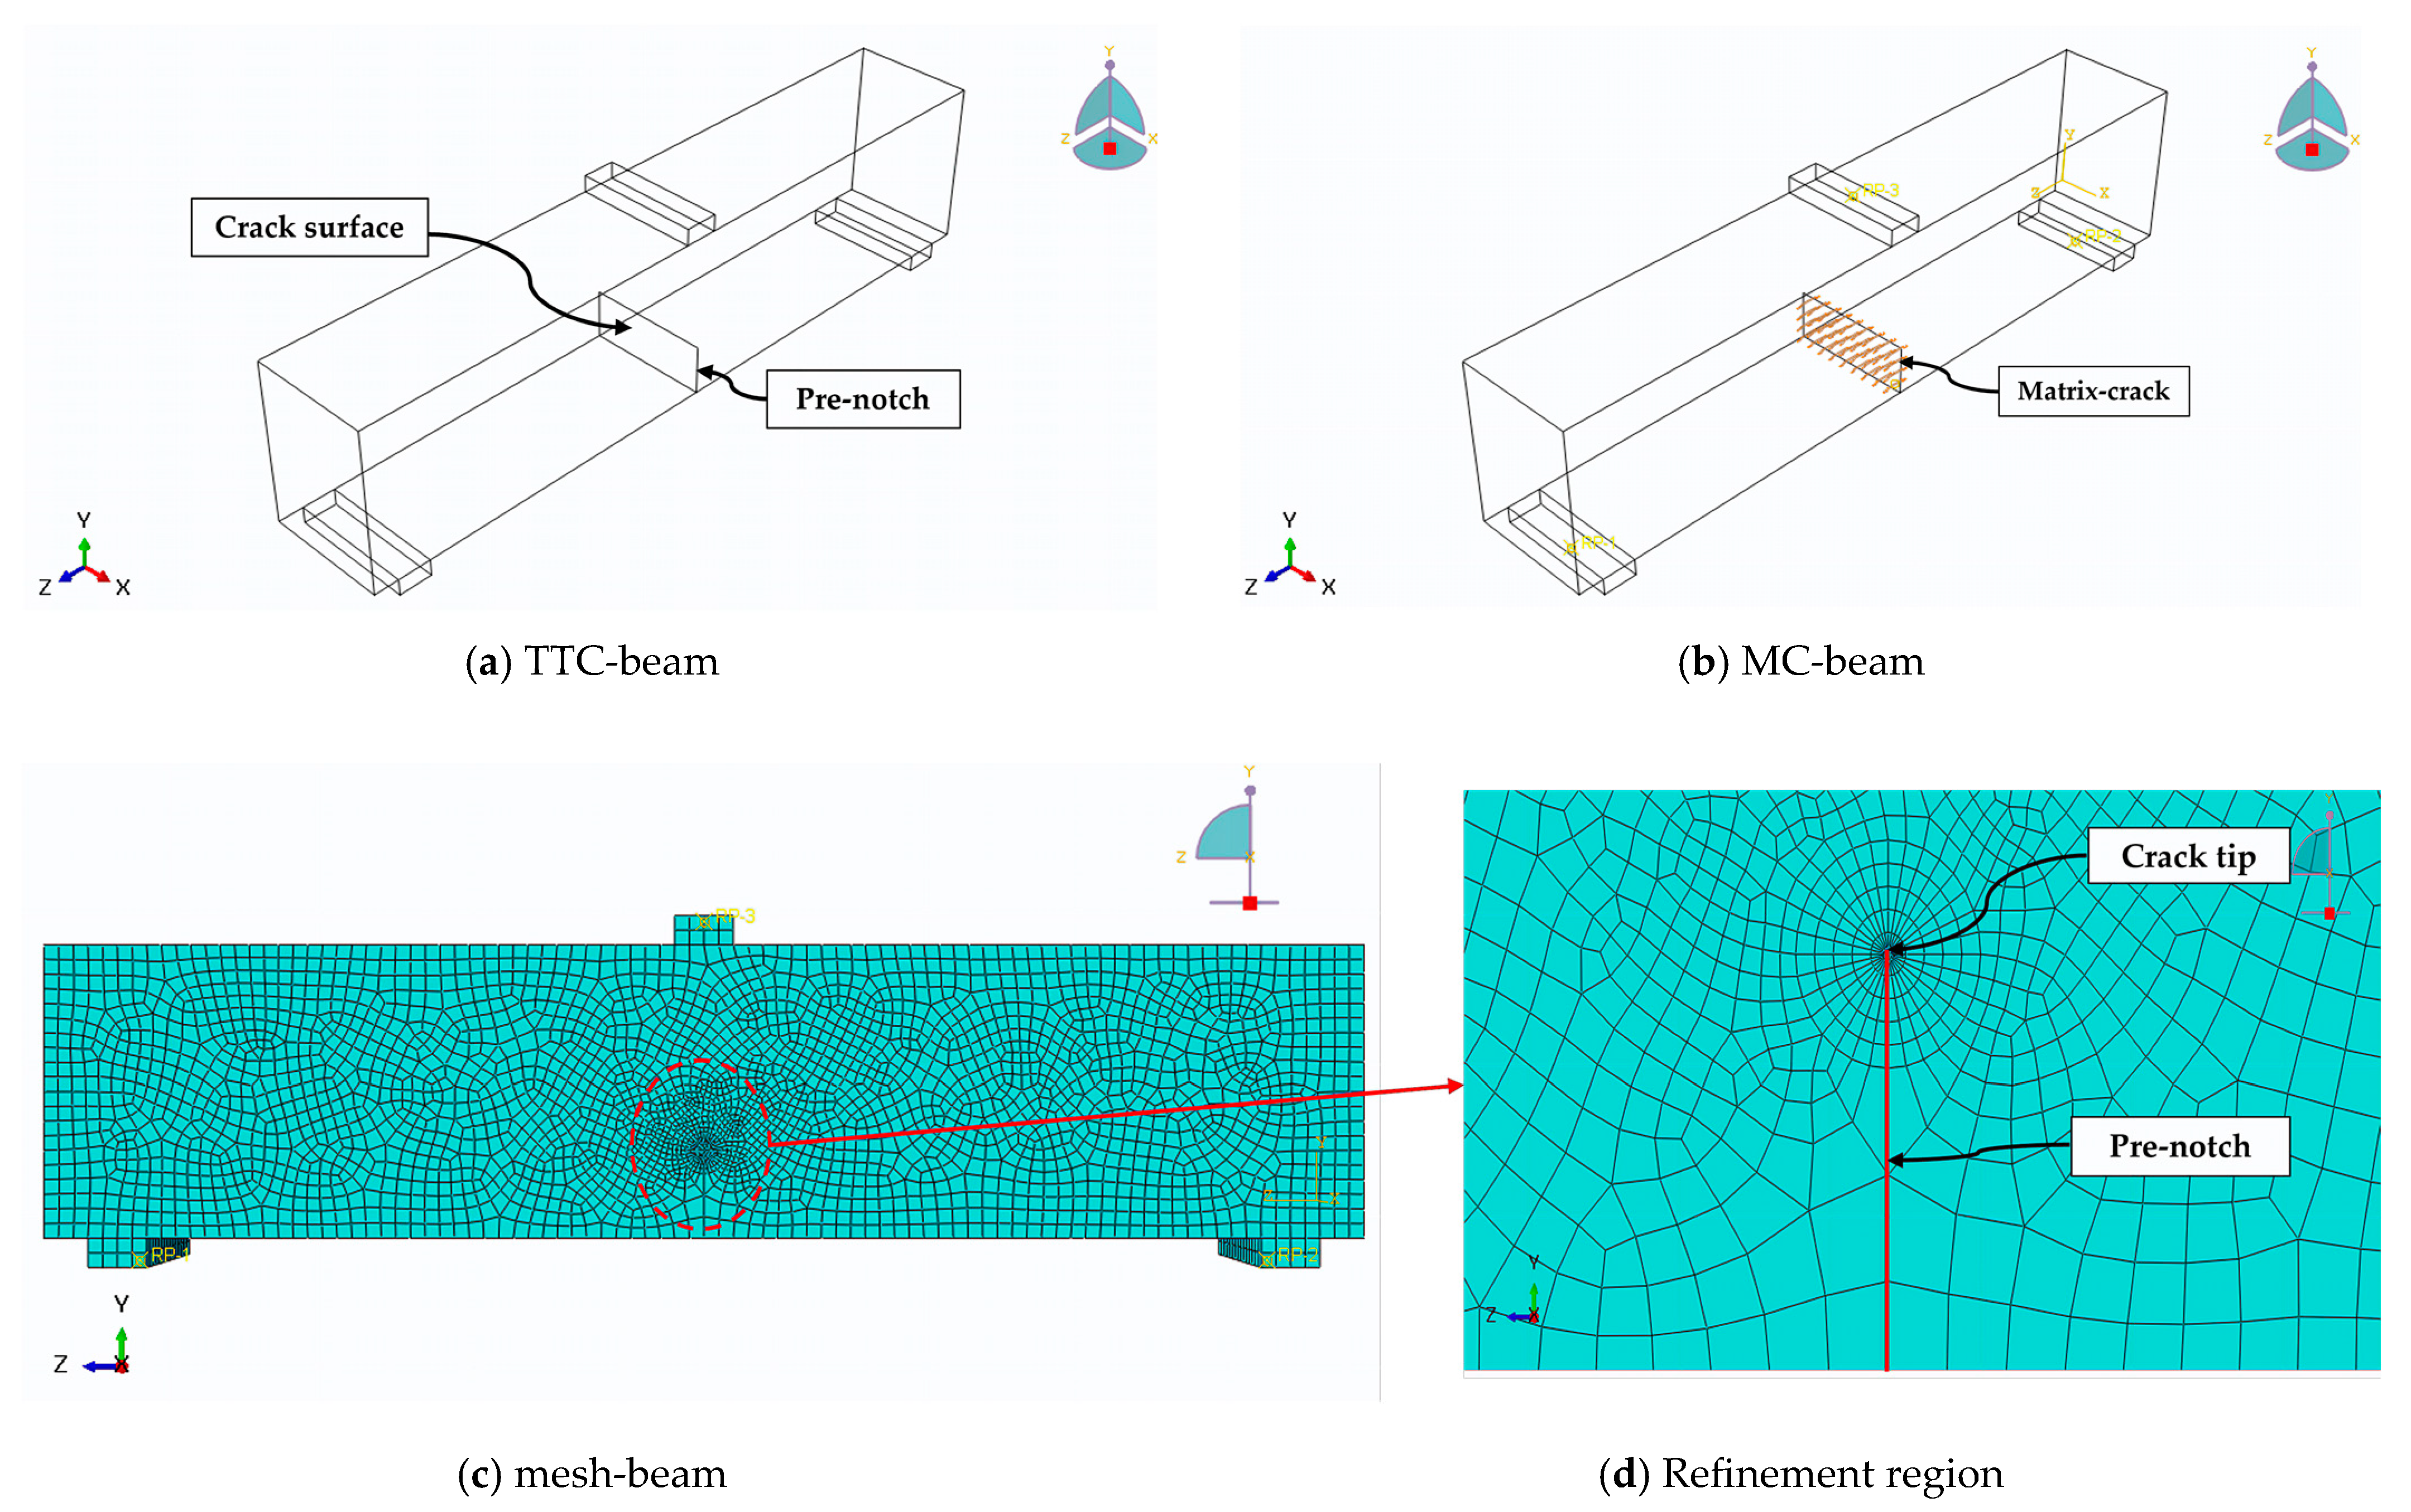
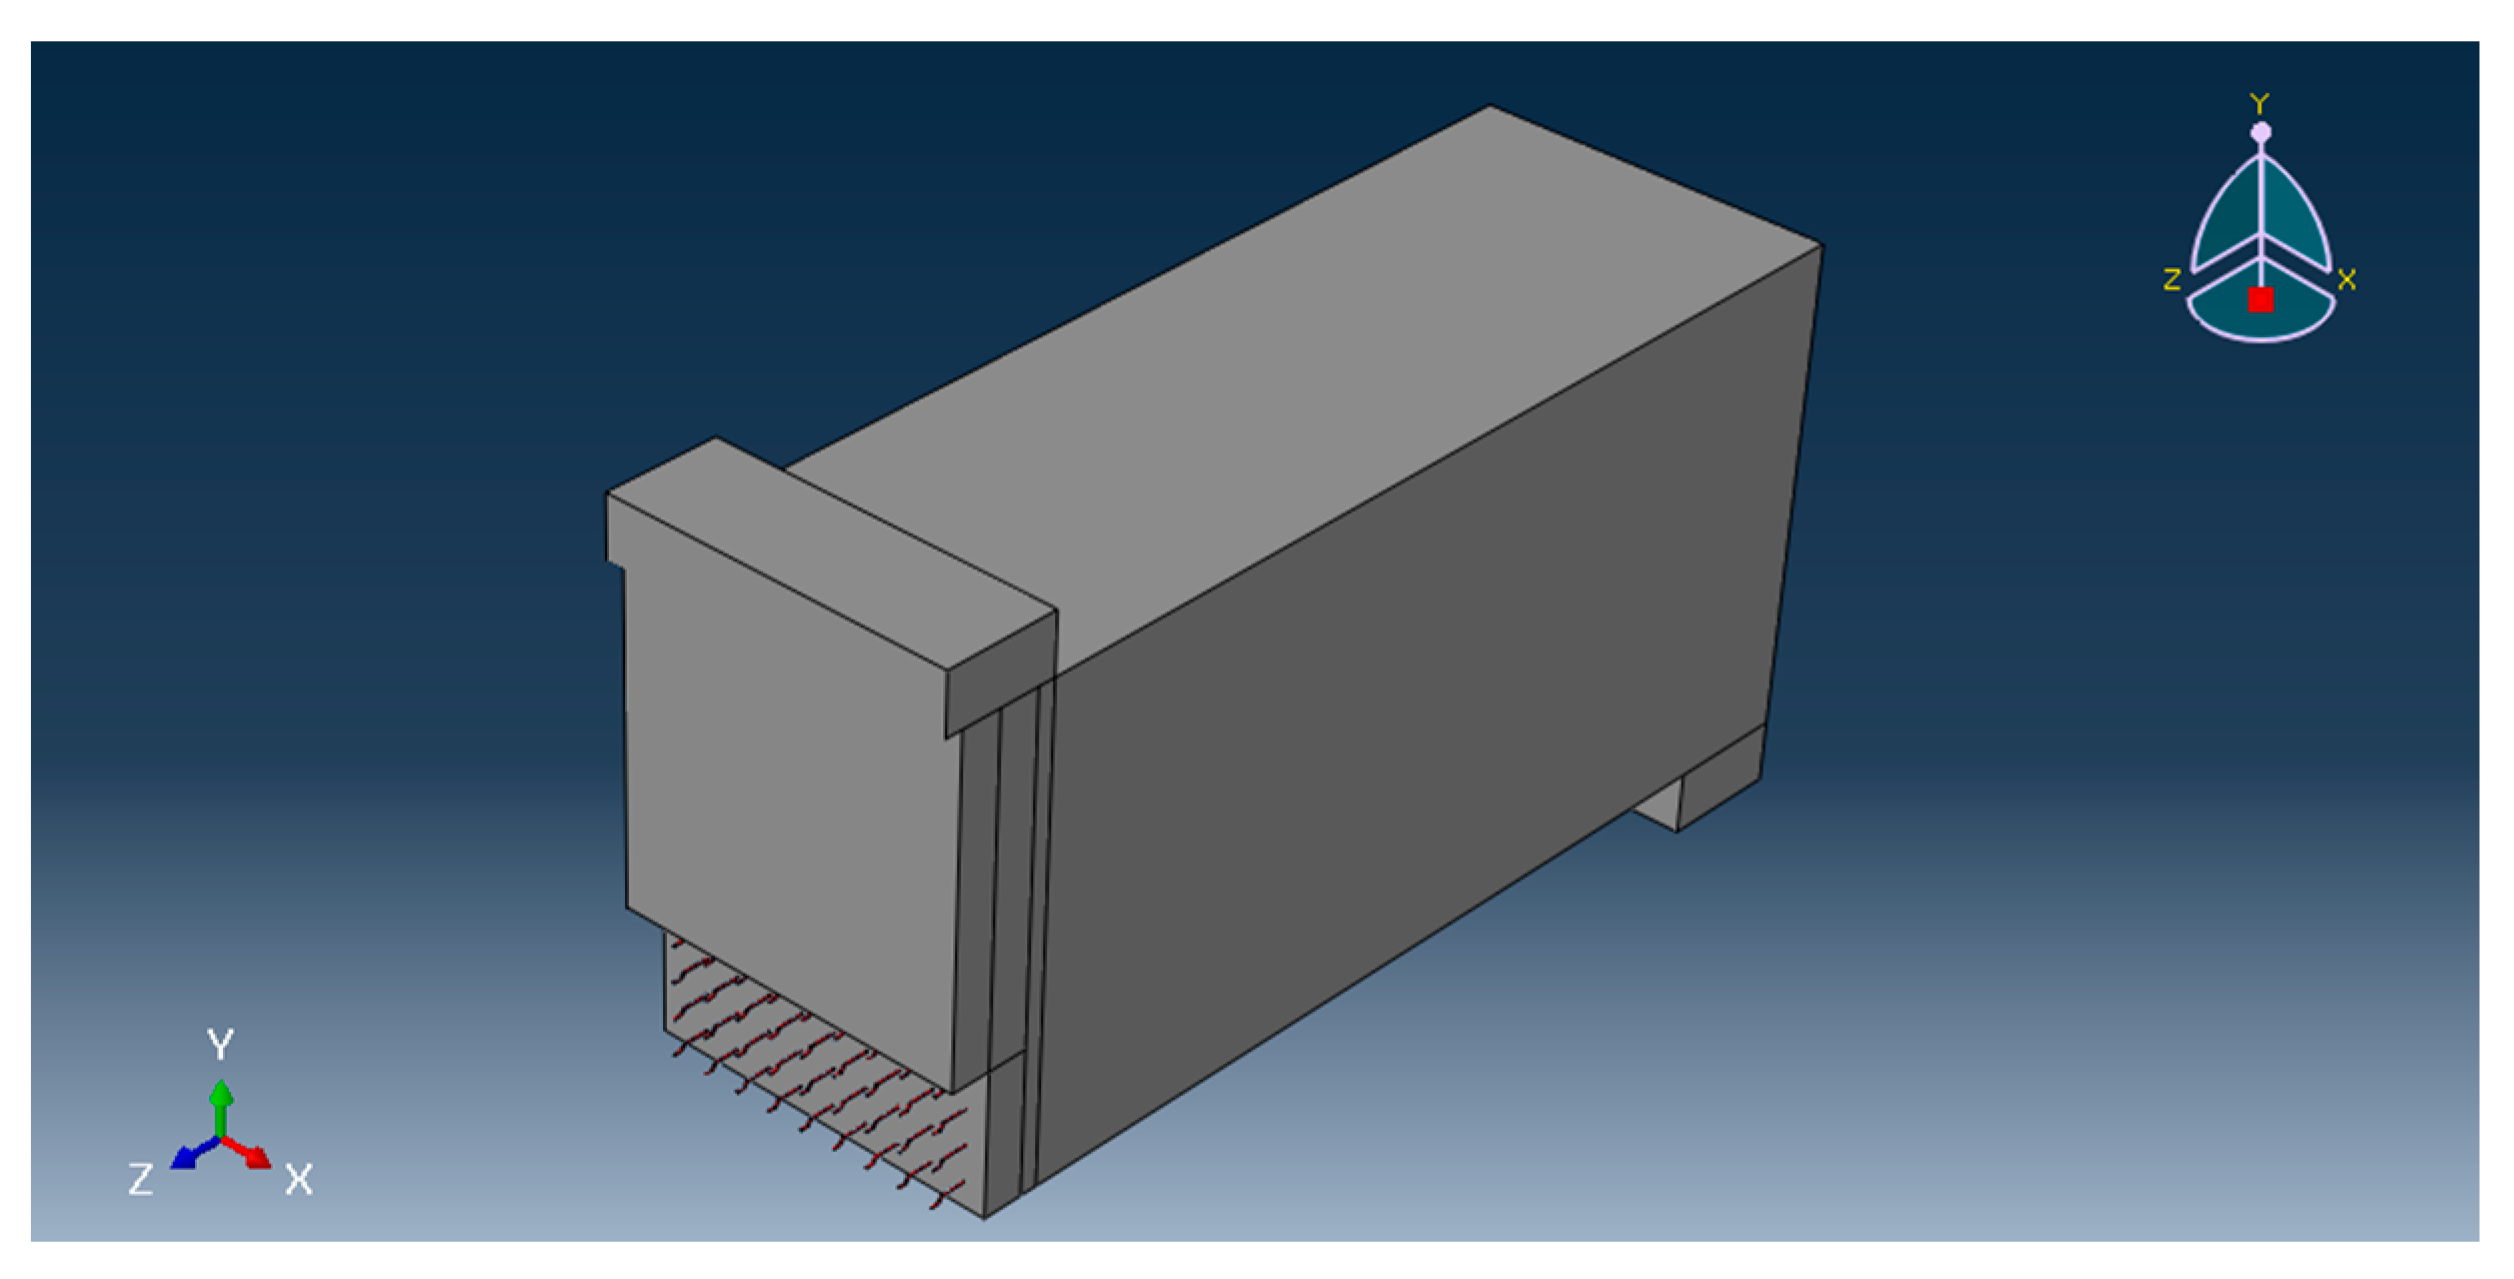
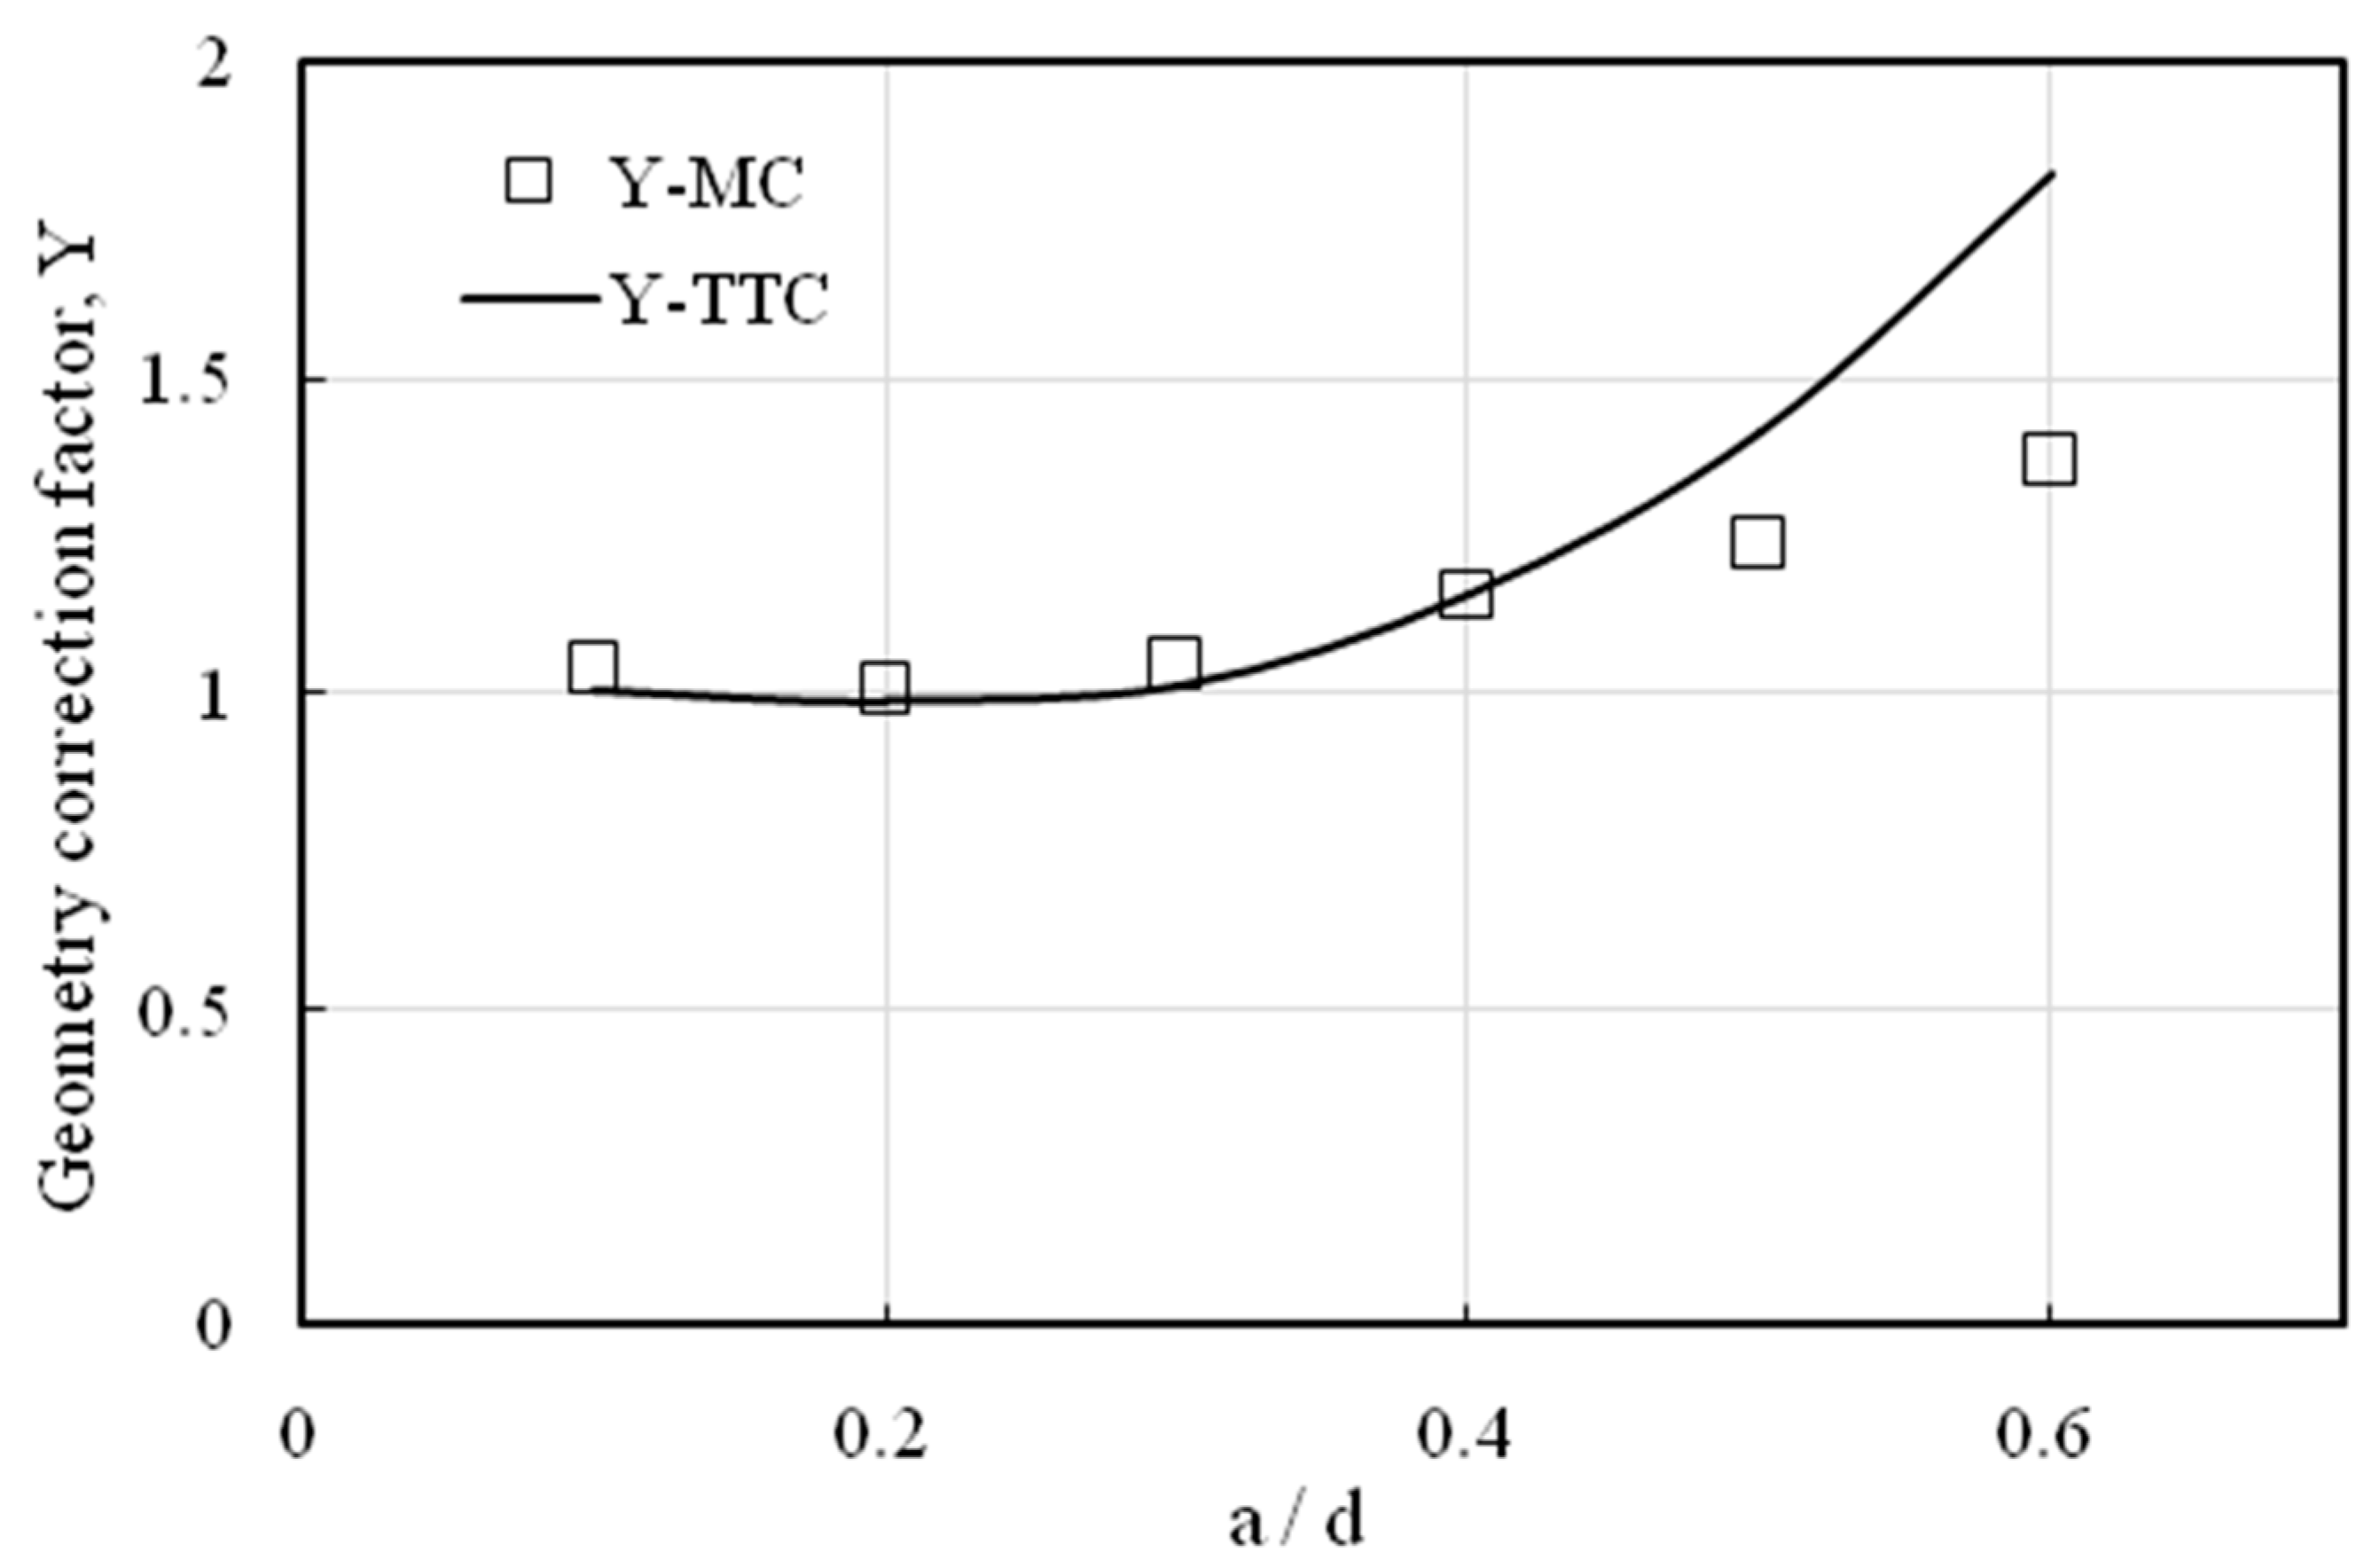
2. Numerical Work
3. Experimental Work
3.1. Materials and Mix Proportions
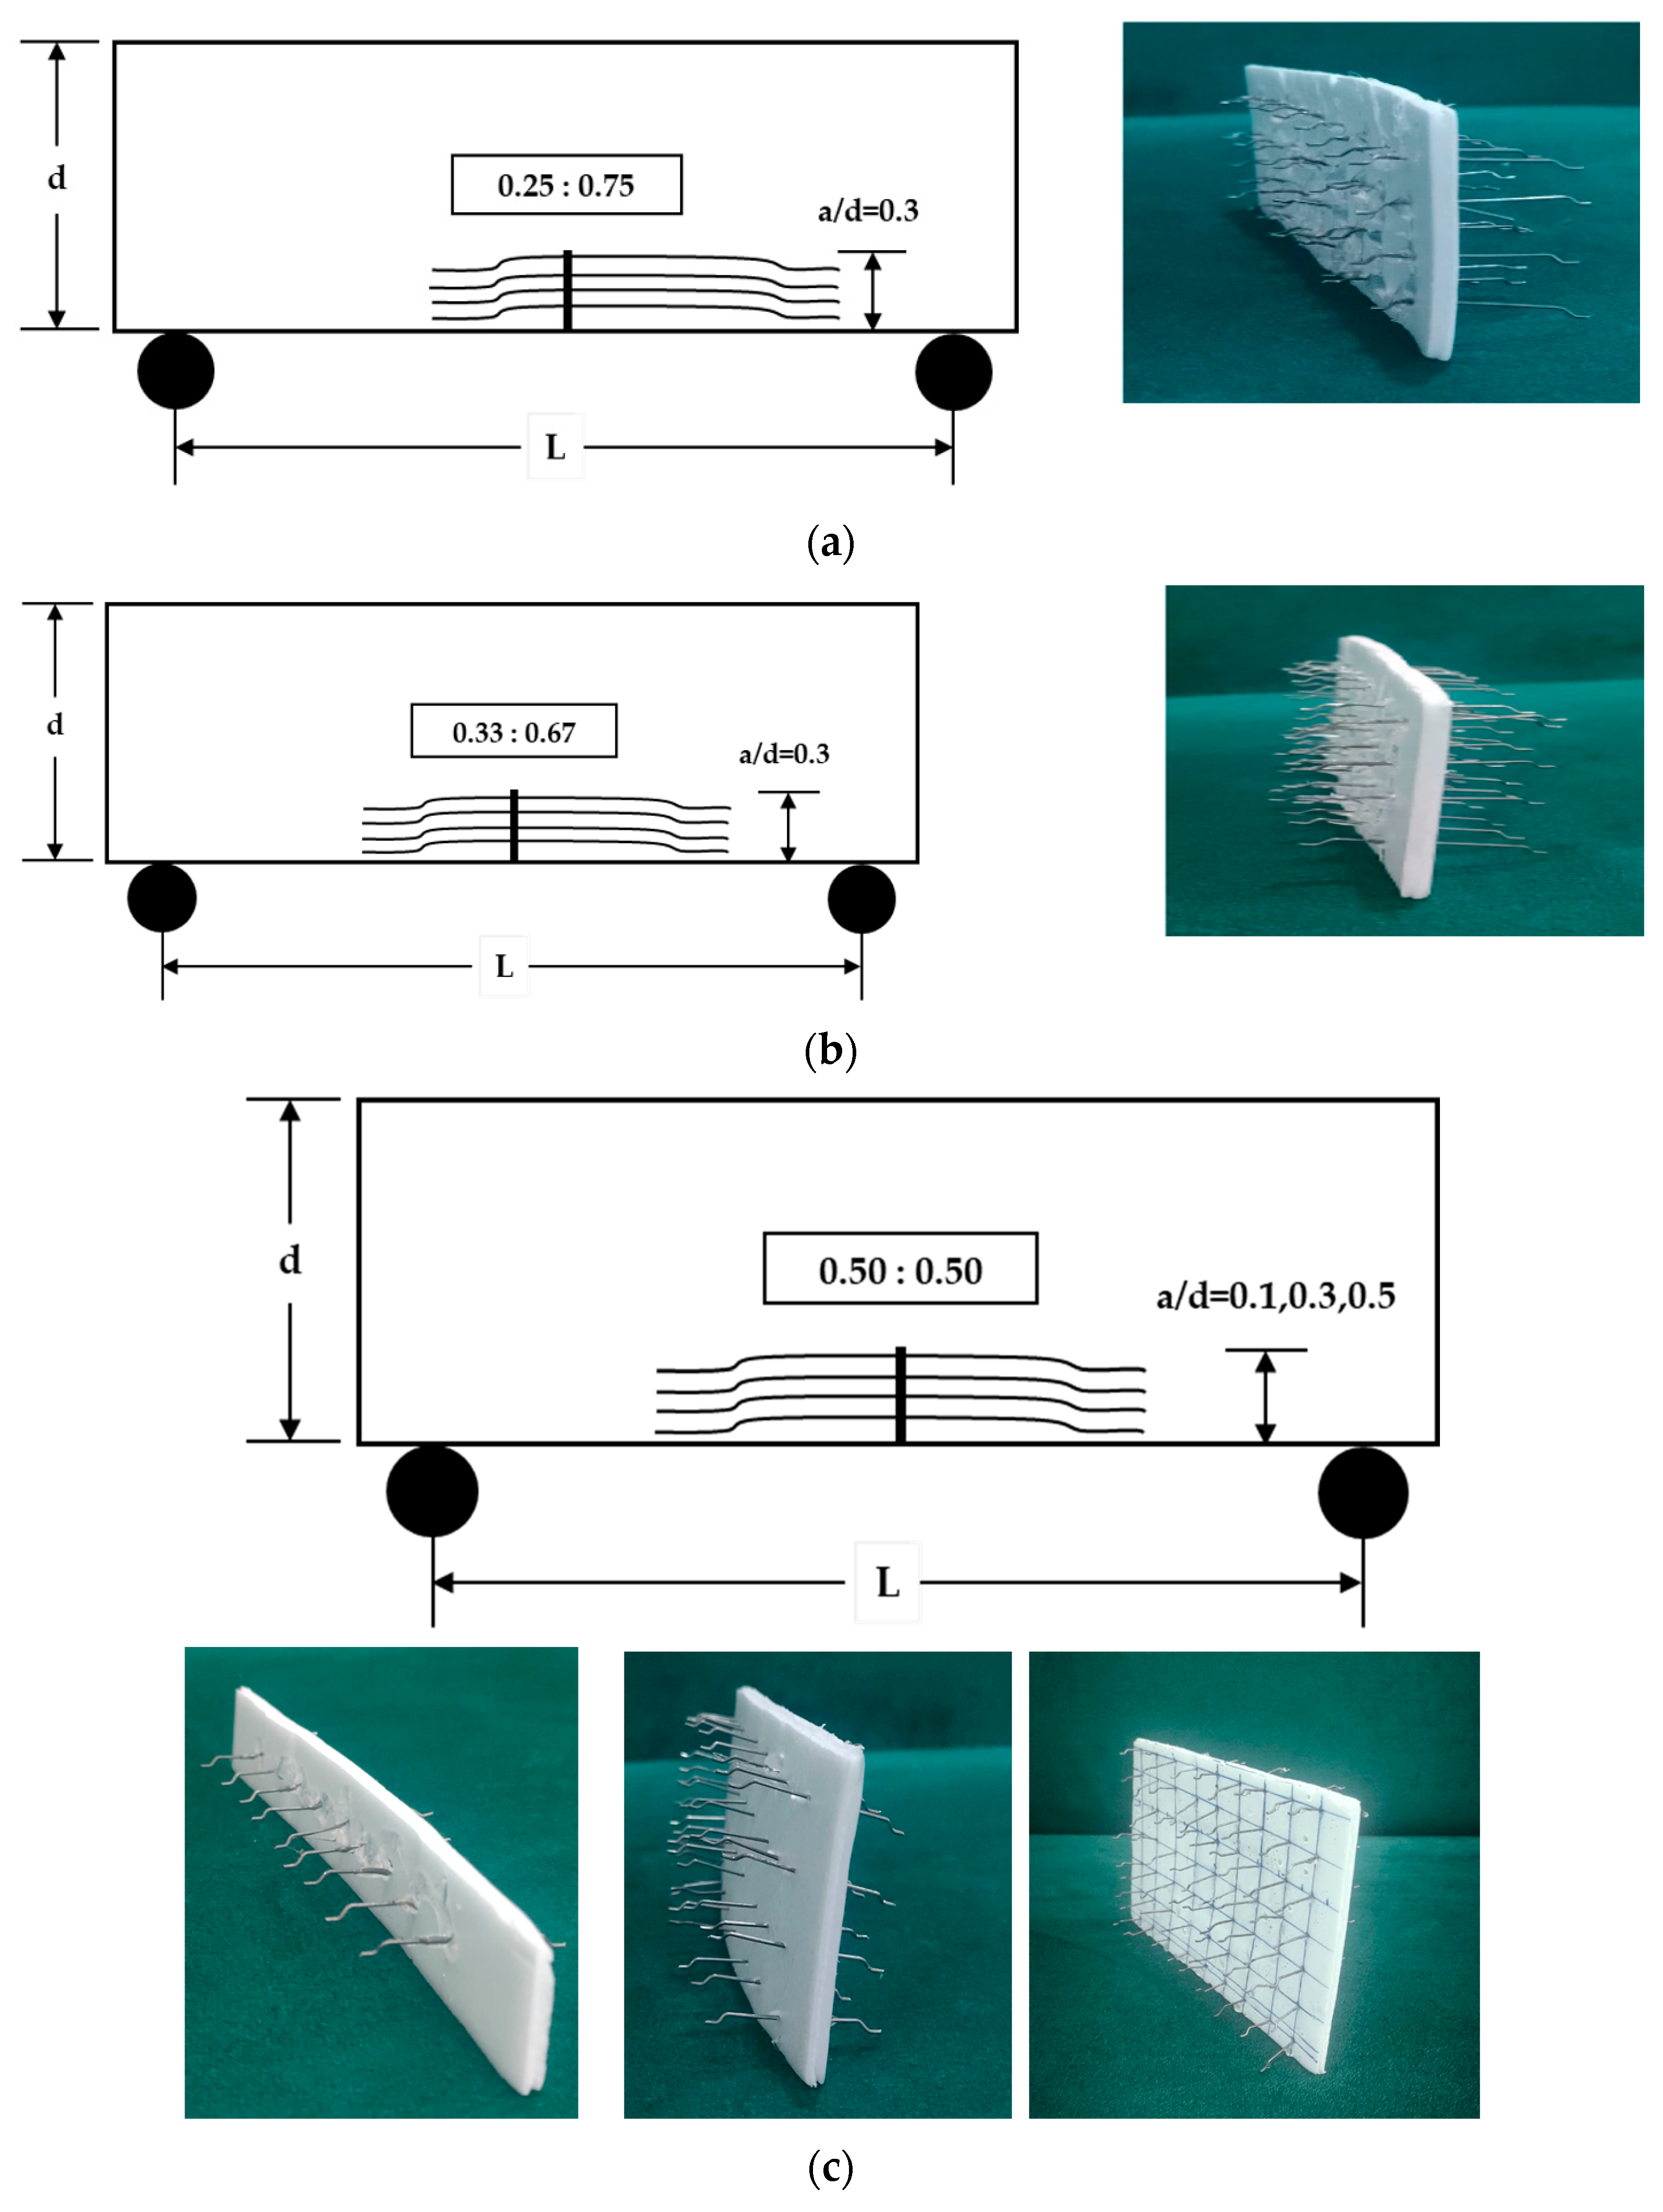
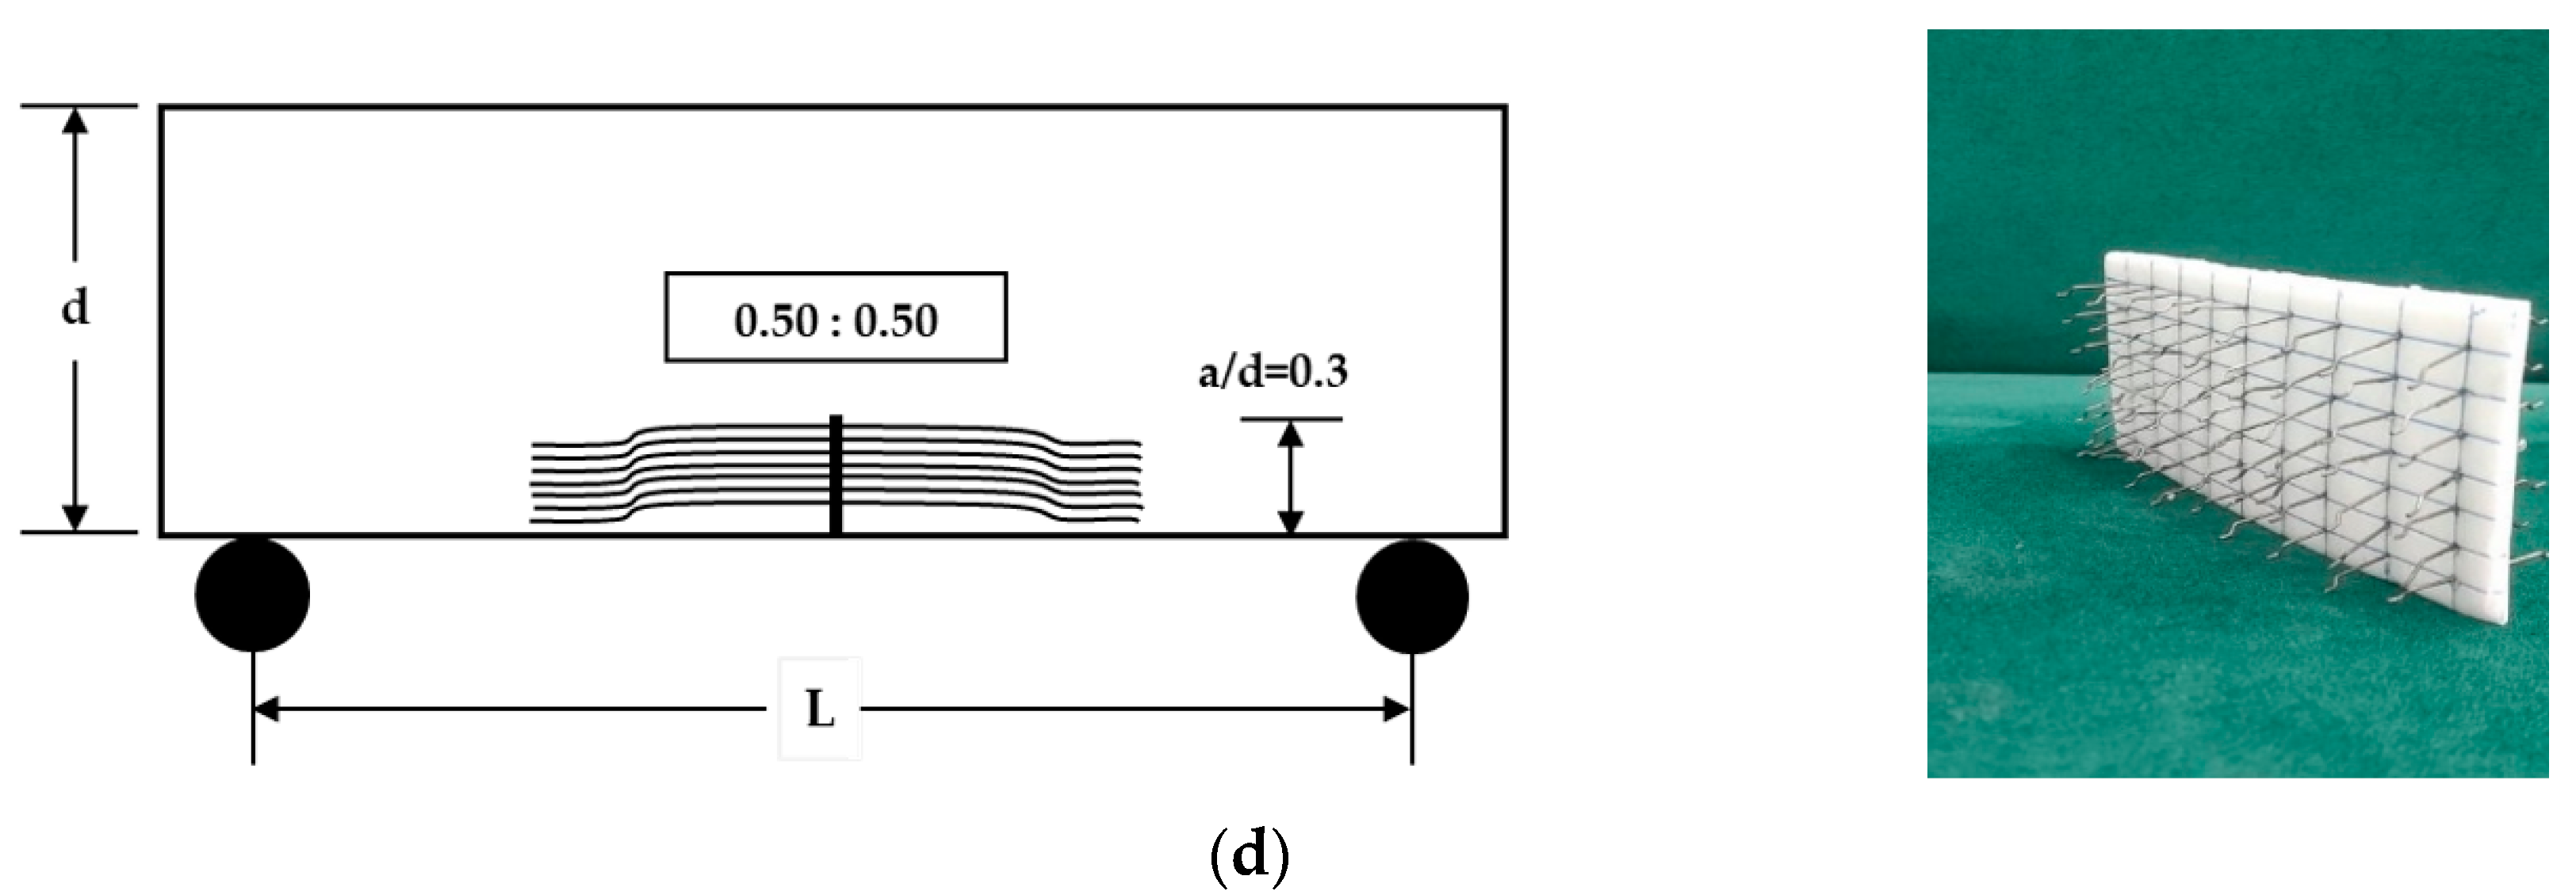
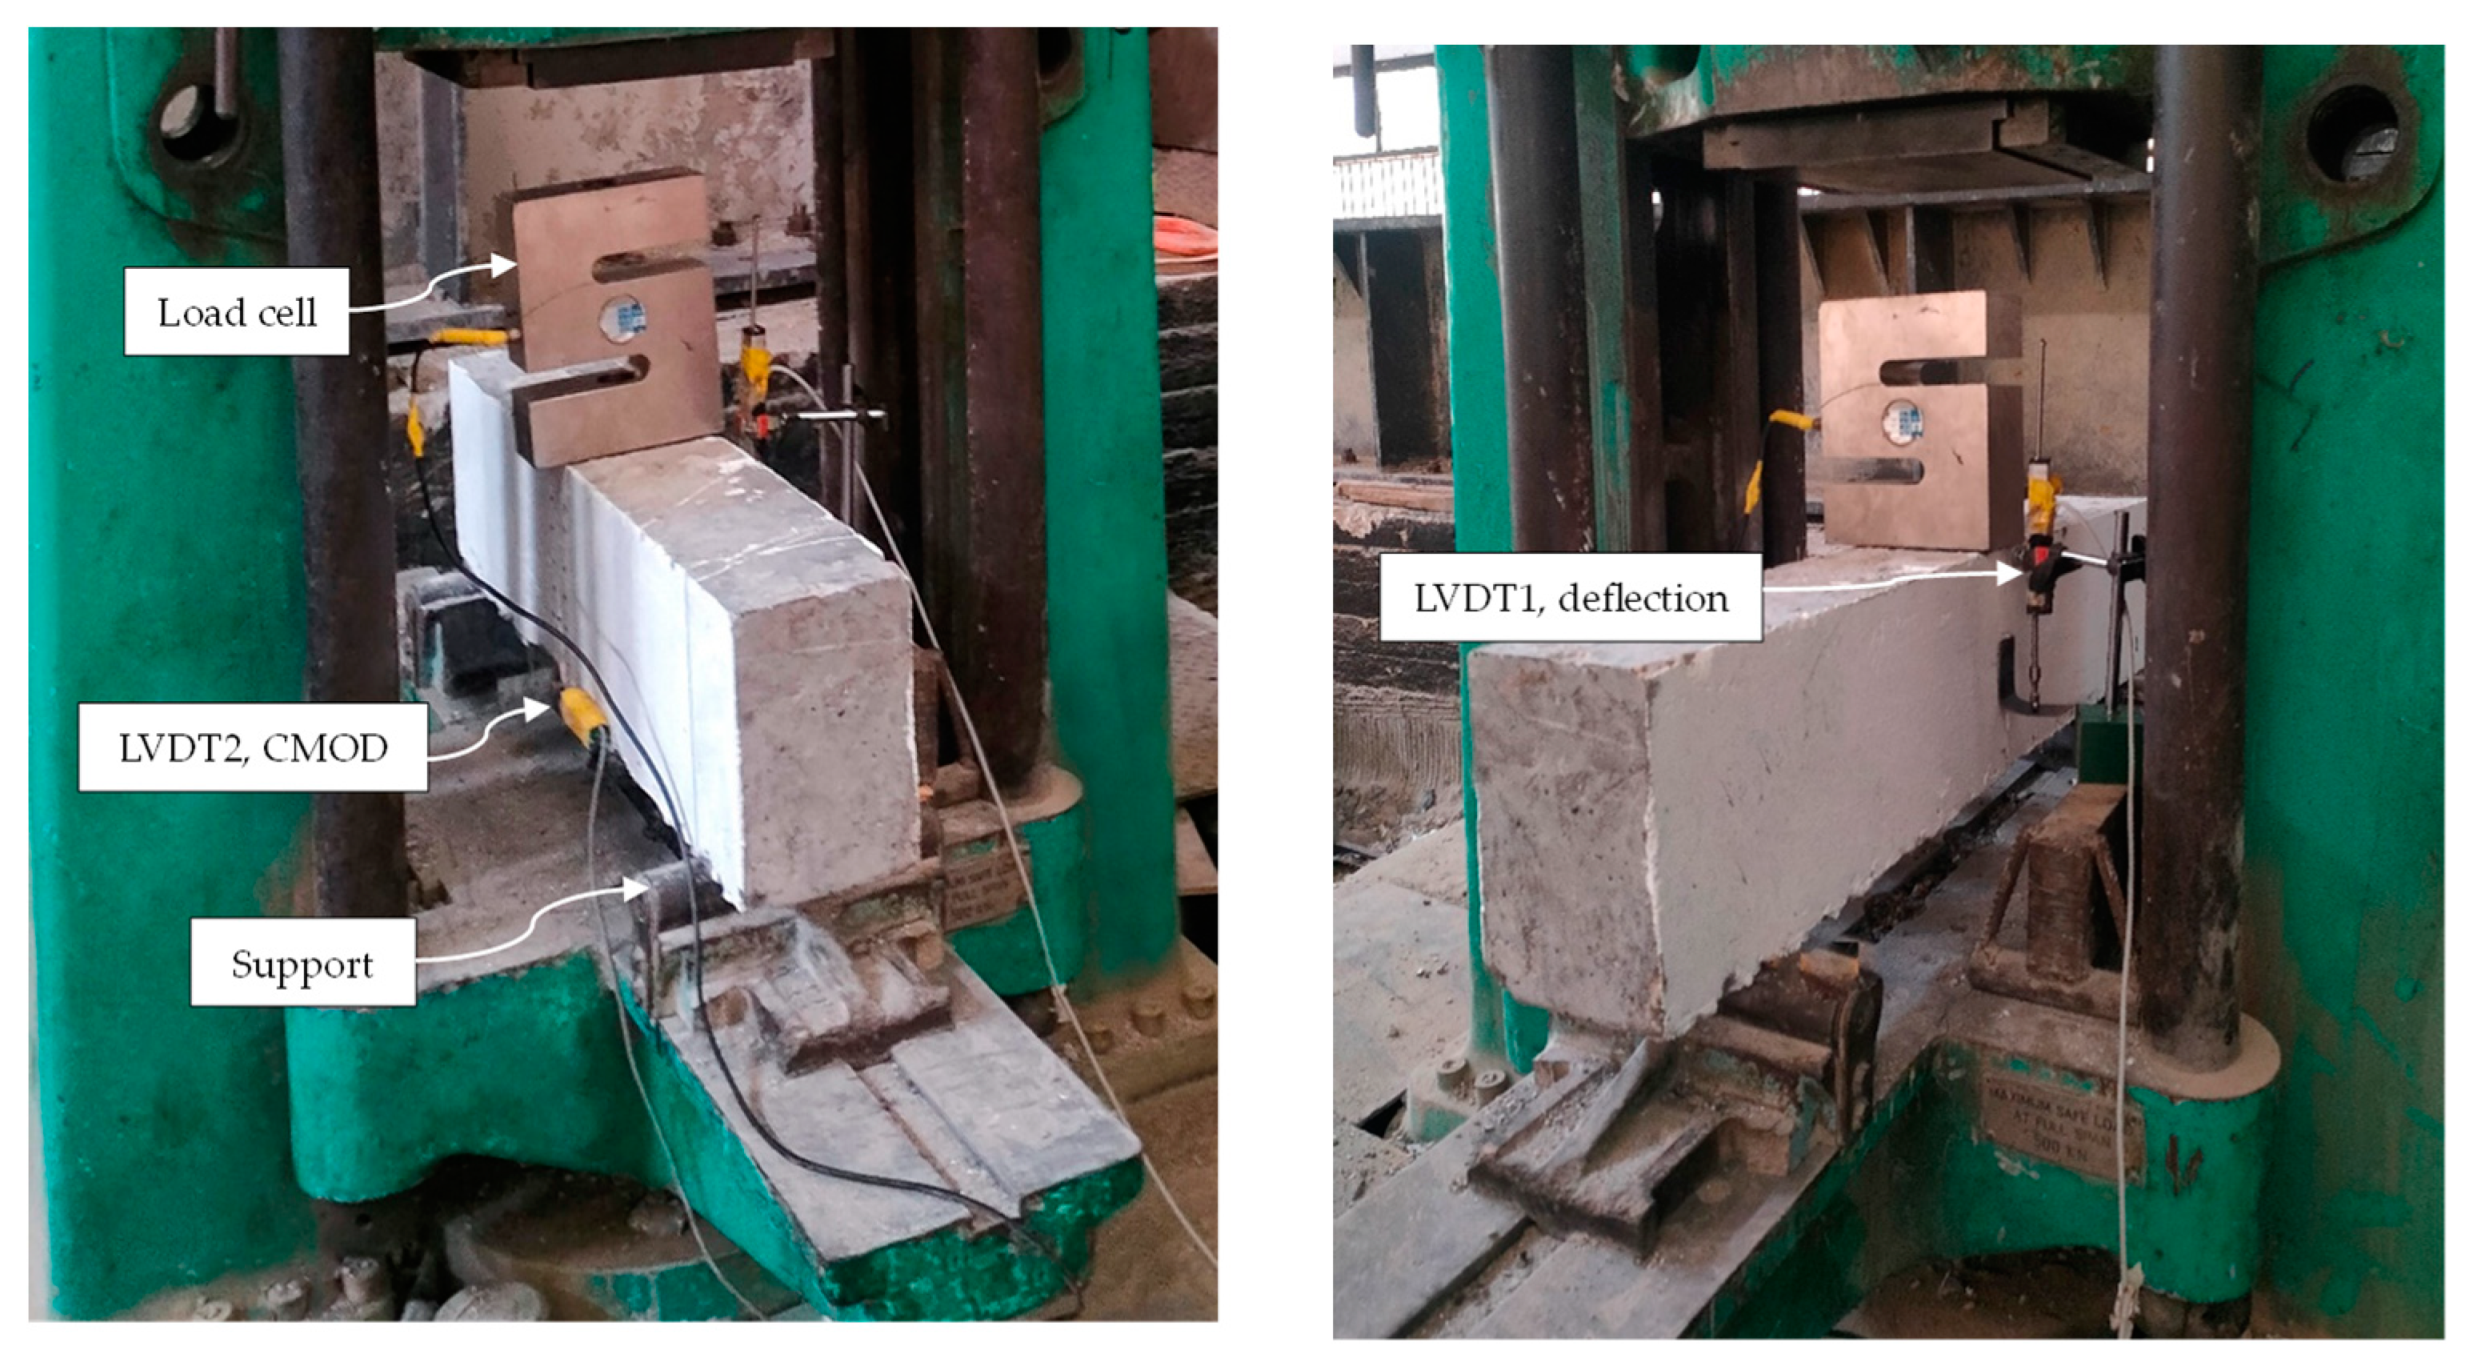
3.2. Experimental Program, Matrix Crack Methodology, and Test Setup
4. Results and Discussion
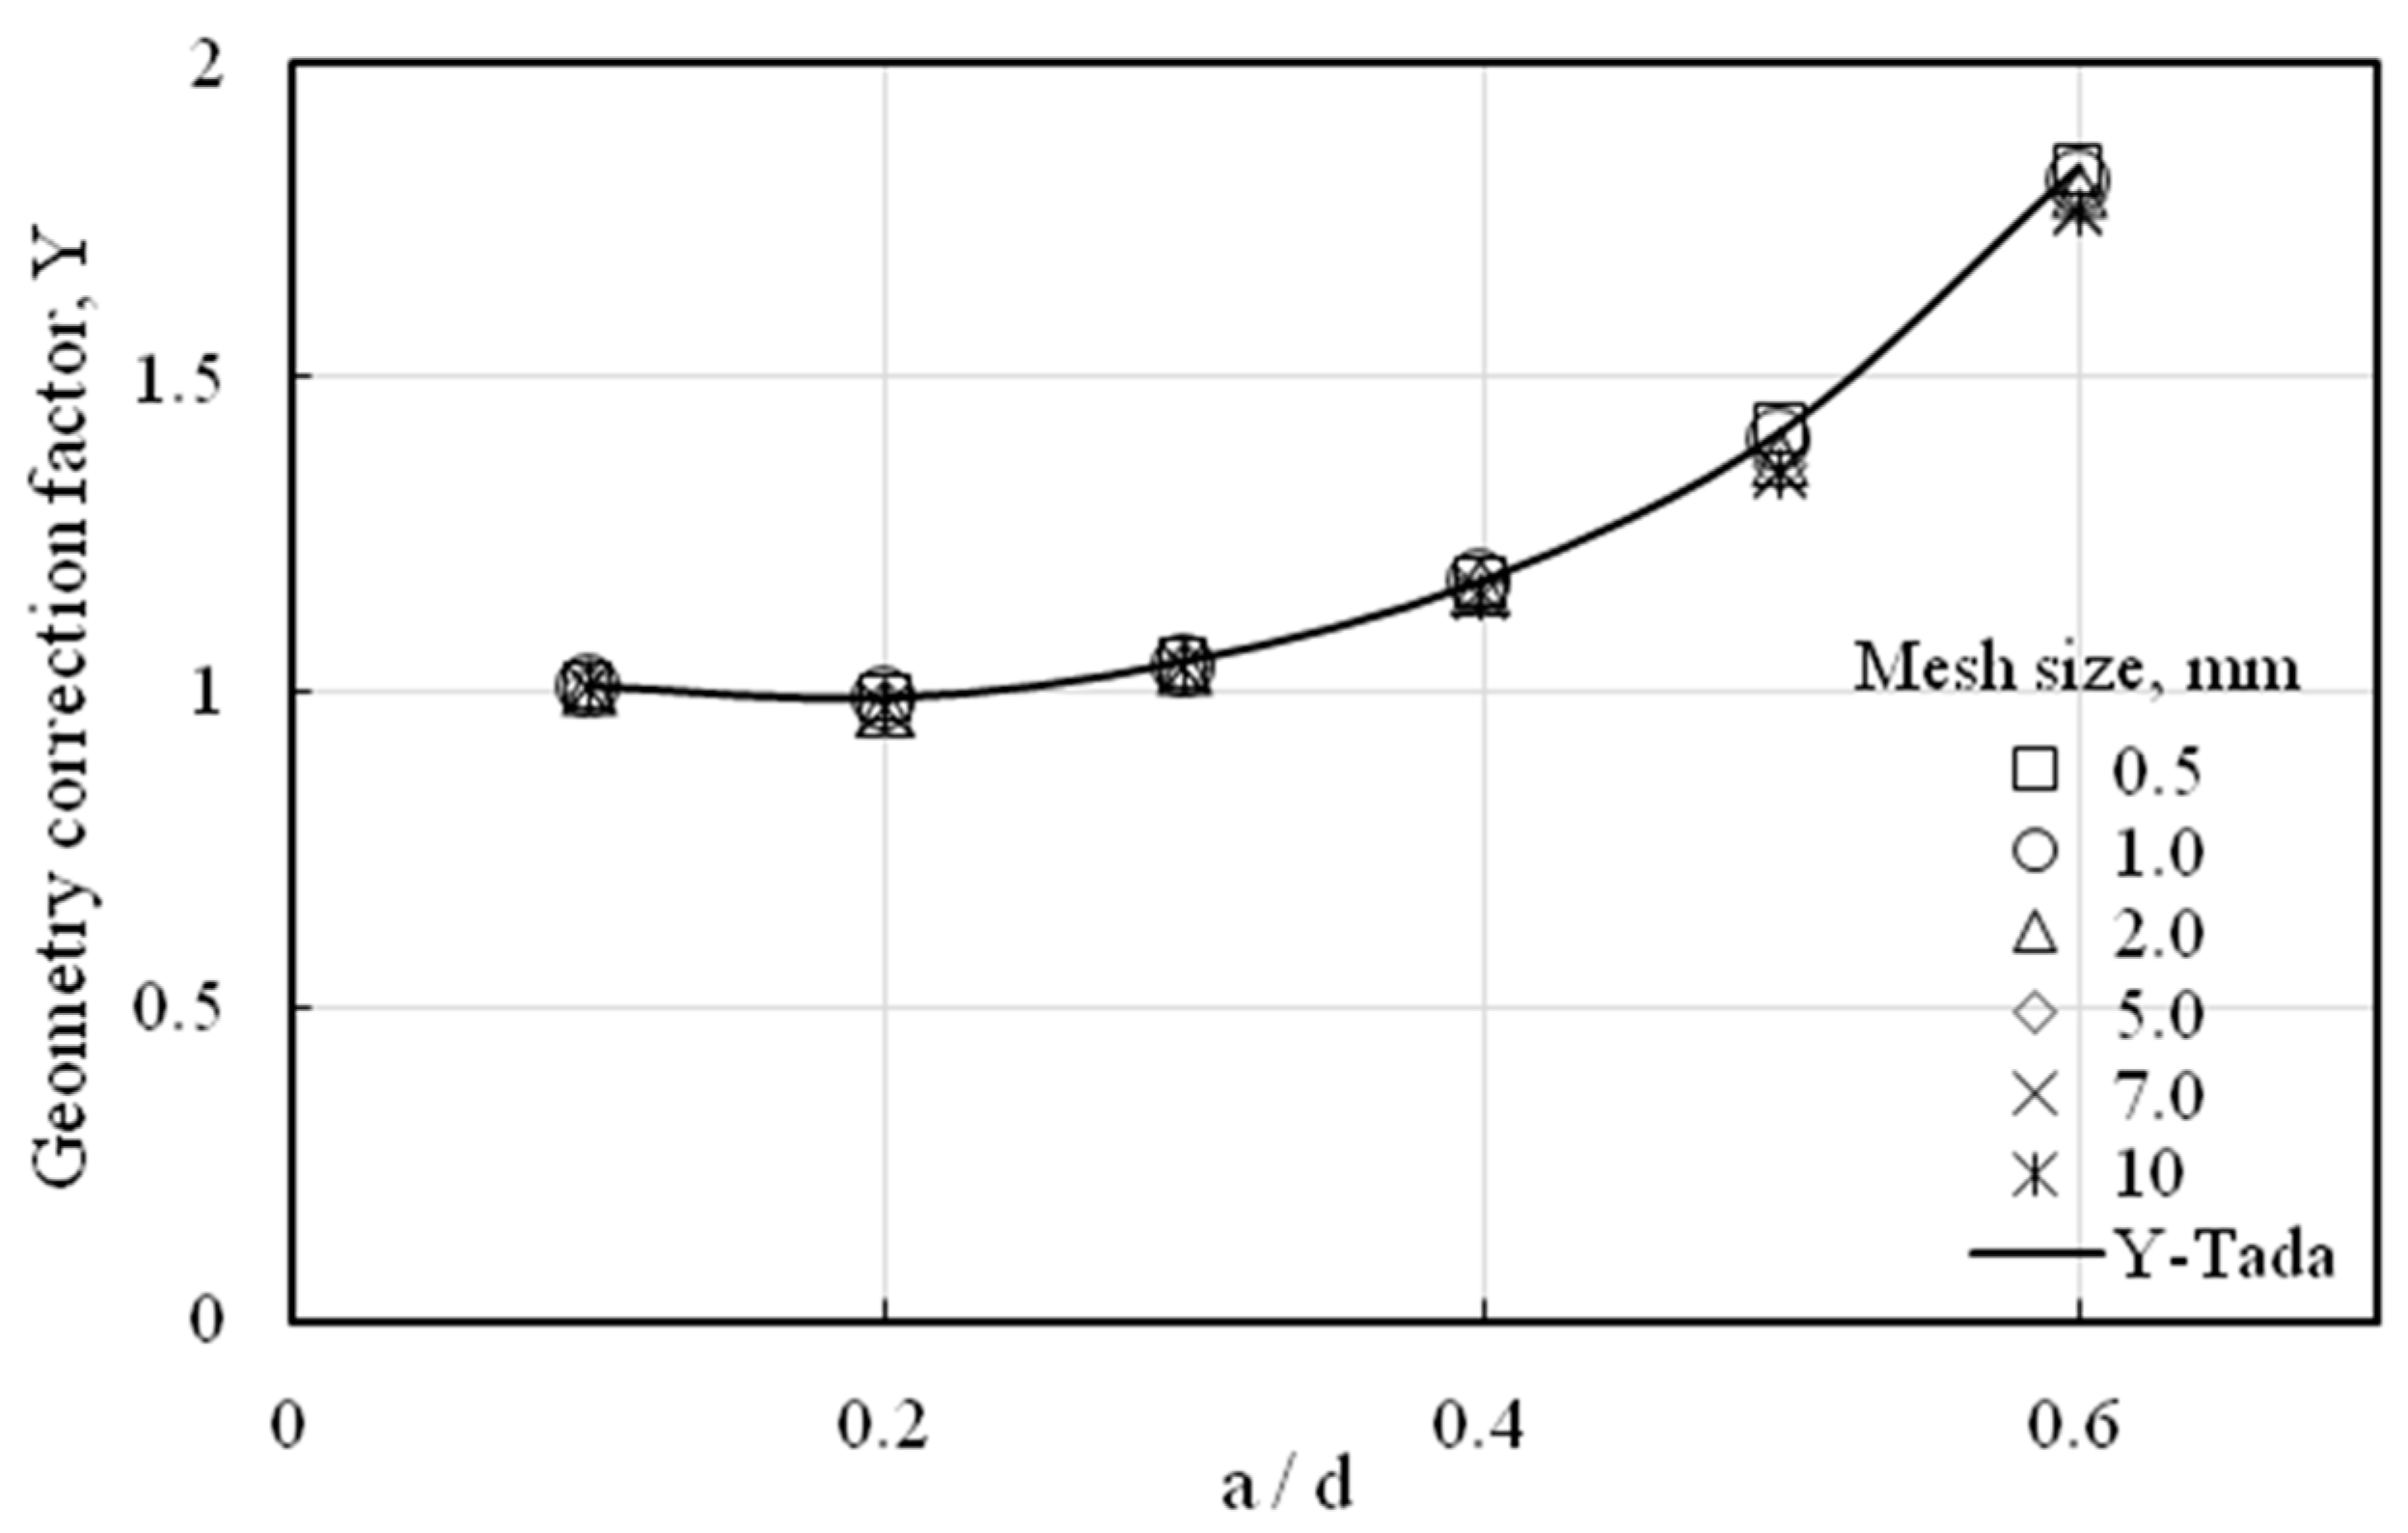
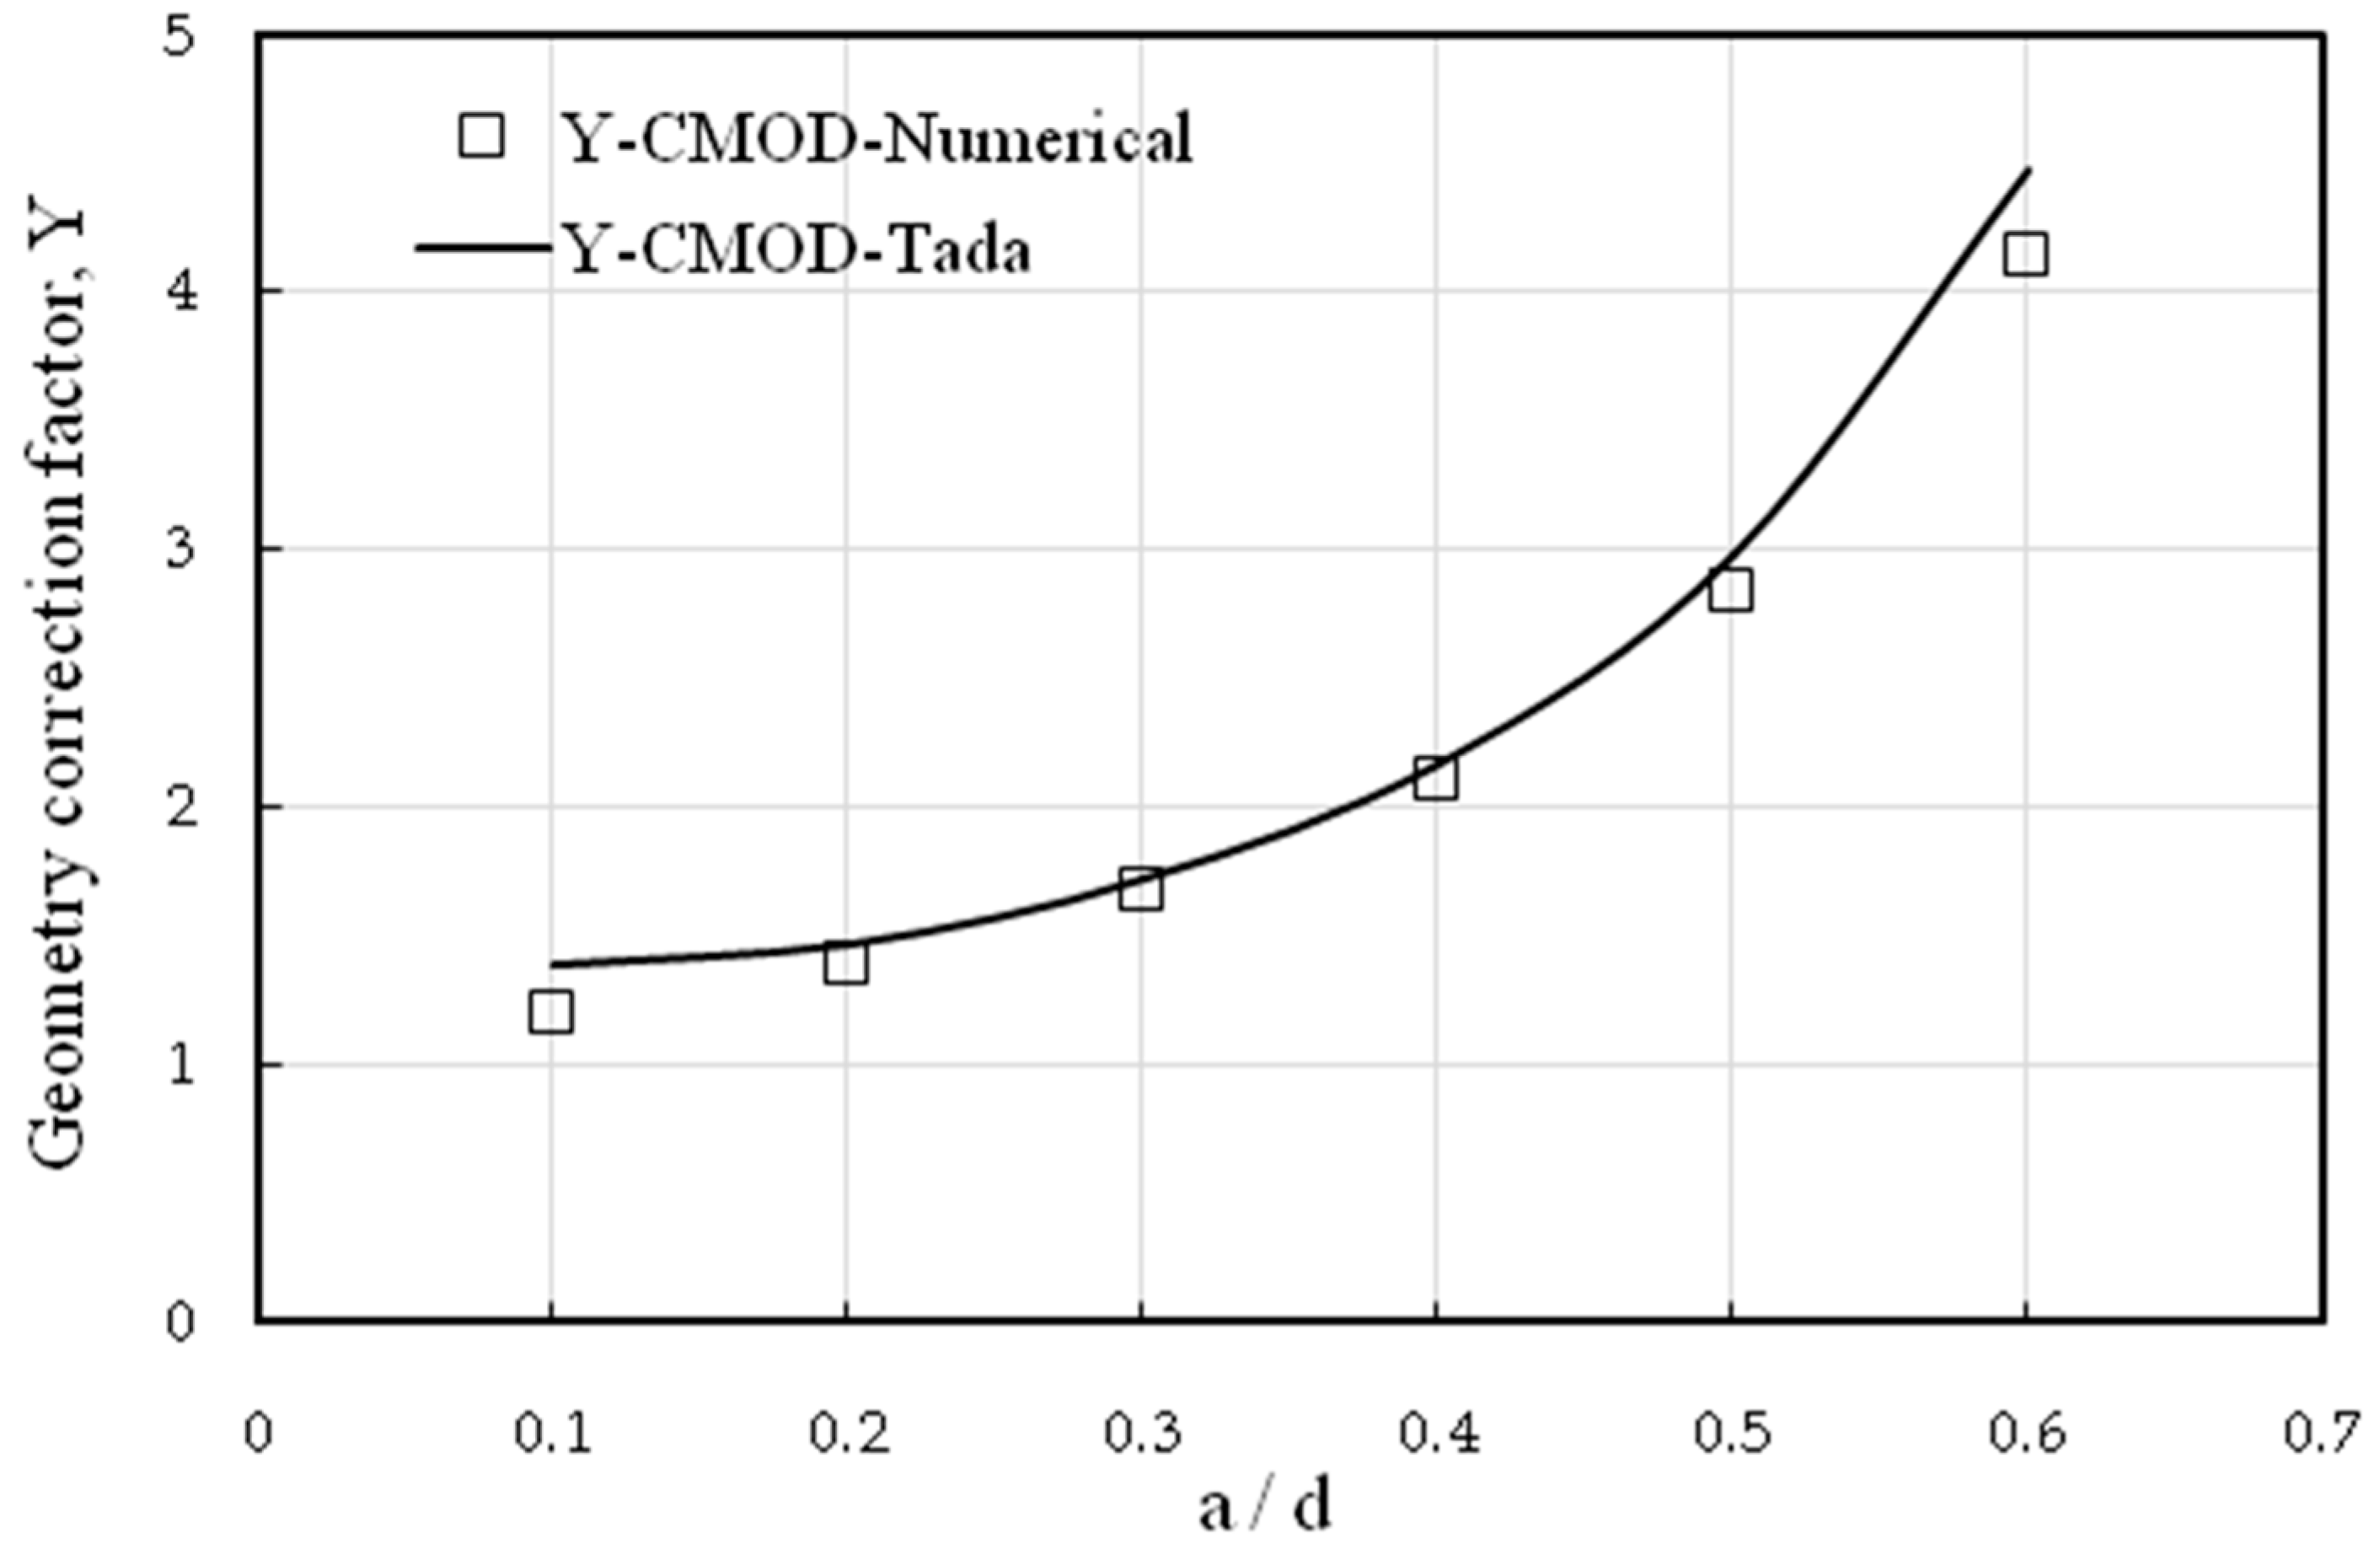
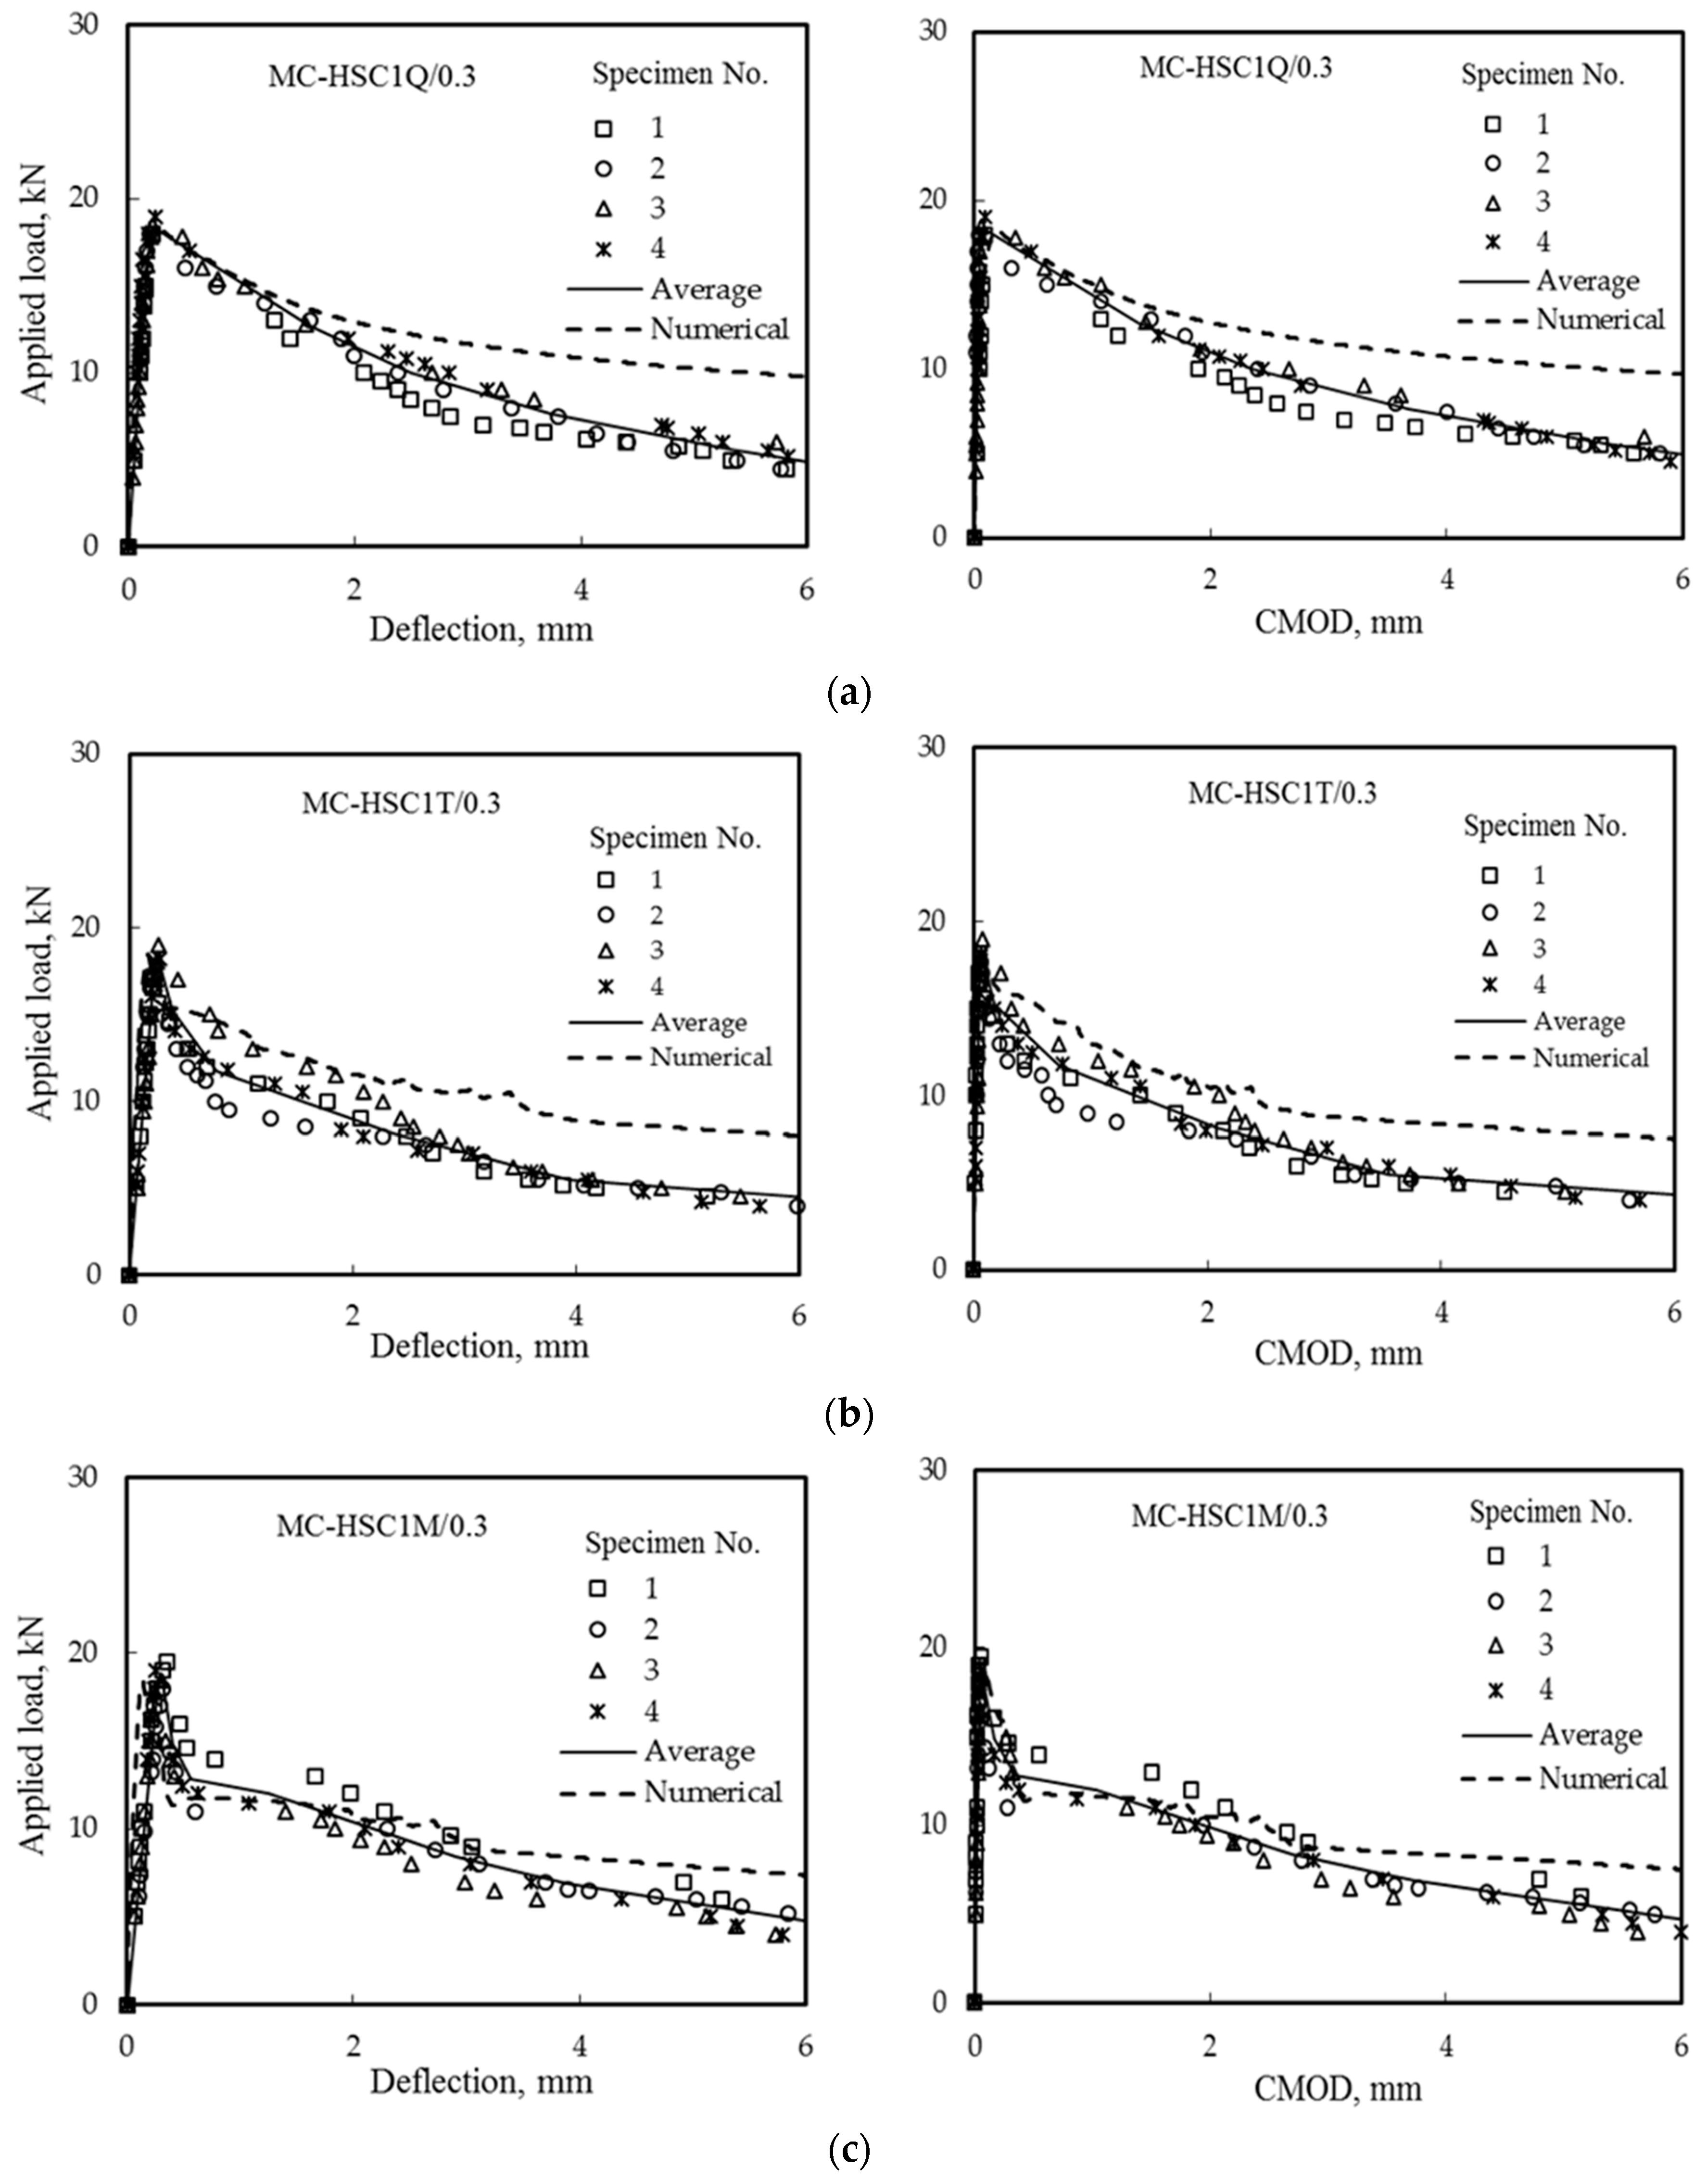
4.1. Numerical Results
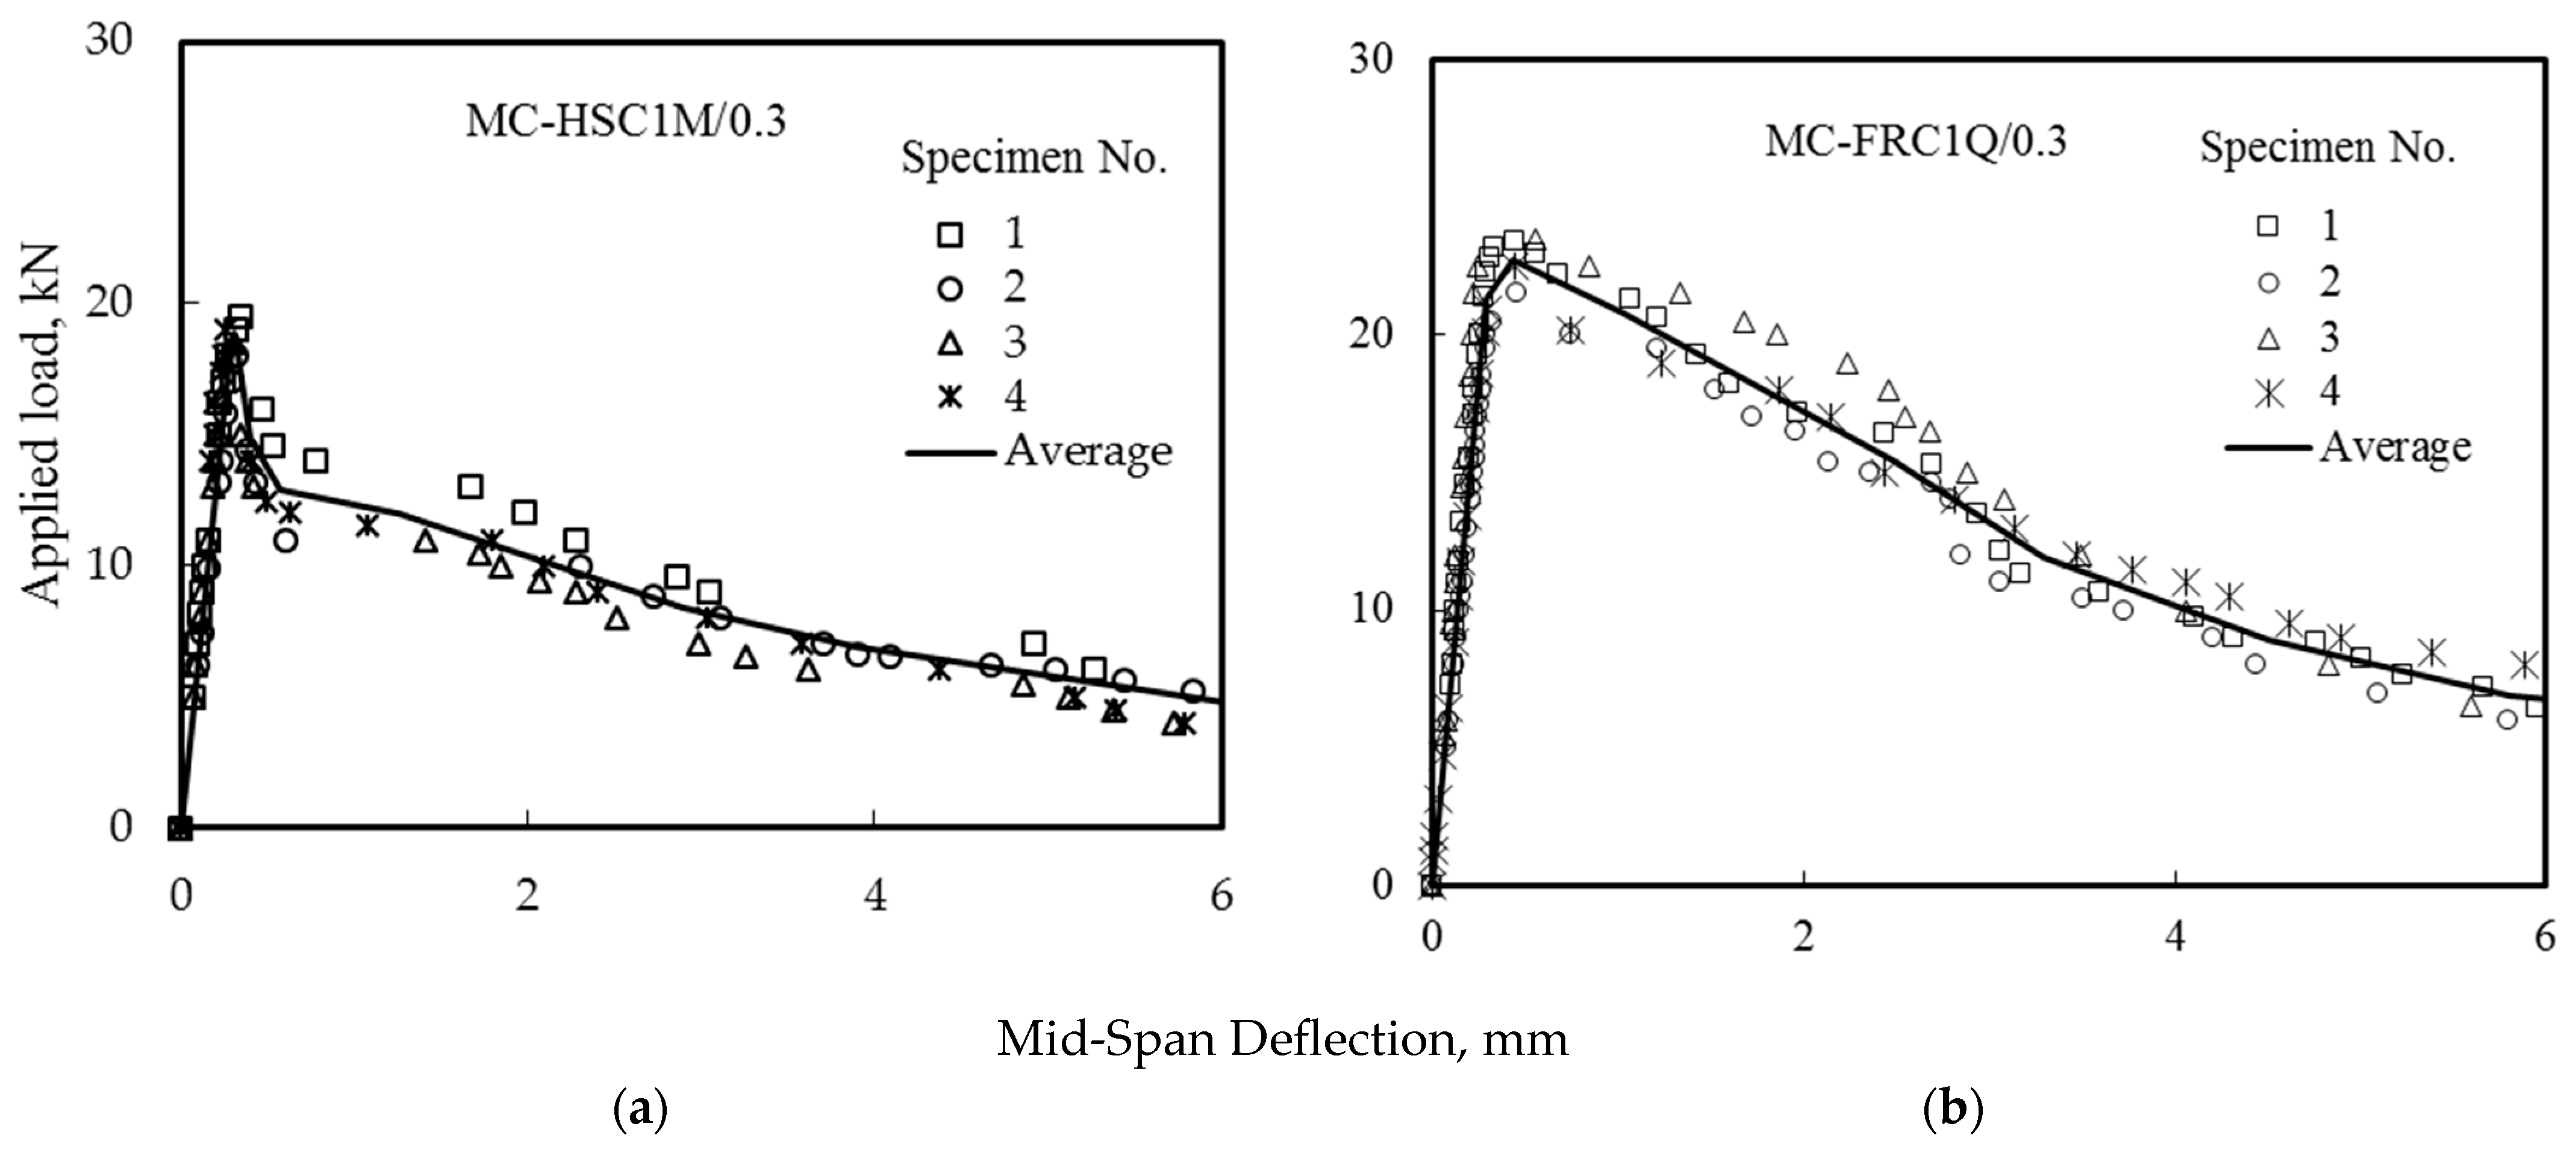
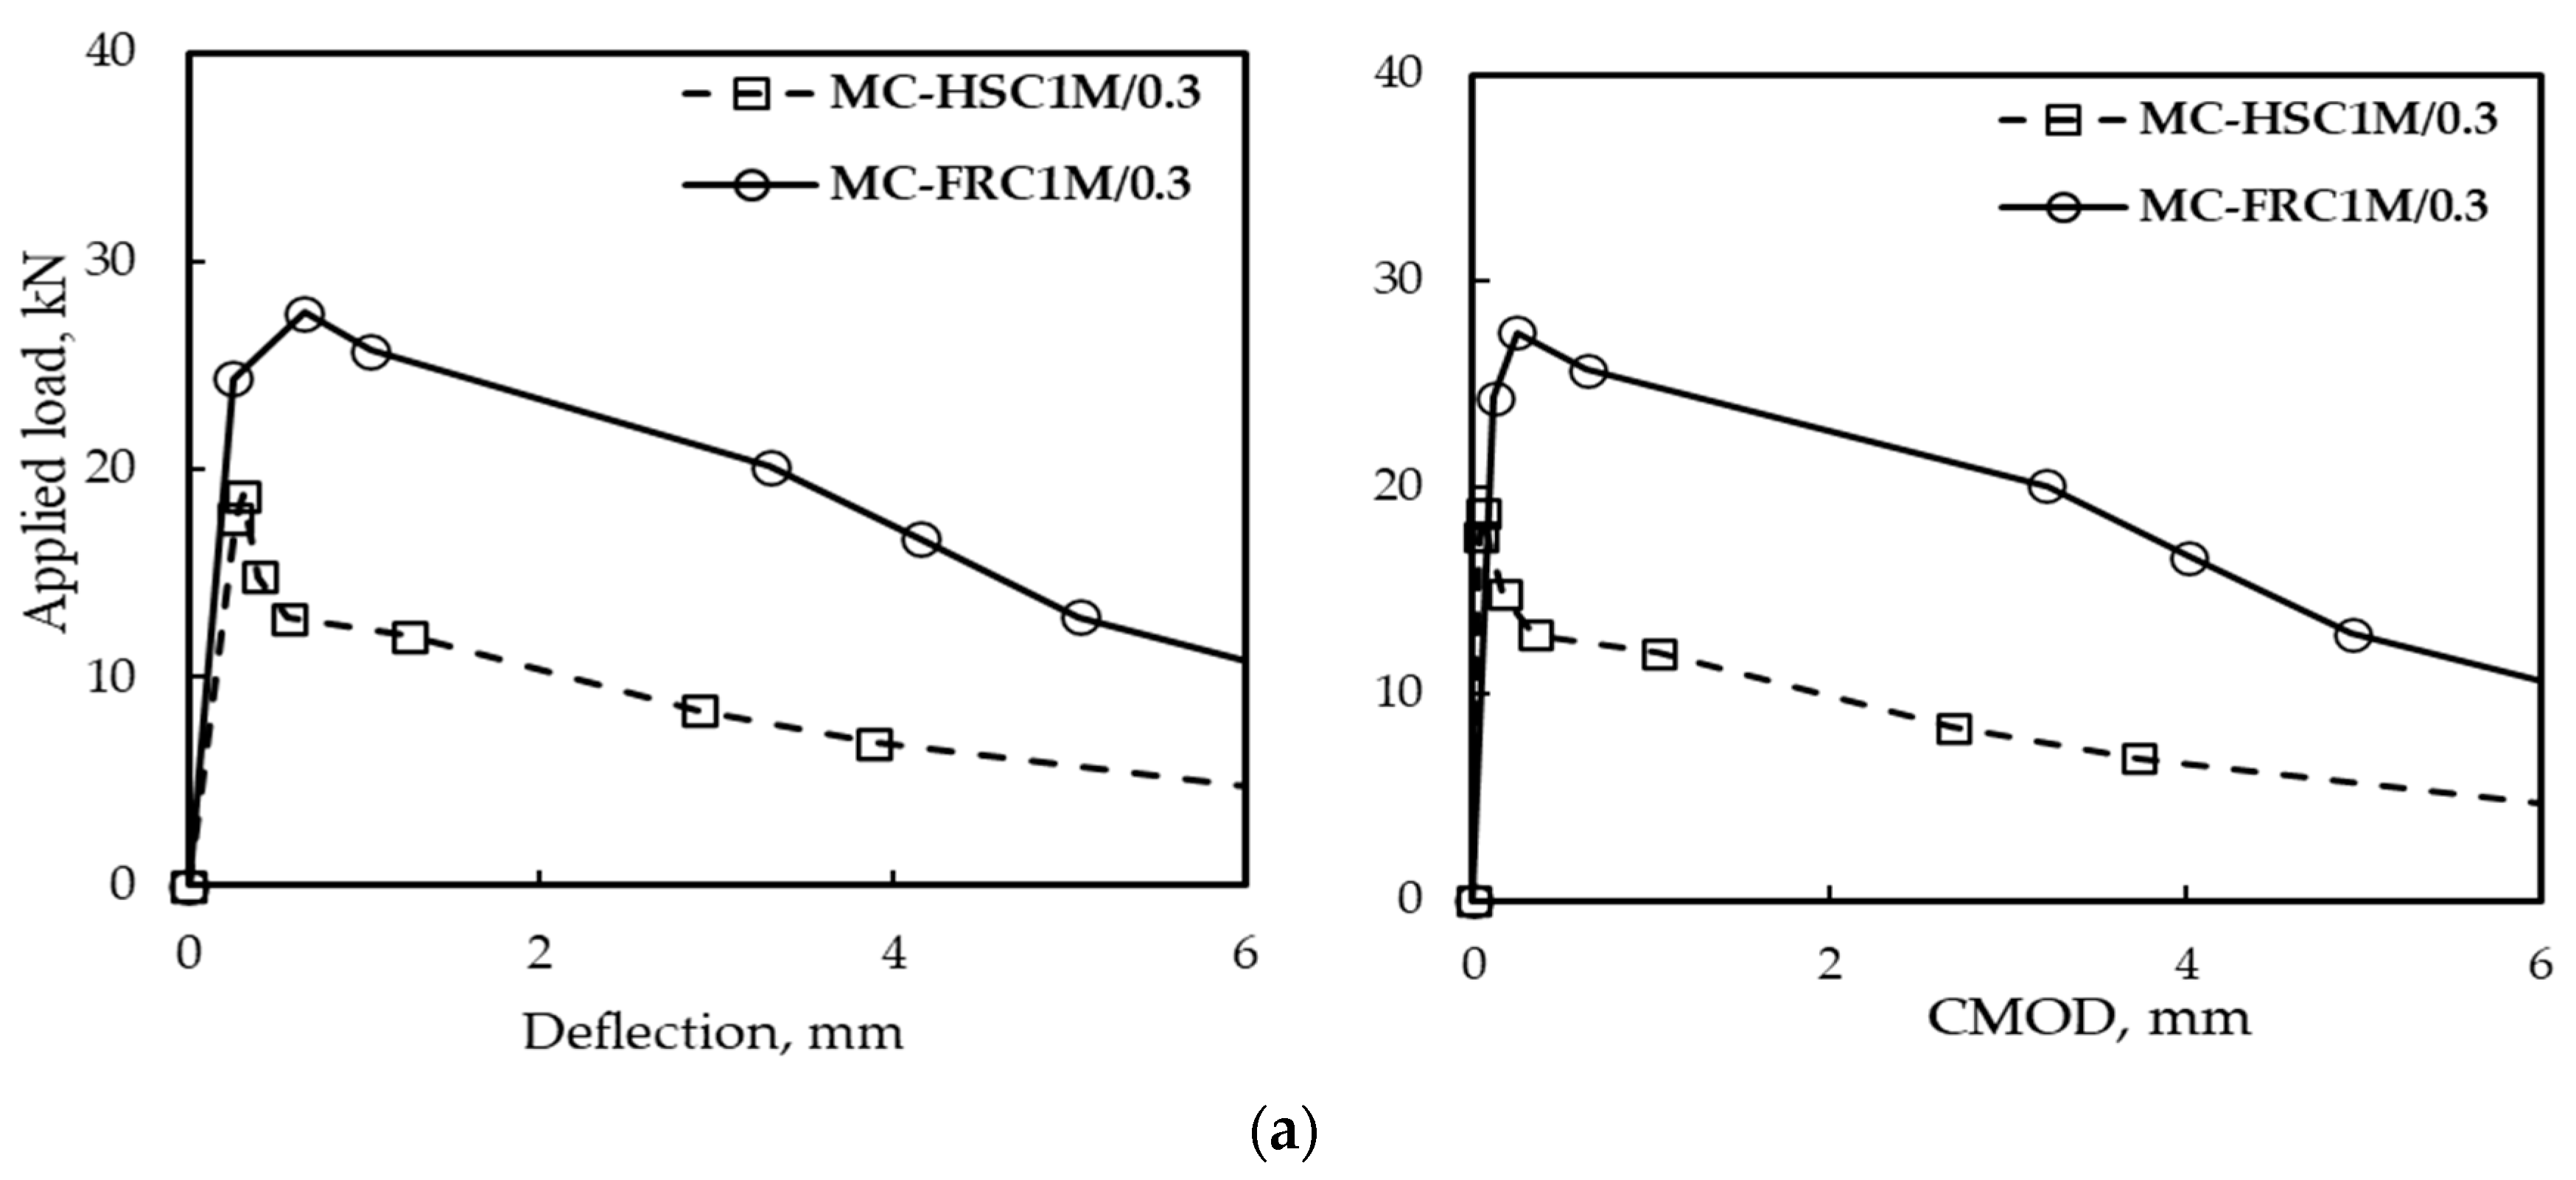
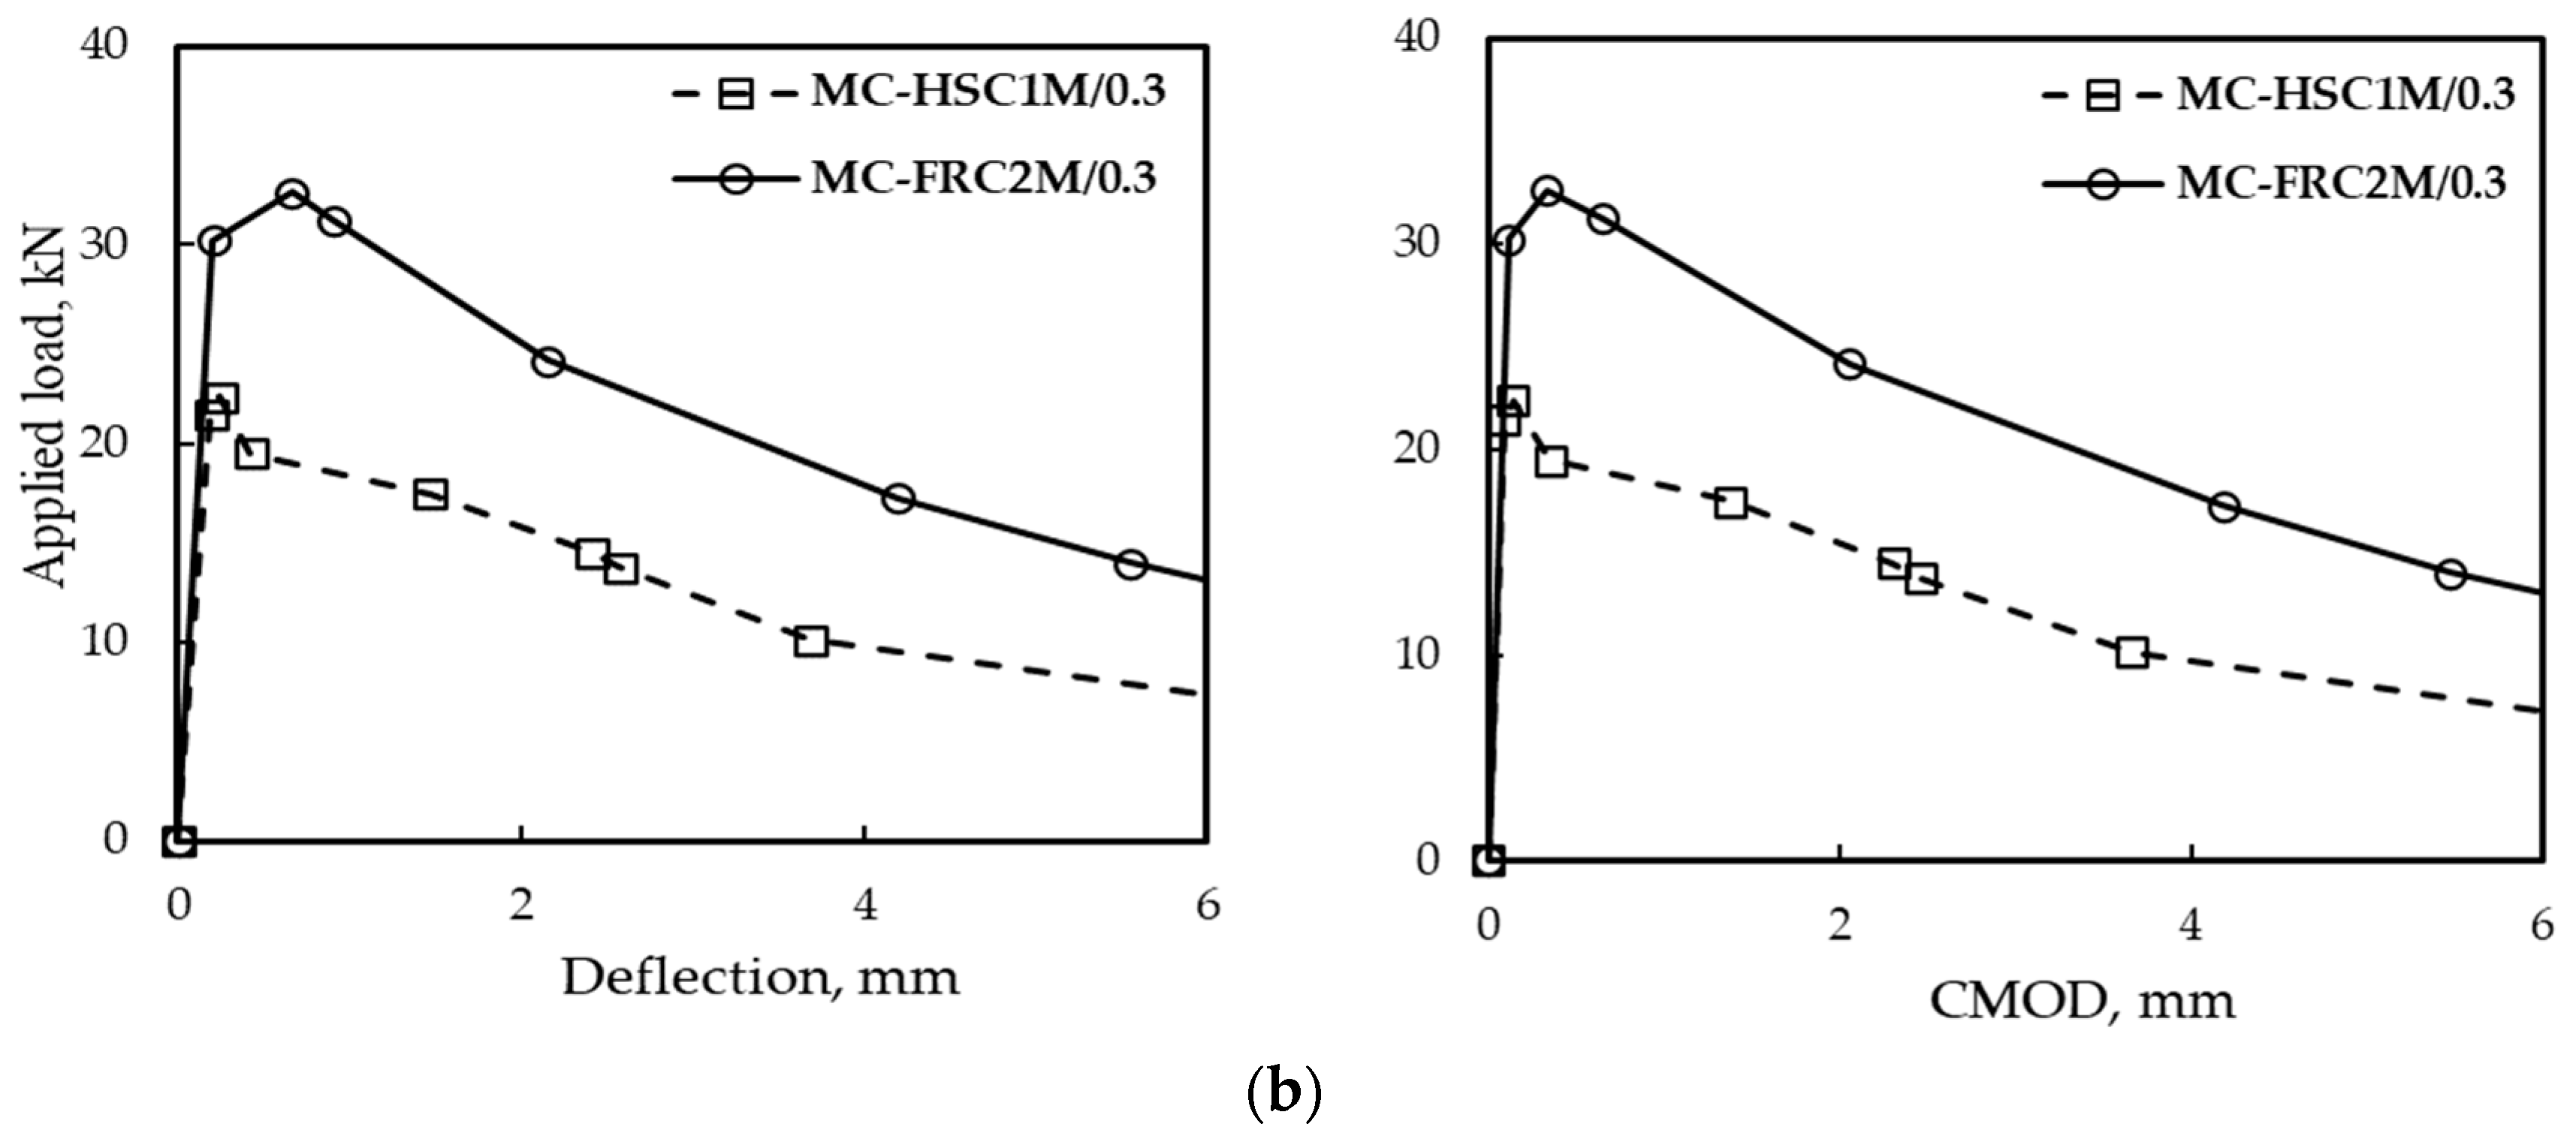
4.2. Experimental Results
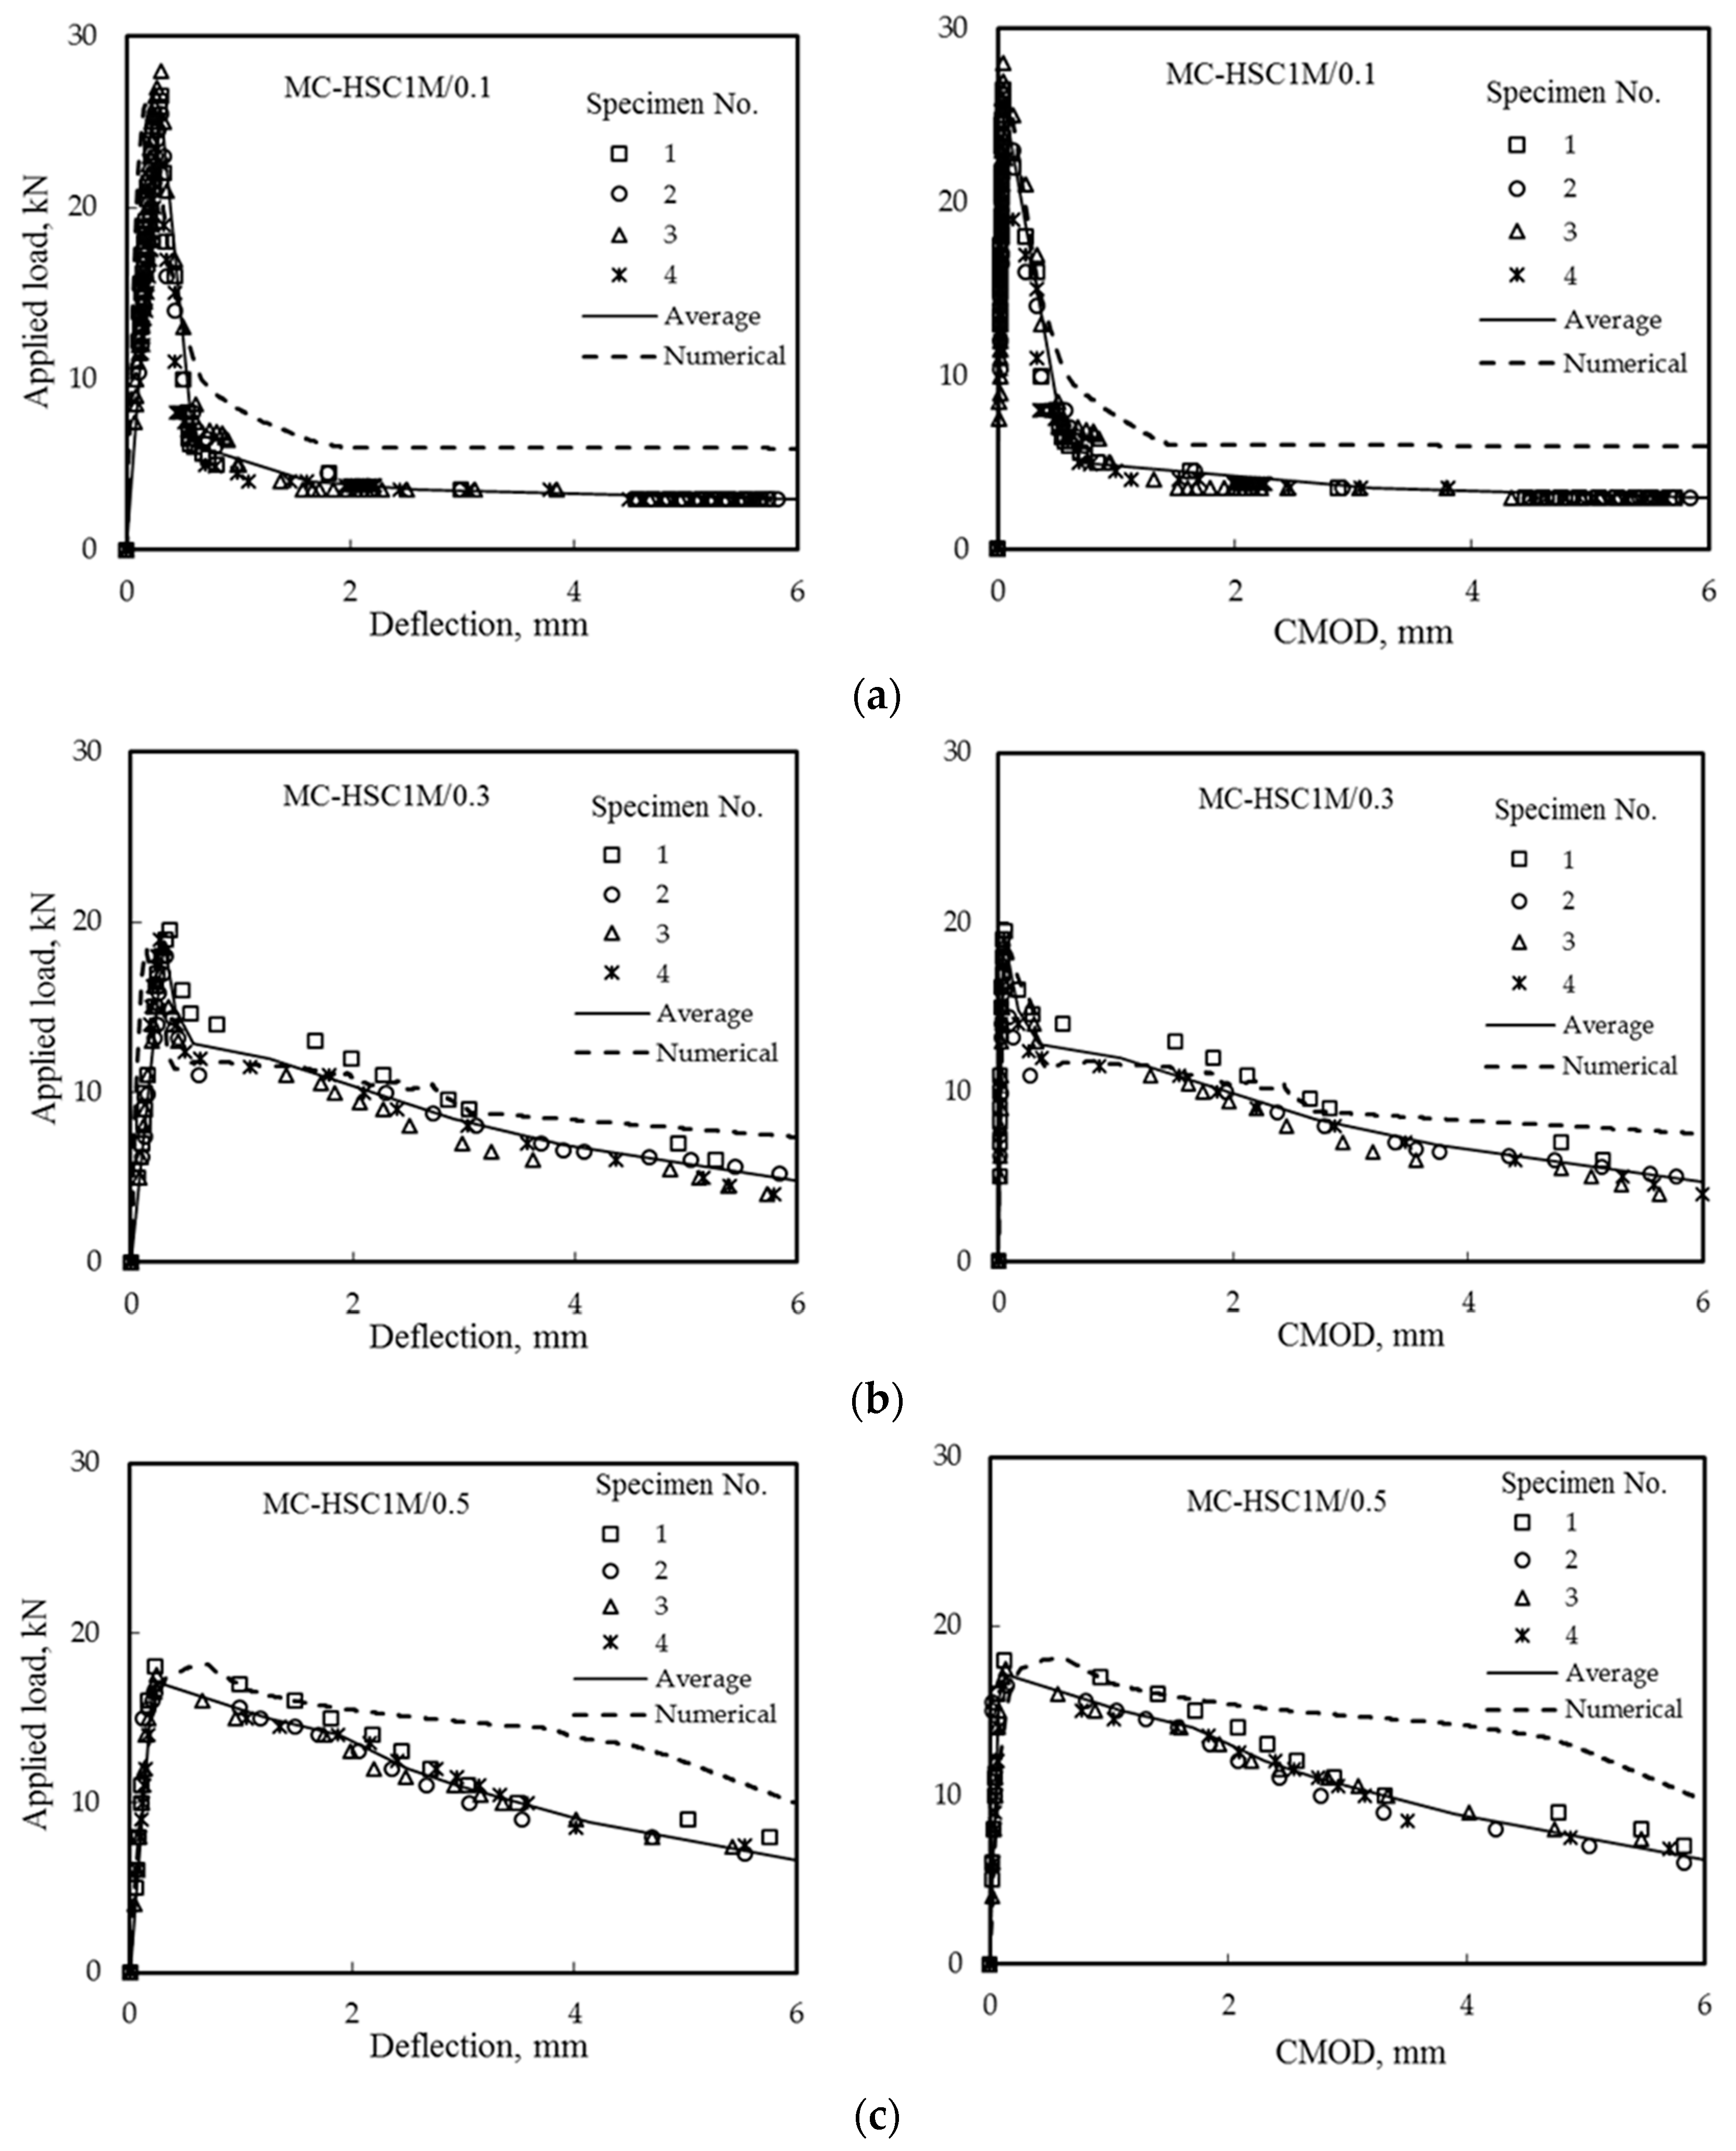
4.3. A Comparison between Experimental and Numerical Results
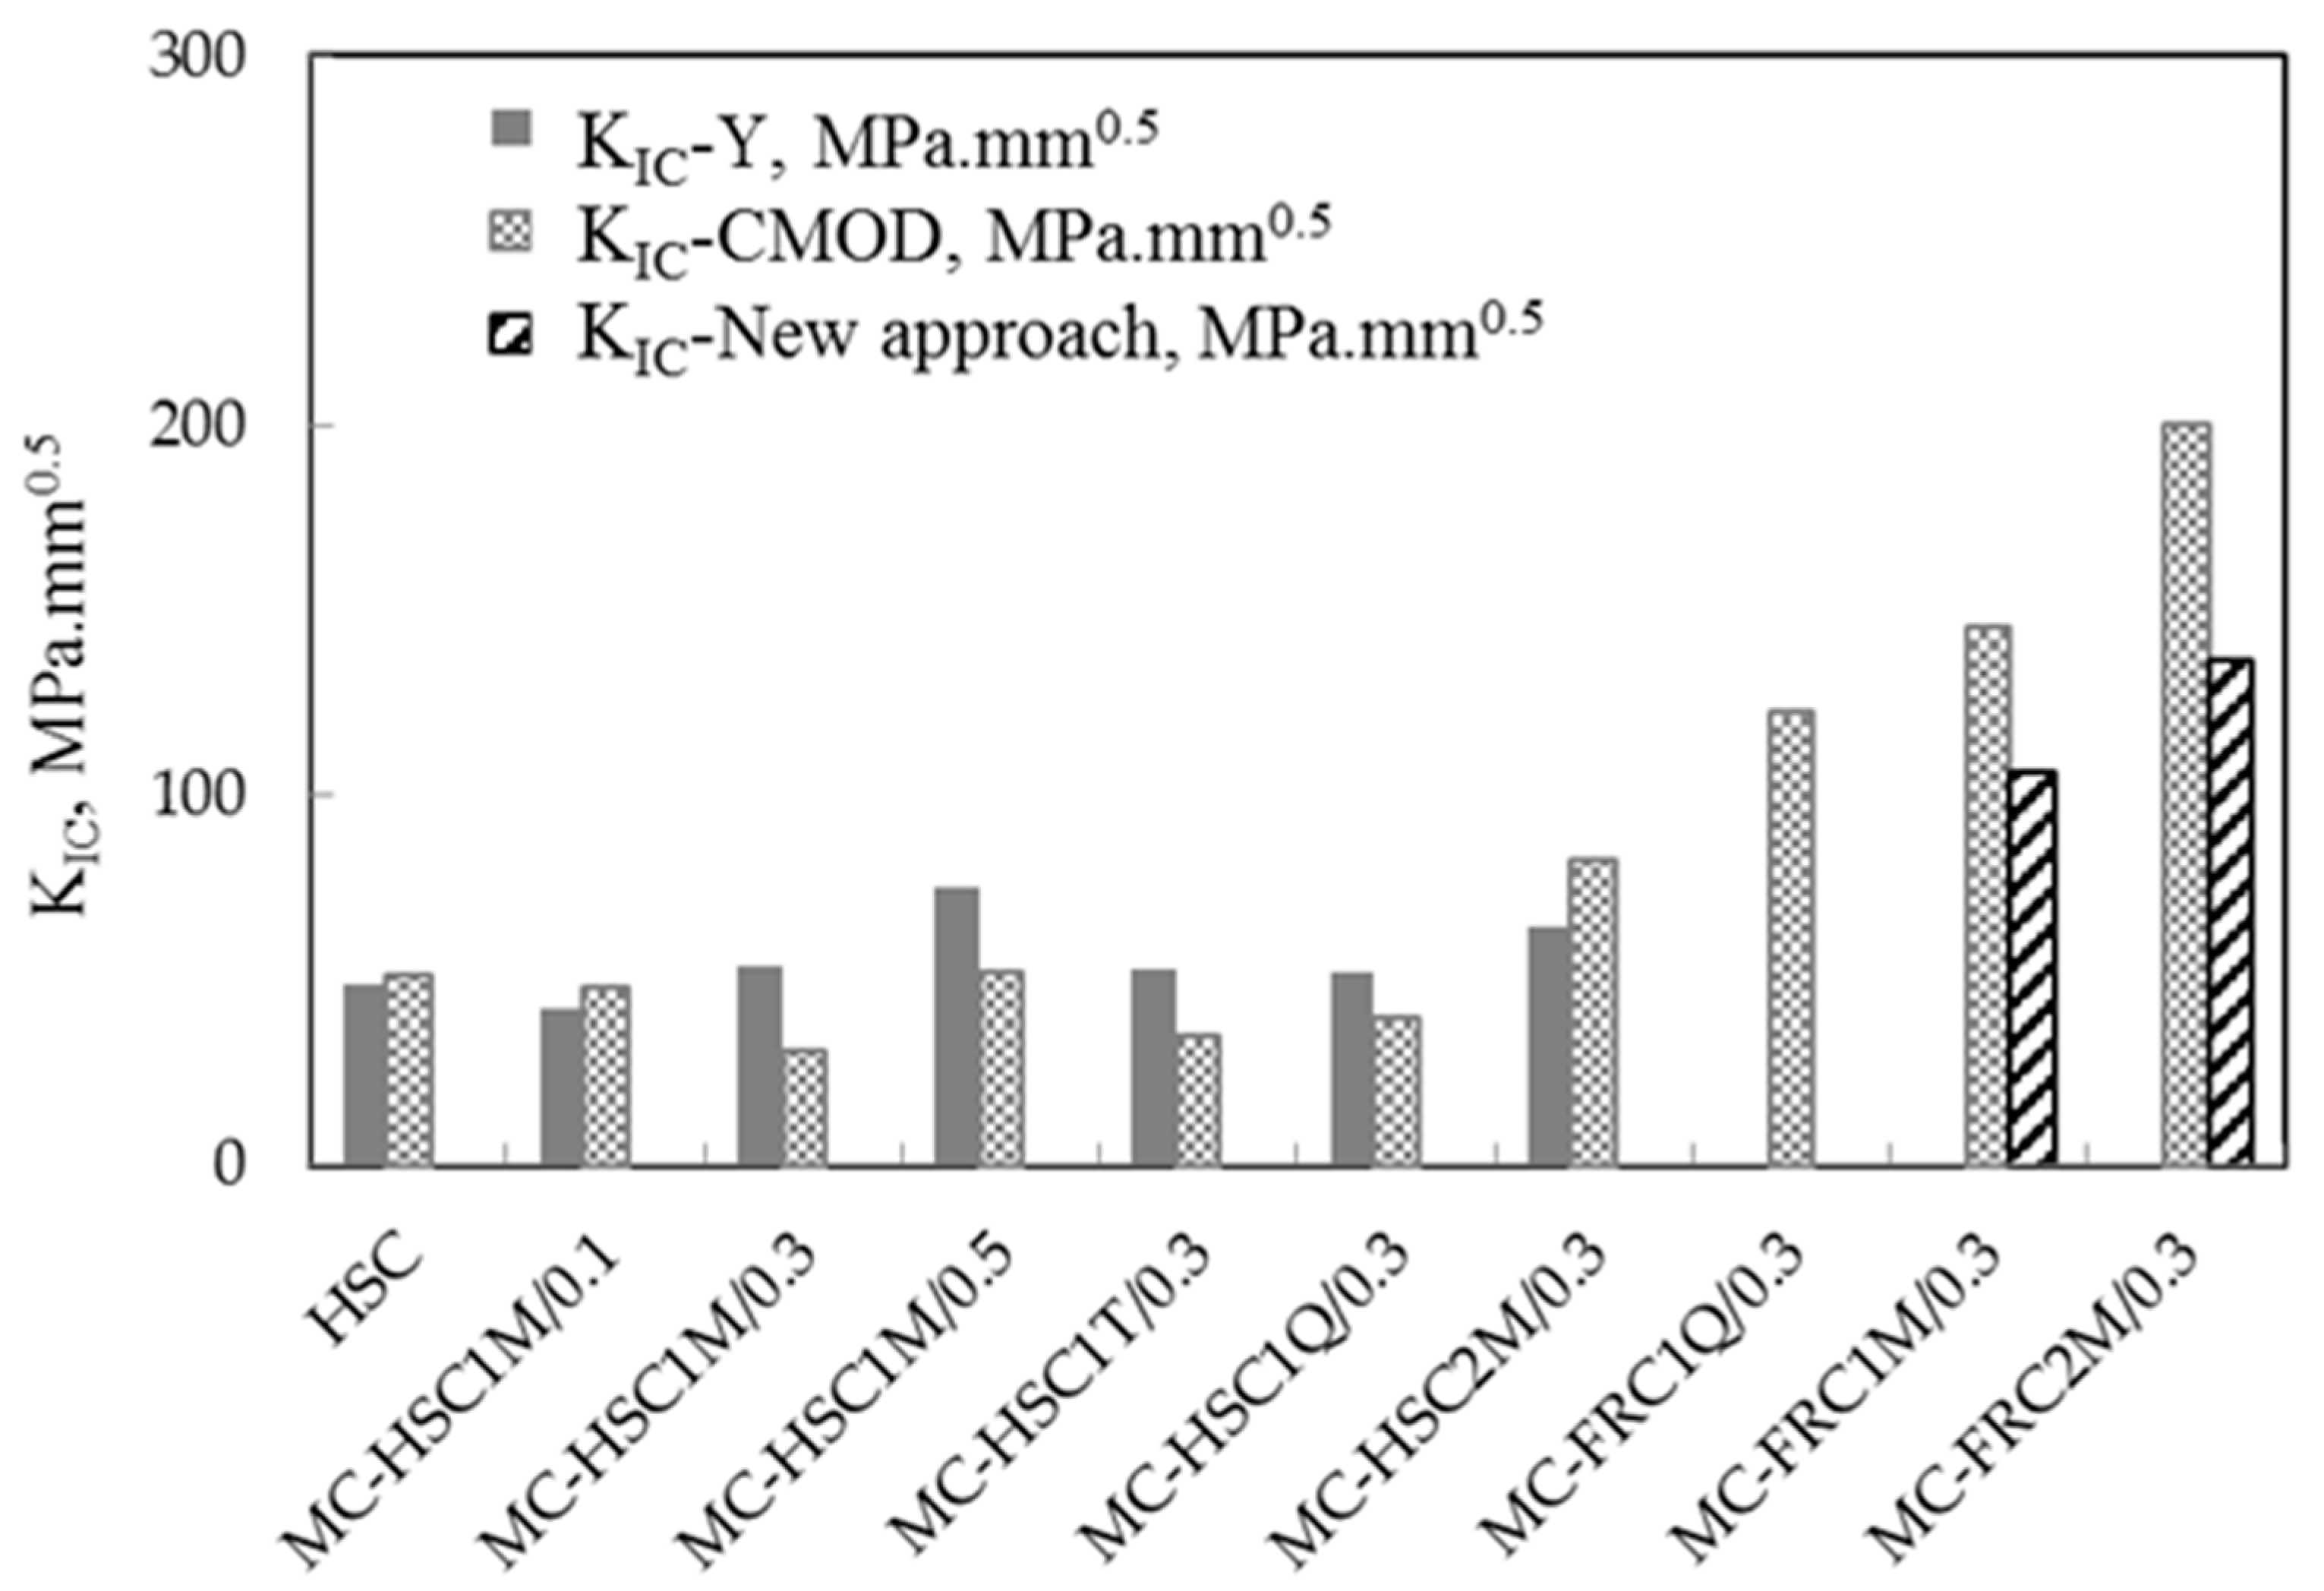
4.4. Fracture Toughness Calculation
- The energy required to initiate the crack is calculated by the difference in the area under the load–deflection curve between the Un-Crack (UC) beam and the MC beam up to the point where the crack will be initiated (dw);
- The dw value is divided by the crack surface area (dA) to obtain GIC;
- The fracture toughness KIC is then calculated by the following.
5. Conclusions
- The MC beam specimen was an excellent approach to measure the realistic fracture toughness because it considers the effect of fiber bridges on the pre-crack surfaces;
- As expected, increasing fiber content increases the KIC of the tested beams;
- The arrangement of the short hooked-end steel fibers critically affects the fracture toughness of fibrous composites. Based on the results of three arrangements used in this study, i.e., 50:50, 33:67, and 25:75, the best arrangement of such fibers to improve the beam fracture toughness is the symmetry around the crack surface. This may be due to the uniform distribution of closing reactions resulting from such an arrangement;
- A 25:75 fiber arrangement gradually leads to a drop after the peak load and gives higher areas under the curves which exhibited more energy absorption (toughness) until failure;
- Using a 50:50 fiber arrangement gives the largest values of KIC while a 25:75 fiber arrangement gives the smallest (critical) value of the KIC;
- The difference between the predicted values obtained numerically and those correspondingly measured experimentally ranged between 0.31% and 6.07%. Therefore, it can be concluded that there is a good agreement between the experimental and numerical results of the load–deflection and load–CMOD behavior of MC-tested beams.
Author Contributions
Funding
Data Availability Statement
Conflicts of Interest
References
- ACI 544.4R-18; Guide for Design with Fiber-Reinforced Concrete. American Concrete Institute: Farmington Hills, MI, USA, 2018; pp. 1–33.
- Naaman, A.E. Fiber Reinforced Cement and Concrete Composites, 1st ed.; Techno-Press 3000: Sarasota, FL, USA, 2018. [Google Scholar]
- Shaaban, I.G.; Said, M.; Khan, S.U.; Eissa, M.; Elrashidy, K. Experimental and theoretical behaviour of reinforced concrete beams containing hybrid fibres. Structures 2021, 32, 2143–2160. [Google Scholar] [CrossRef]
- Kachanov, M. In Fracture Toughness and Fracture Energy of Concrete; Elsevier: Amsterdam, The Netherlands, 1985. [Google Scholar]
- Shah, S.P.; Swartz, S.E.; Ouyang, C. Fracture Mechanics of Concrete: Applications of Fracture Mechanics to Concrete, Rock and Other Quasi-Brittle Materials; John Wiley & Sons: Hoboken, NJ, USA, 1995. [Google Scholar]
- Shah, S.P. Measurement and modeling of fracture processes in concrete. Mater. Sci. Concr. 1992, 243, III. [Google Scholar]
- Kaplan, M.F. Crack propagation and the fracture of concrete. J. Proc. 1961, 58, 591–610. [Google Scholar]
- Xu, S.; Reinhardt, H.W. A simplified method for determining double-K fracture parameters for three-point bending tests. Int. J. Fract. 2000, 104, 181–209. [Google Scholar] [CrossRef]
- Kumar, S.; Barai, S.V. Concrete Fracture Models and Applications; Springer-Verlag: Berlin/Heidelberg, Germany, 2011; 262p. [Google Scholar] [CrossRef]
- Ding, Y. Investigations into the relationship between deflection and crack mouth opening displacement of SFRC beam. Constr. Build. Mater. 2011, 25, 2432–2440. [Google Scholar] [CrossRef]
- Zhang, J.; Li, V.C. Simulation of crack propagation in fiber-reinforced concrete by fracture mechanics. Cem. Concr. Res. 2004, 34, 333–339. [Google Scholar] [CrossRef]
- Cox, B.N.; Marshall, D.B. Stable and unstable solutions for bridged cracks in various specimens. Acta Metall. Mater. 1991, 39, 579–589. [Google Scholar] [CrossRef]
- Accornero, F.; Rubino, A.; Carpinteri, A. A fracture mechanics approach to the design of hybrid-reinforced concrete beams. Eng. Fract. Mech. 2022, 275, 108821. [Google Scholar] [CrossRef]
- Accornero, F.; Rubino, A.; Carpinteri, A. Post-cracking regimes in the flexural behaviour of fibre-reinforced concrete beams. Int. J. Solids Struct. 2022, 248, 111637. [Google Scholar] [CrossRef]
- Accornero, F.; Rubino, A.; Carpinteri, A. Ultra-low cycle fatigue (ULCF) in fibre-reinforced concrete beams. Theor. Appl. Fract. Mech. 2022, 120, 103392. [Google Scholar] [CrossRef]
- El-Sagheer, I.; Abd-Elhady, A.A.; Sallam, H.E.M.; Naga, S.A.R. An assessment of ASTM E1922 for Measuring the Translaminar Fracture Toughness of LaminatedPolymer Matrix Composite Materials. Polym 2021, 13, 3129. [Google Scholar] [CrossRef]
- Elakhras, A.A.; Seleem, M.H.; Sallam, H.E.M. Intrinsic fracture toughness of fiber reinforced and functionally graded concretes: An innovative approach. Eng. Fract. Mech. 2021, 258, 108098. [Google Scholar] [CrossRef]
- Elakhras, A.A.; Seleem, M.H.; Sallam, H.E.M. Fracture toughness of matrix cracked FRC and FGC beams using equivalent TPFM. Frat. Ed IntegritÀ Strutt. 2022, 60, 73–88. [Google Scholar] [CrossRef]
- Elakhras, A.A.; Seleem, M.H.; Sallam, H.E.M. Real Fracture Toughness of FRC and FGC: Size and Boundary Effects. Arch. Civ. Mech. Eng. 2022, 22, 99. [Google Scholar] [CrossRef]
- Ali, A.Y.F.; El-Emam, H.M.; Seleem, M.H.; Sallam, H.E.M.; Moawad, M. Effect of crack and fiber length on mode I fracture toughness of matrix-cracked FRC beams. Constr. Build. Mater. 2022, 341, 127924. [Google Scholar] [CrossRef]
- Hussien, M.A.; Moawad, M.; Seleem, M.H.; Sallam, H.E.M.; El-Emam, H.M. Mixed-mode fracture toughness of high strength FRC: A realistic experimental approach. Arch. Civ. Mech. Eng. 2022, 22, 168. [Google Scholar] [CrossRef]
- El-Sagheer, I.; Abd-Elhady, A.A.; Sallam, H.E.M.; Naga, S.A.; Sayed, S.A.A. Flexural and fracture behaviors of functionally graded long fibrous polymeric composite beam-like specimens. Compos. Struct. 2022, 300, 116140. [Google Scholar] [CrossRef]
- Dassault, S. ABAQUS 6.14 Analysis User’s Manual; Dassault Systems: Providence, RI, USA, 2014. [Google Scholar]
- Tao, Z.; Wang, Z.-B.; Yu, Q. Finite element modelling of concrete-filled steel stub columns under axial compression. J. Constr. Steel. Res. 2013, 89, 121–131. [Google Scholar] [CrossRef]
- Rybicki, E.F.; Kanninen, M.F. A finite element calculation of stress intensity factors by a modified crack closure integral. Eng Fract Mech 1977, 9, 931–938. [Google Scholar] [CrossRef]
- Lee, S.-H.; Abolmaali, A.; Shin, K.-J.; Lee, H.-D. ABAQUS modeling for post-tensioned reinforced concrete beams. J. Build. Eng. 2020, 30, 101273. [Google Scholar] [CrossRef]
- Seow, P.E.C.; Swaddiwudhipong, S. Failure surface for concrete under multiaxial load—A unified approach. J. Mater. Civ. Eng. 2005, 17, 219–228. [Google Scholar] [CrossRef]
- Merwad, A.M.; El-Sisi, A.A.; Mustafa, S.A.A.; Sallam, H.E.-D.M. Lateral Impact Response of Rubberized-Fibrous Concrete-Filled Steel Tubular Columns: Experiment and Numerical Study. Buildings 2022, 12, 1566. [Google Scholar] [CrossRef]
- Carreira, D.J.; Chu, K.-H. Stress-strain relationship for reinforced concrete in tension. J. Proc. 1986, 83, 21–28. [Google Scholar]
- Rice, J.R. A Path Independent Integral and the Approximate Analysis of Strain Concentration by Notches and Cracks; ASME: New York, NY, USA, 1968. [Google Scholar]
- Tada, H. The Stress Analysis of Cracks Handbook; Paris Productions. Inc.: St. Louis, MI, USA, 1985. [Google Scholar]
- BS EN 12390–12393; Testing Hardened Concrete-Compressive Strength of Test Specimens, Part 3. British Standards: London, UK, 2009.
- BS EN 12390–12396; Testing Hardened Concrete. Tensile Splitting Strength of Test Specimens, Part 6. British Standards: London, UK, 2009.
- BS EN 12390–12395; Testing Hardened Concrete. Flexural Strength of Test Specimens, Part 5. British Standards: London, UK, 2009.
- Gettu, R.; Gardner, D.R.; Saldívar, H.; Barrag´an, B.E. Study of the distribution and orientation of fibers in SFRC specimens. Mater. Struct. Constr. 2005, 38, 31–37. [Google Scholar] [CrossRef]
- Martinie, L.; Roussel, N. Simple tools for fiber orientation prediction in industrial practice. Cem. Concr. Res. 2011, 41, 993–1000. [Google Scholar] [CrossRef]
- Lub, K.B.; Padmoes, T. Mechanical behavior of steel fiber-cement mortar in tension and flexure interpreted by Means of Statistics. Mater. J. 1989, 86, 16–28. [Google Scholar]
- Swamy, R.N. Fibre reinforcement of cement and concrete. Mater. Constr. 1975, 8, 235–254. [Google Scholar] [CrossRef]
- Wille, K.; Tue, N.V.; Parra-Montesinos, G.J. Fiber distribution and orientation in UHP-FRC beams and their effect on backward analysis. Mater. Struct. Constr. 2014, 47, 1825–1838. [Google Scholar] [CrossRef]
- Zandi, Y.; Husem, M.; Pul, S. Effect of distribution and orientation of steel fiber reinforced concrete. In Proceedings of the 4th WSEAS International Conference on Energy and Development Environment-Biomedicine, Corfu Island, Greece, 14 July 2011; pp. 260–264. [Google Scholar]
- Mubaraki, M.; Osman, S.A.; Sallam, H.E.M. Effect of RAP content on flexural behavior and fracture toughness of flexible pavement, Lat. Am. J. Solids Struct. 2019, 16, 177. [Google Scholar] [CrossRef]
- Othman, M.A.; El-Emam, H.M.; Seleem, M.H.; Sallam, H.E.M.; Moawad, M. Flexural behavior of functionally graded concrete beams with different patterns. Archiv. Civ. Mech. Eng. 2021, 21, 169. [Google Scholar] [CrossRef]


| Property | Results |
|---|---|
| Color | Creamy appearance, viscous liquid |
| Specific gravity | 2.20 |
| Specific surface area | 17.8 × 10³ kg/m2 |
| Particle size | 0.1 µm |
| Base | Modified Poly Carboxylic Ether |
|---|---|
| Appearance | Creamy appearance, viscous liquid |
| Specific gravity | 1.06–1.07 kg/m3 at 25 °C |
| PH | 5–8 |
| Chloride ion | Less than 0.1% w/v (nil) |
| Air entrainment | Less than 5 g/L (nil) |
| Sulfate content | Less than 1 g/L (nil) |
| Property | Dolomite | Sand |
|---|---|---|
| Nominal maximum aggregate size Specific gravity Gs | 14 mm 2.65 | 2.36 mm 2.60 |
| Bulk density γbulk | 1.56 | 1.61 |
| Fineness modulus | 5.85 | 2.4 |
| Mix | Cement (kg/m3) | Dolomite (kg/m3) | Sand (kg/m3) | Water (kg/m3) | Silica Fume (kg/m3) | Superplasticizer (kg/m3) | Steel Fiber (kg/m3) |
|---|---|---|---|---|---|---|---|
| HSC | 500 | 970 | 720 | 171 | 50 | 6 | - |
| FRC1 | 500 | 950 | 712 | 171 | 50 | 6 | 78.5 |
| FRC2 | 500 | 930 | 706 | 171 | 50 | 6 | 157 |
| Property | HSC | FRC1 | FRC2 |
|---|---|---|---|
| Compressive strength, MPa | 69.63 | 70.96 | 73.77 |
| Tensile strength, MPa | 3.30 | 5.73 | 7.66 |
| Flexure strength, MPa | 6.50 | 7.70 | 8.40 |
| Slump, mm | 110 | 95 | 80 |
| Beam Study Category | Beam Pattern Code | Relative Crack Depth Ratio, α | Fiber Location on MC Surface | Fiber Ratio % |
|---|---|---|---|---|
| HSC | - | - | - | |
| 1st | FRC1 | - | Random | 1 |
| FRC2 | - | Random | 2 | |
| TTC-HSC/0.3 | 0.30 | - | - | |
| MC-HSC1Q/0.3 | 0.30 | 0.25:0.75 | 1 | |
| MC-HSC1T/0.3 | 0.30 | 0.33:0.67 | 1 | |
| 2nd | MC-HSC1M/0.3 | 0.30 | 0.50:0.50 | 1 |
| MC-HSC1M/0.1 | 0.10 | 0.50:0.50 | 1 | |
| MC-HSC1M/0.5 | 0.50 | 0.50:0.50 | 1 | |
| MC-HSC2M/0.3 | 0.30 | 0.50:0.50 | 2 | |
| MC-FRC1Q/0.3 | 0.30 | 0.25:0.75 | 1 | |
| 3th | MC-FRC1M/0.3 | 0.30 | 0.50:0.50 | 1 |
| MC-FRC2M/0.3 | 0.30 | 0.50:0.50 | 2 | |
| Symbols | Fiber location on the MC; middle (M), one-third (T), and quarter (Q) | |||
| Beam ID | Maximum Load, kN | Deflection, mm | CMOD, mm | Slope, N/mm (P/δ) | Ascending * Energy, N.mm | Descending ** Energy, N.mm | Average Maximum Load, kN | SD ***, kN | CoV % + | Numerical Corresponding Values, kN | Error % ++ |
|---|---|---|---|---|---|---|---|---|---|---|---|
| MC-HSC1M/0.1 | 26.50 | 0.31 | 0.05 | 87,330 | 4060 | 23,740 | 25.63 | 2.32 | 9.06 | 26.05 | 1.64 |
| 25.50 | 0.31 | 0.04 | 85,070 | 4130 | 24,920 | ||||||
| 28.00 | 0.31 | 0.04 | 89,460 | 4900 | 24,140 | ||||||
| 22.50 | 0.30 | 0.07 | 74,260 | 3730 | 21,320 | ||||||
| MC-HSC1M/0.3 | 19.50 | 0.35 | 0.06 | 61,090 | 3670 | 54,960 | 18.75 | 0.65 | 3.44 | 18.46 | −1.56 |
| 18.00 | 0.32 | 0.04 | 57,820 | 2870 | 47,440 | ||||||
| 18.50 | 0.30 | 0.06 | 71,430 | 3130 | 44,290 | ||||||
| 19.00 | 0.26 | 0.05 | 73,770 | 2460 | 47,230 | ||||||
| MC-HSC1M/0.5 | 18.00 | 0.23 | 0.12 | 94,120 | 2340 | 68,950 | 17.13 | 0.75 | 4.38 | 18.16 | 6.07 |
| 16.50 | 0.23 | 0.14 | 80,000 | 2060 | 64,020 | ||||||
| 17.50 | 0.24 | 0.13 | 76,920 | 1500 | 64,450 | ||||||
| 16.50 | 0.24 | 0.12 | 84,340 | 2210 | 68,010 |
| Beam ID | Maximum Load, kN | Deflection, mm | CMOD, mm | Slope, N/mm (P/δ) | Ascending Energy, N.mm | Descending Energy, N.mm | Average Maximum Load, kN | S.D., kN | CoV % | Numerical Corresponding Values, kN | Error % |
|---|---|---|---|---|---|---|---|---|---|---|---|
| MC-HSC1Q/0.3 | 18 | 0.216 | 0.071 | 89,000 | 2160 | 49,600 | 18.00 | 0.41 | 2.27 | 18.25 | 1.37 |
| 18 | 0.187 | 0.061 | 100,590 | 1750 | 54,880 | ||||||
| 18.5 | 0.213 | 0.079 | 84,230 | 2020 | 57,650 | ||||||
| 17.5 | 0.241 | 0.06 | 86,210 | 2770 | 59,900 | ||||||
| MC-HSC1T/0.3 | 18.4 | 0.224 | 0.059 | 81,280 | 2040 | 43,050 | 18.40 | 0.43 | 2.35 | 18.46 | 0.31 |
| 18 | 0.205 | 0.064 | 93,220 | 1930 | 41,230 | ||||||
| 19 | 0.26 | 0.070 | 75,000 | 2530 | 48,660 | ||||||
| 18.2 | 0.264 | 0.066 | 76,600 | 2640 | 41,170 | ||||||
| MC-HSC1M/0.3 | 19.50 | 0.35 | 0.061 | 61,090 | 3670 | 54,960 | 18.75 | 0.65 | 3.44 | 18.46 | 1.56 |
| 18.00 | 0.32 | 0.042 | 57,820 | 2870 | 47,440 | ||||||
| 18.50 | 0.30 | 0.063 | 71,430 | 3130 | 44,290 | ||||||
| 19.00 | 0.26 | 0.05 | 73,770 | 2460 | 47,230 |
| Beam ID | Peak Load, kN | Flexure Strength, MPa | KIc-Y, MPa.mm0.5 | KIC-CmOD, MPa.mm0.5 | KIC-New Approch *, MPa.mm0.5 |
|---|---|---|---|---|---|
| HSC | 17.550 | 3.51 | 48.5 | 51.2 | - |
| MC-HSC1M/0.1 | 25.625 | 5.13 | 42.2 | 47.8 | - |
| MC-HSC1M/0.3 | 18.750 | 3.75 | 54.1 | 30.4 | - |
| MC-HSC1M/0.5 | 17.125 | 3.43 | 75.3 | 52.4 | - |
| MC-HSC1T/0.3 | 18.400 | 3.68 | 53.1 | 34.9 | - |
| MC-HSC1Q/0.3 | 18.000 | 3.60 | 51.9 | 40.2 | - |
| MC-HSC2M/0.3 | 22.375 | 4.48 | 64.5 | 82.2 | - |
| MC-FRC1Q/0.3 | 22.720 | 4.54 | 65.5 | 122.3 | - |
| MC-FRC1M/0.3 | 27.500 | 5.50 | 79.3 | 145.4 | 106.3 |
| MC-FRC2M/0.3 | 32.625 | 6.53 | 94.1 | 200.1 | 136.3 |
Disclaimer/Publisher’s Note: The statements, opinions and data contained in all publications are solely those of the individual author(s) and contributor(s) and not of MDPI and/or the editor(s). MDPI and/or the editor(s) disclaim responsibility for any injury to people or property resulting from any ideas, methods, instructions or products referred to in the content. |
© 2023 by the authors. Licensee MDPI, Basel, Switzerland. This article is an open access article distributed under the terms and conditions of the Creative Commons Attribution (CC BY) license (https://creativecommons.org/licenses/by/4.0/).
Share and Cite
Abdallah, M.A.; Elakhras, A.A.; Reda, R.M.; Sallam, H.E.-D.M.; Moawad, M. Applicability of CMOD to Obtain the Actual Fracture Toughness of Rightly-Cracked Fibrous Concrete Beams. Buildings 2023, 13, 2010. https://doi.org/10.3390/buildings13082010
Abdallah MA, Elakhras AA, Reda RM, Sallam HE-DM, Moawad M. Applicability of CMOD to Obtain the Actual Fracture Toughness of Rightly-Cracked Fibrous Concrete Beams. Buildings. 2023; 13(8):2010. https://doi.org/10.3390/buildings13082010
Chicago/Turabian StyleAbdallah, Mahmoud A., Ahmed A. Elakhras, Ramy M. Reda, Hossam El-Din M. Sallam, and Mohamed Moawad. 2023. "Applicability of CMOD to Obtain the Actual Fracture Toughness of Rightly-Cracked Fibrous Concrete Beams" Buildings 13, no. 8: 2010. https://doi.org/10.3390/buildings13082010