
Strategies for LEED-NC-Certified Projects in Germany and Results of Their Life Cycle Assessment


Department of Civil Engineering, Ariel University, Ariel 40700, Israel
Buildings 2023, 13(8), 1970; https://doi.org/10.3390/buildings13081970
Submission received: 31 May 2023
/
Revised: 16 July 2023
/
Accepted: 31 July 2023
/
Published: 1 August 2023
(This article belongs to the Section Building Energy, Physics, Environment, and Systems)
Abstract
:The aim of this study was to investigate strategies for the certification of environmentally friendly office buildings in Germany. A total of 39 LEED-NC gold-certified office space projects were ranked according to their “optimize energy performance” credit (EAc1) achievements from the energy and atmosphere (EA) category and divided into two groups: 13 projects (group 1) with the highest and 13 projects (group 2) with the lowest EAc1 achievements. Nonparametric statistics were used to evaluate the differences between groups 1 and 2. A two-stage nested analysis of variance test was used to evaluate the differences between the two groups in terms of their life cycle assessment (LCA). A comparison of the two groups showed that group 1 outperformed group 2 in the EA category (p < 0.0001). However, in the other LEED categories, the differences between the two groups were not significant (p ≥ 0.0761). As a result, group 1 outperformed group 2 in terms of overall LEED points (p = 0.0048). The LCA of EAc1 showed that group 1 enacted the lowest environmental damage when compared to group 2 (p = 0.0040). The environmental assessment of LEED-certified projects can help green building managers choose the most sustainable certification strategy.
1. Introduction
1.1. LEED Certification Strategies in Different Countries
Leadership in Energy and Environmental Design (LEED) is one of the most well-known environmental rating systems; developed in the United States, it has been widely adopted around the world. The adoption of LEED in foreign countries is due to the flexibility of this certification system. LEED has five main categories—sustainable sites (SS), water efficiency (WE), energy and atmosphere (EA), materials and resources (MR), and indoor environmental quality (EQ)—and two additional categories—innovation in design (ID) and regional priority (RP). Each category has several prerequisites and credits. Each credit can have a certain number of points. By adding up all these points, LEED projects can achieve one out of four certifications: certified (scores 40–49), silver (scores 50–59), gold (scores 60–79), or platinum (scores 80+) (Section 1.2 provides a summary of all prerequisites and credits for LEED-NC v3).
With such a variety of LEED categories and credits, each country can choose the certification strategy that best reflects its climate, demographics, building technologies, and natural resource availability [1,2]. Thus, it becomes clear that different countries may prefer different LEED certification strategies. For example, in the USA, the highest-priority category was EA, while, in China, the priority categories were SS and WE [3]. A comparison between Northern Europe and Southern Europe showed that Northern Europe outperformed Southern Europe in the EAc1 (optimize energy performance) credit [4]. In Vietnam, SS, WE, and EQ scored highly compared to the other categories [5]. In Turkey, SS and WE were higher priorities than the remaining categories [6]. A comparison of eight U.S. states showed different LEED certification strategies: six states used an EA-high emphasized strategy, while two states used a non-EA-moderate emphasized strategy [7].
Studying LEED-certified projects using inference statistics is a new direction in the science of green construction. In 2017 [8], one of the first studies using inferential statistics aggregated LEED data from six countries: the United States, China, Turkey, Brazil, Chile, and Germany and determined four levels of certification: certified, silver, gold, and platinum. With this research design, the strategies for LEED-certified projects in a single country could not be explored. In a 2018 study [9] on the performance of silver-to-gold cross-certification in LEED projects, the design framework included a comparison of two types of design: (i) four U.S. states were analyzed separately, and (ii) four U.S. states were analyzed as one group. The two different study designs led to different results. The first study design showed the unique properties for each U.S. state. In the second study design, the pooled data showed a result acceptable for only one of the four U.S. states. Therefore, the study of LEED-certified projects in a separate country is an urgent problem. In this context, these studies should use the same study design and the same inference statistics, so that different studies can be compared. These different LEED certification strategies that were revealed for different countries/states can lead to different environmental impacts. However, this problem is understandable, because it is a consequence of the previously noted features of each of the countries.
However, the problem is that, as has recently been shown [10,11,12], different LEED certification strategies in office buildings have been used at the state (California, USA), city (Shanghai, China), and borough (Manhattan, New York City) levels. Therefore, these different LEED certification strategies applied to the same country/state/city result in different life cycle assessments (LCA) of their environmental damage (Section 1.3 presents a summary of the LCA methodology). Therefore, the LCA of LEED-certified projects is a timely issue.
For example, California cities have used two different LEED certification strategies: low location and transportation (LT) and high EA or high LT and low EA [10]. In Shanghai, LEED certification strategies have used either high EA and low EQ achievements or low EA and high EQ achievements [11]. In Manhattan, two different LEED certification strategies have been used: either high EA and low MR achievements or low EA and high MR achievements [12]. In all three cases, different LEED certification strategies led to a different LCA of their environmental damage [10,11,12]. Thus, the use of different LEED certification strategies for office buildings should be explored in other countries.
In this regard, Germany is a country of particular interest, as it has the highest number of LEED New Construction (LEED-NC)-certified office space projects among the other European countries, such as Austria, Belgium, Bulgaria, the Czech Republic, Denmark, Finland, France, Greece, Hungary, Ireland, Italy, the Netherlands, Poland, Portugal, Slovakia, Spain, Sweden, Switzerland, and the United Kingdom [13].
It should be noted that, in Germany, the Deutsche Gesellschaft für Nachhaltiges Bauen (DGNB), developed by the German Sustainable Building Council, is the most representative national green rating system [14]. Similar to LEED, DGNB is based on indicators of different environmental area protections, such as responsible procurement and waste management. Unlike LEED, DGNB focuses more on protecting the economic sphere by introducing life cycle cost indicators and social protection, such as access for all and user security [15].
However, as mentioned earlier, the LEED certification adopted in various foreign countries is the focus of this study. This country is a signatory to the Paris Agreement on climate change and has set itself the goal of becoming carbon-neutral by 2050 [16]. Germany also signed the Montreal Protocol to decrease its ozone depletion potential (ODP) [17]. The country has a mandatory AgBB scheme that requires the measurement of volatile organic compounds (VOCs) contained in building materials [18]. German citizens have a high level of willingness to invest in renewable energy [19]. Germany’s current fuels for energy production come from about 50% renewable sources, such as wind, photovoltaic (PV), and bioenergy, and about 50% from fossil fuels, such as coal, natural gas, and oil [20]. This country is making substantial efforts toward the development of hydrogen vehicles and is committed to replacing its electricity system with fully renewable energy sources [21].
Therefore, it can be assumed that operational energy (OE) savings for the heating, cooling, and lighting needs of a building; the use of advanced refrigeration equipment to minimize ODP-related emissions such as chlorofluorocarbons (CFCs) and hydrochlorofluorocarbons (HCFCs); the replacement of fossil fuels with renewable; and the use of low-emission and fuel-efficient vehicles should be a priority for LEED certification in Germany. However, as mentioned earlier, there are countries where LEED certification has been achieved at the same certification level using different certification strategies [10,11,12].
This study continues to explore the issue of multiple LEED certification strategies in the same country to achieve the same level of certification. The main question addressed by this study is whether the same level of LEED certification in Germany means the same environmental impact evaluated using LCA.
1.2. LEED Prerequisites and Credits
Table 1 gives a summary of all prerequisites and credits for LEED-NC v3.
1.3. LCA Methodology
LCA is a “cradle-to-the-grave” method (the whole life cycle from raw material acquisition to final disposal is taken into account) that focuses on the products, as well as services, to evaluate all (theoretical) environmental impacts [22]. The overall structure of the LCA study is prepared by defining the purpose and scope by selecting a functional unit (FU) and a system boundary. Within the system boundary, inputs (raw materials and energy) and outputs (gases and wastes) are then collected for the FU in the life cycle inventory (LCI) phase. The contribution of the LCI to different environmental impact categories, such as climate change and acidification, is evaluated in the life cycle impact assessment (LCIA) phase. Converting LCI into LCIA becomes possible due to the applied scientific models [22].
A “cradle-to-the-grave” LCA of concrete elements includes (i) the design stage, (ii) the production/execution stage, (iii) the usage stage (operational energy and concrete element maintenance), and (iv) the end-of-life (demolition and recycling) stage [23]. However, depending on the application of the LCA, it is possible to conduct a partial LCA. For example, in order to compare LCAs of building material alternatives, only the production stage needs to be evaluated; to compare the LCAs of fuel sources for operational energy generation, only the usage phase must be assessed; and to compare the LCAs of building materials’ recycling options, only the end-of-life stage needs to be considered.
2. Materials and Methods
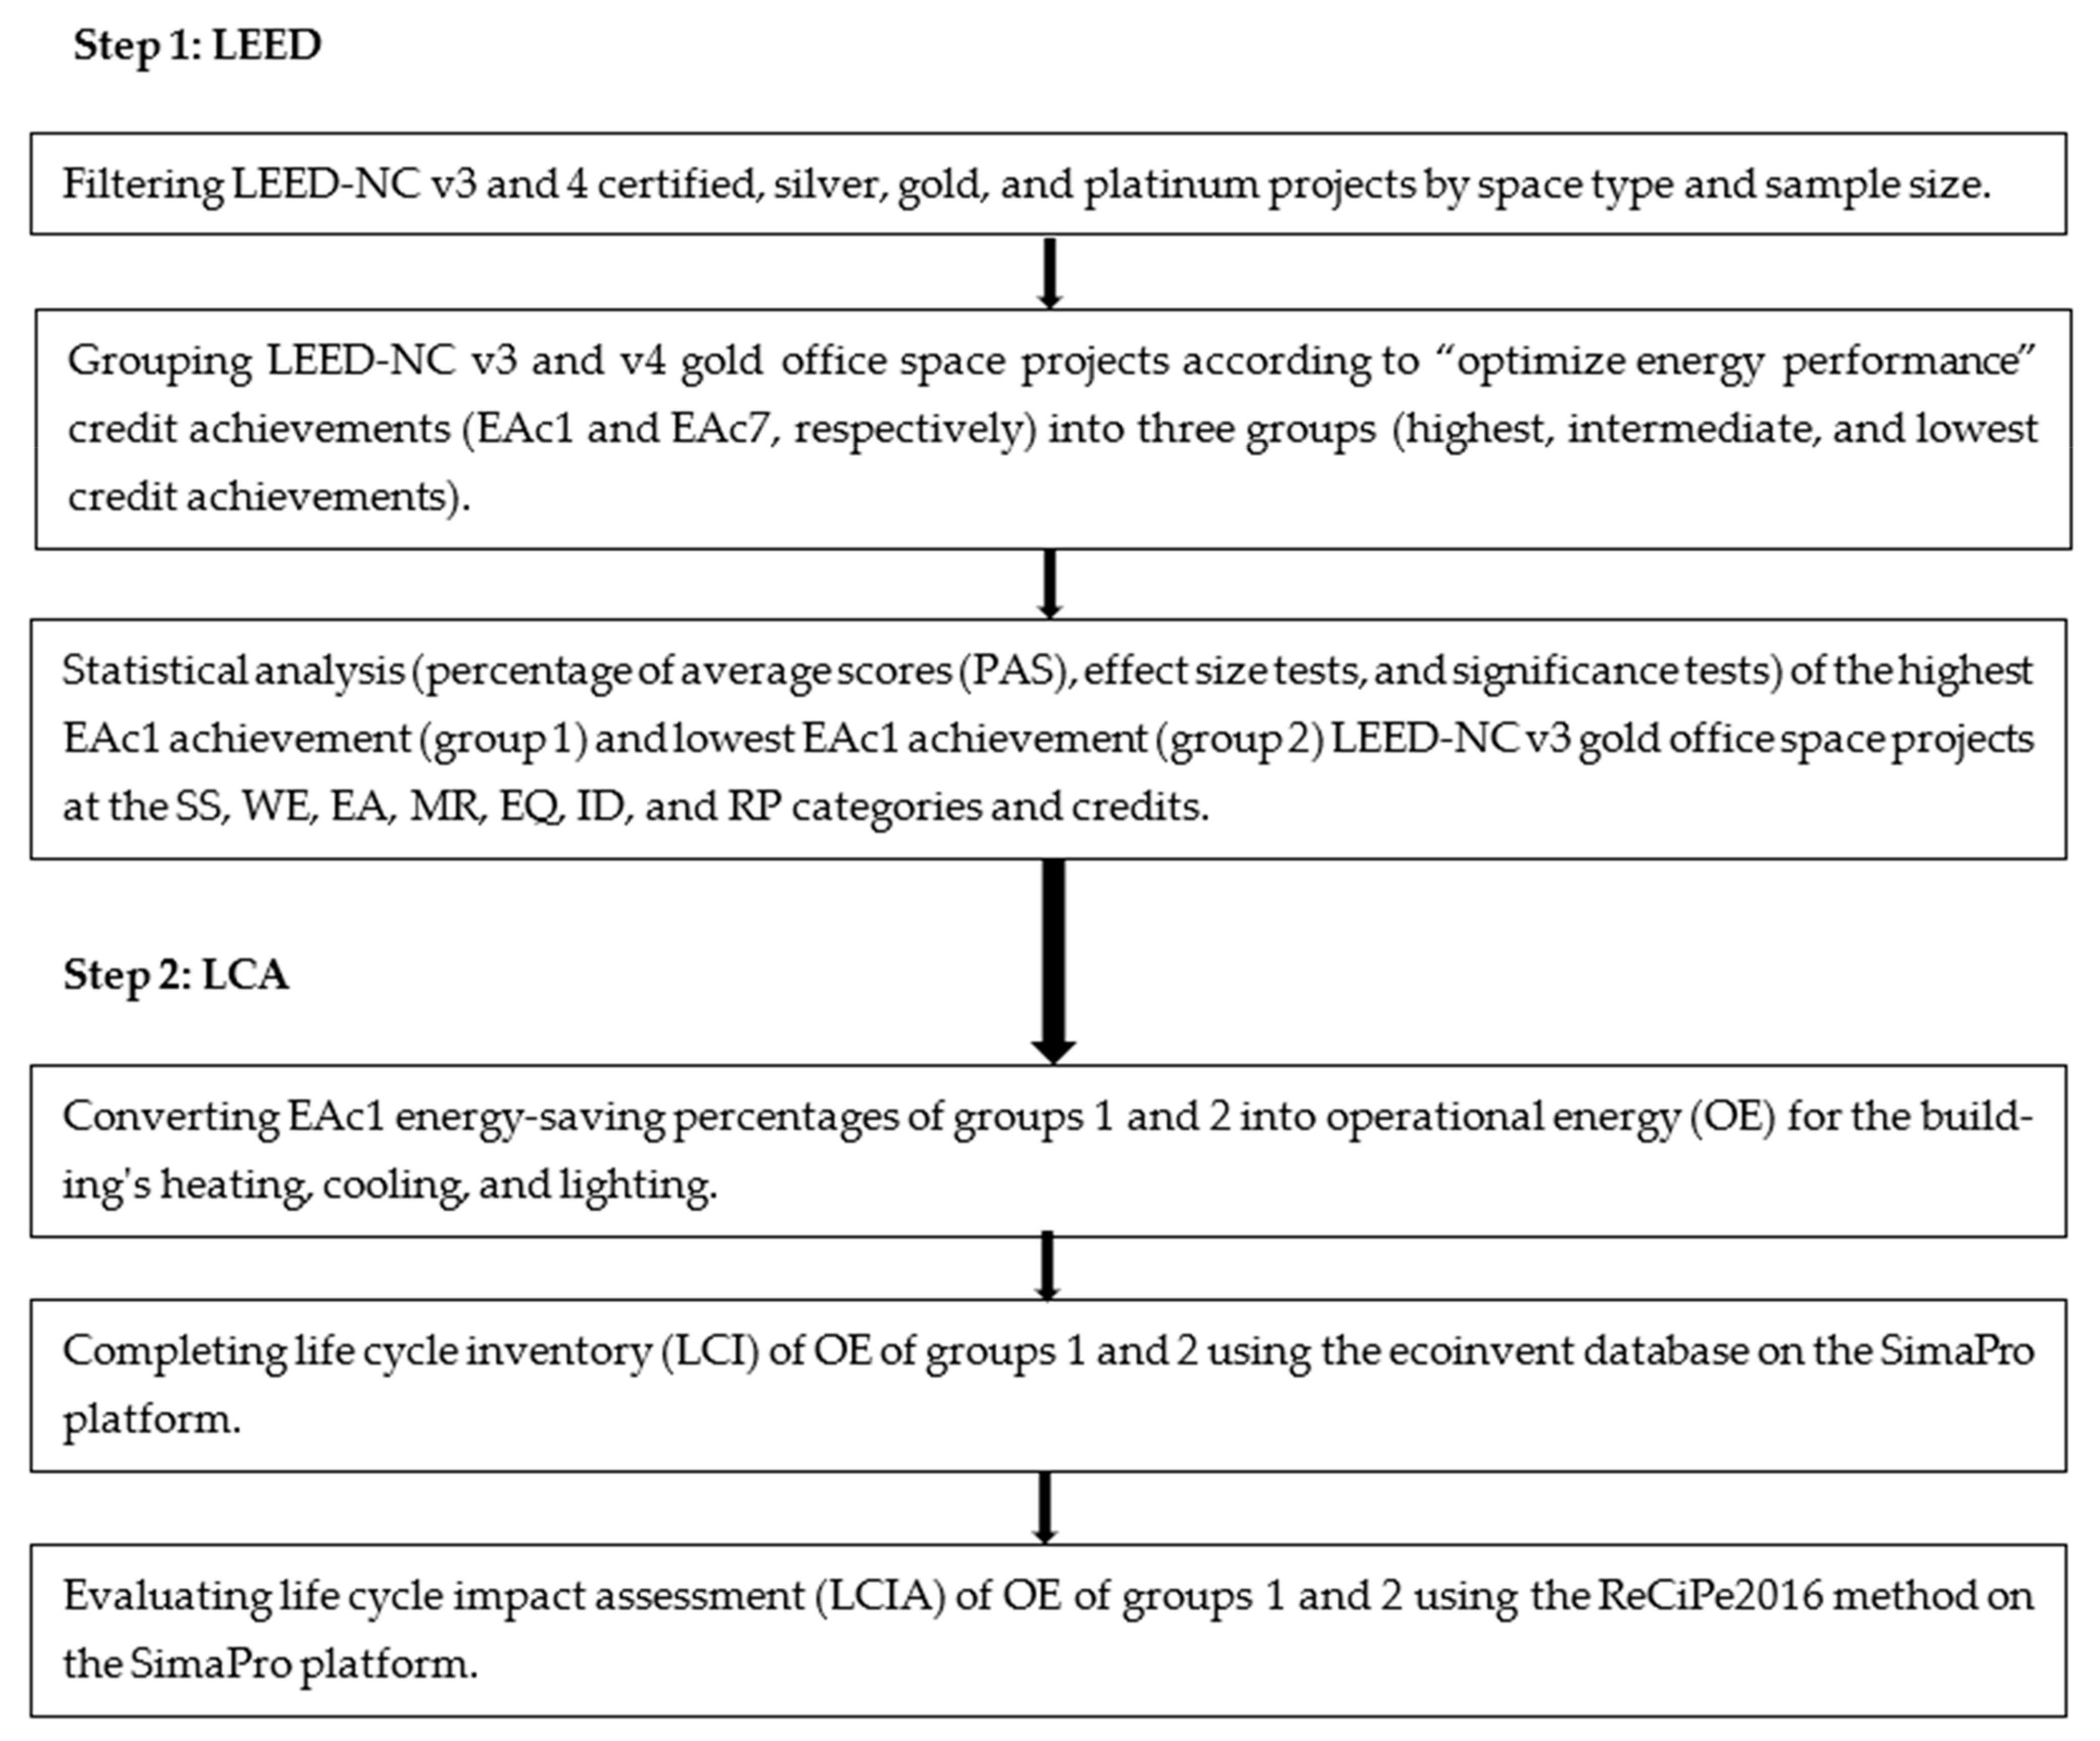
A two-stage procedure was used to evaluate the LCA’s LEED certification strategies (Figure 1).
The first step included analyzing the applied certification strategies used in LEED-NC version 3 (v3) and 4 (v4) gold-certified office space projects in Germany; the second step included assessing the differences in the strategies using the LCA. Figure 1 shows a scheme of the two-step procedure used in this study. Section 2.1 and Section 2.2 present detailed explanations of these two methodological steps.
2.1. LEED Certification
The first step of the study included LEED data collection, sorting, and analyzing.
2.1.1. Data Collection and Sorting
The U.S. Green Building Council (USGBC) [24] and the Green Building Information Gateway (GBIG) databases [25] were used to collect data on LEED-NC v3 and v4 projects in Germany. Table 2 shows that LEED-NC v3 and v4 gold-certified office space projects have the highest number of projects at 39 and 18, respectively.
The sorting procedure included two steps: (i) the LEED-NC v3 and v4 gold-certified projects were ranged by “optimize energy performance” credit achievements from the energy and atmosphere category (EAc1 for v3 and EAc7 for v4), and (ii) the LEED-NC v3 and v4 gold-certified projects were sorted into three groups: highest EAc1/EAc7 achievements, intermediate EAc1/EAc7 achievements, and lowest EAc1/EAc7 achievements.
For v3, since all 39 LEED projects were independent of each other, this allowed 13 LEED projects to be allocated to each group (Table A1, Appendix A). The independence of the LEED projects was determined by the fact that all projects had different addresses, names, and times of registration. In this context, the group with the highest EAc1 achievement (n1 = 13) could be compared with the group with the lowest EAc1 achievement (n2 = 13) using nonparametric statistics [12]. The use of nonparametric statistics with sample sizes (n1 = n2 ≥ 12) made it possible to obtain reliable statistical conclusions [26]. The author focused on two maximally different groups: those with the highest (group 1) and lowest (group 2) EAc1 achievements. The intermediate achievement group was not compared with the other groups in the present study.
For v4, 8 of the 18 projects had the same address, dependent names, and times of registration (Appendix A, Table A2). Therefore, these eight LEED projects could be considered as a median of eight projects, i.e., as one LEED project, to avoid sacrificial pseudoreplication [27]. This LEED project belonged to an intermediate group that was not at the forefront of the present research. In this context, the remaining 10 projects were divided into two groups: high (n1 = 4) and low (n2 = 6) EAc7 achievements. However, with such small sample sizes, using nonparametric statistics to compare the two groups could lead to erroneous statistical inferences [28].
Therefore, in the present study, the author focused only on LEED-NC v3 projects, while LEED-NC v4 projects were not considered due to the small sample sizes.
2.1.2. Data Analysis
The LEED certification strategies of groups 1 and 2 were compared at the category and credit levels of SS, WE, EA, MR, EQ, ID, and RP using the median; percentage of average scores (PAS)—the ratio of points obtained to the total points, expressed as a percentage; effect size tests; Cliff’s δ range interpretation; significance tests; and p-value interpretation.
Percentage of Average Scores
According to [29], the PAS with the formula
was used to evaluate the performances of both categories and credits in LEED-NC v3 gold-certified office space projects in Germany.
Nonparametric Statistical Analysis
Effect Size Tests and Interpretation. The Cliff’s δ effect size test was used [30] if the LEED data were related to the ordinal scale. The natural logarithm of the odds ratio (lnθ) effect size test [31] was used if the LEED data were related to the binary scale. Cliff’s δ ranges between –1 and +1, and lnθ ranges from minus infinity to plus infinity. In both δ and lnθ, (+) indicates that group 1 is superior to group 2, (–) indicates that group 2 is superior to group 1, and zero indicates no difference between the groups. According to [32], Cliff’s δ indicates three levels of effect size: small (|0.147|), medium (|0.33|), and large (|0.474|). According to [33], lnθ indicates three levels of effect size: small (|0.51|), medium (|1.24|), and large (|1.90|).
Significance Tests and p-Value Interpretation. The exact Wilcoxon–Mann–Whitney (WMW) test was used [26] if the LEED data were related to an ordinal scale. Fisher’s exact test, using a 2 × 2 table with Lancaster’s correction, was used if the LEED data were related to a binary scale [34]. Three-value logic was used to interpret the exact p-value [35].
2.2. Life Cycle Assessment
The second step of this study included LCAs of both the highest EAc1 achievement (group 1) and the lowest EAc1 achievement (group 2). The ecoinvent database on the SimaPro platform was used to complete the life cycle inventory (LCI) of the EAc1 achievement of groups 1 and 2 [36]. RECiPe2016 was used to convert LCI into a life cycle impact assessment (LCIA) [36].
2.2.1. Selecting EAc1 Achievements of Groups 1 and 2 for LCA
Table 3 gives the names and addresses of the projects of groups 1 and 2. Frankfurt Am Main is a city in which four projects from group 1 (Condor Campus, Gateway Gardens, Kornmarkt Arkaden BT D–Buero, NM I, and KION Headquarters) and five projects from group 2 (KVH, ML36, Neue Mainzer Strasse 80, Alpha Rotex, and FCA Fiat Chrysler Automobiles) were located. Therefore, to decrease the influence of city-specific factors, such as location and climate, on the EAc1 achievements, the author focused only on the medians of the EAc1 achievements of all of the abovementioned projects, which are located in this city. As a result, the medians of EAc1 of group 1 and group 2 were 19 and 11 points, respectively. Further, these median achievements related to OE savings were assessed using the LCA.
2.2.2. Converting the EAc1 Achievements of Groups 1 and 2 into LCI Input Data
EAc1 includes operational energy (OE) reduction regarding the heating, cooling, and lighting needs of the building and awards 1–19 points for a 2–48% OE reduction regarding the OE of a typical building, where every 2% OE reduction is worth 1 point [37].
An appropriate functional unit (FU) is necessary for conducting a LCA. This is the unit to which all inputs and outputs need to be related [22]. To compare the certification strategies of groups 1 and 2, 1 m2 of the building floor was selected as a functional unit (FU). This is because this FU was confirmed as an appropriate measure for the LCA of LEED certification strategies [11,12]. Thus, the FU is OE (kWh) per 1 m2 of the building floor for one year.
A “cradle-to-the-grave” LCA of concrete elements includes (i) the design stage, (ii) the production/execution stage, (iii) the usage stage, and (iv) the end-of-life stage [23]. However, the system boundary of this LCA was restricted by the OE stage only due to the requirement of EAc1, which prescribes decreasing the OE only.
According to LEED-NC v3 [37], 19 and 11 EAc1 points are awarded for 48% and 32% OE reductions, respectively. According to the building energy codes in Germany, using 124.8 kWh/m2·y of OE corresponds to typical office building-type needs [38]. Using the base case and these OE reduction percentages, the final OE values for groups 1 and 2 were estimated to be 64.9 kWh/m2∙y and 84.9 kWh/m2∙y, respectively.
These 64.9 kWh/m2∙year and 84.9 kWh/m2∙year OE values were converted into LCI data using German energy source shares and the corresponding ecoinvent data records (Table 4). Most of the energy sources were evaluated using the LCI energy production processes in Germany.
2.2.3. Converting Life Cycle Impact to Life Cycle Impact Assessment
ReCiPe2016 was used to convert the LCIs of the results of groups 1 and 2 into a LCIA [39]. ReCiPe2016 allows for performing environmental evaluations at the mid-point and end-point levels and impact- and damage-based levels, respectively. The mid-point level is represented by 18 environmental impacts, such as acidification, ionizing radiation, water consumption, global warming potential, and terrestrial ecotoxicity. However, it is very difficult to interpret such numerous impact-based results.
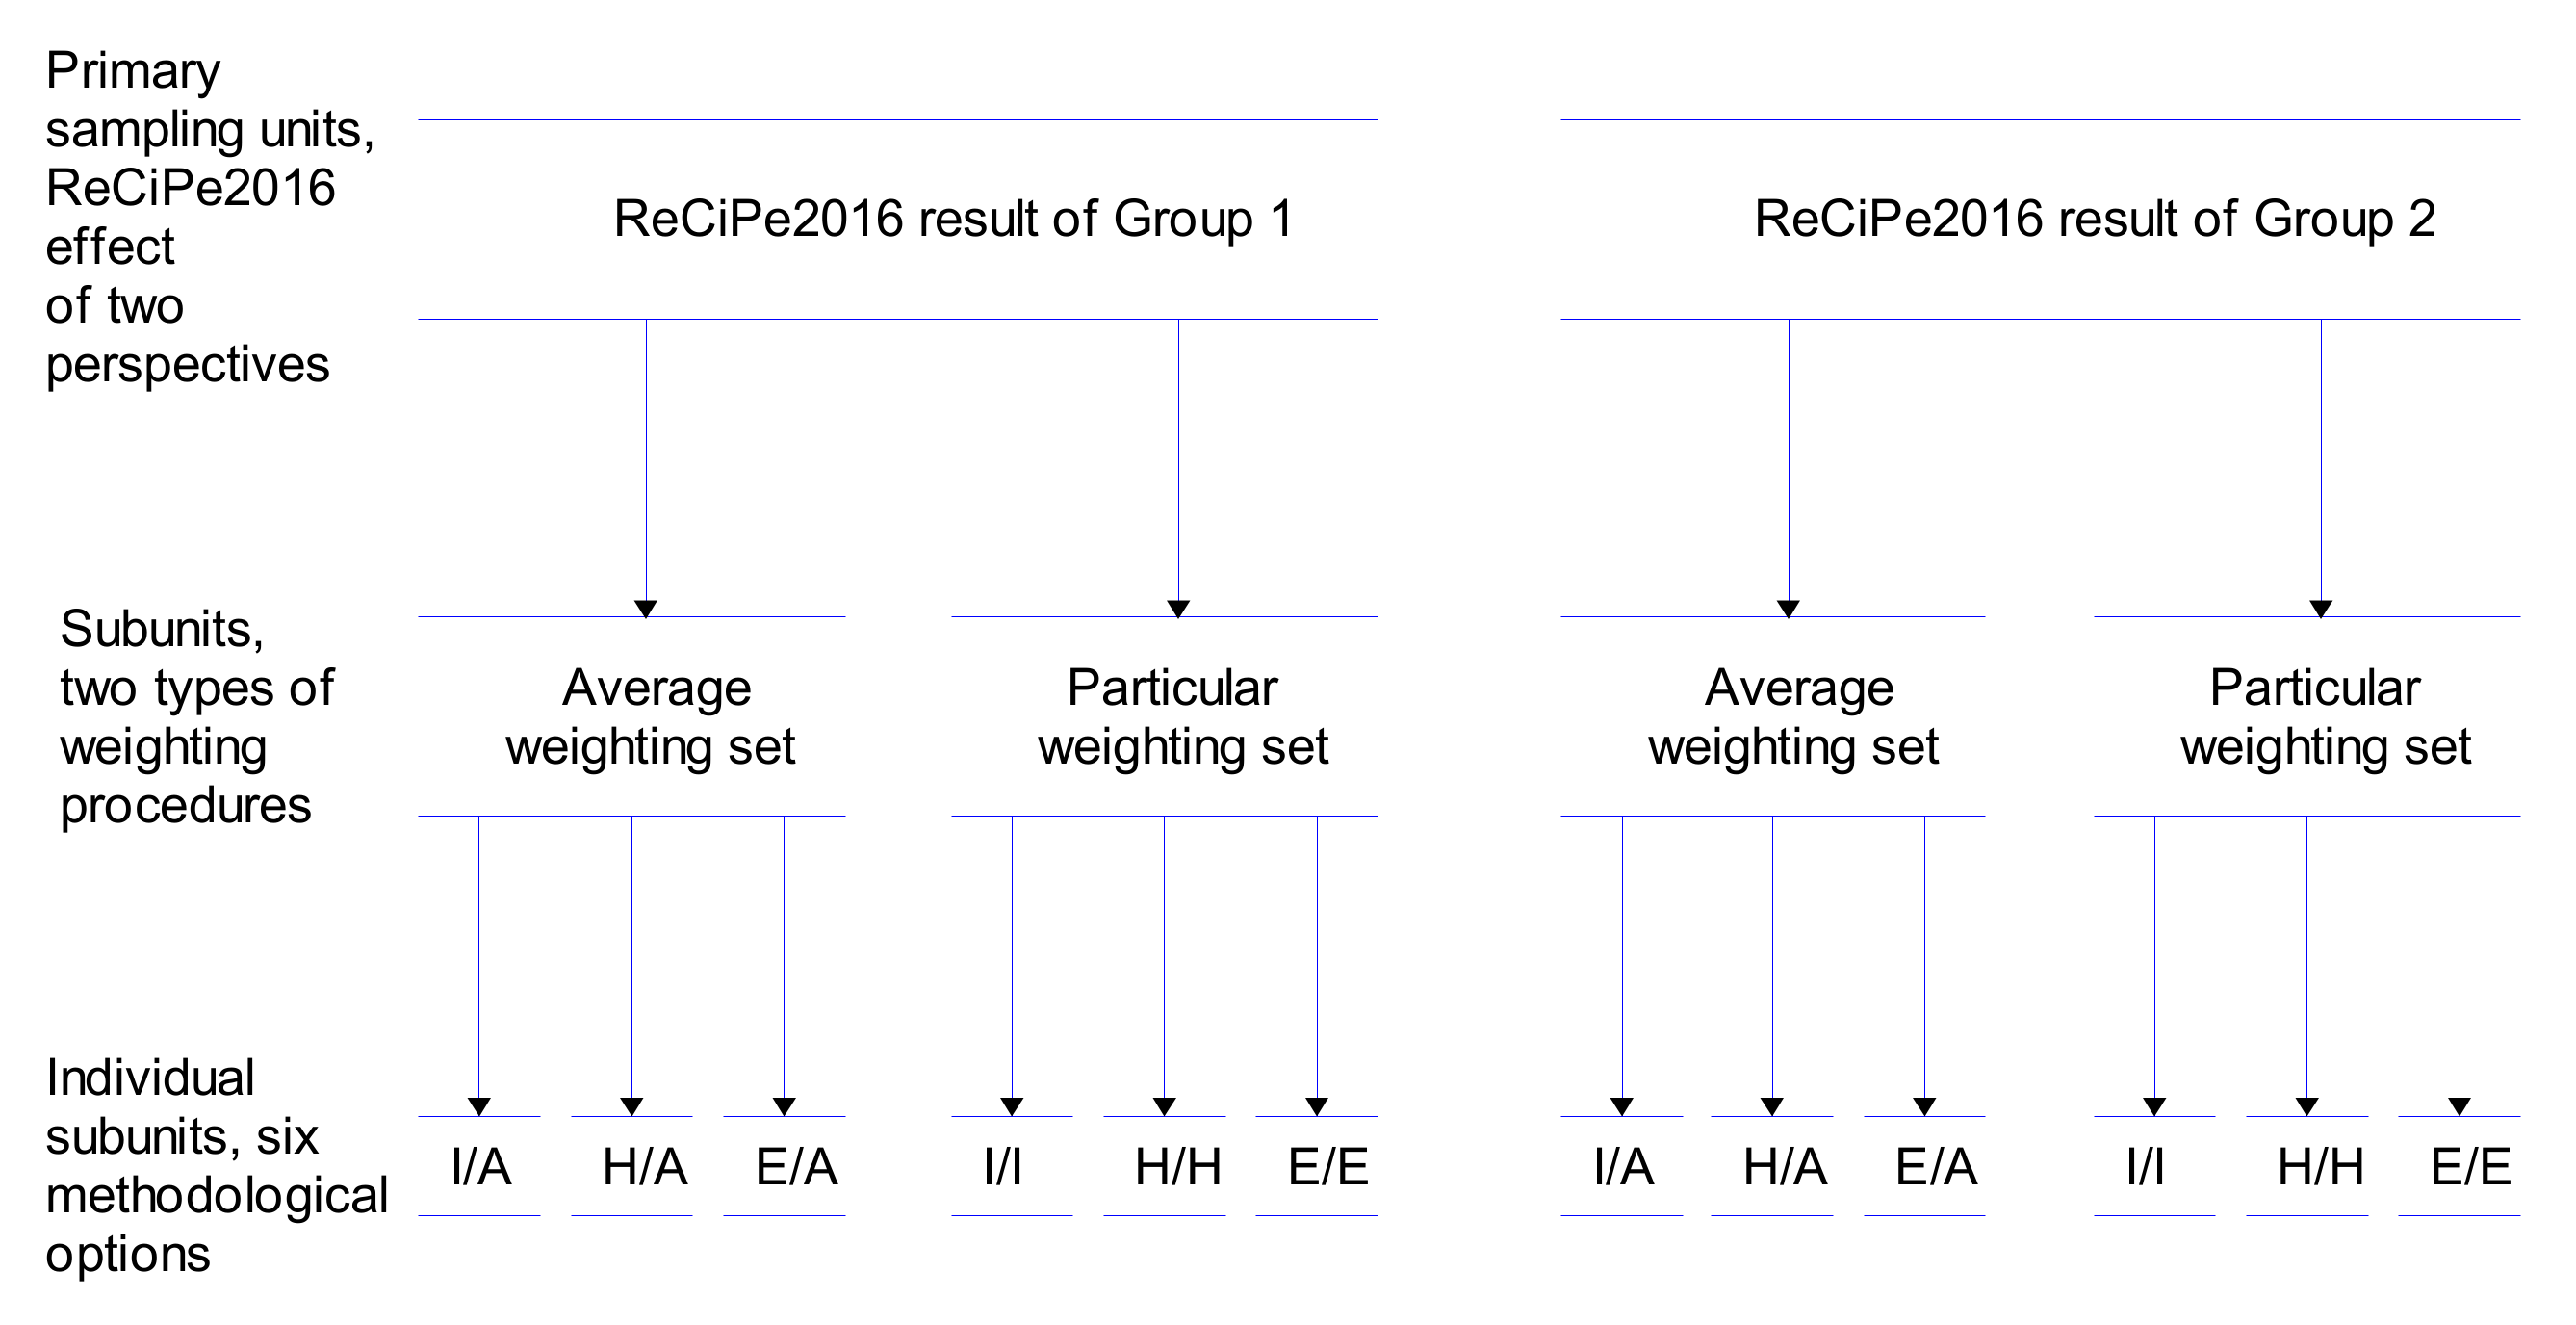
Thus, at the end-point level, the impact-based results can be summed into three kinds of environmental damage: damage to human health, ecosystem quality, and resources. This presentation of the results greatly facilitates their interpretation. However, the converting of impact-based results into damage-based results involves a lot of uncertainty regarding the relative importance of the impacts. Thus, ReCiPe2016 suggests solving this uncertainty via the consideration of the resulting environmental damage over three time periods: short-, intermediate-, and long-term using individualist, hierarchist, and egalitarian perspectives, respectively, and applying average and perspective-relevant weighting sets to the damage. As a result, the ReCiPe2016 method includes three methodological options: individualist/average (I/A), hierarchist/average (H/A), and egalitarian/average (E/A), which are nested in an average weighting set, and three methodological options, which are nested in a particular weighting set: individualist/individualist (I/I), hierarchist/hierarchist (H/H), and egalitarian/egalitarian (E/E) [40].
3. Results and Discussion
3.1. LEED-NC v3 Certification Strategies
3.1.1. Category Level
Table 5 shows that groups 1 and 2 scored highly for SS, WE, EQ, ID, and RP (55 < PAS < 94); MR was low in both groups (29 < PAS < 36), while EA was high in group 1 but low in group 2 (PAS = 63 and 40, respectively). Table 4 also shows that group 1 outperformed group 2 with a large effect size in the EA category (δ = 0.92, p < 0.0001).
According to recent studies [11,12], group 2 was expected to outperform group 1, with the large effect size in other (non-EA) categories compensating for the low achievement in EA. However, in the SS, WE, MR, EQ, ID, and RP categories, group 2 outperformed group 1 with a negligible-to-medium effect size (0.01 ≤ δ ≤ 0.40). As a result, for the total LEED, group 1 outperformed group 2 with a large effect size in the LEED total score (δ = 0.63, p = 0.0048). Thus, the low EA score in group 2 compared to group 1 was partially offset by a slightly increased achievement in six categories (SS, WE, MR, EQ, ID, and PR) in group 2. Partial compensation in group 2 led to gold certification, but this group did not achieve the same level of sustainability as group 1.
3.1.2. Credit Level
The analysis of the EA credits is presented below, while the analyses of the SS, WE, MR, and EQ credits are presented in Appendix A and summarized below. This is because there was a significant difference between the achievements of the groups for the EA category, while no significant differences were revealed between the groups for the SS, WE, MR, and EQ categories (Table 5).
EA credits
Table 6 shows the EA credit achievements of both group 1 and group 2.
According to Table 6, group 1 outperformed group 2 only for EAc1: optimize energy performance (p < 0.0001). The PAS of group 1 was high, with 89% of the maximum points obtained, whereas the PAS of group 2 was much lower, with 51% of the maximum points obtained. This significant difference in EAc1 achievement suggests that the two certification strategies—high EAc1 and low EAc1 for group 1 and group 2, respectively—may have different environmental impacts. This suspicion is also reinforced by Germany’s fuel sources for energy production: 50% is based on fossil fuels such as coal, natural gas, and oil [20]. This is because these fuels are sources of greenhouse gas emissions, such as carbon dioxide (CO2), methane (CH4), and nitrous oxide (N2O). Therefore, EAc1 was evaluated in the further LCA of the two different certification strategies used by groups 1 and 2 (Section 3.2).
For the achievements regarding the rest of the credits (EAc2–EAc6), there was no difference between groups 1 and 2 (0.2200 ≤ p ≤ 0.5712) (Table 6). EAc2: On-site renewable energy encourages replacing part of nonrenewable OE, such as oil, coal, and natural gas, with on-site renewable energy, such as solar and wind energy [37]. EAc6: Green power recommends signing a two-year contract to use renewable energy from the grid [37]. Thus, both of these credits are aimed at expanding the use of renewable energy sources. The average annual solar radiation in Germany is quite high at 1100 kWh/m2. In addition, its inhabitants have a high level of willingness to invest in renewable energy sources in order to reduce the environmental damage associated with the use of nonrenewable energy [19]. However, according to the findings of this study on the LEED-NC v3 certification strategies, both EAc2 and EAc6 were largely ignored by most of the projects of groups 1 and 2. In particular, 3 projects in group 1 and 1 project in group 2, out of the 13 projects in each group, earned EAc2 points. Therefore, the PAS was very low: 10 and 1 for groups 1 and 2, respectively (Table 5). Thus, the on-site installation of PV modules was not popular among the projects studied here. EAc6 was slightly more popular, with 3 projects in group 1 and 4 projects in group 2 out of the 13 projects in each group that earned points for this credit. This was due to the availability of grid source renewable energy in Germany: 21.63% and 10.12% of the total energy produced from wind energy and solar energy, respectively [20]. As a result, groups 1 and 2 achieved PAS = 23 and PAS = 31, respectively (Table 6).
EAc3: Enhanced commissioning requires the fundamental commissioning of heating, ventilating, air conditioning, and refrigeration (HVAC&R) systems, lighting and daylighting controls, hot water systems, and renewable energy systems. EAc5: Metering and verification credit, requires the implementation of a metering and verification (M&V) plan to ensure that the energy consumption of HVAC&R and other mechanical systems is accounted for over time. These two credits were popular in less than half of the 13 total projects in both groups (26 ≤ PAS ≤ 46) (Table 6).
EAc4: Advanced refrigerant management requires the installation of HVAC&R refrigerants and equipment that minimize or eliminate emissions, such as CFCs, HCFCs, or halons, to reduce the ODP. Germany is one of the countries in Northwestern Europe that signed the Montreal Protocol toward decreasing the ODP [17]. Thus, 12 out of the 13 projects in group 1 and all 13 projects in group 2 scored the highest for EAc4: PAS = 92 and PAS = 100, respectively. Thus, only EAc1 scored differently in groups 1 and 2, whereas the EAc2–EAc6 credits were scored very similar for the two groups, with a low PAS (EAc2, EAc3, EAc5, and EAc6) or a high PAS (EAc4).
SS, WE, MR, and EQ Credits
A similar tendency in credit achievements (similarly low PAS or similarly high PAS in both groups 1 and 2) was noticed for the rest of the categories: SS, WE, MR, and EQ (Table A1, Table A2, Table A3 and Table A4, Appendix A). Based on the results from Table A1, Table A2, Table A3 and Table A4 (Appendix A), Table 7 shows a summary of the most popular credits (that scored highly) from these categories that present the certification strategy used by groups 1 and 2.
In Germany, after the energy sector, with a share of 44% of the total CO2 emissions, road transport emissions are the second-largest source at 21.3% [21]. Thus, by 2035, Germany intends to replace its electricity system with fully renewable energy sources [21]. The SSc4.1–4.4 credits aim to decrease this transportation-related environmental damage by using public transportation, low-emitting vehicles, and bicycles [37]. Therefore, for these credits, both groups scored high (Table 7 and Table A1, Appendix A).
Germany has a large amount of rainfall and six river systems, as well as coastal areas facing the North and Baltic Seas. Thus, the country does not face a significant water shortage problem [42]. Nevertheless, WEc1 and WEc3 (saving water outdoors and indoors, respectively) were important credits for both groups (Table 7 and Table A2, Appendix A).
The construction and demolition waste (C&DW) issue is a very important issue worldwide. In Germany, the amount of C&DW has increased significantly in recent years, while the landfill capacity has rapidly decreased [43]. Thus, both groups included MRc2: Construction waste management and MRc4: Recycled content in their certification strategy (Table 7 and Table A3, Appendix A).
EQ credits place requirements on building materials to reduce their harmful effects on human health. EQc4.1 and 4.2 low-emitting materials: adhesives and sealants and paints and coatings requiring a decrease in VOC were part of the certification strategies in both groups of the studied projects (Table 7 and Table A4, Appendix A). The assessment of the VOC in building materials is supported by the German mandatory scheme (Ausschuss zur gesundheitlichen Bewertung von Bauprodukten; AgBB) [18].
Based on the results from Table A1, Table A2, Table A3 and Table A4 (Appendix A), Table 8 shows a summary of the least popular SS, WE, MR, and EQ credits of LEED-NC v3 gold-certified office space projects in Germany. Among these, Building and material reuse (MRc1.1 and 1.2) and Renewable materials (MRc6) were not popular at all in groups 1 and 2. In response to the Paris Agreement on climate change, Germany reduced greenhouse gas (GHG) emissions by 35% from 1990 to the present, with the country aiming to become carbon-neutral by 2050. However, the current reduction in GHG emissions has been achieved mainly through energy efficiency, while material efficiency, including higher levels of recycling, remanufacturing, and reuse, has exhibited insufficient progress [16].
3.2. LCA of EAc1
3.2.1. LCA of EAc1: Mid-Point Evaluation
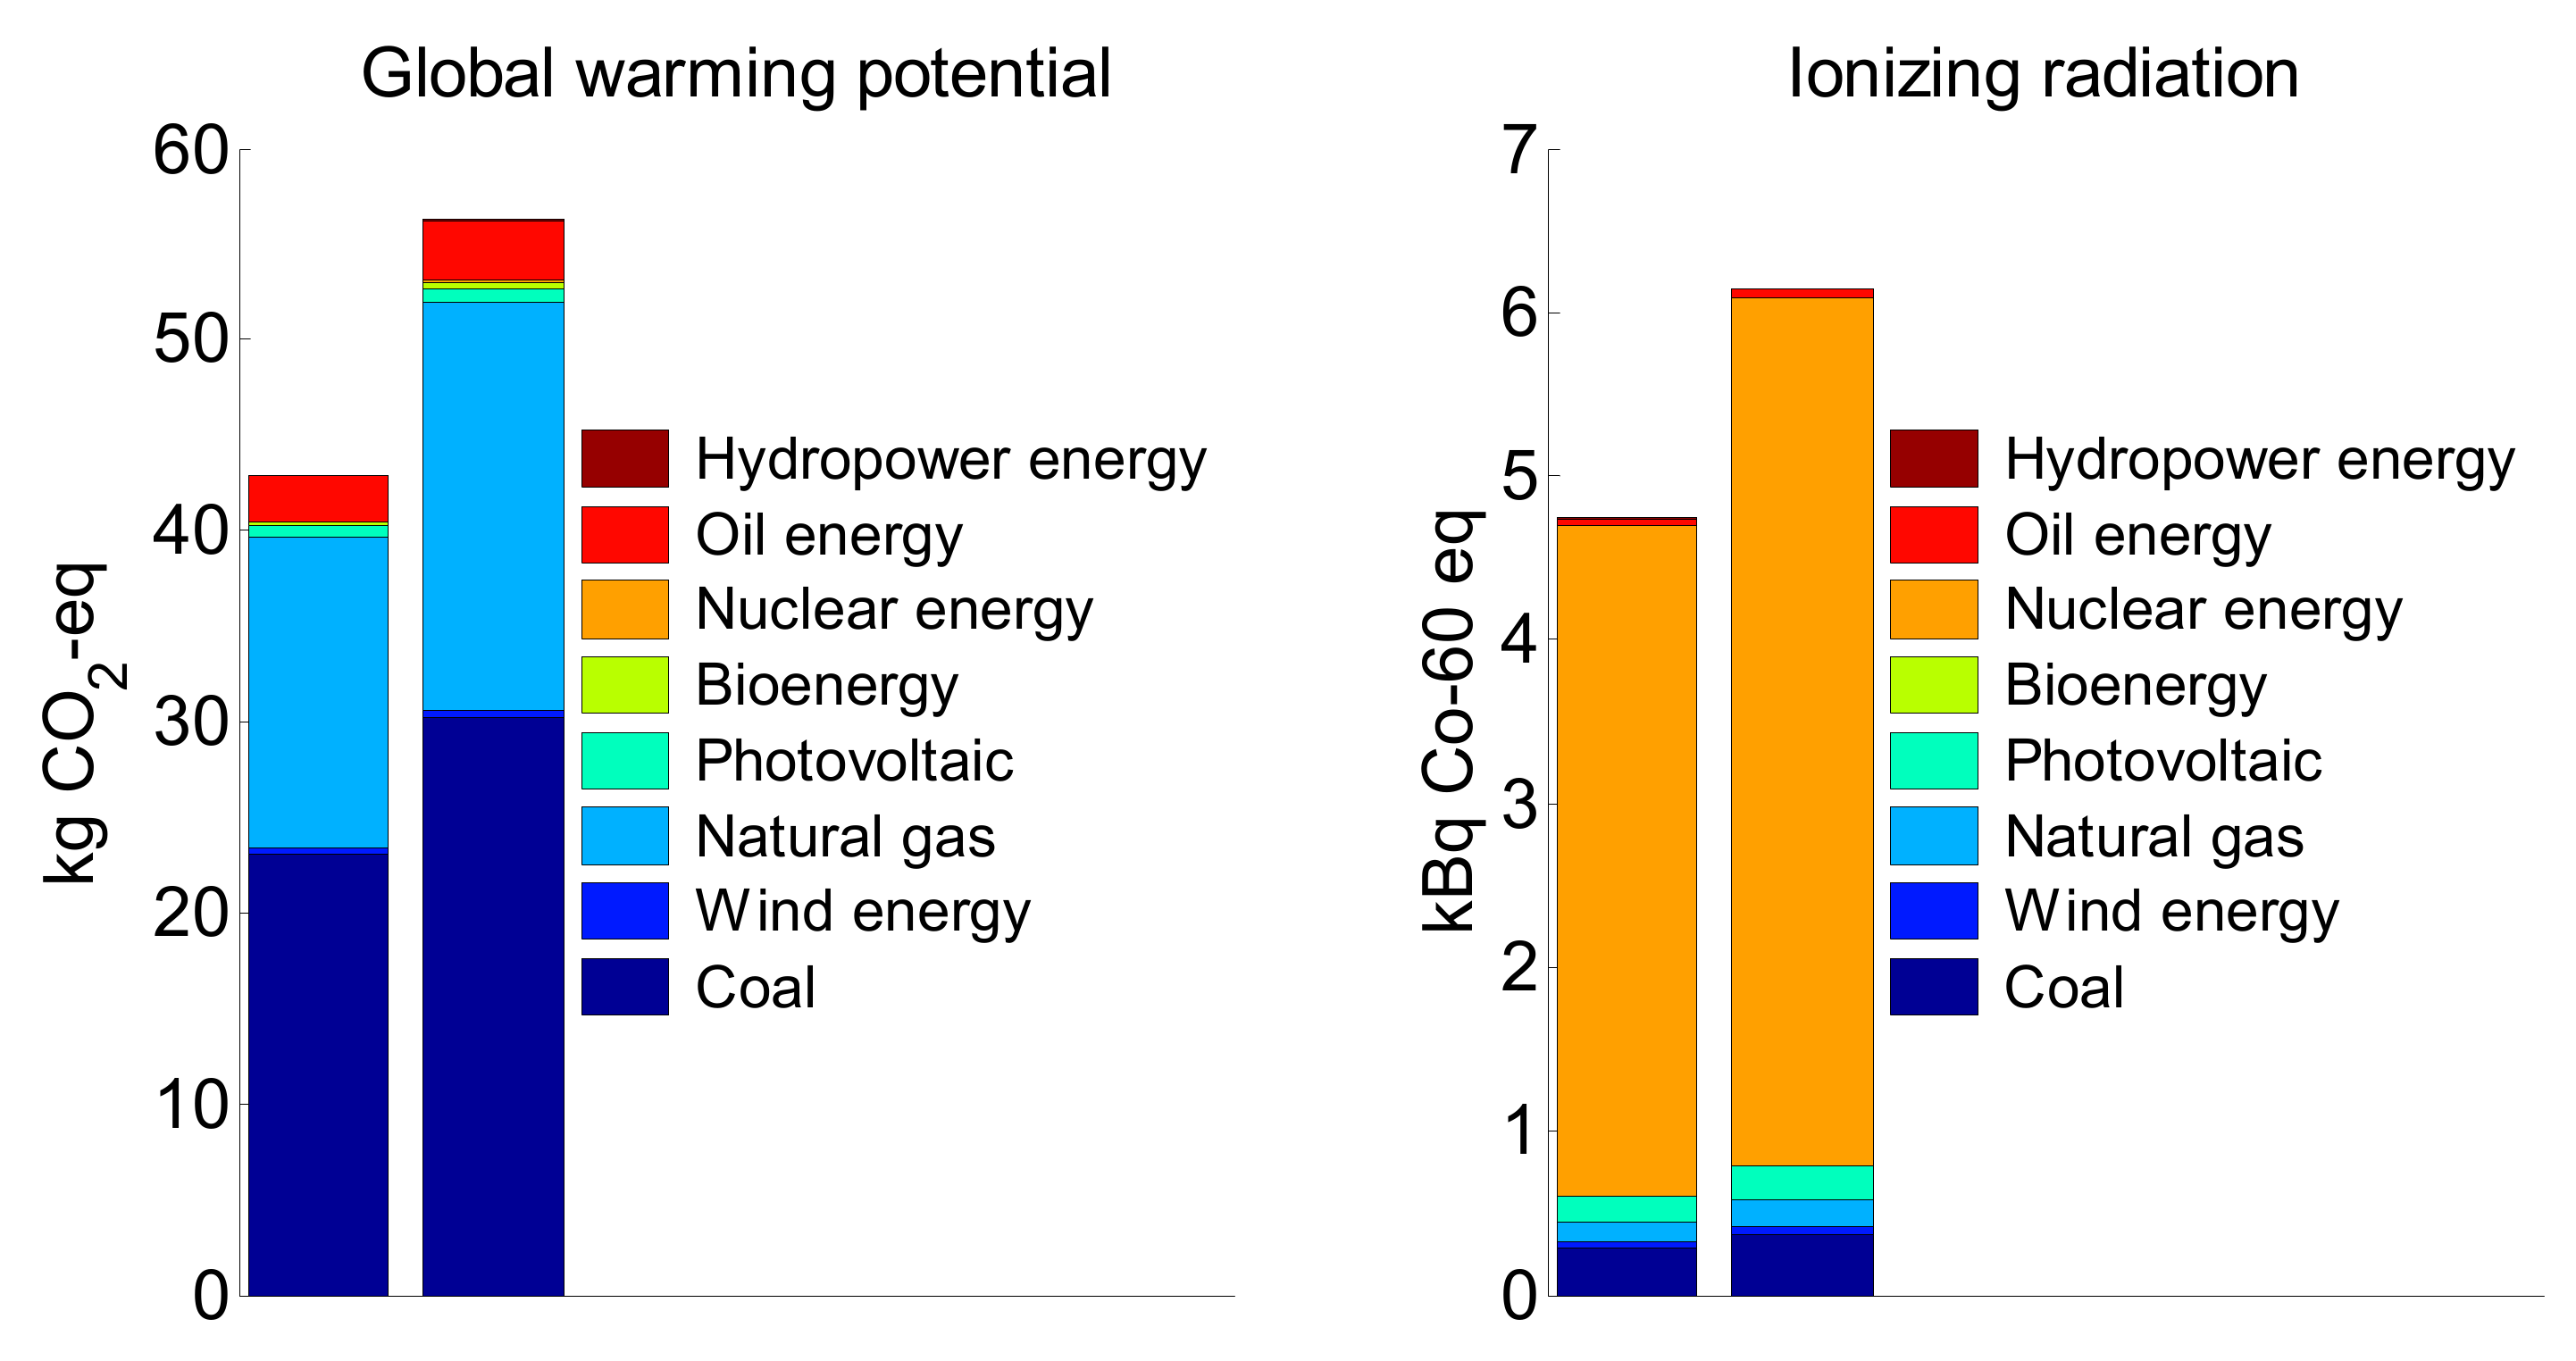
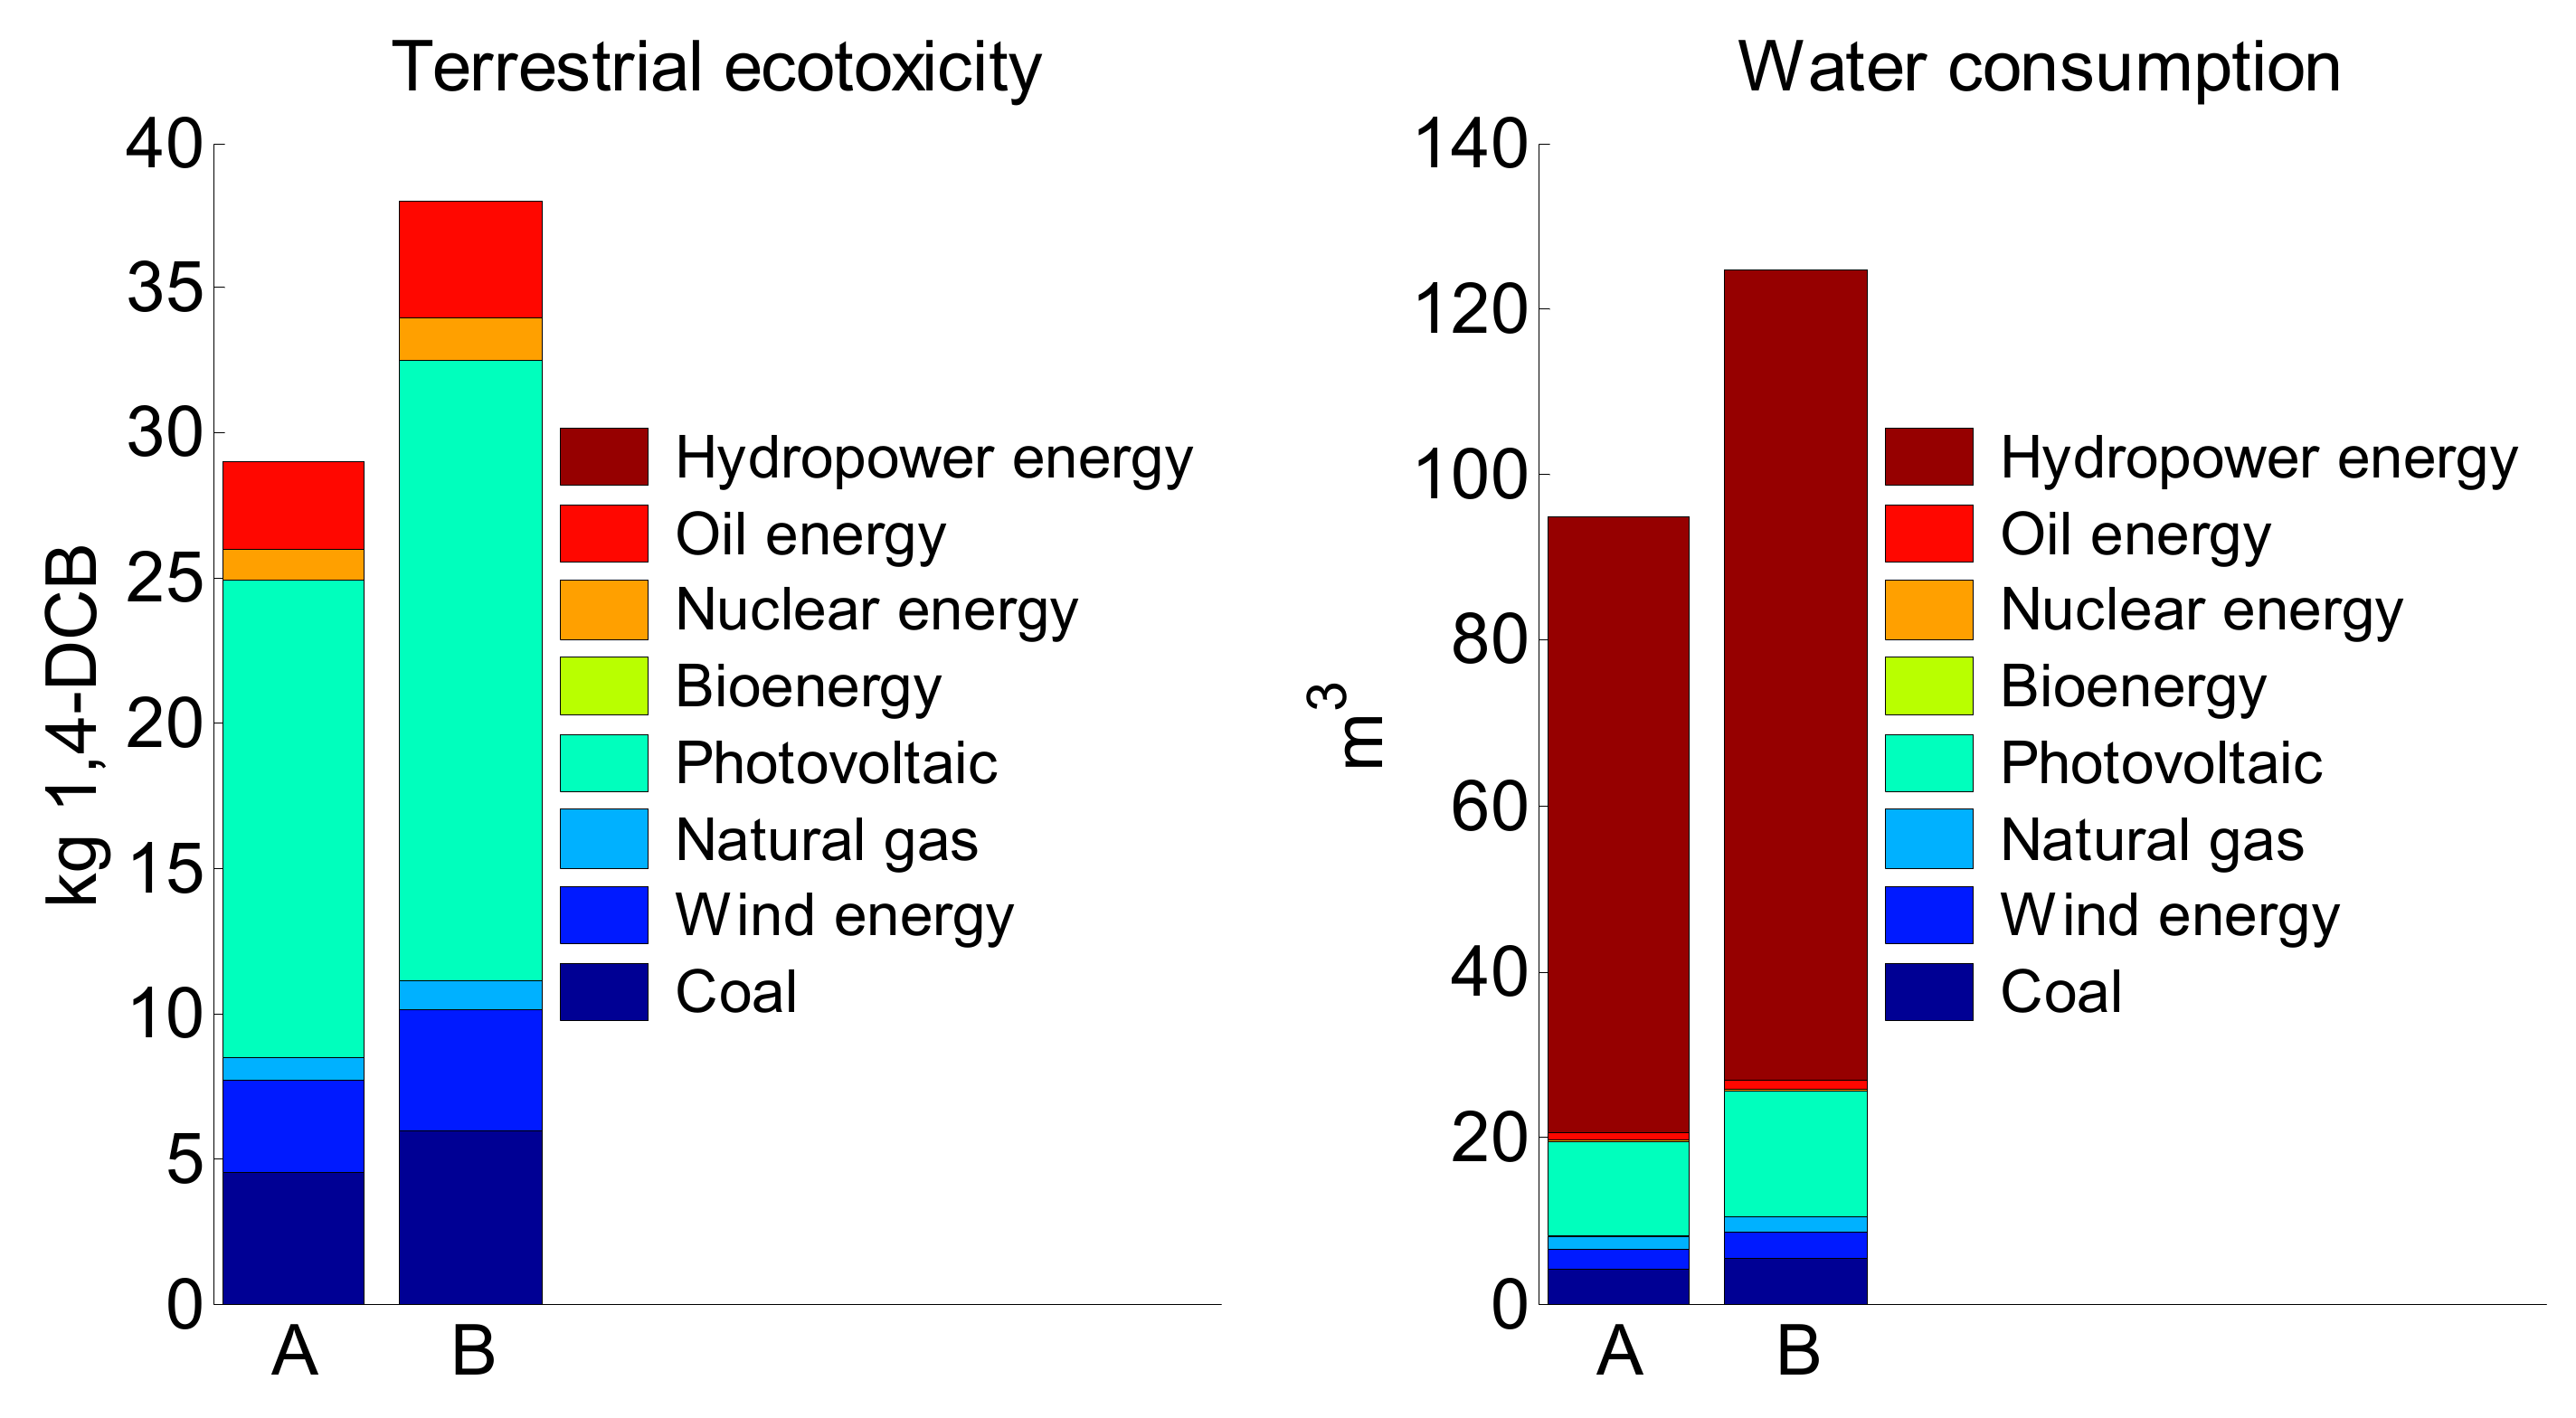
Figure 3 shows the global warming potential, ionizing radiation, terrestrial ecotoxicity, and water consumption results for the OE achievements shown by groups 1 and 2. According to the results, all four impacts in group 1 were lower by 22.8–23.9% than those in group 2.
Coal and natural gas were the main sources of global warming potential at 54% and 38%, respectively (Figure 3). This is because the main emissions of CO2 and CH4 from burning coal and natural gas for electricity generation are 1.9 g/MJ and 0.15 g/MJ, respectively [44]. According to the literature, using nuclear energy led to increased ionizing radiation [45]. In this study, nuclear energy was the main source of ionizing radiation at 87%, followed by coal, PV, and natural gas at 6%, 3%, and 3%, respectively (Figure 3). PV was the main source of terrestrial ecotoxicity at 57%, followed by coal, wind energy, and oil at 16%, 11%, and 10%, respectively (Figure 3). Terrestrial ecotoxicity was recognized as one of the most significant impacts resulting from the production of photovoltaic panels and their supporting infrastructure in the LCA study of roof-mounted photovoltaic panels and a ground-mounted photovoltaic farm [46]. Hydropower was the main source of water consumption at 78%, followed by PV, coal, wind, and natural gas at 12%, 4%, 3%, and 2%, respectively (Figure 3). This confirms the findings in other studies that hydropower is a large global water consumer [47].
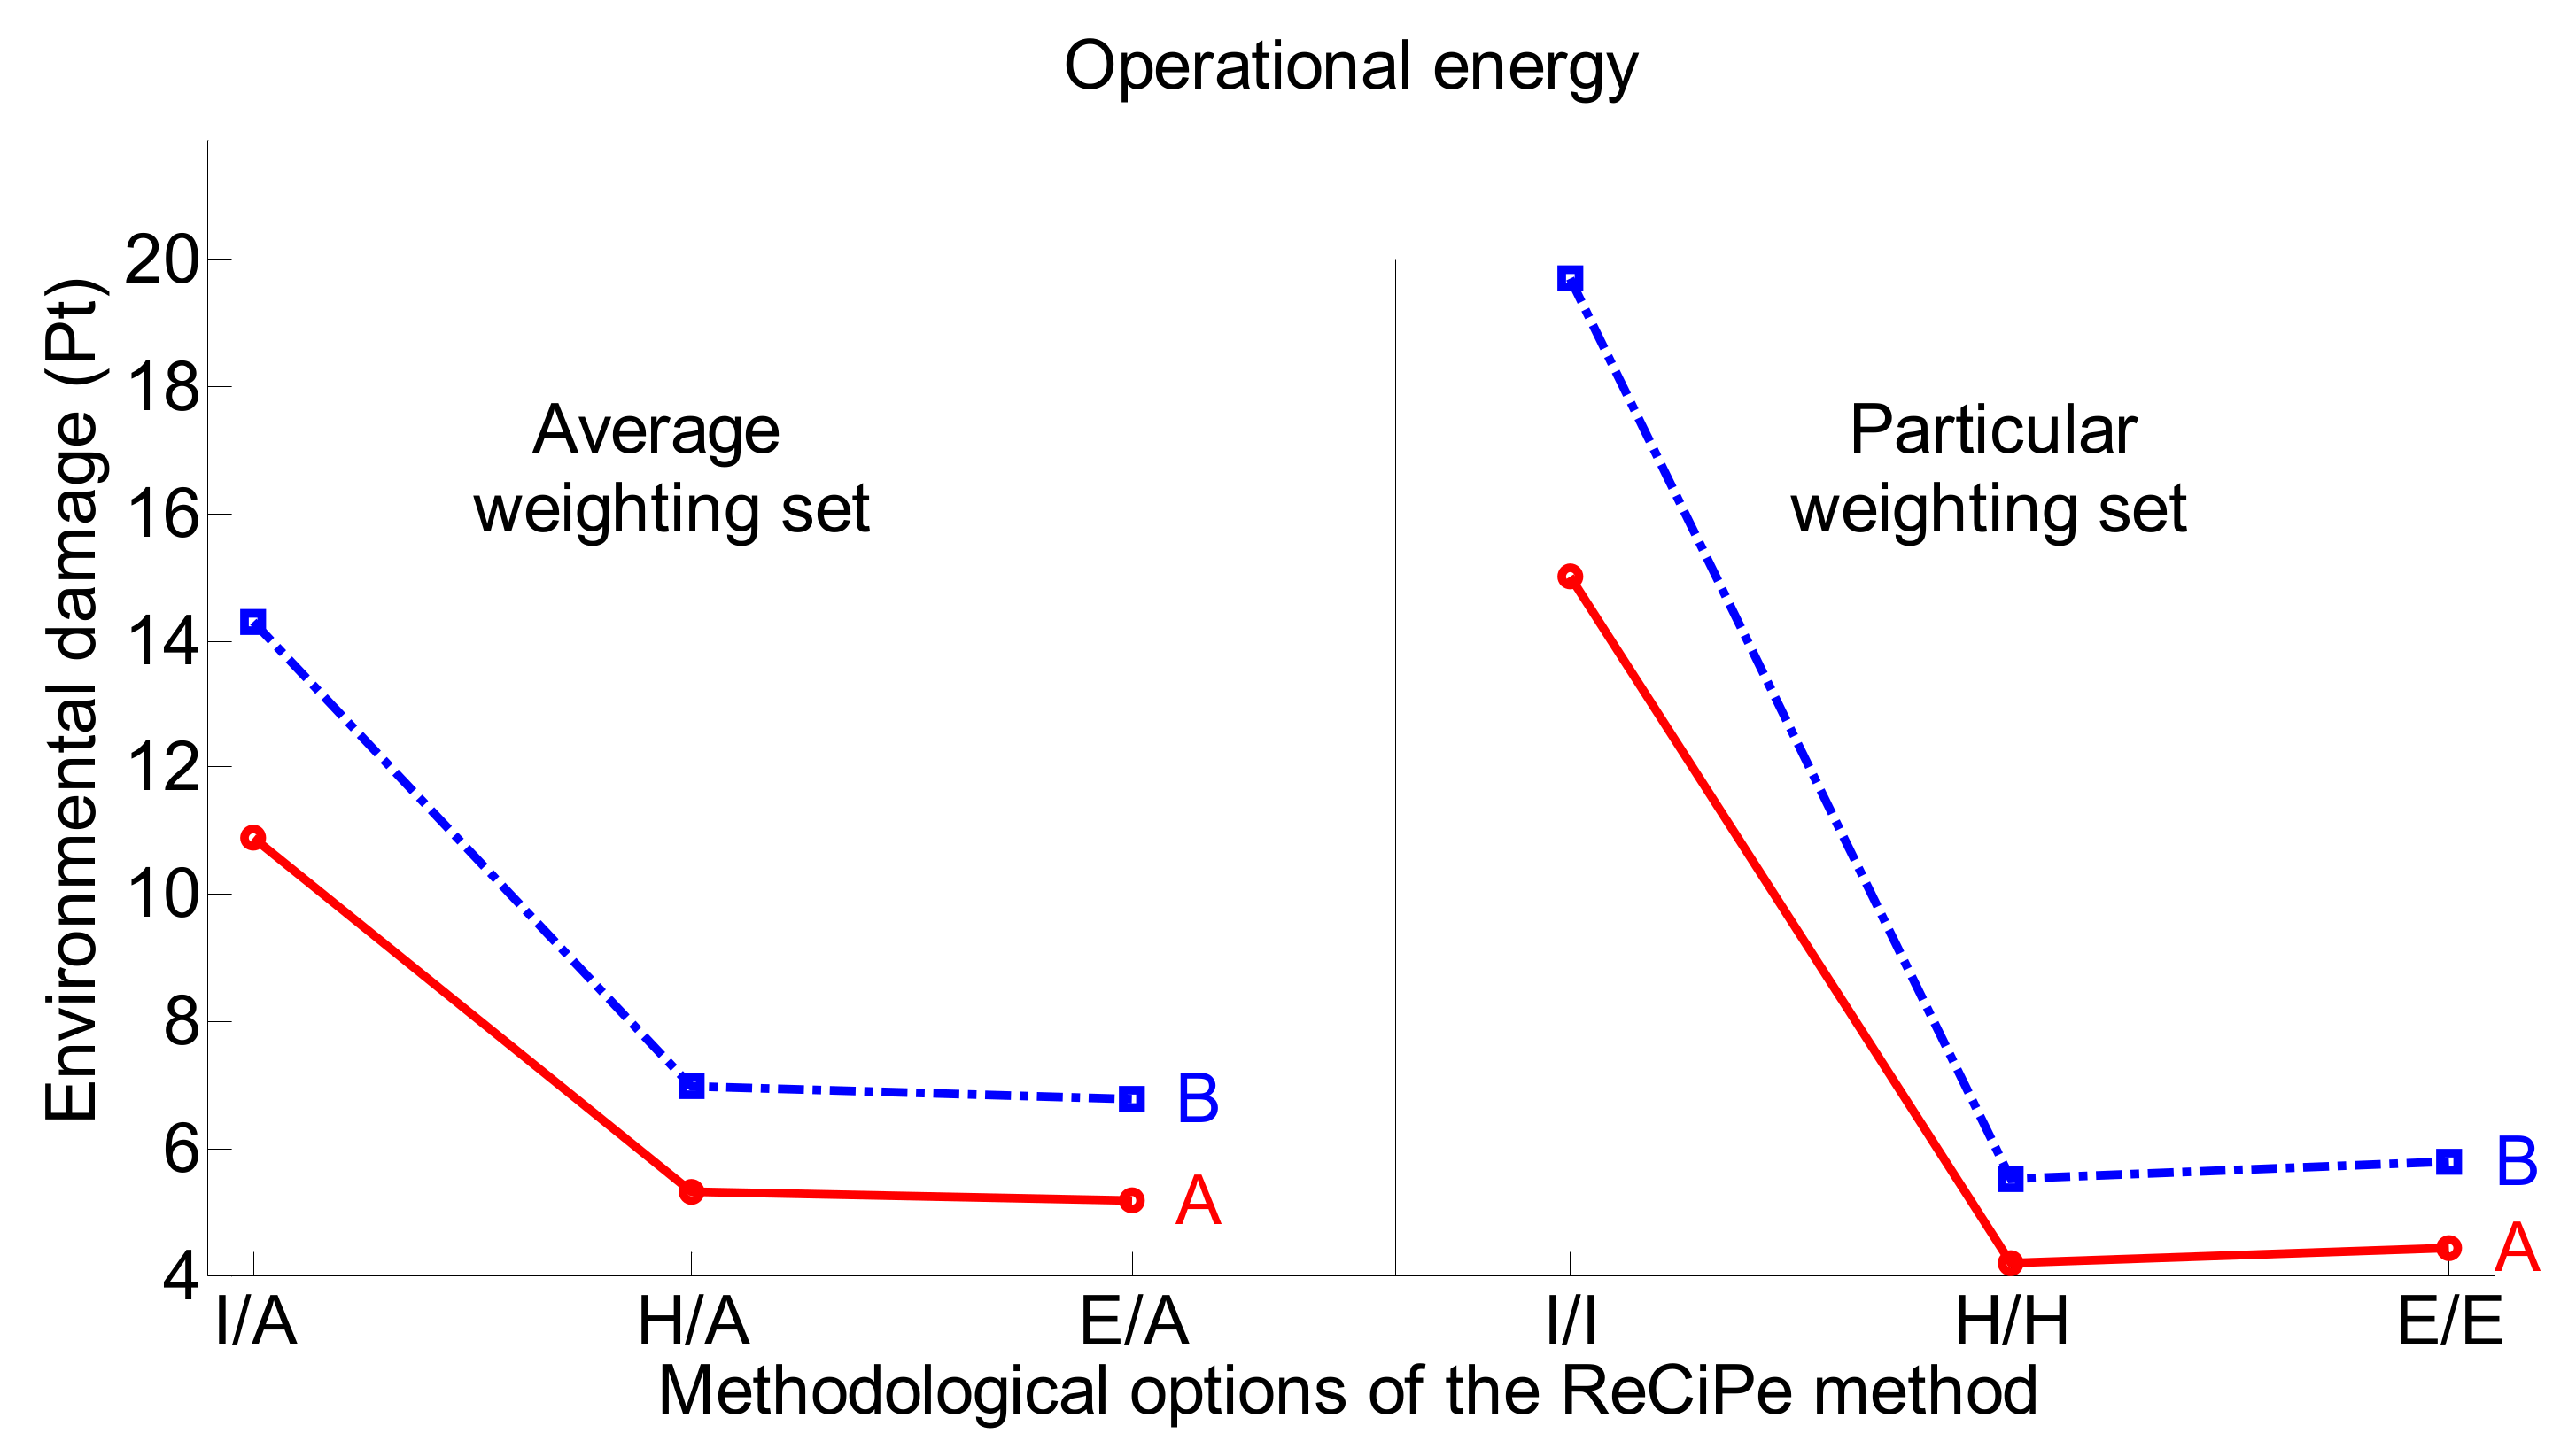
3.2.2. LCA of EAc1: End-Point Evaluation
Figure 4 shows the results of the EAc1 strategy used by groups 1 and 2. According to all six methodological options: I/A, H/A, E/A, I/I, H/H, and E/E, the environmental damage of group 1 was significantly lower than that of group 2 (p = 0.0040).
Thus, the mid-point results for only four of the environmental impacts presented earlier (Figure 3) were confirmed by the end-point scale, which analyzes a wide range of environmental impacts (22) from three different perspectives: individualistic, hierarchical, and egalitarian (Figure 4). In addition, the two-stage ANOVA test, in combination with the hierarchical structure of ReCiPe2016 (Figure 2), made it possible to evaluate the resulting statistical differences between the certification strategies of group 1 and group 2 (Figure 4).
4. Conclusions
In the introduction, it was shown that the relationship between the EA category and the rest of the LEED categories for California, Manhattan, and Shanghai differed significantly. As a result, the LCAs of LEED-certified projects at the same certification level were different. The present study shows that the relationship between the EA category and the rest of the LEED categories for Germany was not similar to that in the mentioned articles. In addition, the LCA results of buildings (especially operational energy for a building’s heating, cooling, and lighting) are highly dependent on the balance between nonrenewable (coal and gas) and renewable (solar, wind, and hydro) energy used in the building sector. Therefore, the LCA of LEED-certified projects must be carried out in each individual country and, if necessary, in separate regions of the country. An appropriate study design and appropriate statistical analysis must be used to obtain real results.
In this context, an appropriate study design includes a homogeneous group in which one factor is variable and the other factors are fixed as much as possible. Appropriate statistical analyses of ordinal and binary LEED data are nonparametric tests of significance and measure the effect size. The use of a similar study design and similar statistical analysis allows for the comparison of results from different studies. The study of green construction by analyzing LEED-certified projects in different countries allows researchers to identify different LEED certification strategies and therefore find the best way to reduce environmental damage in the global building sector.
In particular, this study analyzed two different strategies of LEED-NC v3 gold-certified office space projects in Germany. The first strategy included high achievements in the EAc1 (optimize energy performance), and the second strategy included low achievements in the EAc1. The following conclusions were reached:
The certification strategy for the SS, WE, EA, MR, and EQ credits of both groups was basically the same. This means that both groups had the same high-achieving credits, such as SSc4.1–4.4: Alternative transportation, WEc1: Water efficient landscaping, WEc3: Water use reduction, EAc4: Enhanced refrigerant management, MRc2: Construction waste management, MRc4: Recycled content, and EQc4.3 and 4.4: Low-emitting materials. These results provide guidance for LEED project professionals regarding high-scoring SS, WE, EA, MR, and EQ credits that form part of Germany’s certification strategy. In this way, Germany’s LEED practitioners can easily develop the most appropriate certification strategy within the time and cost constraints imposed by the project.
However, there were credits that achieved low scores. For example, MRc1.1 and 1.2: Building reuse, MRc3: Materials reuse, and MRc6: Rapidly renewable materials. This means that the problem of the efficient use of building materials in the country still exists. These results may encourage local governments to adopt policies that incentivize the use of reusable and rapidly renewable materials. In addition, they may lead to improved LEED training courses that can explain the importance of the currently unpopular credits.
EAc1 was of particular interest in this study. A significant difference was found between the OE savings in groups 1 and 2. In addition, in Germany, about 50% of OE is still produced by using fossil fuels, which leads to a large amount of greenhouse gas emissions. The LCA of the EAc1 achievements in groups 1 and 2 showed that the certification strategy used by group 1 was more environmentally preferable than that used by group 2. These results showed that the same level of LEED-NC (gold-certified) projects in Germany can lead to different levels of environmental damage. Thus, these results may encourage LEED managers to opt for high achievements in EAc1 for more sustainable development in the construction sector.
Funding
This research received no external funding.
Data Availability Statement
Publicly available data sets were analyzed in this study. The data can be found here: https://www.usgbc.org/projects (USGBC Projects Site) (accessed on 24 May 2023) and http://www.gbig.org (GBIG Green Building Data) (accessed on 24 May 2023).
Conflicts of Interest
The authors declare no conflict of interest.
Appendix A

Table A1.
LEED-NC v3 gold-certified office space projects at the sustainable sites (SS) credit level in Germany: group 1 versus group 2 (n1 = n2 = 13).
Table A1.
LEED-NC v3 gold-certified office space projects at the sustainable sites (SS) credit level in Germany: group 1 versus group 2 (n1 = n2 = 13).
| Credit | Maximum Points | Median, 25th–75th Percentiles (PAS) | p-Value | ||
|---|---|---|---|---|---|
| Group 1 | Group 2 | ||||
| SSc1, Site selection b | 1 | 1.0 1.0–1.0 (85) | 1.0 1.0–1.0 (100) | −1.77 | 0.1200 |
| SSc2, Development density and community connectivity a | 5 | 5.0 0.0–5.0 (69) | 5.0 5.0–5.0 (85) | −0.15 | 0.6447 |
| SSc3, Brownfield redevelopment b | 1 | 0.0 0.0–1.0 (46) | 1.0 0.0–1.0 (54) | −0.31 | 0.5753 |
| SSc4.1 Alternative transportation—public transportation access a | 6 | 6.0 6.0–6.0 (92) | 6.0 6.0–6.0 (92) | 0.00 | 1.0000 |
| SSc4.2, Alternative transportation—bicycle storage and changing rooms b | 1 | 1.0 1.0–1.0 (92) | 1.0 0.0–1.0 (62) | 2.01 | 0.0512 |
| SSc4.3, Alternative transportation—low-emitting and fuel-efficient vehicles a | 3 | 3.0 3.0–3.0 (85) | 3.0 3.0–3.0 (100) | −0.15 | 0.4800 |
| SSc4.4, Alternative transportation—parking capacity b | 2 | 2.0 0.0–2.0 (69) | 2.0 1.5–2.0 (77) | −0.39 | 0.5337 |
| SSc5.1, Site development—protect or restore habitat b | 1 | 0.0 0.0–1.0 (31) | 1.0 0.0–1.0 (54) | −0.97 | 0.1901 |
| SSc5.2, Site development—maximize open space b | 1 | 1.0 1.0–1.0 (92) | 1.0 1.0–1.0 (92) | 0.00 | 0.7400 |
| SSc6.1, Stormwater design—quantity control b | 1 | 0.0 0.0–1.0 (46) | 0.0 0.0–1.0 (46) | 0.00 | 0.8475 |
| SSc6.2, Stormwater design—quality control b | 1 | 0.0 0.0–0.0 (15) | 0.0 0.0–0.3 (23) | −0.50 | 0.4913 |
| SSc7.1, Heat island effect—nonroof b | 1 | 1.0 0.0–1.0 (62) | 1.0 1.0–1.0 (100) | −2.86 | 0.0098 |
| SSc7.2, Heat island effect—roof b | 1 | 1.0 0.0–1.0 (62) | 1.0 1.0–1.0 (85) | −1.23 | 0.1493 |
| SSc8, Light pollution reduction b | 1 | 0.0 0.0–1.0 (31) | 0.0 0.0–0.0 (15) | 0.89 | 0.2814 |
Note: the percentage of the average score (PAS)—the ratio of points obtained to the total points (expressed as a percentage). a Cliff’s δ and the exact Wilcoxon–Mann–Whitney test were used to estimate the differences between group 1 and group 2. b The natural logarithm of the odds ratio (lnθ) and Fisher’s exact test 2 × 2 tables were used to estimate the differences between group 1 and group 2.
Table A2.
LEED-NC v3 gold-certified office space projects at the water efficiency (WE) credit level in Germany: group 1 versus group 2 (n1 = n2 = 13).
Table A2.
LEED-NC v3 gold-certified office space projects at the water efficiency (WE) credit level in Germany: group 1 versus group 2 (n1 = n2 = 13).
| Credit | Maximum Points | Median, 25th–75th Percentiles (PAS) | p-Value | ||
|---|---|---|---|---|---|
| Group 1 | Group 2 | ||||
| WEc1, Water efficient landscaping a | 4 | 4.0 4.0 4.0 (100) | 4.0 4.0 4.0 (92) | 0.15 | 0.4800 |
| WEc2, Innovative wastewater technologies b | 2 | 0.0 0.0 2.0 (38) | 0.0 0.0 2.0 (38) | 0.00 | 0.8441 |
| WEc3, Water use reduction a | 4 | 4.0 2.3 4.0 (71) | 4.0 4.0 4.0 (94) | −0.33 | 0.0914 |
Note: the percentage of the average score (PAS)—the ratio of points obtained to the total points (expressed as a percentage). a Cliff’s δ and the exact Wilcoxon–Mann–Whitney test were used to estimate the differences between group 1 and group 2. b The natural logarithm of the odds ratio (lnθ) and Fisher’s exact test 2 × 2 tables were used to estimate the differences between group 1 and group 2.
Table A3.
LEED-NC v3 gold-certified office space projects at the material and resources (MR) credit level in Germany: group 1 versus group 2 (n1 = n2 = 13).
Table A3.
LEED-NC v3 gold-certified office space projects at the material and resources (MR) credit level in Germany: group 1 versus group 2 (n1 = n2 = 13).
| Credit | Maximum Points | Median, 25th–75th Percentiles (PAS) | p-Value | ||
|---|---|---|---|---|---|
| Group 1 | Group 2 | ||||
| MRc1.1, Building reuse—maintain existing walls, floors, and roof a | 3 | 0.0 0.0 0.0 (0) | 0.0 0.0 0.0 (0) | 0.00 | 1.0000 |
| MRc1.2, Building reuse—maintain interior nonstructural elements b | 1 | 0.0 0.0 0.0 (0) | 0.0 0.0 0.0 (0) | 0.00 | 0.5000 |
| MRc2, Construction waste management a | 2 | 2.0 0.0 2.0 (62) | 2.0 1.0 2.0 (77) | −0.14 | 0.5092 |
| MRc3, Materials reuse a | 2 | 0.0 0.0 0.0 (0) | 0.0 0.0 0.0 (0) | 0.00 | 1.0000 |
| MRc4, Recycled content a | 2 | 1.0 0.0 2.0 (58) | 1.0 1.0 2.0 (65) | −0.07 | 0.7985 |
| MRc5, Regional materials a | 2 | 2.0 1.0 2.0 (77) | 2.0 2.0 2.0 (96) | −0.24 | 0.2087 |
| MRc6, Rapidly renewable materials b | 1 | 0.0 0.0 0.0 (0) | 0.0 0.0 0.0 (0) | 0.00 | 0.5000 |
| MRc7, Certified wood b | 1 | 0.0 0.0 0.0 (8) | 0.0 0.0 0.3 (23) | −1.28 | 0.2200 |
Note: the percentage of the average score (PAS)—the ratio of points obtained to the total points (expressed as a percentage). a Cliff’s δ and the exact Wilcoxon–Mann–Whitney test were used to estimate the differences between group 1 and group 2. b The natural logarithm of the odds ratio (lnθ) and Fisher’s exact test 2 × 2 tables were used to estimate the differences between group 1 and group 2.
Table A4.
LEED-NC v3 gold-certified office space projects at the indoor environmental quality (EQ) credit level in Germany: group 1 versus group 2 (n1 = n2 = 13).
Table A4.
LEED-NC v3 gold-certified office space projects at the indoor environmental quality (EQ) credit level in Germany: group 1 versus group 2 (n1 = n2 = 13).
| Credit | Maximum Points | Median, 25th–75th Percentiles (PAS) | p-Value | ||
|---|---|---|---|---|---|
| Group 1 | Group 2 | ||||
| EQc1, Outdoor air delivery monitoring | 1 | 0.0 0.0 1.0 (46) | 0.0 0.0 1.0 (38) | 0.32 | 0.5712 |
| EQc2, Increased ventilation | 1 | 1.0 0.0 1.0 (62) | 1.0 0.0 1.0 (62) | 0.00 | 0.8441 |
| EQc3.1, Construction IAQ management plan—during construction | 1 | 1.0 1.0 1.0 (85) | 1.0 1.0 1.0 (100) | −1.77 | 0.1200 |
| EQc3.2, Construction IAQ management plan—before occupancy | 1 | 0.0 0.0 0.0 (15) | 0.0 0.0 1.0 (31) | −0.89 | 0.2814 |
| EQc4.1, Low-emitting materials—adhesives and sealants | 1 | 1.0 0.0 1.0 (69) | 1.0 1.0 1.0 (85) | −0.89 | 0.2814 |
| EQc4.2, Low-emitting materials—paints and coatings | 1 | 1.0 1.0 1.0 (85) | 1.0 1.0 1.0 (92) | −0.78 | 0.4150 |
| EQc4.3, Low-emitting materials—flooring systems | 1 | 0.0 0.0 1.0 (31) | 0.0 0.0 1.0 (31) | 0.00 | 0.8364 |
| EQc4.4, Low-emitting materials—composite wood and agrifiber products | 1 | 0.0 0.0 0.0 (15) | 0.0 0.0 0.0 (15) | 0.00 | 0.7965 |
| EQc5, Indoor chemical and pollutant source control | 1 | 0.0 0.0 0.3 (23) | 0.0 0.0 0.3 (23) | 0.00 | 0.8224 |
| EQc6.1, Controllability of systems—lighting | 1 | 0.0 0.0 0.3 (23) | 0.0 0.0 0.3 (23) | 0.00 | 0.8224 |
| EQc6.2, Controllability of systems—thermal comfort | 1 | 1.0 0.0 1.0 (69) | 0.0 0.0 1.0 (46) | 0.97 | 0.1901 |
| EQc7.1, Thermal comfort—design | 1 | 1.0 1.0 1.0 (85) | 1.0 0.0 1.0 (62) | 1.23 | 0.1493 |
| EQc7.2, Thermal comfort—verification | 1 | 1.0 0.0 1.0 (54) | 1.0 0.0 1.0 (54) | 0.00 | 0.8475 |
| EQc8.1, Daylight and views—daylight | 1 | 1.0 0.0 1.0 (69) | 1.0 0.8 1.0 (77) | −0.39 | 0.5337 |
| EQc8.2, Daylight and views—views | 1 | 1.0 1.0 1.0 (92) | 1.0 1.0 1.0 (85) | 0.78 | 0.4150 |
Note: the percentage of the average score (PAS)—the ratio of points obtained to the total points (expressed as a percentage).
References
- Suzer, O. A comparative review of environmental concern prioritization: LEED vs. other major certification systems. J. Environ. Manag. 2015, 154, 266–283. [Google Scholar] [CrossRef]
- Pushkar, S. The Effect of Regional Priority Points on the Performance of LEED 2009 Certified Buildings in Turkey, Spain, and Italy. Sustainability 2018, 10, 3364. [Google Scholar] [CrossRef] [Green Version]
- Wu, P.; Song, Y.; Wang, J.; Wang, X.; Zhao, X.; He, Q. Regional Variations of Credits Obtained by LEED 2009 Certified Green Buildings—A Country Level Analysis. Sustainability 2018, 10, 20. [Google Scholar] [CrossRef] [Green Version]
- Pushkar, S. A Comparative Analysis of Gold Leadership in Energy and Environmental Design for New Construction 2009 Certified Projects in Finland, Sweden, Turkey, and Spain. Appl. Sci. 2018, 8, 1496. [Google Scholar] [CrossRef] [Green Version]
- Pham, D.H.; Kim, B.; Lee, J.; Ahn, A.C.; Ahn, Y. A Comprehensive Analysis: Sustainable Trends and Awarded LEED 2009 Credits in Vietnam. Sustainability 2020, 12, 852. [Google Scholar] [CrossRef] [Green Version]
- Toğan, V.; Thomollari, X. Credit Success Rates of Certified Green Buildings in Turkey. Tek. Dergi. 2020, 31, 10063–10084. [Google Scholar] [CrossRef] [Green Version]
- Pushkar, S.; Verbitsky, O. LEED-NC 2009 Silver to Gold certified projects in the US in 2012–2017: An appropriate statistical analysis. J. Green Build. 2019, 14, 83–107. [Google Scholar] [CrossRef]
- Wu, P.; Song, Y.; Shou, W.; Chi, H.; Chong, H.Y.; Sutrisna, M. A comprehensive analysis of the credits obtained by LEED 2009 certified green buildings. Renew. Sustain. Energy Rev. 2017, 68 Pt 1, 370–379. [Google Scholar] [CrossRef]
- Pushkar, S. Sacrificial Pseudoreplication in LEED Cross-Certification Strategy Assessment: Sampling Structures. Sustainability 2018, 10, 1353. [Google Scholar] [CrossRef] [Green Version]
- Pushkar, S. Life-Cycle Assessment in the LEED-CI v4 Categories of Location and Transportation (LT) and Energy and Atmosphere (EA) in California: A Case Study of Two Strategies for LEED Projects. Sustainability 2022, 14, 10893. [Google Scholar] [CrossRef]
- Pushkar, S. Life-Cycle Assessment of LEED-CI v4 Projects in Shanghai, China: A Case Study. Sustainability 2023, 15, 5722. [Google Scholar] [CrossRef]
- Pushkar, S. LEED-CI v4 Projects in Terms of Life Cycle Assessment in Manhattan, New York City: A Case Study. Sustainability 2023, 15, 2360. [Google Scholar] [CrossRef]
- Gurgun, A.P.; Polat, G.; Damci, A.; Bayhan, H.G. Performance of LEED energy credit requirements in European countries. In Proceedings of the 5th Creative Construction Conference (CCC 2016), Budapest, Hungary, 25–28 June 2016; Elsevier: Amsterdam, The Netherlands, 2016; Volume 164, pp. 432–438. [Google Scholar]
- Sánchez Cordero, A.; Gómez Melgar, S.; Andújar Márquez, J.M. Green Building Rating Systems and the New Framework Level(s): A Critical Review of Sustainability Certification within Europe. Energies 2020, 13, 66. [Google Scholar] [CrossRef] [Green Version]
- Møller, R.S.; Rhodes, M.K.; Larsen, T.S. DGNB building certification companion: Sustainability tool for assessment, planning, learning, and engaging (Staple). Int. J. Energy Prod. Mgmt. 2018, 3, 57–68. [Google Scholar] [CrossRef]
- Pauliuk, S.; Heeren, N. Material efficiency and its contribution to climate change mitigation in Germany: A deep decarbonization scenario analysis until 2060. J. Ind. Ecol. 2021, 25, 479–493. [Google Scholar] [CrossRef]
- Western, L.M.; Redington, A.L.; Manning, A.J.; Trudinger, C.M.; Hu, L.; Henne, S.; Fang, X.; Kuijpers, L.J.M.; Theodoridi, C.; Godwin, D.S.; et al. A renewed rise in global HCFC-141b emissions between 2017–2021. Atmos. Chem. Phys. 2022, 22, 9601–9616. [Google Scholar] [CrossRef]
- Scutaru, A.M.; Witterseh, T. Risk Mitigation for Indoor Air Quality using the Example of Construction Products–Efforts Towards a Harmonization of the Health-Related Evaluation in the EU. Int. J. Hyg. Environ. Health 2020, 229, 113588. [Google Scholar] [CrossRef]
- Osseweijer, F.J.; van den Hurk, L.B.; Teunissen, E.J.; van Sark, W.G. A comparative review of building integrated photovoltaics ecosystems in selected European countries. Renew. Sustain. Energy Rev. 2018, 90, 1027–1040. [Google Scholar] [CrossRef]
- Ritchie, H.; Roser, M. Germany: Energy Country Profile. Our World in Data. 2022. Available online: https://ourworldindata.org/energy/country/germany (accessed on 25 May 2023).
- Sadik-Zada, E.R.; Gonzalez, E.D.S.; Gatto, A.; Althaus, T.; Quliyev, F. Pathways to the hydrogen mobility futures in German public transportation: A scenario analysis. Renew. Energy 2023, 205, 384–392. [Google Scholar] [CrossRef]
- ISO 14040; Environmental Management Life Cycle Assessment Principles and Framework. International Organization for Standardization: Geneva, Switzerland, 2006.
- ISO13315-1; Environmental Management for Concrete and Concrete Structures 2012, Part. 1: General Principles. International Organization for Standardization: Geneva, Switzerland, 2012.
- USGBC Projects Site. Available online: https://www.usgbc.org/projects (accessed on 24 May 2023).
- GBIG Green Building Data. Available online: http://www.gbig.org (accessed on 24 May 2023).
- Bergmann, R.; Ludbrook, J.; Spooren, W.P.J.M. Different outcomes of the Wilcoxon-Mann-Whitney test from different statistics packages. Am. Stat. 2000, 54, 72–77. [Google Scholar]
- Hurlbert, S.H. Pseudoreplication and the Design of Ecological Field Experiments. Ecol. Monogr. 1984, 54, 187–211. Available online: https://www.uvm.edu/~ngotelli/Bio%20264/Hurlbert.pdf (accessed on 24 May 2023). [CrossRef] [Green Version]
- Mundry, R.; Fischer, J. Use of statistical programs for nonparametric tests of small samples often leads to incorrect p values: Examples from animal behaviour. Anim. Behav. 1998, 56, 256–259. [Google Scholar] [CrossRef] [PubMed] [Green Version]
- Pham, D.H.; Kim, B.; Lee, J.; Ahn, Y. An Investigation of the Selection of LEED Version 4 Credits for Sustainable Building Projects. Appl. Sci. 2020, 10, 7081. [Google Scholar] [CrossRef]
- Cliff, N. Dominance statistics: Ordinal analyses to answer ordinal questions. Psychol. Bull. 1993, 114, 494–509. [Google Scholar] [CrossRef]
- Bland, J.M.; Altman, D.G. The odds ratio. BMJ 2000, 320, 1468. [Google Scholar] [CrossRef] [Green Version]
- Romano, J.; Corragio, J.; Skowronek, J. Appropriate statistics for ordinal level data: Should we really be using t-test and Cohen’s d for evaluating group differences on the NSSE and other surveys? In Proceedings of the Annual Meeting of the Florida Association of Institutional Research, Cocoa Beach, FL, USA, 1–3 February 2006; Florida Association for Institutional Research: Cocoa Beach, FL, USA, 2006; pp. 1–33. [Google Scholar]
- Chen, H.; Cohen, P.; Chen, S. How Big is a Big Odds Ratio? How big is a big odds ratio? Interpreting the magnitudes of odds ratios in epidemiological studies. Commun. Stat. Simulat. Comput. 2010, 39, 860–864. [Google Scholar] [CrossRef]
- Routledge, R.D. Resolving the conflict over Fisher’s exact test. Can. J. Statist. 1992, 20, 201–209. Available online: https://www.jstor.org/stable/3315468 (accessed on 31 January 2023).
- Hurlbert, S.H.; Lombardi, C.M. Lopsided reasoning on lopsided tests and multiple comparisons. Aust. N. Z. J. Stat. 2012, 54, 23–42. [Google Scholar] [CrossRef]
- PRé Consultants. SimaPro, Version 9.1. 0.35; PRé Consultants: Amersfoort, The Netherlands, 2019.
- LEED 2009 for New Construction and Major Renovations. 2014. Available online: https://energy.nv.gov/uploadedFiles/energynvgov/content/2009_NewConstruction.pdf (accessed on 24 May 2023).
- Hu, M.; Qiu, Y. A comparison of building energy codes and policies in the USA, Germany, and China: Progress toward the net-zero building goal in three countries. Clean Technol. Environ. Policy 2019, 21, 291–305. [Google Scholar] [CrossRef]
- Huijbregts, M.A.J.; Steinmann, Z.J.N.; Elshout, P.M.F.; Stam, G.; Verones, F.; Vieira, M.; Zijp, M.; Hollander, A.; van Zelm, R. ReCiPe2016: A harmonised life cycle impact assessment method at midpoint and endpoint level. Int. J. Life Cycle Assess. 2017, 22, 138–147. [Google Scholar] [CrossRef]
- Verbitsky, O.; Pushkar, S. Eco-Indicator 99, ReCiPe, and ANOVA for evaluating building technologies under LCA uncertainties. Environ. Eng. Manag. J. 2018, 17, 2549–2559. [Google Scholar]
- Picquelle, S.J.; Mier, K.L. A practical guide to statistical methods for comparing means from two-stage sampling. Fish. Res. 2011, 107, 1–13. [Google Scholar] [CrossRef]
- Sewilam, H.; Nacken, H.; Breuer, R.; Pyka, C. Competence-based and game-based capacity development for sustainable water management in Germany. Environ. Earth Sci. 2017, 76, 131. [Google Scholar] [CrossRef]
- Steins, J.J.; Volk, R.; Schultmann, F. Modelling and predicting the generation of post-demolition autoclaved aerated concrete (AAC) volumes in Germany until 2050. Resour. Conservat. Recycl. 2021, 171, 105504. [Google Scholar] [CrossRef]
- Venkatesh, A.; Jaramillo, P.; Griffin, W.M.; Matthews, H.S. Uncertainty in Life Cycle Greenhouse Gas Emissions from United States Coal. Energy Fuels 2012, 26, 4917–4923. [Google Scholar] [CrossRef]
- Igos, E.; Rugani, B.; Rege, S.; Benetto, E.; Drouet, L.; Zachary, D.S. Combination of equilibrium models and hybrid life cycle-input-output analysis to predict the environmental impacts of energy policy scenarios. Appl. Energy 2015, 145, 234–245. [Google Scholar] [CrossRef] [Green Version]
- Kouloumpis, V.; Kalogerakis, A.; Pavlidou, A.; Tsinarakis, G.; Arampatzis, G. Should Photovoltaics Stay at Home? Comparative Life Cycle Environmental Assessment on Roof-Mounted and Ground-Mounted Photovoltaics. Sustainability 2020, 12, 9120. [Google Scholar] [CrossRef]
- Mekonnen, M.M.; Hoekstra, A.Y. The blue water footprint of electricity from hydropower. Hydrol. Earth Syst. Sci. 2012, 16, 179–187. [Google Scholar] [CrossRef] [Green Version]
Figure 1.
A scheme of the methodology for a two-step evaluation procedure of the LCAs of groups 1 and 2 and their LEED-NC certification strategies.
Figure 1.
A scheme of the methodology for a two-step evaluation procedure of the LCAs of groups 1 and 2 and their LEED-NC certification strategies.

Figure 2.
ReCiPe2016 hierarchical structure: statistical comparison between groups 1 and 2.

Figure 3.
Impact-based mid-point ReCiPe2016 (H/A) results of the EAc1 certification strategies used by groups 1 (A) and 2 (B).
Figure 3.
Impact-based mid-point ReCiPe2016 (H/A) results of the EAc1 certification strategies used by groups 1 (A) and 2 (B).


Figure 4.
Damage-based end-point ReCiPe2016 results for the EAc1 certification strategies used by groups 1 (A) and 2 (B). There was differences between both groups (p = 0.0040).
Figure 4.
Damage-based end-point ReCiPe2016 results for the EAc1 certification strategies used by groups 1 (A) and 2 (B). There was differences between both groups (p = 0.0040).

Table 1.
The LEED-NC v3: prerequisites and credits.
| Abbreviation | Prerequisite/Credit Title | Points |
|---|---|---|
| Sustainable Sites (SS) category | 26 | |
| SSp1 | Construction activity pollution prevention | – |
| SSc1 | Site selection | 1 |
| SSc2 | Development density and community connectivity | 5 |
| SSc3 | Brownfield redevelopment | 1 |
| SSc4.1 | Alternative transportation—public transportation access | 6 |
| SSc4.2 | Alternative transportation—bicycle storage and changing rooms | 1 |
| SSc4.3 | Alternative transportation—low-emitting and fuel-efficient vehicles | 3 |
| SSc4.4 | Alternative transportation—parking capacity | 2 |
| SSc5.1 | Site development—protect or restore habitat | 1 |
| SSc5.2 | Site development—maximize open space | 1 |
| SSc6.1 | Stormwater design—quantity control | 1 |
| SSc6.2 | Stormwater design—quality control | 1 |
| SSc7.1 | Heat island effect—nonroof | 1 |
| SSc7.2 | Heat island effect—roof | 1 |
| SSc8 | Light pollution reduction | 1 |
| Water Efficiency (WE) category | 10 | |
| WEp1 | Water use reduction | – |
| WEc1 | Water efficient landscaping | 4 |
| Wec2 | Innovative wastewater technologies | 2 |
| WEc3 | Water use reduction | 4 |
| Energy and Atmosphere (EA) category | 35 | |
| EAp1 | Fundamental commissioning of building energy systems | – |
| EAp2 | Minimum energy performance | – |
| EAp3 | Fundamental refrigerant management | – |
| EAc1 | Optimize energy performance | 19 |
| EAc2 | On-site renewable energy | 7 |
| EAc3 | Enhanced commissioning | 2 |
| EAc4 | Enhanced refrigerant management | 2 |
| EAc5 | Measurement and verification | 3 |
| EAc6 | Green power | 2 |
| Material and Resources (MR) category | 14 | |
| MRp1 | Storage and collection of recyclables | – |
| MRc1.1 | Building reuse—maintain existing walls, floors, and roof | 3 |
| MEc1.2 | Building reuse—maintain interior nonstructural elements | 1 |
| MRc2 | Construction waste management | 2 |
| MRc3 | Materials reuse | 2 |
| MRc4 | Recycled content | 2 |
| MRc5 | Regional materials | 2 |
| MRc6 | Rapidly renewable materials | 1 |
| MRc7 | Certified wood | 1 |
| Indoor Environmental Quality (EQ) category | 15 | |
| EQp1 | Minimum indoor air quality performance | – |
| EQp2 | Environmental tobacco smoke (ETS) control | – |
| EQc1 | Outdoor air delivery monitoring | 1 |
| EQc2 | Increased ventilation | 1 |
| EQc3.1 | Construction IAQ management plan—during construction | 1 |
| EQc3.2 | Construction IAQ management plan—before occupancy | 1 |
| EQc4.1 | Low-emitting materials—adhesives and sealants | 1 |
| EQc4.2 | Low-emitting materials—paints and coatings | 1 |
| EQc4.3 | Low-emitting materials—flooring systems | 1 |
| EQc4.4 | Low-emitting materials—composite wood and AgriFiber products | 1 |
| EQc5 | Indoor chemical and pollutant source control | 1 |
| EQc6.1 | Controllability of systems—lighting | 1 |
| EQc6.2 | Controllability of systems—thermal comfort | 1 |
| EQc7.1 | Thermal comfort—design | 1 |
| EQc7.2 | Thermal comfort—verification | 1 |
| EQc8.1 | Daylight and views—daylight | 1 |
| EQc8.2 | Daylight and views—views | 1 |
| Innovation in Design (ID) category | 6 | |
| IDc1 | Innovation in design | 5 |
| IDc2 | LEED accredited professional | 1 |
| Regional Priority (RP) category | 4 | |
| RPc1 | Regional priority | 4 |
| Total | 110 |
Table 2.
The LEED-NC v3/v4 project distribution among space types in Germany (accessed on 18 May 2023).
Table 2.
The LEED-NC v3/v4 project distribution among space types in Germany (accessed on 18 May 2023).
| Space-Type | LEED-NC v3 | LEED-NC v4 | ||||||
|---|---|---|---|---|---|---|---|---|
| Certified | Silver | Gold | Platinum | Certified | Silver | Gold | Platinum | |
| Datacenter | 0 | 0 | 3 | 4 | 0 | 0 | 0 | 0 |
| Health Care | 0 | 1 | 0 | 0 | 0 | 0 | 0 | 0 |
| Higher Education | 0 | 2 | 0 | 0 | 0 | 0 | 0 | 0 |
| Industrial Manufacturing | 1 | 3 | 3 | 0 | 0 | 0 | 0 | 0 |
| Laboratory | 0 | 1 | 1 | 0 | 0 | 0 | 0 | 0 |
| Lodging | 0 | 3 | 12 | 2 | 0 | 0 | 1 | 0 |
| Multifamily Residential | 0 | 0 | 2 | 0 | 0 | 0 | 0 | 0 |
| Office | 0 | 6 | 39 | 9 | 1 | 2 | 18 | 1 |
| Other | 0 | 3 | 1 | 0 | 0 | 0 | 2 | 0 |
| Public Assembly | 0 | 0 | 1 | 0 | 0 | 0 | 0 | 0 |
| Retail | 0 | 0 | 0 | 2 | 0 | 0 | 0 | 0 |
| Undefined | 0 | 0 | 1 | 0 | 0 | 0 | 0 | 0 |
| Warehouse and Distribution | 0 | 1 | 2 | 0 | 0 | 0 | 0 | 0 |
Table 3.
LEED-NC v3 gold-certified office space in Germany (groups 1 and 2).
| Highest LEED-NC v3 Gold-Certified Office Space EAc1 Achievement (Group 1) | ||
|---|---|---|
| Name of Project | Address and Certification Time (Month, Day, and Year) | EAc1 |
| Condor Campus—Gateway Gardens | Gateway Gardens, Frankfurt Am Main (2 October 2012) | 19 |
| Wilo Pioneer Cube | Nortkirchenstrasse 100, Dortmund (26 February 2021) | 19 |
| Kornmarkt Arkaden BT D–Buero | Bethmannstrasse 6, Frankfurt Am Main (25 September 2018) | 19 |
| NM I | Victor-Slotosch-Strasse 20, Frankfurt Am Main (25 September 2018) | 19 |
| Neubau Enervie Hagen | Platz der Impulse 1, Hagen (13 January 2015) | 18 |
| Siemens Erlangen Neubau SPE | Günther-Scharowsky-Strasse 2, Erlangen (28 June 2017) | 18 |
| Siemens Forchheim | An der Lände 9, Forchheim (30 May 2017) | 16 |
| House of Elements | Messeallee 11, Essen (6 December 2017) | 16 |
| KION Headquarters | Thea-Rasche-Strasse 8, Frankfurt Am Main (6 December 2017) | 16 |
| Medienbruecke | Anzinger Strasse 19, Munich (8 July 2011) | 16 |
| ARENA | Adi-Dassler-Strasse 1, Herzogenaurach (29 June 2020) | 15 |
| FOM—Dietzingen | Ditzinger Strasse 8, Ditzingen (4 February 2015) | 15 |
| TUV Headquarter Energetic Renovation | Am Grauen Stein 1, Köln (17 May 2017) | 15 |
| Smallest LEED-NC v3 Gold-Certified Office Space EAc1 Achievement (Group 2) | ||
| Verwaltungsgebaeude Meiller | Ambossstrasse 4, Munich (2 June 2016) | 12 |
| TriCon | Ludwig-Erhard-Str. 21, Oberursel (17 September 2011) | 12 |
| KVH | Europa Allee Baufeld 42 C West, Frankfurt Am Main (23 January 2017) | 11 |
| ML36 | Mainzer Landstrasse 36, Frankfurt Am Main (27 April 2017) | 11 |
| Neue Mainzer Strasse 80 | Neue Mainzer Strasse 80, Frankfurt Am Main (8 May 2017) | 11 |
| Hafeninsel | Hafeninsel 9, Offenbach Am Main (16 April 2015) | 11 |
| SAP Innovation Center Potsdam | Nedlitzer Strasse 12, Potsdam (16 May 2014) | 11 |
| OSA Otto-Suhr-Allee Neubau | Otto-Suhr-Allee 6-16, Berlin (17 June 2017) | 10 |
| Alpha Rotex | Gateway Gardens, Frankfurt Am Main (21 January 2014) | 10 |
| Headquarters Healthineers Erlangen | Henkestrasse 127, Erlangen (22 March 2019) | 9 |
| Am Oktogon B1 | Rudower Chaussee 44, Berlin (20 February 2014) | 9 |
| FCA Fiat Chrysler Automobiles | Hanauer Landstrasse 166, Frankfurt Am Main (23 April 2018) | 5 |
| CNI–Airplus | Dornhofstrasse 10, Neu Isenburg (4 November 2013) | 4 |
Note: EAc1 medians of the projects located in Frankfurt Am Main were used to evaluate the LCAs of the credit achievements in groups 1 and 2.
Table 4.
Germany: energy share and ecoinvent data sources.
| Source | Share | Ecoinvent Data Source [36] |
|---|---|---|
| Coal | 31.05% | Electricity, hard coal, at power plant/DE |
| Wind energy | 21.63% | Electricity, at wind power plant/CH |
| Natural gas | 16.49% | Electricity, industrial gas, at power plant/DE |
| Photovoltaic | 10.12% | Electricity, production mix photovoltaic, at plant/DE |
| Bioenergy | 8.11% | Electricity, biomass, at power plant/US |
| Nuclear energy | 6.26% | Electricity, nuclear, at power plant/DE |
| Oil energy | 3.31% | Electricity, oil, at power plant/DE |
| Hydropower energy | 2.99% | Electricity, hydropower, at power plant/DE |
| Other renewables | 0.04% | – |
Note: DE: Germany; CH: Switzerland; US: the United States.
Table 5.
LEED-NC v3 gold-certified office space projects at the category level in Germany: group 1 versus group 2 (n1 = n2 = 13).
Table 5.
LEED-NC v3 gold-certified office space projects at the category level in Germany: group 1 versus group 2 (n1 = n2 = 13).
| Category | Maximum Points | Median, 25th–75th Percentiles (PAS) | p-Value | ||
|---|---|---|---|---|---|
| Group 1 | Group 2 | ||||
| Sustainable sites (SS) | 26 | 20.0 15.0–22.0 (71) | 22.0 18.5–22.3 (79) | –0.40 | 0.0761 |
| Water efficiency (WE) | 10 | 8.0 6.3–10.0 (76) | 8.0 8.0–10.0 (82) | –0.15 | 0.5230 |
| Energy and atmosphere (EA) | 35 | 21.0 20.8–24.0 (63) | 13.0 12.0–16.0 (40) | 0.92 | <0.0001 |
| Material and resources (MR) | 14 | 5.0 2.0–6.0 (29) | 5.0 4.8–6.0 (36) | –0.21 | 0.3601 |
| Indoor Environmental Quality (EQ) | 15 | 7.0 6.0–11.0 (55) | 8.0 6.8–10.3 (55) | –0.01 | 0.9710 |
| Innovation in design (ID) | 6 | 3.0 3.0–4.0 (58) | 4.0 3.0–4.0 (62) | –0.23 | 0.4283 |
| Regional priority (RP) | 4 | 4.0 2.8–4.0 (79) | 4.0 3.8–4.0 (94) | –0.28 | 0.1716 |
| LEED total | 110 | 67.0 64.8–69.3 | 64.0 62.5–64.3 | 0.63 | 0.0048 |
Note: The percentage of the average score (PAS)—the ratio of points obtained to the total points (expressed as a percentage).
Table 6.
LEED-NC v3 gold-certified office space projects at the energy and atmosphere (EA) credit level in Germany: group 1 versus group 2 (n1 = n2 = 13).
Table 6.
LEED-NC v3 gold-certified office space projects at the energy and atmosphere (EA) credit level in Germany: group 1 versus group 2 (n1 = n2 = 13).
| Credit | Maximum Points | Median, 25th–75th Percentiles (PAS) | p-Value | ||
|---|---|---|---|---|---|
| Group 1 | Group 2 | ||||
| EAc1, Optimize energy performance a | 19 | 16.0 15.8 19.0 (89) | 11.0 9.0 11.0 (51) | 1.00 | <0.0001 |
| EAc2, On-site renewable energy a | 7 | 0.0 0.0 0.5 (10) | 0.0 0.0 0.0 (1) | 0.17 | 0.2200 |
| EAc3, Enhanced commissioning b | 2 | 0.0 0.0 2.0 (38) | 0.0 0.0 2.0 (46) | –0.32 | 0.5712 |
| EAc4, Enhanced refrigerant management b | 2 | 2.0 2.0 2.0 (92) | 2.0 2.0 2.0 (100) | –1.18 | 0.2500 |
| EAc5, Measurement and verification a | 3 | 0.0 0.0 3.0 (46) | 0.0 0.0 1.5 (26) | 0.19 | 0.4109 |
| EAc6, Green power b | 2 | 0.0 0.0 0.5 (23) | 0.0 0.0 2.0 (31) | –0.39 | 0.5337 |
Note: The percentage of the average score (PAS)—the ratio of points obtained to the total points (expressed as a percentage). a Cliff’s δ and the exact Wilcoxon–Mann–Whitney test were used to estimate the differences between group 1 and group 2. b The natural logarithm of the odds ratio (lnθ) and Fisher’s exact test 2 × 2 tables were used to estimate the differences between group 1 and group 2.
Table 7.
The most popular SS, WE, MR, and EQ credits of LEED-NC v3 gold-certified office space projects in Germany.
Table 7.
The most popular SS, WE, MR, and EQ credits of LEED-NC v3 gold-certified office space projects in Germany.
| Category (PAS) | Credits |
|---|---|
| SS (62 ≤ PAS ≤ 100) | SSc1: Site selection; SSc2: Development density and community connectivity; SSc4.1–4.4: Alternative transportation: public transportation access, bicycle storage and changing rooms, low-emitting and fuel-efficient vehicles, and parking capacity; SSc5.2: Site development: maximize open space; SSc7.1: Heat island effect: nonroof; SSc7.2: Heat island effect: roof. |
| WE (71 ≤ PAS ≤ 100) | WEc1: Water efficient landscaping; WEc3: Water use reduction. |
| MR (58 ≤ PAS ≤ 96) | MRc2: Construction waste management; MRc4: Recycled content; MRc5: Regional materials. |
| EQ (62 ≤ PAS ≤ 100) | EQc3.1: Construction IAQ management plan: during construction; EQc4.1, 4.2: Low-emitting materials: adhesives and sealants, paints and coatings; EQc7.1: Thermal comfort: design; EQc8.1, 8.2: Daylight and views: daylight, views. |
Table 8.
The least popular SS, WE, MR, and EQ credits of LEED-NC v3 gold-certified office space projects in Germany.
Table 8.
The least popular SS, WE, MR, and EQ credits of LEED-NC v3 gold-certified office space projects in Germany.
| Category (PAS) | Credits |
|---|---|
| SS (15 ≤ PAS ≤ 31) | SSc6.2: Stormwater design: quality control; SSc8: Light pollution reduction. |
| WE (PAS = 38) | WEc2: Innovative wastewater technologies. |
| MR (PAS = 0) | MRc1.1 and 1.2: Building reuse: maintain existing walls, floors, and roof and maintain interior nonstructural elements; MRc3: Materials reuse; MRc6: Rapidly renewable materials. |
| EQ (15 ≤ PAS ≤ 31) | EQc3.2: Construction IAQ management plan: before occupancy; EQc4.3 and 4.4: Low-emitting materials: flooring systems and composite wood and AgriFiber products; EQc5: Indoor chemical and pollutant source control; EQc6.1: Controllability of systems: lighting. |
Disclaimer/Publisher’s Note: The statements, opinions and data contained in all publications are solely those of the individual author(s) and contributor(s) and not of MDPI and/or the editor(s). MDPI and/or the editor(s) disclaim responsibility for any injury to people or property resulting from any ideas, methods, instructions or products referred to in the content. |
© 2023 by the author. Licensee MDPI, Basel, Switzerland. This article is an open access article distributed under the terms and conditions of the Creative Commons Attribution (CC BY) license (https://creativecommons.org/licenses/by/4.0/).
Share and Cite
MDPI and ACS Style
Pushkar, S. Strategies for LEED-NC-Certified Projects in Germany and Results of Their Life Cycle Assessment. Buildings 2023, 13, 1970. https://doi.org/10.3390/buildings13081970
AMA Style
Pushkar S. Strategies for LEED-NC-Certified Projects in Germany and Results of Their Life Cycle Assessment. Buildings. 2023; 13(8):1970. https://doi.org/10.3390/buildings13081970
Chicago/Turabian StylePushkar, Svetlana. 2023. "Strategies for LEED-NC-Certified Projects in Germany and Results of Their Life Cycle Assessment" Buildings 13, no. 8: 1970. https://doi.org/10.3390/buildings13081970
Note that from the first issue of 2016, this journal uses article numbers instead of page numbers. See further details here.