Article

Evaluating Reduction in Thermal Energy Consumption across Renovated Buildings in Latvia and Lithuania

by
Aleksejs Prozuments
1,*,
Anatolijs Borodinecs
1,*,
Sergejs Zaharovs
1,
Karolis Banionis
2,
Edmundas Monstvilas
2 and
Rosita Norvaišienė
2
1
Department of Heat Engineering and Technology, Faculty of Civil Engineering, Riga Technical University, LV-1048 Riga, Latvia
2
Institute of Architecture and Construction, Kaunas University of Technology, 44405 Kaunas, Lithuania
*
Authors to whom correspondence should be addressed.
Buildings 2023, 13(8), 1916; https://doi.org/10.3390/buildings13081916
Submission received: 21 June 2023 / Revised: 20 July 2023 / Accepted: 26 July 2023 / Published: 27 July 2023
(This article belongs to the Special Issue Healthy, Digital and Sustainable Buildings and Cities)

Abstract

:
Currently, the optimization of thermal energy consumption in buildings is considered a suitable alternative in the construction of new buildings, as a result of which the overall energy efficiency of the building increases. Thus, this study examined the efficiency and efficacy of different building renovation packages conducted across several buildings in Latvia and in Lithuania (across a larger building stock). In the first section of this study, 13 multi-apartment residential houses with 3 building renovation packages have been investigated in the city of Daugavpils, Latvia, in order to determine the actual reduction in heat energy consumption across each of the renovation implementation packages. The study findings indicate that changes in Latvian building regulations regarding insulation thickness did not significantly impact thermal energy consumption in fully renovated buildings. However, the combination of facade renovations, upgraded heating systems, and improved ventilation systems resulted in substantial energy savings, with an average reduction of 50.59% in thermal energy consumption for space heating across the reviewed multi-apartment residential building stock. In the following section of this study, the impact of the Energy Performance of Buildings Directive (EPBD) on building energy efficiency in Lithuania has been examined. The results show that over a 10-year period in the 2000s, Lithuanian building stock experienced a 20% increase in energy efficiency, followed by an additional 6.3% increase between 2010 and 2016. The mandatory requirement for renovated buildings to achieve a minimum energy efficiency class has resulted in significant reductions in energy consumption for heating purposes. The findings underscore the effectiveness of building renovation packages and the EPBD regulations in enhancing energy efficiency and promoting sustainable building practices. The importance of heat metering, consideration of indoor air temperature, and the need to address indoor air quality during renovations were also highlighted.

1. Introduction

With the rising demand for energy and the diminishing availability of fossil fuel-based energy sources, which are both environmentally unsustainable and costly, enhancing the energy efficiency of building stock is a matter of concern worldwide. Building stock accounts for approximately 40% of total final energy use across developed countries, constituting up to one-third of the worldwide greenhouse gas emissions. Thus, upgrading existing buildings to be more energy efficient and implementing sustainable design principles are crucial. This necessitates the adoption of advanced technologies, innovative building materials, and energy-efficient systems to reduce energy consumption and promote a transition toward renewable and low-carbon energy sources. By upgrading the energy efficiency of the existing building stock, governments can mitigate energy demand, enhance energy security, and contribute to the overall sustainability and resilience of the built environment, as well as meet carbon emission reduction targets stipulated in their agenda [1,2].
Building energy efficiency is a dynamically and rapidly growing field and has certainly become a separate industry and a research area over recent decades, as it requires an involvement of highly skilled professionals and continuous research and development activities. In line with the industry’s growth, the market availability and promotion of sustainable and energy-efficient products and solutions has increased. This development is in large part driven by national and regional energy and environmental building codes and regulations. Regulatory building codes have proven to be an effective way to promote energy efficiency in buildings. Many governments across the world have put forward nationwide long-term energy use reduction goals for newly constructed and existing building stock that are reinforced by stringent UN regulations aimed at addressing the environmental impact and climate change [3,4,5,6,7].
Residential heating is a compelling issue requiring immediate attention, particularly in regions characterized by mild and cold climates, where low outdoor temperatures persist for extended periods and the heating season lasts approximately 5–6 months. These conditions necessitate efficient and effective heating systems to maintain comfortable indoor environments and reduce building energy consumption. The duration of the heating period is of particular importance as it influences energy demand, costs, and has a substantial environmental impact. Therefore, in these regions, careful consideration must be given to the selection and optimization of building energy efficiency, including heating technology, such as centralized heating systems, heat pumps, or alternative energy sources, to ensure sustainable and cost-effective solutions for residential heating needs [8,9].
Latvia and Lithuania, as Northern European countries, have been implementing and continue to implement energy efficiency programs for existing and future building stock, which help reduce energy consumption and GHG emissions. One of the feasible approaches to reduce the energy consumption of a building is a partial or full renovation. A partial renovation of a residential building is primarily related to insulating the building envelope or retrofitting the heating system, while the full renovation of the building includes both the insulation of the building envelope and the modernization of the heating system [10,11,12]. It should be noted that before implementing measures to upgrade a building’s energy efficiency, what measures stipulate higher feasibility in energy consumption reduction and economic terms have to be thoroughly evaluated [13,14,15].
Buildings in the EU-27 account for approximately 55% of total electricity consumption and roughly 40% of total final energy consumption on average. Followed by transport and industry, the building industry is the largest end-use energy sector in Europe [16,17,18]. In Latvia and Lithuania, buildings’ energy use share is higher than the EU-27 average (45%) due to the poor energy performance of the existing building stock that features a high share of structures constructed between 1945 and 1990, and is now obsolete with regards to meeting stringent energy performance criteria. Up until the late 1990s and early 2000s, buildings in Latvia and Lithuania were constructed in accordance with regulatory codes, which were insufficiently rigorous and thorough with regards to thermal performance stipulations. As a result, the bulk of the existing building stock that has not undergone deep renovation features poor thermal insulation, excessive outdoor air infiltration, and condensation occurrence within the external wall structures. Moreover, the absolute majority of the building stock constructed between 1945 and 1990 lacks mechanical ventilation systems, and thus the air exchange occurs due to natural ventilation and/or outdoor air infiltration through the external elements (walls and roofs), which entails major thermal energy losses, especially during critical cold season months [19,20,21].
As building energy consumption continues to rise, it is expected to constitute an even larger proportion of the overall energy consumption. Consequently, it becomes imperative to devote more stringent and thorough attention to building energy efficiency. Enhancing energy efficiency in buildings is crucial for mitigating the environmental impact, reducing energy demand, and ensuring long-term sustainability [22,23,24]. This entails the implementation of rigorous building energy upgrade measures such as advanced building design, energy-efficient technologies, and effective energy management systems. By prioritizing building energy efficiency, governments can strive toward achieving energy conservation goals, reducing greenhouse gas emissions, and promoting a sustainable future [25,26,27].
Furthermore, it is important to note that there is a notable research gap in the field of renovation measure efficiency within the Baltic countries. While several studies have been conducted in this field in various regions worldwide, a limited number of studies have been conducted in the Baltic countries’ context.

2. Methodology

2.1. Building Selection Criteria: Case Study of Latvia

The research methodology pertained to analyzing the available thermal energy consumption data (kWh) of 13 renovated multi-apartment residential houses in Daugavpils (city in south-eastern Latvia) throughout the period from 2012 to 2021. This was aimed at identifying common guidelines that would help to classify various buildings that had undergone deep renovation in certain time periods, as well as understanding the effectiveness of energy efficiency measures. Taking into account the fact that the share of renovated residential houses in Daugavpils is very low (around 1% of the total multi-apartment residential stock), this study included multi-apartment residential buildings that meet the following criteria:
the multi-apartment residential house put into operation before the end of 2000;
the total combined floor area of the residential premises is greater than 300 m2;
the total floor area of uninhabitable premises (shop, office, etc.) does not exceed 50% of the total area of the residential building;
the technical documentation of the planned renovation package has been developed for energy efficiency improvement measures;
the multi-apartment building has received municipal or state co-financing support for the renovation project implementation.
The climate data for the city of Daugavpils are added in the table below (Table 1).
Daugavpils experiences a cold climate characterized by long, harsh winters. The city’s geographical position in the eastern part of the country exposes it to continental influences, resulting in significantly cold temperatures. The average winter temperatures in Daugavpils can often drop below freezing, requiring adequate heating measures to ensure comfort and energy efficiency in buildings. As is seen in Figure 1, the temperature range in the city of Daugavpils in the cold season of the year (October thru March) drops below 0 °C very frequently, falling even below −15 °C.
The datalogger used to measure the temperature, RH, and CO2 level was Extech Industries Datalogger SD800 (Table 2)

2.2. Profile of the Examined Buildings

All of the selected multi-apartment buildings were constructed before 1980, while the renovation measures to improve the energy efficiency of those buildings were implemented in the period from 2012 to 2020 (pertaining to the year of completion). The selected buildings were assigned a sequence number, as well as the building group category describing the renovation package with regards to the implemented renovation measures.
To attain the most impartial findings regarding accomplished energy efficiency advancements, the analyzed buildings were categorized into separate groups based on specific criteria (such as characteristics of structural elements, serial type of the multi-apartment building characterizing their total floor count, layout features and materials used in their building envelope, etc.). The photos of the analyzed building types are added in Figure 2. Considering the aforementioned criteria, the categorization of the renovation multi-apartment buildings is as follows:
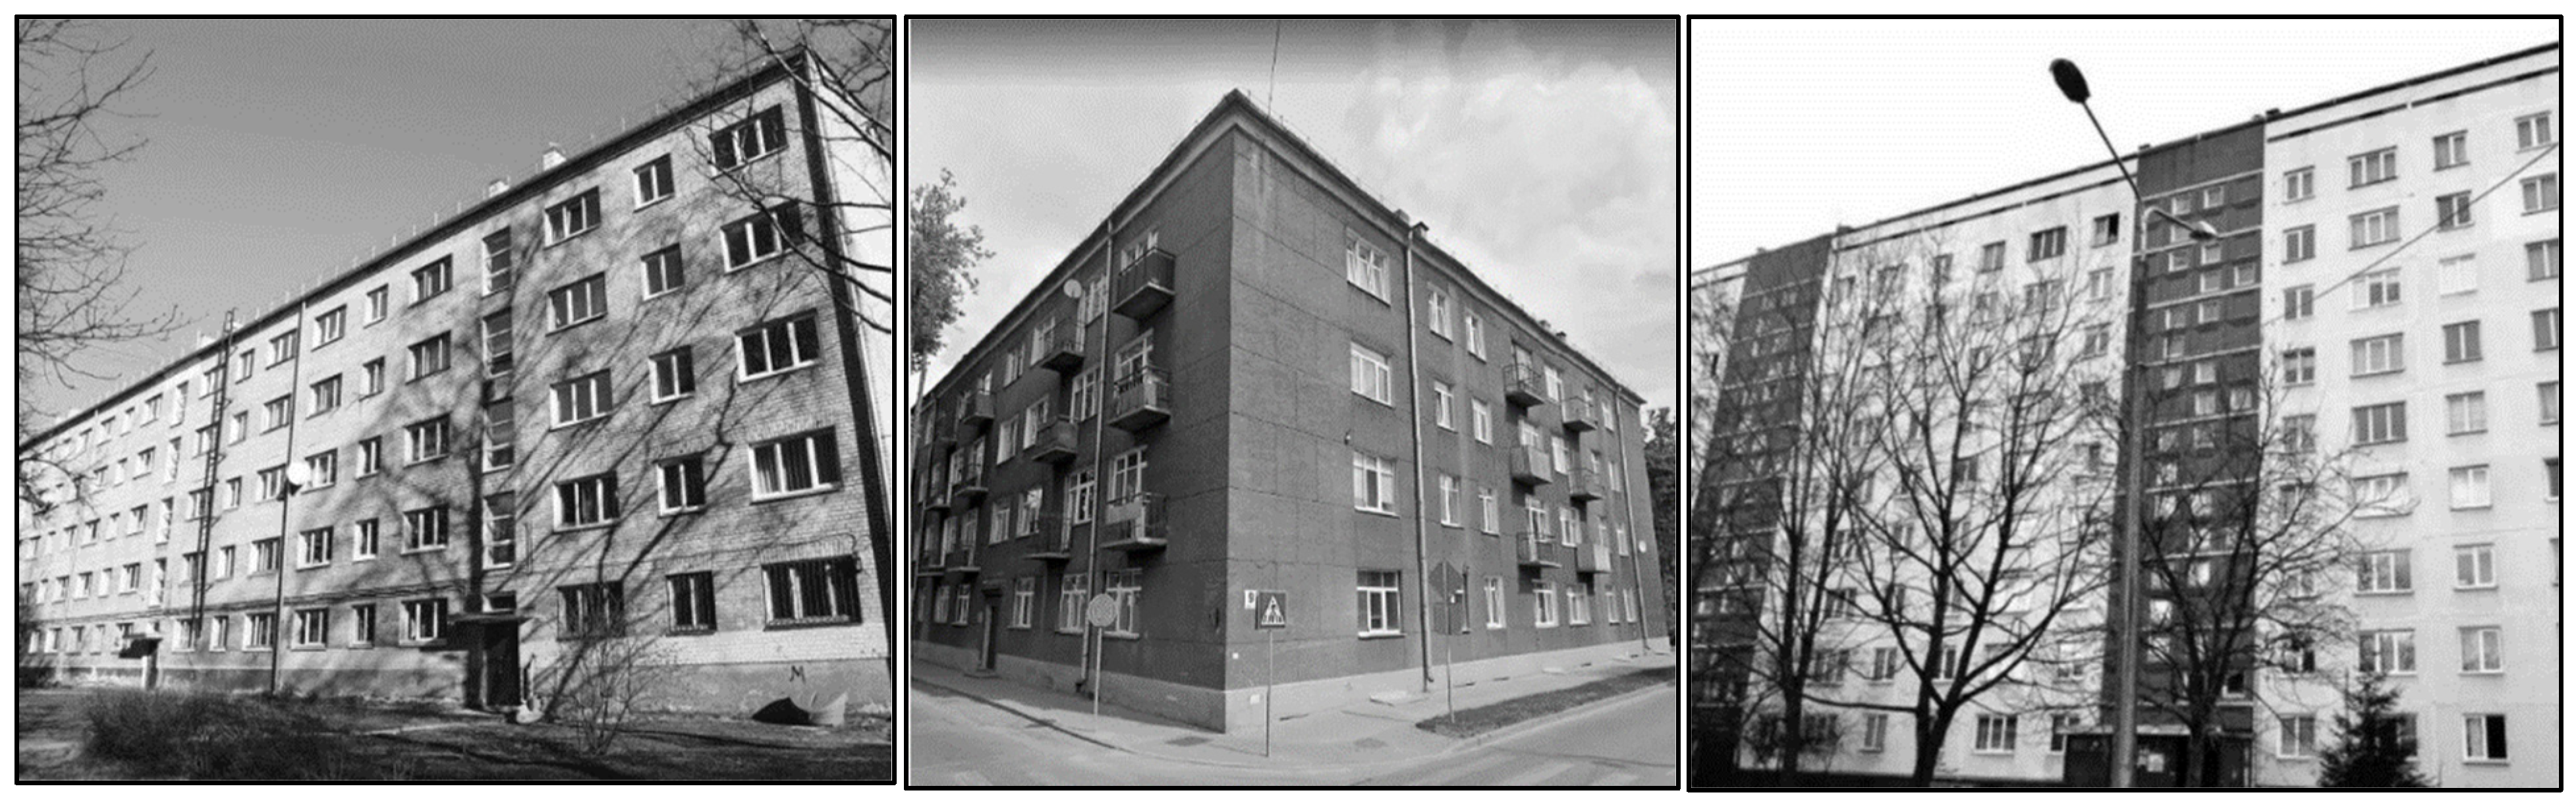
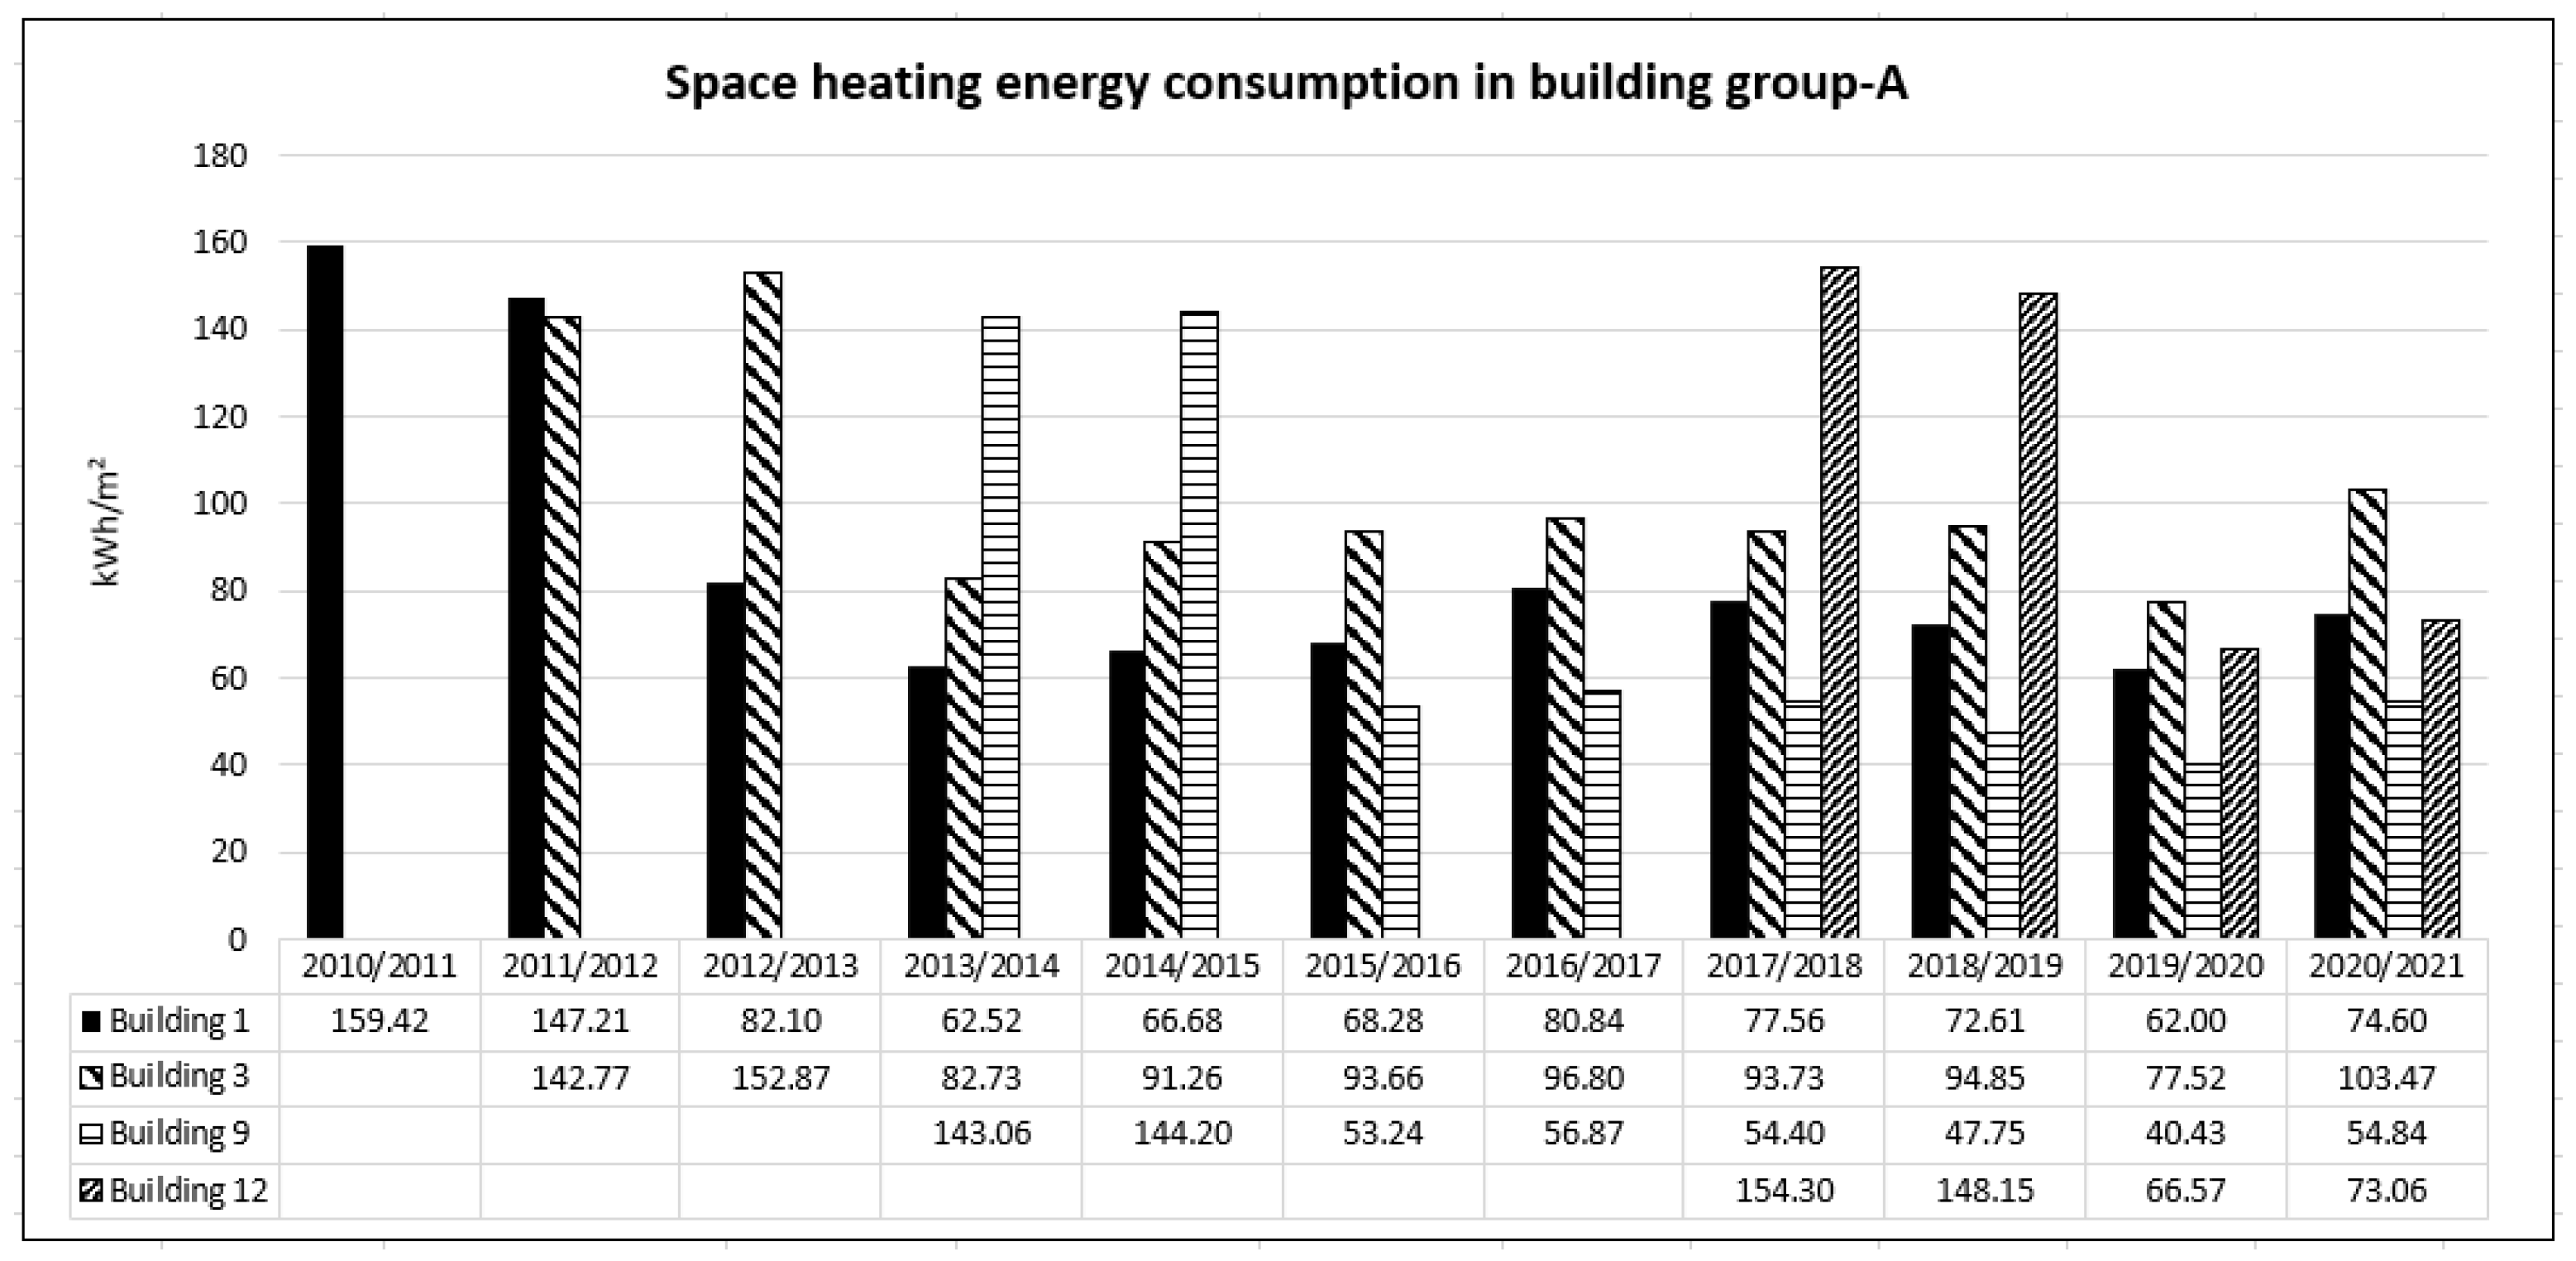
The A-group comprises buildings #1, #3, and #12, where the classification of buildings is based on the reference serial-type standard for residential houses (series 316), while building #9 belongs to an enhanced series of prior residential structures (series 318) constructed using similar materials as series 316.
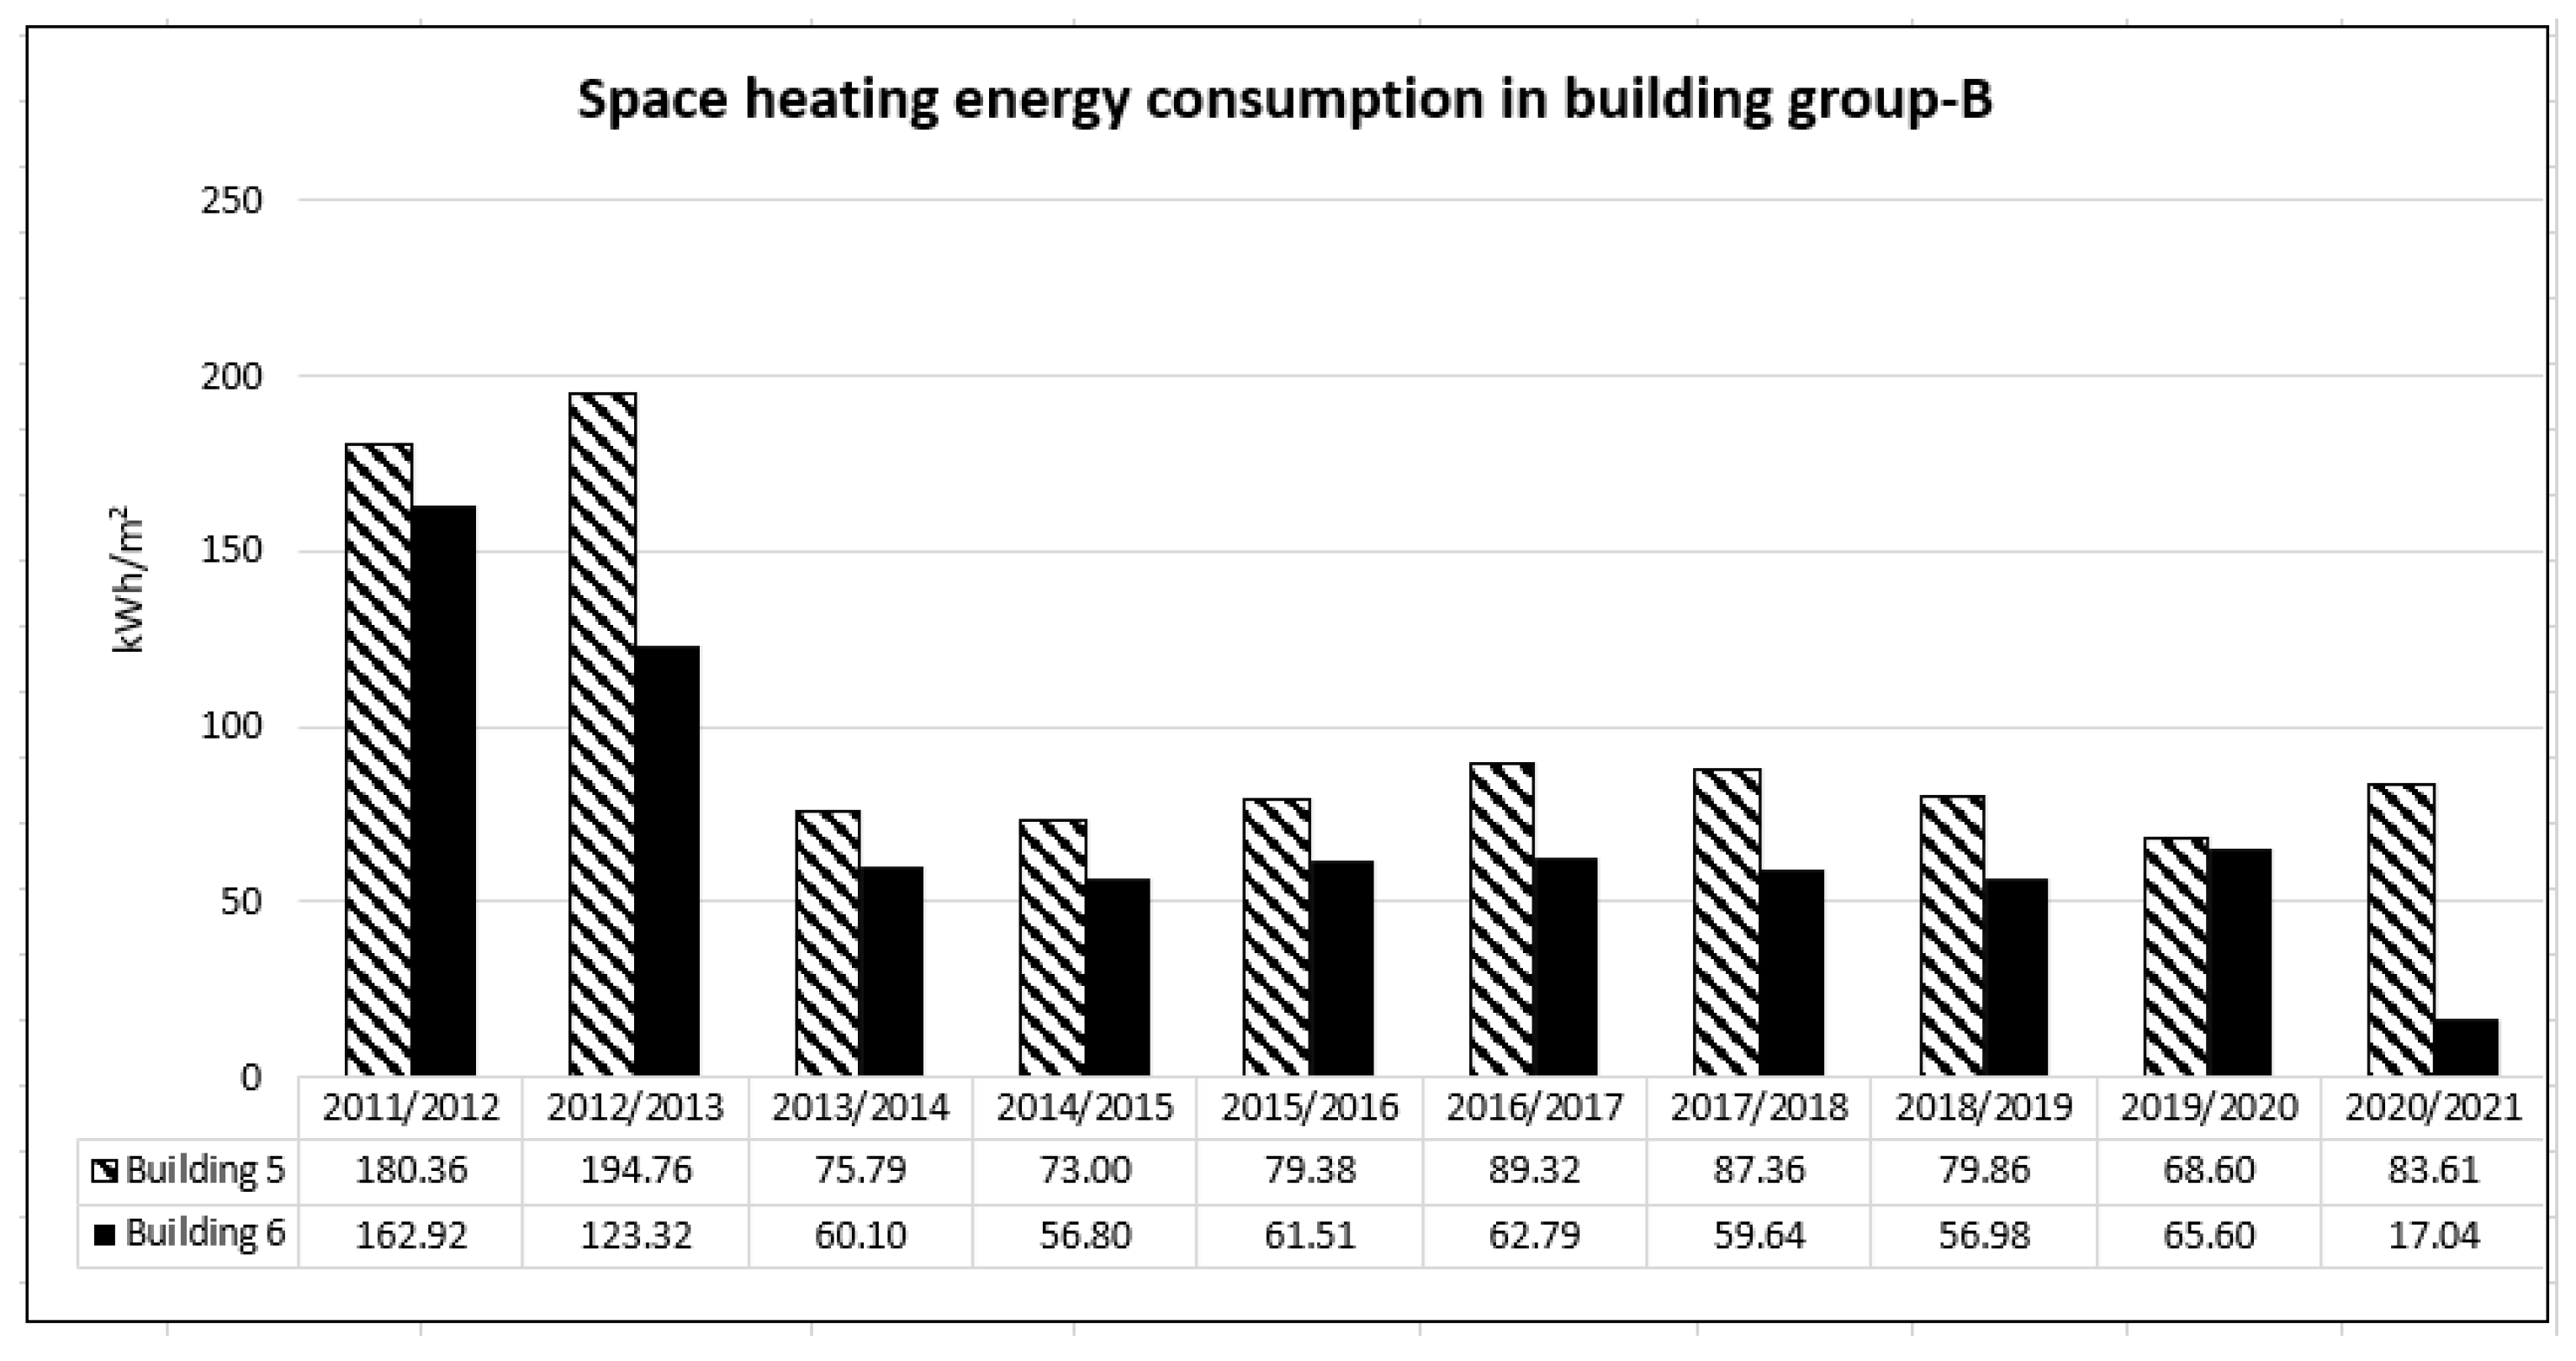
The B-group consists of buildings #5 and #6, which were categorized based on a specific serial-type standard of residential houses commonly referred to as “Stalinka”. These buildings share similar architectural characteristics, including the same number of floors, apartment layout, and a distinctive design element known as a “turn”.
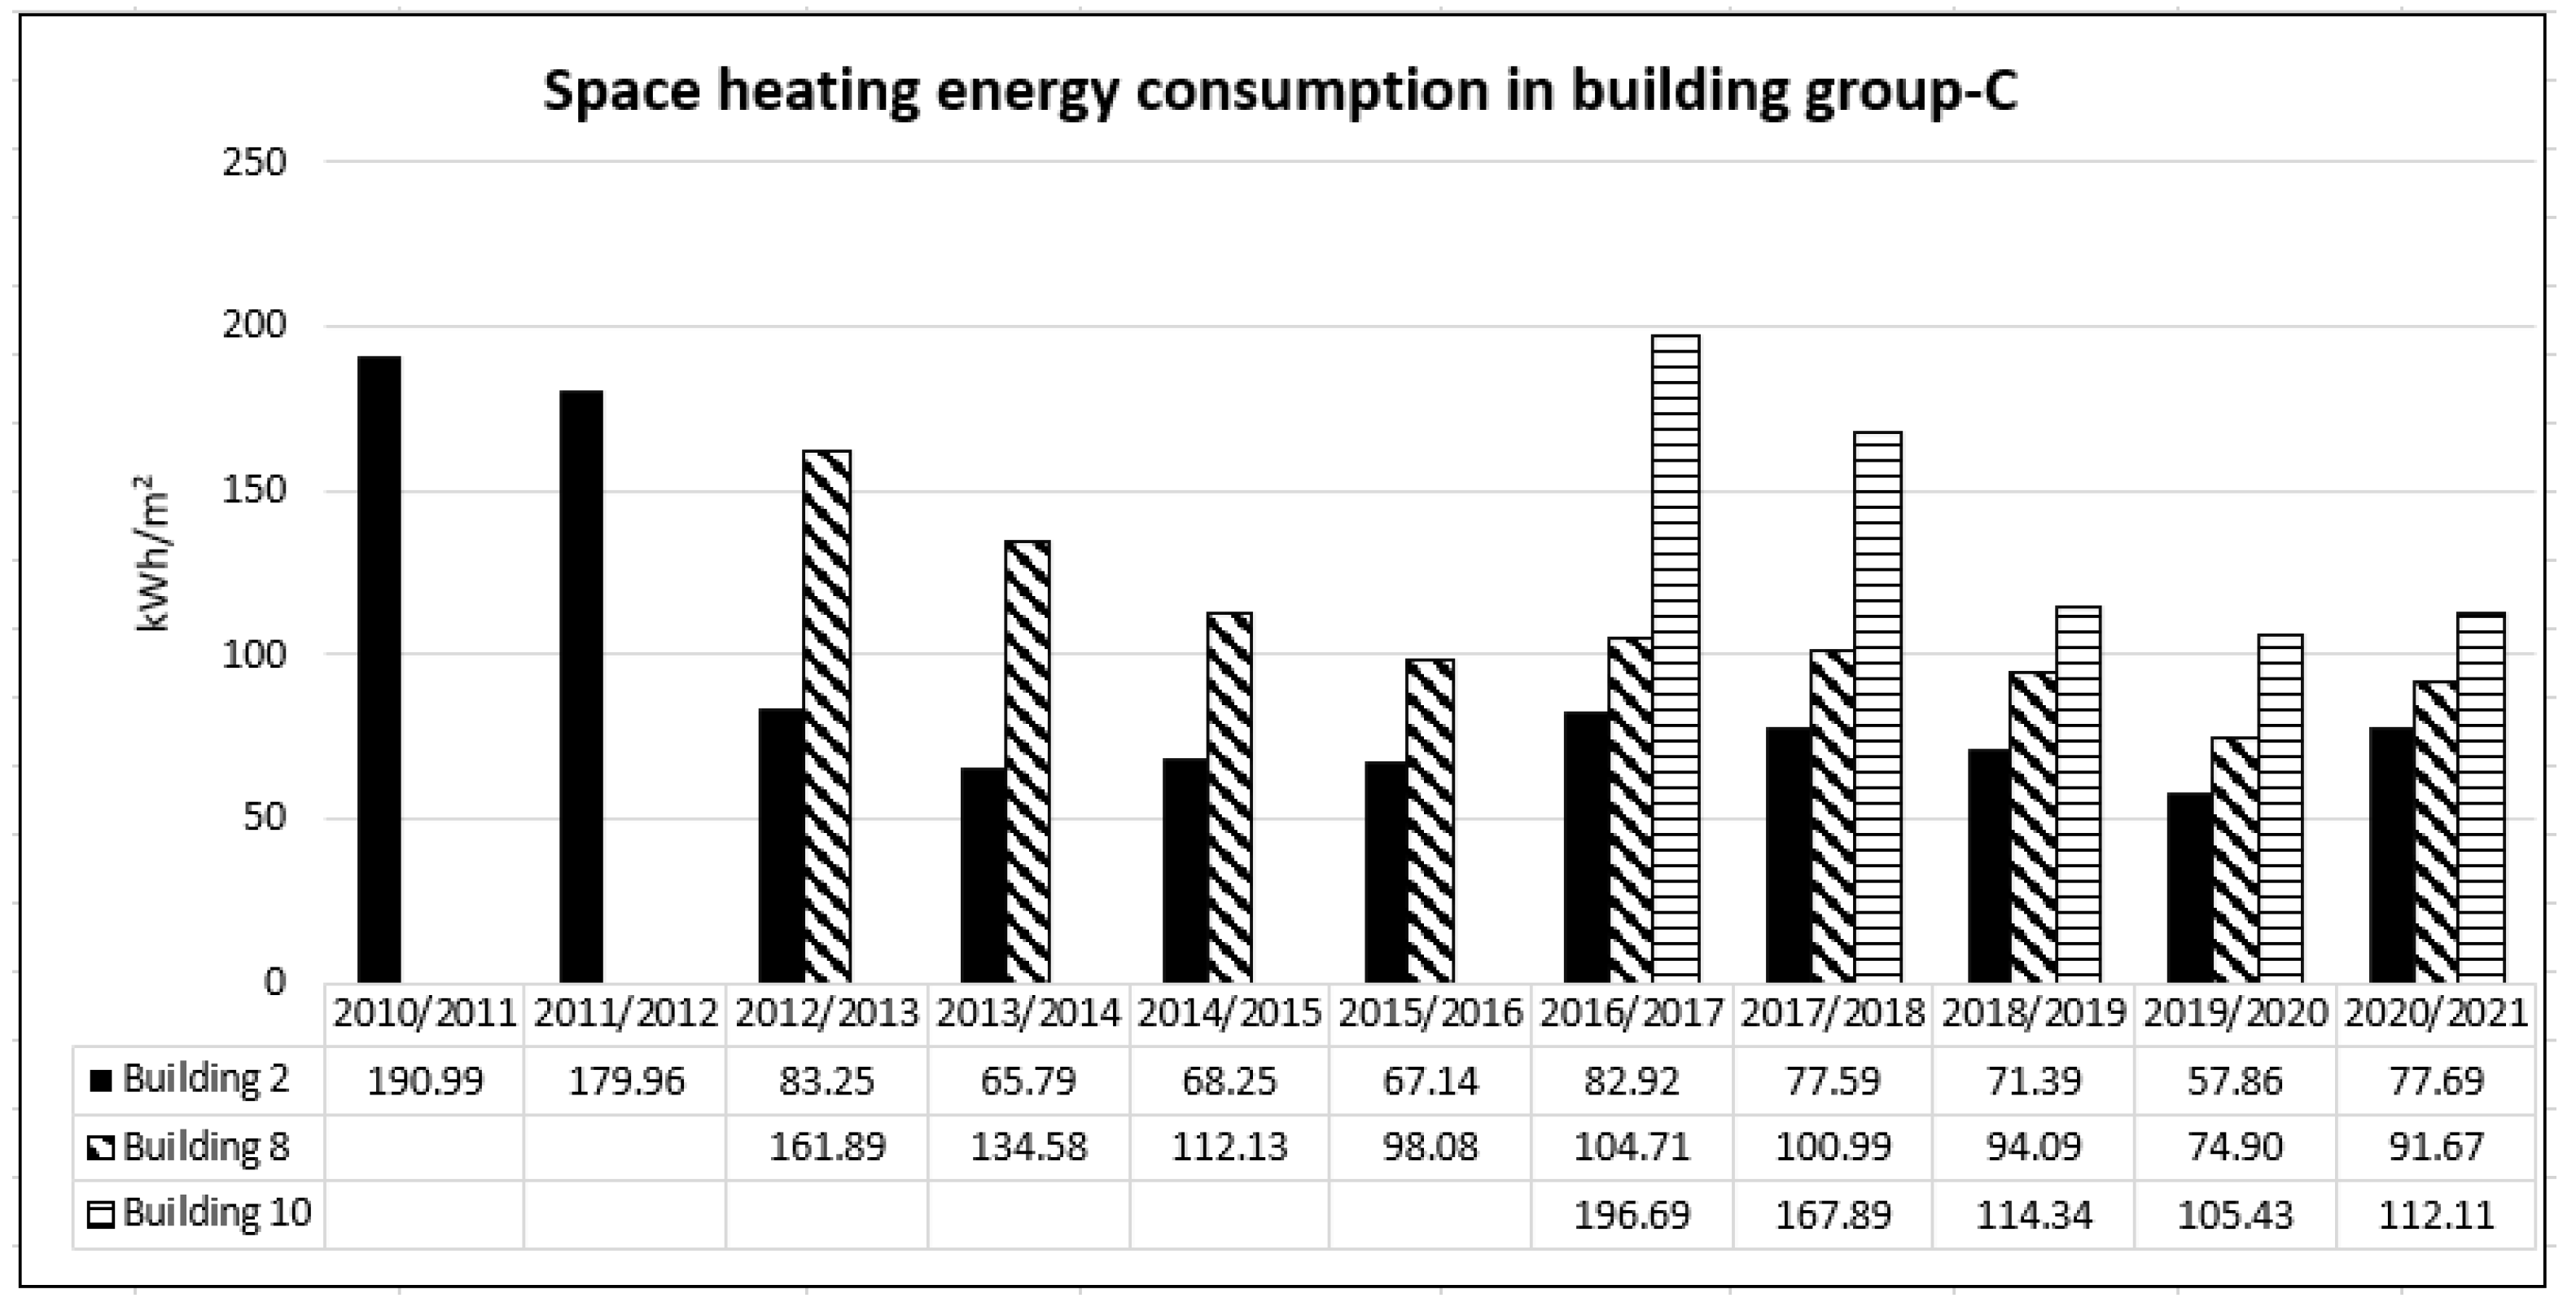
The C-group comprises buildings #2, #8, and #10, which are two-story structures; however, it should be noted that building #8 currently has three floors, despite originally being constructed with only two floors in 1974.
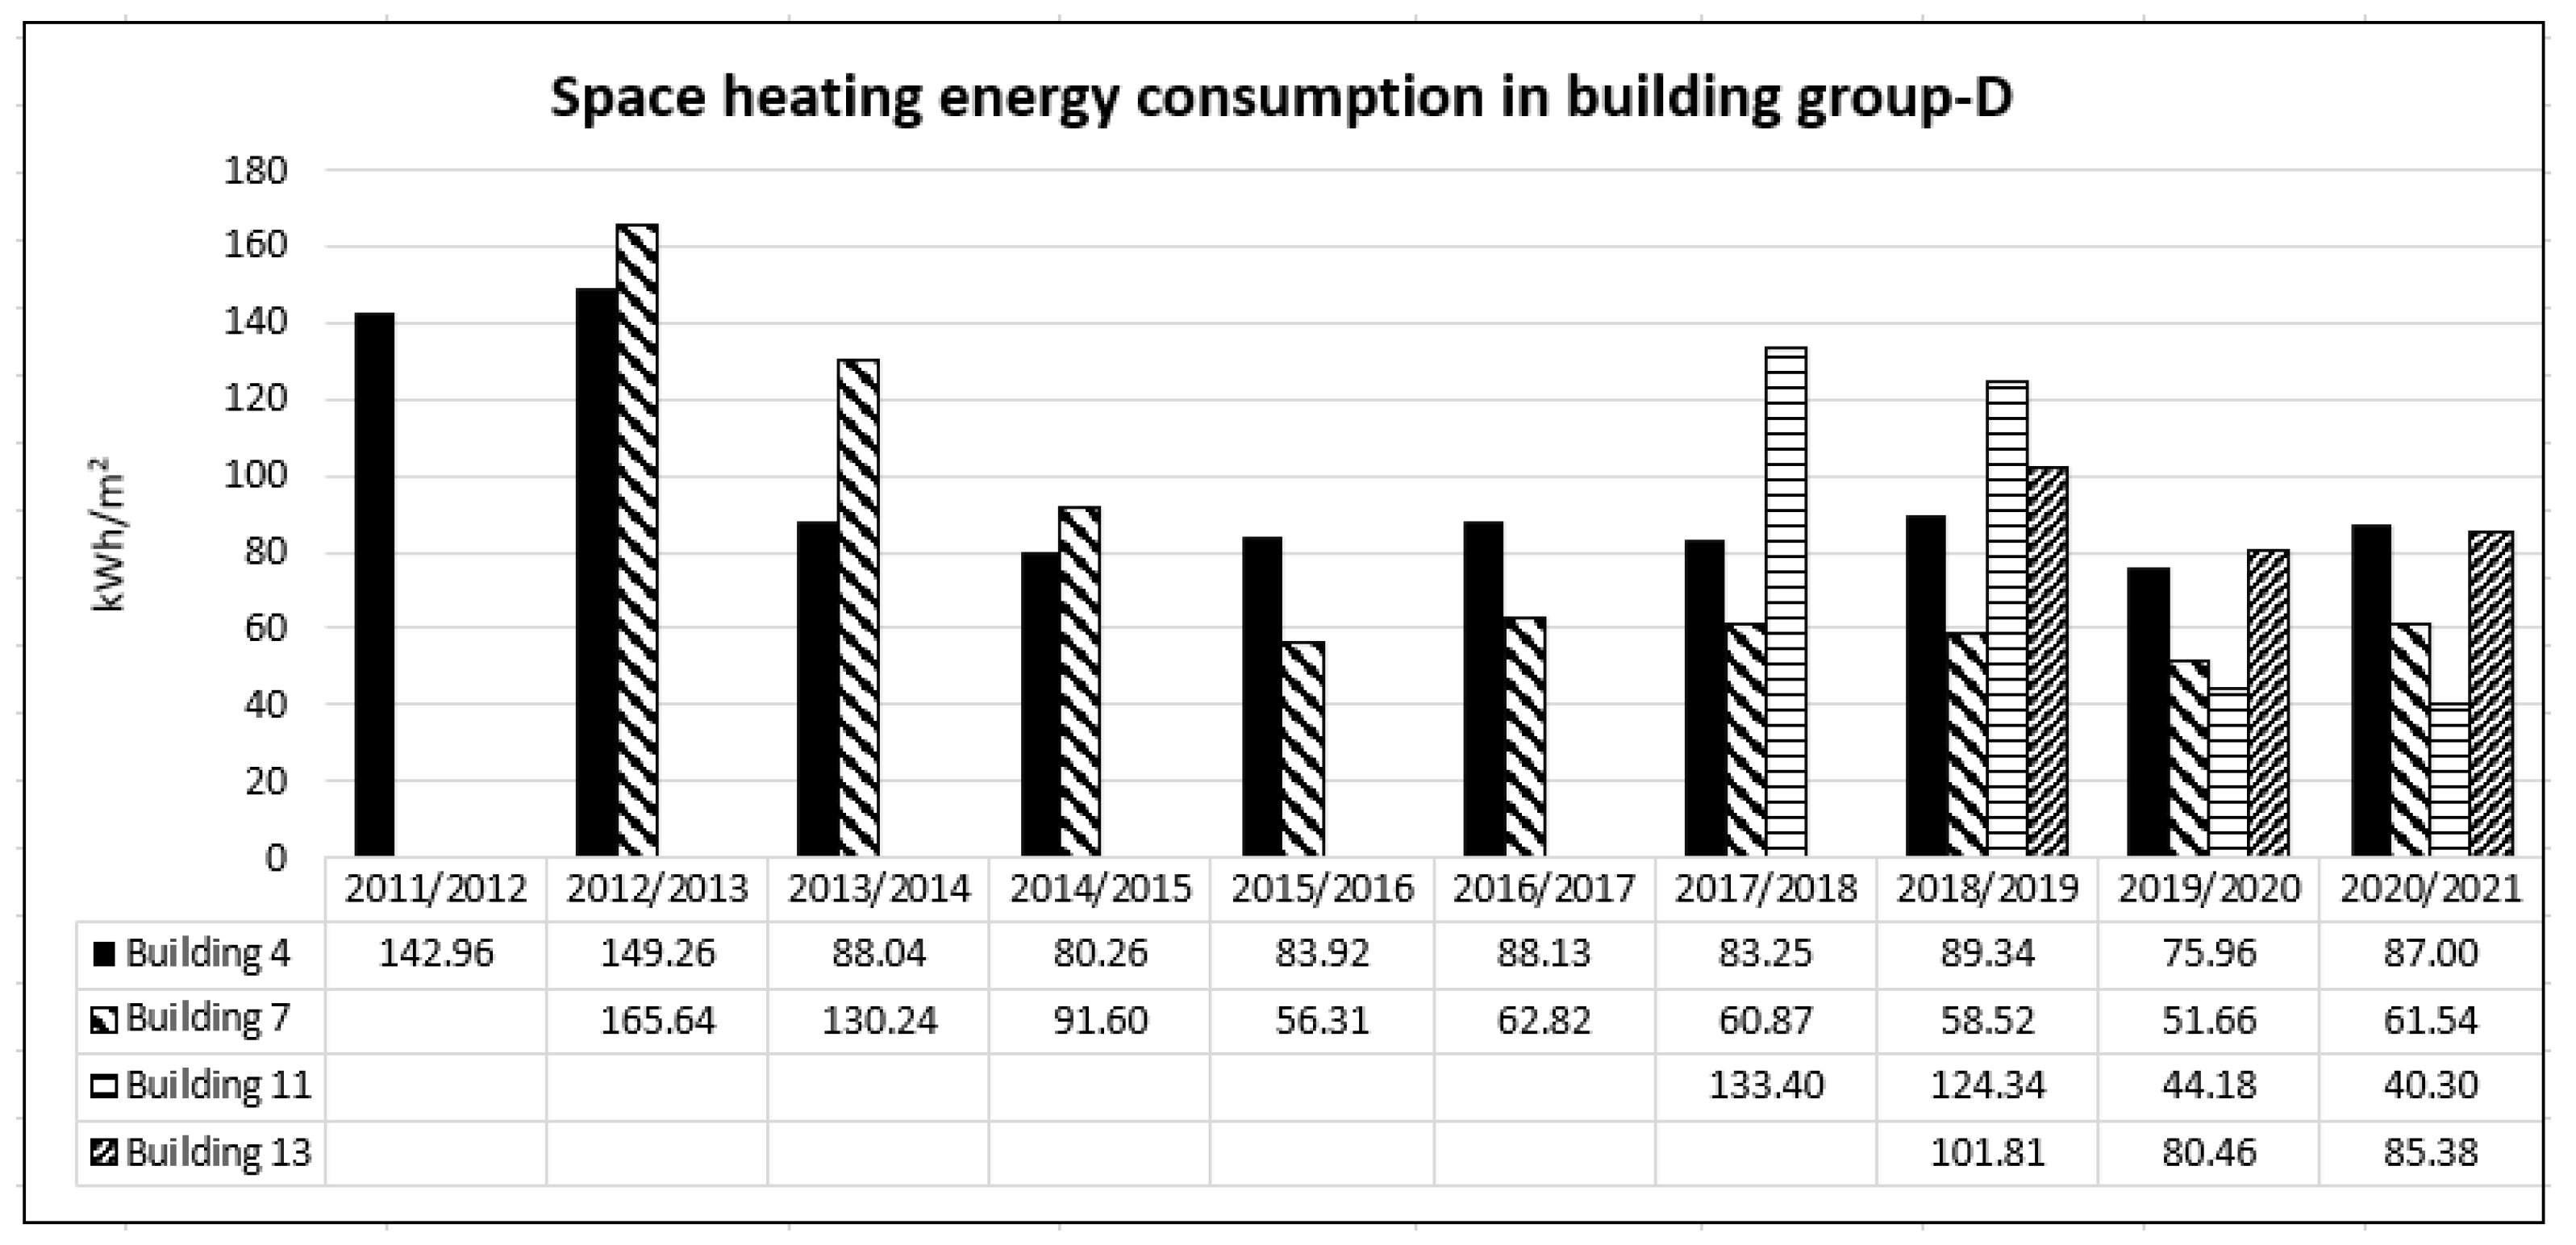
The D-group residential houses are quite different (#4—building of series 602; #7—small-family residential house; #11—building of series 467; #13—building of series 103), but all residential houses have one thing in common which are elements of external enclosing structures, i.e., hollow reinforced concrete panels.
The D-group of the examined residential buildings exhibits notable variations (#4 is 602 serial-type buildings, #7 and #11 are serial-type 467 buildings, and #13 is serial-type 103 building). Nonetheless, a shared characteristic among all residential houses within this group is the 9 to 10 story floor count, the utilization of external enclosing structures comprising hollow reinforced concrete panels.
Despite the fact that residential houses are divided into groups according to one or more characteristics, it is necessary to divide the groups of buildings into smaller groups (subgroups) in order to evaluate the effectiveness of the implemented measures. For the comparison of the objects under study, we assume a division into three subgroups, i.e., buildings with an insulated facade and renovated heating system (first subgroup); renovated heating system (second subgroup); insulated building facade (third subgroup).
In order to assess the effectiveness of the implemented measures across the dispersed building stock, it was necessary to further subdivide the groups of residential houses into smaller subgroups. Thus, it was proposed to divide the implemented renovation measures into three subgroups: the first subgroup comprises buildings with both an insulated facade and a renovated heating system, the second subgroup includes buildings with a renovated heating system only, and the third subgroup consists of buildings where only facade insulation was implemented. This subdivision allows for a more detailed evaluation of the outcomes achieved within each subgroup and enables a comprehensive analysis of the impact of specific interventions on energy efficiency and thermal performance of the residential buildings.
Table 3 compiles the building profile information and directory used for the evaluation.

2.3. Building Selection Criteria: Case Study of Lithuania

To investigate the impact of the Energy Performance of Buildings Directive (EPBD) on building energy efficiency in Lithuania, this study employed a quantitative methodology. Data from 5558 multi-apartment buildings, registered between 2014 and 2020, were analyzed. These buildings were classified into energy efficiency classes ranging from A++ to G. The primary focus was on the certification calculations of renovated multi-apartment buildings, specifically those classified as energy performance classes C and D. Energy efficiency certificates (EPCs) issued and registered in Lithuania between 2007 and 2021, totaling 257,196, were also considered. This study compared the average final energy consumption and primary energy consumption for heating purposes across different energy efficiency classes, highlighting the changes resulting from building renovation efforts.

2.4. Result Evaluation

Energy consumption data for the renovated buildings were collected using energy meters installed within each building. These energy meters recorded the thermal energy consumption (kWh) on a regular basis, allowing for a detailed analysis of energy usage patterns before and after the implementation of the renovation measures. The data collected included information on thermal energy consumption for space heating, providing a comprehensive understanding of the energy performance of the buildings. By comparing the energy consumption data (kWh) before and after the renovations, this study was able to quantify the actual energy savings achieved through the implemented measures and assess the effectiveness of the renovation strategies in reducing thermal energy consumption.
To determine the actual thermal energy savings (Δ) as a result of the building renovation measures, the following equation was used:
Δ = Q i 0 Q j 1 Q i 0 100   %
where:
Q i 0 —the actual thermal energy consumption of the building in the year i before renovation [kWh];
Q j 1 —actual thermal energy consumption of the building in year j after renovation [kWh].

3. Results

3.1. Case Study of Latvia

Within building group-A (Figure 3), the pre-renovation thermal energy consumption for space heating ranged from 142.77 to 159.42 kWh/m2, while the thermal energy consumption during the most recent heating season varied from 73.06 to 103.47 kWh/m2. Due to the absence of the A2 subgroup within the group-A building sample, it was not possible to estimate the energy savings achieved solely by renovating the heating system without insulating the facade.
However, upon comparing the average heat energy consumption before and after renovation, the average savings are as follows: building #1—53.09%, building #3—37.92%, building #9—64.31%, and building #12—53.84%. Analyzing the results of building #3 (subgroup A3), it is evident that the savings significantly differ from the A building group belonging to subgroup A1. This finding indicates that the facade insulation upgrade alone, without adjustments to the heating system in a specific series-type house, is not sufficiently effective. Buildings #1 and #12 exhibit rather similar results to building #9 in terms of the thermal energy savings. Despite variations in the thickness of the facade insulation (#1 and #9—100 mm stone wool, #12—150 mm stone wool), the distribution type of the heating system plays a more significant role than the insulation thickness itself. Buildings #1 and #12 have a common heating distribution pattern (single-pipe distribution from the attic), while building #9 features a different heating system distribution (two-pipe bottom distribution from the basement).
Building group-B (Figure 4) constitutes the smallest group in the study, containing only one subgroup, B1. Both buildings share similar layouts and external building envelope materials. However, despite these similarities, the average thermal energy consumption for space heating per square meter is higher for building #5 compared to building #6, both before renovation (#5: 187.55; #6: 143.12 kWh/m2) and after renovation (#5: 79.61; #6: 55.06 kWh/m2).
The average thermal energy savings are as follows: building #5—57.55%, building #6—55.05%. Despite having different heating distribution systems (building #5: two-pipe top distribution from the attic; building #6: horizontal distribution with individual heat meters), the thermal energy savings are quite similar. When comparing buildings with the same heating distribution system (upper distribution from the attic) from different groups/subgroups, such as A1 and B1 (buildings #1, #12, and #5), the thermal energy saving for building #5 is on average 4% higher compared to buildings #1 and #12. This implies that the reduction in thermal energy consumption in this case is influenced by the technical characteristics of the building’s fundamental enclosing structures.
Building group-C (Figure 5) encompasses all individual subgroups for the detailed result comparison, consisting of buildings that had undergone facade and heating system renovations (C1), only the heating system upgrade/renovation (C2), or only the facade insulation (C3).
Notably, buildings #2 and #8 feature partial insulation due to their status as cultural and historical monuments. Additionally, buildings #2 and #10 share the same heating system distribution (horizontal distribution with individual heat meters). The implementation of energy efficiency measures enables the evaluation of each building under equivalent conditions. The average heat energy savings are as follows: building #2—60.92%, building #8—31.21%, and building #10—33.40%. These results indicate that heating system modernizations (C2) yield similar savings to facade insulation (C3), and, when combined (C2 + C3), the energy savings are lower than those achieved through a comprehensive renovation (C1).
Comparing buildings with the same heating distribution system and insulation thickness from different groups/subgroups, such as B1 and C1 (buildings #6 and #2), the thermal energy savings are notably close (<2%). This finding suggests that the thermal system distribution pattern is a significant factor for buildings with a smaller total floor space for living areas (up to 522.3 m2). Conversely, buildings with a similar insulation thickness from different groups/subgroups, such as A3 and C3 (buildings #3 and #8), demonstrate nearly identical results in thermal energy savings (<1%), indicating an average thermal energy resource saving of 31% for brick-type buildings.
Building group-D (Figure 6) encompasses all subgroups for result comparison, including buildings within the same subgroup (D1) with varying thermal insulation thicknesses but using the same insulation material (mineral wool). The average thermal energy savings are as follows: building #4—42.17%, building #7—57.19%, building #11—67.22%, and building #13—36.17%. These results indicate that the lowest savings were achieved in buildings where only the facade was insulated (third subgroup). A similar outcome was observed for building #8 (C3—31.21%) and building #3 (A3—30.69%).
Furthermore, the results demonstrate that, similar to building group-C, the renovation of the heating system (second subgroup) yields nearly identical thermal energy savings in cases where the facade is not insulated (third subgroup). It is important to note that building #13 had its heating system replaced during renovation, similar to building #9 (bottom distribution with two-pipe system from the basement), which falls within the first subgroup (A1) with a thermal energy saving of 65.02%. Theoretical calculations suggest that insulating building #13 with a 100 mm thick thermal insulation could result in very close savings compared to building #9.
Additionally, building #7 and building #11 feature the same subgroup (D1), sharing the similar heating distribution system (single-pipe top/bottom distribution), but differing in thermal insulation thickness—100 mm (#7) and 150 mm (#11). In this case, the 10% difference in thermal energy savings for panel-type residential houses is directly influenced by the insulation thickness.
Table 4 compiles averaged thermal energy consumption (kWh/m2) and thermal energy savings (%) before and after renovation implementation. The data provided in the table allow for investigating the correlation between different retrofit packages and the relative humidity (RH) and carbon dioxide (CO2) levels in the buildings after renovation, where RH and CO2 were monitored. Buildings underwent various retrofit packages, including facade upgrades, heating system upgrades, and full retrofit packages (facade, ventilation, heating system upgrades). These buildings exhibited notable energy savings ranging from 34.80% to 67.22%.
When examining the average RH levels, it is important to note that the measured RH levels were not excessively high and remained within the comfort range of 30 to 70%. This suggests that the retrofit packages implemented in these buildings, which included improvements to the building envelope and heating systems, potentially contributed to better moisture control and healthier indoor environments. However, in buildings 9 and 11, the average RH level was <30% which suggests that the humidity level is rather low. Although the cause behind the low RH levels in buildings 9 and 11 may require further investigation, it is highly likely that the retrofit measures implemented in these buildings, such as improved insulation or sealing, inadvertently resulted in reduced moisture infiltration from outside. Inadequate humidity control systems or insufficient moisture sources within the buildings may have also contributed to the low RH levels.
Similarly, when examining the CO2 levels in these buildings, it was observed that all buildings had CO2 concentrations below 1500 ppm, except for building #10 where the average CO2 concentration was 2796 ppm, critically exceeding the DIN 1946 Part 2 stipulated limit for a healthy IEQ of 1500 ppm. The CO2 level <1500 ppm in other buildings indicates improved ventilation and indoor air quality, which can be attributed to the retrofit measures implemented. These measures likely enhanced air circulation and facilitated the removal of indoor air pollutants. In building #10, only the heating system upgrade was carried out, suggesting that the overly high CO2 concentration might have been an underlying issue, and further retrofit measures are suggested (improved air circulation, mechanical ventilation system) to control the CO2 concentration within the premises. The measured humidity level is also higher in building #10, suggesting that insufficient air exchange and poor ventilation lead to both moisture and indoor pollutant build-up.
Further research and monitoring are necessary to obtain more conclusive evidence regarding the correlation between specific retrofit strategies and the RH and CO2 levels in buildings, as these parameters are position-dependent, implying that the measurement and data might be influenced by the specific position or location where they are taken, and therefore the readings may fluctuate substantially depending on the sensor position with regards to the building layout and potential sources of pollution.

3.2. Case Study of Lithuania

Most buildings by area (83%) in Lithuania were built before 1993 (Table 5). Insulation materials were not used for the better thermal insulation of these buildings and only the specific thermal resistance of the building materials (such as bricks, blocks, or panels) determined the thermal resistance of the building. In addition, a significant part of these buildings has not been renovated either by participating in renovation programs. As a result, a large part of the building stock is in poor technical condition (especially in the apartment segment). A total of 58% of the area of the building fund consists of buildings built between 1961 and 1992, the architectural and structural diversity of which is probably not great [28,29,30,31]. Accordingly, there is a potential for implementing repeated (standard) renovation solutions, especially in the apartment building segment, where ~72% buildings were built between 1961 and 1992.
The typical energy consumption designed for in these houses is for 160–180 kWh/m² per year. In terms of heating systems, according to data published by the Lithuanian Heating Association [32], 46.97% of multi-apartment buildings are supplied by a district heating system, with the remaining share of multi-apartment buildings using individual boiler modules present within the building or inside of individual apartments. A smaller percentage of multi-story residential buildings are heated via the use of electric radiators [33]. Notwithstanding the high percentage of multi-apartment buildings connected to a central district heating system, by area, this is significantly smaller, with only 26% of the total area comprising the entire Lithuanian multi-apartment building stock currently connected to a centralized heating system. To address this, the Lithuanian long-term strategy is to transform the current building stock in a way that would lead to a much more efficient use of energy (with conditions mature enough to transform these buildings into almost zero-energy buildings) and make the country independent of fossil fuels by 2050.
In all of this, the energy certification of buildings plays an important role, positioning itself as one of the most important tools of the energy policy for buildings in Lithuania. Over the period 2007–2021, 257,196 EPCs were issued and registered in Lithuania. For the purpose of this study, the data comprised the certification calculations of 5558 multi-apartment buildings registered between the period 2014–2020 [34]. Figure 7, to this effect, shows the distribution of energy performance certificates issued for these 5558 multi-apartment buildings.
Most common energy renovation strategies taken in those buildings were the replacement of the heating system (or part of it), outer wall insulation, roof insulation/replacement, window replacement. The implementation of the Energy Performance of Buildings Directive (EPBD) in Lithuania started in 2007 and during a period of 10 years (from 2000 to 2010), the overall energy efficiency in Lithuania increased by about 20% (Norvaišienė, Karbauskaitė, and Bruzgevičius 2014), while during 2010 and 2016, it grew additionally by 6.3% (Statistics Lithuania, 2018). All buildings in Lithuania are classified into one of nine classes: A++, A+, A, B, C, D, E, F, or G, where class A++ represents the highest energy efficient building class or NZEB building, while class G refers to a building with poor energy efficiency. It should also be noted that for renovated (modernized) buildings in Lithuania, it is mandatory to achieve an energy efficiency class no lower than C from 2014 and D energy efficiency class till 2014. Over the period 2007–2021, 257,196 energy efficiency certificates (EPCs) were issued and registered in Lithuania. For the purpose of this study, the data comprised the certification calculations of 5558 multi-apartment buildings registered between the period 2014 and 2020, among which were 1253 of C class and 53 D energy efficiency class renovated multi-apartment buildings. Due to the increased level of thermal insulation of the building envelope, the average final energy consumption used for heating purposes decreased from 262 kWh/m².annum for buildings with an energy performance class G, compared to 78 kWh/m².annum for renovated multi-apartment buildings with an energy performance class D and 56 kWh/m² with an energy performance class C. Likewise, primary energy consumption decreased from 440 kWh/m².annum for buildings with an energy performance class G, compared to 102 kWh/m².annum for buildings with an energy performance class D and 74 kWh/m² with an energy performance class C.
And finally, taking, as an example, the primary energy used to heat renovated buildings in Lithuania with an energy performance class, class C utilize a share of around 35% of their total primary energy consumption for heating, 34% for domestic hot water preparation, 27% for lighting and electrical appliances, and 4% for cooling.

4. Discussion

Due to the limited number of studies of a similar nature carried out in Latvia, this study drew upon the framework of scientific studies on the same subject carried out in Sweden, Lithuania, and Poland.
A substantial amount of data on thermal energy consumption in partially or fully renovated multi-apartment residential buildings were collected over a 10-year period to objectively identify successful projects. Despite regional variations and a relatively slow pace of building renovations in both of the examined countries (Latvia and Lithuania), ongoing projects present opportunities to amend deficiencies and implement new technologies and materials. Renovated buildings were grouped based on structural features such as floor count, construction material, and living space area, facilitating comparative analysis.
The BETSI experiment (buildings, energy consumption, technical status, and indoor environment) conducted in Sweden, which involved numerous residential buildings, demonstrated that countries situated in a single climatic zone do not require dispersed national data acquisition [35,36]. Consequently, measurements can be organized in a selected inhabited area or city within Latvia, based on data availability. Daugavpils, the second most populous city in Latvia, experiences lower winter temperatures compared to the capital and other coastal cities, making indoor temperature readings more significant. The majority of housing in Daugavpils consists of series-type buildings constructed between 1945 and the late 1980s, further simplifying the grouping of renovated buildings. Subgroups were created to evaluate the effectiveness of renovation measures, such as facade insulation, heating system renovation, or full renovation.
Considering the volatile global energy market and economic calculations, prioritizing projects with shorter payback periods, such as heating system renovations, is recommended. Projects with longer repayment periods should be deferred until the State Treasury’s discount rate stabilizes or until project co-financing support significantly reduces the repayment period. During the research, it was discovered that the air exchange systems in renovated residential buildings often lacked sufficient ventilation, resulting in compromised air quality in habitable rooms. This finding aligns with observations made by [37], emphasizing the overlooked aspect of ventilation during building renovations.
The determination of actual thermal energy consumption in buildings is influenced by factors such as the performed renovation package, calculation methodologies before and after the renovation, and individual heat energy metering. Installation of additional heat energy metering devices in buildings undergoing complete renovation or heating system renovation allows for the accurate measurement of thermal energy consumption. However, for buildings that do not have an integrated metering option, alternative approaches are required to determine actual thermal energy savings [38].
The findings of this study provide valuable insights into the effectiveness of the Energy Performance of Buildings Directive (EPBD) and building renovation packages in improving energy efficiency in Lithuania. The observed 20% increase in energy efficiency over a 10-year period, coupled with an additional 6.3% increase in subsequent years, suggests that the EPBD regulations have positively influenced the energy performance of buildings. The mandatory requirement for renovated buildings to achieve a minimum energy efficiency class has demonstrated significant reductions in energy consumption for heating purposes. The decrease in average final energy consumption from class G buildings to class C buildings highlights the impact of building renovation efforts on energy efficiency improvement. Furthermore, the distribution of primary energy consumption in renovated class C buildings, with a considerable share allocated to heating, domestic hot water preparation, lighting, electrical appliances, and cooling, indicates a balanced and efficient use of energy resources. The findings support the notion that building renovation packages, aligned with the EPBD regulations, play a crucial role in enhancing energy efficiency and promoting sustainability in the built environment. Future research could explore the long-term effects of these measures and assess the economic feasibility of building renovation packages in achieving even higher energy efficiency targets.
The study conducted by Yu et al. [39] serves as a valuable complement to our research, emphasizing the importance of considering multiple objectives and post-occupancy evaluation in building retrofits for more comprehensive and sustainable outcomes. By employing a post-occupancy evaluation approach and multi-objective optimization (MOO) techniques, the authors effectively address the challenges of achieving comfort and energy efficiency in retrofit projects. Their findings demonstrate the potential of integrating energy performance feedback, as demonstrated in our own research. This integration enables stakeholders to make more informed and efficient choices, resulting in sustainable and optimized retrofit solutions.

5. Conclusions

The present study examined the efficiency of building renovation measures across the building stock in the context of two Northern European countries—Latvia and Lithuania.

5.1. Latvia

The findings reveal that amendments to Latvian building regulations in the last 10 years, regarding the insulation thickness of the enclosing structure, did not significantly affect the average thermal energy consumption in fully renovated buildings. In buildings that were renovated in 2012 (featuring 100 mm thick mineral wool insulation), compared to buildings renovated in 2020 (featuring 150 mm thick rock wool insulation), the thermal energy consumption was very similar, despite the fact that the registered winter temperature averages have risen, highlighting the impact of regulatory building codes during full renovation. The majority of the examined buildings in the study were subject to facade renovations (11 of 13) and 10 out of 13 had their heating systems upgraded. The upgrades also involved transitioning from less efficient one-pipe distribution systems to more efficient two-pipe heating distribution systems. This change allows for better heat control and distribution throughout the buildings, contributing to improved energy efficiency and thermal comfort. The renovation measures resulted in significant reductions in thermal energy consumption. Average energy consumption for space heating decreased from 151.34 kWh/m2 to 74.78 kWh/m2, resulting in a remarkable 50.59% reduction in thermal energy consumption for space heating. These savings can be attributed to a combination of facade renovations, improved ventilation systems, and upgraded heating systems. The findings also emphasize the importance of heat metering. Installing a heat energy meter in the heating circuit prior to renovation greatly simplifies the assessment of actual thermal energy savings. Access to pre-renovation thermal energy consumption data during energy audits improves the accuracy of building models and helps mitigate the influence of regulatory changes on energy consumption calculations. In conjunction with the heat energy meter, measurements of indoor air temperature should be conducted. Residents’ preferences for maintaining consistent temperature conditions indicate the need for regulatory standards on minimum room air temperatures to prevent excessive individual adjustments that affect neighboring apartments during prolonged absences. Insufficient attention has been addressed with respect to indoor air quality during renovation processes. Energy efficiency interventions in serial-type multi-apartment buildings primarily focus on reducing thermal energy consumption rather than enhancing the quality of living conditions. The installation of heat recovery mechanical ventilation systems is not feasible within simplified building renovation frameworks. Therefore, to improve indoor environmental quality, a shift from traditional radiator-based room-heating systems to air-heating/ventilation (hybrid) systems is suggested, albeit the integration of such systems is more complex and thus not commonly applied in the multi-apartment housing sector in Latvia.

5.2. Lithuania

The implementation of the Energy Performance of Buildings Directive (EPBD) in Lithuania has resulted in a notable increase in overall energy efficiency. Over a 10-year period (2000–2010), energy efficiency in Lithuania improved by 20%, with an additional 6.3% increase in subsequent years. The mandatory energy efficiency requirements for renovated buildings have been effective, as evidenced by the significant decrease in energy consumption for heating purposes. The distribution of primary energy usage in renovated buildings reflects a balanced and efficient utilization of resources. These findings highlight the positive impact of building renovation packages and the EPBD regulations in improving energy efficiency in Lithuania.
This study demonstrates the effectiveness of renovation measures in improving energy efficiency and reducing thermal energy consumption in buildings. Facade renovations, improved ventilation systems, and upgraded heating systems all contributed to significant energy savings. Future renovation projects should prioritize comprehensive measures that encompass all aspects of the heating and distribution systems to maximize energy efficiency and achieve substantial reductions in thermal energy consumption.
Our study contributes to highlighting building retrofit effectiveness by providing quantitative evaluations of thermal energy reduction achieved through retrofit measures. By analyzing data from real-world retrofit projects in Latvia and Lithuania, we offer empirical evidence of the energy-saving potential associated with specific strategies. Additionally, our research contextualizes retrofit practices within the Baltic countries, filling a gap in localized knowledge and guidelines. This tailored information enables stakeholders to make informed decisions, prioritize cost-effective measures, and achieve significant energy savings. Moreover, the findings contribute to sustainability efforts by quantifying the environmental impact reduction resulting from retrofit interventions. In summary, our study’s insights support informed decision-making, advance sustainable practices, and address the unique retrofit challenges faced in Baltic countries.

Author Contributions

Conceptualization, A.P. and A.B.; methodology, S.Z. and A.B.; resources, S.Z., K.B., E.M. and R.N., validation—A.B.; writing—original draft preparation, A.P.; revision—A.B.; visualization, A.P. and S.Z.; supervision, A.B. All authors have read and agreed to the published version of the manuscript.

Funding

This research received no external funding.

Conflicts of Interest

The authors declare no conflict of interest.

References

  1. Thonipara, A.; Runst, P.; Ochsner, C.; Bizer, K. Energy efficiency of residential buildings in the European Union—An exploratory analysis of cross-country consumption patterns. Energy Policy 2019, 129, 1156–1167. [Google Scholar] [CrossRef] [Green Version]
  2. Shadram, F.; Mukkavaara, J. Exploring the effects of several energy efficiency measures on the embodied/operational energy trade-off: A case study of swedish residential buildings. Energy Build. 2019, 183, 283–296. [Google Scholar] [CrossRef]
  3. Fernandes, D.V.; Silva, C.S. Open Energy Data—A regulatory framework proposal under the Portuguese electric system context. Energy Policy 2022, 170, 113240. [Google Scholar] [CrossRef]
  4. Ekström, T.; Bernardo, R.; Blomsterberg, Å. Cost-effective passive house renovation packages for Swedish single-family houses from the 1960s and 1970s. Energy Build. 2018, 161, 89–102. [Google Scholar] [CrossRef]
  5. Scorpio, M.; Ciampi, G.; Gentile, N.; Sibilio, S. Effectiveness of low-cost non-invasive solutions for daylight and electric lighting integration to improve energy efficiency in historical buildings. Energy Build. 2022, 270, 112281. [Google Scholar] [CrossRef]
  6. Rademaekers, I.R.A.K.; Williams, R.; Yearwood, J. Boosting Building Renovation: What Potential and Value for Europe? 2016. Available online: https://www.europarl.europa.eu/RegData/etudes/STUD/2016/587326/IPOL_STU(2016)587326_EN.pdf (accessed on 25 July 2023).
  7. D’Agostino, D.; Tzeiranaki, S.T.; Zangheri, P.; Bertoldi, P. Assessing Nearly Zero Energy Buildings (NZEBs) development in Europe. Energy Strat. Rev. 2021, 36, 100680. [Google Scholar] [CrossRef]
  8. Deshko, V.; Bilous, I.; Sukhodub, I.; Yatsenko, O. Evaluation of energy use for heating in residential building under the influence of air exchange modes. J. Build. Eng. 2021, 42, 103020. [Google Scholar] [CrossRef]
  9. Zemitis, J.; Terekh, M. Management of energy efficient measures by buildings’ thermorenovation. MATEC Web Conf. 2018, 245, 06003. [Google Scholar] [CrossRef] [Green Version]
  10. Krumins, A.; Lebedeva, K.; Tamane, A.; Millers, R. Possibilities of Balancing Buildings Energy Demand for Increasing Energy Efficiency in Latvia. Environ. Clim. Technol. 2022, 26, 98–114. [Google Scholar] [CrossRef]
  11. Grazieschi, G.; Asdrubali, F.; Thomas, G. Embodied energy and carbon of building insulating materials: A critical review. Clean. Environ. Syst. 2021, 2, 100032. [Google Scholar] [CrossRef]
  12. Zajacs, A.; Lebedeva, K.; Bogdanovičs, R. Evaluation of Heat Pump Operation in a Single-Family House. Latv. J. Phys. Tech. Sci. 2023, 60, 85–98. [Google Scholar] [CrossRef]
  13. Geikins, A.; Borodinecs, A.; Jacnevs, V. Estimation of Energy Profile and Possible Energy Savings of Unclassified Buildings. Buildings 2022, 12, 974. [Google Scholar] [CrossRef]
  14. Borodinecs, A.; Zemitis, J.; Dobelis, M.; Kalinka, M.; Prozuments, A.; Šteinerte, K. Modular retrofitting solution of buildings based on 3D scanning. Procedia Eng. 2017, 205, 160–166. [Google Scholar] [CrossRef]
  15. Asdrubali, F.; Grazieschi, G. Life cycle assessment of energy efficient buildings. Energy Rep. 2020, 6, 270–285. [Google Scholar] [CrossRef]
  16. Gulotta, T.; Cellura, M.; Guarino, F.; Longo, S. A bottom-up harmonized energy-environmental models for europe (BOHEEME): A case study on the thermal insulation of the EU-28 building stock. Energy Build. 2021, 231, 110584. [Google Scholar] [CrossRef]
  17. EUBD. European Buildings Database. 2017. Available online: https://ec.europa.eu/energy/en/eu-buildings-database (accessed on 25 July 2023).
  18. Tzeiranaki, S.T.; Bertoldi, P.; Diluiso, F.; Castellazzi, L.; Economidou, M.; Labanca, N.; Serrenho, T.R.; Zangheri, P. Analysis of the EU Residential Energy Consumption: Trends and Determinants. Energies 2019, 12, 1065. [Google Scholar] [CrossRef] [Green Version]
  19. EM. Latvian Building Industry’s Development Strategy 2017–2024. 2016. Available online: https://www.em.gov.lv/files/buvnieciba/BS_17.05.2017.pdf (accessed on 25 July 2023).
  20. Deshko, V.; Bilous, I.; Sukhodub, I.; Yatsenko, O. Analysis of the Influence of Air Exchange Distribution between Rooms on the Apartment Energy Consumption. Power Eng. Econ. Tech. Ecol. 2021, 49, 39–50. [Google Scholar] [CrossRef]
  21. Borodinecs, A.; Zemitis, J.; Sorokins, J.; Baranova, D.; Sovetnikov, D. Renovation need for apartment buildings in Latvia. Mag. Civ. Eng. 2017, 68, 58–64. [Google Scholar] [CrossRef] [Green Version]
  22. Aslani, A.; Bakhtiar, A.; Akbarzadeh, M.H. Energy-efficiency technologies in the building envelope: Life cycle and adaptation assessment. J. Build. Eng. 2019, 21, 55–63. [Google Scholar] [CrossRef]
  23. Eliopoulou, E.; Mantziou, E. Architectural Energy Retrofit (AER): An alternative building’s deep energy retrofit strategy. Energy Build. 2017, 150, 239–252. [Google Scholar] [CrossRef]
  24. Cho, K.; Yang, J.; Kim, T.; Jang, W. Influence of building characteristics and renovation techniques on the energy-saving performances of EU smart city projects. Energy Build. 2021, 252, 111477. [Google Scholar] [CrossRef]
  25. Fan, Y.; Xia, X. Energy-efficiency building retrofit planning for green building compliance. Build. Environ. 2018, 136, 312–321. [Google Scholar] [CrossRef]
  26. Copiello, S. Building energy efficiency: A research branch made of paradoxes. Renew. Sustain. Energy Rev. 2017, 69, 1064–1076. [Google Scholar] [CrossRef]
  27. Röck, M.; Baldereschi, E.; Verellen, E.; Passer, A.; Sala, S.; Allacker, K. Environmental modelling of building stocks—An integrated review of life cycle-based assessment models to support EU policy making. Renew. Sustain. Energy Rev. 2021, 151, 111550. [Google Scholar] [CrossRef]
  28. Toleikyte, A.; Kranzl, L.; Müller, A. Cost curves of energy efficiency investments in buildings—Methodologies and a case study of Lithuania. Energy Policy 2018, 115, 148–157. [Google Scholar] [CrossRef]
  29. Attia, S.; Kurnitski, J.; Kosiński, P.; Borodiņecs, A.; Belafi, Z.D.; István, K.; Krstić, H.; Moldovan, M.; Visa, I.; Mihailov, N.; et al. Overview and future challenges of nearly zero-energy building (nZEB) design in Eastern Europe. Energy Build. 2022, 267, 112165. [Google Scholar] [CrossRef]
  30. Monstvilas, E.; Borg, S.P.; Norvaišienė, R.; Banionis, K.; Ramanauskas, J. Impact of the EPBD on Changes in the Energy Performance of Multi-Apartment Buildings in Lithuania. Sustainability 2023, 15, 2032. [Google Scholar] [CrossRef]
  31. Šadauskienė, J.; Seduikyte, L.; Paukštys, V.; Banionis, K.; Gailius, A. The role of air tightness in assessment of building energy performance: Case study of Lithuania. Energy Sustain. Dev. 2016, 32, 31–39. [Google Scholar] [CrossRef]
  32. LSTA. 2018 Overview of Lithuania’s Centralized Heat Supply Sector. 2018. Available online: https://lsta.lt/wp-content/uploads/2019/10/LSTA_apzvalga_2018.pdf (accessed on 18 July 2023).
  33. Janulis, M.; Bieksa, D. Lietuvos Ilgalaikė Renovacijos Strategija. Available online: https://energy.ec.europa.eu/system/files/2021-04/lt_2020_ltrs_0.pdf (accessed on 25 July 2023).
  34. SPSC. Center of Certification of Construction Production. Available online: https://www.spsc.lt/cms/index.php?option=com_content&view=article&id=60&Itemid=267&lang=en (accessed on 25 July 2023).
  35. Psomas, T.; Teli, D.; Langer, S.; Wahlgren, P.; Wargocki, P. Indoor humidity of dwellings and association with building characteristics, behaviors and health in a northern climate. Build. Environ. 2021, 198, 107885. [Google Scholar] [CrossRef]
  36. Wang, J.; Norbäck, D. Subjective indoor air quality and thermal comfort among adults in relation to inspected and measured indoor environment factors in single-family houses in Sweden-the BETSI study. Sci. Total. Environ. 2022, 802, 149804. [Google Scholar] [CrossRef]
  37. Cholewa, T.; Balaras, C.A.; Nižetić, S.; Siuta-Olcha, A. On calculated and actual energy savings from thermal building renovations—Long term field evaluation of multifamily buildings. Energy Build. 2020, 223, 110145. [Google Scholar] [CrossRef]
  38. Cabovská, B.; Bekö, G.; Teli, D.; Ekberg, L.; Dalenbäck, J.-O.; Wargocki, P.; Psomas, T.; Langer, S. Ventilation strategies and indoor air quality in Swedish primary school classrooms. Build. Environ. 2022, 226, 109744. [Google Scholar] [CrossRef]
  39. Yu, C.-R.; Liu, X.; Wang, Q.-C.; Yang, D. Solving the comfort-retrofit conundrum through post-occupancy evaluation and multi-objective optimisation. Build. Serv. Eng. Res. Technol. 2023, 44, 381–403. [Google Scholar] [CrossRef]
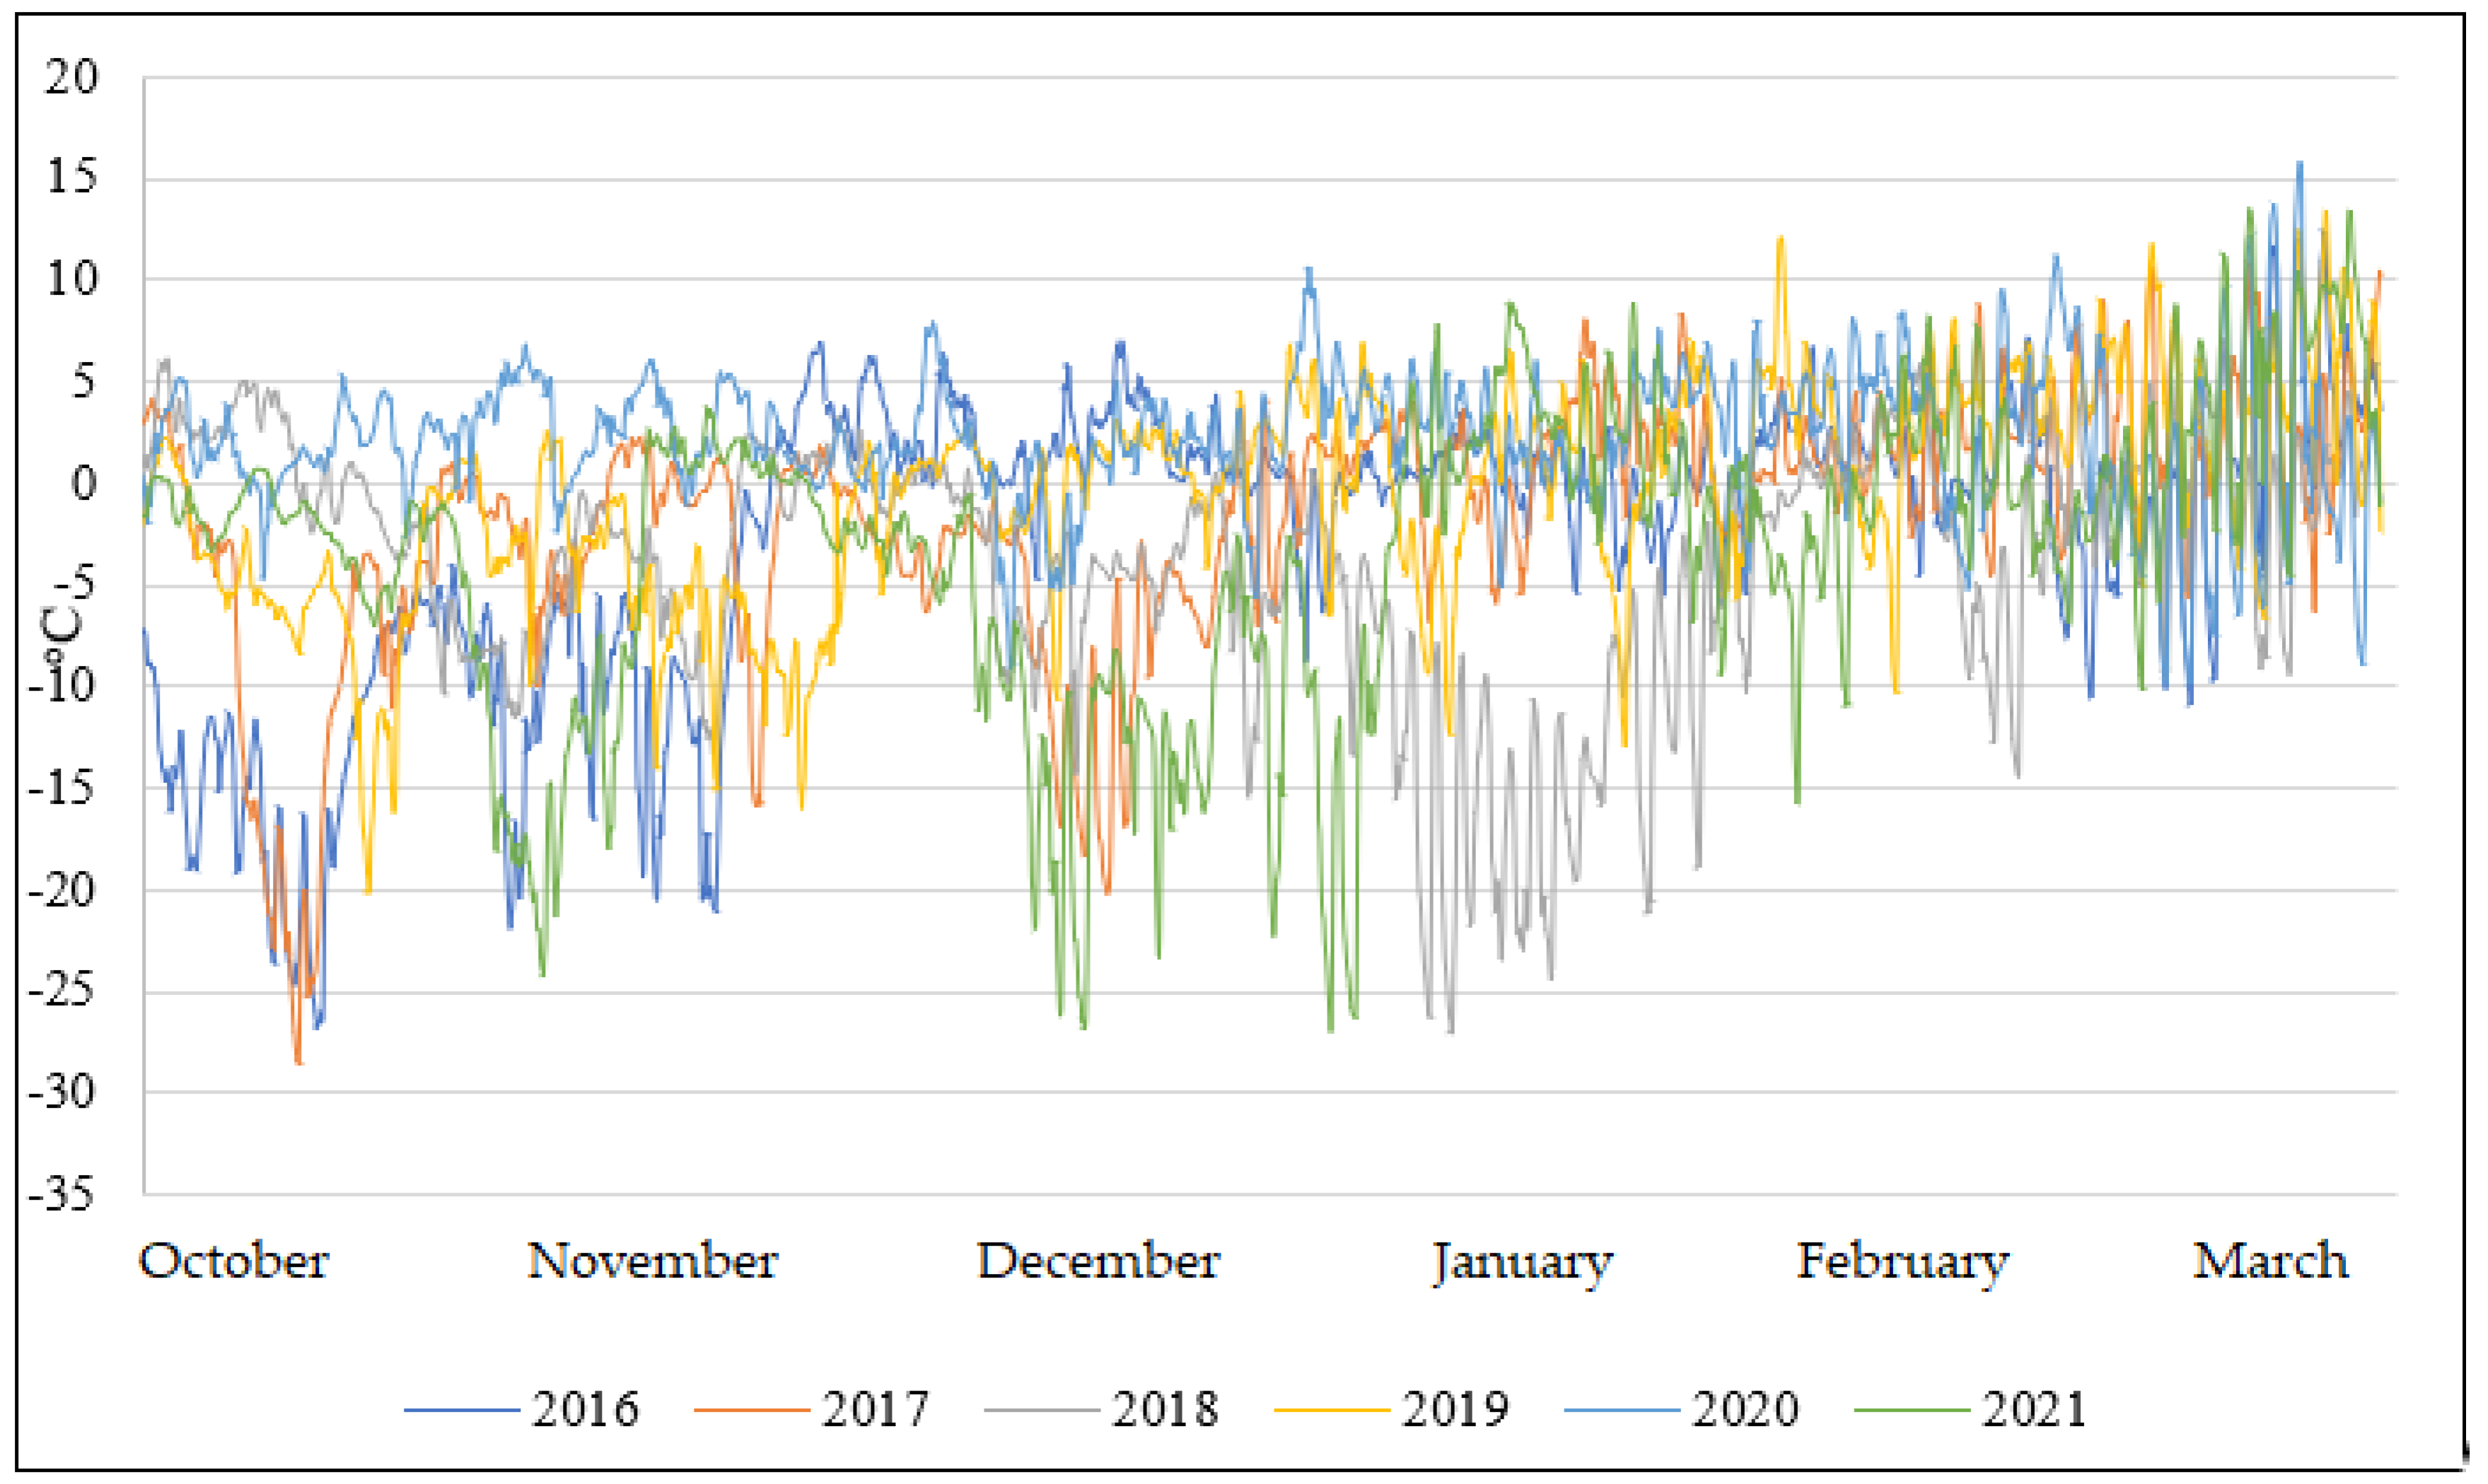
Figure 1. Recorded outdoor air temperatures between the months of October and March (heating season) over the period of 2016–2021 in city of Daugavpils.
Buildings 13 01916 g001
Figure 2. Photos of reference buildings employed in the study (from left: group-A, group-B, group-D, no group-C picture is available).
Buildings 13 01916 g002
Figure 3. Comparison of thermal energy consumption for space heating within building group-A [kWh/m2].
Buildings 13 01916 g003
Figure 4. Comparison of thermal energy consumption for space heating within building group-B [kWh/m2].
Buildings 13 01916 g004
Figure 5. Comparison of thermal energy consumption for space heating within building group-C [kWh/m2].
Buildings 13 01916 g005
Figure 6. Comparison of thermal energy consumption for space heating within building group-D [kWh/m2].
Buildings 13 01916 g006
Figure 7. The number of multi-apartment building certificates analyzed from December 2014 to April 2020.
Buildings 13 01916 g007
Table 1. Climate characteristics of the city of Daugavpils.
CityThe Average Air Temperature of the Coldest Five DaysThe Average Air Temperature of the Coldest Five Days, the Probability of Exceeding Which IsColdest Monthly Temperatures
0.020.1IIIIIIXXIXII
Daugavpils–23.3–26.4–22.3–42.7–43.2–32.0–14.7–24.1–38.7
Table 2. Technical parameters of the datalogger.
ParameterValue
Humidity measuring accuracy±4%
Humidity measuring range10…90% RH
Humidity measuring resolution0.1% RH
Measurement accuracy±5%
Measuring instrument featuresautomatic temperature compensation
Measuring range0…4000 ppm
Temperature measurement accuracy±0.8 °C
Temperature measurement resolution0.1 °C
Temperature measuring range0…50 °C
Type of meterdatalogger
Table 3. The characteristics of the examined multi-apartment buildings.
Building CharacteristicsImplemented Renovation MeasuresHeating System Description
No.Building ID #Building GroupFloor Area, m2Year of ConstructionRenovation Completion YearFacade RenovationVentilation System RenovationUpgrade/Modernization of Heating SystemHeating System *Distribution *
11A12840.419602012+-+one-pipetop
29A11920.0719712015+-+two-pipebottom
312A12820.419632019+++one-pipetop
43A32803.519602013+--one-pipetop
55B11468.119572012+-+two-pipetop
66B11806.119552012+-+two-pipebottom
72C1522.319492012+-+two-pipebottom
810C2317.519572017--+two-pipebottom
98C31004.2519742013+--one-pipetop
107D12681.519802013+-+one-pipetop
1111D12656.4219772018+++one-pipebottom
1213D22069.9719732020--+two-pipebottom
134D31957.9219802013+--one-pipetop
* A one-pipe or single-pipe heating system uses a single pipe to distribute both the supply and return of hot water or steam in one circuit, while a two-pipe system has separate pipes for supply and return circuit. “Top” and “bottom” refer to the vertical positioning of heating system components, with “top” typically denoting higher floor levels and “bottom” referring to lower floor levels.
Table 4. The comparison of measured parameters in the examined multi-apartment buildings.
No.Building ID #Building GroupAverage Thermal Energy Consumption Q for Space Heating [kWh/m2] Average Measured Parameters Comments
Before Renovation, Qi per Floor AreaAfter Renovation, Qj per Floor AreaSavings [%]RH [%]CO2 [ppm]
11A1153.3271.9153.10%37.51079Facade + heating system upgrade
29A1143.6351.2564.31%25.5457Facade + heating system upgrade
312A1151.2369.8153.84%42.61314Full retrofit package
43A3147.8291.7537.93%N/AN/ARH, CO2 were not monitored
55B1187.5679.6257.55%44.31096Facade + heating system upgrade
66B1143.1255.0661.53%40.01399Facade + heating system upgrade
72C1185.4872.4360.95%N/AN/ARH, CO2 were not monitored
810C2182.29110.6239.31%62.02796Only heating system upgrade
98C3148.2396.6534.80%N/AN/ARH, CO2 were not monitored
107D1147.9463.3357.19%41.9747Facade + heating system upgrade
1111D1128.8742.2467.22%29.9438Full retrofit package
1213D2127.8182.9236.17%34.21131Only heating system upgrade
134D3146.1184.4942.17%35.41496Only facade renovation
Table 5. Building stock by year of construction completion (thousand m²).
Type of BuildingYear of ConstructionTotalTotal %
<19001901–19601961–19921993–20052006–20132014–20162017–20182019
1. Residential1.76523.10572.03811.06710.4614.8413.7681.958129.00464%
1–2 apartment buildings1.21217.09529.1606.6287.2313.9122.8611.44169.54034%
Multi-apartment buildings5536.01042.8784.4393.23092990751759.46429%
2. Non-residential8408.38444.3377.4056.4772.3601.95491372.67036%
Industrial2353.41623.5373.3822.62796889143335.49018%
Administrative1691.5545.70692484435133221710.0975%
Educational1181.2576.36738622012516148.5034%
Trade474952.3751.6271.631491316837.0644%
Treatment274671.973218178503722.9521.46%
Accommodation402619872574242072061162.4971.24%
Culture1454671.44912259142302.2791.13%
Service312271.2312912038783452.1991.09%
Other28239711199291664951.5890.79%
Total2.60531.489116.37518.47216.9387.2015.7222.872201.674100%
Total in %1%16%58%9%8%4%3%1%100%
Disclaimer/Publisher’s Note: The statements, opinions and data contained in all publications are solely those of the individual author(s) and contributor(s) and not of MDPI and/or the editor(s). MDPI and/or the editor(s) disclaim responsibility for any injury to people or property resulting from any ideas, methods, instructions or products referred to in the content.

