
A Comprehensive Review of Stone Dust in Concrete: Mechanical Behavior, Durability, and Environmental Performance
 ,
,  ,
,  , and
, and 
Abstract
:
1. Introduction
1.1. Overview
1.2. The Importance of Alternative Materials for Building Construction
1.3. Use of Stone Dust in Sustainable Concrete
1.4. Features and Objectives of the Review Paper
- What are the differences in the physical and chemical properties of stone dust aggregates compared to those of natural sand?
- How does stone dust influence recycled concrete’s workability, mechanical, physical, and durability properties?
- Can replacing natural sand with stone dust reduce environmental impacts in terms of energy and emissions?
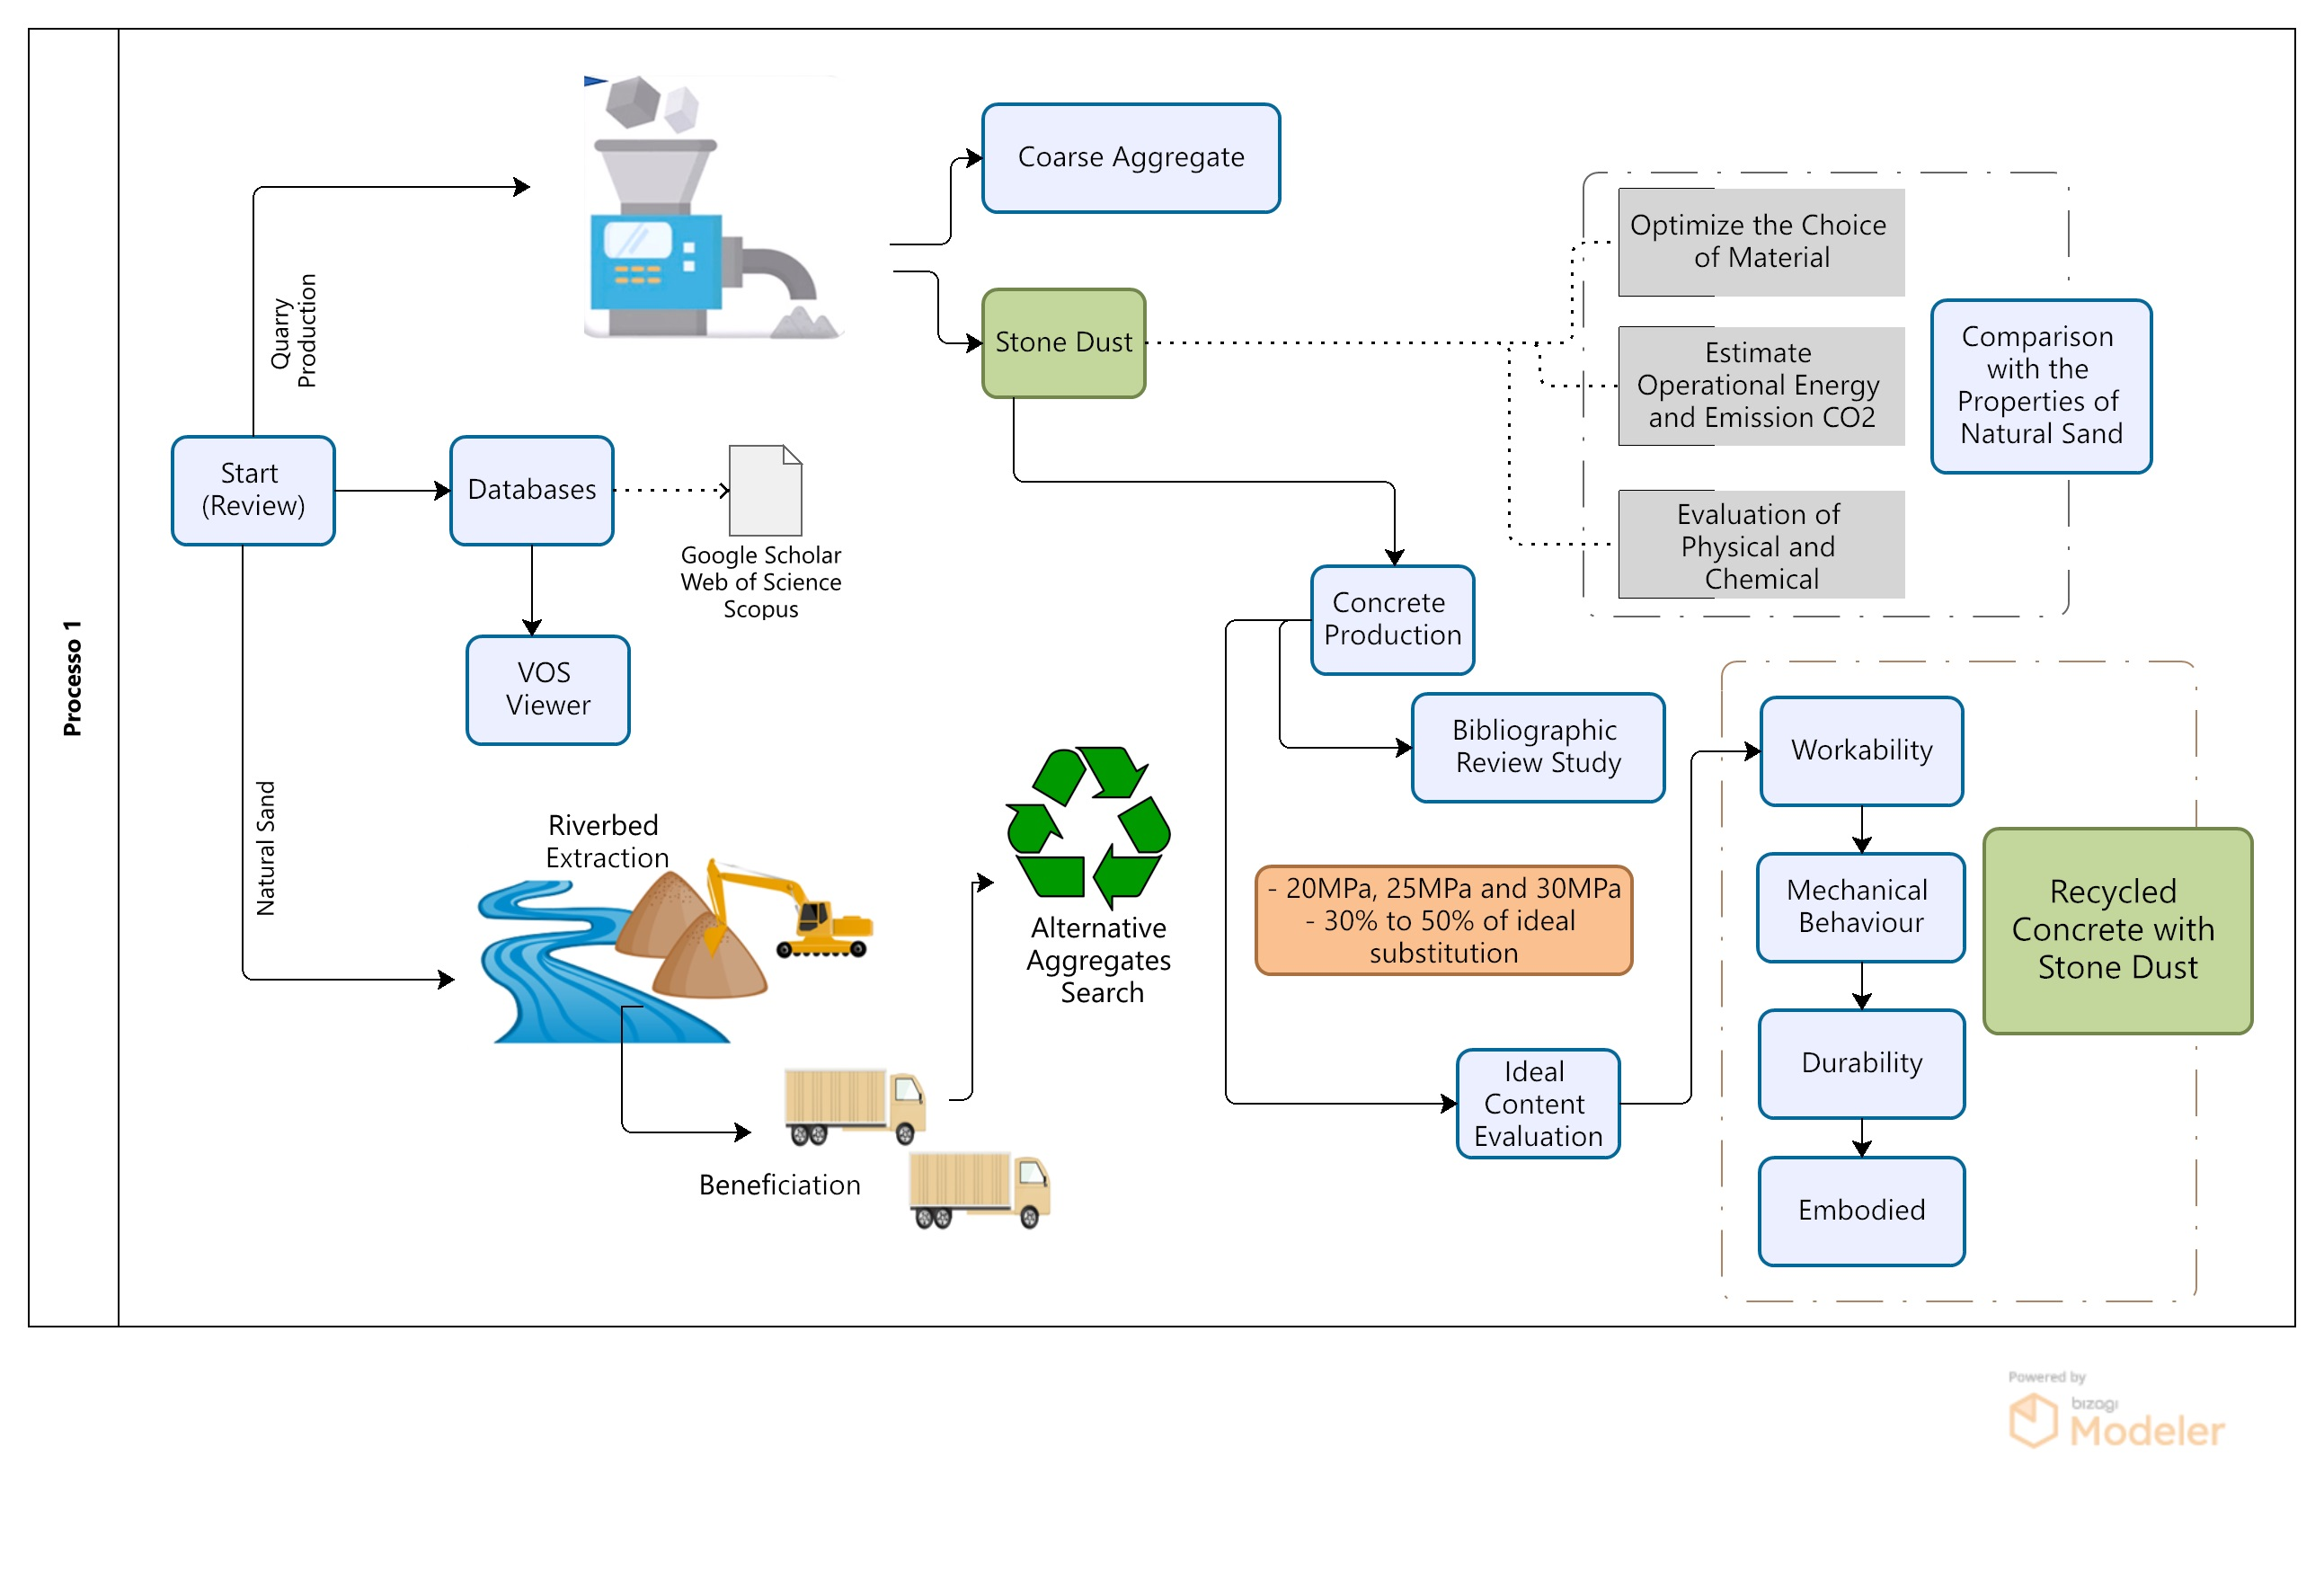
2. Methodology
2.1. Keywords Input and Collection of Documents from Search Databases
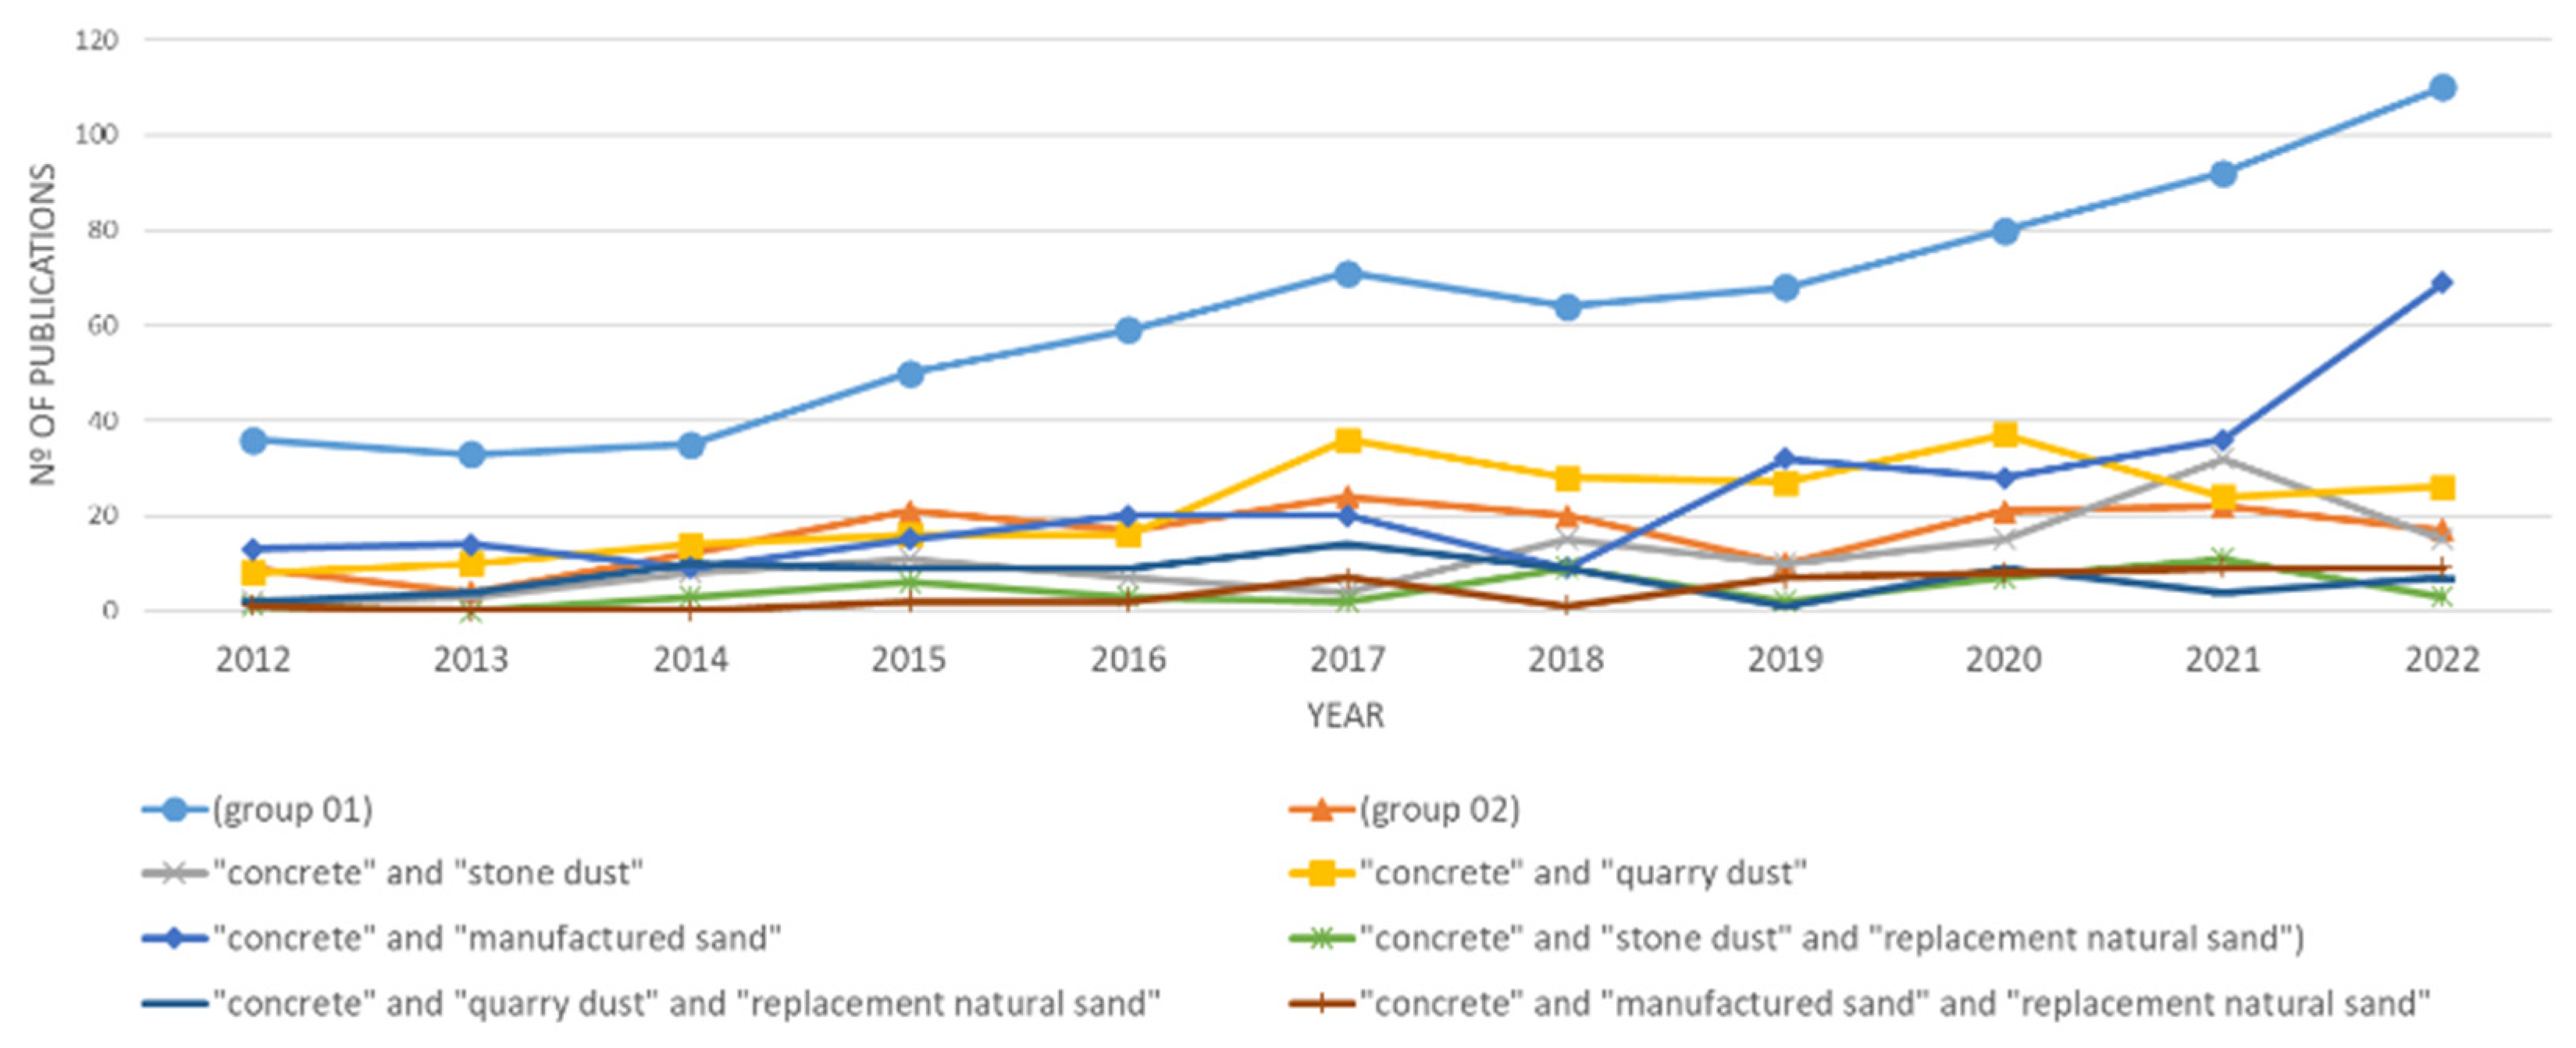
2.2. Published Research for Stone Dust in Concrete by Year
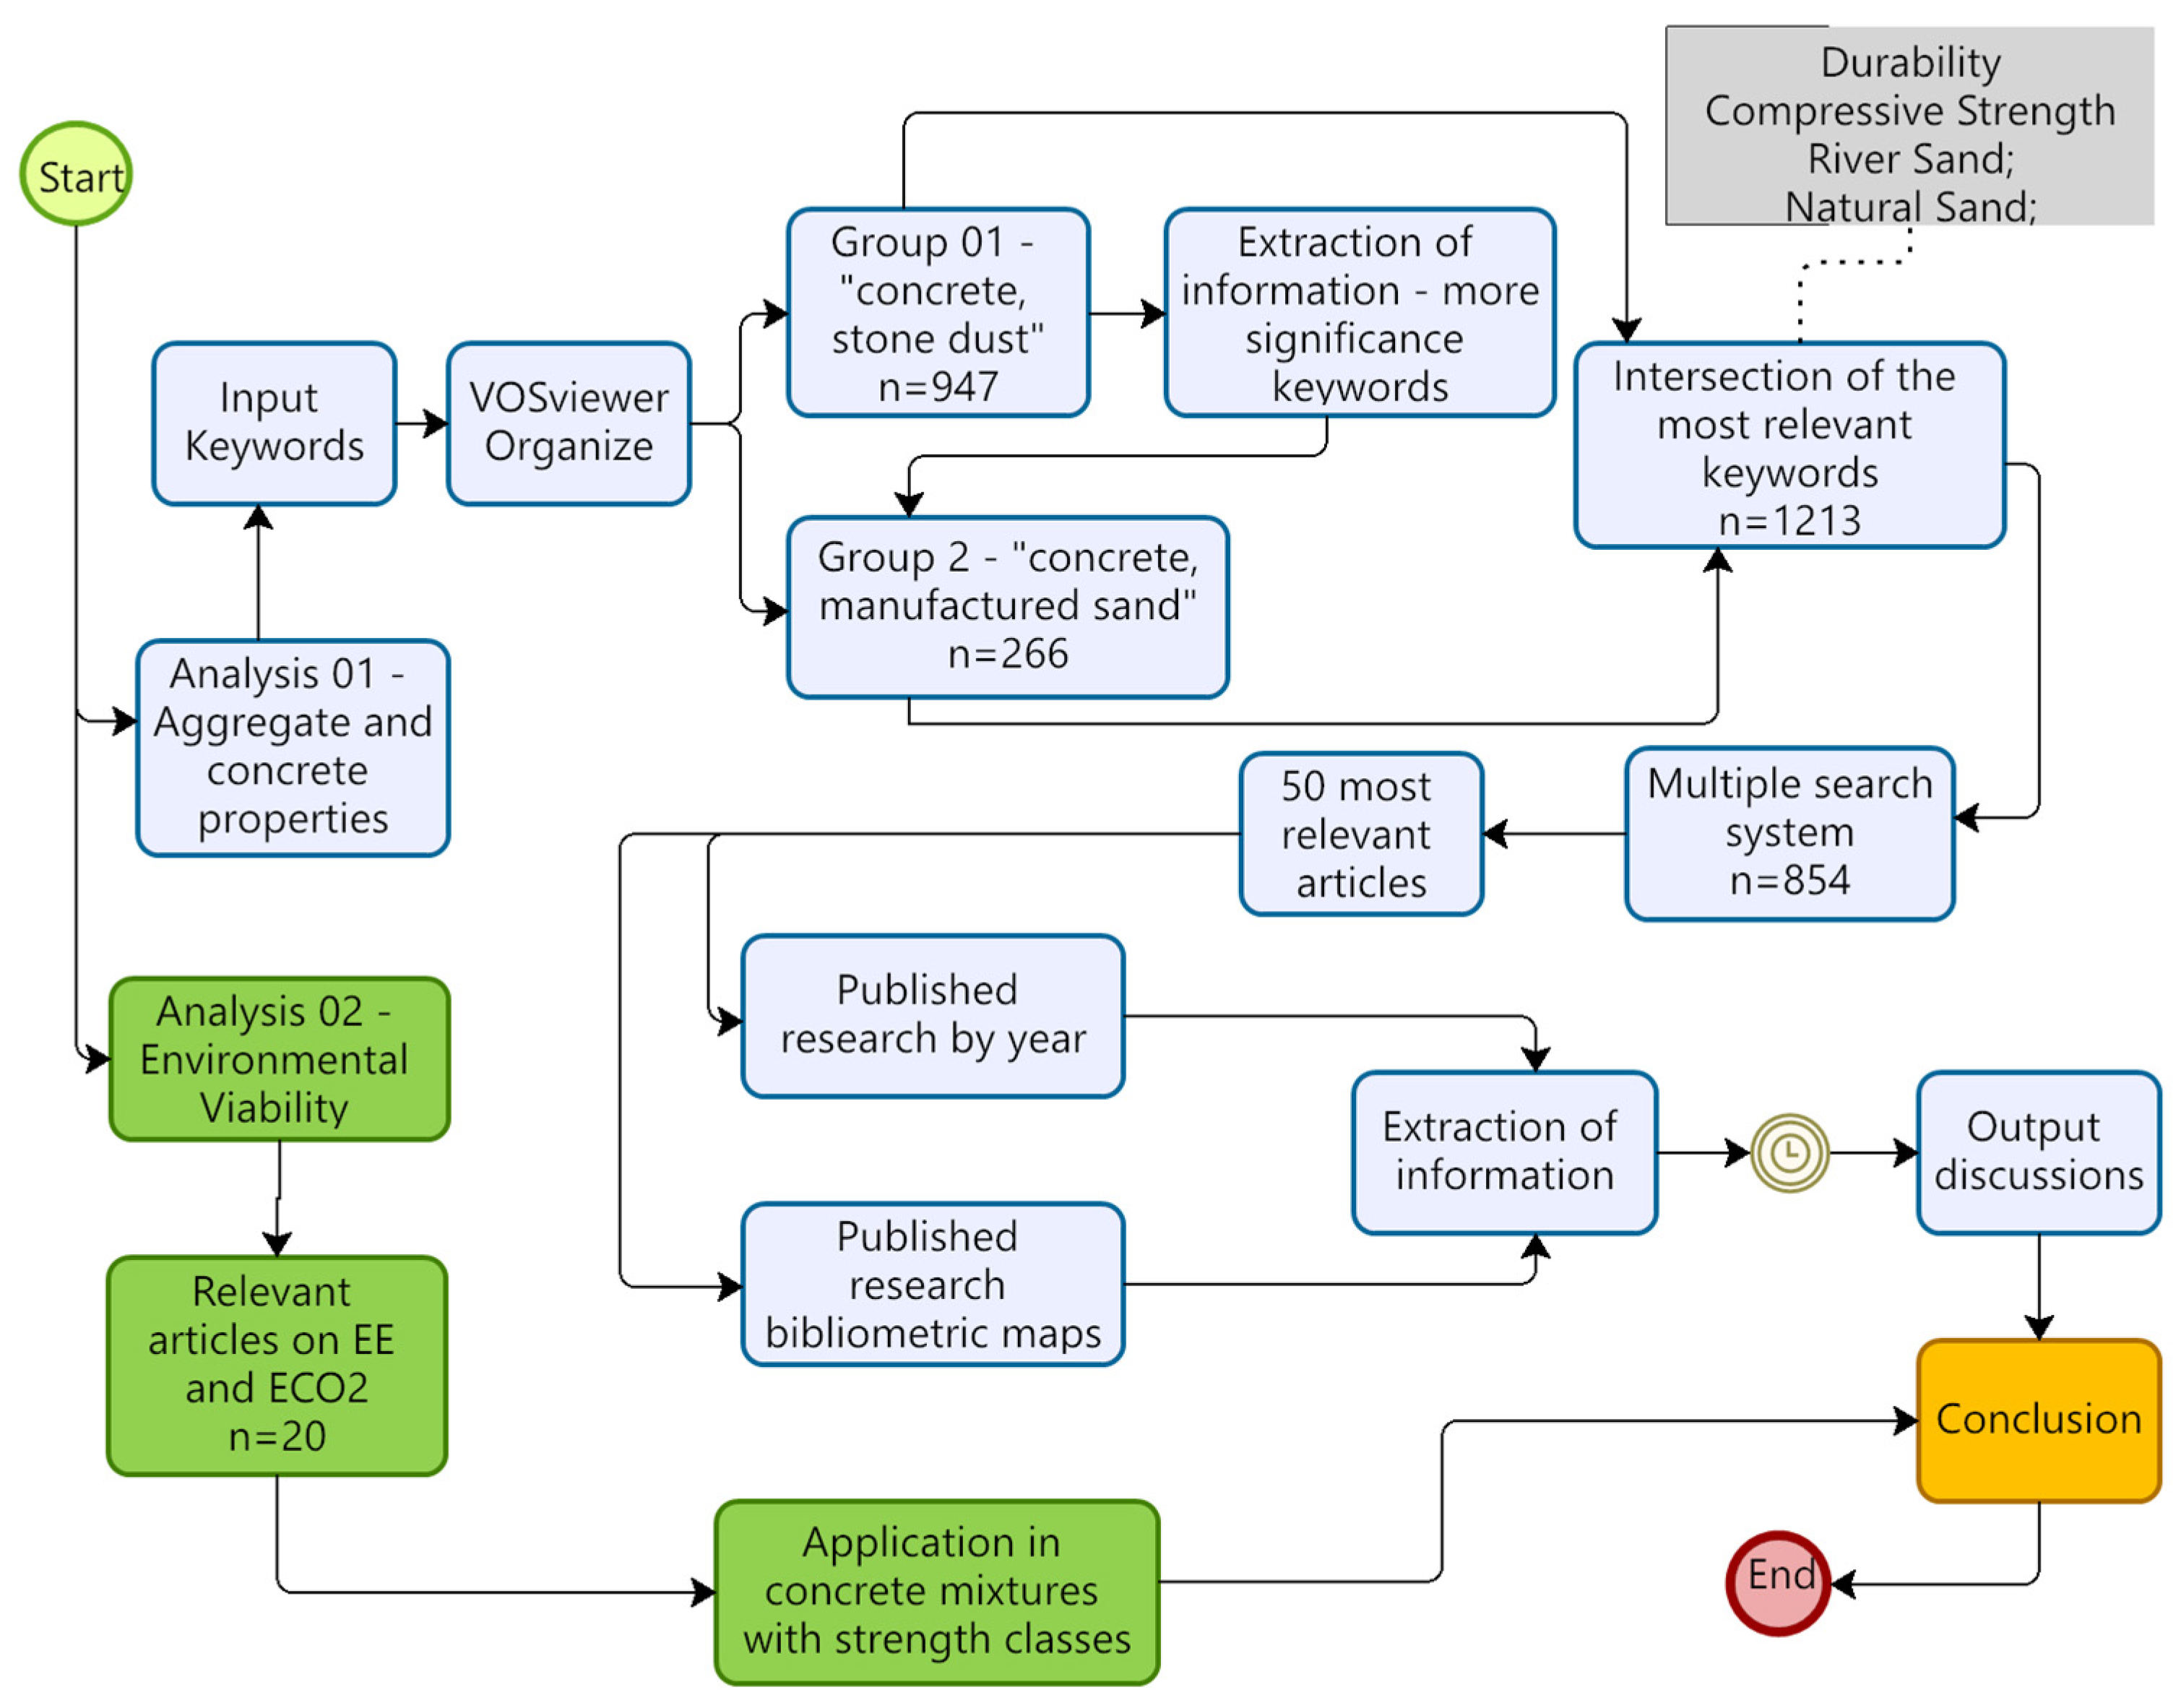
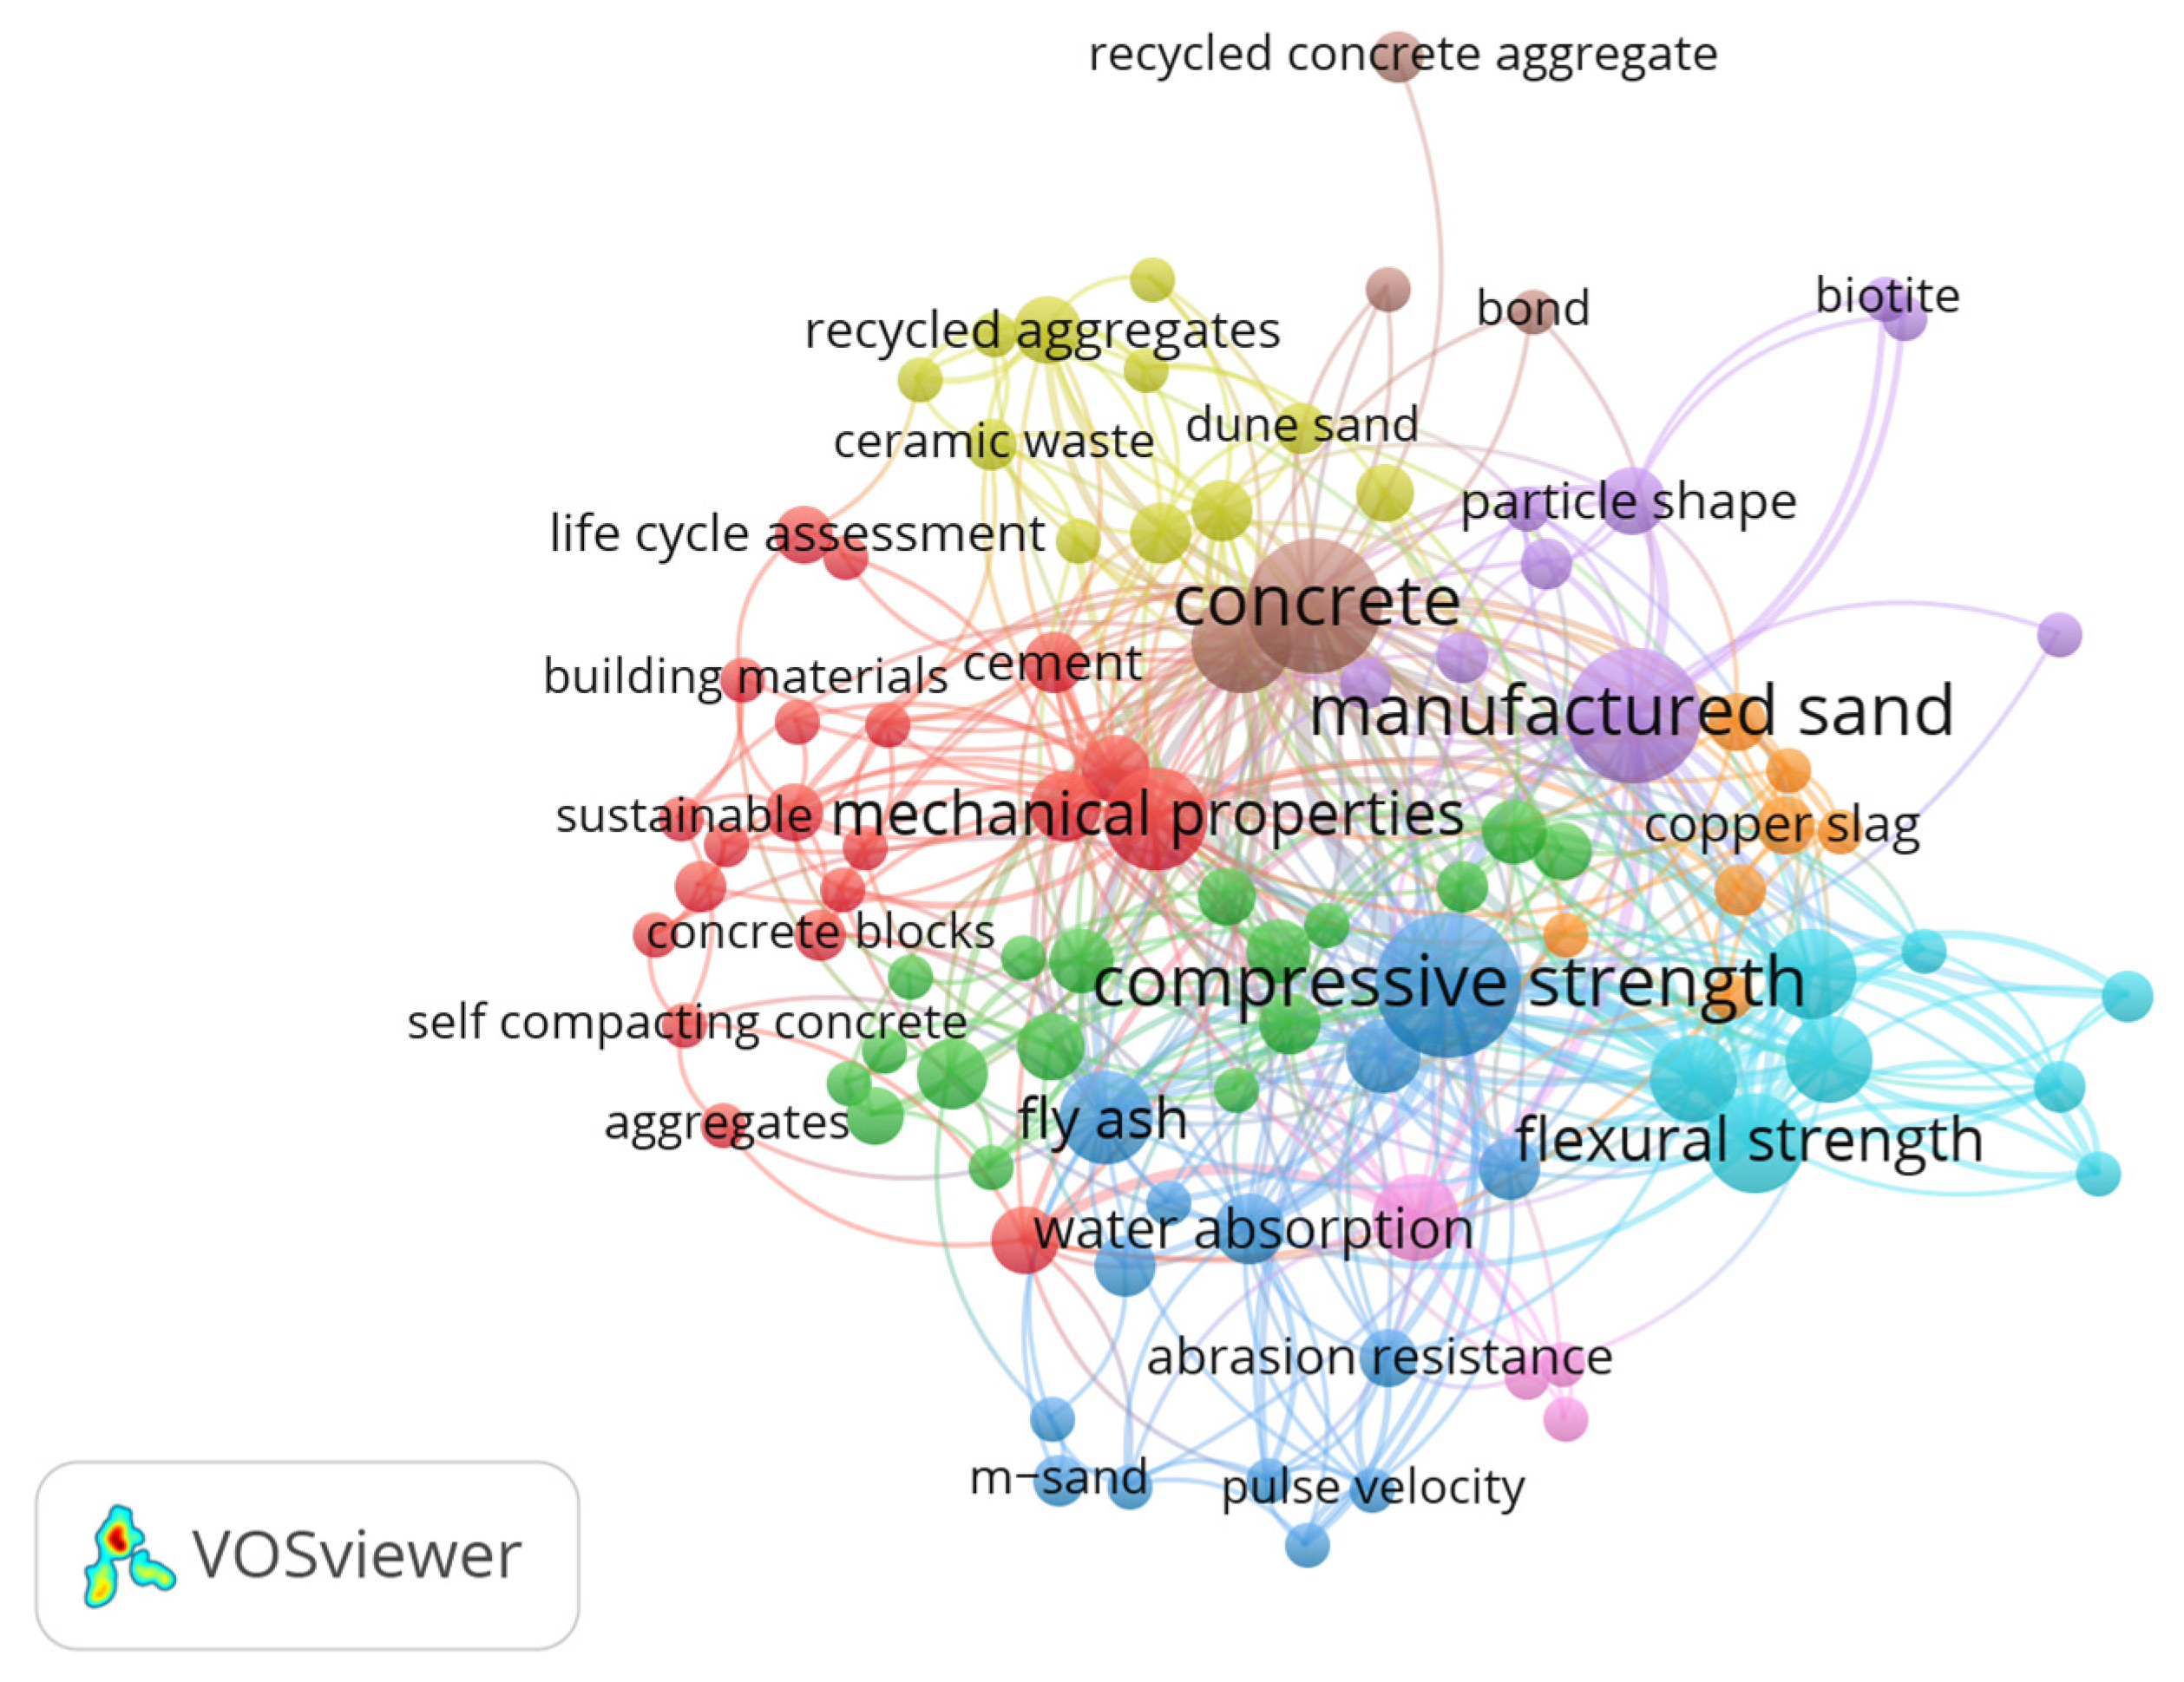
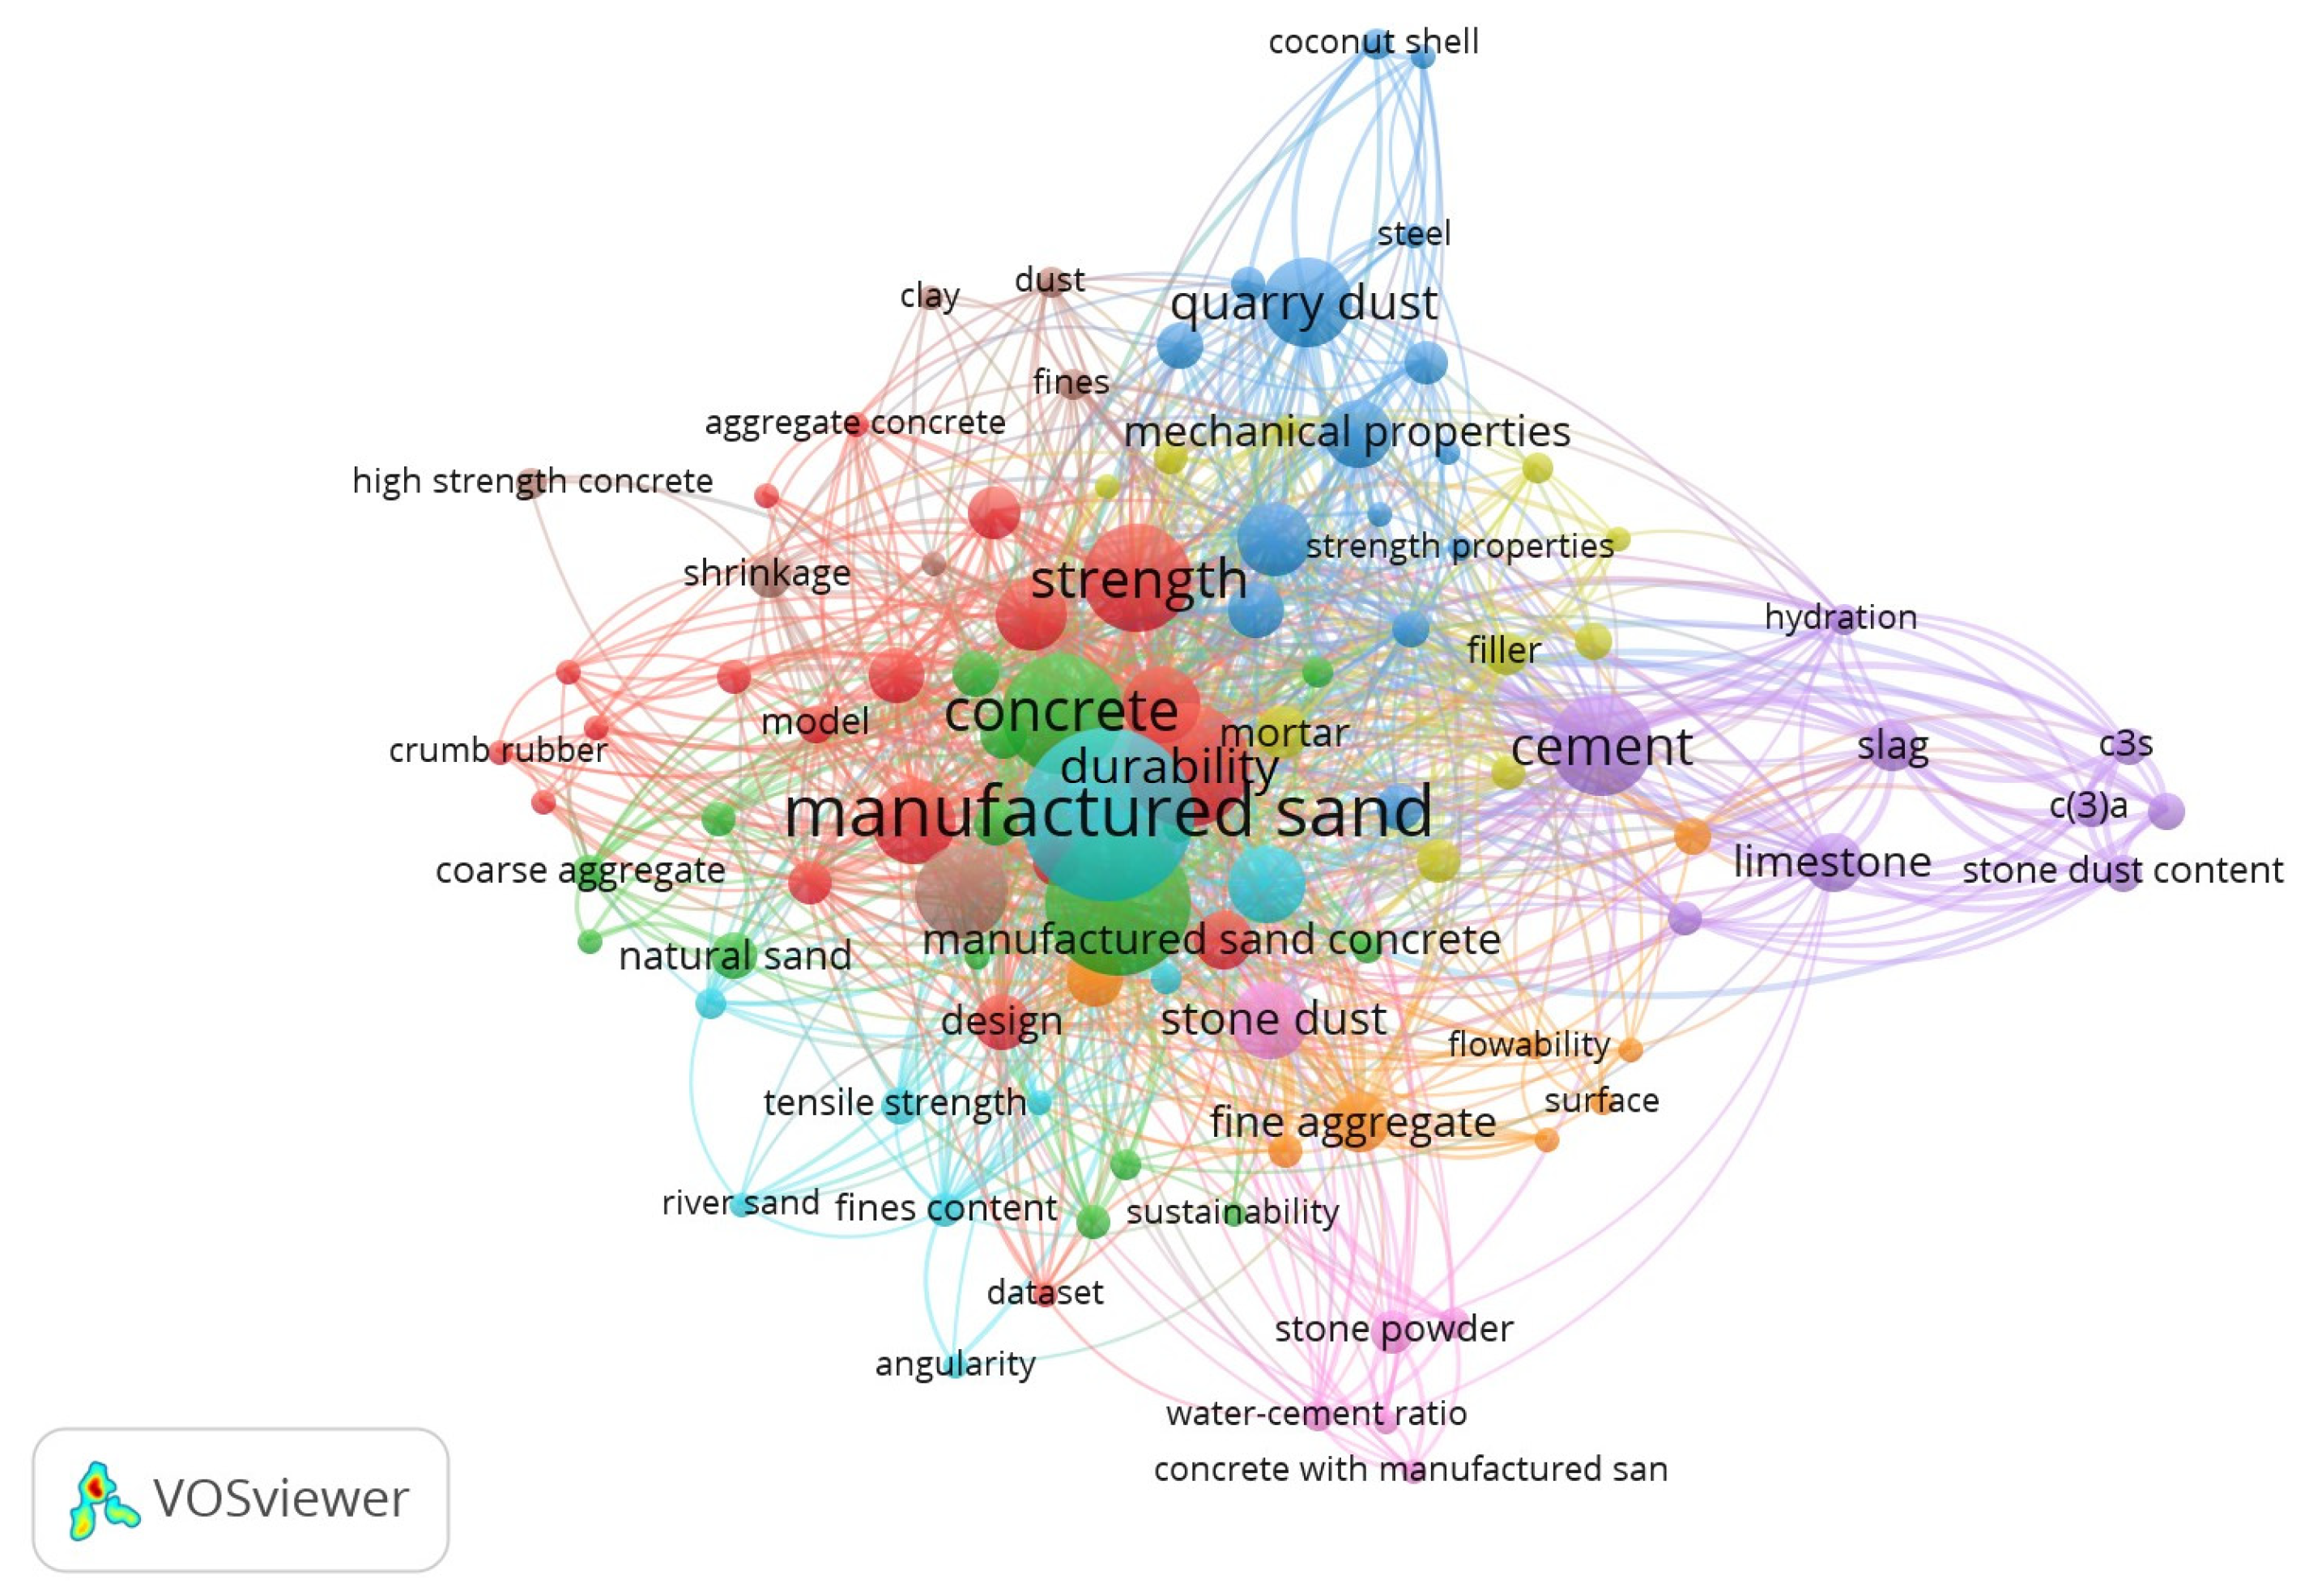
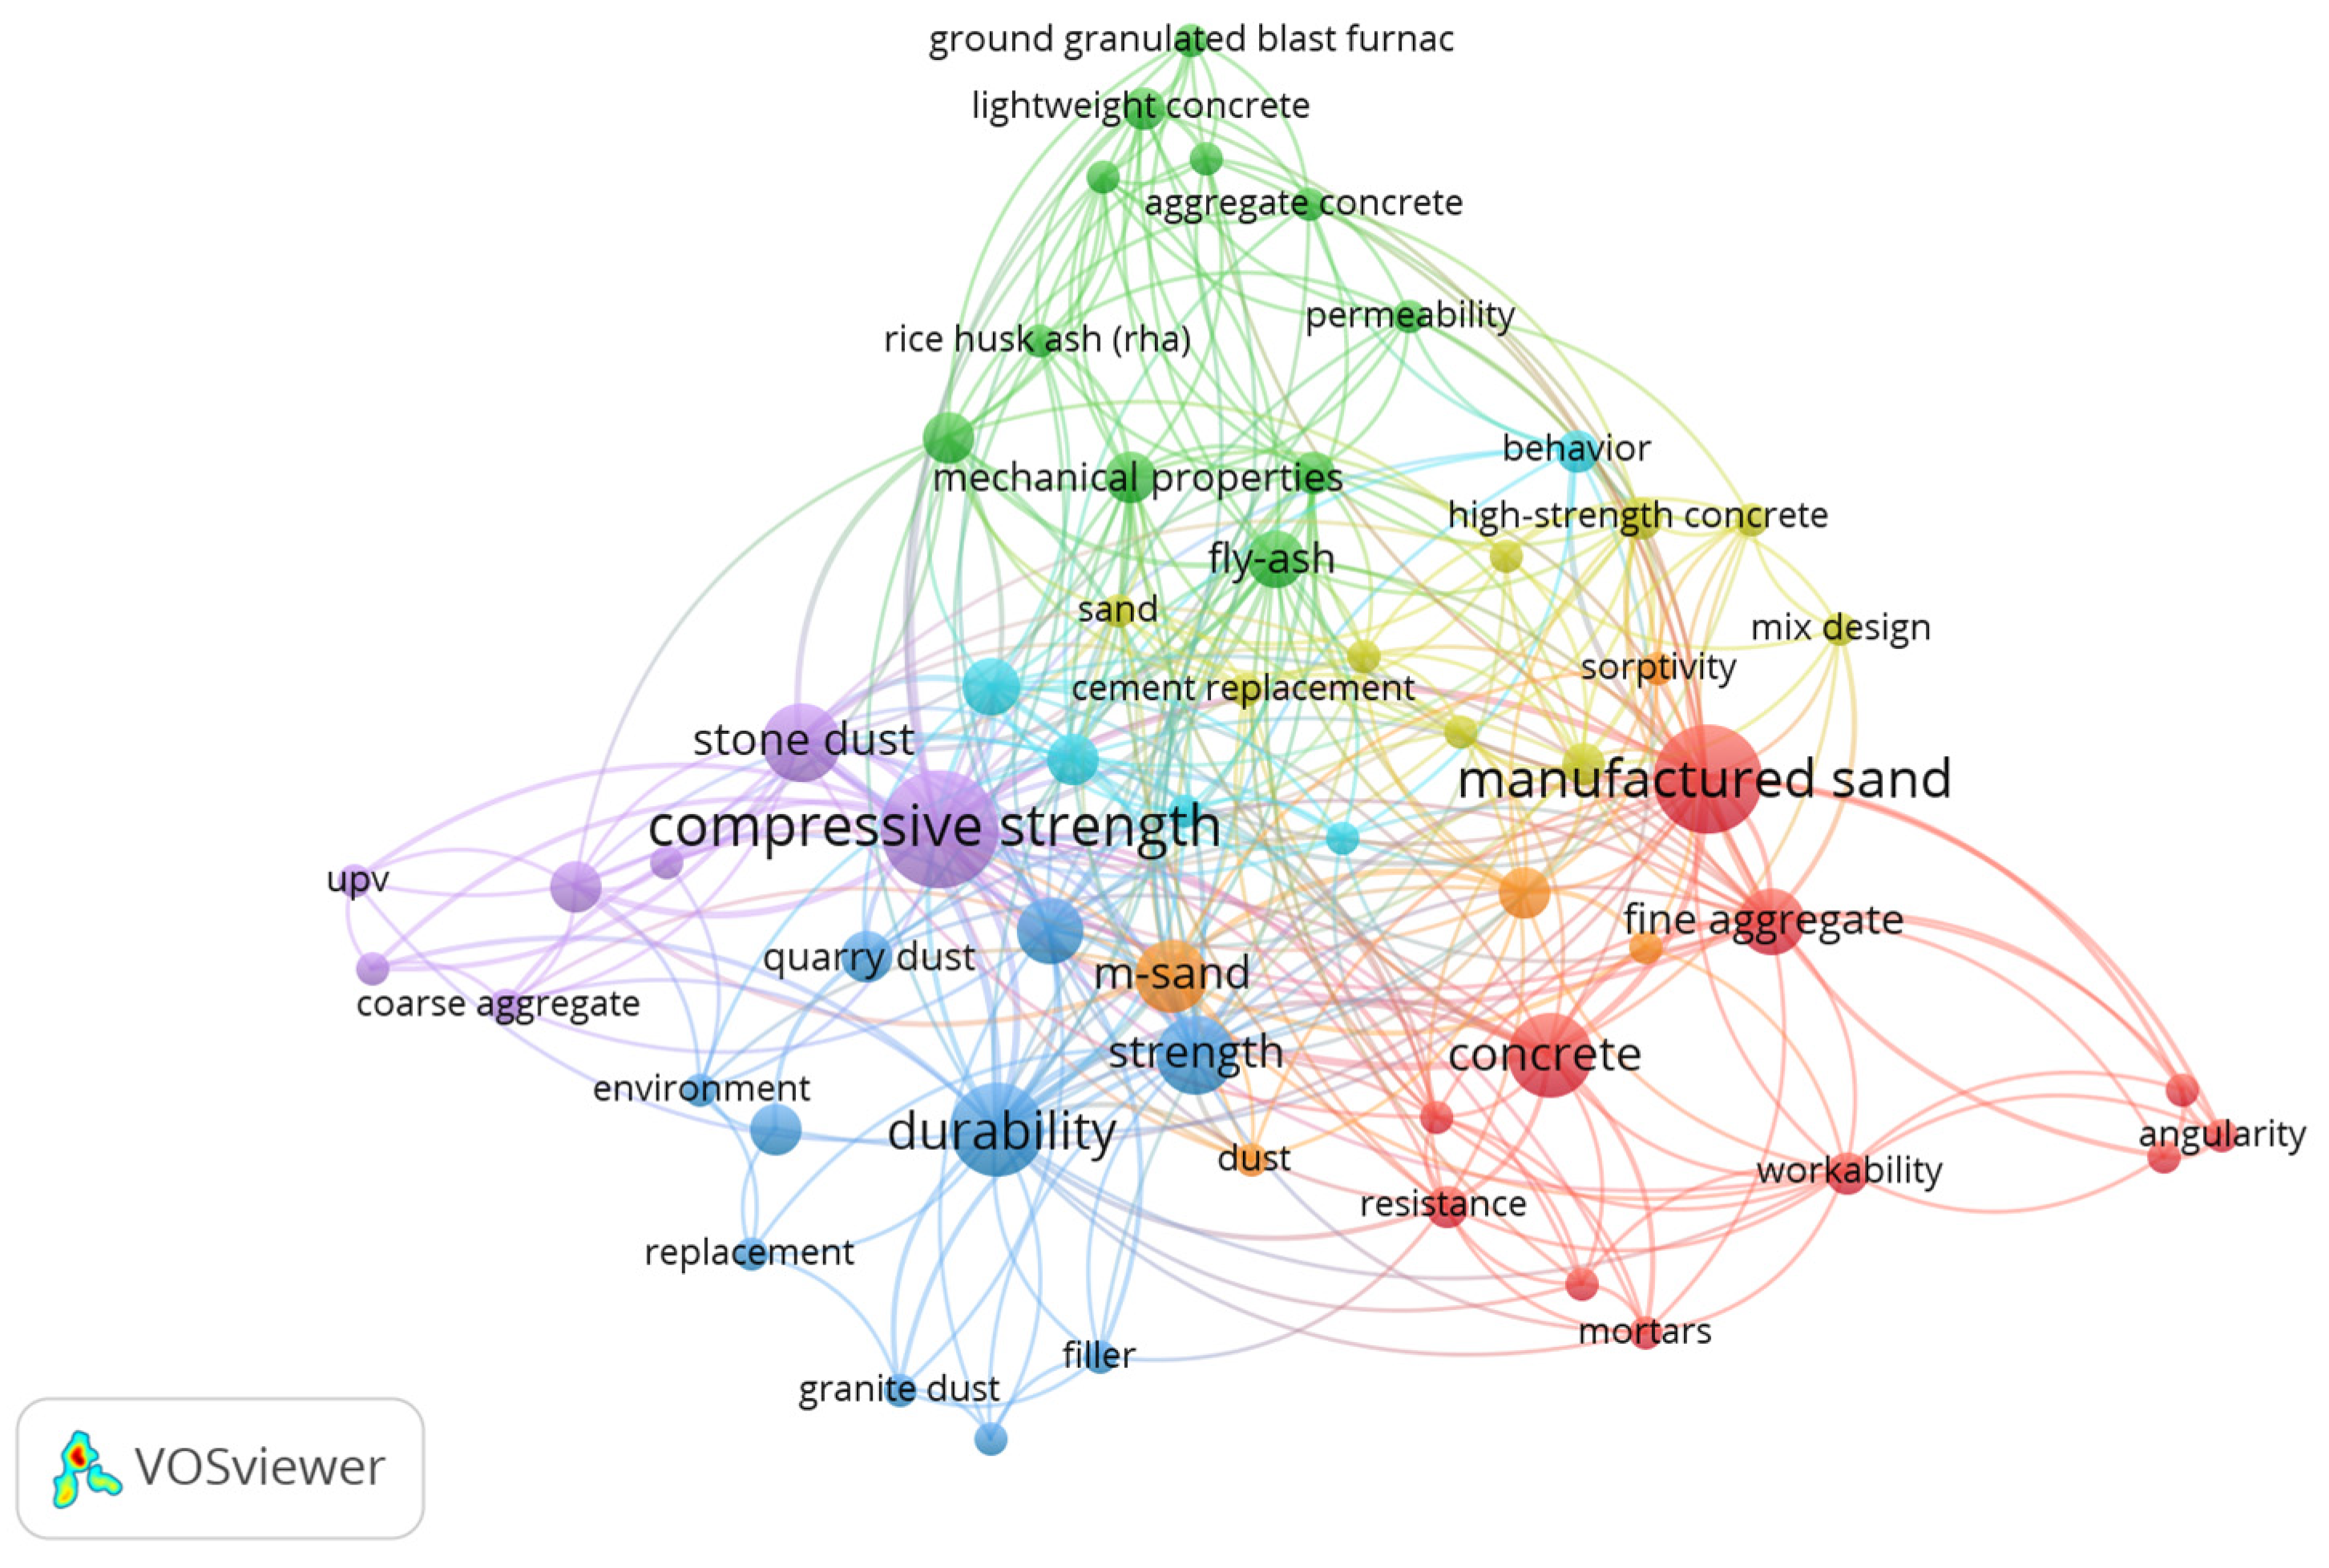
2.3. Recycled Concrete with Stone Dust—Bibliometric Map
2.4. Extraction of Information from Published Research into Stone Dust for Recycled Concrete
3. Results and Discussion
3.1. What Are the Differences in the Physical and Chemical Properties of Stone Dust Aggregates Compared to Those of Natural Sand?
3.2. How Does Stone Dust Influence Recycled Concrete’s Workability, Mechanical, Physical, and Durability Properties?
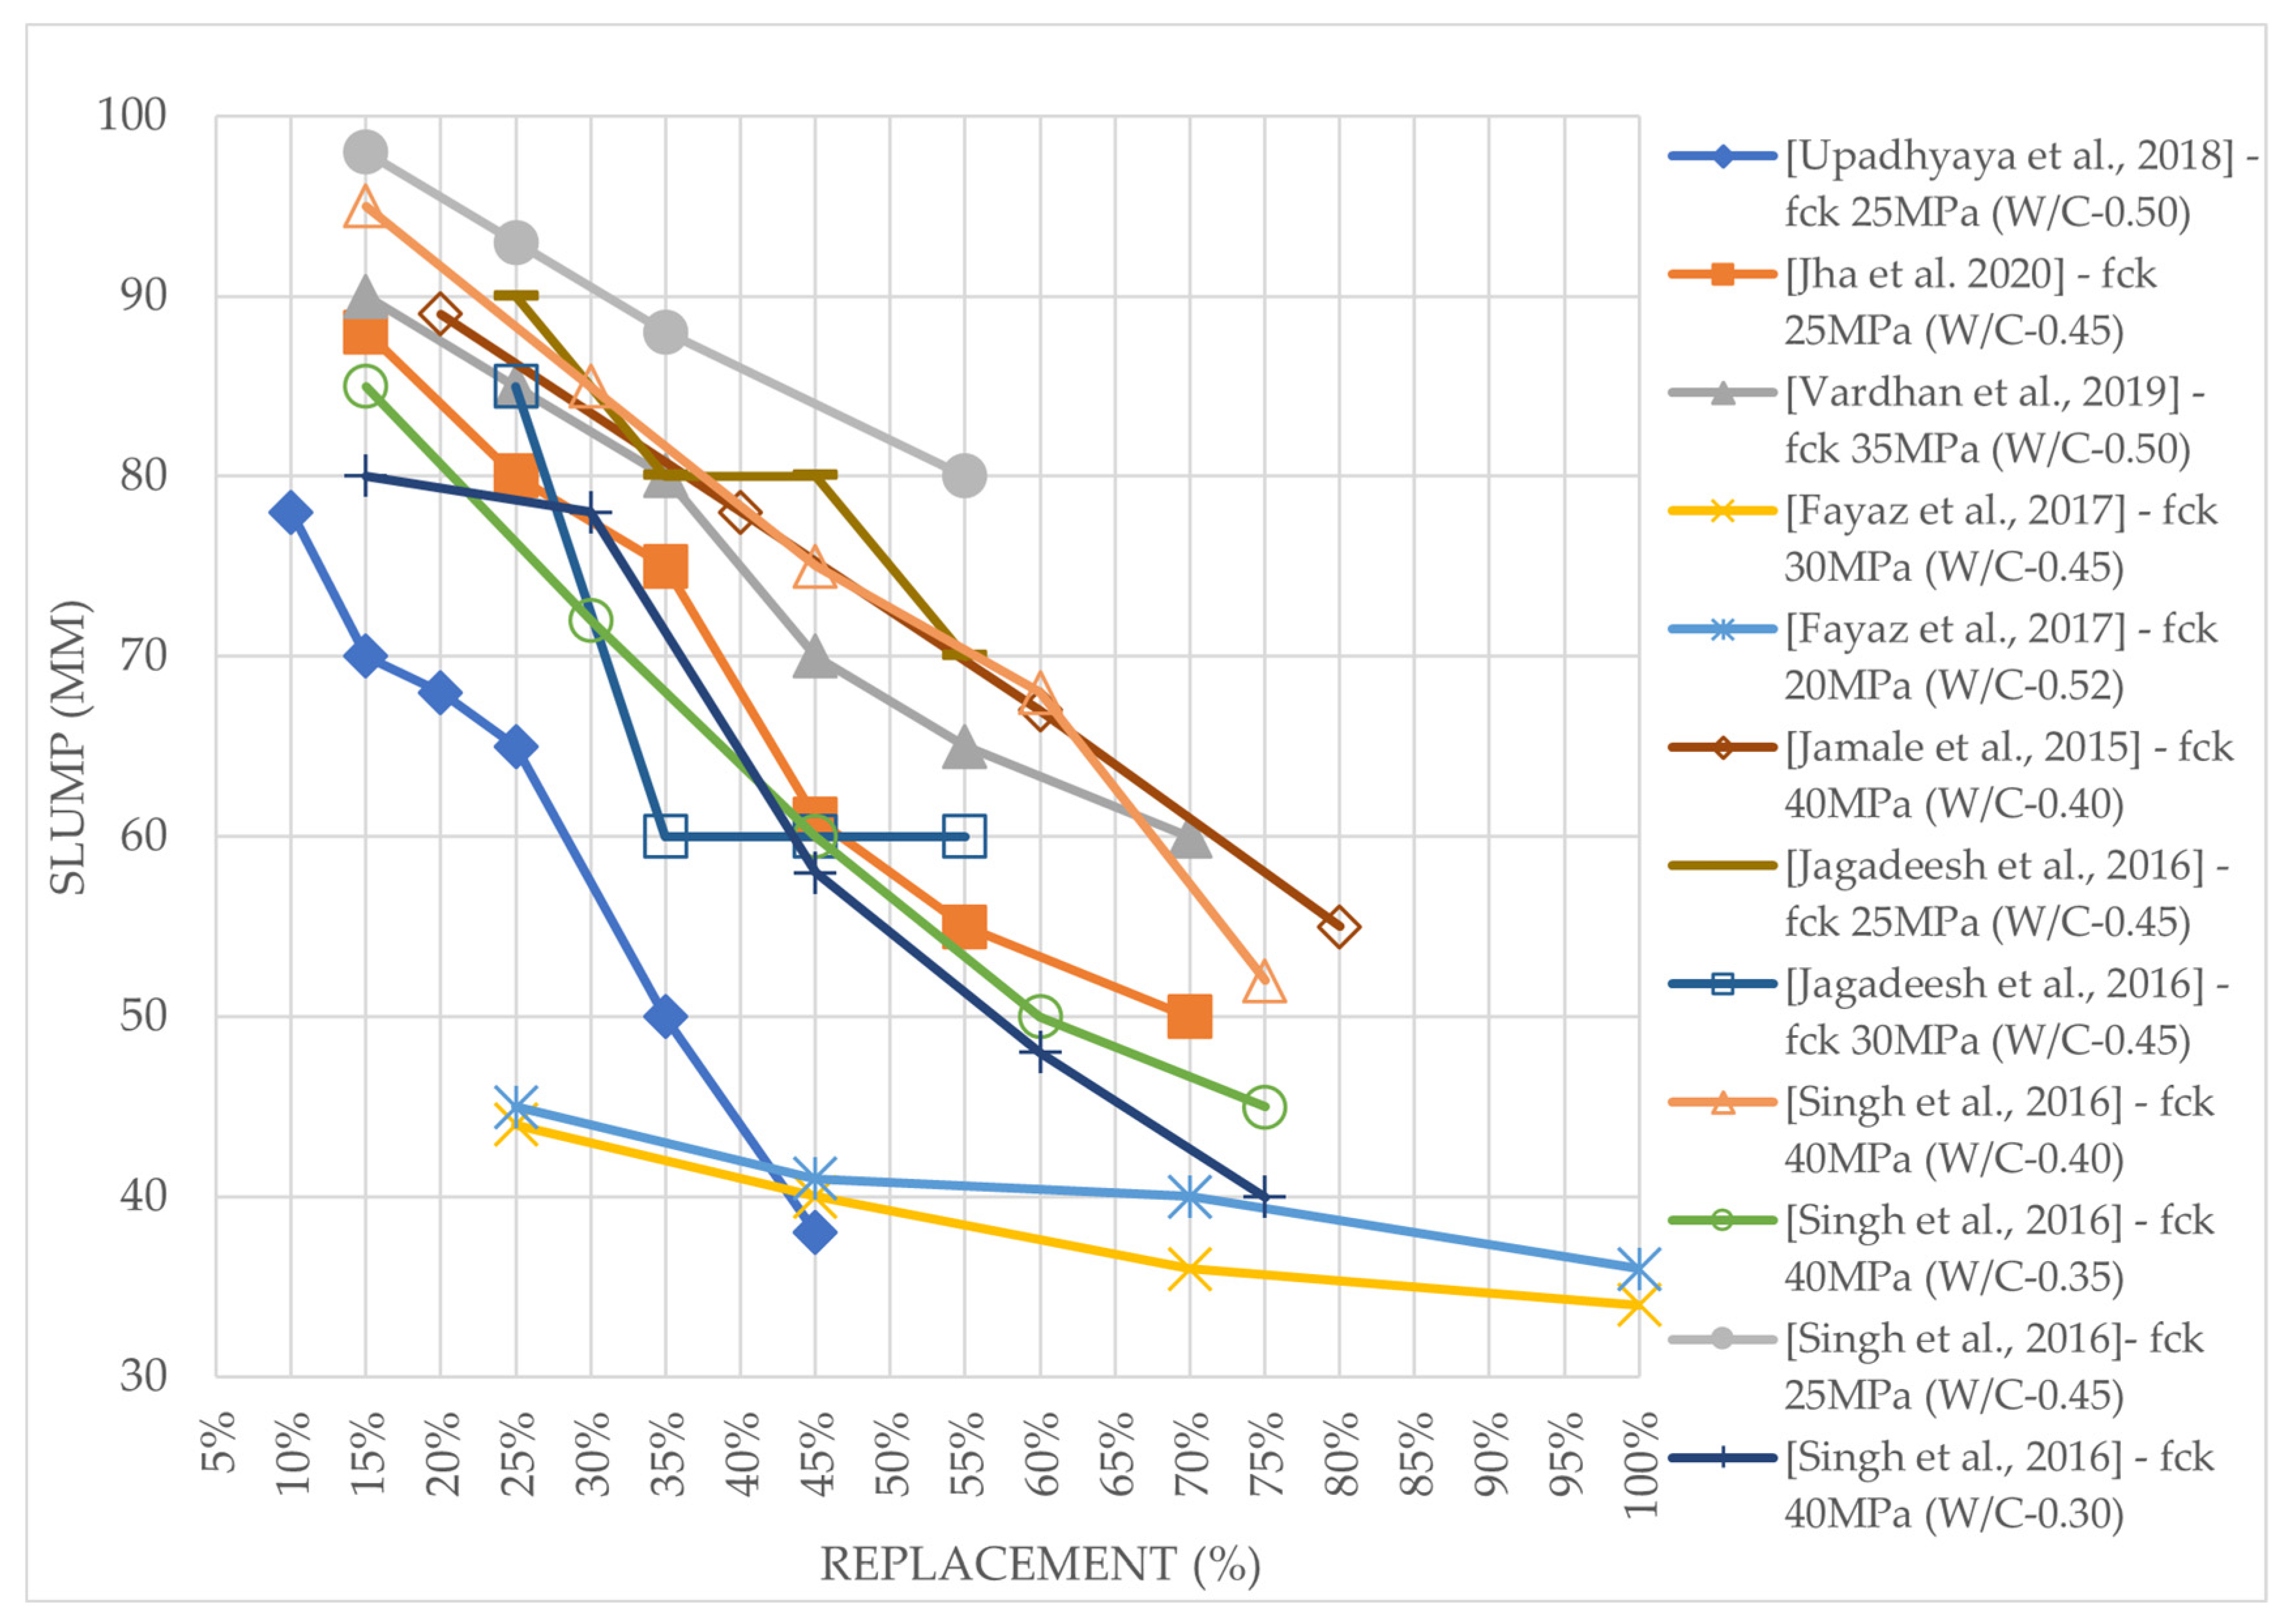
3.2.1. Workability
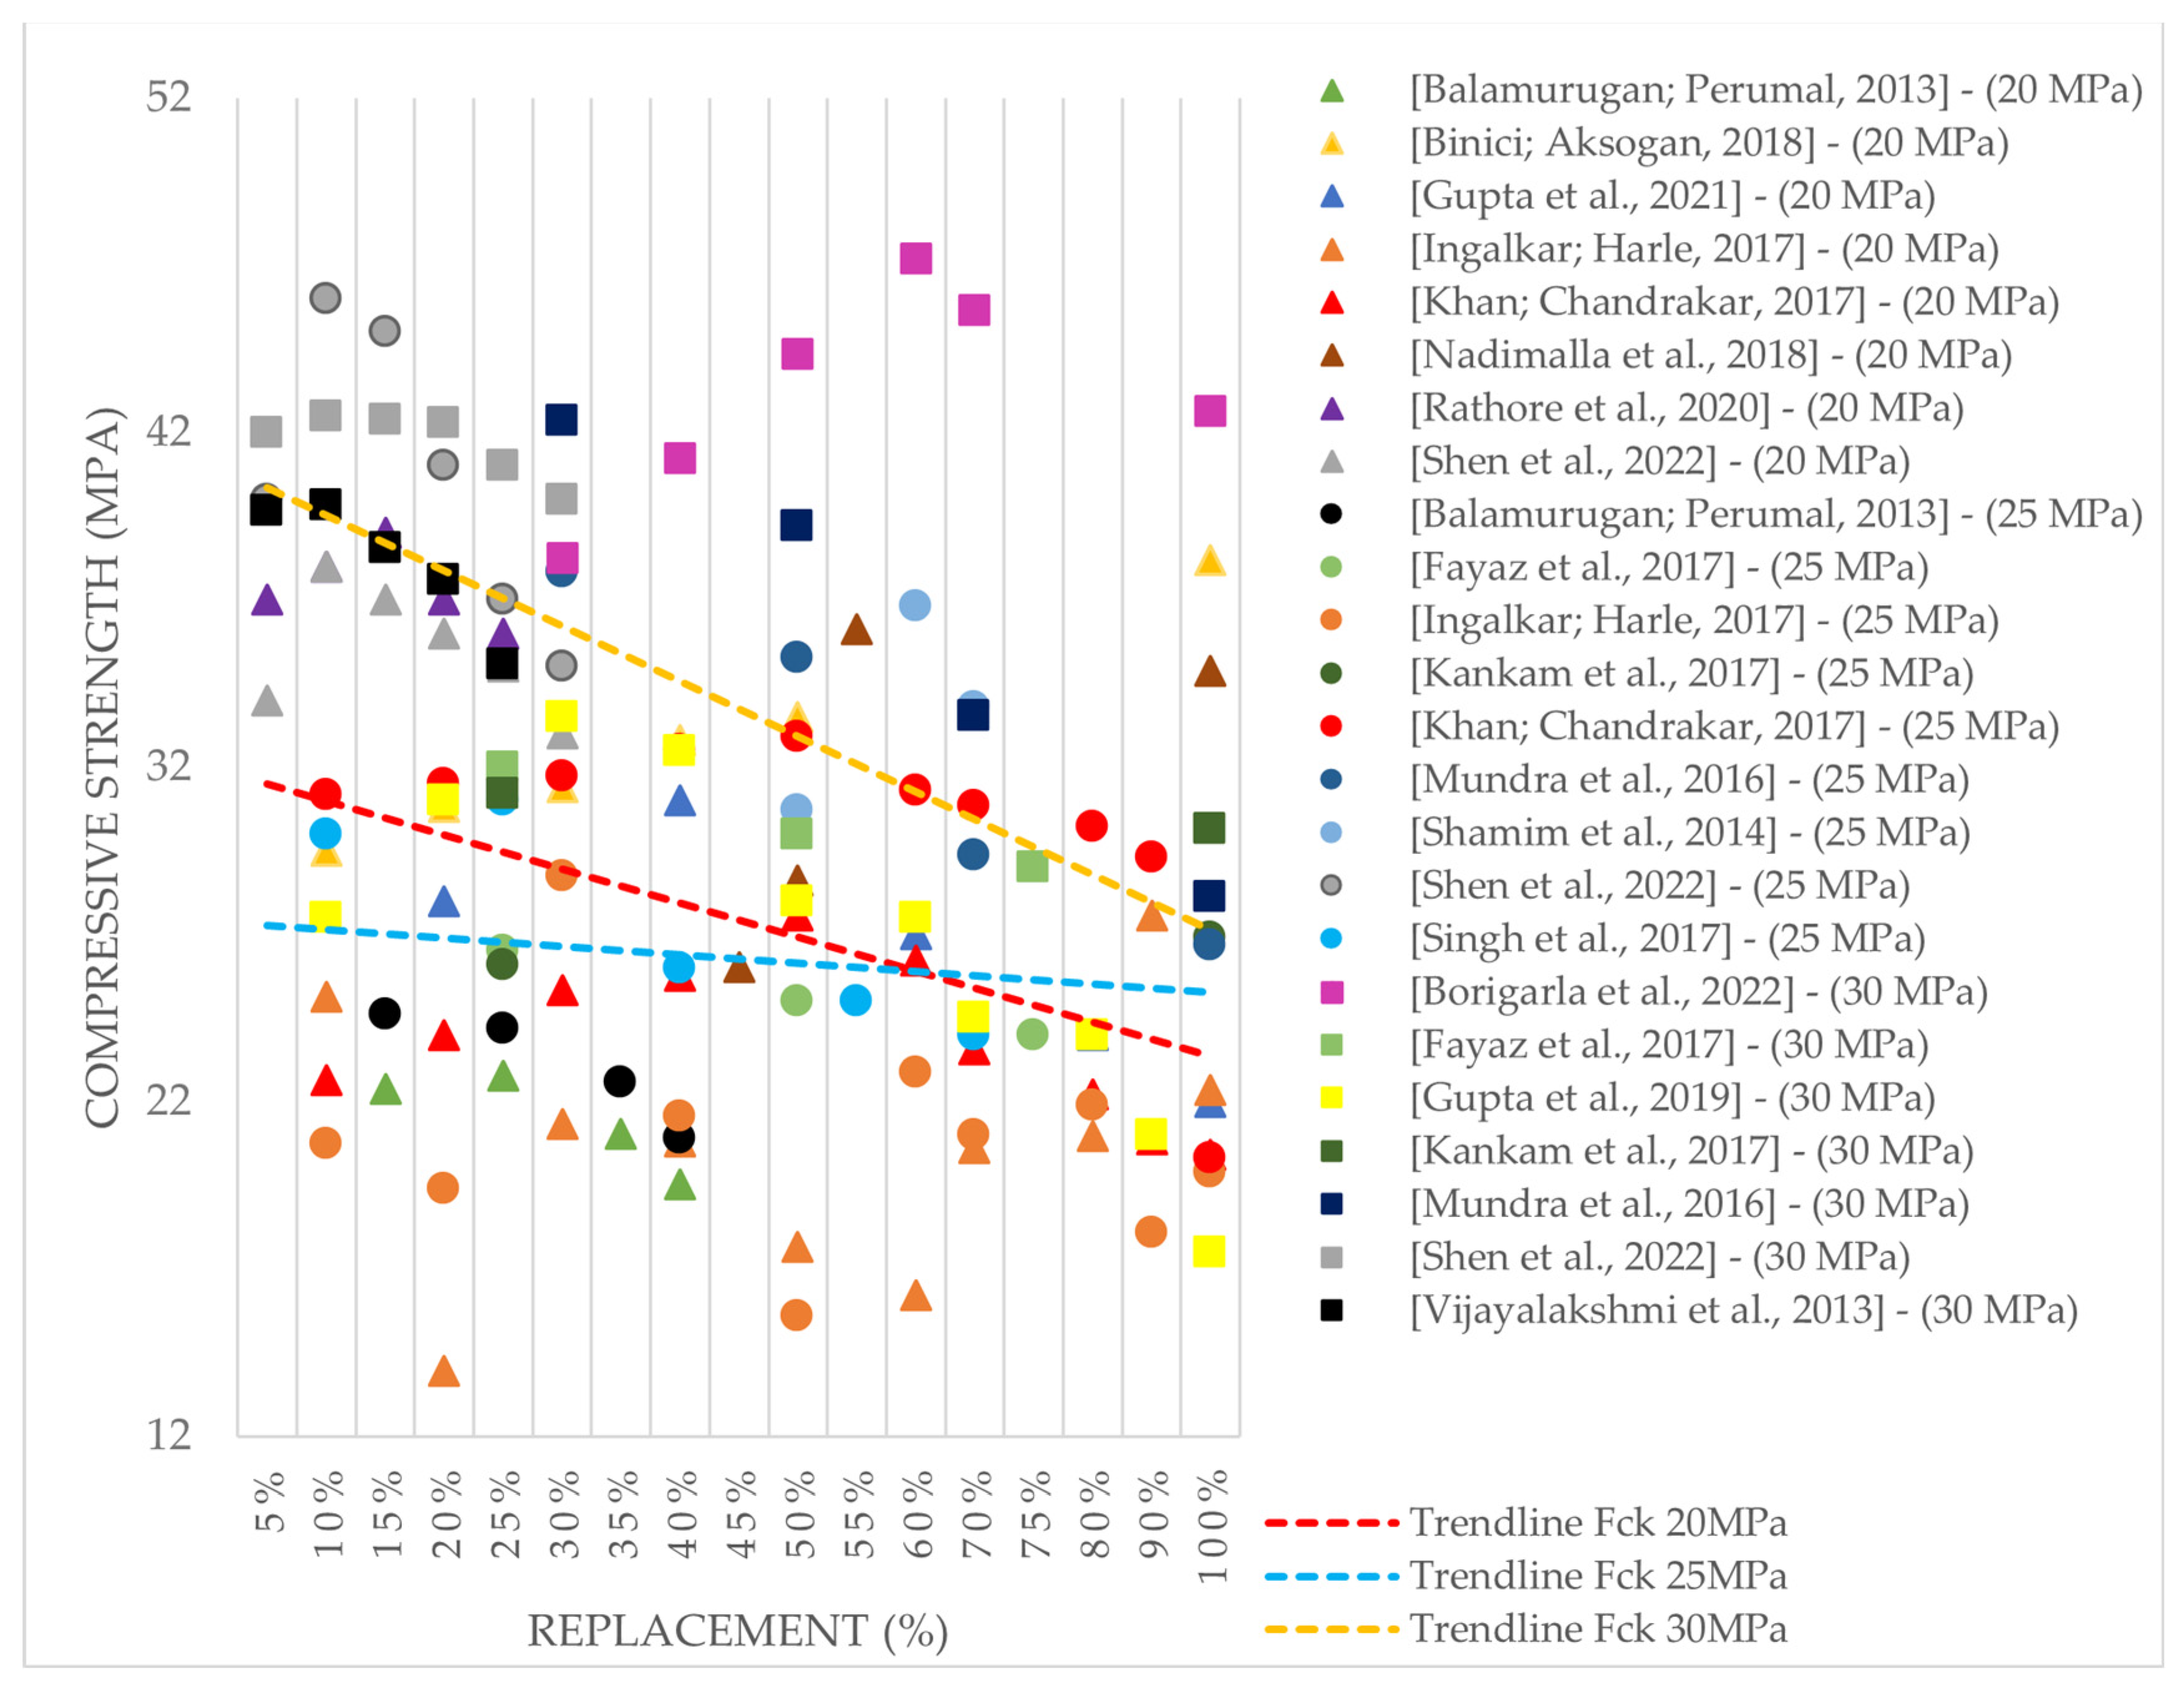
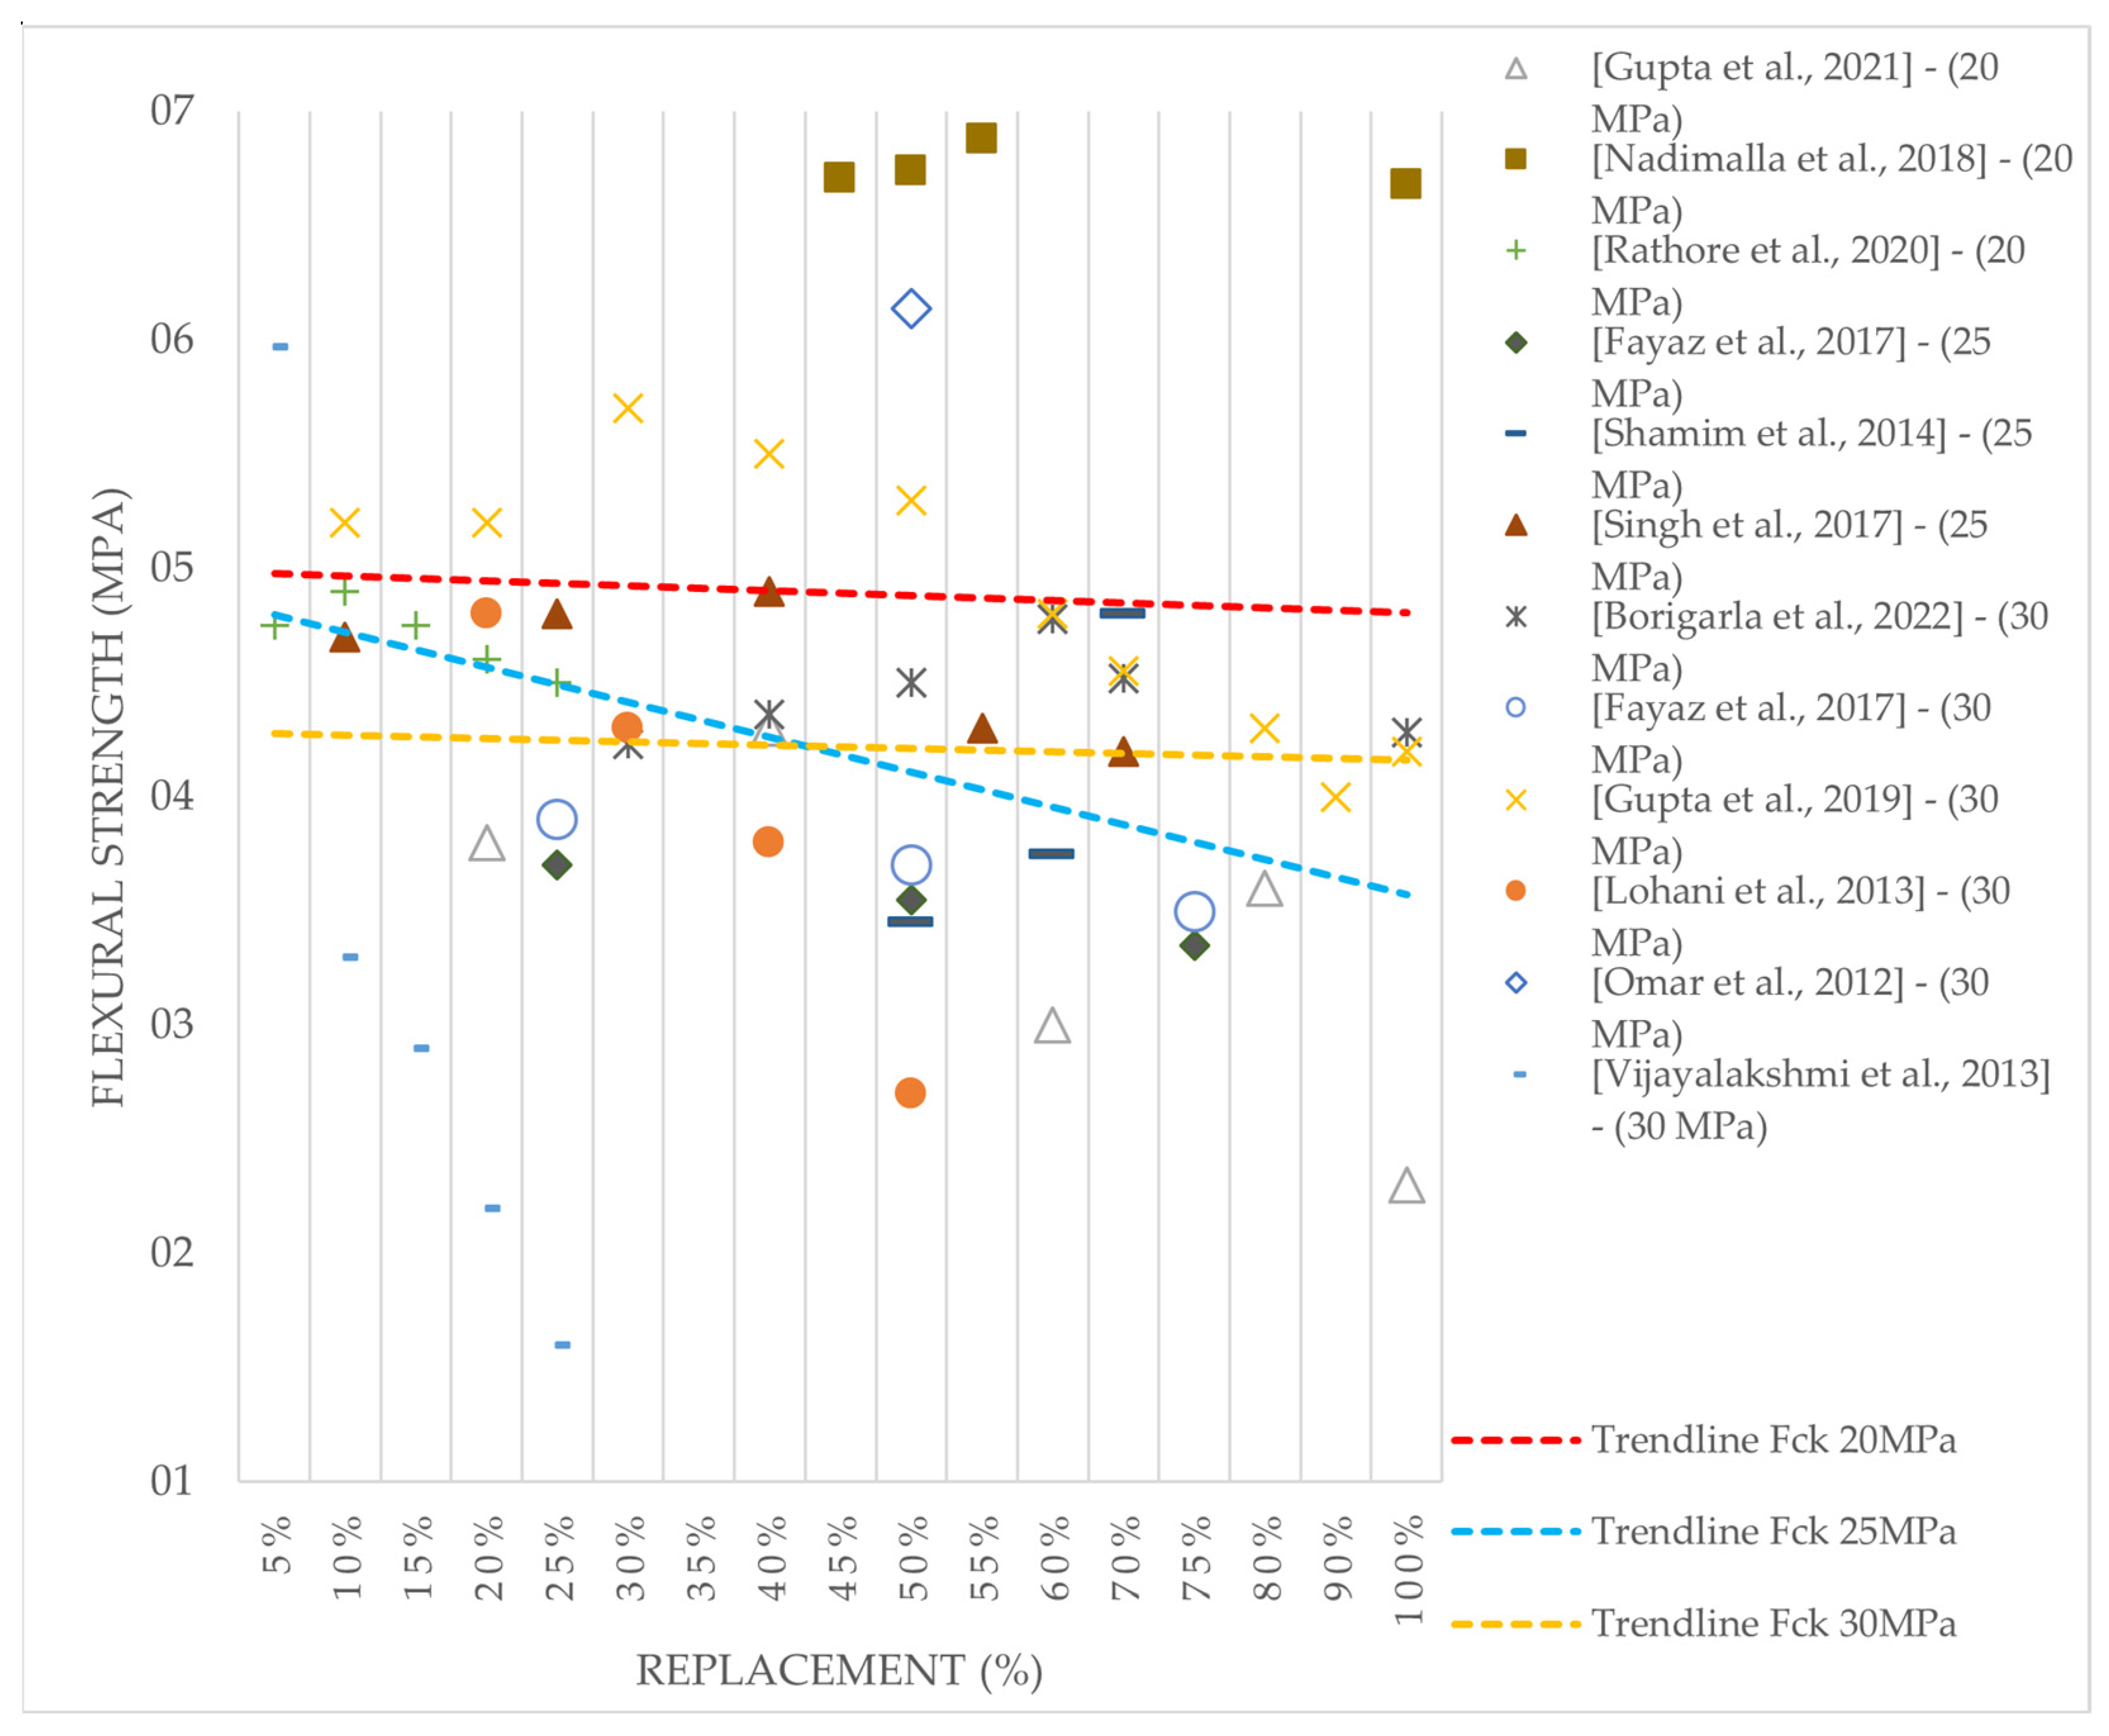
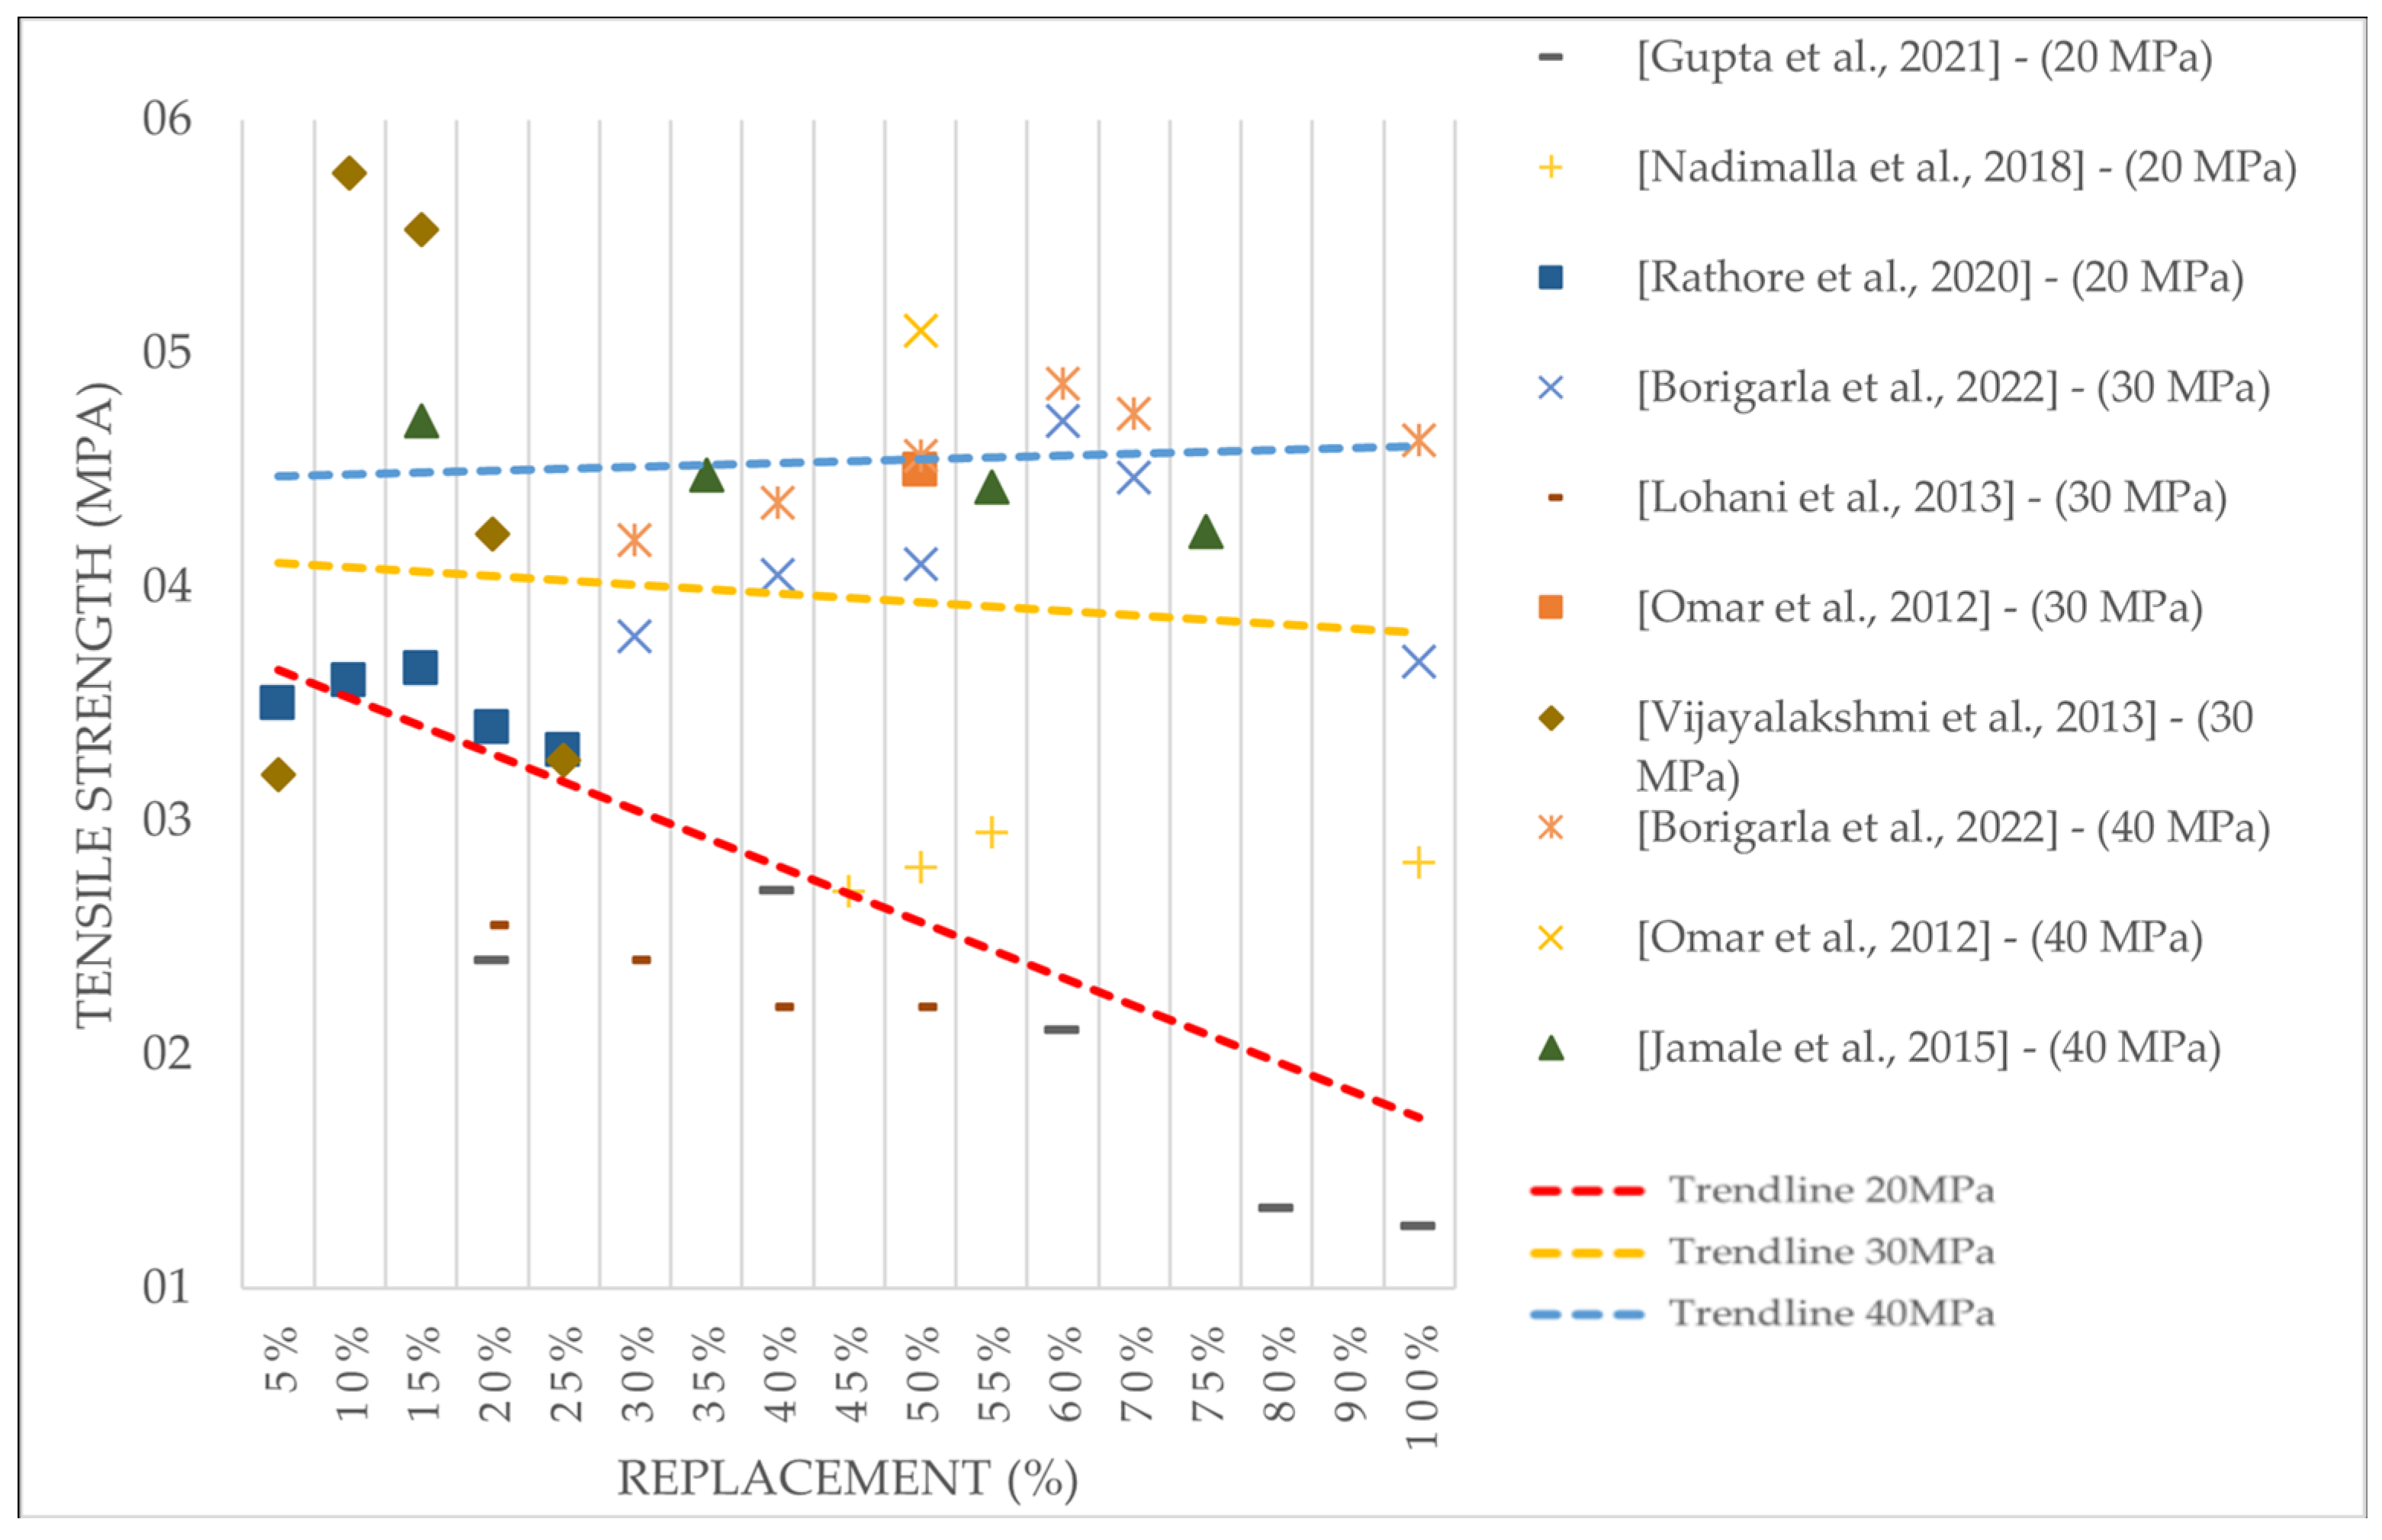
3.2.2. Mechanical Properties
3.2.3. Physical Properties
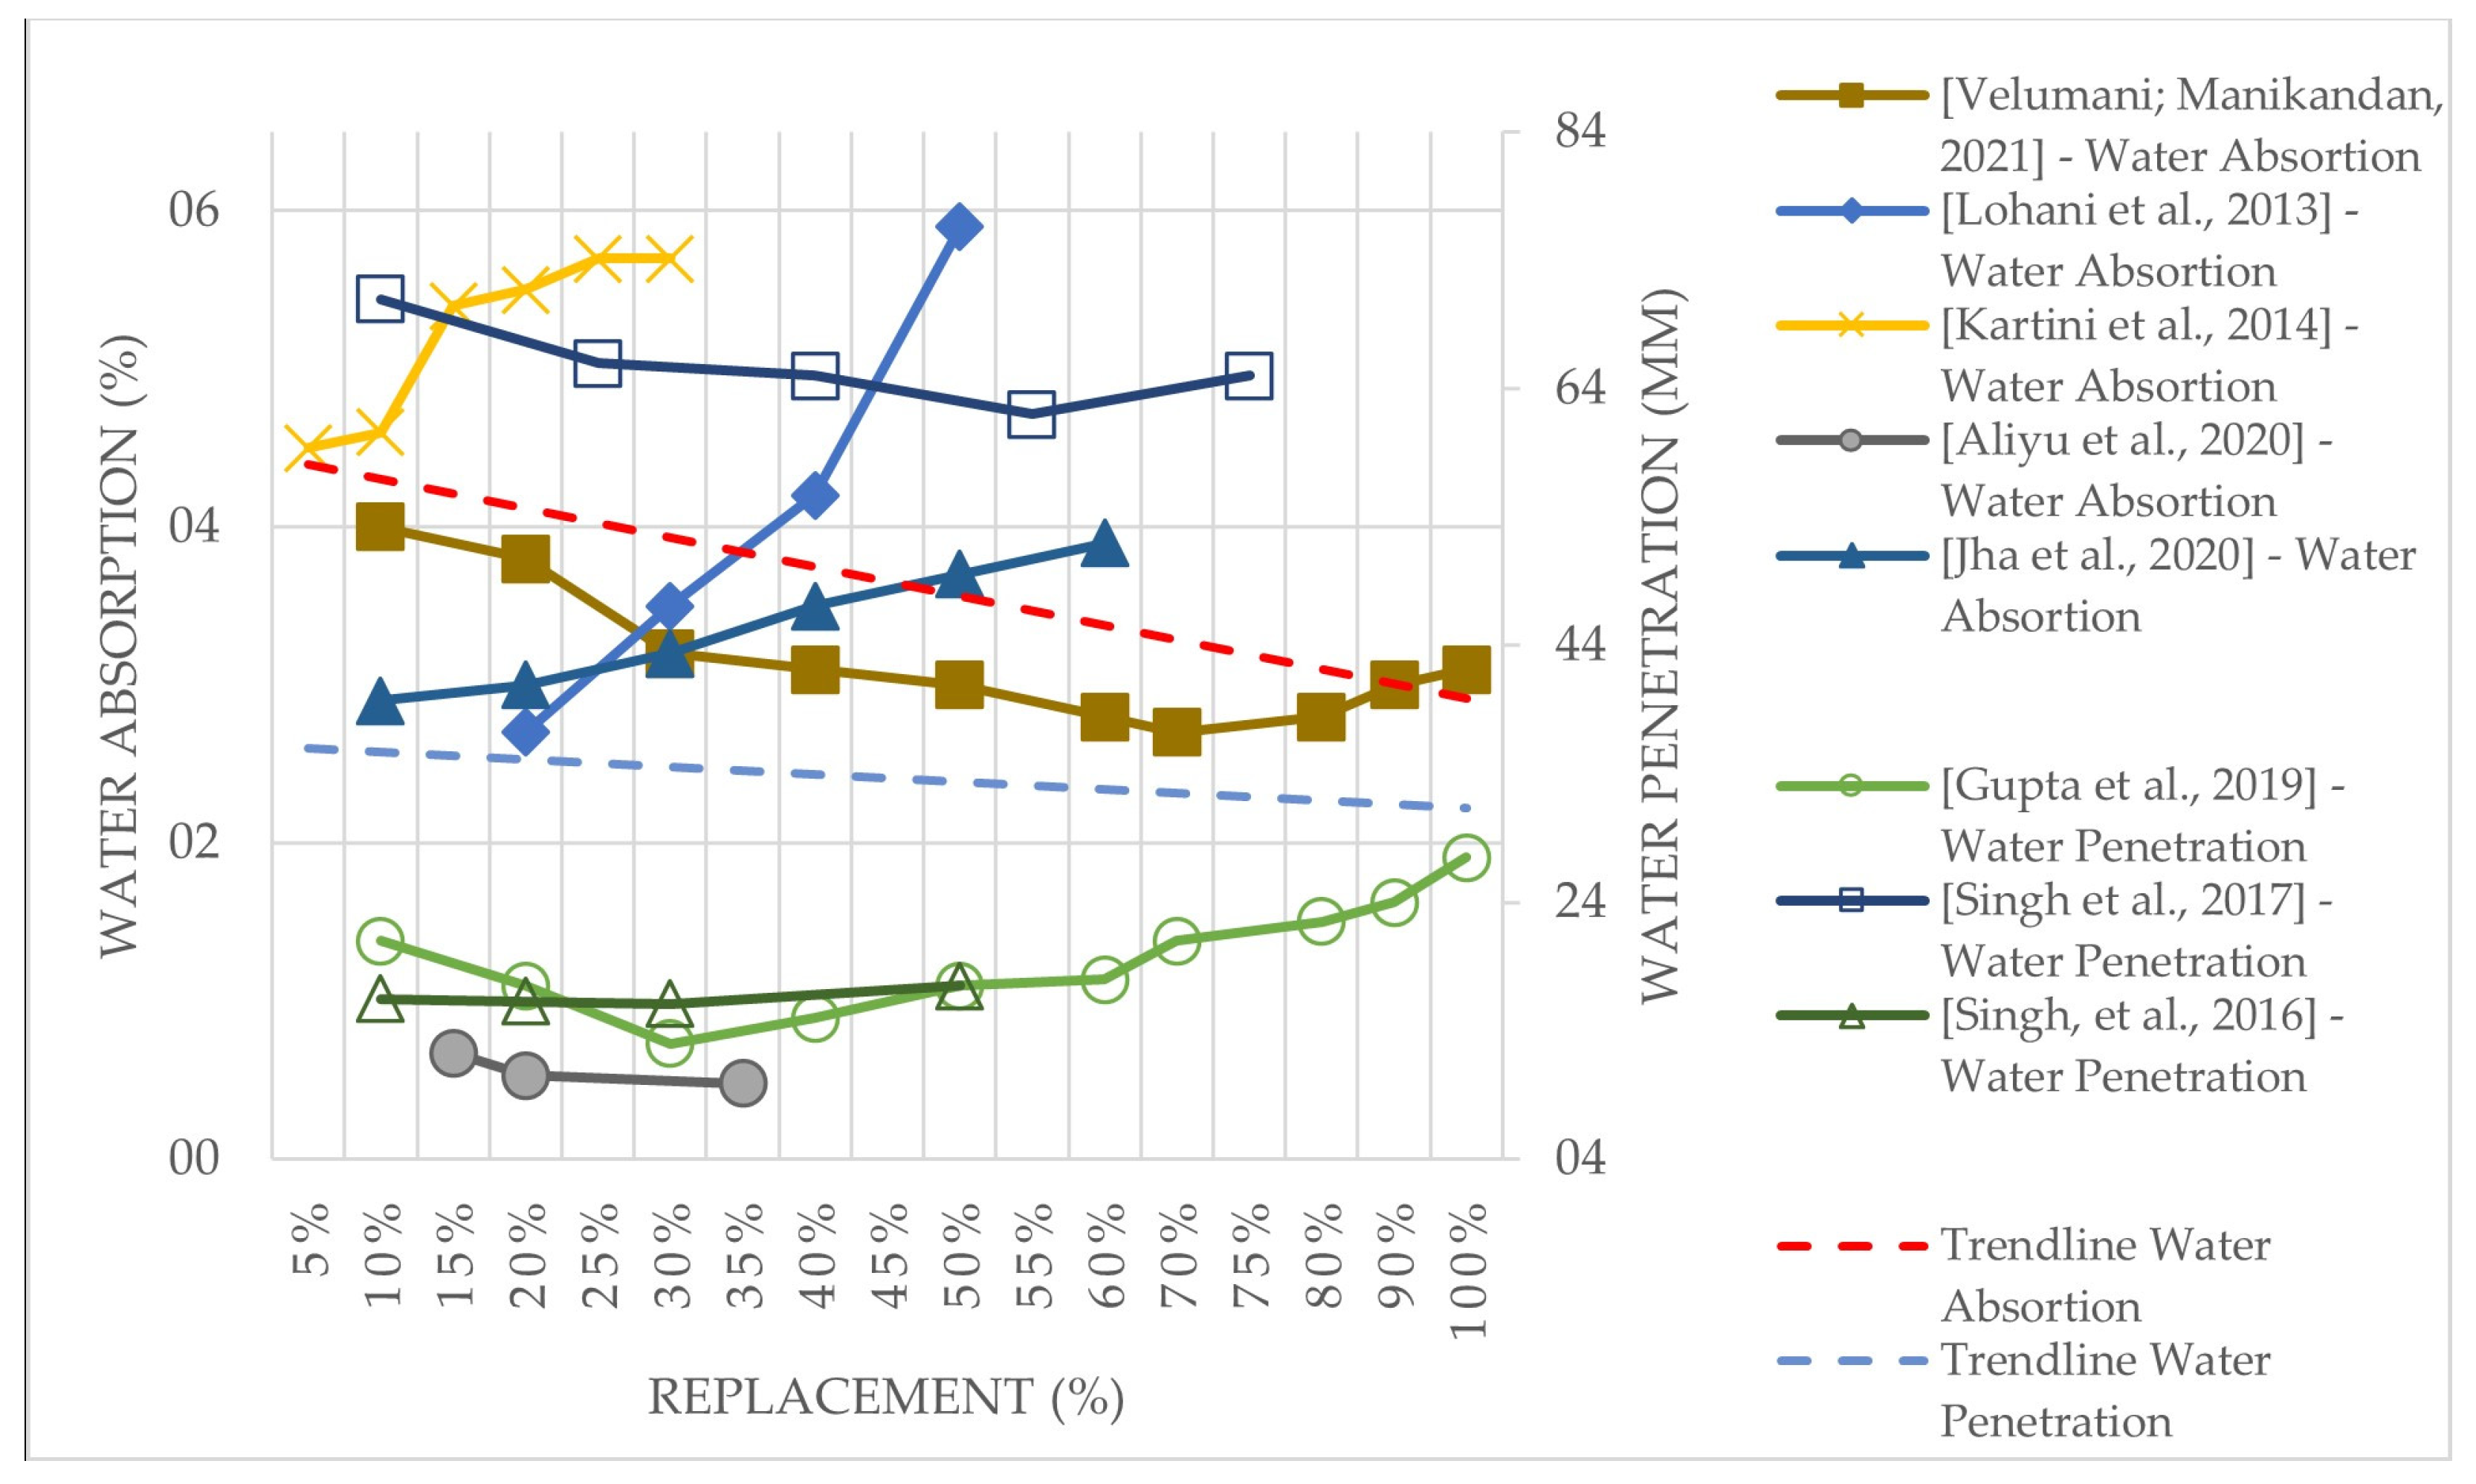
3.2.4. Durability
3.2.5. Ideal SD Content in Concrete Mixtures
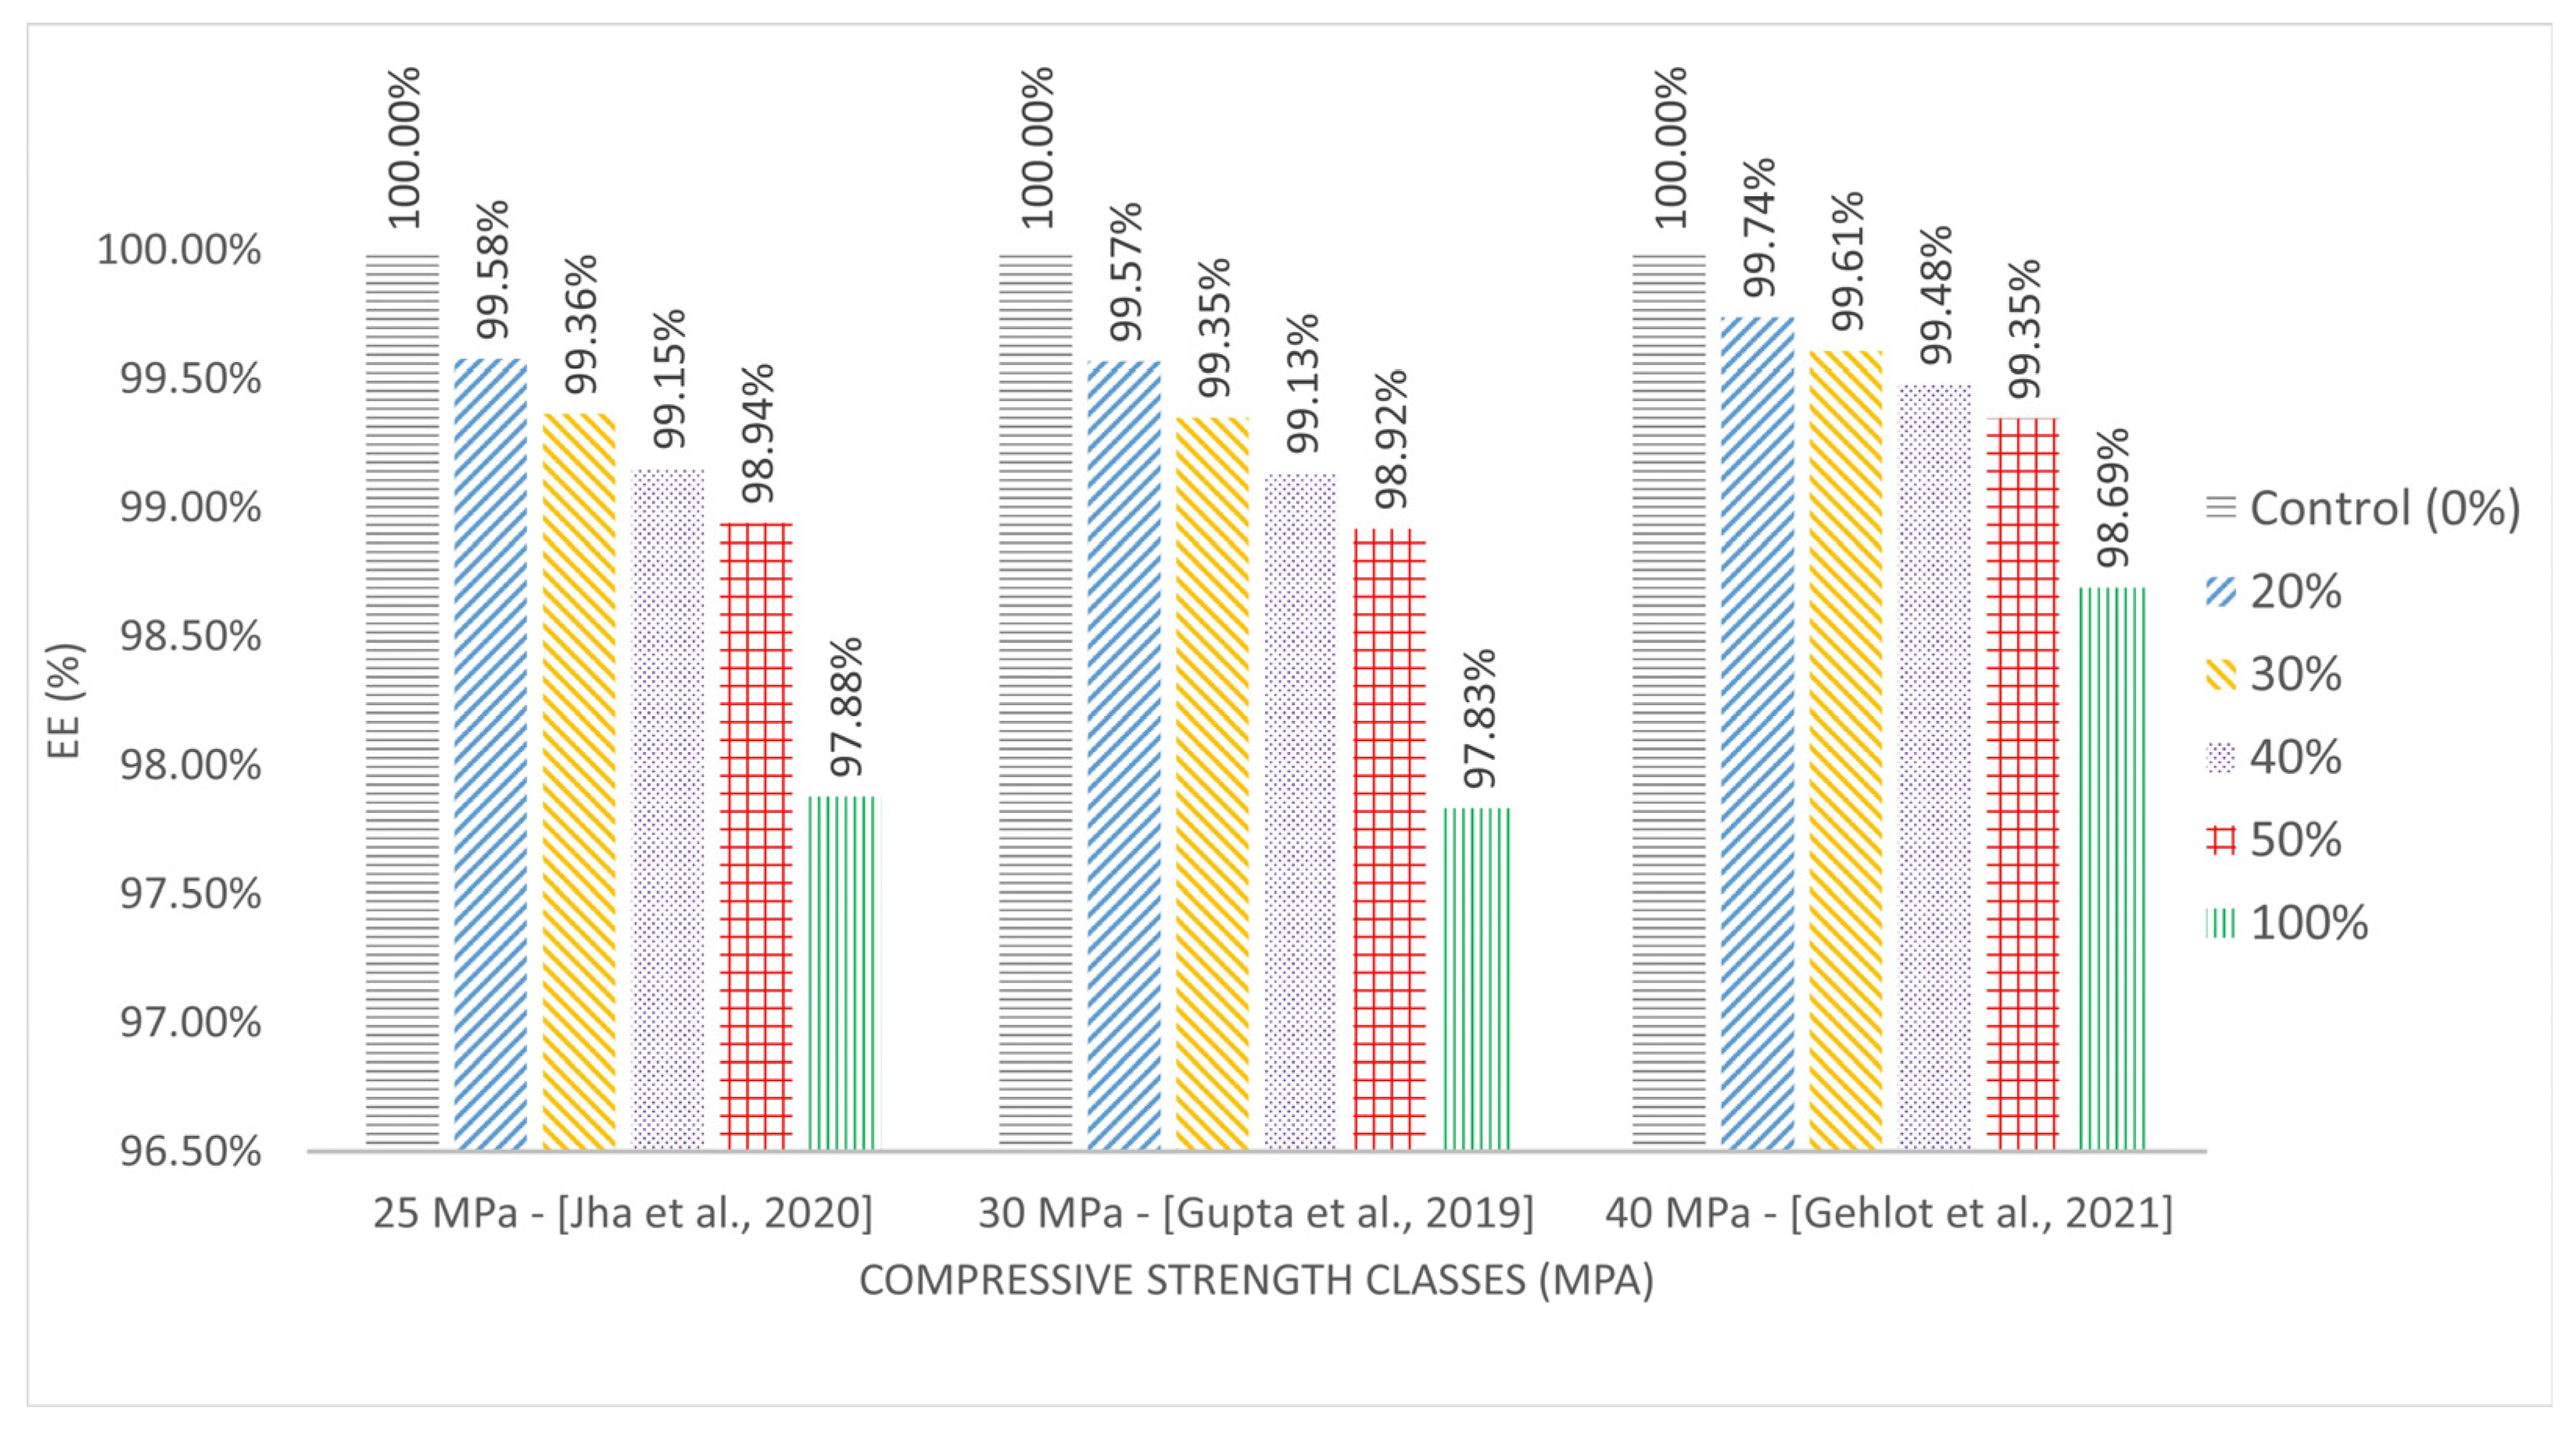
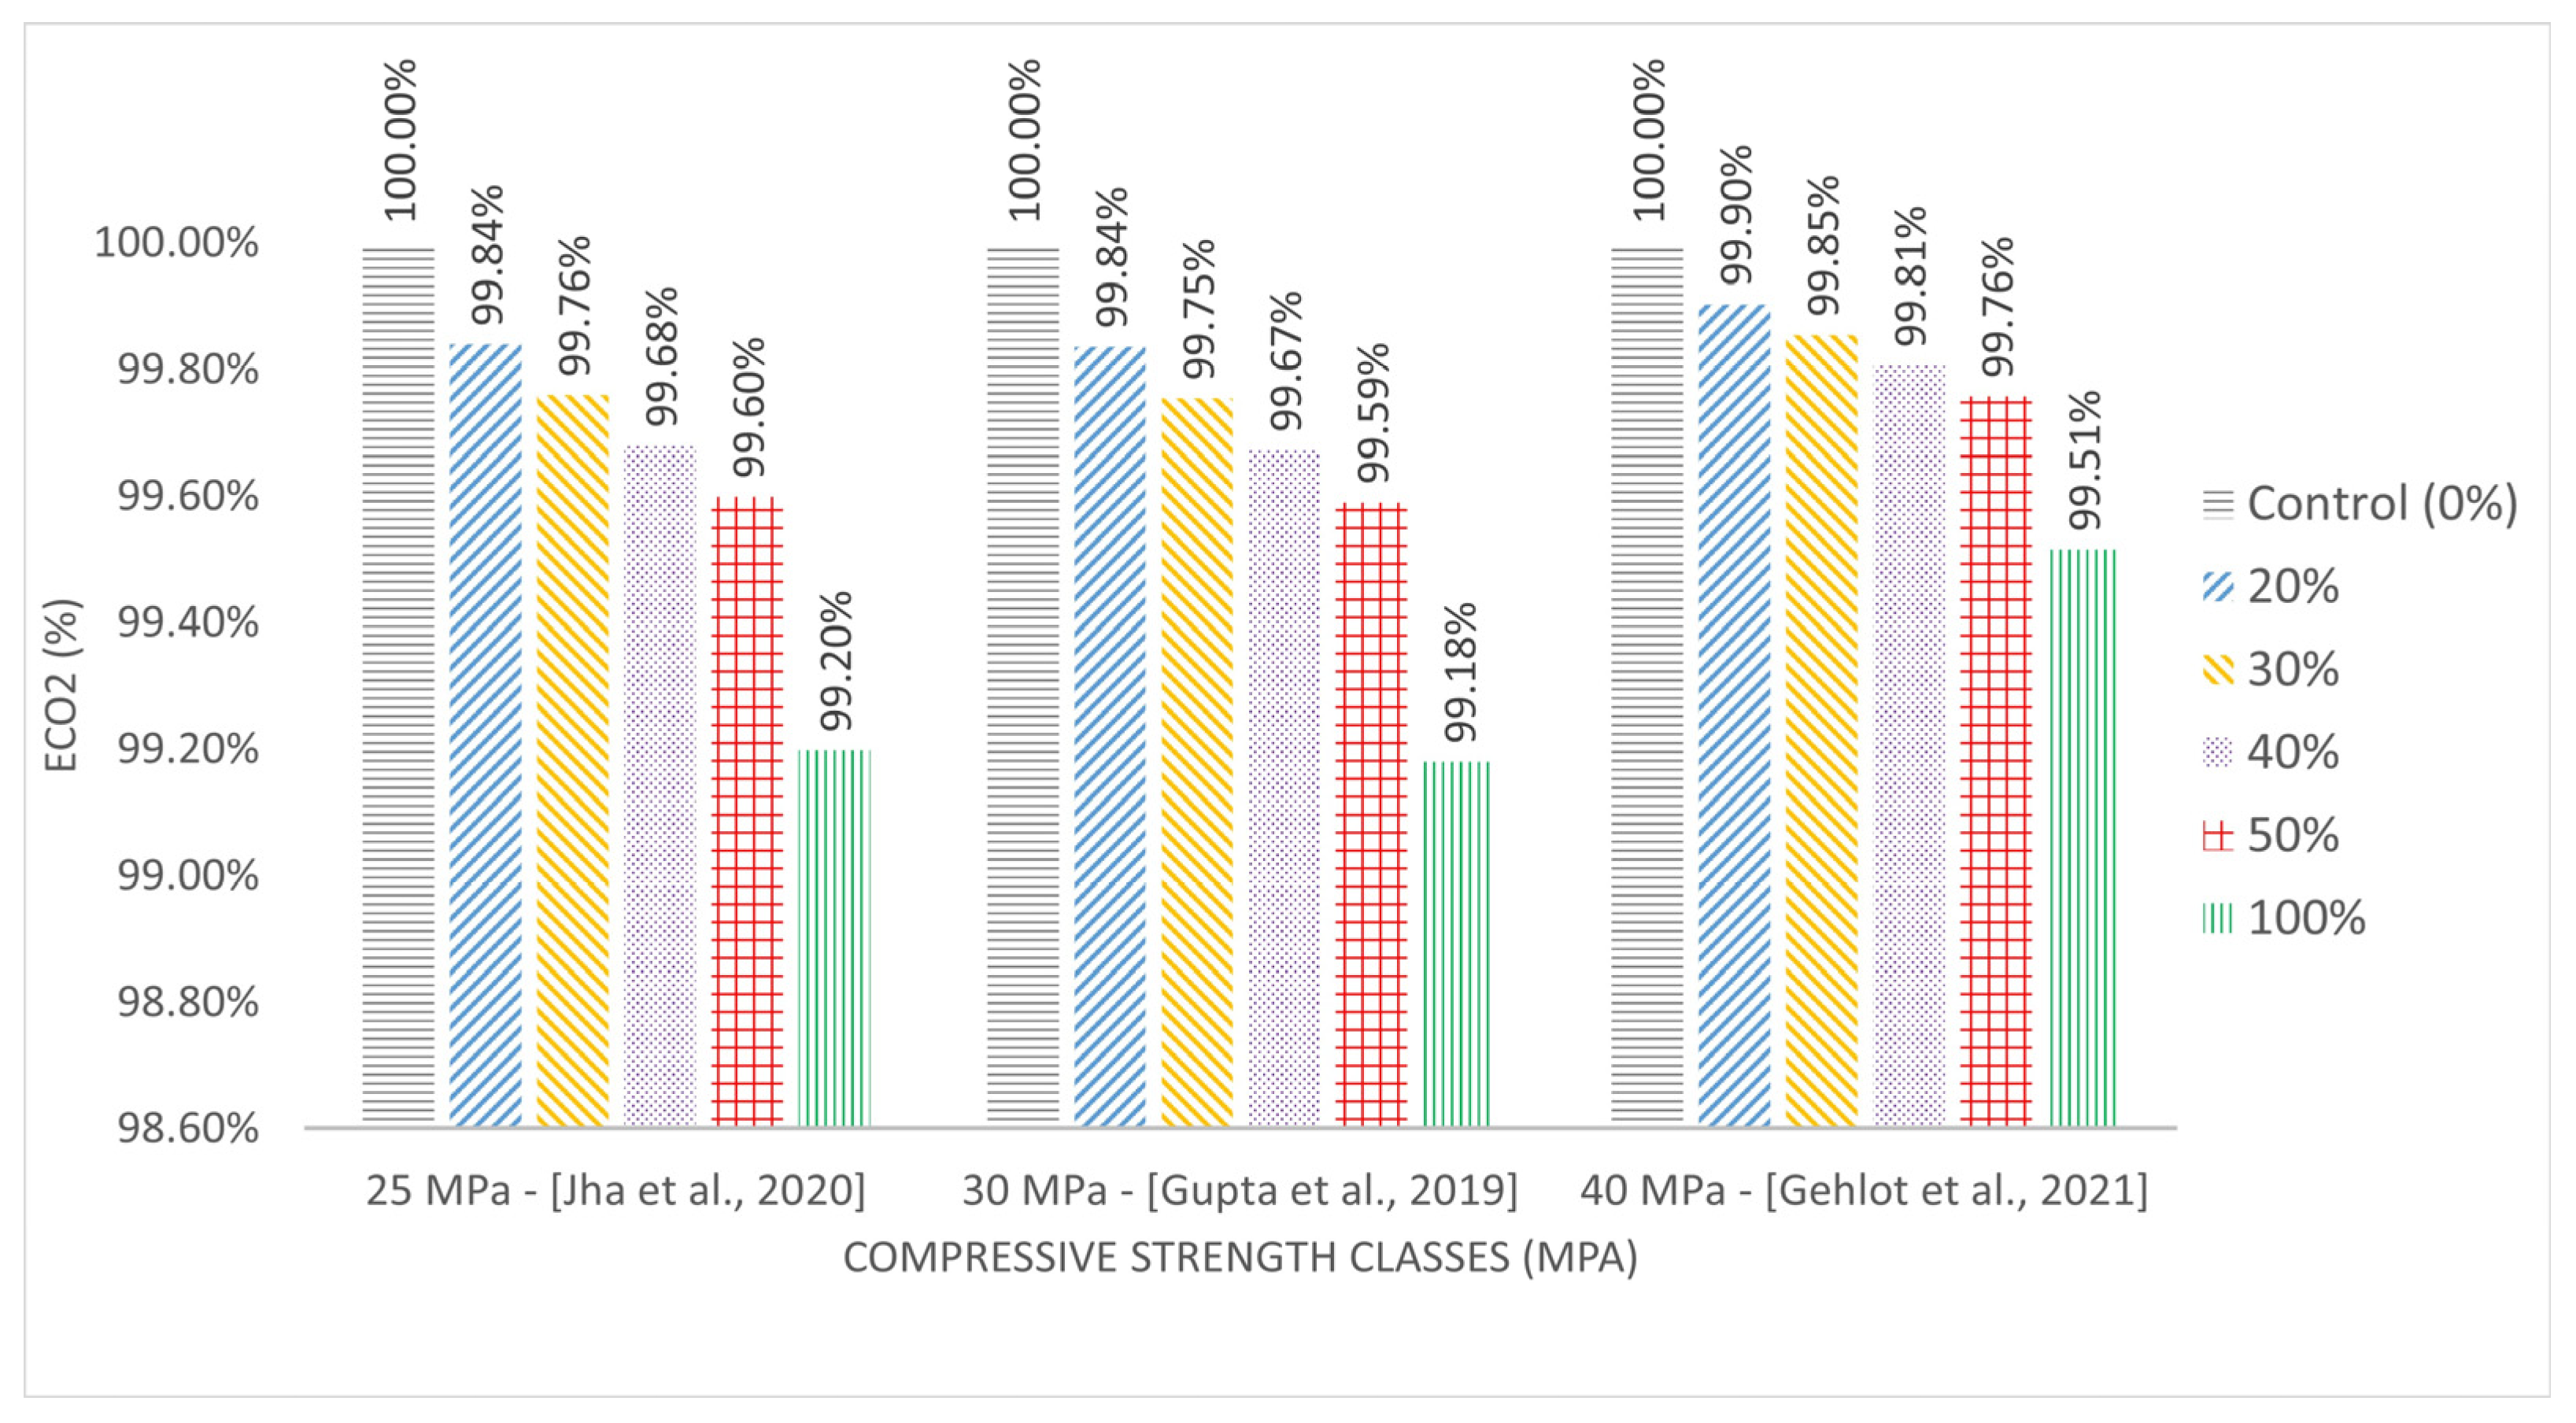
3.3. Can the Replacement of Natural Sand by Stone Dust Contribute to the Reduction of Environmental Impacts in Terms of Energy and Emissions?
4. Conclusions and Future Directions
Author Contributions
Funding
Data Availability Statement
Acknowledgments
Conflicts of Interest
References
- Darko, A.; Chan, A.P.; Owusu-Manu, D.-G.; Ameyaw, E.E. Drivers for implementing green building technologies: An international survey of experts. J. Clean. Prod. 2017, 145, 386–394. [Google Scholar] [CrossRef] [Green Version]
- Dimitriou, G.; Savva, P.; Petrou, M.F. Enhancing mechanical and durability properties of recycled aggregate concrete. Constr. Build. Mater. 2018, 158, 228–235. [Google Scholar] [CrossRef]
- Shen, W.; Wu, J.; Du, X.; Li, Z.; Wu, D.; Sun, J.; Wang, Z.; Huo, X.; Zhao, D. Cleaner production of high-quality manufactured sand and ecological utilization of recycled stone powder in concrete. J. Clean. Prod. 2022, 375, 134146. [Google Scholar] [CrossRef]
- Torres, A.; Brandt, J.; Lear, K.; Liu, J. A looming tragedy of the sand commons. Science 2017, 357, 970–971. [Google Scholar] [CrossRef]
- Bendixen, M.; Best, J.; Hackney, C.; Iversen, L.L. Time is running out for sand. Nature 2019, 571, 29–31. [Google Scholar] [CrossRef] [Green Version]
- Zhang, H.; Xiao, J.; Tang, Y.; Duan, Z.; Poon, C.-S. Long-term shrinkage and mechanical properties of fully recycled aggregate concrete: Testing and modelling. Cem. Concr. Compos. 2022, 130, 104527. [Google Scholar] [CrossRef]
- Jaeger, W.K. The hidden costs of relocating sand and gravel mines. Resour. Policy 2006, 31, 146–164. [Google Scholar] [CrossRef]
- Singh, O.; Kumar, A. Sand and gravel extraction from piedmont and floodplain zones of Yamunanagar district in Haryana, India: Environmental tragedy or economic gain? Int. J. Environ. Stud. 2018, 75, 267–283. [Google Scholar] [CrossRef]
- Rentier, E.S.; Cammeraat, L.H. The environmental impacts of river sand mining. Sci. Total Environ. 2022, 838, 155877. [Google Scholar] [CrossRef]
- Ludacer, R. The World Is Running out of Sand and There’s a Black Market for It Now; The Business Insider: New York, NY, USA, 2018. [Google Scholar]
- Luan, J.; Chen, X.; Ning, Y.; Shi, Z. Beneficial utilization of ultra-fine dredged sand from Yangtze River channel as a concrete material based on the minimum paste theory. Case Stud. Constr. Mater. 2022, 16, e01098. [Google Scholar] [CrossRef]
- Jaglan, M.; Chaudhary, B. Geo-Environmental Consequences of River Sand and Stone Mining: A Case Study of Narnaul Block, Haryana. Trans. Inst. Indian Geogr. 2014, 36, 219–240. [Google Scholar]
- Marschke, M.; Rousseau, J.-F. Sand ecologies, livelihoods and governance in Asia: A systematic scoping review. Resour. Policy 2022, 77, 102671. [Google Scholar] [CrossRef]
- Segura-Salazar, J.; Tavares, L.M. A life cycle-based, sustainability-driven innovation approach in the minerals industry: Application to a large-scale granitic quarry in Rio de Janeiro. Miner. Eng. 2021, 172, 107149. [Google Scholar] [CrossRef]
- European Commission. Communication from the Commission to the European Parliament, the Council, the European Economic and Social Committee and the Committee of the Regions: A New Circular Economy Action Plan For a Cleaner and More Competitive Europe; European Commission: Brussels, Belgium, 2020.
- Sinoh, S.S.; Othman, F.; Onn, C.C. Circular economy potential of sustainable aggregates for the Malaysian construction industry. Sustain. Cities Soc. 2023, 89, 104332. [Google Scholar] [CrossRef]
- Geisendorf, S.; Pietrulla, F. The circular economy and circular economic concepts—A literature analysis and redefinition. Thunderbird Int. Bus. Rev. 2018, 60, 771–782. [Google Scholar] [CrossRef]
- Research, E.M. Green Concrete Market Size, Share, Growth|Report, 2030. 2020. Available online: https://www.marketresearchfuture.com/reports/green-concrete-market-8699 (accessed on 18 March 2023).
- Luciano, A.; Reale, P.; Cutaia, L.; Carletti, R.; Pentassuglia, R.; Elmo, G.; Mancini, G. Resources Optimization and Sustainable Waste Management in Construction Chain in Italy: Toward a Resource Efficiency Plan. Waste Biomass Valorization 2020, 11, 5405–5417. [Google Scholar] [CrossRef]
- Cimen, O. Construction and built environment in circular economy: A comprehensive literature review. J. Clean. Prod. 2021, 305, 127180. [Google Scholar] [CrossRef]
- Luciano, A.; Cutaia, L.; Altamura, P.; Penalvo, E. Critical issues hindering a widespread construction and demolition waste (CDW) recycling practice in EU countries and actions to undertake: The stakeholder?s perspective. Sustain. Chem. Pharm. 2022, 29, 100745. [Google Scholar] [CrossRef]
- European Commission. EU Construction and Demolition Waste Protocol and Guidelines; European Commission: Brussels, Belgium, 2018.
- European Commission. Guidelines for the Waste Audits before Demolition and Renovation Works of Buildings; European Commission: Brussels, Belgium, 2018.
- European Commission. Circular Economy Principles for Buildings Design; European Commission: Brussels, Belgium, 2020.
- Honic, M.; Kovacic, I.; Rechberger, H. Improving the recycling potential of buildings through Material Passports (MP): An Austrian case study. J. Clean. Prod. 2019, 217, 787–797. [Google Scholar] [CrossRef]
- Kylili, A.; Fokaides, P.A. Policy trends for the sustainability assessment of construction materials: A review. Sustain. Cities Soc. 2017, 35, 280–288. [Google Scholar] [CrossRef]
- Zhang, H.; Hara, K.; Yabar, H.; Yamaguchi, Y.; Uwasu, M.; Morioka, T. Comparative analysis of socio-economic and environmental performances for Chinese EIPs: Case studies in Baotou, Suzhou, and Shanghai. Sustain. Sci. 2009, 4, 263–279. [Google Scholar] [CrossRef]
- Yu, C.; Davis, C.; Dijkema, G.P.J. Understanding the Evolution of Industrial Symbiosis Research A Bibliometric and Network Analysis (1997–2012). J. Ind. Ecol. 2014, 18, 280–293. [Google Scholar] [CrossRef]
- Turkeli, S.; Kemp, R.; Huang, B.; Bleischwitz, R.; McDowall, W. Circular economy scientific knowledge in the European Union and China: A bibliometric, network and survey analysis (2006–2016). J. Clean. Prod. 2018, 197, 1244–1261. [Google Scholar] [CrossRef]
- Brasil, C. Lei nº 12.305, de 2 de agosto de 2010. Institui a Política Nacional de Resíduos Sólidos; altera a Lei nº 9.605, de 12 de fevereiro de 1998; e dá outras providências. Off. Diary Union 2010, 3. Available online: https://www.planalto.gov.br/ccivil_03/_ato2007-2010/2010/lei/l12305.htm (accessed on 18 March 2023).
- Brasil, C. DECRETO Nº 11.413 DE 13 DE FEVEREIRO DE 2023 Institui o Certificado de Crédito de Reciclagem de Logística Reversa, o Certificado de Estruturação e Reciclagem de Embalagens em Geral e o Certificado de Crédito de Massa Futura, no âmbito dos sistemas de logística reversa de que trata o art. 33 da Lei nº 12.305, de 2 de agosto de 2010. Off. Diary Union 2023, 3. Available online: http://www.planalto.gov.br/ccivil_03/_ato2023-2026/2023/decreto/D11413.htm (accessed on 18 March 2023).
- Behera, M.; Bhattacharyya, S.K.; Minocha, A.K.; Deoliya, R.; Maiti, S. Recycled aggregate from C&D waste & its use in concrete—A breakthrough towards sustainability in construction sector: A review. Constr. Build. Mater. 2014, 68, 501–516. [Google Scholar] [CrossRef]
- Kirthika, S.K.; Singh, S.K.; Chourasia, A. Alternative fine aggregates in production of sustainable concrete—A review. J. Clean. Prod. 2020, 268, 122089. [Google Scholar] [CrossRef]
- Omar, O.M.; Abd Elhameed, G.D.; Sherif, M.A.; Mohamadien, H.A. Influence of limestone waste as partial replacement material for sand and marble powder in concrete properties. HBRC J. 2012, 8, 193–203. [Google Scholar] [CrossRef] [Green Version]
- Mundra, S.; Sindhi, P.; Chandwani, V.; Nagar, R.; Agrawal, V. Crushed rock sand–An economical and ecological alternative to natural sand to optimize concrete mix. Perspect. Sci. 2016, 8, 345–347. [Google Scholar] [CrossRef] [Green Version]
- Galetakis, M.; Soultana, A. A review on the utilisation of quarry and ornamental stone industry fine by-products in the construction sector. Constr. Build. Mater. 2016, 102, 769–781. [Google Scholar] [CrossRef]
- Abd Elmoaty, A.E.M. Mechanical properties and corrosion resistance of concrete modified with granite dust. Constr. Build. Mater. 2013, 47, 743–752. [Google Scholar] [CrossRef]
- Bacarji, E.; Toledo, R.D.; Koenders, E.A.B.; Figueiredo, E.P.; Lopes, J. Sustainability perspective of marble and granite residues as concrete fillers. Constr. Build. Mater. 2013, 45, 1–10. [Google Scholar] [CrossRef]
- Kartini, K.; Hamidah, M.; Norhana, A.; Nur Hanani, A. Quarry dust fine powder as substitute for ordinary Portland cement in concrete mix. J. Eng. Sci. Technol. 2014, 9, 191–205. [Google Scholar]
- Vijayalakshmi, M.; Sekar, A.S.S.; Prabhu, G.G. Strength and durability properties of concrete made with granite industry waste. Constr. Build. Mater. 2013, 46, 1–7. [Google Scholar] [CrossRef]
- Ali, A.; Hussain, Z.; Akbar, M.; Elahi, A.; Bhatti, S.; Imran, M.; Zhang, P.; Leslie Ndam, N. Influence of Marble Powder and Polypropylene Fibers on the Strength and Durability Properties of Self-Compacting Concrete (SCC). Adv. Mater. Sci. Eng. 2022, 2022, 9553382. [Google Scholar] [CrossRef]
- Krishnamoorthi, A.; Kumar, G.M. Properties of green concrete mix by concurrent use of fly ash and quarry dust. IOSR J. Eng. 2013, 3, 48–54. [Google Scholar] [CrossRef]
- Lohani, T.; Padhi, M.; Dash, K.; Jena, S. Optimum utilization of quarry dust as partial replacement of sand in concrete. Int. J. Appl. Sci. Eng. Res. 2012, 1, 391–404. [Google Scholar]
- Ukpata, J.O.; Ephraim, M.E.; Akeke, G.A. Compressive strength of concrete using lateritic sand and quarry dust as fine aggregate. ARPN J. Eng. Appl. Sci. 2012, 7, 81–92. [Google Scholar]
- Ray, S.; Haque, M.; Ahmed, T.; Mita, A.F.; Saikat, M.H.; Alom, M.M. Predicting the strength of concrete made with stone dust and nylon fiber using artificial neural network. Heliyon 2022, 8, e09129. [Google Scholar] [CrossRef]
- Kankam, C.K.; Meisuh, B.K.; Sossou, G.; Buabin, T.K. Stress-strain characteristics of concrete containing quarry rock dust as partial replacement of sand. Case Stud. Constr. Mater. 2017, 7, 66–72. [Google Scholar] [CrossRef]
- Gupta, T.; Kothari, S.; Siddique, S.; Sharma, R.K.; Chaudhary, S. Influence of stone processing dust on mechanical, durability and sustainability of concrete. Constr. Build. Mater. 2019, 223, 918–927. [Google Scholar] [CrossRef]
- Gupta, A.; Gupta, N.; Saxena, K.K.; Goyal, S.K. Investigation of the mechanical strength of stone dust and ceramic waste based composite. Mater. Today Proc. 2021, 44, 29–33. [Google Scholar] [CrossRef]
- Taiwo, L.A.; Obianyo, I.I.; Omoniyi, A.O.; Onwualu, A.P.; Soboyejo, A.B.O.; Amu, O.O. Mechanical behaviour of composite produced with quarry dust and rice husk ash for sustainable building applications. Case Stud. Constr. Mater. 2022, 17, e01157. [Google Scholar] [CrossRef]
- Temiz, H.; Kantarci, F. Investigation of durability of CEM II B-M mortars and concrete with limestone powder, calcite powder and fly ash. Constr. Build. Mater. 2014, 68, 517–524. [Google Scholar] [CrossRef]
- Kanellopoulos, A.; Nicolaides, D.; Petrou, M.F. Mechanical and durability properties of concretes containing recycled lime powder and recycled aggregates. Constr. Build. Mater. 2014, 53, 253–259. [Google Scholar] [CrossRef]
- Gehlot, T.; Sankhla, S.S.; Parihar, S. Compressive, flexural strength test and chloride ion permeability test of concrete incorporating quartzite rock dust. Mater. Today Proc. 2021, 45, 4724–4730. [Google Scholar] [CrossRef]
- Ray, S.; Haque, M.; Auni, M.M.; Islam, S. Analysing properties of concrete made with stone dust and jute fibre using response surface methodology. Int. J. Sustain. Mater. Struct. Syst. 2021, 5, 206–224. [Google Scholar] [CrossRef]
- Akbar, M.; Hussain, Z.; Pan, H.; Imran, M.; Thomas, B.S. Impact of waste crumb rubber on concrete performance incorporating silica fume and fly ash to make a sustainable low carbon concrete. Struct. Eng. Mech. 2023, 85, 275–287. [Google Scholar] [CrossRef]
- Ali, M.; Opulencia, M.J.C.; Chandra, T.; Chandra, S.; Muda, I.; Dias, R.; Chetthamrongchai, P.; Jalil, A.T. An Environmentally Friendly Solution for Waste Facial Masks Recycled in Construction Materials. Sustainability 2022, 14, 8739. [Google Scholar] [CrossRef]
- Idrees, M.; Akbar, A.; Mohamed, A.M.; Fathi, D.; Saeed, F. Recycling of Waste Facial Masks as a Construction Material, a Step towards Sustainability. Materials 2022, 15, 1810. [Google Scholar] [CrossRef]
- Jaesung, A.; Juhyuk, M.; Junil, P.; Hyeong-Ki, K. Microplastics as lightweight aggregates for ultra-high performance concrete: Mechanical properties and autoignition at elevated temperatures. Compos. Struct. 2023, 321, 117333. [Google Scholar]
- Prasittisopin, L.; Ferdous, W.; Kamchoom, V. Microplastics in construction and built environment. Dev. Built Environ. 2023, 15, 100188. [Google Scholar] [CrossRef]
- Kaya, A.; Kar, F. Properties of concrete containing waste expanded polystyrene and natural resin. Constr. Build. Mater. 2016, 105, 572–578. [Google Scholar] [CrossRef]
- Hilal, N.; Sor, N.H.; Faraj, R.H. Development of eco-efficient lightweight self-compacting concrete with high volume of recycled EPS waste materials. Environ. Sci. Pollut. Res. 2021, 28, 50028–50051. [Google Scholar] [CrossRef] [PubMed]
- Zhang, X.R.; Tang, Z.; Ke, G.J.; Li, W.G. Mechanical Properties and Durability of Sustainable Concrete Containing Various Industrial Solid Wastes. Transp. Res. Rec. 2021, 2675, 797–810. [Google Scholar] [CrossRef]
- Ahmad, J.; Aslam, F.; Martinez-Garcia, R.; de-Prado-Gil, J.; Qaidi, S.M.A.; Brahmia, A. Effects of waste glass and waste marble on mechanical and durability performance of concrete. Sci. Rep. 2021, 11, 21525. [Google Scholar] [CrossRef]
- Kaish, A.; Odimegwu, T.C.; Zakaria, I.; Abood, M.M. Effects of different industrial waste materials as partial replacement of fine aggregate on strength and microstructure properties of concrete. J. Build. Eng. 2021, 35, 102092. [Google Scholar] [CrossRef]
- Umar, T.; Yousaf, M.; Akbar, M.; Abbas, N.; Hussain, Z.; Ansari, W.S. An Experimental Study on Non-Destructive Evaluation of the Mechanical Characteristics of a Sustainable Concrete Incorporating Industrial Waste. Materials 2022, 15, 7346. [Google Scholar] [CrossRef] [PubMed]
- Prakash, K.S.; Rao, C.H. Study on Compressive Strength of Quarry Dust as Fine Aggregate in Concrete. Adv. Civ. Eng. 2016, 2016, 1742769. [Google Scholar] [CrossRef] [Green Version]
- Kumar, N.V.S. Crushed rock dust as filler material in concrete. Mater. Today Proc. 2021, 43, 1714–1719. [Google Scholar] [CrossRef]
- Patel, A.N.; Pitroda, J. Stone waste in India for concrete with value creation opportunities. Int. J. Latest Trends Eng. Technol. 2013, 2, 113–120. [Google Scholar]
- Palanisamy, C.; Velusamy, S.; Krishnaswami, N.; Manickam, K.; Rathinasamy, L.; Annamalai, I. Experimental investigation on self-compacting concrete with waste marble and granite as fine aggregate. Mater. Today Proc. 2022, 65, 1900–1907. [Google Scholar] [CrossRef]
- Anya, C.; Osadebe, N. Effect of partial replacement of sand with quarry dust on the structural characteristics of sandcrete blocks. Niger. J. Technol. 2015, 34, 679–684. [Google Scholar] [CrossRef]
- Ingalkar, R.S.; Harle, S.M. Replacement of natural sand by crushed sand in the concrete. Landsc. Archit. Reg. Plan. 2017, 2, 13–22. [Google Scholar]
- Koehnken, L.; Rintoul, M. Impacts of sand mining on ecosystem structure, process and biodiversity in rivers. World Wildl. Fund Int. 2018. Available online: https://wwfint.awsassets.panda.org/downloads/sandmining_execsum__final_.pdf (accessed on 20 December 2022).
- Danish, A.; Mosaberpanah, M.A.; Salim, M.U.; Fediuk, R.; Rashid, M.F.; Waqas, R.M. Reusing marble and granite dust as cement replacement in cementitious composites: A review on sustainability benefits and critical challenges. J. Build. Eng. 2021, 44, 102600. [Google Scholar] [CrossRef]
- Celik, T.; Marar, K. Effects of crushed stone dust on some properties of concrete. Cem. Concr. Res. 1996, 26, 1121–1130. [Google Scholar] [CrossRef]
- Singh, S.; Nagar, R.; Agrawal, V.; Rana, A.; Tiwari, A. Sustainable utilization of granite cutting waste in high strength concrete. J. Clean. Prod. 2016, 116, 223–235. [Google Scholar] [CrossRef]
- Sahu, A.K.; Kumar, S.; Sachan, A.K. Crushed stone waste as fine aggregate for concrete. Indian Concr. J. 2003, 77, 845–848. [Google Scholar]
- Hameed, M.S.; Sekar, A. Properties of green concrete containing quarry rock dust and marble sludge powder as fine aggregate. ARPN J. Eng. Appl. Sci 2009, 4, 83–89. [Google Scholar]
- Qu, F.; Li, W.; Dong, W.; Tam, V.W.Y.; Yu, T. Durability deterioration of concrete under marine environment from material to structure: A critical review. J. Build. Eng. 2021, 35, 102074. [Google Scholar] [CrossRef]
- Binici, H.; Aksogan, O. Durability of concrete made with natural granular granite, silica sand and powders of waste marble and basalt as fine aggregate. J. Build. Eng. 2018, 19, 109–121. [Google Scholar] [CrossRef]
- Bachinilla, B.; Evangelista, A.; Siddhpura, M.; Haddad, A.N.; da Costa, B.B.F. High-Speed Railway Bridge and Pile Foundation: A Review. Infrastructures 2022, 7, 154. [Google Scholar] [CrossRef]
- Snyder, H. Literature review as a research methodology: An overview and guidelines. J. Bus. Res. 2019, 104, 333–339. [Google Scholar] [CrossRef]
- Morrisey, L.J. Bibliometric and bibliographic analysis in an era of electronic scholarly communication. Sci. Technol. Libr. 2002, 22, 149–160. [Google Scholar] [CrossRef]
- Bizagi Modeler. Available online: https://www.bizagi.com/pt/plataforma/modeler (accessed on 6 July 2023).
- Mendeley Reference Manager. Available online: https://www.mendeley.com/reference-management/reference-manager (accessed on 26 December 2022).
- Montgomery, D.C. Design and Analysis of Experiments; John Wiley & Sons: Hoboken, NJ, USA, 2017. [Google Scholar]
- Rathore, K.; Agrwal, V.; Nagar, R. Green concrete: Using quarry waste of sandstone as fine aggregate with high levels of microfines. Mater. Today Proc. 2020, 32, 728–733. [Google Scholar] [CrossRef]
- Singh, S.; Nande, N.; Bansal, P.; Nagar, R. Experimental Investigation of Sustainable Concrete Made with Granite Industry By-Product. J. Mater. Civ. Eng. 2017, 29, 04017017. [Google Scholar] [CrossRef]
- Balamurugan, G.; Perumal, P. Behaviour of concrete on the use of quarry dust to replace sand–an experimental study. IRACST Eng. Sci. Technol. Int. J. ESTIJ 2013, 3, 776–781. [Google Scholar]
- Khan, N.; Chandrakar, R. An Experimental study on uses of Quarry Dust to replace sand in concrete. Int. Res. J. Eng. Technol. IRJET 2017, 4, 1215–1217. [Google Scholar]
- Akhtar, M.N.; Ibrahim, Z.; Bunnori, N.M.; Jameel, M.; Tarannum, N.; Akhtar, J.N. Performance of sustainable sand concrete at ambient and elevated temperature. Constr. Build. Mater. 2021, 280, 122404. [Google Scholar] [CrossRef]
- Jagadeesh, P.; Kumar, P.S.; Prakash, S. Influence of quarry dust on compressive strength of concrete. Indian J. Sci. Technol. 2016, 9. [Google Scholar] [CrossRef]
- Mogre, R.P.; Parbat, D.D.K.; Bajad, D.S.P. feasibility of artificial Sand in concrete. Int. J. Eng. Res. Technol. IJERT 2013, 2, 1606–1610. [Google Scholar]
- Kumar, A.; Pratheba, S.; Rajendran, R.; Perumal, K.; Lingeshwaran, N.; Sambaraju, S. An experimental study on the mechanical properties of concrete replacing sand with quarry dust and waste foundry sand. Mater. Today Proc. 2020, 33, 828–832. [Google Scholar] [CrossRef]
- Devadass, T. Experimental study on replacement of fine aggregate in concrete with dissimilar curing conditions. Case Stud. Constr. Mater. 2019, 11, e00245. [Google Scholar] [CrossRef]
- Aliyu, I.; Sulaiman, T.A.; Mohammed, A.; Kaura, J. Effect of Sulphuric Acid on the Compressive Strength of Concrete with Quarry Dust as Partial Replacement of Fine Aggregate. FUDMA J. Sci. 2020, 4, 553–559. [Google Scholar]
- Opara, H.E.; Eziefula, U.G.; Eziefula, B.I. Comparison of physical and mechanical properties of river sand concrete with quarry dust concrete. Sel. Sci. Pap. J. Civ. Eng. 2018, 13, 127–134. [Google Scholar] [CrossRef]
- Jamale, A.H.; Kawade, U.R. Effect of Quarry Dust and Fly Ash Mix on strength properties of M40 grade Concrete. Int. J. Eng. Res. Gen. Sci. 2015, 3, 391–397. [Google Scholar]
- Vijaya, B.; Selvan, S.S.; Kala, F.; Annadurai, R. Comparative study on the strength and durability properties of concrete with manufactured sand. Indian J. Sci. Technol. 2015, 8, 174–178. [Google Scholar] [CrossRef]
- Borigarla, B.; Buddaha, T.; Kiran, S.; Hait, P. Experimental study on replacing sand by M-Sand and quarry dust in rigid pavements. Mater. Today Proc. 2022, 60, 658–667. [Google Scholar] [CrossRef]
- Molay, T.G.G.; Leroy, M.N.L.; Fidele, T.; Franck, H.G.; Bienvenu, N.J.-M. Mechanical and physical performances of concretes made from crushed sands of different geological nature subjected to high temperatures. Eng. Sci. Technol. Int. J. JESTECH 2019, 22, 1116–1124. [Google Scholar] [CrossRef]
- Nadimalla, A.; Masjuki, S.A.B.; Khan, S.A.; Akshatha, B.A. The Effect of Replacement of Natural Sand by Manufactured Sand on the Properties of the Concrete. In Proceedings of the 2018 IEEE 5th International Conference on Engineering Technologies and Applied Sciences (ICETAS), Bangkok, Thailand, 22–23 November 2018; pp. 1–7. [Google Scholar]
- Velumani, P.; Manikandan, P. Steel mill scale waste and granite powder waste in concrete production—An experimental study. Mater. Today Proc. 2021, 37, 1748–1752. [Google Scholar] [CrossRef]
- Vardhan, K.; Siddique, R.; Goyal, S. Influence of marble waste as partial replacement of fine aggregates on strength and drying shrinkage of concrete. Constr. Build. Mater. 2019, 228, 116730. [Google Scholar] [CrossRef]
- Jha, P.; Sachan, A.; Singh, R. Utilization of stone dust as an effective alternative for sand replacement in concrete. In Proceedings of the 3rd International Conference on Innovative Technologies for Clean and Sustainable Development: ITCSD 2020, Chandigarh, India, 19–21 February 2020; pp. 513–526. [Google Scholar]
- Upadhyaya, S.; Nanda, B.; Panigrahi, R. Experimental analysis on partial replacement of fine aggregate by granite dust in concrete. In Sustainable Construction and Building Materials: Select Proceedings of ICSCBM 2018; Springer: Berlin/Heidelberg, Germany, 2018; pp. 335–344. [Google Scholar]
- Shamim, S.; Srivastava, V.; Agarwal, V. Compressive and flexural strengths of concrete using stone dust and recycled aggregate as partial replacement of natural aggregate. J. Acad. Ind. Res. JAIR 2014, 3, 322. [Google Scholar]
- Upadhyaya, S.; Nanda, B.; Panigrahi, R. Effect of granite dust as partial replacement to natural sand on strength and ductility of reinforced concrete beams. J. Inst. Eng. India Ser. A 2020, 101, 669–677. [Google Scholar] [CrossRef]
- Fayaz, S.; Rashid, S.; Reddy, K.Y. Behavior of Concrete with Quarry Dust as Partial Replacement of Fine Aggregate. Int. J. Mod. Trends Sci. Technol. 2017, 3, 105–112. [Google Scholar]
- Singh, S.; Khan, S.; Khandelwal, R.; Chugh, A.; Nagar, R. Performance of sustainable concrete containing granite cutting waste. J. Clean. Prod. 2016, 119, 86–98. [Google Scholar] [CrossRef]
- Prokopski, G.; Marchuk, V.; Huts, A. The effect of using granite dust as a component of concrete mixture. Case Stud. Constr. Mater. 2020, 13, e00349. [Google Scholar] [CrossRef]
- Oorkalan, A.; Chithra, S.; Balaji, R.; Kumar, S.G.; Kumar, J.K.; Kumar, T.K. Experimental study on high volume fly ash concrete made with coir pith and quarry dust. Mater. Today Proc. 2020, 21, 833–836. [Google Scholar] [CrossRef]
- Simao, L.; Souza, M.T.; Ribeiro, M.J.; Montedo, O.R.K.; Hotza, D.; Novais, R.M.; Raupp-Pereira, F. Assessment of the recycling potential of stone processing plant wastes based on physicochemical features and market opportunities. J. Clean. Prod. 2021, 319, 128678. [Google Scholar] [CrossRef]
- Lim, S.K.; Tan, C.S.; Li, B.; Ling, T.-C.; Hossain, M.U.; Poon, C.S. Utilizing high volumes quarry wastes in the production of lightweight foamed concrete. Constr. Build. Mater. 2017, 151, 441–448. [Google Scholar] [CrossRef]
- ASTM C618; Standard Specification for Coal Fly Ash and Raw or Calcined Natural Pozzolan for Use in Concrete. ASTM International: West Conshohocken, PA, USA, 2019.
- Obianyo, I.I.; Mahamat, A.A.; Anosike-Francis, E.N.; Stanislas, T.T.; Geng, Y.; Onyelowe, K.C.; Odusanya, S.; Onwualu, A.P.; Soboyejo, A.B.O. Performance of lateritic soil stabilized with combination of bone and palm bunch ash for sustainable building applications. Cogent Eng. 2021, 8, 1921673. [Google Scholar] [CrossRef]
- Bureau of Indian Standard. Coarse and Fine Aggregate for Concrete Specification; BIS: Delhi, India, 2016.
- ASTM. Standard Specification for Concrete Aggregates; American Society for Testing and Materials: Philadelphia, PA, USA, 2003. [Google Scholar]
- ABNT NBR 7211; Agregados Para Concreto-Especificação. ABNT: Rio de Janeiro, Brazil, 2021.
- Li, Z.; Lao, J.; Wang, L.; Lim, N.S.; Tan, K.H.; Qian, S. A review on substitution of natural sand with granite fines in sustainable concrete. Constr. Build. Mater. 2022, 346, 128417. [Google Scholar] [CrossRef]
- Dixon, D.E.; Prestrera, J.R.; Burg, G.R.; Chairman, S.A.; Abdun-Nur, E.A.; Barton, S.G.; Bell, L.W.; Blas, S.J., Jr.; Carrasquillo, R.L.; Carrasquillo, P.M.; et al. Standard Practice for Selecting Proportions for Normal, Heavyweight and Mass Concrete; American Concrete Institute: Singapore, 1991. [Google Scholar]
- Hashmi, S.R.Z.; Khan, M.I.; Khahro, S.H.; Zaid, O.; Siddique, M.S.; Yusoff, N.I.M. Prediction of Strength Properties of Concrete Containing Waste Marble Aggregate and Stone Dust-Modeling and Optimization Using RSM. Materials 2022, 15, 8024. [Google Scholar] [CrossRef]
- Singh, S.; Nagar, R.; Agrawal, V. A review on Properties of Sustainable Concrete using granite dust as replacement for river sand. J. Clean. Prod. 2016, 126, 74–87. [Google Scholar] [CrossRef]
- Kumar, N.V.S.; Ram, K.S.S. Experimental study on properties of concrete containing crushed rock dust as a partial replacement of cement. Mater. Today Proc. 2018, 5, 7240–7246. [Google Scholar] [CrossRef]
- Neville, A. Properties of Concrete, 5th ed.; Prentice Hall: Hoboken, NJ, USA, 2011. [Google Scholar]
- Ganjian, E.; Khorami, M.; Maghsoudi, A.A. Scrap-tyre-rubber replacement for aggregate and filler in concrete. Constr. Build. Mater. 2009, 23, 1828–1836. [Google Scholar] [CrossRef]
- Lee, M.K.; Jung, S.H.; Oh, B.H. Effects of Carbonation on Chloride Penetration in Concrete. ACI Mater. J. 2014, 111, 458–459. [Google Scholar]
- Carneiro, A.; Daschevi, P.; Langaro, E.; Pieralisi, R.; Medeiros, M. Effectiveness of surface coatings in concrete: Chloride penetration and carbonation. J. Build. Pathol. Rehabil. 2021, 6, 3. [Google Scholar] [CrossRef]
- Bu, C.; Liu, L.; Lu, X.; Zhu, D.; Sun, Y.; Yu, L.; OuYang, Y.; Cao, X.; Wei, Q. The Durability of Recycled Fine Aggregate Concrete: A Review. Materials 2022, 15, 1110. [Google Scholar] [CrossRef] [PubMed]
- ACI 201.2R-01. Guide to Durable Concrete. J. Am. Concr. Inst. 2001, 74, 573–609. Available online: https://0901.nccdn.net/4_2/000/000/050/773/ACI_201.2R01_Guide_to_Durable_Concrete.pdf (accessed on 6 July 2023).
- American Society for Testing and Materials. Standard Test Method for Electrical Indication of Concrete’s Ability to Resist Chloride Ion Penetration; American Society for Testing and Materials: West Conshohocken, PA, USA, 2012. [Google Scholar]
- Sivamani, J.; Renganathan, N.T. Effect of fine recycled aggregate on the strength and durability properties of concrete modified through two-stage mixing approach. Environ. Sci. Pollut. Res. 2022, 29, 85869–85882. [Google Scholar] [CrossRef]
- Cartuxo, F.; de Brito, J.; Evangelista, L.; Ramon Jimenez, J.; Ledesma, E.F. Increased Durability of Concrete Made with Fine Recycled Concrete Aggregates Using Superplasticizers. Materials 2016, 9, 98. [Google Scholar] [CrossRef] [Green Version]
- Udawattha, C.; Halwatura, R. Embodied energy of mud concrete block (MCB) versus brick and cement blocks. Energy Build. 2016, 126, 28–35. [Google Scholar] [CrossRef]
- Saghafi, M.D.; Teshnizi, Z.S.H. Recycling value of building materials in building assessment systems. Energy Build. 2011, 43, 3181–3188. [Google Scholar] [CrossRef]
- Shukla, A.; Tiwari, G.N.; Sodha, M.S. Embodied energy analysis of adobe house. Renew. Energy 2009, 34, 755–761. [Google Scholar] [CrossRef]
- Mithun, B.M.; Narasimhan, M.C. Performance of alkali activated slag concrete mixes incorporating copper slag as fine aggregate. J. Clean. Prod. 2016, 112, 837–844. [Google Scholar] [CrossRef]
- Dixit, M.K.; Fernandez-Solis, J.L.; Lavy, S.; Culp, C.H. Identification of parameters for embodied energy measurement: A literature review. Energy Build. 2010, 42, 1238–1247. [Google Scholar] [CrossRef]
- Zanoletti, A.; Federici, S.; Borgese, L.; Bergese, P.; Ferroni, M.; Depero, L.E.; Bontempi, E. Embodied energy as key parameter for sustainable materials selection: The case of reusing coal fly ash for removing anionic surfactants. J. Clean. Prod. 2017, 141, 230–236. [Google Scholar] [CrossRef]
- Geng, Y.; Wang, Z.; Shen, L.; Zhao, J. Calculating of CO2 emission factors for Chinese cement production based on inorganic carbon and organic carbon. J. Clean. Prod. 2019, 217, 503–509. [Google Scholar] [CrossRef]
- Flower, D.J.M.; Sanjayan, J.G. Green house gas emissions due to concrete manufacture. Int. J. Life Cycle Assess. 2007, 12, 282–288. [Google Scholar] [CrossRef]
- Ma, F.; Sha, A.; Yang, P.; Huang, Y. The Greenhouse Gas Emission from Portland Cement Concrete Pavement Construction in China. Int. J. Environ. Res. Public Health 2016, 13, 632. [Google Scholar] [CrossRef]
- Hammond, G.; Jones, C. A BSRIA Guide Embodied Carbon the Inventory of Carbon and Energy v3. 0 (ICE); BSRIA: Bracknell, UK, 2019. [Google Scholar]
- Caronge, M.A.; Tjaronge, M.W.; Rahim, I.R.; Irmawaty, R.; Lapian, F.E.P. Feasibility study on the use of processed waste tea ash as cement replacement for sustainable concrete production. J. Build. Eng. 2022, 52, 104458. [Google Scholar] [CrossRef]
- Wijayasundara, M.; Crawford, R.H.; Mendis, P. Comparative assessment of embodied energy of recycled aggregate concrete. J. Clean. Prod. 2017, 152, 406–419. [Google Scholar] [CrossRef]
- Choi, W.-C.; Yun, H.-D.; Kang, J.-W.; Kim, S.-W. Development of recycled strain-hardening cement-based composite (SHCC) for sustainable infrastructures. Compos. Part B Eng. 2012, 43, 627–635. [Google Scholar] [CrossRef]
- Rycewicz-Borecki, M. Materials for Sustainable Sites. A Complete Guide to the Evaluation, Selection and Use of Sustainable Construction Materials. Landsc. Urban Plan. 2009, 92, 177–178. [Google Scholar] [CrossRef]
- Yu, J.; Lu, C.; Leung, C.K.Y.; Li, G. Mechanical properties of green structural concrete with ultrahigh-volume fly ash. Constr. Build. Mater. 2017, 147, 510–518. [Google Scholar] [CrossRef]
- Crawford, R.H.; Stephan, A.; Prideaux, F. Environmental Performance in Construction (EPiC) Database; The University of Melbourne: Melbourne, Australia, 2019. [Google Scholar]
- Hammond, G.; Jones, C. Inventory of Carbon & Energy (ICE) Version 2.0; University of Bath: Bath, UK, 2011; Volume 19, p. 641. [Google Scholar]


| Keywords | |
|---|---|
| Group 1 | Group 2 |
| “concrete” and “SD” “concrete” and “quarry dust” “concrete” and “manufactured sand” | “concrete” and “SD” and “replacement NS” “concrete” and “quarry dust” and “replacement NS” “concrete” and “manufactured sand” and “replacement NS” |
| Name | Subjects | Number of Documents | ||||
|---|---|---|---|---|---|---|
| Before the Filter | After the Filter | |||||
| Group 1 | Group 2 | Group 1 | Group 2 | Total | ||
| Web of Science | Multidiscipline | 213 | 98 | 178 | 67 | 245 |
| Google Scholar | Multidiscipline | 734 | 168 | 495 | 114 | 609 |
| Total | - | 947 | 266 | 673 | 181 | 854 |
| Ref. | Aggregates and Fibers | Binders and Additives | Concrete Tests Conducted in the Study | Analyzed Properties |
|---|---|---|---|---|
| [3] | Granite stone dust (0–30%), fly ash, natural sand, and gravel. | Ordinary Portland cement of 43 grade (IS), superplasticizer (ASTM Type I). | Chloride penetration resistance, compressive strength, freezing–thawing resistance, J-Ring, and slump-flow test. | SL, S, C |
| [34] | Limestone stone dust (0–75%), marble stone dust (5–15%), natural sand, and gravel. | Ordinary Portland cement of 53 grade (IS), superplasticizer (ASTM Type II). | Compressive strength, flexural strength, tensile strength, modulus of elasticity, permeability, and slump-flow test. | CH, P, SL, S, F, T, M, WA |
| [35] | Granite stone dust (0–100%), fly ash (0–35%), natural sand, and gravel. | Ordinary Portland cement of 43 grade (IS), superplasticizer (ASTM Type I). | Compressive strength, flexural strength, and slump-flow test. | P, SL, S, F |
| [37] | Natural sand, gravel, and granite stone dust (0–15%). | ASTM Type I, water-reducing admixture (CEM I 42,5N). | Compressive strength, corrosion cell test, microstructure, setting time and expansion of cement paste, tensile strength, porosity, and XRD. | P, CH |
| [38] | Marble and granite stone dust (0–20%). | Brazilian Portland cement CPII F-32 (CEM II 32,5/ASTM Type II). | Compressive strength, microstructure, modulus of elasticity, slump-flow test, and water absorption. | CH |
| [39] | Granite stone dust (0–15%), natural sand, and gravel. | CEM I, superplasticizer (ASTM Type I). | Compressive strength, Schmidt rebound hammer, slump-flow test, water absorption, and water permeability. | P, CH |
| [40] | Granite dust (0–25%), natural sand, and gravel. | CEM-II (ASTM Type II). | Acid attack, carbonation depth, compressive strength, electrical resistive test, flexural strength, rapid chloride permeability test, slump-flow test, and split tensile strength. | P, SL, S, F, T, U, C, AA |
| [42] | Granite stone dust (0–100%), natural sand, fly ash (10–20%), and gravel. | ASTM Type I, superplasticizer (CEM I 42,5N). | Compaction factor, compressive strength, flexural strength, slump-flow test, and tensile strength. | P |
| [43] | Granite stone dust (0–50%), sand, and gravel. | ASTM Type I (CEM I 42,5N). | Compaction factor, compressive strength, flexural strength, modulus of elasticity, resistance to chemical solutions, slump-flow test, tensile strength, and water absorption. | SL, S, C, T, F, M, WA, AA |
| [44] | Laterite (0–100%), granite stone dust (0–100%), and gravel. | CEM I (ASTM Type I). | Compaction factor, compressive strength, and slump-flow test. | P |
| [45] | Stone dust (20%–50%), nylon fiber (0.25%–0.75%), natural sand, and gravel. | Portland limestone cement (PLC) (ASTM Type I). | Compressive strength, slump-flow test, and splitting tensile strength. | SL, S, P |
| [46] | Stone dust (0–100%), natural sand, and gravel. | Ordinary Portland cement of 53 grade (IS), superplasticizer. (ASTM Type II). | Compressive strength, static modulus of elasticity, and stress–strain curves. | P, M, S, |
| [47] | Granite stone dust (0–100%), natural sand, and gravel. | Ordinary Portland cement of 43 grade (IS) (ASTM Type I). | Abrasion resistance, compressive strength, depth of wear, flexural strength, impact resistance, modulus of elasticity, slump-flow test, and water penetration. | S, F, DW, W, M, P |
| [48] | Stone dust (0–100%), waste ceramic aggregates (0–20%), natural sand, and gravel. | Ordinary Portland cement of 43 grade, superplasticizer (ASTM Type I). | Compressive strength, flexural strength, and shear strength. | S, P |
| [49] | Stone dust (0–25%), rice husk ash (0–25%), natural sand, and gravel. | Ordinary Portland cement of 43 grade (IS) (ASTM Type I). | Compressive strength, Fourier transform infrared (FTIR) spectrometer, scanning electron microscope (SEM), and X-ray fluorescence (XRF). | P, CH, S |
| [50] | Limestone stone dust (5–35%), calcite stone dust (5–35%), natural sand, and fly ash (5–30%). | CEM II 32,5/B-M (ASTM Type II). | Abrasion resistance, compressive strength, durability in chemical solutions, microstructure, setting time, unit weight, volume expansion, and water permeability. | S, DW, W, AA |
| [51] | Natural sand, gravel, and limestone stone dust (5–20%). | CEM I 32,5, CEM II 42,5, superplasticizer (ASTM Type I/II). | Abrasion resistance, chloride permeability, compressive strength, flexural strength, open porosity, and slump-flow test. | P |
| [52] | Stone dust (0–100%), natural sand, and gravel. | Portland limestone cement. | Compressive strength, flexural strength, and slump-flow test. | P, SL, S, F |
| [53] | Granite stone dust (100%), jute fiber (0.10–0.15%), natural sand, and gravel. | CEM-II (ASTM Type II). | Compressive strength, slump-flow test, split tensile strength, and statistical response surface. | SL, P, S, T |
| [65] | Stone dust (0–30%), natural sand, and gravel. | Ordinary Portland cement of 53 grade (IS) (ASTM Type II). | Compressive strength with different water–cement ratios. | S, P |
| [68] | Manufactured sand (75%), marble waste dust (25%), granite stone dust (25%), fly ash (35%), natural sand, and gravel. | Ordinary Portland cement of 43 grade (IS), superplasticizer (ASTM Type I). | Compressive strength, flexural strength, slump-flow test, and tensile strength. | P, SL, S, T, F |
| [70] | Stone dust (0–100%), natural sand, and gravel. | Ordinary Portland cement of 53 grade (IS) (ASTM Type II). | Compressive strength and slump-flow test. | SL, S, P |
| [74] | Granite stone dust (0–70%), natural sand, and gravel. | Ordinary Portland cement of 43 grade (IS), superplasticizer (ASTM Type I). | Abrasion resistance, carbonation, compressive strength, corrosion, flexural strength, scanning electron microscopy, slump-flow test, thermogravimetric analysis, and water absorption. | P, CH, S, SL, F, WA, CD, DW |
| [78] | Granite stone dust (10–100%), marble stone dust (10–100%), granule basalt (10–100%), natural sand, and gravel. | CEM I 42,5 (ASTM Type I). | Capillary water permeability, compressive strength, freeze–thaw property, resistance to abrasion, and sulfate resistance. | P, WA, S, DW, U |
| [85] | Granite stone dust (0–25%), natural sand, and gravel. | CEM-II (ASTM Type II), Superplasticizer. | Compressive strength, flexural strength, slump-flow test, split tensile strength, and ultrasonic pulse velocity. | P, U, S, T, F |
| [86] | Granite stone dust (0–70%), natural sand, and gravel. | Ordinary Portland cement of 43 grade (IS) (ASTM Type I). | Abrasion resistance, acid attack, carbonation, chloride penetration, compressive strength, corrosion flexural strength, microstructure analysis (scanning electron microscopy—SEM), slump-flow test, water permeability, and X-ray powder diffraction (XRD). | SL, S, F, DW, W, CD, D, P |
| [87] | Stone dust (0–40%), natural sand, and gravel. | Ordinary Portland cement of 43 grade (IS), superplasticizer (ASTM Type I). | Compressive strength and slump-flow test. | SL, S |
| [88] | Stone dust (0–100%), natural sand, and gravel. | Ordinary Portland cement of 53 grade (IS) (ASTM Type II). | Compressive strength and slump-flow test. | SL, S, P |
| [89] | Stone dust (0%–100%), crumb rubber (0–20%), natural sand, and gravel. | Ordinary Portland cement of 43 grade (ASTM Type I). | Chemical analysis pH (FTIR spectrometer), compressive strength, and ratio of compressive strength at elevated and ambient temperatures. | S, P |
| [90] | Stone dust (0–50%), natural sand, and gravel. | Ordinary Portland cement of 53 grade (IS), superplasticizer (ASTM Type II). | Compaction factor test, compressive strength, and slump-flow test. | SL, S, P |
| [91] | Stone dust (0–100%), natural sand, and gravel. | Ordinary Portland cement of 43 grade (ASTM Type I). | Compressive strength, slump-flow test, and split tensile strength. | SL, S, P |
| [92] | Stone dust (20–30%), waste foundry sand (70–80%), and gravel. | Ordinary Portland cement of 43 grade (ASTM Type I). | Compressive strength, flexural strength, slump-flow test, and split tensile strength. | P |
| [93] | Stone dust (0–50%), absorbent polymer (0,3/0,4%), natural sand, and gravel. | Ordinary Portland cement of 53 grade (IS) (ASTM Type II). | Compressive strength and split tensile strength. | P |
| [94] | Stone dust (0–35%), natural sand, and gravel. | Ordinary Portland cement of 43 grade (ASTM Type I). | Acid effect, compressive strength, slump-flow test, and water absorption. | SL, S, P, WA, CH |
| [95] | Stone dust (100%), natural sand, and gravel. | CEM I 42,5N (ASTM Type I). | Compressive strength and slump-flow test. | SL, S, P |
| [96] | Stone dust (0–75%), fly ash (0–20%), natural sand, and gravel. | Ordinary Portland cement of 53 grade (IS), superplasticizer (ASTM Type II). | Compressive strength, flexural strength, slump-flow test, and split tensile strength. | SL, S, P, T, F |
| [97] | Manufactured sand (0–100%), natural sand, and gravel. | Ordinary Portland cement of 43 grade (IS) (ASTM Type I). | Acid attack, chloride permeability, compressive strength, flexural strength, slump-flow test, tensile strength, and water permeability. | P, SL, S, F, T, W, AA |
| [98] | Stone dust (0–100%), natural sand, and gravel. | Ordinary Portland cement of 53 grade (IS), superplasticizer (ASTM Type II). | Compressive strength, flexural strength, slump-flow test, temperature, and tensile strength. | P, SL, S, F, T |
| [99] | Crushed gneiss stone dust (0–5%), crushed basalt stone dust (0–5%), natural sand, and gravel. | CEM II/A class 42.5 R (ASTM Type II). | Compressive strength, loss of mass under high temperature, physical appearance under high temperature, split tensile strength, variation of volume under high temperature, and water absorption. | P, S, T, WA |
| [100] | Manufactured sand (0–100%), natural sand, and gravel. | Ordinary Portland cement of 53 grade (IS) (ASTM Type II). | Compressive strength, flexural strength, slump-flow test, and split tensile strength. | P, SL, S, F, T |
| [101] | Steel mill scale waste (0–100%), granite stone dust (0–100%), natural sand, and gravel. | Ordinary Portland cement of 43 grade (IS) (ASTM Type I). | Bulk density, compressive strength, and water absorption. | P, S, WA |
| [102] | Marble stone dust (0–60%), natural sand, and gravel. | Ordinary Portland cement of 43 grade (IS) (ASTM Type I). | Compressive strength, drying and strain shrinkage, microstructural analysis, slump-flow test, and X-ray diffraction (XRD) spectra. | P, CH, SL, S |
| [103] | Stone dust (0–60%), natural sand, and gravel. | Ordinary Portland cement of 43 grade (IS), superplasticizer (ASTM Type I). | Acid attack, compressive strength, slump-flow test, split tensile strength, and water absorption. | P, S, SL, AA, T, WA |
| [104] | Granite stone dust (0–40%), natural sand, and gravel. | Ordinary Portland cement of 43 grade (IS) (ASTM Type I). | Compressive strength, microstructural analysis, pull-out test, and slump-flow test. | P, S, SL |
| [105] | Stone dust (0–50%), natural sand, and gravel. | Portland Pozzolana cement (ASTM Type I). | Compressive strength, flexural strength, and slump-flow test. | P, SL, S, F |
| [106] | Granite stone dust (0–20%), natural sand, and gravel. | Ordinary Portland cement of 43 grade (IS) (ASTM Type I). | Compressive strength, ductility, flexural rigidity of the reinforced concrete beam, flexural strength, load–deflection characteristics, crack pattern, and slump-flow test. | P |
| [107] | Stone dust (0–100%), natural sand, and gravel. | Ordinary Portland cement of 43 grade (IS) (ASTM Type I). | Acid attack, compressive strength, flexural strength, slump-flow test, and split tensile strength. | P, S, SL, F, T, AA |
| [108] | Granite stone dust (0–50%), natural sand, and gravel. | Ordinary Portland cement of 43 grade (IS), superplasticizer (ASTM Type I). | Abrasion resistance, compressive strength, flexural strength, scanning electron microscope (SEM), slump-flow test, water absorption, and X-ray diffraction (XRD) spectra. | P, CH, S, SL, F, DW, WA |
| [109] | Granite stone dust (0–50%), natural sand, and gravel. | CEM I 32,5 R and CEM I 42,5 R, superplasticizer (ASTM Type I/II). | Compressive strength, flexural strength, scanning electron microscopy, slump-flow test, split tensile strength, and water absorption. | P, S, SL, WP, WA |
| [110] | Stone dust (0–75%), coconut coir pith (5%), fly ash, natural sand, and gravel. | Ordinary Portland cement of 53 grade (IS) (ASTM Type II). | Compressive strength, flexural strength, slump-flow test, and split tensile strength. | P, S, SL |
| Search | SiO2 | Al2O3 | Fe2O3 | TiO2 | CaO | MgO | Na2O | K2O | P2O5 | MnO | CaSO4 | SO3 | LoI 1 | Type |
|---|---|---|---|---|---|---|---|---|---|---|---|---|---|---|
| [34] | 6.5 | 0.8 | 0.4 | - | 35.0 | 14.4 | 0.1 | 0.4 | - | - | - | 0.7 | 41.0 | Limestone |
| [34] | 14.1 | 2.7 | 1.9 | - | 42.1 | 2.8 | 0.9 | 0.6 | - | - | - | - | - | Marble |
| [37] | 85.5 | 2.1 | 0.4 | - | 4.9 | 2.5 | - | - | - | - | - | 1.8 | 1.1 | Granite |
| [38] | 55.8 | 10.4 | 6.9 | - | 10.1 | 2.6 | 2.6 | 2.4 | - | - | 0.04 | 0.03 | 6.8 | Granite |
| [39] | 69.7 | 12.8 | 4.3 | 0.2 | 1.8 | 0.4 | 0.5 | 8.1 | 0.2 | 0.1 | - | 0.2 | 1.32 | Granite |
| [49] | 47.9 | 11.0 | 2.4 | 0.4 | 1.7 | 3.7 | - | 2.9 | 0.43 | 0.31 | - | 0.04 | - | Granite |
| [74] | 72.6 | 15.6 | - | - | - | 0.8 | 4.2 | 6.8 | - | - | - | - | - | Granite |
| [94] | 62.5 | 18.7 | 6.5 | 1.2 | 4.8 | 2.6 | - | 3.2 | - | - | - | - | 0.5 | Granite |
| [102] | 4.7 | 0.2 | 0.5 | - | 28.7 | 22.3 | 0.06 | 0.05 | - | - | - | - | 43.7 | Marble |
| [108] | 72.6 | 15.6 | - | - | - | 0.8 | 4.2 | 6.8 | - | - | - | - | - | Granite |
| Average Granite | 68.4 | 11.0 | 4.5 | 0.7 | 5.4 | 2.0 | 1.6 | 4.6 | 0.2 | 0.1 | 0.04 | 0.7 | 2.4 | |
| Average Marble | 9.4 | 1.5 | 1.2 | - | 35.4 | 12.5 | 0.49 | 0.34 | - | - | - | - | 43.7 |
| Stone Dust—SD | Natural Sand—NS | ||||||
|---|---|---|---|---|---|---|---|
| Search | Specific Gravity (g/cm3) | Water Absorption (%) | Fineness Modulus (mm) | Search | Specific Gravity (g/cm3) | Water Absorption (%) | Fineness Modulus (mm) |
| [46] | 2.66 | 10.6 | 3.54 | [46] | 2.64 | 6.8 | 2.66 |
| [47] | 2.56 | 3.2 | 3.30 | [47] | 2.64 | 0.8 | 2.70 |
| [85] | 2.59 | 1.1 | 3.41 | [85] | 2.65 | 1.1 | 3.10 |
| [86] | 2.62 | 4.4 | 2.57 | [86] | 2.70 | 2.9 | 3.36 |
| [89] | 2.59 | 11.6 | 1.70 | - | - | - | - |
| Average—SD | 2.60 | 6.2 | 2.90 | Average—NS | 2.66 | 2.9 | 2.96 |
| Concrete Property | Ideal SD Content Interval | Ref. | ||
|---|---|---|---|---|
| Minimum | Maximum | Ideal | ||
| Workability (slump) | 40% | 50% | 40% | [90] |
| Chloride penetration resistance | 25% | 50% | 50% | [86] |
| Carbonation resistance | 30% | 40% | 35% | [108] |
| Water penetration | 40% | 50% | 30% | [74] |
| Water absorption | 30% | 40% | 30% | [74] |
| Compressive strength | 40% | 65% | 40% | [102] |
| Flexural strength | 50% | 80% | 40% | [48] |
| Split tensile strength | 75% | 90% | 75% | [96] |
| Average | 41.3% | 58.1% | 42.5% | |
| Cement | Natural Sand | Coarse Aggregate | Water | Admixture |
|---|---|---|---|---|
| 4.800 [47] | 0.081 [47] | 0.083 [47] | 0.200 [47] | 2.600 [140] |
| 3.630 [140] | 0.098 [138] | 0.098 [138] | 0.200 [148] | 11.500 [135] |
| 7.790 [134] | 0.089 [140] | 0.180 [140] | 0.010 [141] | 4.740 [143] |
| 5.232 [145] | 0.080 [134] | 0.150 [145] | 0.010 [146] | 11.470 [146] |
| 4.600 [148] | 0.100 [145] | 0.100 [148] | 0.017 [147] | - |
| 5.500 [141] | 0.100 [148] | 0.083 [141] | - | |
| 5.500 [146] | 0.067 [141] | 0.083 [146] | - | - |
| 11.800 [147] | 0.081 [146] | 0.036 [147] | - | - |
| Average | ||||
| 6.107 | 0.087 | 0.102 | 0.087 | 7.578 |
| Cement | Natural Sand | Coarse Aggregate | Water | Admixture |
|---|---|---|---|---|
| 0.930 [47] | 0.005 [47] | 0.005 [47] | 0.001 [47] | 0.720 [138] |
| 0.840 [138] | 0.004 [139] | 0.005 [139] | 0.0002 [142] | 0.520 [139] |
| 0.820 [139] | 0.007 [140] | 0.005 [140] | 0.001 [141] | 0.690 [140] |
| 0.659 [140] | 0.003 [142] | 0.007 [142] | 0.001 [146] | 0.690 [143] |
| 0.931 [142] | 0.005 [145] | 0.008 [145] | 0.001 [147] | 0.600 [146] |
| 0.908 [145] | 0.005 [148] | 0.005 [148] | - | |
| 0.830 [148] | 0.002 [144] | 0.002 [141] | - | - |
| 0.930 [141] | 0.005 [146] | 0.005 [146] | - | - |
| 0.930 [146] | 0.003 [147] | - | - | |
| Average | ||||
| 0.864 | 0.004 | 0.005 | 0.001 | 0.644 |
| Concrete Strength Class | % of SD | Concrete Composition (kg/m3) | EE (MJ/m3) | ECO2 (kgCO2/m3) | |||||
|---|---|---|---|---|---|---|---|---|---|
| Cement | Natural Sand | Stone Dust | Coarse Aggregate | Water | Additive | ||||
| 25 MPa [103] | 0% | 326.0 | 698.0 | 0.0 | 1255.9 | 160.7 | - | 2193.11 | 291.56 |
| 20% | 326.0 | 558.4 | 139.6 | 1255.9 | 160.7 | - | 2183.80 | 291.09 | |
| 30% | 326.0 | 488.6 | 209.4 | 1255.9 | 160.7 | - | 2179.15 | 290.85 | |
| 40% | 326.0 | 418.8 | 279.2 | 1255.9 | 160.7 | - | 2174.50 | 290.62 | |
| 50% | 326.0 | 349.0 | 349.0 | 1255.9 | 160.7 | - | 2169.84 | 290.39 | |
| 100% | 326.0 | 0.0 | 698.0 | 1255.9 | 160.7 | 2.21 | 2146.57 | 289.22 | |
| 30 MPa [47] | 0% | 339.0 | 745.0 | 0.0 | 1248.0 | 152.5 | 2.21 | 2291.82 | 304.37 |
| 20% | 339.0 | 596.0 | 149.0 | 1248.0 | 152.5 | 2.21 | 2281.89 | 303.87 | |
| 30% | 339.0 | 521.5 | 223.5 | 1248.0 | 152.5 | 2.21 | 2276.92 | 303.62 | |
| 40% | 339.0 | 447.0 | 298.0 | 1248.0 | 152.5 | 2.21 | 2271.95 | 303.37 | |
| 50% | 339.0 | 372.5 | 372.5 | 1248.0 | 152.5 | 2.21 | 2266.98 | 303.12 | |
| 100% | 339.0 | 0.0 | 745.0 | 1248.0 | 152.5 | 2.21 | 2242.15 | 301.88 | |
| 40 MPa [52] | 0% | 440.5 | 563.5 | 0.0 | 1135.0 | 167.4 | - | 2869.04 | 389.30 |
| 20% | 440.5 | 450.8 | 112.7 | 1135.0 | 167.4 | - | 2861.52 | 388.93 | |
| 30% | 440.5 | 394.5 | 169.1 | 1135.0 | 167.4 | - | 2857.76 | 388.74 | |
| 40% | 440.5 | 338.1 | 225.4 | 1135.0 | 167.4 | - | 2854.01 | 388.55 | |
| 50% | 440.5 | 281.8 | 281.8 | 1135.0 | 167.4 | - | 2850.25 | 388.36 | |
| 100% | 440.5 | 0.0 | 563.5 | 1135.0 | 167.4 | - | 2831.46 | 387.42 | |
Disclaimer/Publisher’s Note: The statements, opinions and data contained in all publications are solely those of the individual author(s) and contributor(s) and not of MDPI and/or the editor(s). MDPI and/or the editor(s) disclaim responsibility for any injury to people or property resulting from any ideas, methods, instructions or products referred to in the content. |
© 2023 by the authors. Licensee MDPI, Basel, Switzerland. This article is an open access article distributed under the terms and conditions of the Creative Commons Attribution (CC BY) license (https://creativecommons.org/licenses/by/4.0/).
Share and Cite
Silva, L.S.; Amario, M.; Stolz, C.M.; Figueiredo, K.V.; Haddad, A.N. A Comprehensive Review of Stone Dust in Concrete: Mechanical Behavior, Durability, and Environmental Performance. Buildings 2023, 13, 1856. https://doi.org/10.3390/buildings13071856
Silva LS, Amario M, Stolz CM, Figueiredo KV, Haddad AN. A Comprehensive Review of Stone Dust in Concrete: Mechanical Behavior, Durability, and Environmental Performance. Buildings. 2023; 13(7):1856. https://doi.org/10.3390/buildings13071856
Chicago/Turabian StyleSilva, Leandro S., Mayara Amario, Carina M. Stolz, Karoline V. Figueiredo, and Assed N. Haddad. 2023. "A Comprehensive Review of Stone Dust in Concrete: Mechanical Behavior, Durability, and Environmental Performance" Buildings 13, no. 7: 1856. https://doi.org/10.3390/buildings13071856