
Impact Performance of RC Beams Reinforced by Engineered Cementitious Composite
Key Laboratory of Urban Security and Disaster Engineering of Ministry of Education, Beijing University of Technology, Beijing 100124, China
Buildings 2023, 13(7), 1688; https://doi.org/10.3390/buildings13071688
Submission received: 18 April 2023
/
Revised: 17 May 2023
/
Accepted: 29 May 2023
/
Published: 30 June 2023
(This article belongs to the Special Issue Assessment and Retrofit of Buildings)
Abstract
:To mitigate potential damage to RC structures subjected to impact load—especially spalling damage—engineered cementitious composite (ECC) is applied, with the aim of reinforcing the RC members, so as to improve their impact performance. In the present study, the response of beams, with and without ECC reinforcement, to impact loading was investigated. Firstly, the mechanical properties of the ECC were characterized by quasi-static compression and tension tests, as well as by dynamic direct tension tests. Then, the K&C model (Karagozian and Case Concrete Model) was employed to delineate the ECC behavior, whose parameters were calibrated using the test data. Subsequently, models of RC beams with and without ECC reinforcement, validated using the drop weight test, were established to investigate the impact response. The numerical results suggested that the performance of the impact resistance of the ECC-reinforced RC beams was significantly improved. The damage degree of the ECC-reinforced members was effectively reduced, the degree of deformation was effectively controlled, and the energy consumption capacity was significantly increased while the impact load and transferred load increased. In particular, the method of multiple separate layers as reinforcement, proposed in this study, was found to reduce effectively the response and damage extent, improve the energy dissipation, and control the impact load and transferred load within certain levels. In addition, the multiple separate ECC layers effectively prevented the crack propagation caused by the cracking of the member, ensured the residual integrity of the member, and further improved the performance of the impact resistance of the member comprehensively.
1. Introduction
Due to the increasing number of vehicles and their improper operation by humans, accidental vehicle crashes have occurred frequently in recent years [1,2], which has led to a serious threat to critical infrastructure and architectural structures, especially reinforced concrete (RC) structures [3,4]. RC structures experience severe spalling damage and reduced structural integrity under impact loading due to the brittle properties of the concrete, which in turn increases the risk of structural collapse [5,6]; therefore, structural protection of important reinforced concrete structures against impact load has attracted increasing attention in recent decades.
To improve the impact resistance of RC structures [7,8,9], effective methods include increasing the size of the structural members, increasing the reinforcement ratio, and increasing the concrete strength [10,11,12,13]. For instance, increasing the member size and reinforcement ratio can effectively improve the impact performance. In addition, the capacity of shear resistance and energy absorption of reinforced concrete members is improved by applying pre-stress to the steel bars in the concrete members [14,15]. However, although the strength and stiffness of RC members is improved by increasing the member size, material properties, and reinforcement ratio, the disadvantages of these methods include their being expensive, labor-intensive, and time-consuming. In fact, most existing structures were not designed for protection against impact loads; thus, strengthening existing RC structures has become a necessity for important RC structures [16,17,18].
Impact performance is mitigated with a reduced spalling degree by confining the RC members. Typically, fiber-reinforced polymer (FRP) and polyurea (PU) with high tensile strength and ductility are applied to RC members as reinforcement [19,20,21,22], and their protective effect has been investigated. Specifically, increasing the thickness of the FRP layer could significantly improve the impact resistance of the RC members to alleviate the degree of local damage. However, the durability of the polymeric reinforcement FRP and PU has not been favorable to date [23]. In addition, the interface may suffer failure under strong dynamic tension and shear [24,25]. To this end, to reduce the spalling damage of blast-loaded RC members, using fiber-reinforced concrete (FRC) is another promising option [26,27].
The performance of FRC has been improved by adding various fibers to the cementitious material, such as steel fibers [28,29], basalt fibers [30,31], and PE or PVA fibers [32,33]. The two main categories of FRC are ultra-high-performance concrete (UHPC), which has ultra-high compressive strength, and engineered cementitious composite (ECC), which has high ductility. As a reinforcement material for RC members, ECC exhibits higher compatibility, ductility, and durability. In addition, the short-cut flexible fibers were added to cement mortar to make ECC with metal-like ductility and toughness [34,35].
Engineered cementitious composite (ECC), initially proposed by Li et al. [36], has attracted more attention in the field of civil engineering. The mechanical properties of ECC were extensively investigated in terms of fiber type, volume fraction, and geometry, and meaningful results were obtained. The ultimate tensile strength and tensile strain capacity were effectively improved by up to 20 MPa and 8.7%, respectively, by adding 2% polyethylene fibers [37]. Furthermore, the uniaxial tension test, compression test, and flexural test suggested that the size effect of the ECC was not significant within the concerned range of specimen dimension [38]. The performances of ECC members were also extensively and intensively investigated. The damaged RC beams were strengthened using ECC with a compressive strength of 130 MPa, and the results showed that the original load-bearing capacity of the beams could be restored after repair [39]. The shear and flexural properties of the concrete beams were enhanced by applying ECC, and it was found that the ultimate flexural and shear strengths of the strengthened RC beams were increased by about 20% and 60%, respectively [40]. In addition, pre-damaged RC beams were retrofitted with hybrid fiber-reinforced ECC, and the strengthened RC beams maintained their load-bearing capacity, even at large deflection [41].
In addition to the promising application of ECC in the field of structural protection under dynamic loading, its dynamic property at the material level was also investigated. Test results showed that within the strain rate range of 10−6–10−1/s, the ultimate tensile strength increased, and the tensile strain capacity slightly fluctuated with an increasing strain rate [42]. With a higher strain rate of 10/s, it was found that the tensile strength of the ECC increased and that the ductility decreased with an increasing strain rate [43]. Furthermore, the split-Hopkinson tensile bar test suggested a significant strain rate effect on ECC’s tensile strength and toughness under a strain rate of up to 150/s was observed; meanwhile, the tensile strain capacity decreased [44].
Reinforcing RC beams with an ECC layer is a common method in the field of structural protection [45]. The impact tests implied that RC beams with embedded prefabricated ECC strips reduced the crack width, improved the crack distribution, and increased the bearing capacity and ductility compared to the RC counterparts. The impact resistance of ECC-reinforced RC members increased with the increasing thickness of the reinforcement layer. However, the increased thickness of the ECC reinforcement layer inevitably increased the response stiffness of the member. The increased stiffness will lead to an increase in impact loads and transferred loads (reaction force), which may lead to negative effects in engineering applications. For example, in vehicle impacts on bridge piers, the damage degree of the ECC-reinforced piers was reduced because of their increased stiffness, which increases the interaction force between the vehicle and piers. However, the vehicle would suffer more serious damage. It is worth noting that the benefits of simply increasing stiffness are limited. In addition, the increased transferred loads could result in a higher load on the bearing structure, which is detrimental to its protection.
While it is difficult and expensive to conduct many impact tests, certain response data, such as energy, are also challenging to measure accurately with standard equipment. As a result, numerical simulation is often preferred. In the present study, the effect of strengthening RC beams with ECC layers of different configurations was investigated. Firstly, the material properties of the ECC were obtained through quasi-static compression tests and quasi-static and dynamic tensile tests. Then, a K&C model with parameters calibrated from test data was employed to describe ECC behavior. Subsequently, the numerical model of ECC-reinforced RC beams subjected to impact load was established and validated with impact test data. Furthermore, with the validated numerical model, important factors governing the strengthening effect of ECC layers are discussed in detail. In particular, the effectiveness of separating the ECC layers for impact mitigation is shown with single-layer strengthening as a reference.
2. Material Characteristics
2.1. Quasi-Static and Dynamic Mechanical Properties of Concrete and Steel
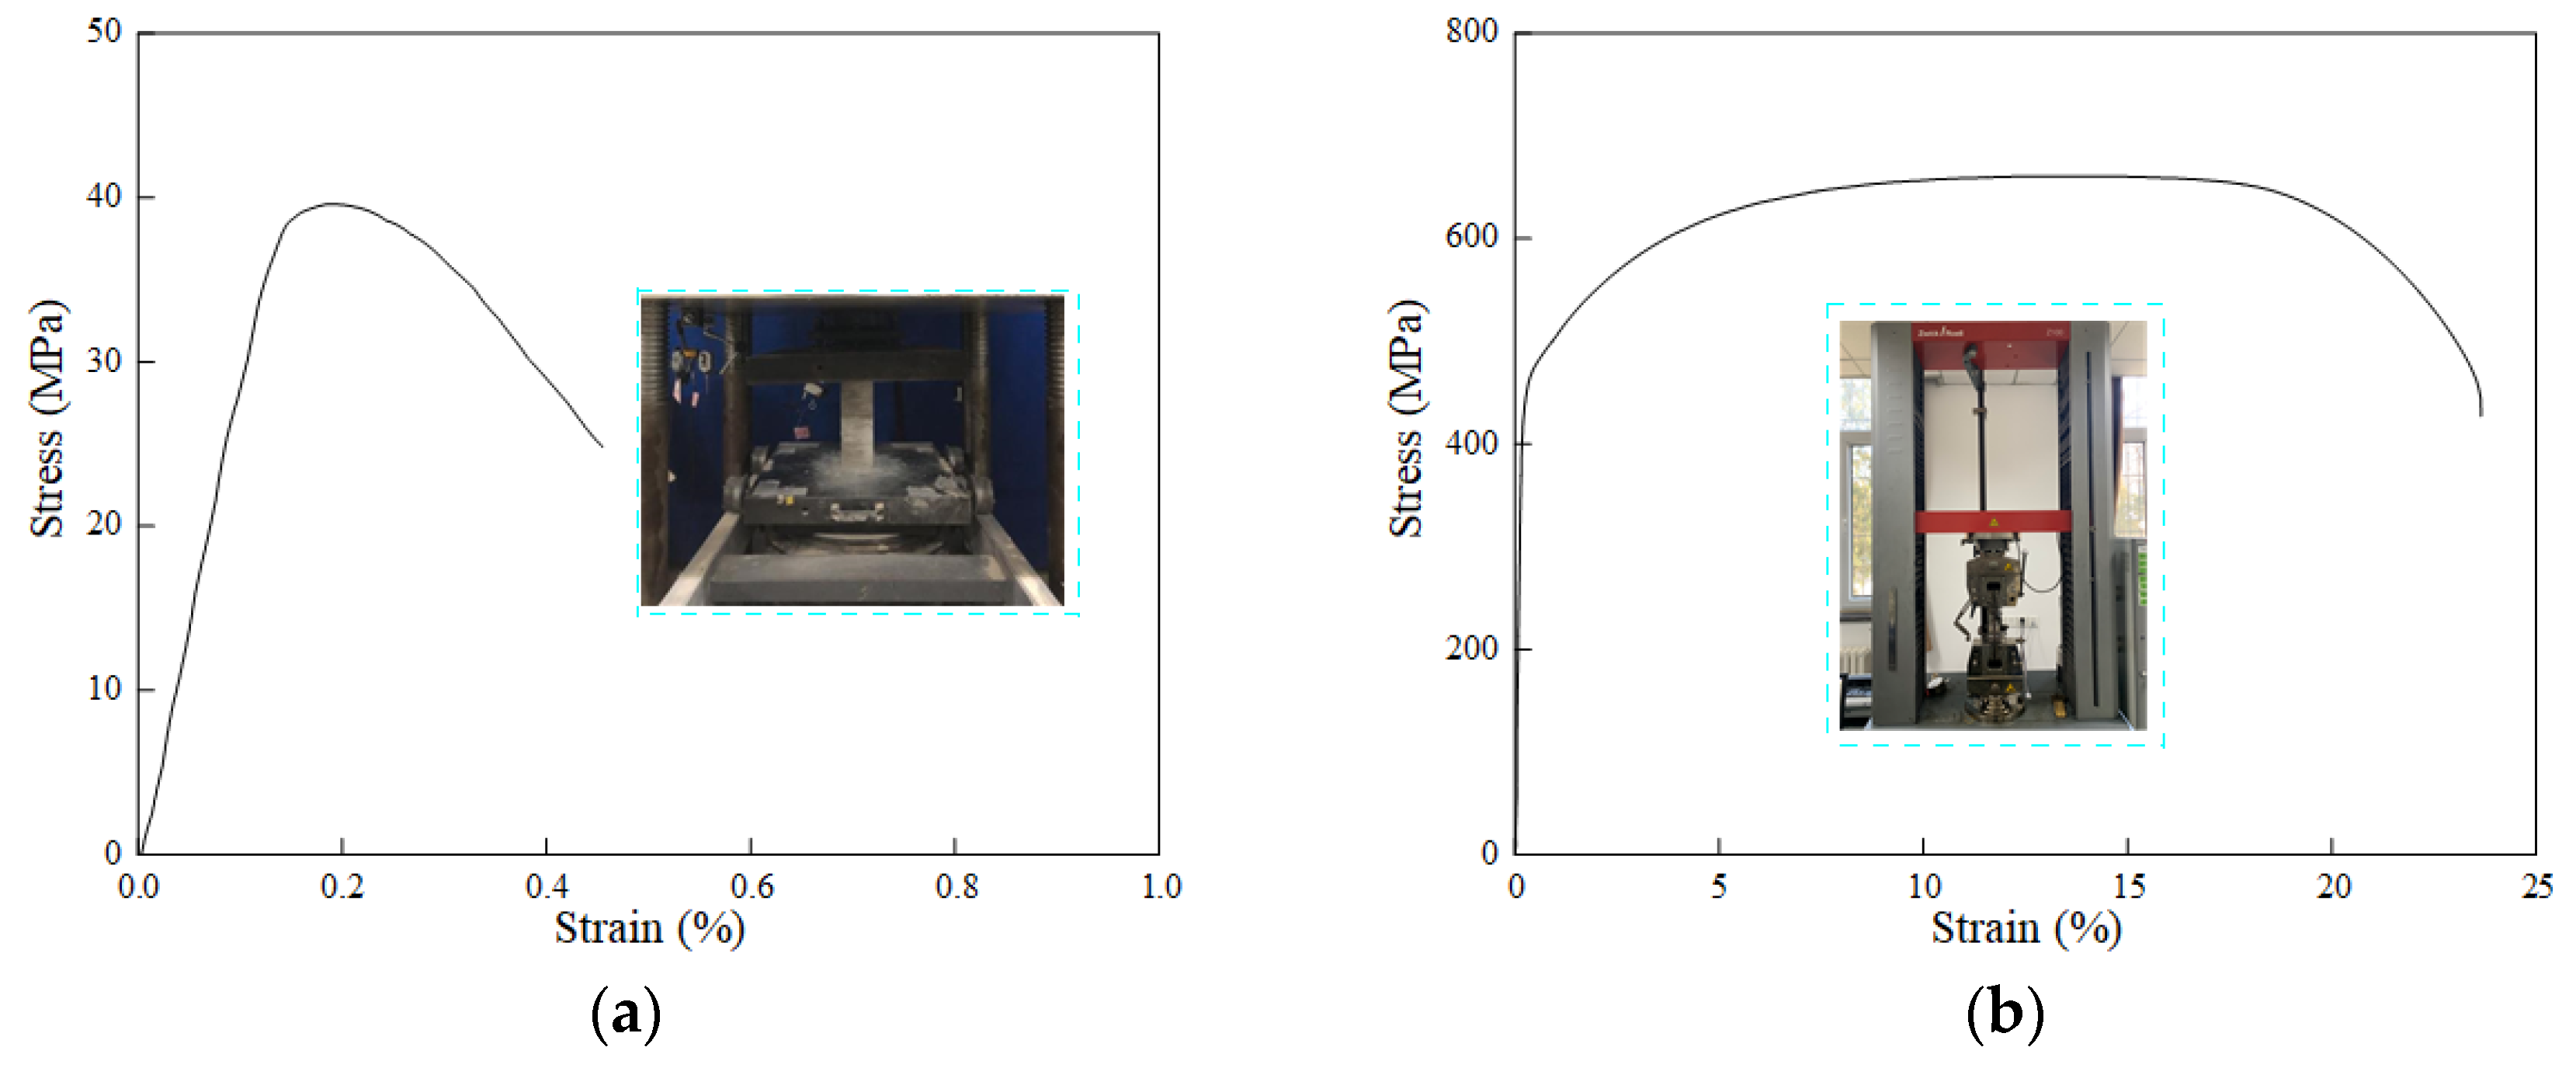
The quasi-static compression and tension tests were conducted to obtain the mechanical properties of the concrete and steel reinforcement. All mixtures were prepared according to the concrete mix proportion in Table 1. The C35 grade concrete with the size 150 mm × 150 mm × 450 mm was prepared for the quasi-static compression test by the electronic universal testing machine MTS-YAW6306 (maximum load 3000 kN) with a loading speed of 5 mm/min, which was according to the China Design Code of GB 50010-2010 (2015): Code for design for concrete structure. The 28-day compressive strength of the concrete was 39.5 MPa, and the stress–strain relation is shown in Figure 1a. The mechanical properties of HPB 335 steel were obtained by quasi-static tension test by an electronic universal testing machine Zwick Roell-Z100 with a displacement loading rate of 5 mm/min, which was according to the China Design Code of GB/T 1499.2-2018: Steel for reinforced concrete Part 2: hot rolled ribbed bars. The Young’s modulus and yield strength of the HPB 335 steel were 203 GPa and 450 MPa, respectively, and the tensile stress–strain curve is given in Figure 1b.
With increasing strain rate, the Cowper–Symonds model was employed to delineate the strain rate effect [46]:
where σy and σd denote quasi-static and dynamic yield strength, respectively. C and p are strain rate parameters, taken as 40/s and 5, respectively, for typical mild steel, and denotes the equivalent strain rate.
2.2. Quasi-Static and Dynamic Mechanical Properties of ECC
As shown in Table 2, the raw materials of P.II 525 ordinary Portland cement, the fly ash (class I, 880 kg/m3) with particle size greater than 10 μm, the silica sand (2010 kg/m3) with particle size ranging from 0.12 mm to 0.18 mm, the tap water, the high-range water reducer admixture (HRWRA), and the polyethylene (PE) fibers were used to manufacture ECC. The short-cut PE fibers with a length of 12 mm and diameter of 20 μm, whose mechanical characteristics are listed in Table 3, were added to the cementitious matrix. The volume fraction of the fiber was set at 2%.
All mixtures were prepared according to the mix proportion of ECC in Table 2. Then, the fresh ECC mortar was cast into a steel mold to form quasi-static tensile and compressive specimens. All specimens were covered with plastic films, demolded 24 h after molding, and cured for 7 days.
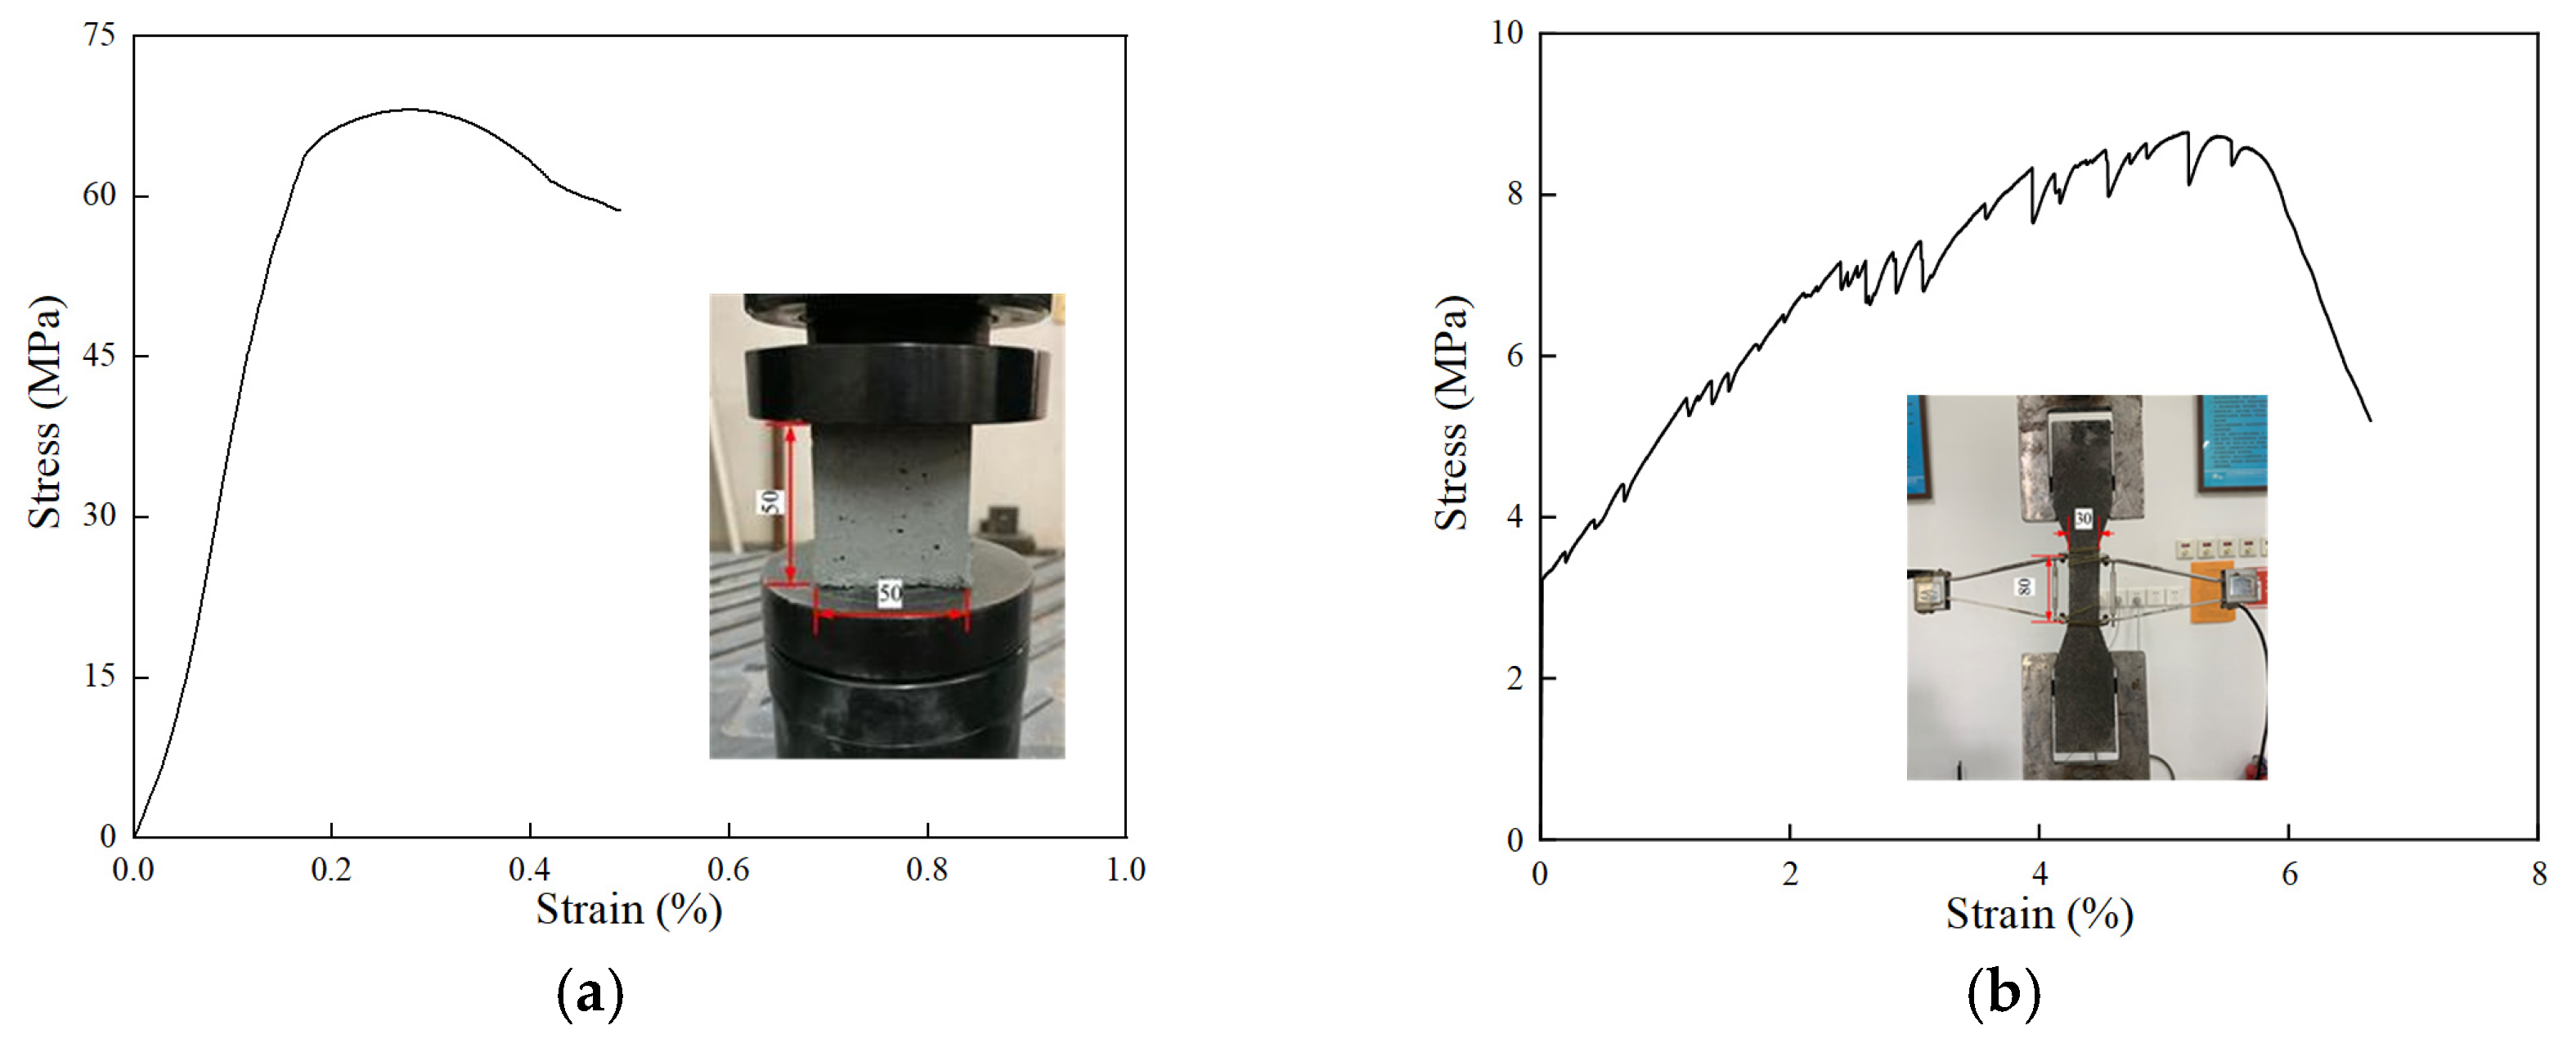
To obtain the mechanical properties of the prepared ECC, a quasi-static compression test was conducted with the MTS Exceed E45 universal testing machine (maximum loading capacity of 300 kN). As shown in Figure 2a, the cubic ECC specimens of 50 mm × 50 mm × 50 mm were loaded with the displacement control mode of compression rate at 0.5 mm/min, and the measured stress–strain curve is shown in Figure 2a. It was observed that the bearing capacity of the ECC specimen gradually decreased after it reached its ultimate compressive strength of 68 MPa, implying relatively excellent ductility.
The quasi-static tension test was also conducted on the MTS Exceed E45 universal testing machine with the displacement control mode at a loading speed of 0.0008 mm/s. The measured stress–strain curve is shown in Figure 2b. It was observed that the ECC underwent obvious strain hardening, and the initial cracking strength, the ultimate tensile strength, and the tensile strain capacity were 3.2 MPa, 8.67 MPa, and 5.61%, respectively. The mechanical properties of the ECC are listed in Table 4.
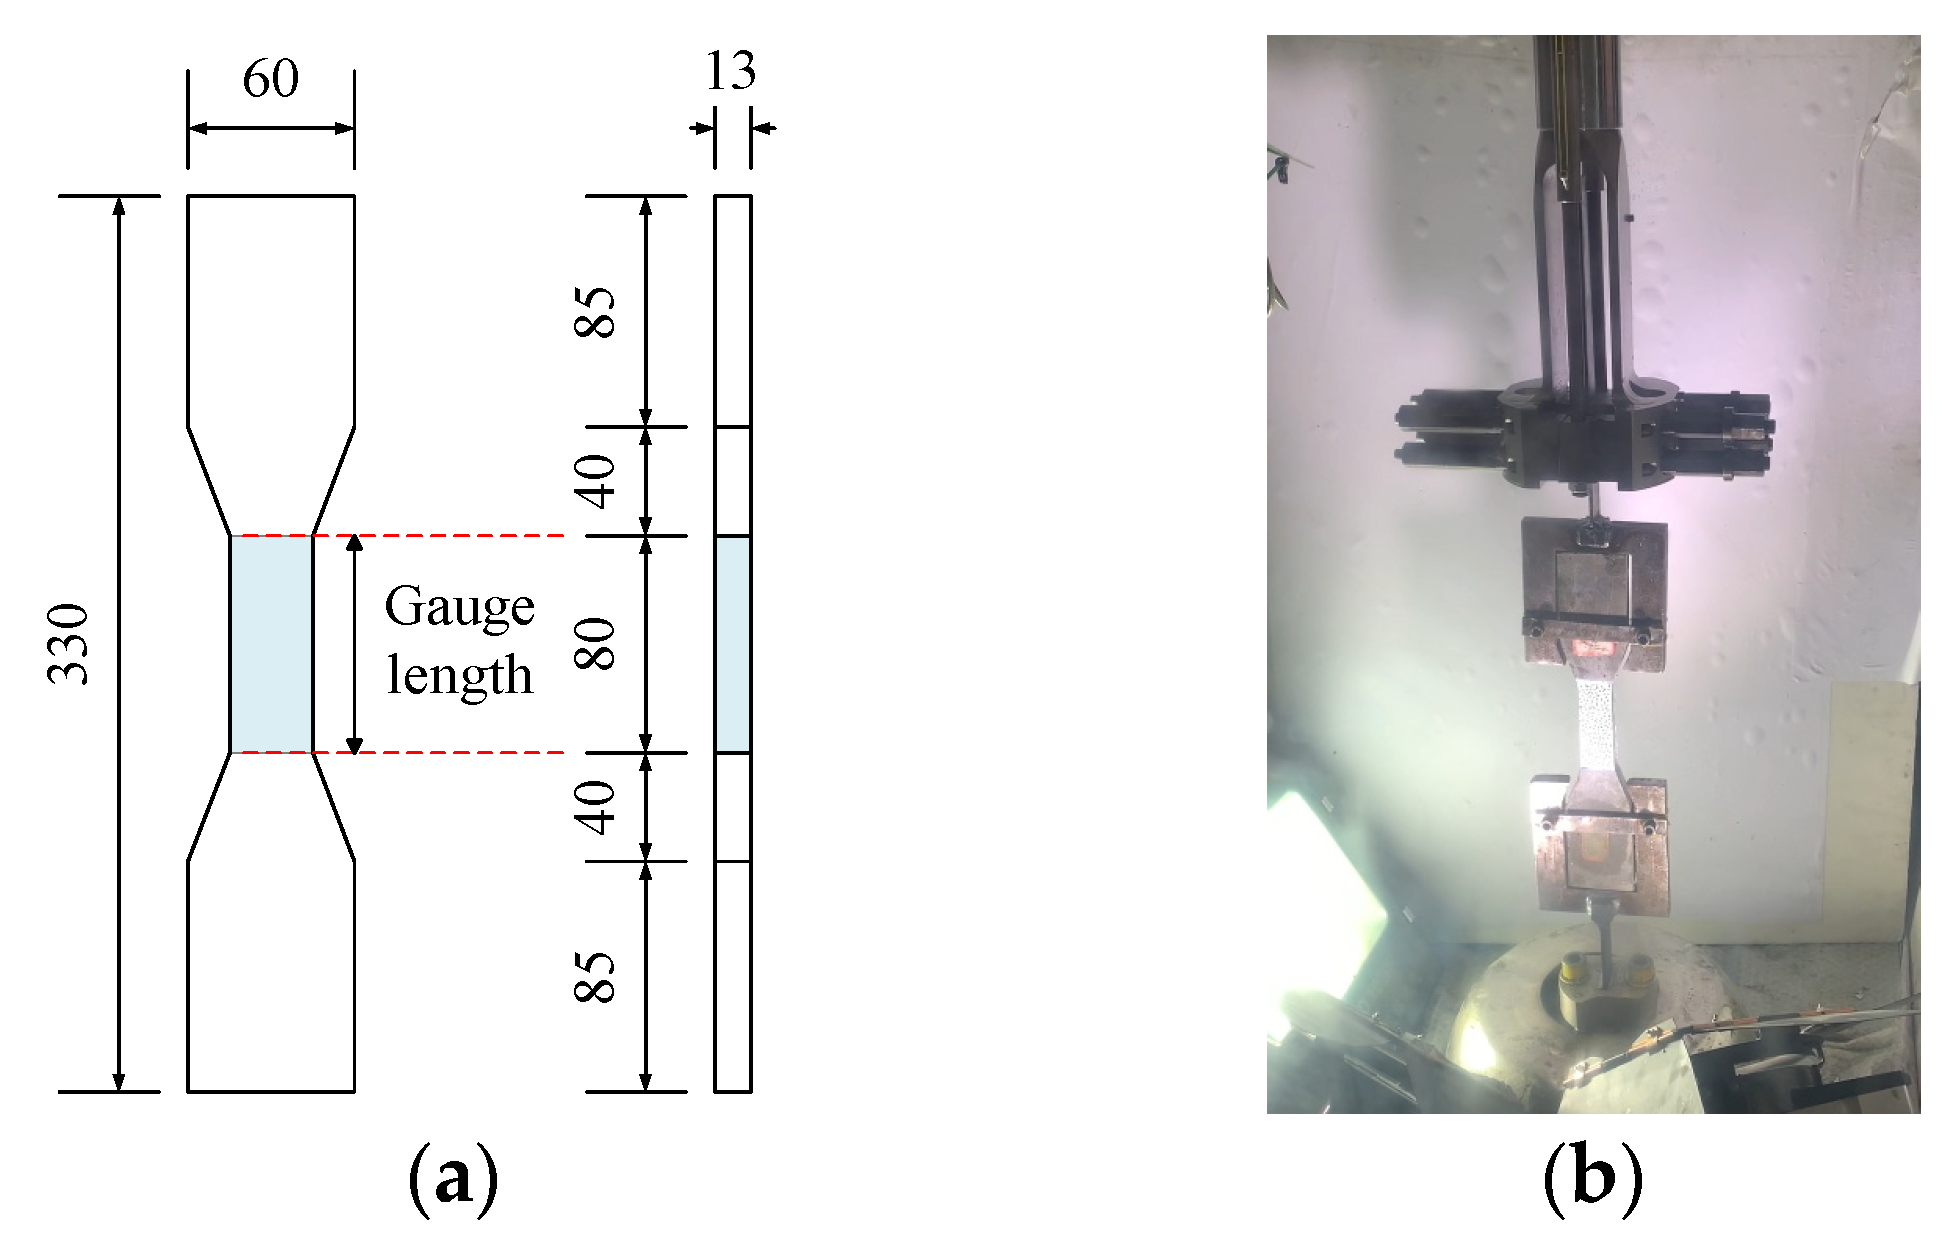
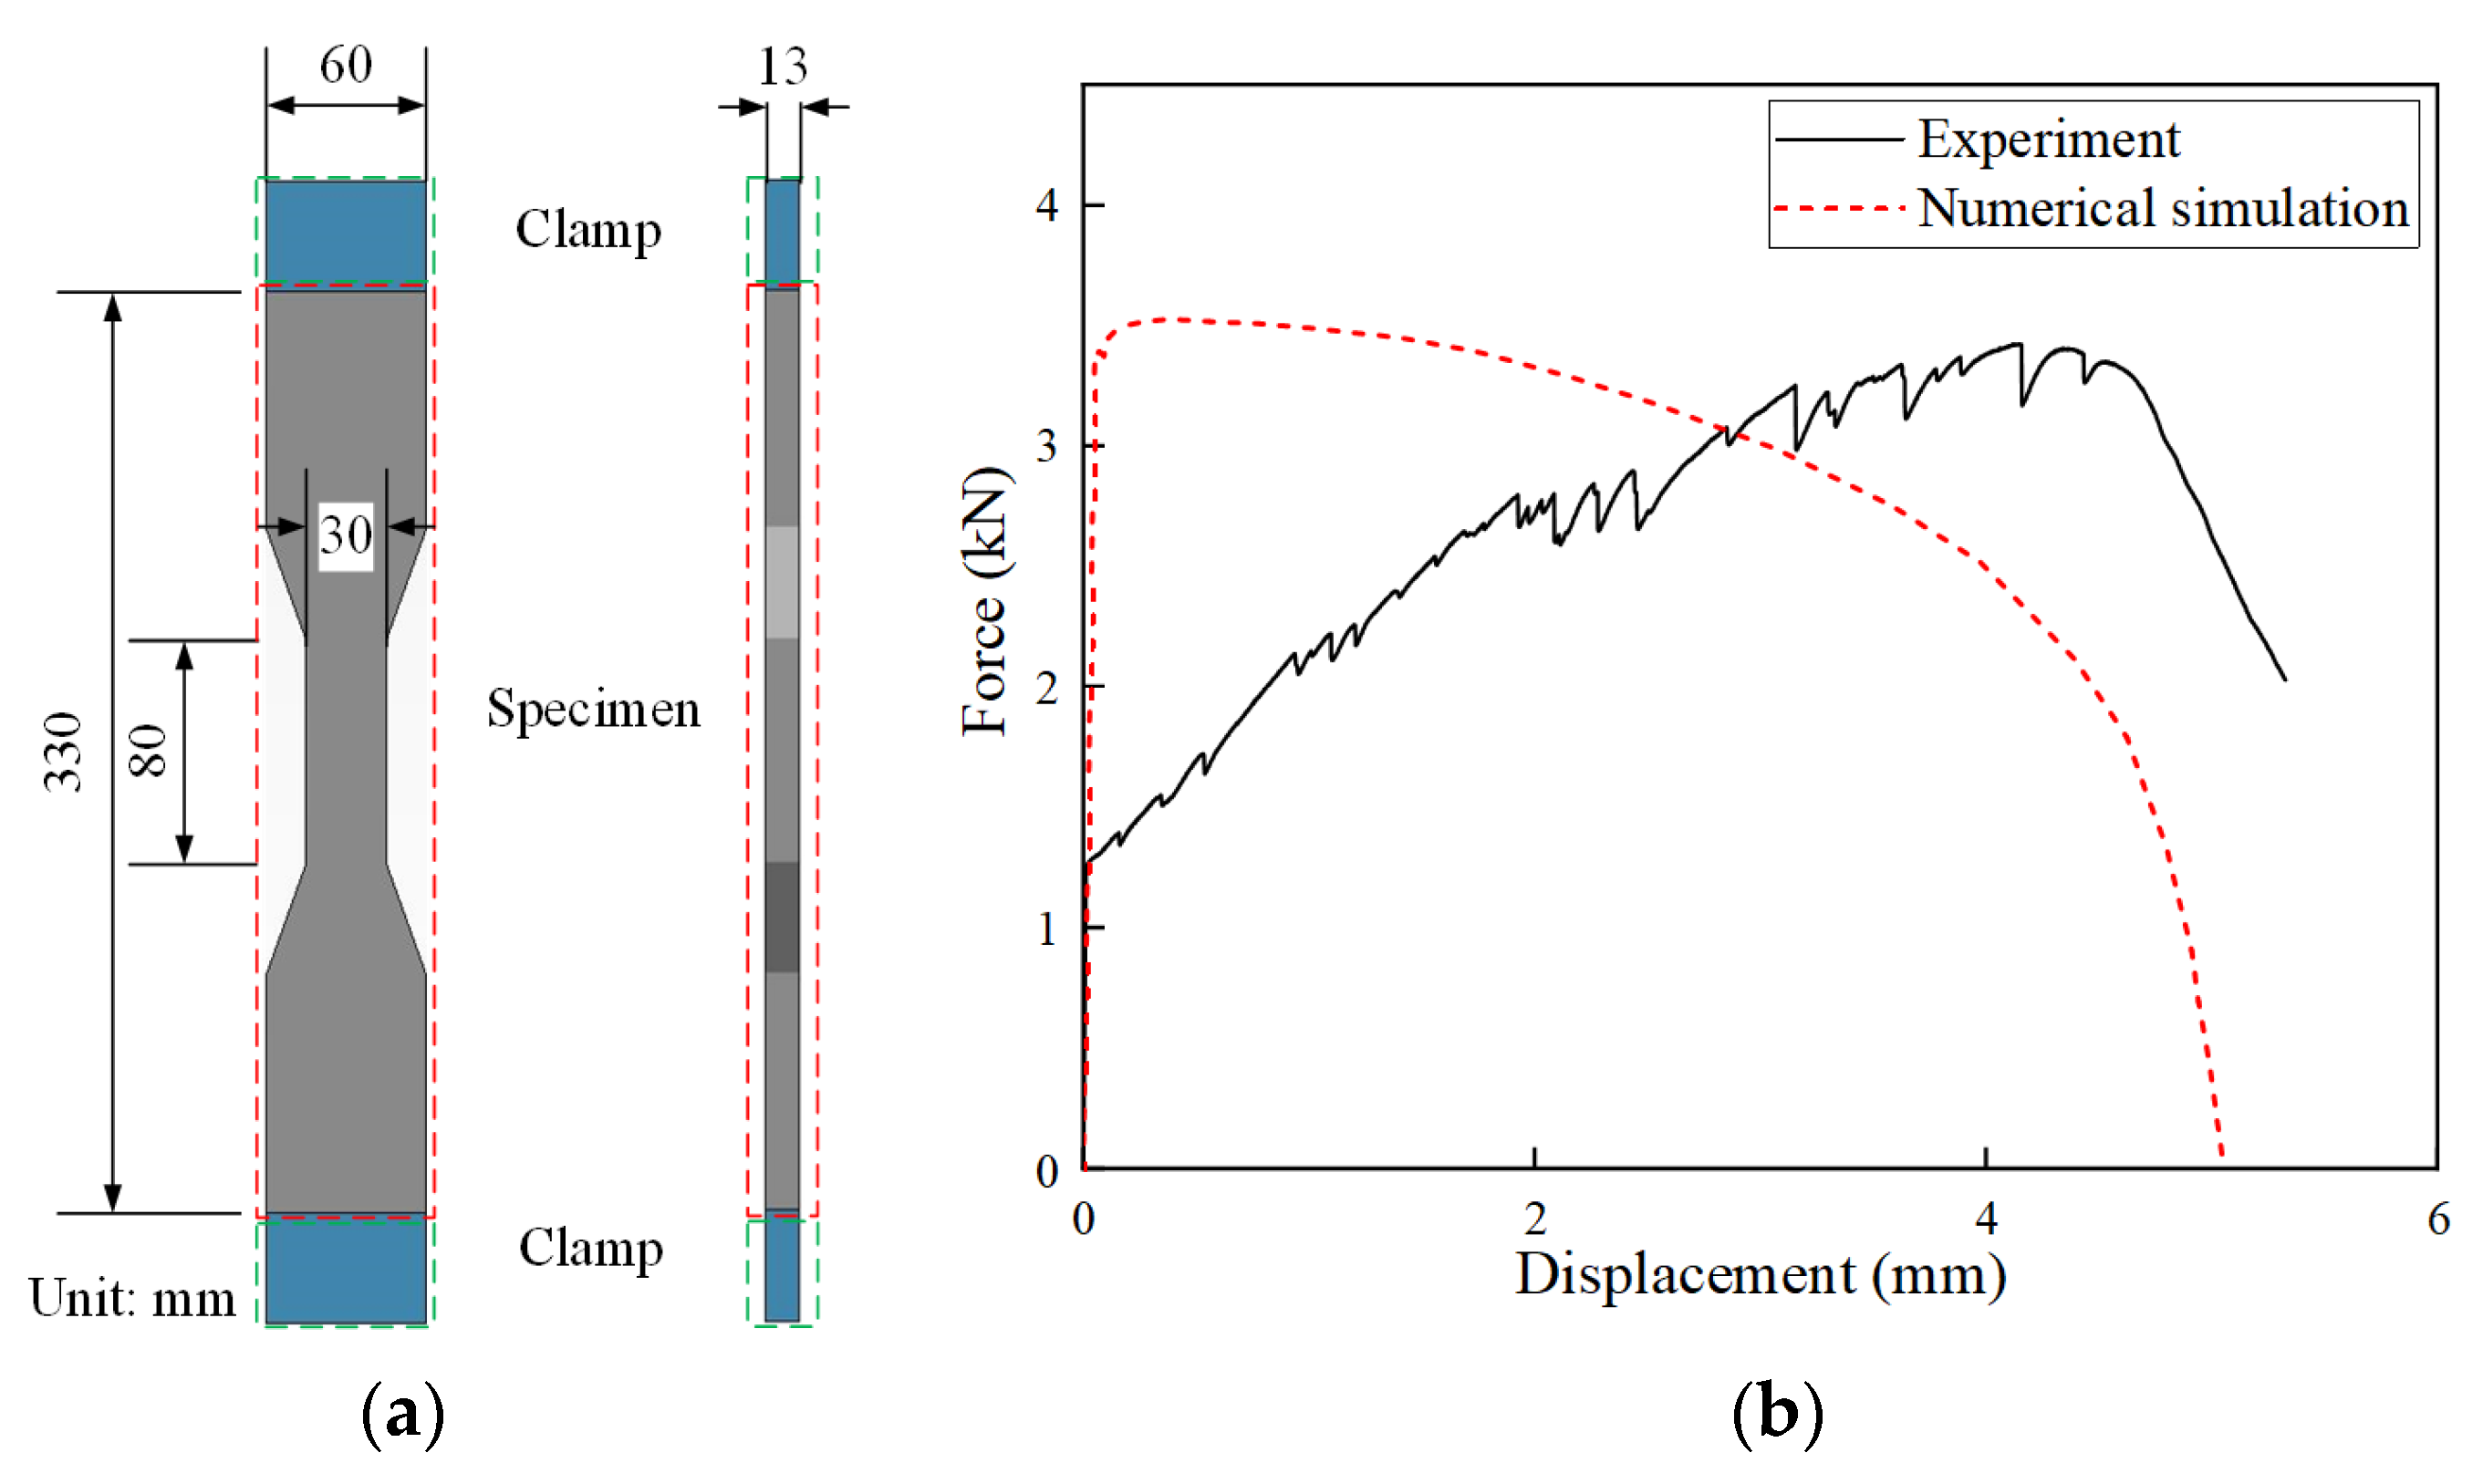
The ECC dog-bone specimens with a thickness of 13 mm, as shown in Figure 3a, were prepared for the dynamic tension test. The Japan Society of Civil Engineers specification was applied to the test [47]. In total, 4 strain rates were considered for each dog-bone specimen, and each test of any strain rate coupon-type combination was repeated 3 times, resulting in 12 specimens in total. The dynamic tension test was conducted with the Instron VHS 160-20 high-speed testing machine at Tianjin University (the maximum load = 100 kN, maximum data acquisition rate = 60 MHz), as shown in Figure 3b. Displacement loading was applied to control the tensile strain rate at 1/s, 10/s, 50/s, and 100/s.
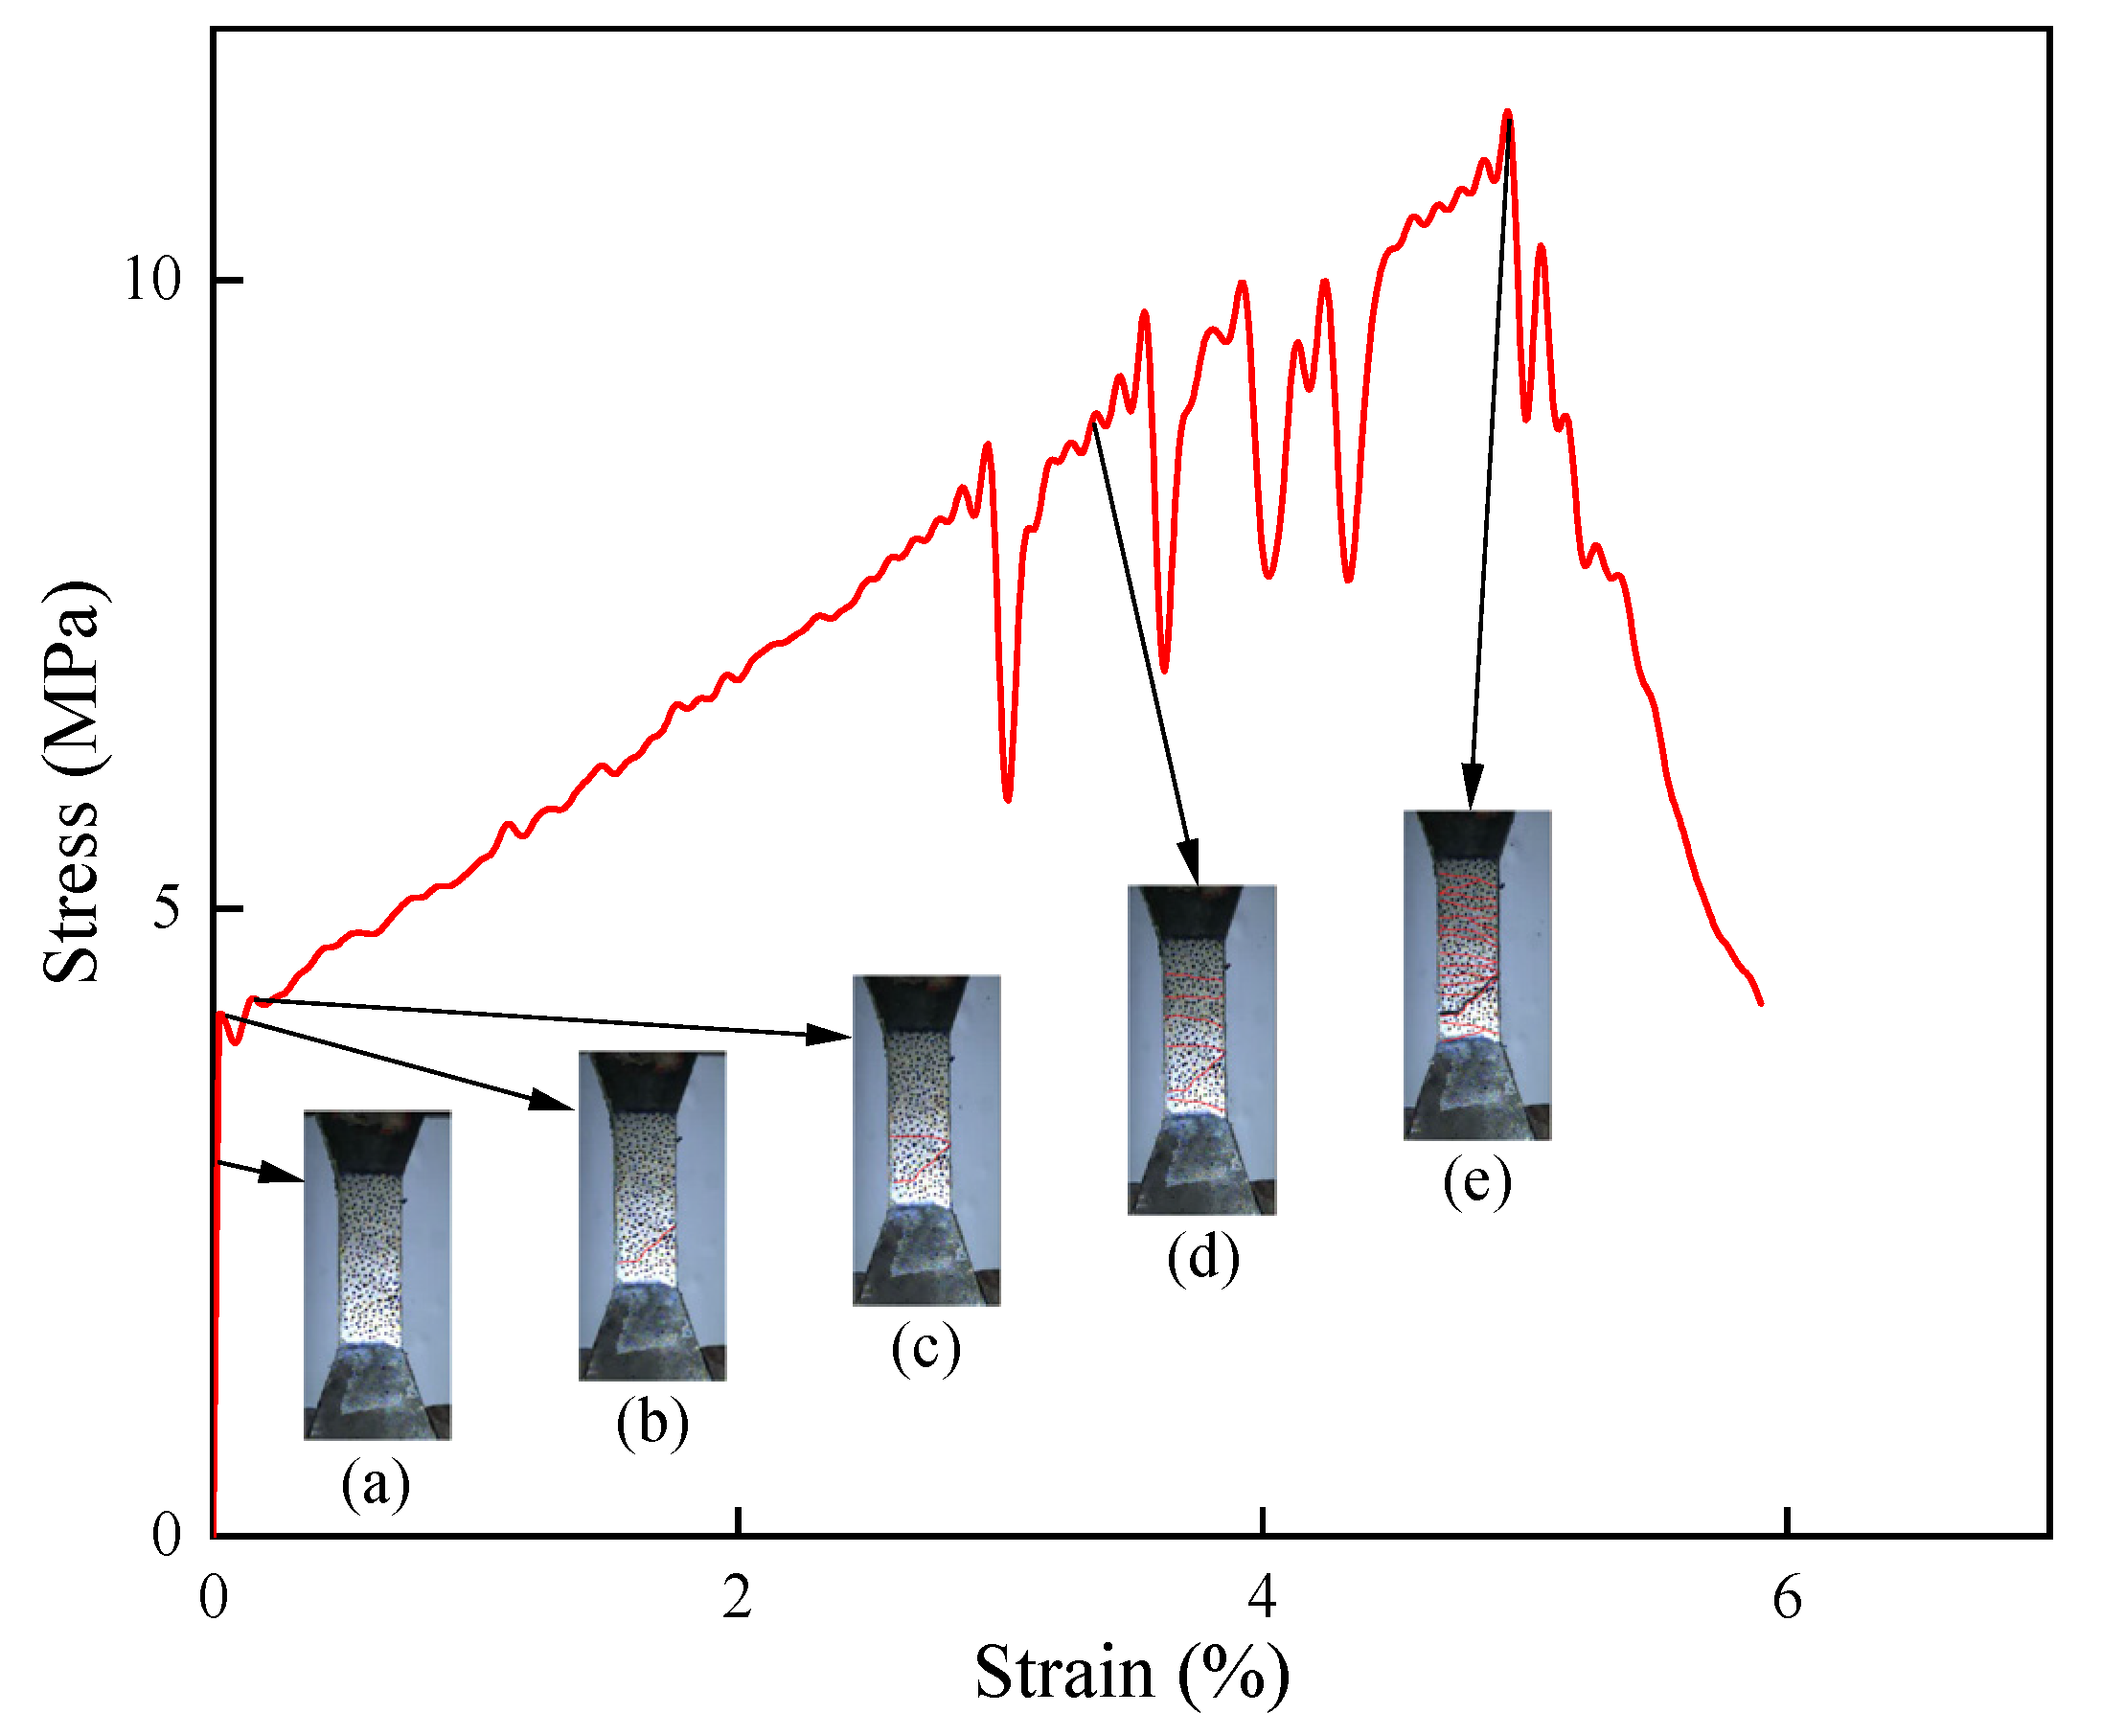
As shown in Figure 4, the tensile stress–strain relationship of ECC with the significant strain hardening process was observed, regardless of the strain rate. Take the case of strain rate 1/s, for instance; the stress–strain relationship with response mode is shown in Figure 4.
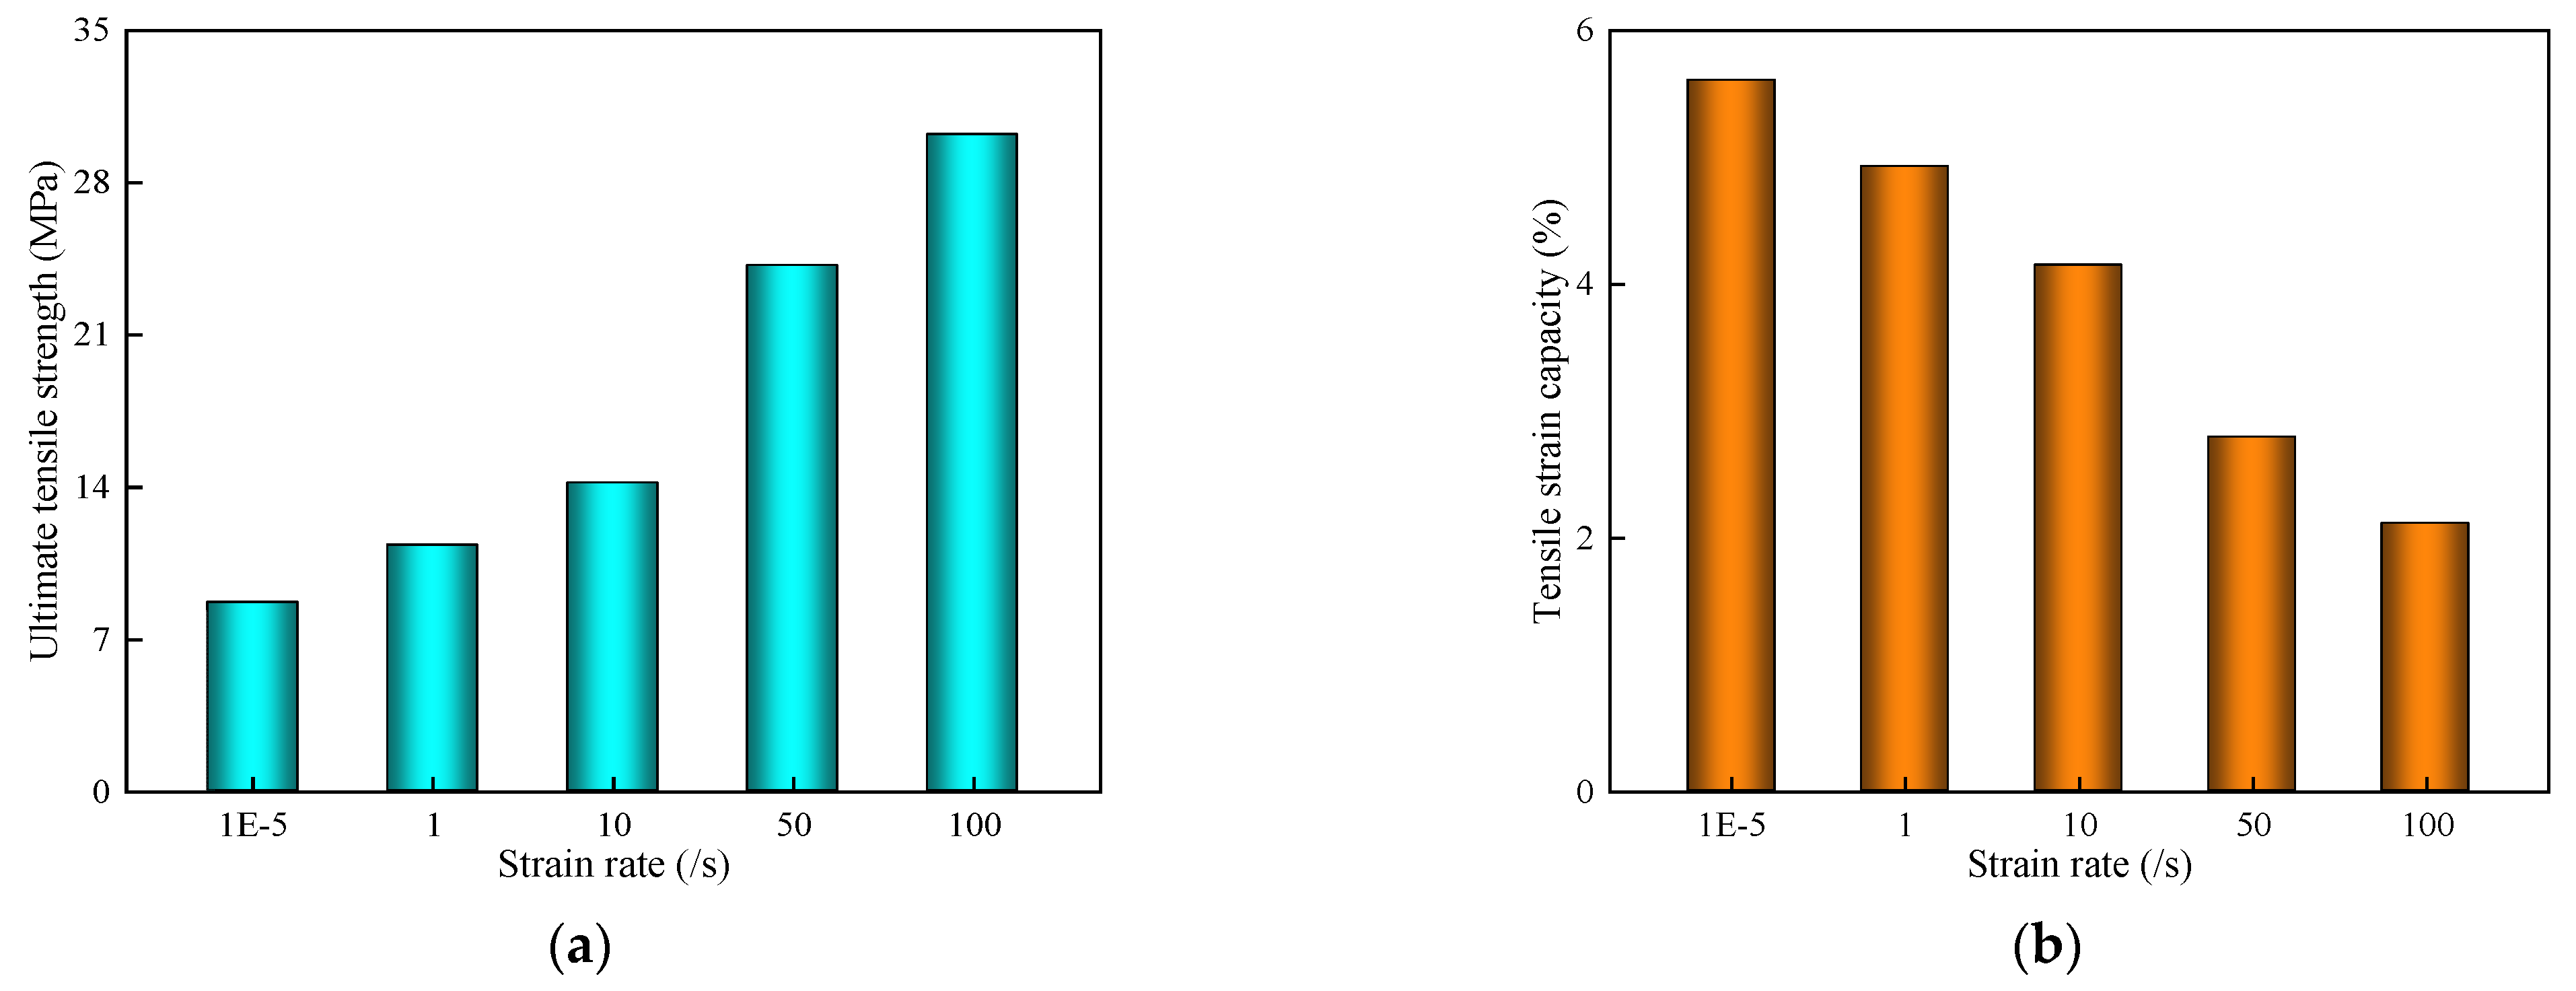
The ultimate tensile strengths and tensile strain capacity of ECC specimens with five different strain rates were obtained from ECC quasi-static and dynamic uniaxial tensile tests, as listed in Table 5 and shown in Figure 5.
It was observed that the stress–strain curve presented during the strain-hardening stage under quasi-static tensile loading exhibited relatively high ductility and low tensile strength. With increasing and up to relatively high strain rates, the ultimate tensile strength increases, and the tensile strain capacity decreases.
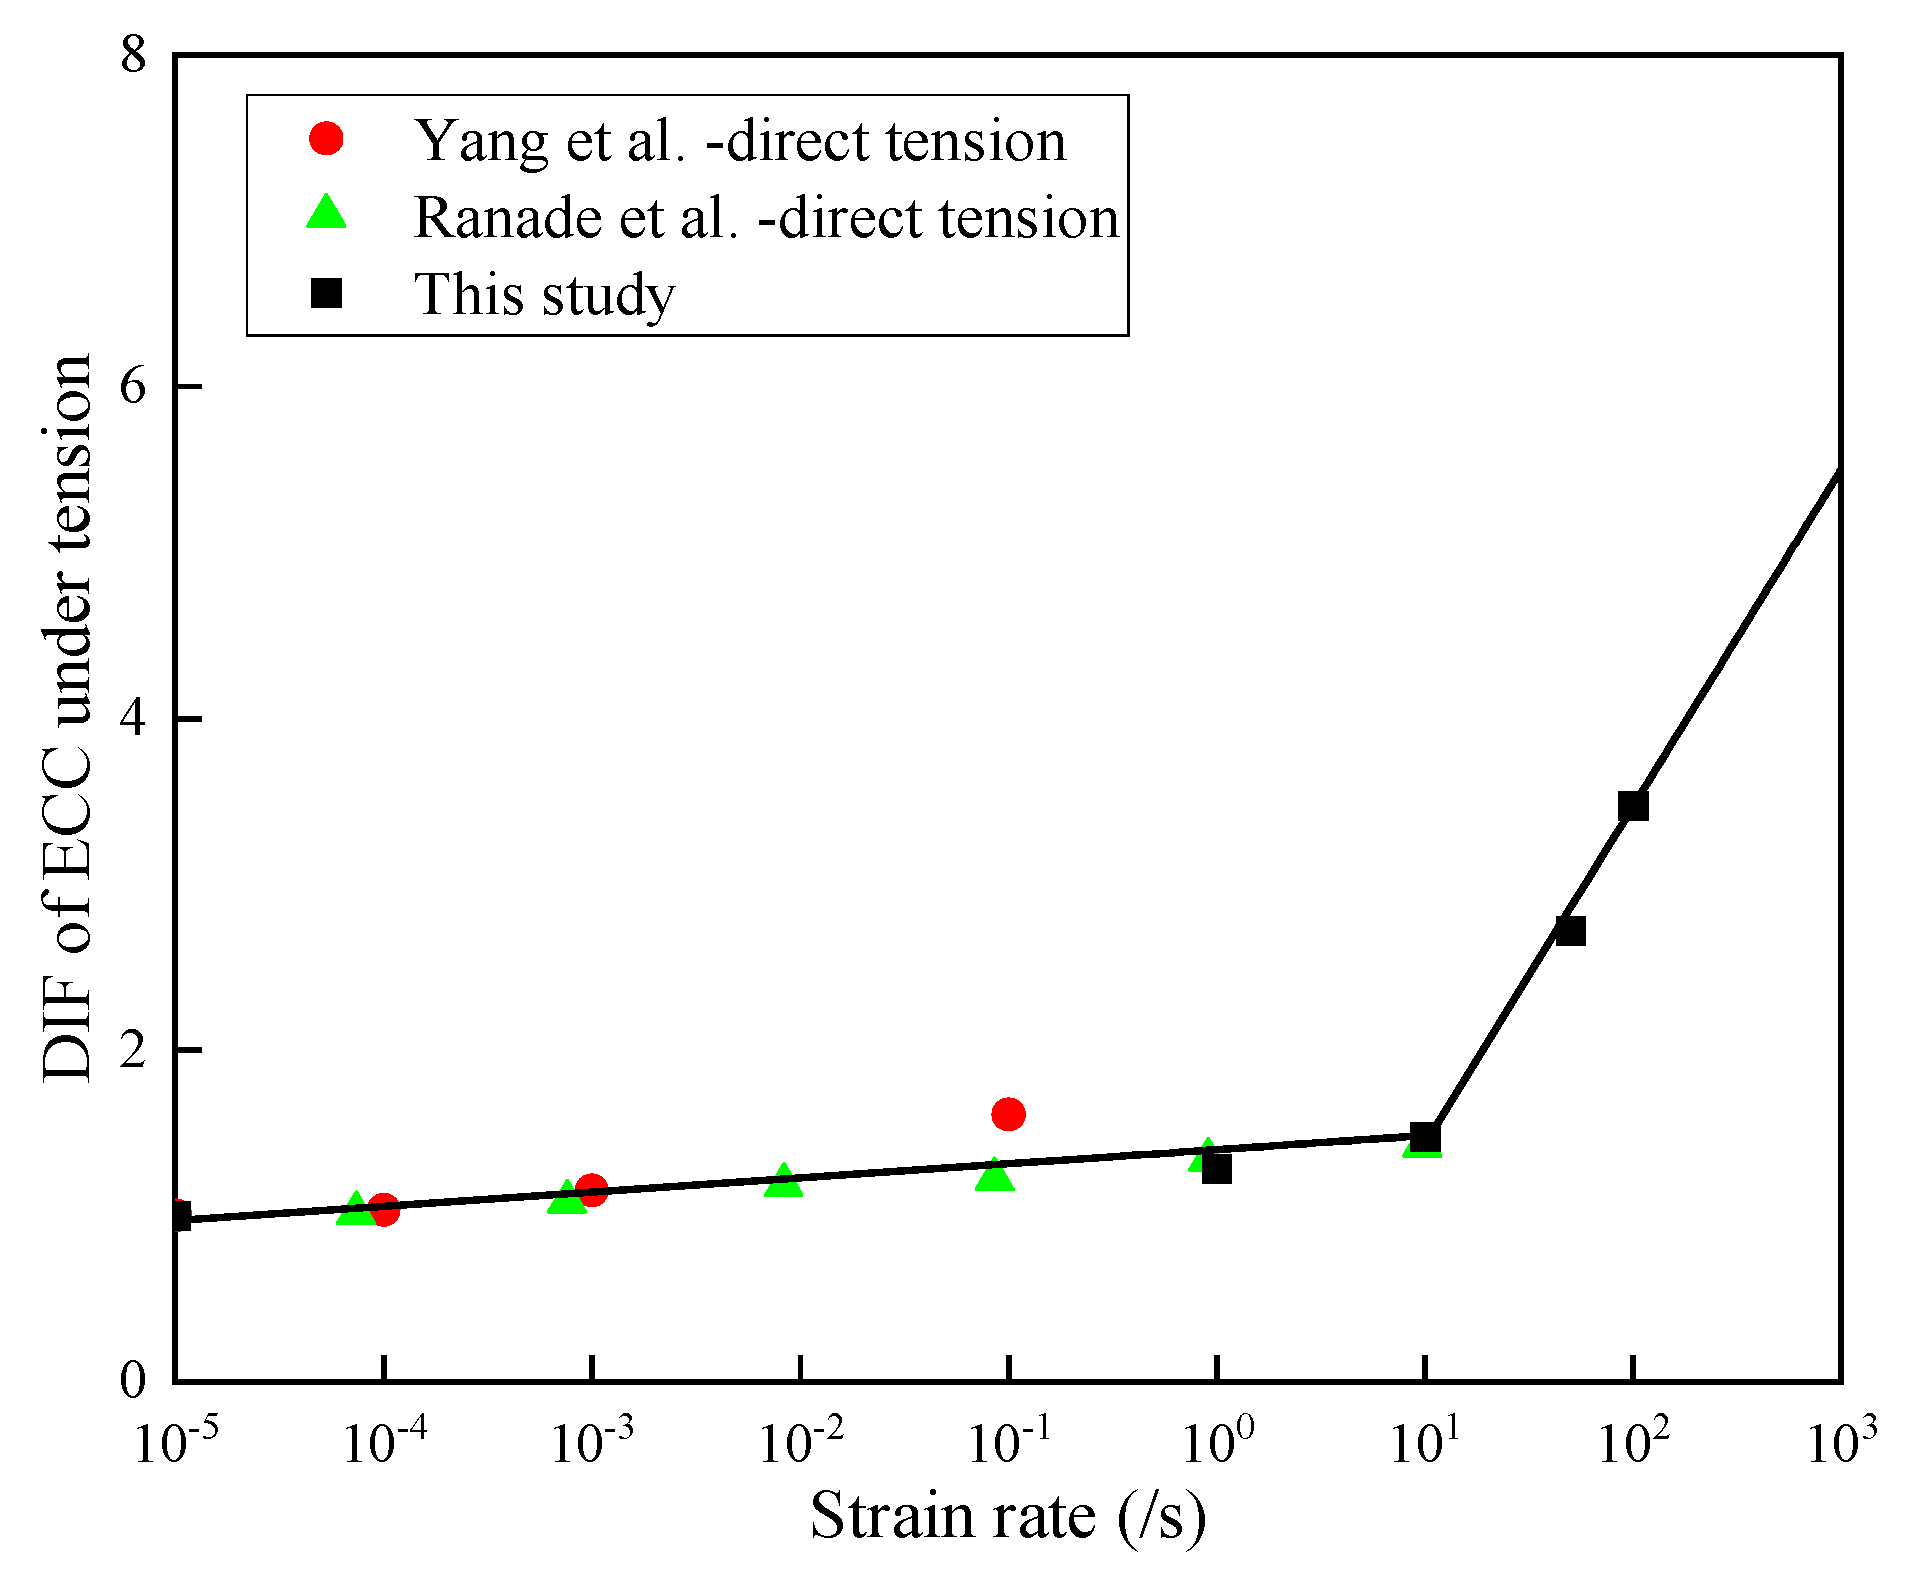
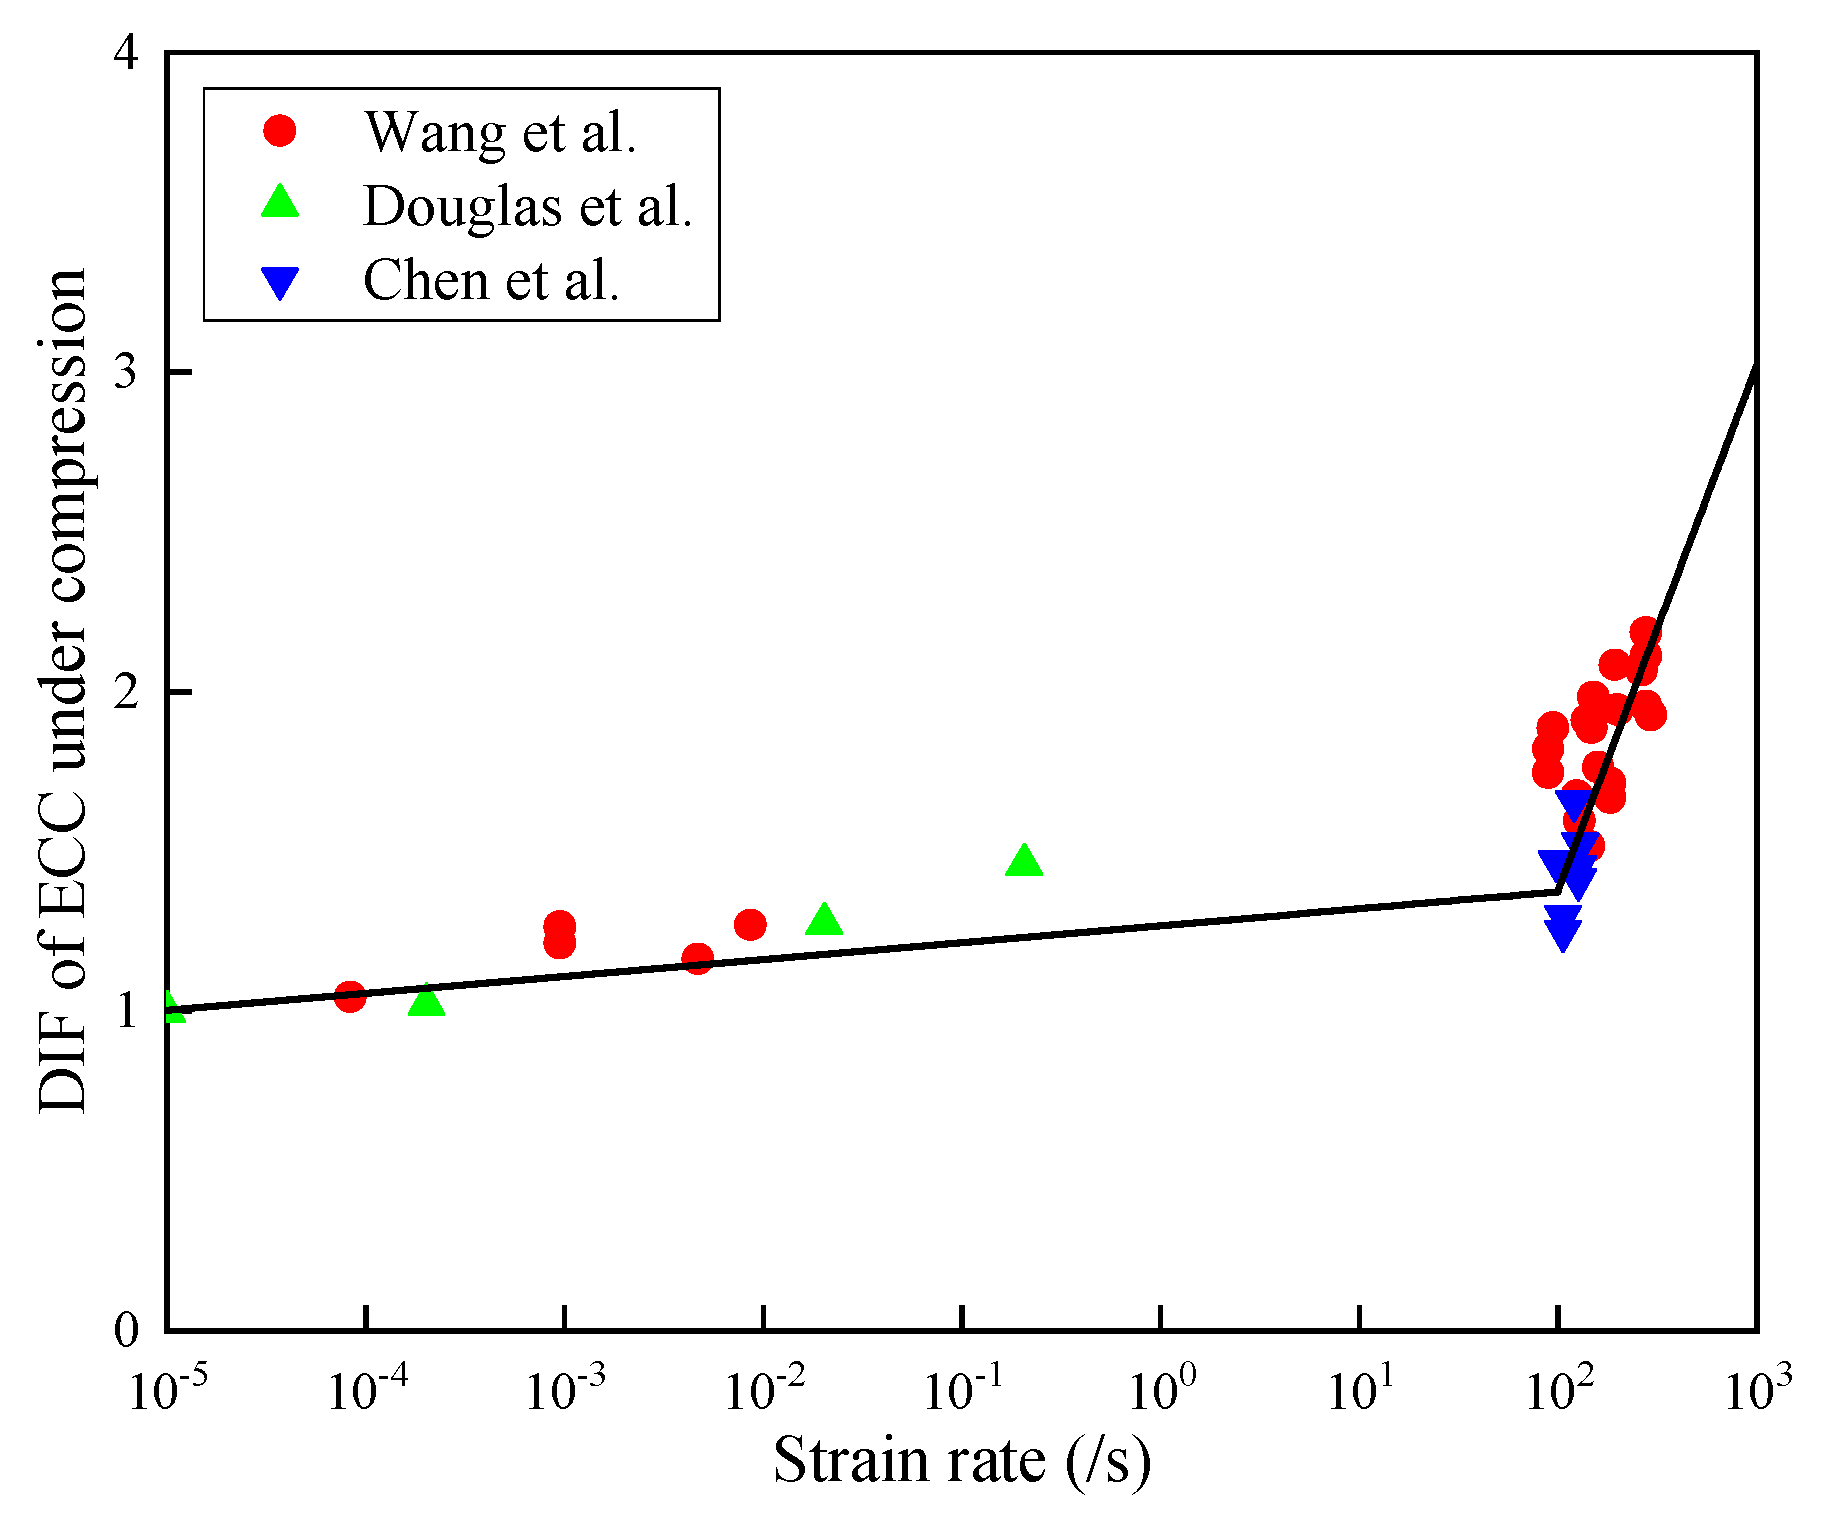
It was observed that the ultimate tensile strength and tensile strain capacity were significantly related to the strain rate effect by the above test results and previous studies [48,49] with the same test method. The dynamic increase factor (DIF) was calculated by the dynamic ultimate tensile strength divided by the ultimate tensile strength under quasi-static tension. With increasing strain rate, the DIF of ultimate tensile strength exhibited a slight increase under a relatively low strain rate. However, it increased rapidly under a relatively higher strain rate greater than 10/s, as shown in Figure 6. To this end, a bilinear function was employed to represent the tensile DIF of ECC.
3. Numerical Model and Validation of Low-Velocity Drop Weight Test
To further investigate the response of ECC-reinforced RC beams subjected to impact load, the impact test model was established with the finite element software ANSYS/LS-DYNA. First, the K&C model calibrated and validated with test data was applied to describe the behavior of ECC. Then, the impact test numerical models were validated by the drop weight test.
3.1. Numerical Model
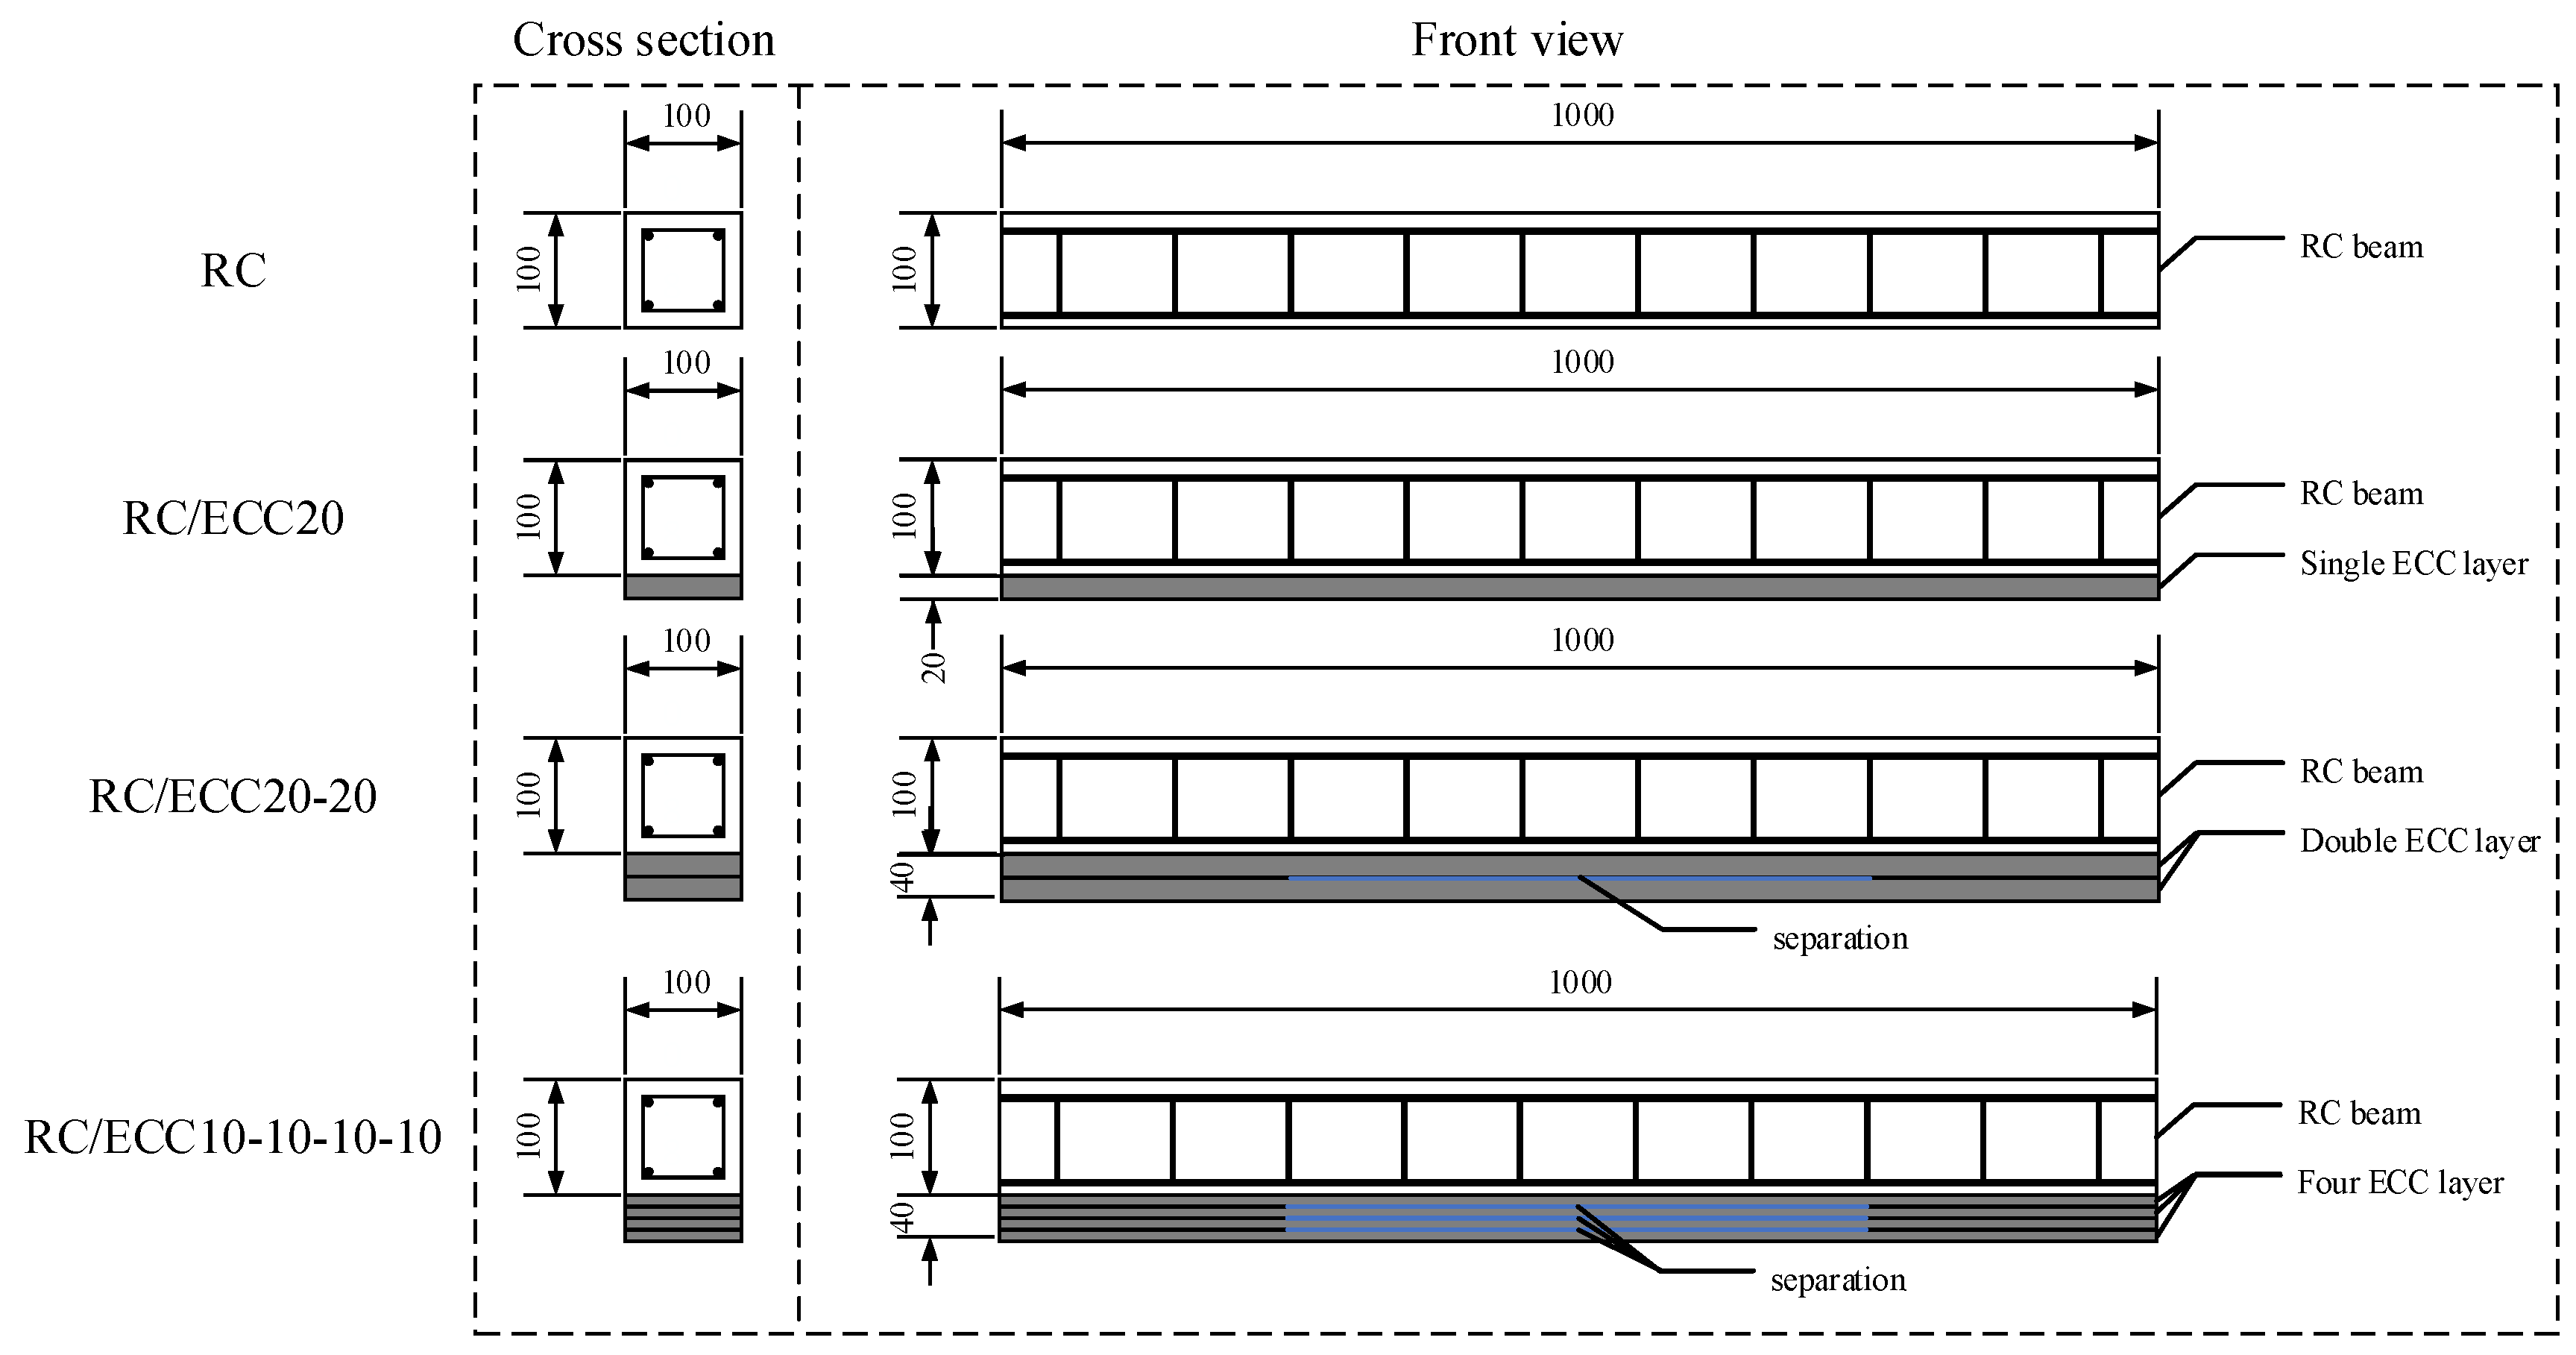
The thickness of the reinforcement layer and the reinforcement method were considered optimization parameters to design six members for the response investigation under low-velocity impact loading, as listed in Table 6. The C35 concrete and steel bar in Section 2.1 was applied on the RC beam, longitudinal steel bar HRB 335, diameter 8 mm, reinforcement rate 1.0%, double reinforcement rectangular section, hoop diameter 6 mm, spacing 100 mm. The cross-sectional dimensions of the RC beam were 100 mm × 100 mm (width × height), and the length of the beam was 1000 mm. When the ECC reinforcement layer was a single layer, the bonding properties were excellent between the ECC layer and the RC beam. This was because of ECC direct casting on the RC beam, which could be considered monolithic structure. When the ECC reinforcement layer was a separation layer reinforcement, the ECC layer and the RC beam bonded perfectly. However, a separation layer with a length of 500 mm was reserved between the ECC and ECC layer, which acts as a layered barrier; the details are shown in Figure 7.
3.1.1. Description of Numerical Model
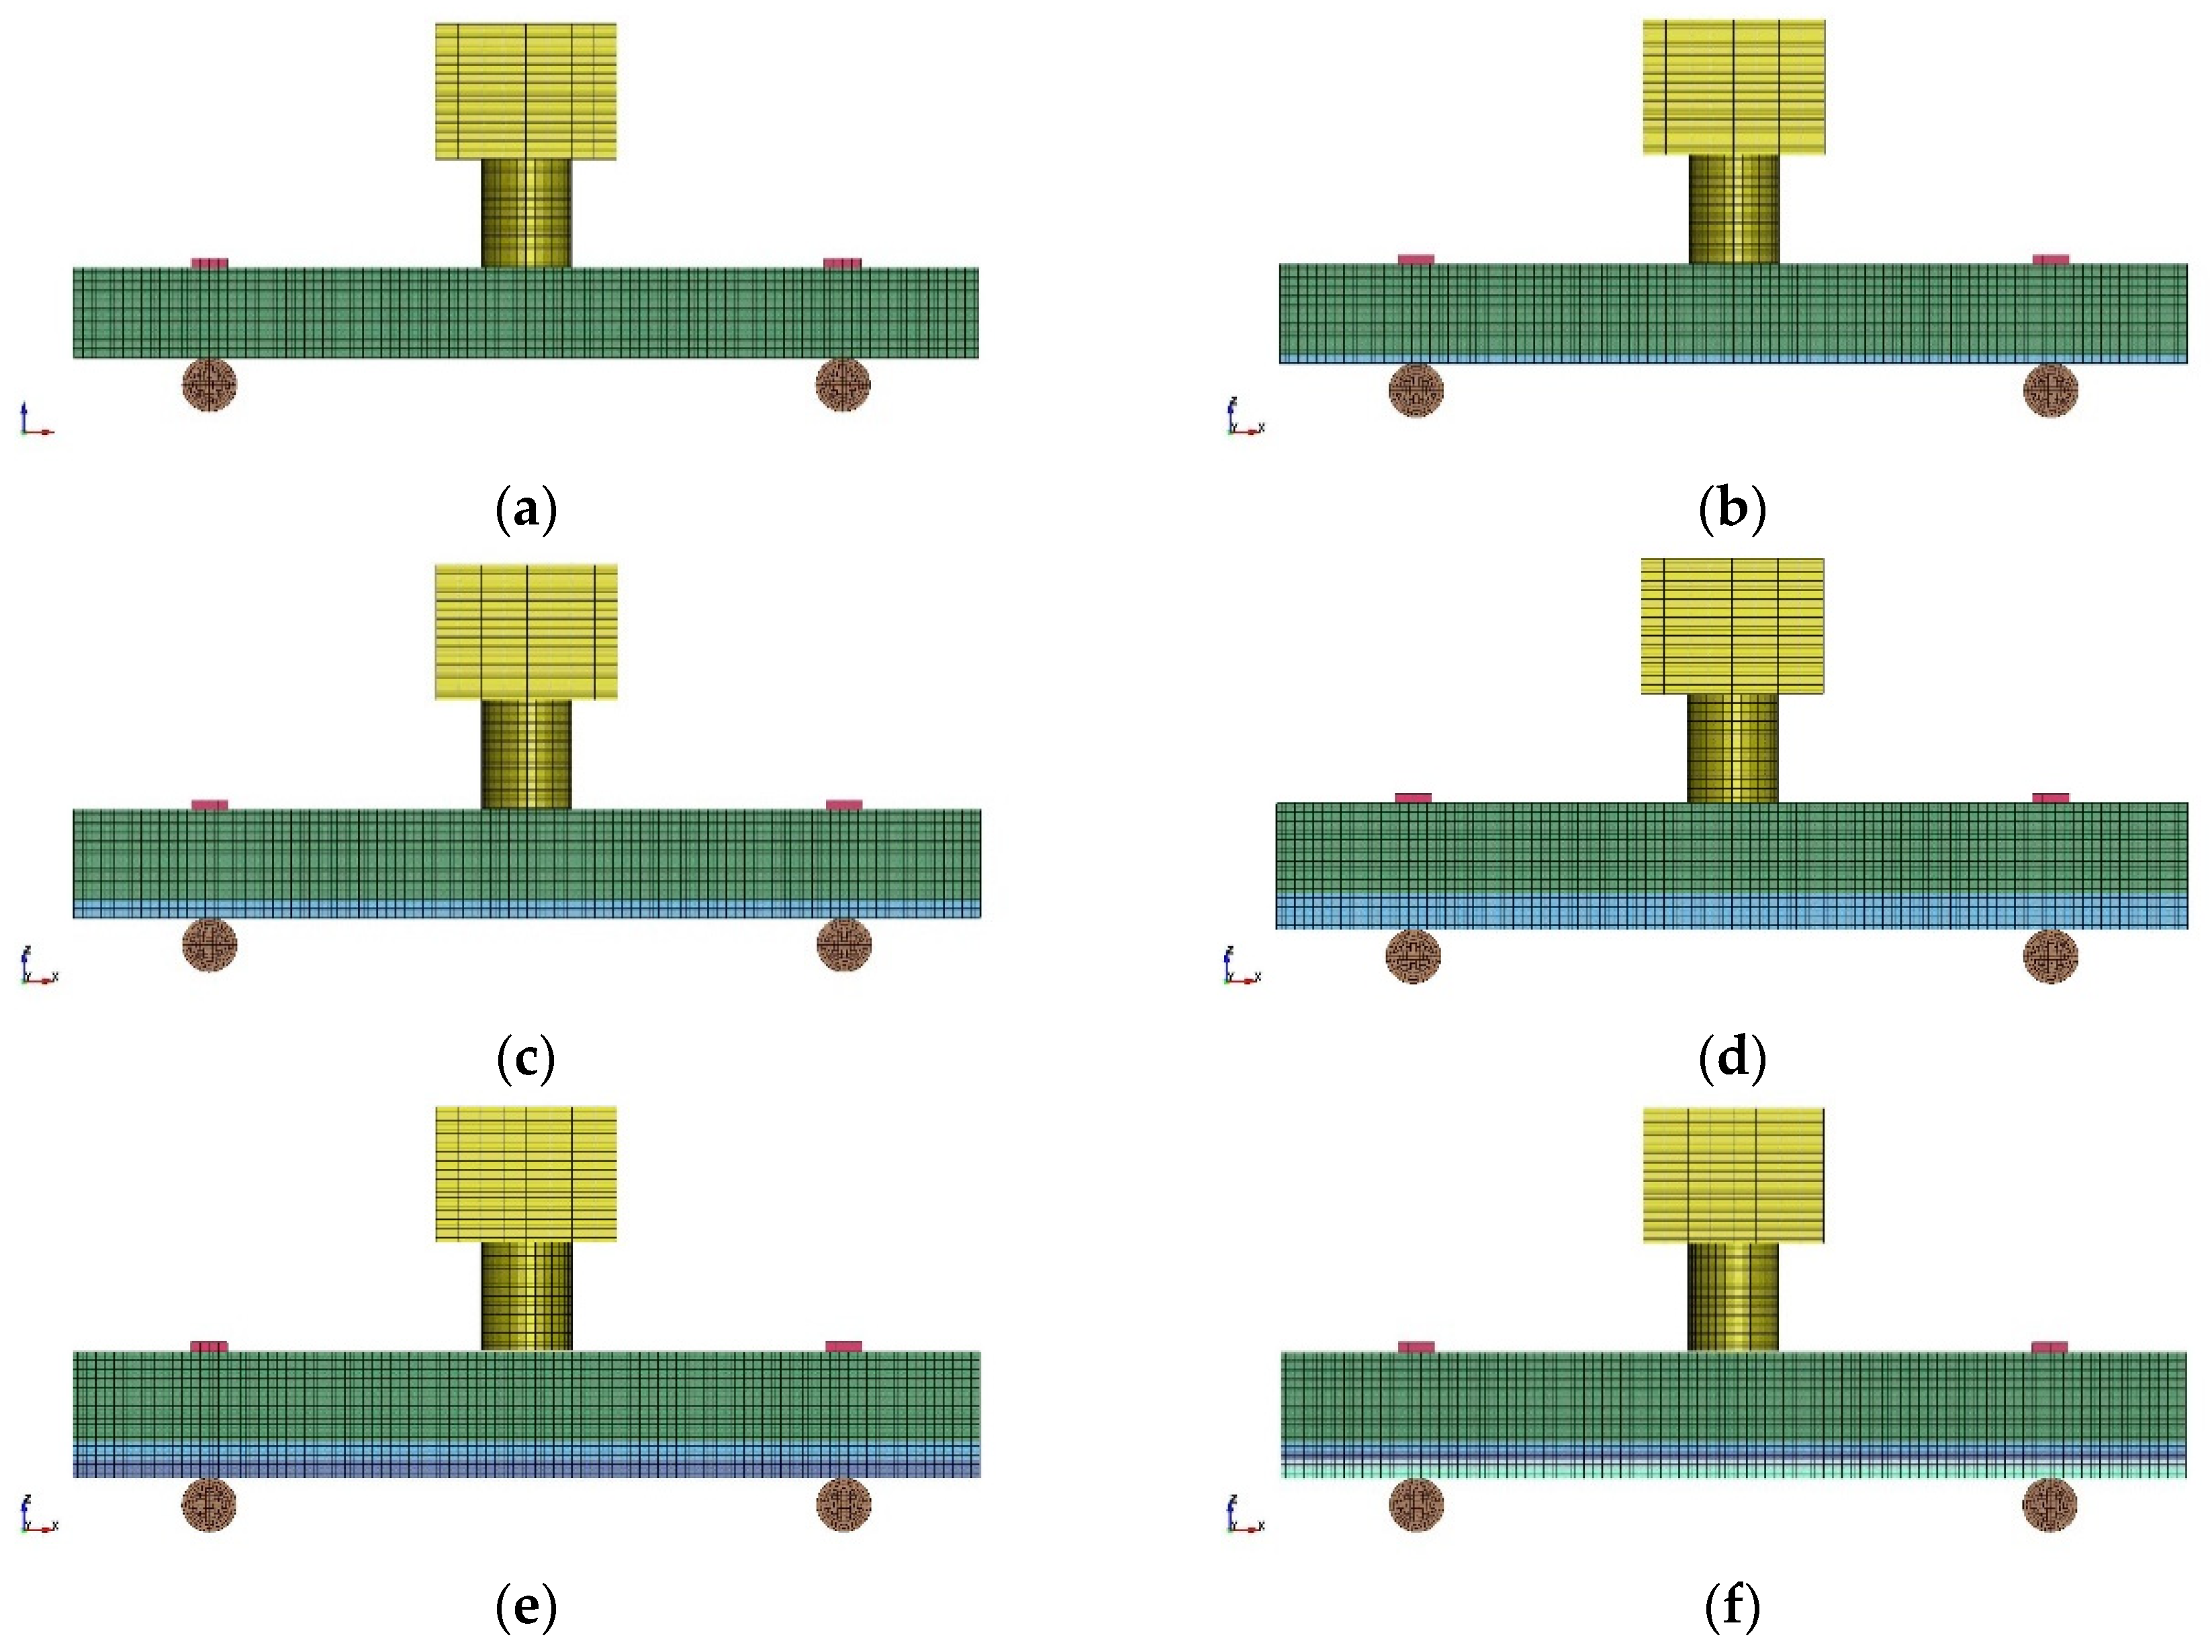
The three-dimensional numerical models of the RC beam, the RC/ECC10 beam, the RC/ECC20 beam, the RC/ECC40 beam, the RC/ECC20-20 beam, and the RC/ECC10-10-10-10 beam subjected to the impact load are illustrated in Figure 8. The numerical model consisted of three parts: the drop hummer, the supports, and the specimen. The flat hummer was adopted, and a 200 mm × 200 mm × 160 mm steel block was used to characterize the hummer. To more accurately simulate the constrained boundary in the impact test, 2 cylindrical supports were established to ensure an effective span of 700 mm. The specimen was placed on the cylindrical support, and a 100 mm × 50 mm × 10 mm steel block was established above the specimen to achieve the constraint condition of solid support on both sides. The contact AUTOMATIC_NODE_TO_SURFACE was applied between the cylindrical support and the specimen. The contact AUTOMATIC_SURFACE_TO_SURFACE was applied between the constraint steel block and the specimen.
The concrete and ECC in the beam meshed with the Solid 164 element, while the rebar in the RC beam and the RC/ECC beam meshed with the BEAM 161 element. According to previous studies, the sliding effect between the reinforcement and concrete under low-velocity impact loading was slight since the coupling of concrete and rebar in the RC beam or the RC/ECC beam was realized by sharing common nodes. The contact AUTOMATIC_SURFACE_TO_SURFACE was applied to describe the separation ECC reinforcement layer, while the contact between the RC beam and the ECC reinforcement layer shared the common nodes. Mesh sensitivity testing for different mesh sizes was conducted. The 5 mm mesh size was applied to all the components in the numerical model to balance computational accuracy and efficiency.
3.1.2. Material Model
In the present study, MAT_PLASTIC_KINEMATIC was employed to model steel. This was suitable for modeling the isotropic and kinematic hardening plasticity incorporating the strain rate effect with the Cowper–Symonds model. Table 7 details the parameters obtained by quasi-static and dynamic loading.
The K&C model (MAT_072R3) in ANSYS/LS-DYNA was applied to represent concrete, which was capable of capturing complex concrete behavior in the structural response under impact and blast loading with adequate accuracy. Some of the model parameters were automatically generated based on the unconfined compressive strength of concrete, and the strain rate effect was considered. In addition, the three “strength surfaces” that changed shape with hydrostatic pressure were defined. Finally, damage parameters were defined to control the damage from tension and compression.
Although the parameters automatically generated in ANSYS/LS-DYNA were able to reasonably represent the dynamic response of concrete, they were unable to capture the behavior of ECC. To this end, the K&C model (MAT_072R3) had to be calibrated to describe the ECC material. Three strength surfaces, including the yield strength, ultimate strength surface, and residual strength surface, were introduced to the K&C model to describe the change mechanisms of the yield strength, ultimate strength, and residual strength of the ECC:
where aiy, aim, and air (i = 1, 2, 3) are the strength surface parameters determined by test data of the triaxial compression test. P denotes the hydrostatic pressure. , where Δσ denotes the equivalent stress, and J2 denotes the second invariant of the deviatoric stress tensor.
The damage evolution of the ECC in the K&C model was obtained from linear interpolation between the loading surface. Firstly, the ECC was not damaged until the yield surface was reached. As the loading continued to increase beyond the yield strength, accompanying the observed strain-hardening behavior, the damage evolution was determined by linear interpolation between the initial yield surface and the ultimate strength surface. After that, with continued loading, the material underwent softening, corresponding to the change in strength surface from the ultimate surface to the residual surface with interpolation. The pressure-dependent yield surface function γ is as follows:
where rf denotes the dynamic increase factor, η is the damage evolution function varying from 0.0 to 1.0, and λ denotes the accumulated effective plastic strain to describe the damage effect on the material behavior. In the K&C model, the function was realized by inputting thirteen (λ, η) pairs, while for the values not provided by the data sets, the associated value of η was obtained by interpolation, as listed in Table 8. The transition from strain hardening to softening was denoted by λ = λm, where η = 1.
The dynamic tensile behavior of ECC is described in Section 2.2, and its dynamic compression behavior is characterized by Equation (7) and Figure 9. It was noted that the DIFc was consistent for different groups of tests and thus could be considered reasonable.
The parameters of damage evolution in tension and compression were calculated as follows:
where denotes the increment of effective plastic strain. ft is the tensile strength, and b1 and b2 are the parameters controlling the ECC softening behavior after peak stress under uniaxial compression and tension. The EOS-8 in the K&C model was applied to describe ECC, in which the pressure–volume relationship was expressed by
where C(μ) denotes the tabulated pressure evaluated along a 0 K isotherm as a function of the volumetric strain. θ(μ) denotes the tabulated temperature-related parameter as a function of volumetric strain, whose parameters are listed in Table 9.
3.2. Validation of the Numerical Model
To validate the concrete and ECC constitutive model and the model methodology employed in the present study, the simulation results were compared with the corresponding test data of ECC specimens, and RC beams with and without the ECC strengthening layer subjected to drop weight impact.
3.2.1. Concrete Constitutive Model
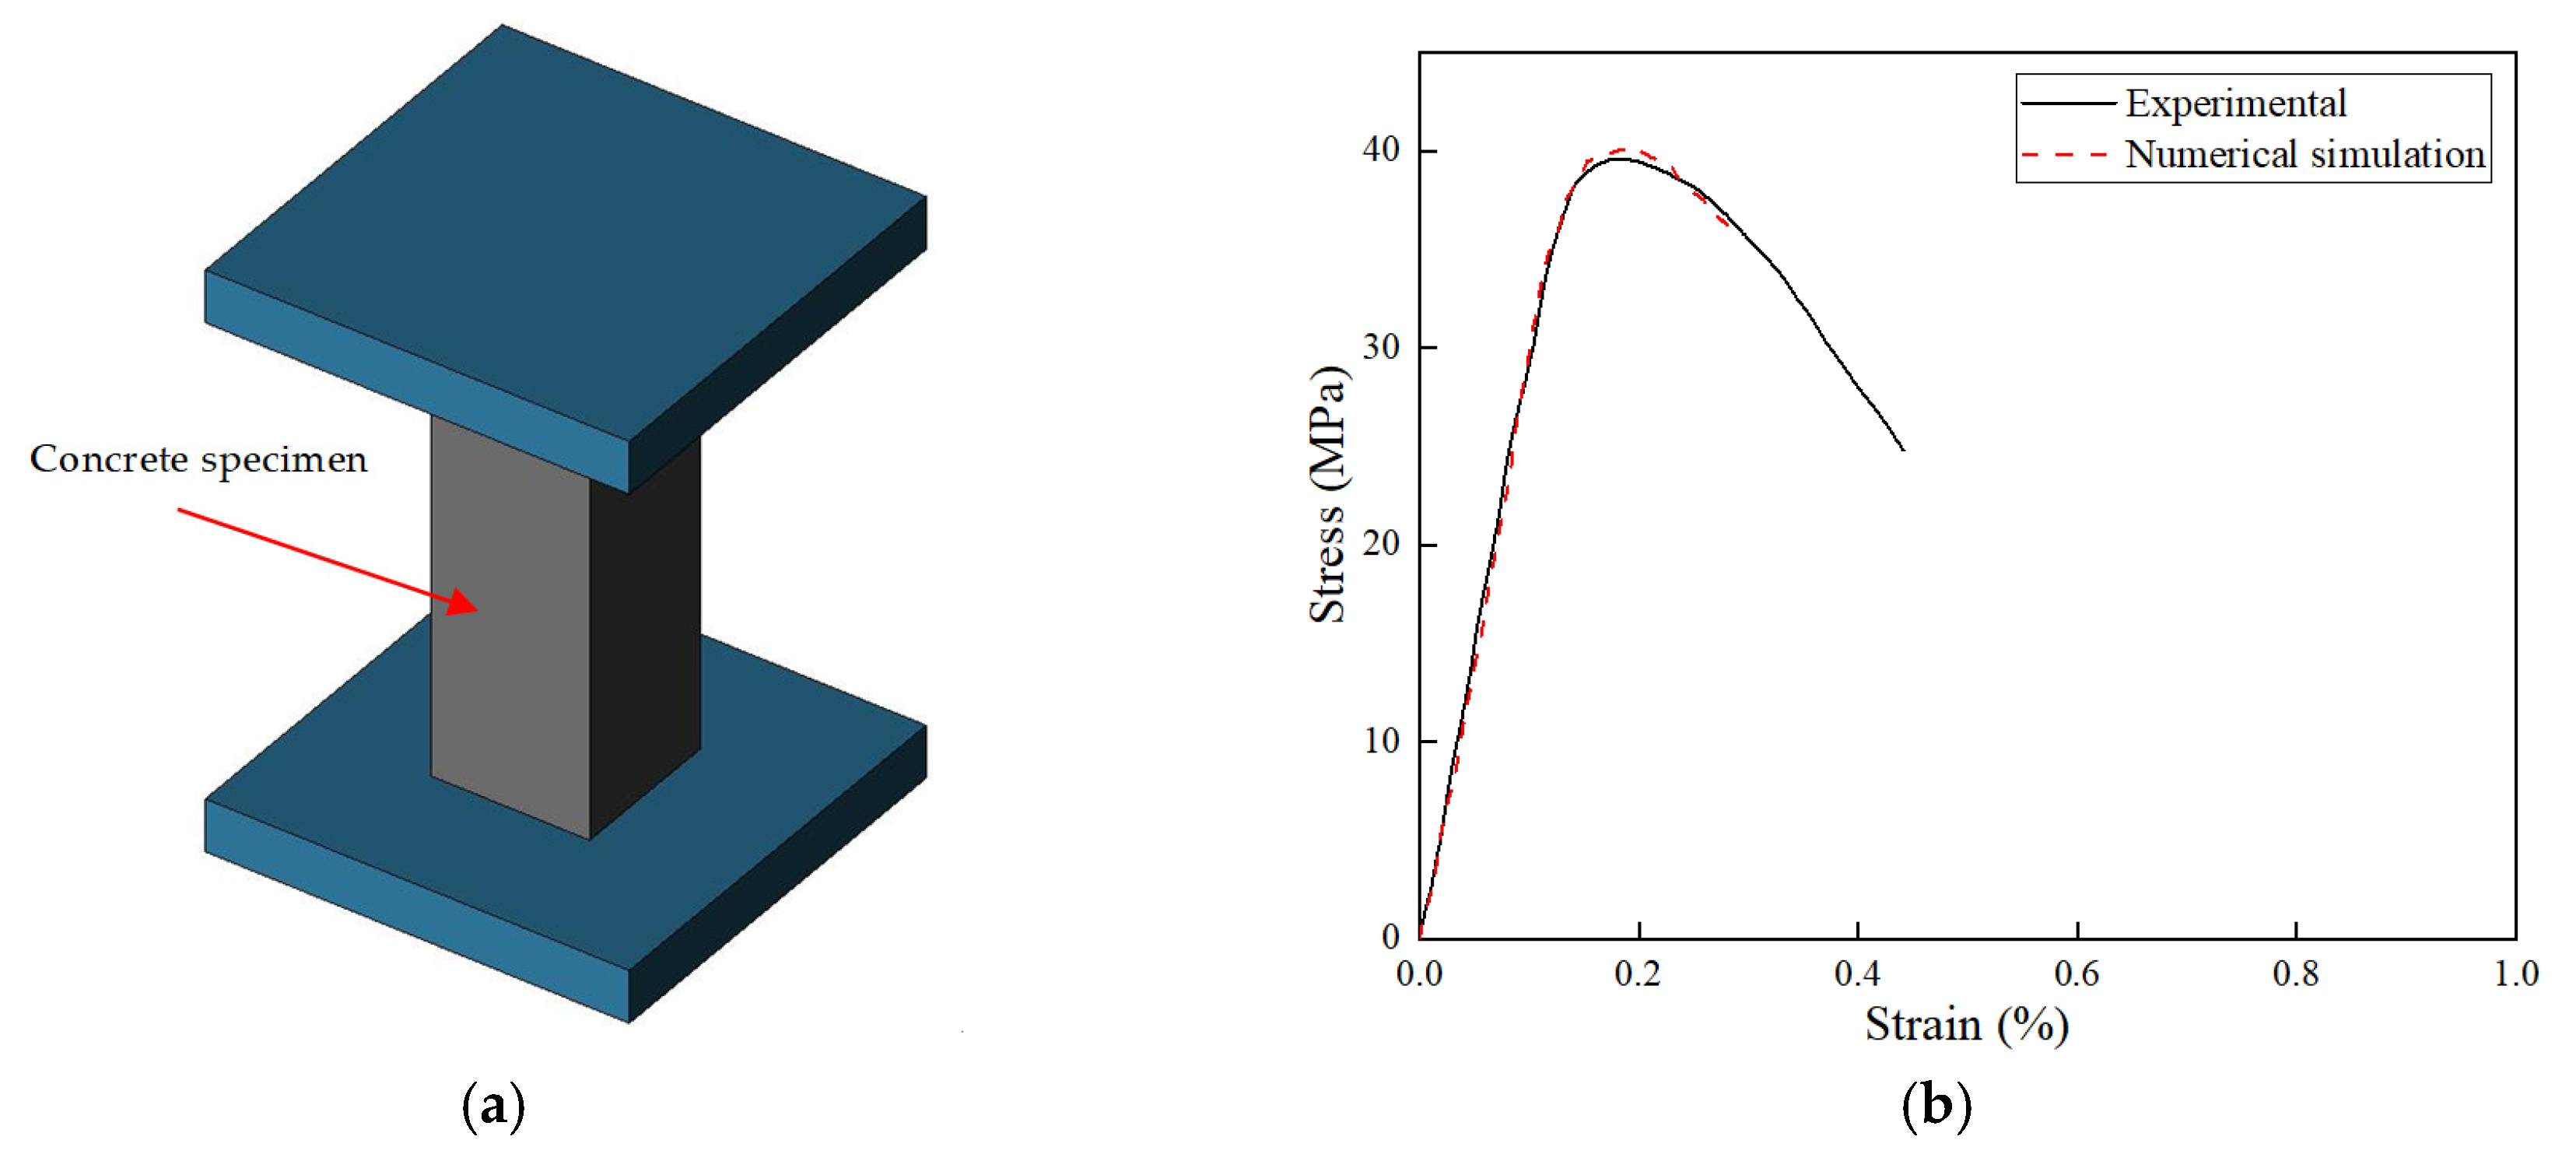
The uniaxial compression test of a concrete specimen was simulated. A concrete specimen of dimensions 150 mm × 150 mm × 450 mm was modeled, and the specimen was sandwiched between 2 steel plates, as shown in Figure 10a. The translation and rotation of the bottom steel plate were completely restrained, while the top steel plate compressed the cube at a rate of 5 mm/min. The concrete specimen and steel plate were meshed with the solid 164 element of 5 mm size. It was found that the stress–strain relationship of numerical simulation favorably agreed with the test data, as shown in Figure 10b.
3.2.2. ECC Constitutive Model
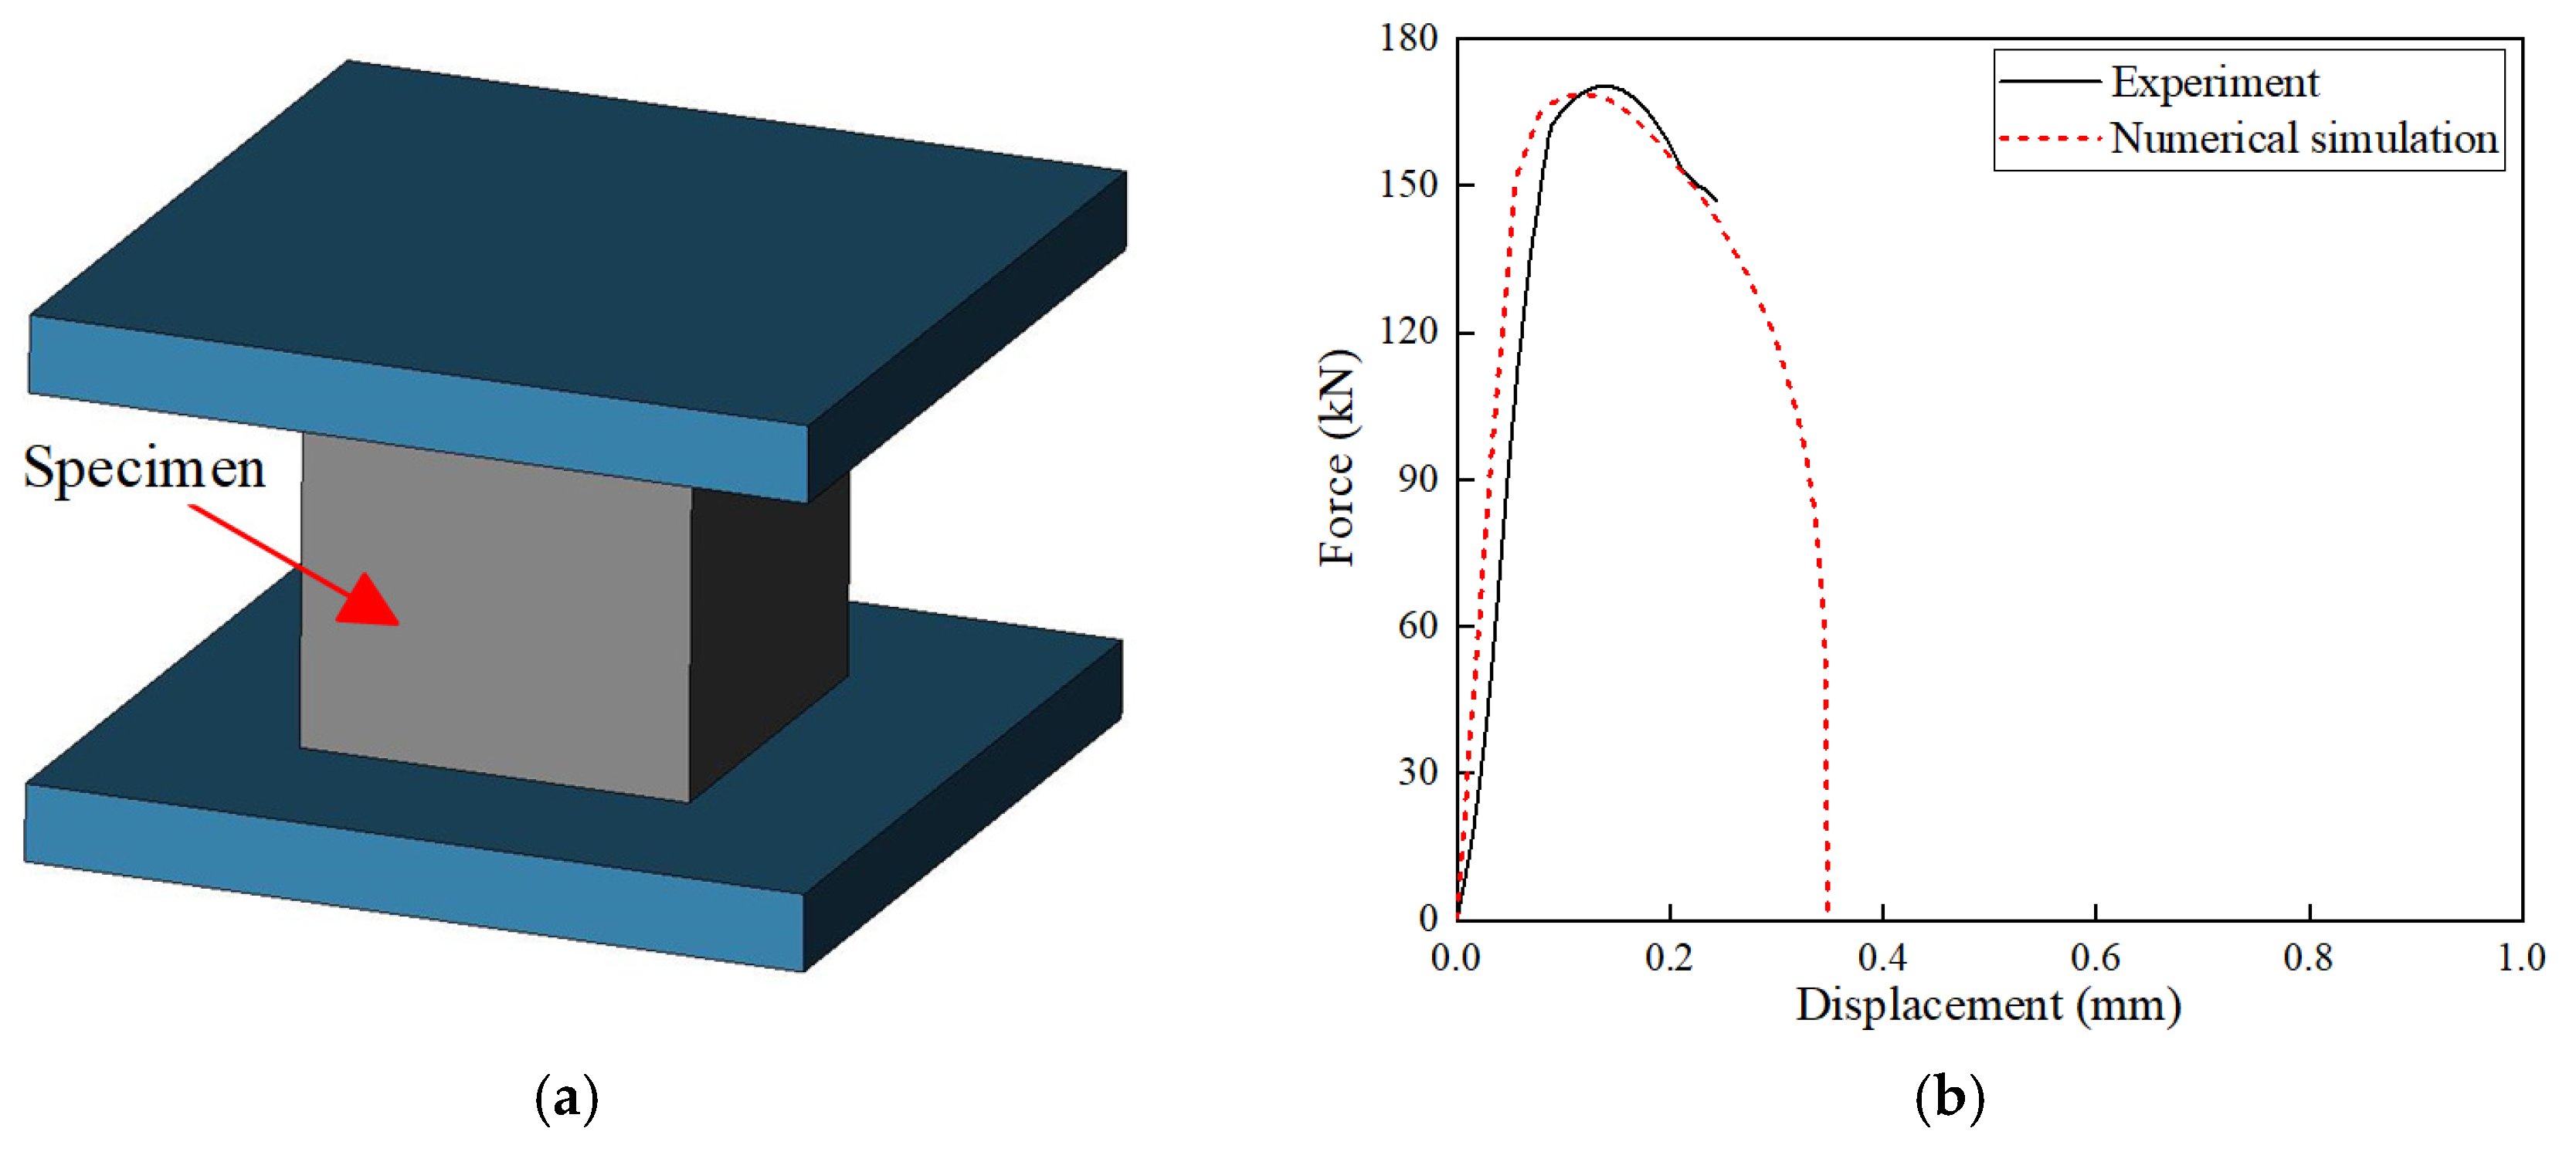
The uniaxial compression test of an ECC specimen was simulated. An ECC cube of dimensions 50 mm × 50 mm × 50 mm was modeled with the material parameters in this study, and the cube was sandwiched between 2 steel plates, as shown in Figure 11a. The translation and rotation of the bottom steel plate were completely restrained, while the top steel plate compressed the cube at a rate of 0.5 mm/min. The ECC specimen and steel plate were meshed with the solid 164 element of 5 mm size. It was found that the force–displacement relationship of numerical simulation favorably agreed with the test data, as shown in Figure 11b.
Similarly, the numerical model of the dog-bone specimen subjected to uniaxial tension was established, as shown in Figure 12a. The upper and lower ends of the dog-bone specimen were loaded with connected steel plates. The translation and rotation of the bottom steel plate were completely restrained, and the top steel plate moved upward at a rate of 0.0008 mm/s. The ECC specimen and steel plate were modeled with the Solid 164 element with a mesh size of 5 mm. The comparison between the numerically simulated and test results in Figure 12b suggested that the ECC model with chosen parameters was capable of capturing the tensile behavior of ECC to a reasonable extent. However, a discrepancy did exist, which is also observed in the literature.
3.2.3. Modeling Methodology of Drop Weight Impact on Beams
Both the drop weight test and the corresponding numerical model were described in Section 3.1.1. With the defined contact conditions between the concerned parts, the interaction between the concrete and rebar, and the parameters, the response of the RC beam with and without ECC reinforcement was simulated and compared with the test.
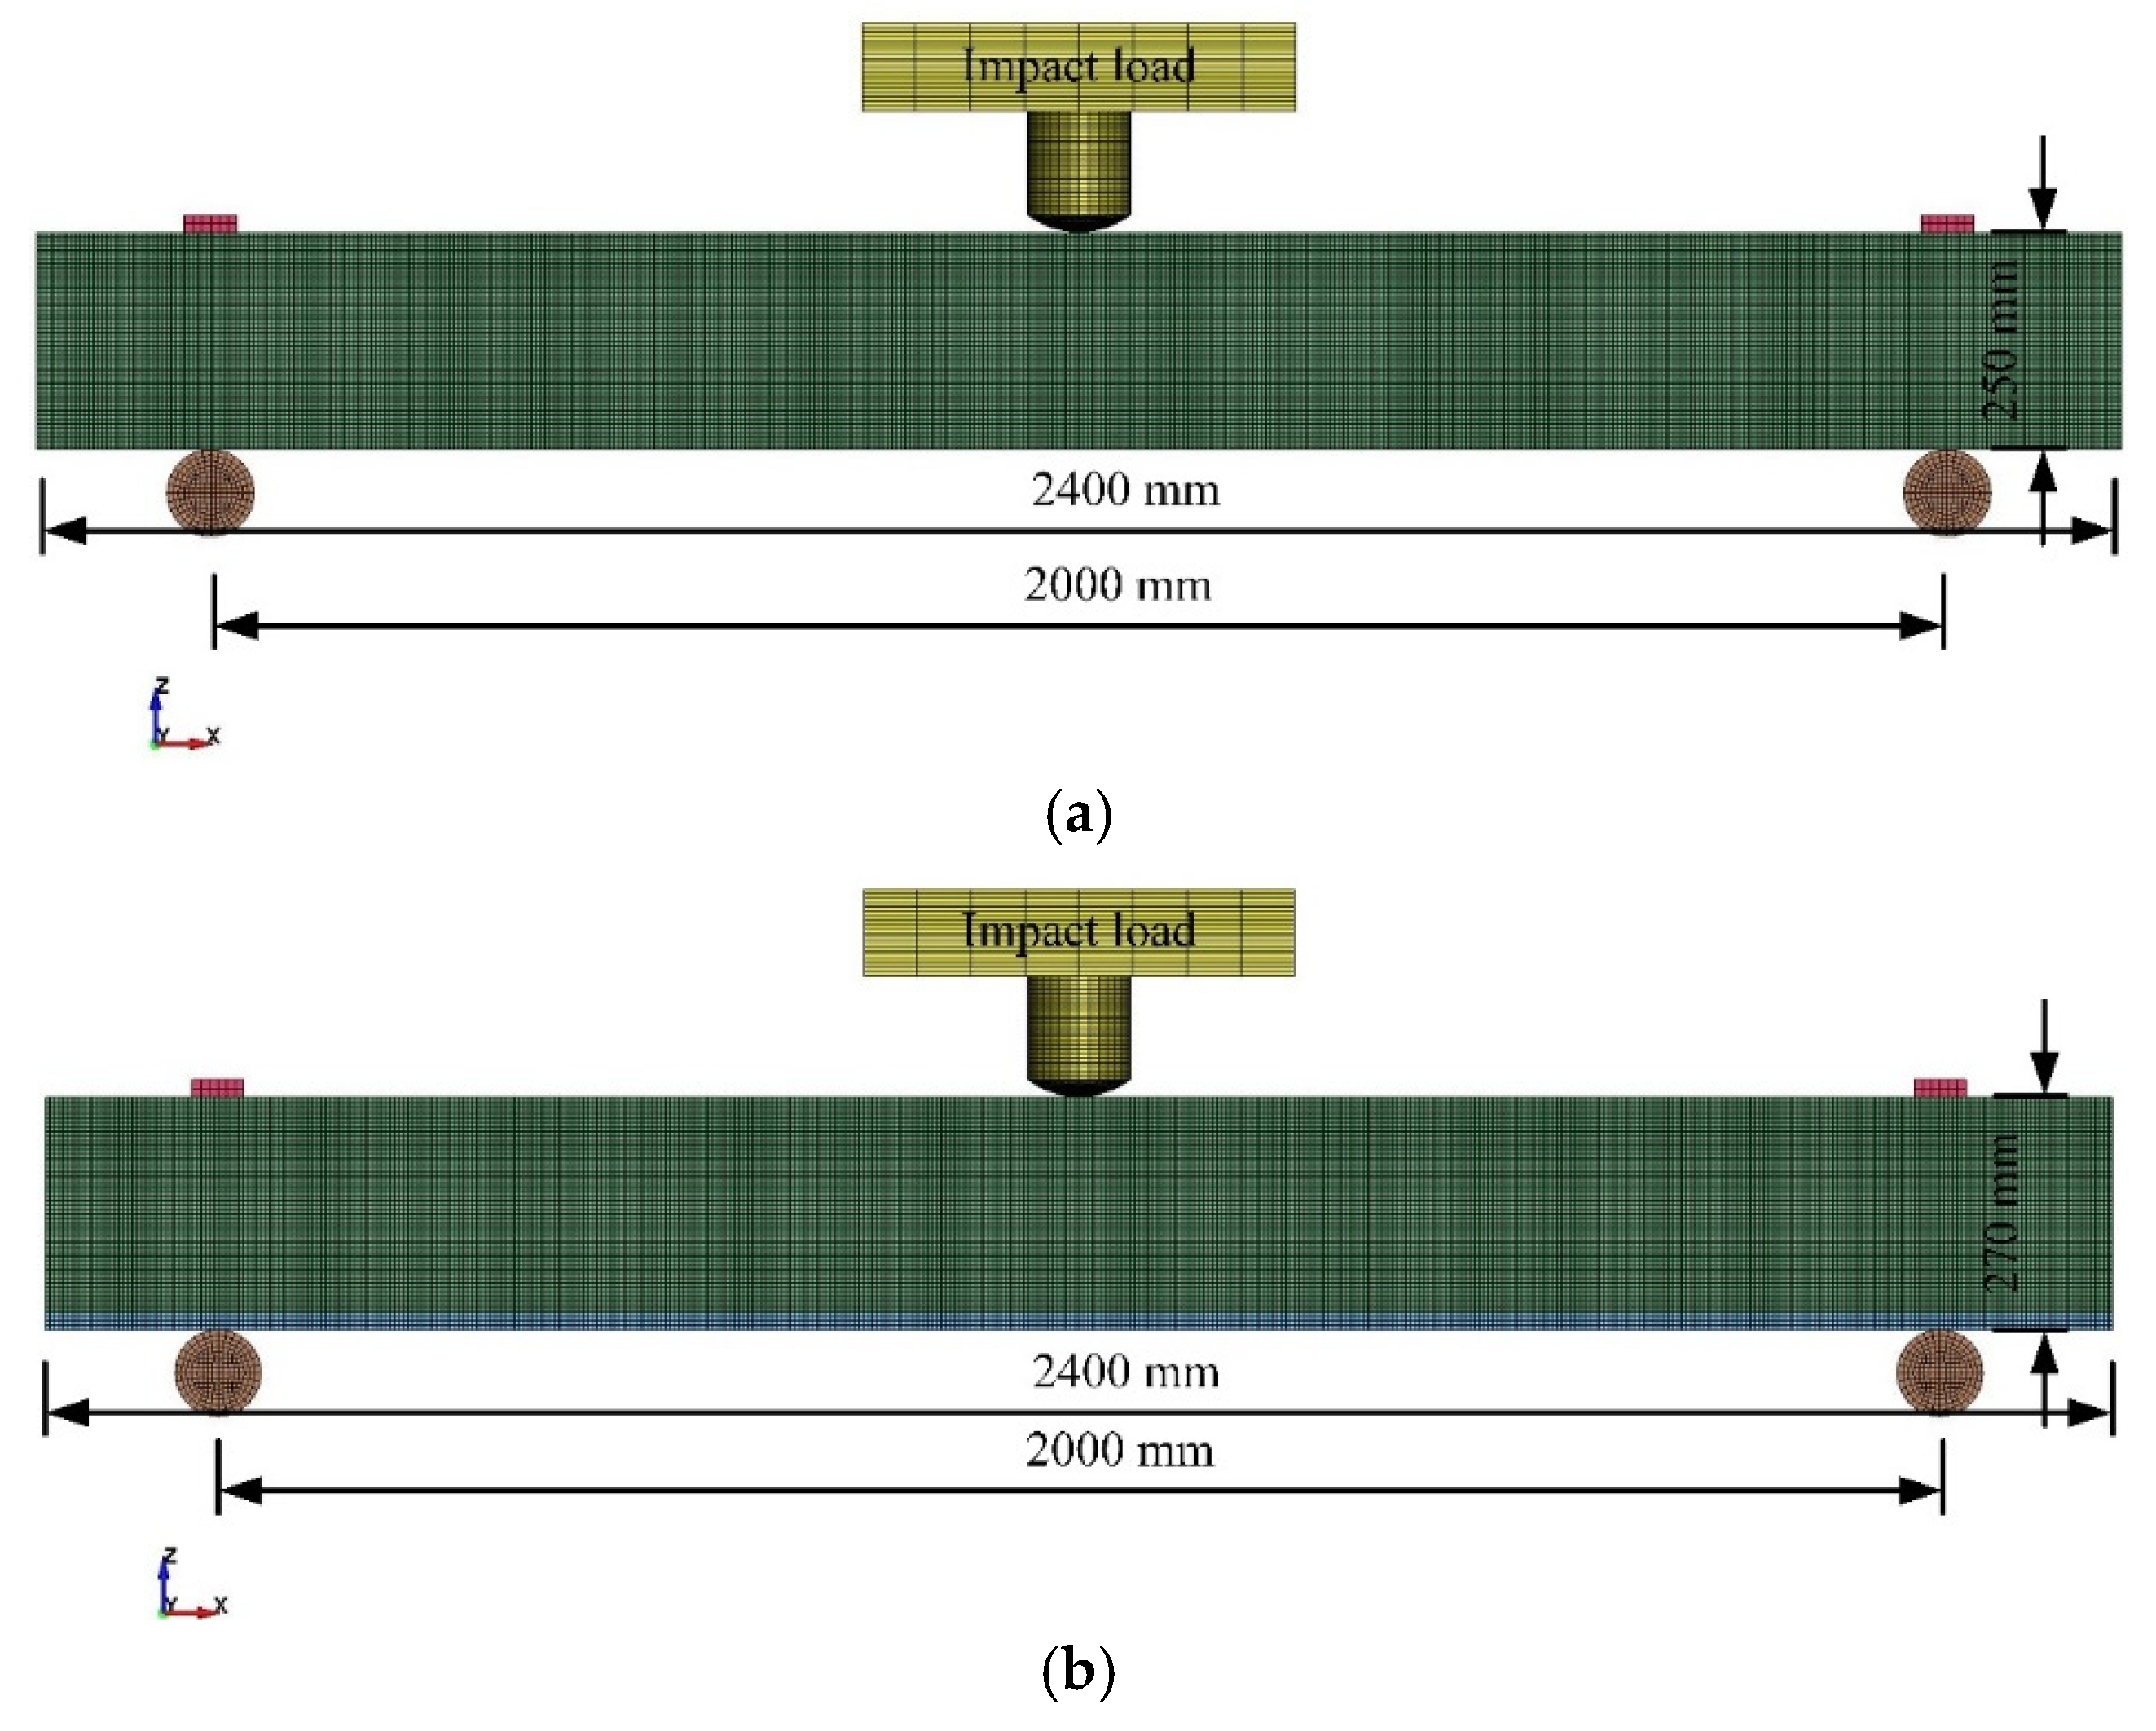
A brief overview of the low-velocity drop hammer impact tests by Pan et al. [52] on RC beams with and without ECC reinforcement is provided. The 2400 mm long RC beams with cross-sectional dimensions of 150 mm × 250 mm (width × height) were restricted at both ends by steel plates and rollers, resulting in an effective span of 2000 mm. The 4 longitudinal steel bars were Φ12 HPB400, and the stirrup bars were Φ6 HPB300 with a 100 mm spacing. Two beams were identical, one with a twenty mm ECC reinforcement layer installed on the bottom side, and the other without a reinforcement layer as a control group. In each test, the drop hammer with a mass of 200 kg impacted the beam in mid-span from a free fall height of 1 m, implying the impact load was the same for the 2 beams. The parameters of the beams and reinforcement layer, as well as the test conditions, are summarized in Table 10.
The numerical models were established according to the low-velocity drop hammer test, as shown in Figure 13. The hammer with the curved head was modeled, and the 500 mm × 500 mm × 100 mm steel block was applied to the drop weight of 200 kg. The geometry of the numerical model was set precisely the same as that of the test. Specifically, the numerical model consisted of three parts: the drop hammer, the supports, and the beam with or without the ECC reinforcement. To more accurately simulate the boundary condition of the beams, 2 cylindrical supports were established, having an effective span of 2000 mm. The beam was placed on the cylindrical support, and a 100 mm × 50 mm × 10 mm steel block was installed on both top sides of the beam. The keyword CONTACT_AUTOMATIC_NODE_TO_SURFACE was applied between the cylindrical support and the beam, while CONTACT_AUTOMATIC_SURFACE_TO_SURFACE was applied between the constraint steel block and the beam.
The concrete and ECC in the beam were meshed with the Solid 164 element, while the rebar was meshed with the BEAM 161 element. According to the test results, sliding between rebar and concrete under low-velocity impact loading was slight. To this end, the coupling between concrete and rebar was modeled by sharing common nodes. CONTACT_ AUTOMATIC_SURFACE_TO_SURFACE was applied to describe the interaction among the separate ECC reinforcement layers, while the interaction between the RC beam and the ECC reinforcement layer shared common nodes. A mesh sensitivity study with different mesh sizes was conducted, and the 5 mm mesh size was adopted for all the components in the numerical model to balance the computational accuracy and efficiency.
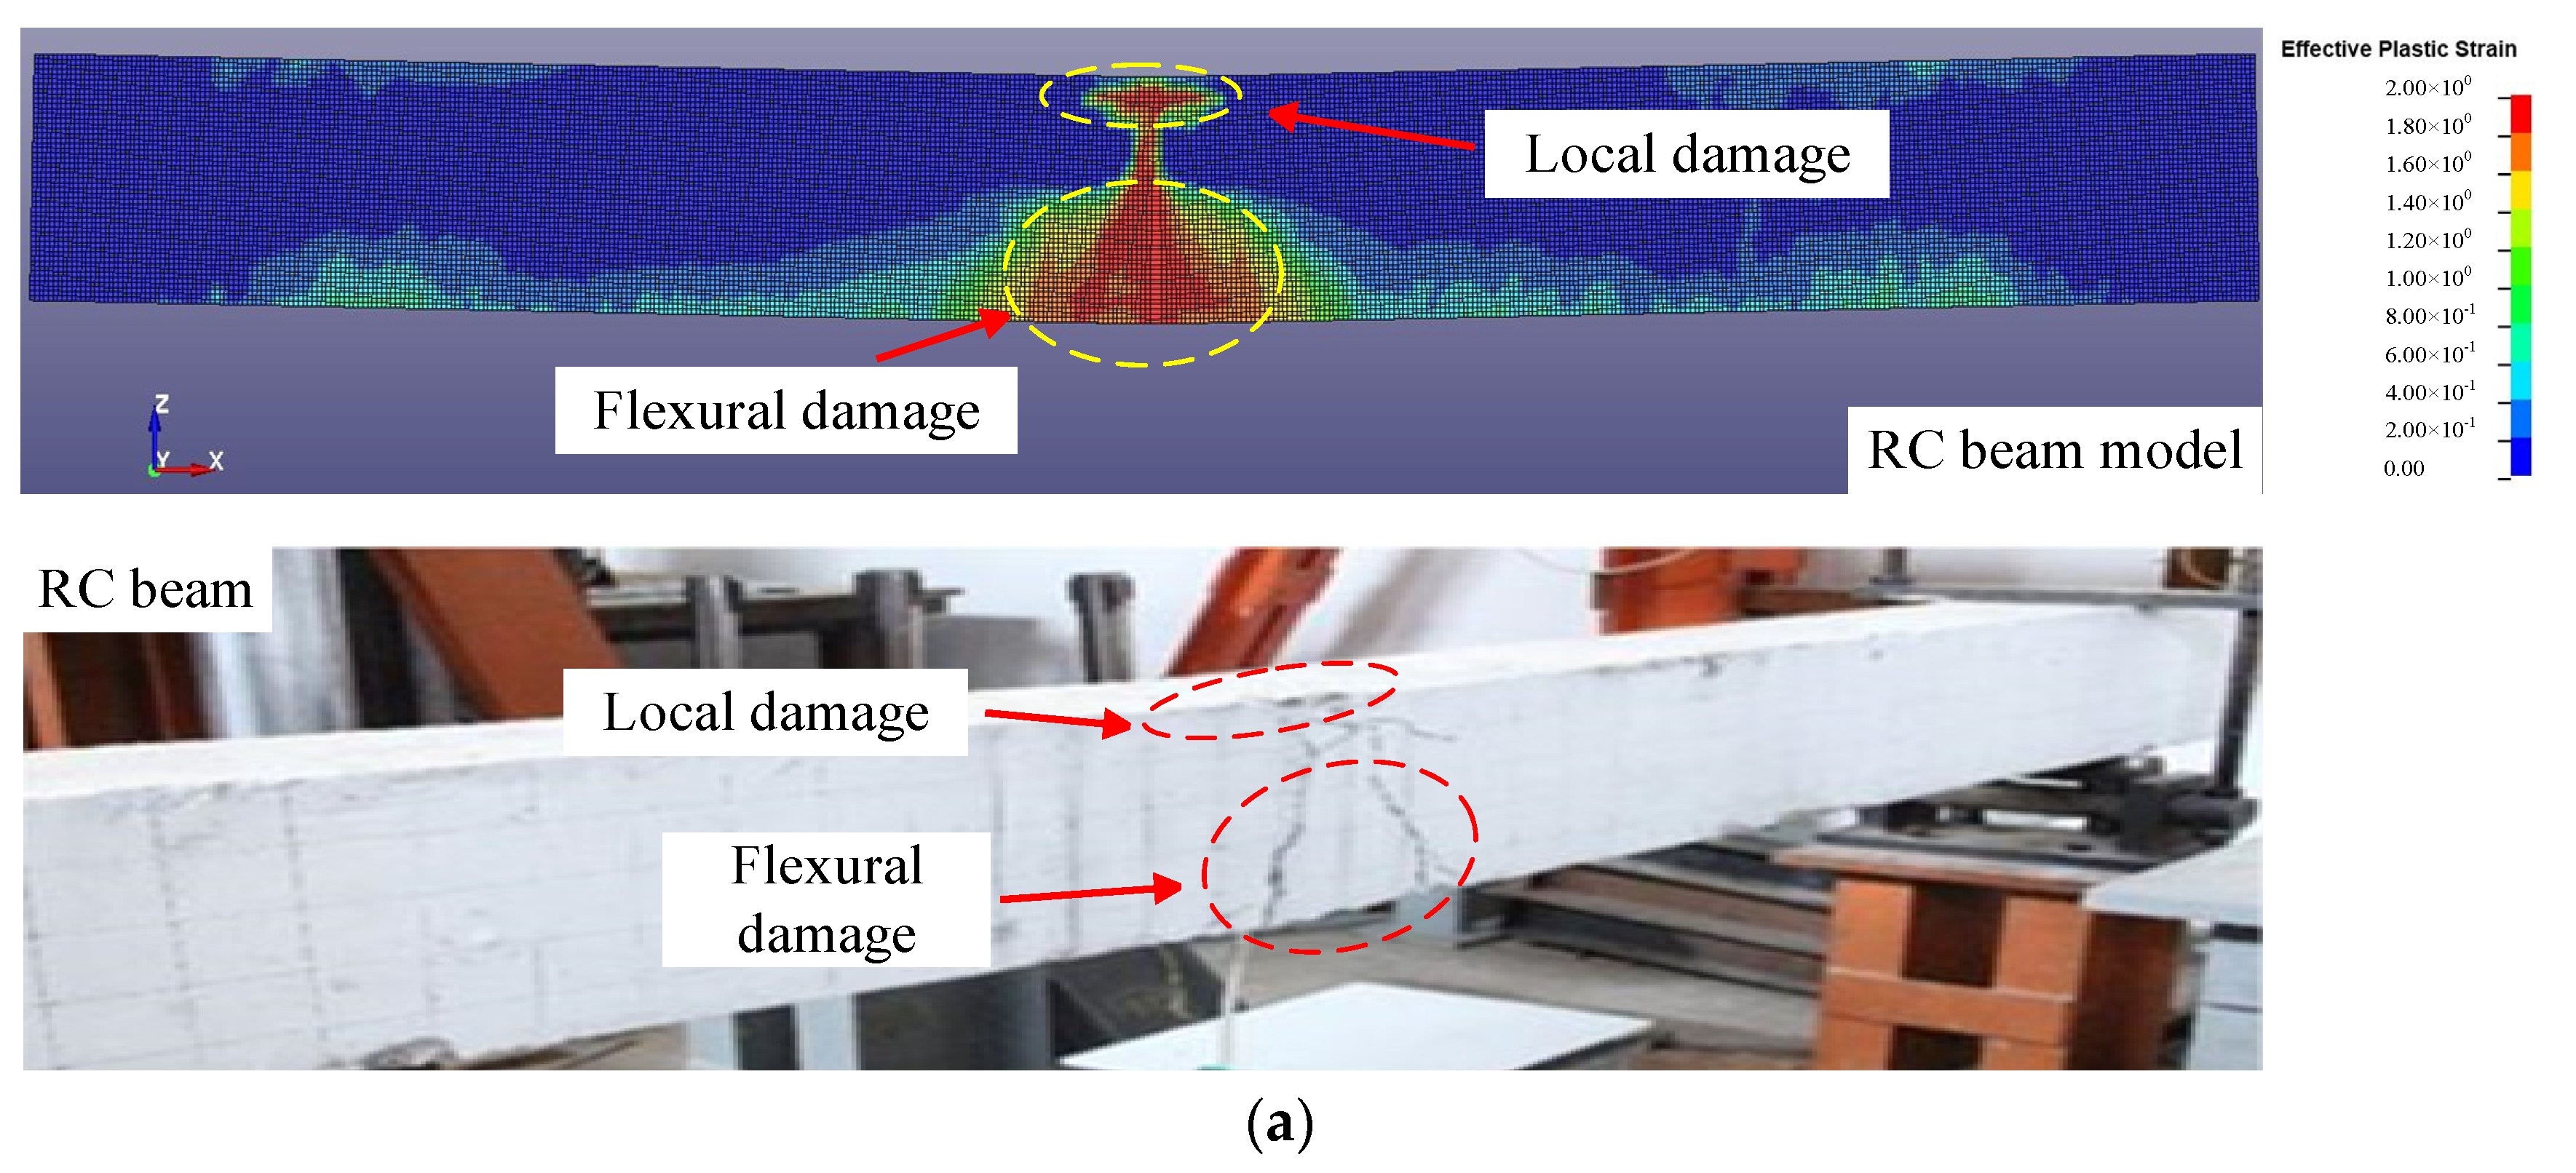
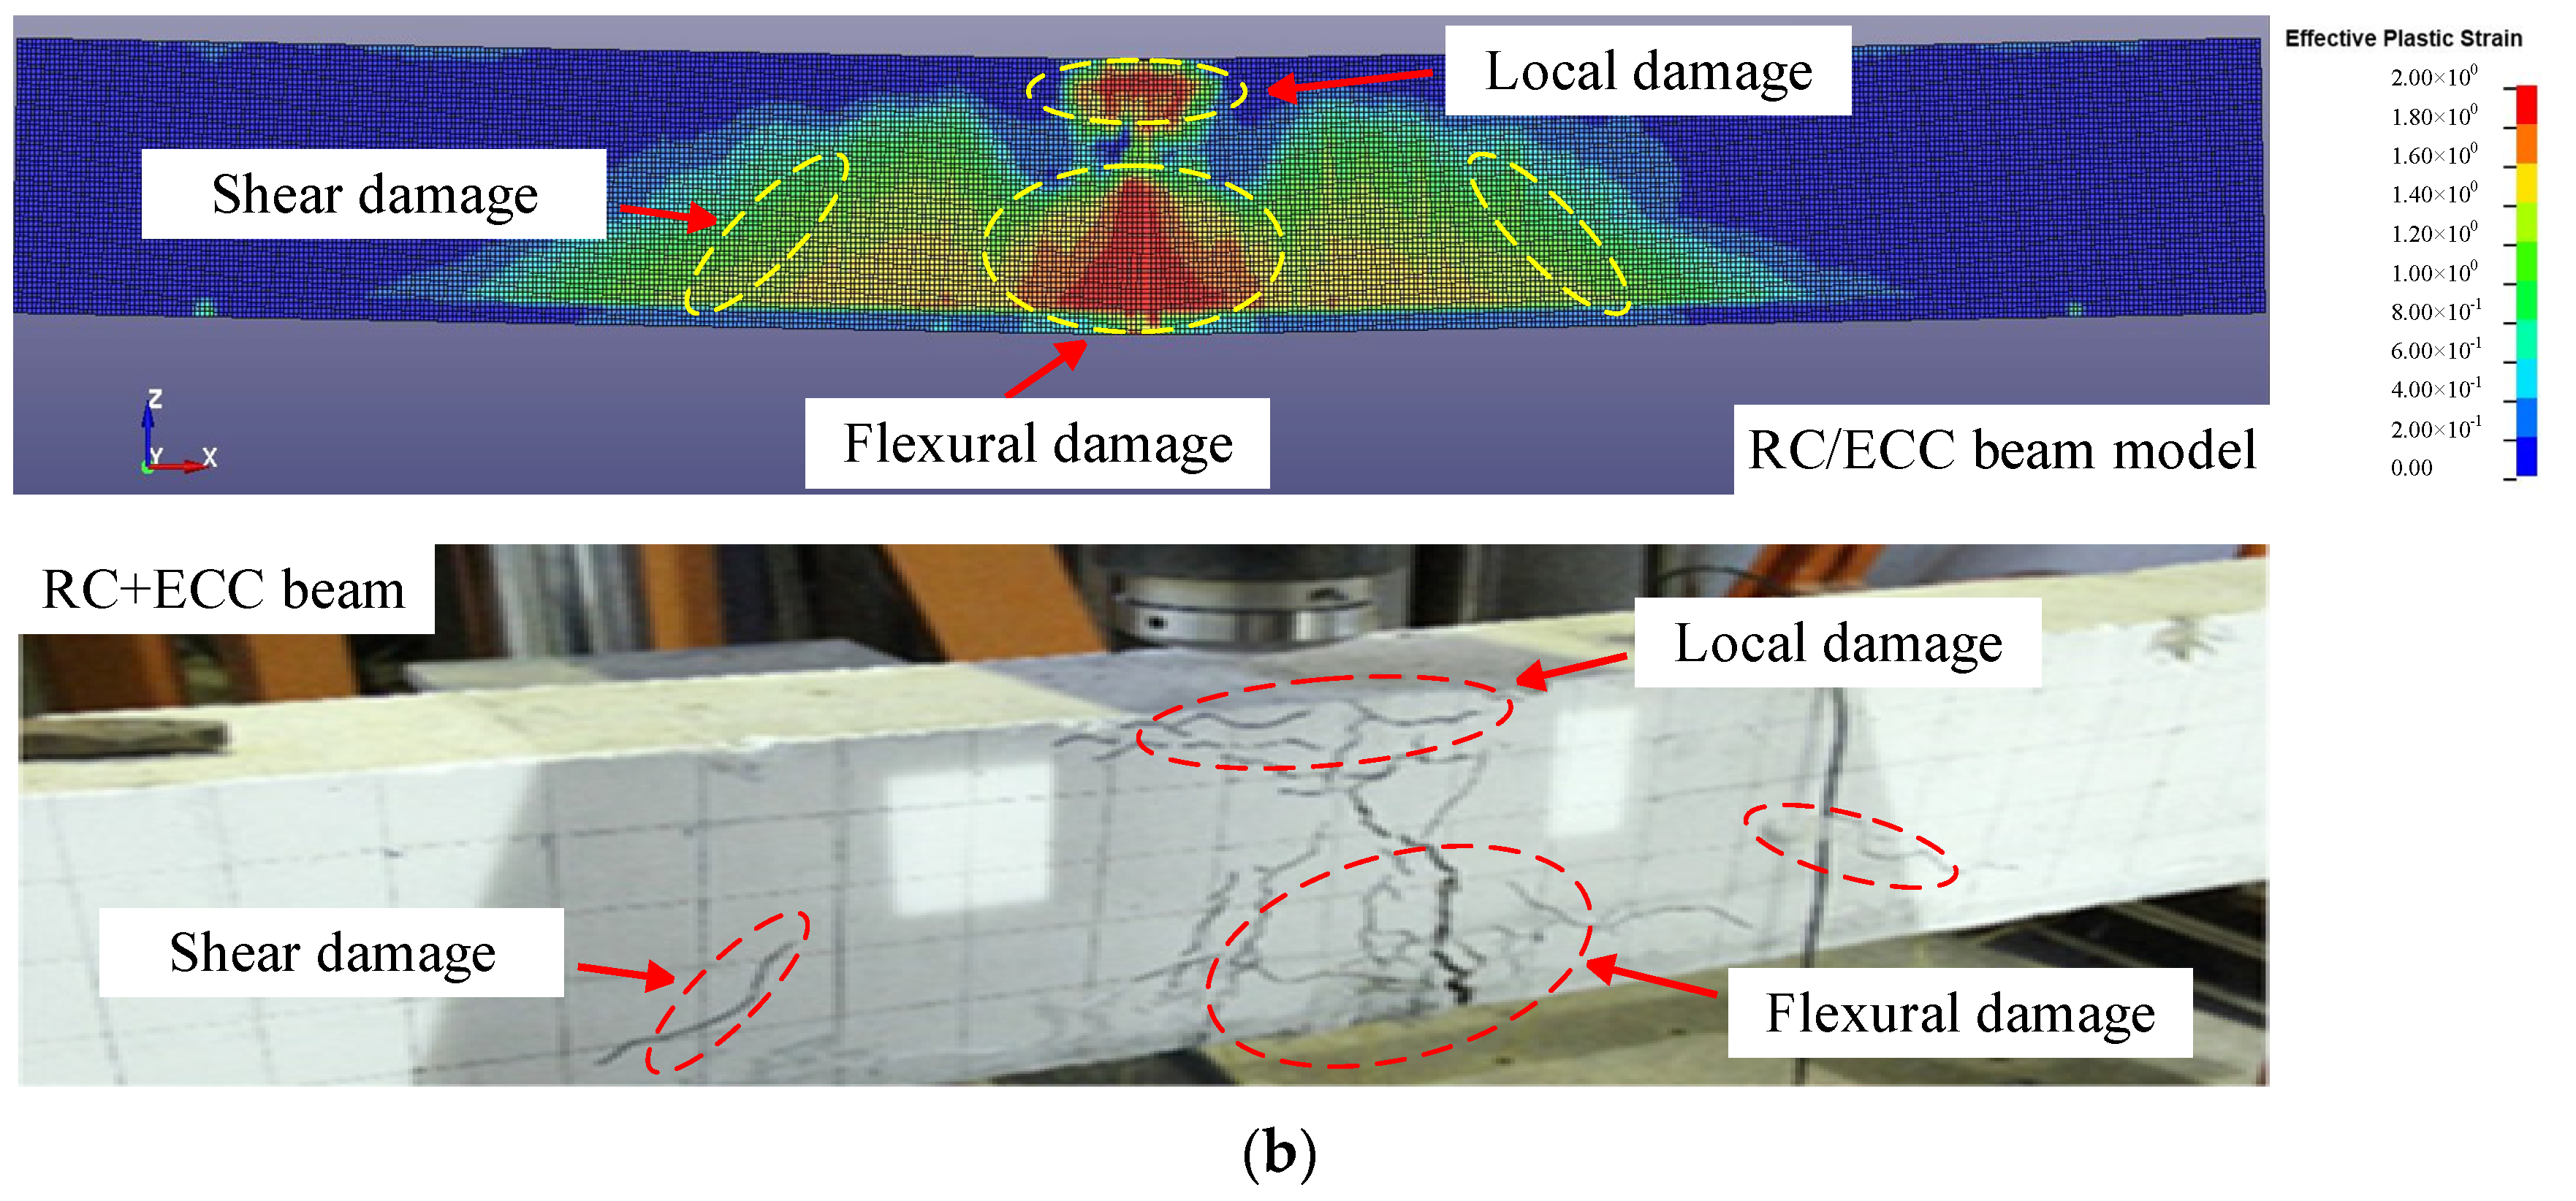
The response and damage modes of the two beams were reasonably represented by the numerical model, in which the damage location and degree agreed favorably with the test results, shown in Figure 14. The RC beam showed a bending damage pattern, and the span displayed significant bending damage. In addition, the contact location of the falling hammer showed localized damage. All these features were effectively captured by the numerical model of the RC beam. RC/ECC beams exhibited a bending-shear damage mode, and shear damage could be observed on both sides of the bending damage location in the span, and these characteristic damages could be effectively reflected in the numerical model of RC/ECC beams. The difference in damage modes between RC and RC/ECC beams was due to the increased response stiffness of the ECC-reinforced RC beams, which in turn led to the transformation of the specimens from bending damage of RC beams to bending-shear damage of RC/ECC beams.
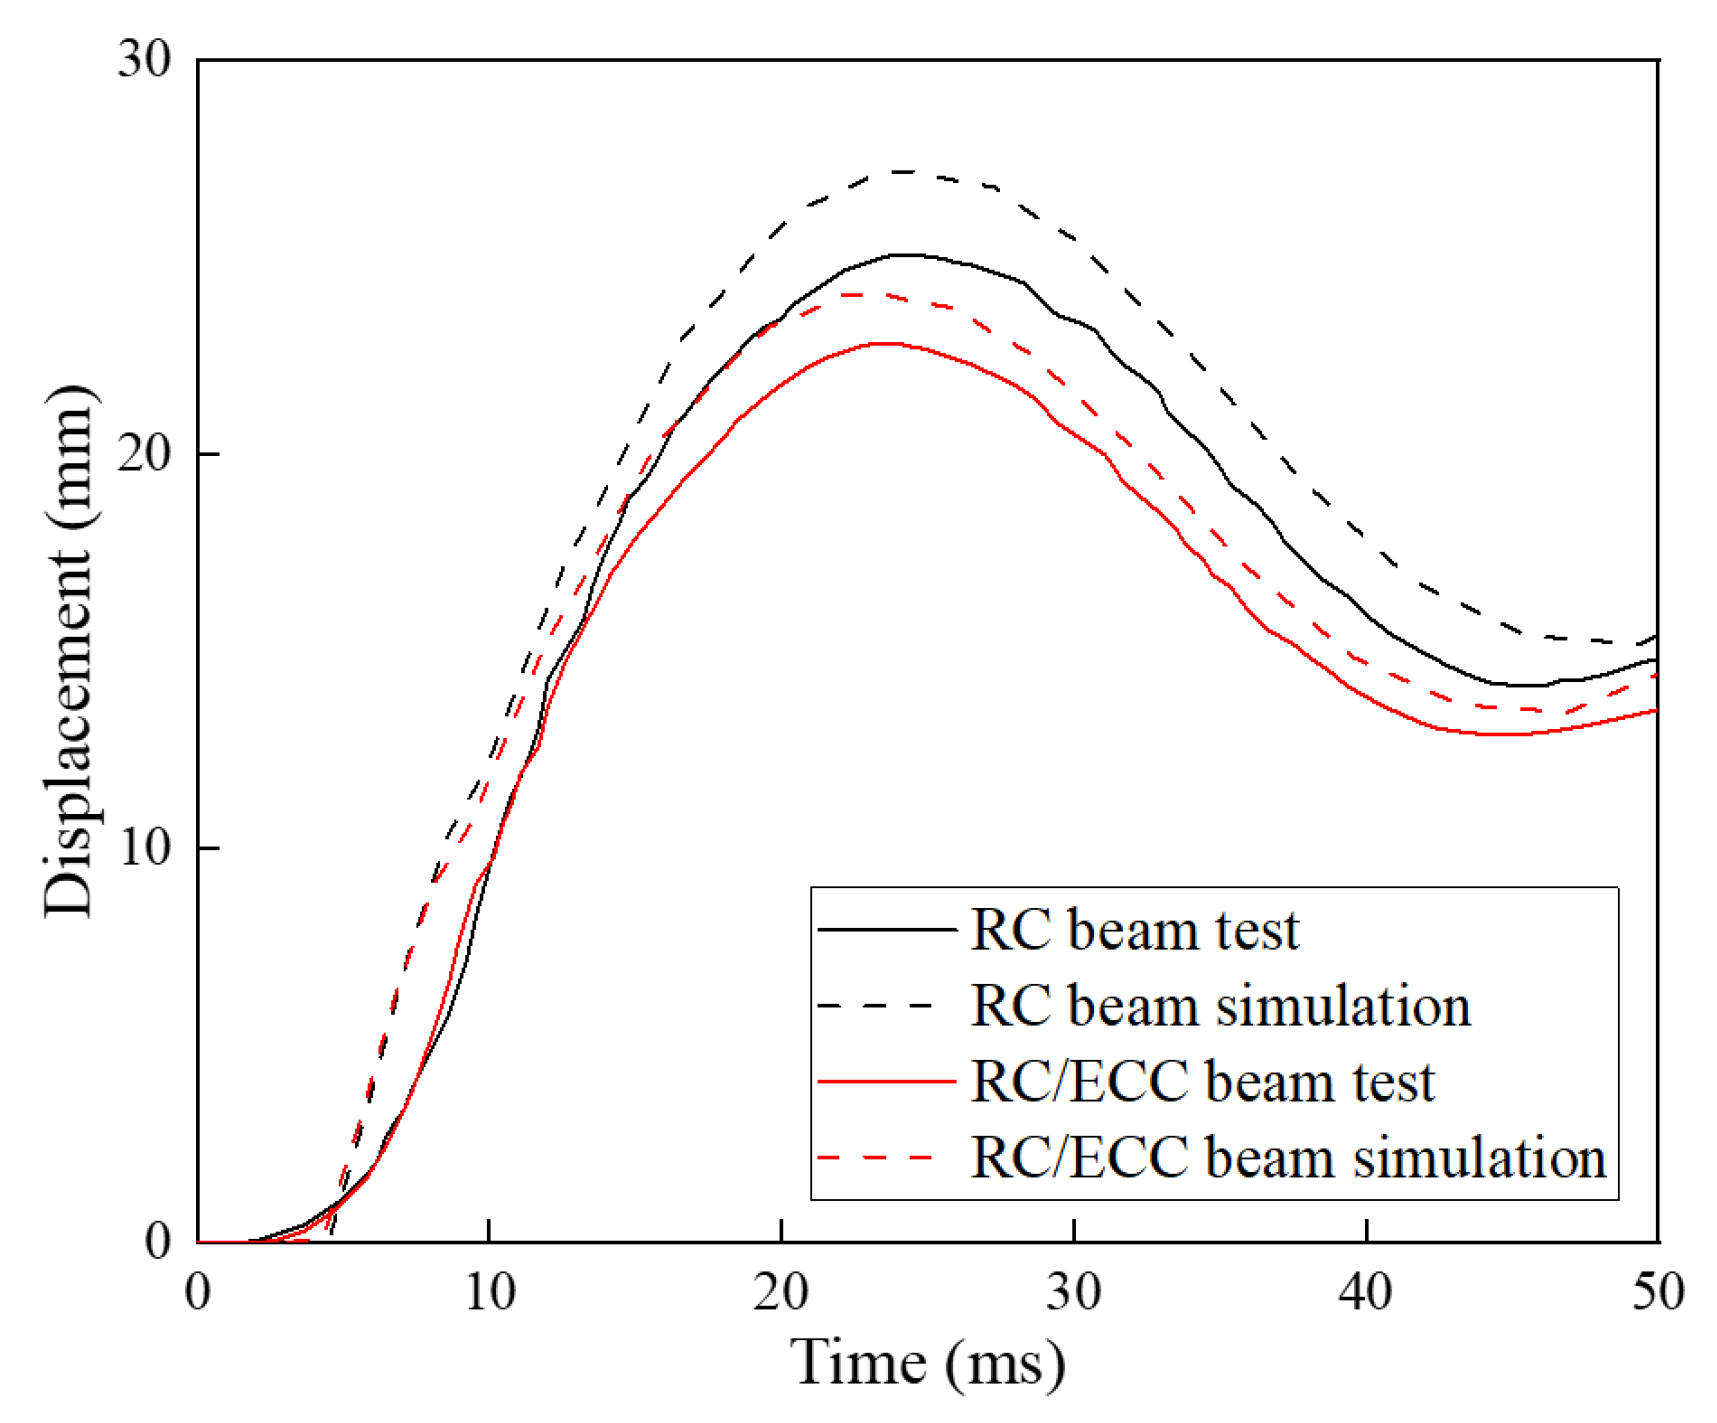
The simulated deflection time histories of the beam mid-span were close to those of the test, shown in Figure 15. Although the peak displacements of the numerical model were slightly larger than the experimental results, the errors were only 5.6% and 8.7% for the RC and RC/ECC beams, respectively. On the one hand, the falling hammer inevitably caused a certain speed and energy loss during the falling process in the test, resulting in the actual speed and energy acting on the specimen being slightly less than the speed and energy calculated from the free fall. On the other hand, the specimen’s constrained boundary of the specimen in the test was not entirely precise. Therefore, it could cause some degree of energy dissipation, which in turn led to a reduced degree of specimen deformation. In contrast, the boundary constraint in the numerical simulation was nearly perfect, which led to a severe deformation of the numerical model. Therefore, the peak displacement of the numerical model is slightly larger than the experimental results.
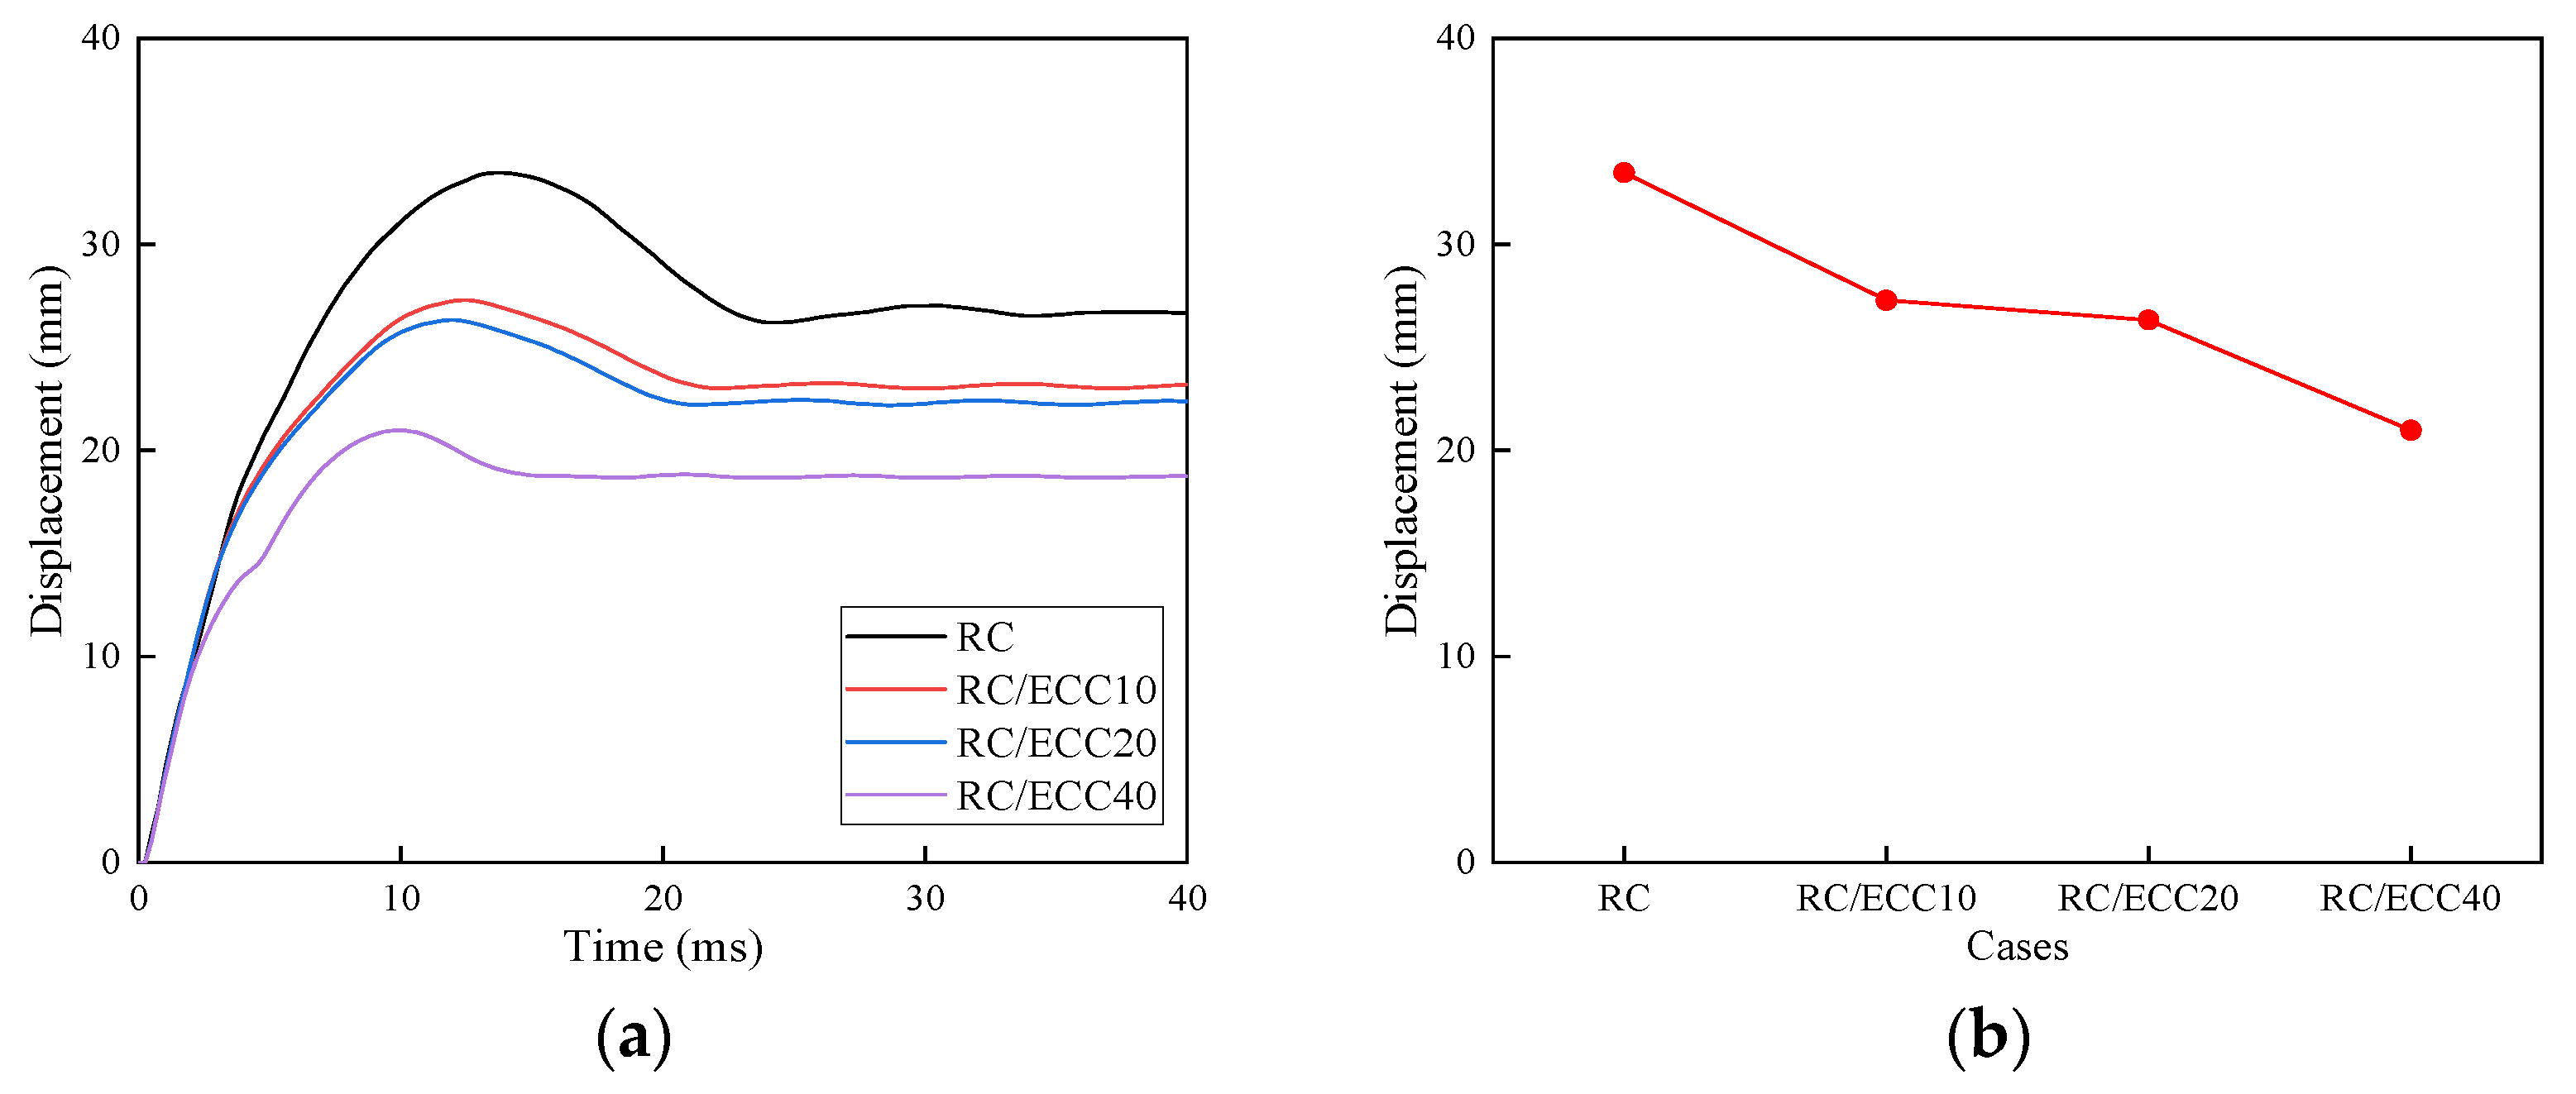
The peak displacement of the RC beam and RC/ECC beam are listed in Table 11. ECC reinforcement significantly reduced the displacement of the RC beam. The displacement decreased with the increase in reinforcement layer thickness because the ECC reinforcement layer could effectively improve the overall response stiffness of the member during the deformation process, which in turn reduced the span deflection, decreased the degree of deformation, and effectively controlled the deformation of the member under impact load.
To sum up, both the ECC constitutive model and the modeling methodology for the drop weight impact test reasonably represented the corresponding tests with adequate accuracy. As a result, the numerical models can be considered validated.
4. Discussions
In this section, in addition to the response and damage mode of the beam, quantitative response parameters, including mid-span deflection, impact load, reaction force, and energy dissipation, are discussed to evaluate their performance when subjected to impact load.
4.1. ECC Reinforcement Thickness
4.1.1. Response and Failure Mode
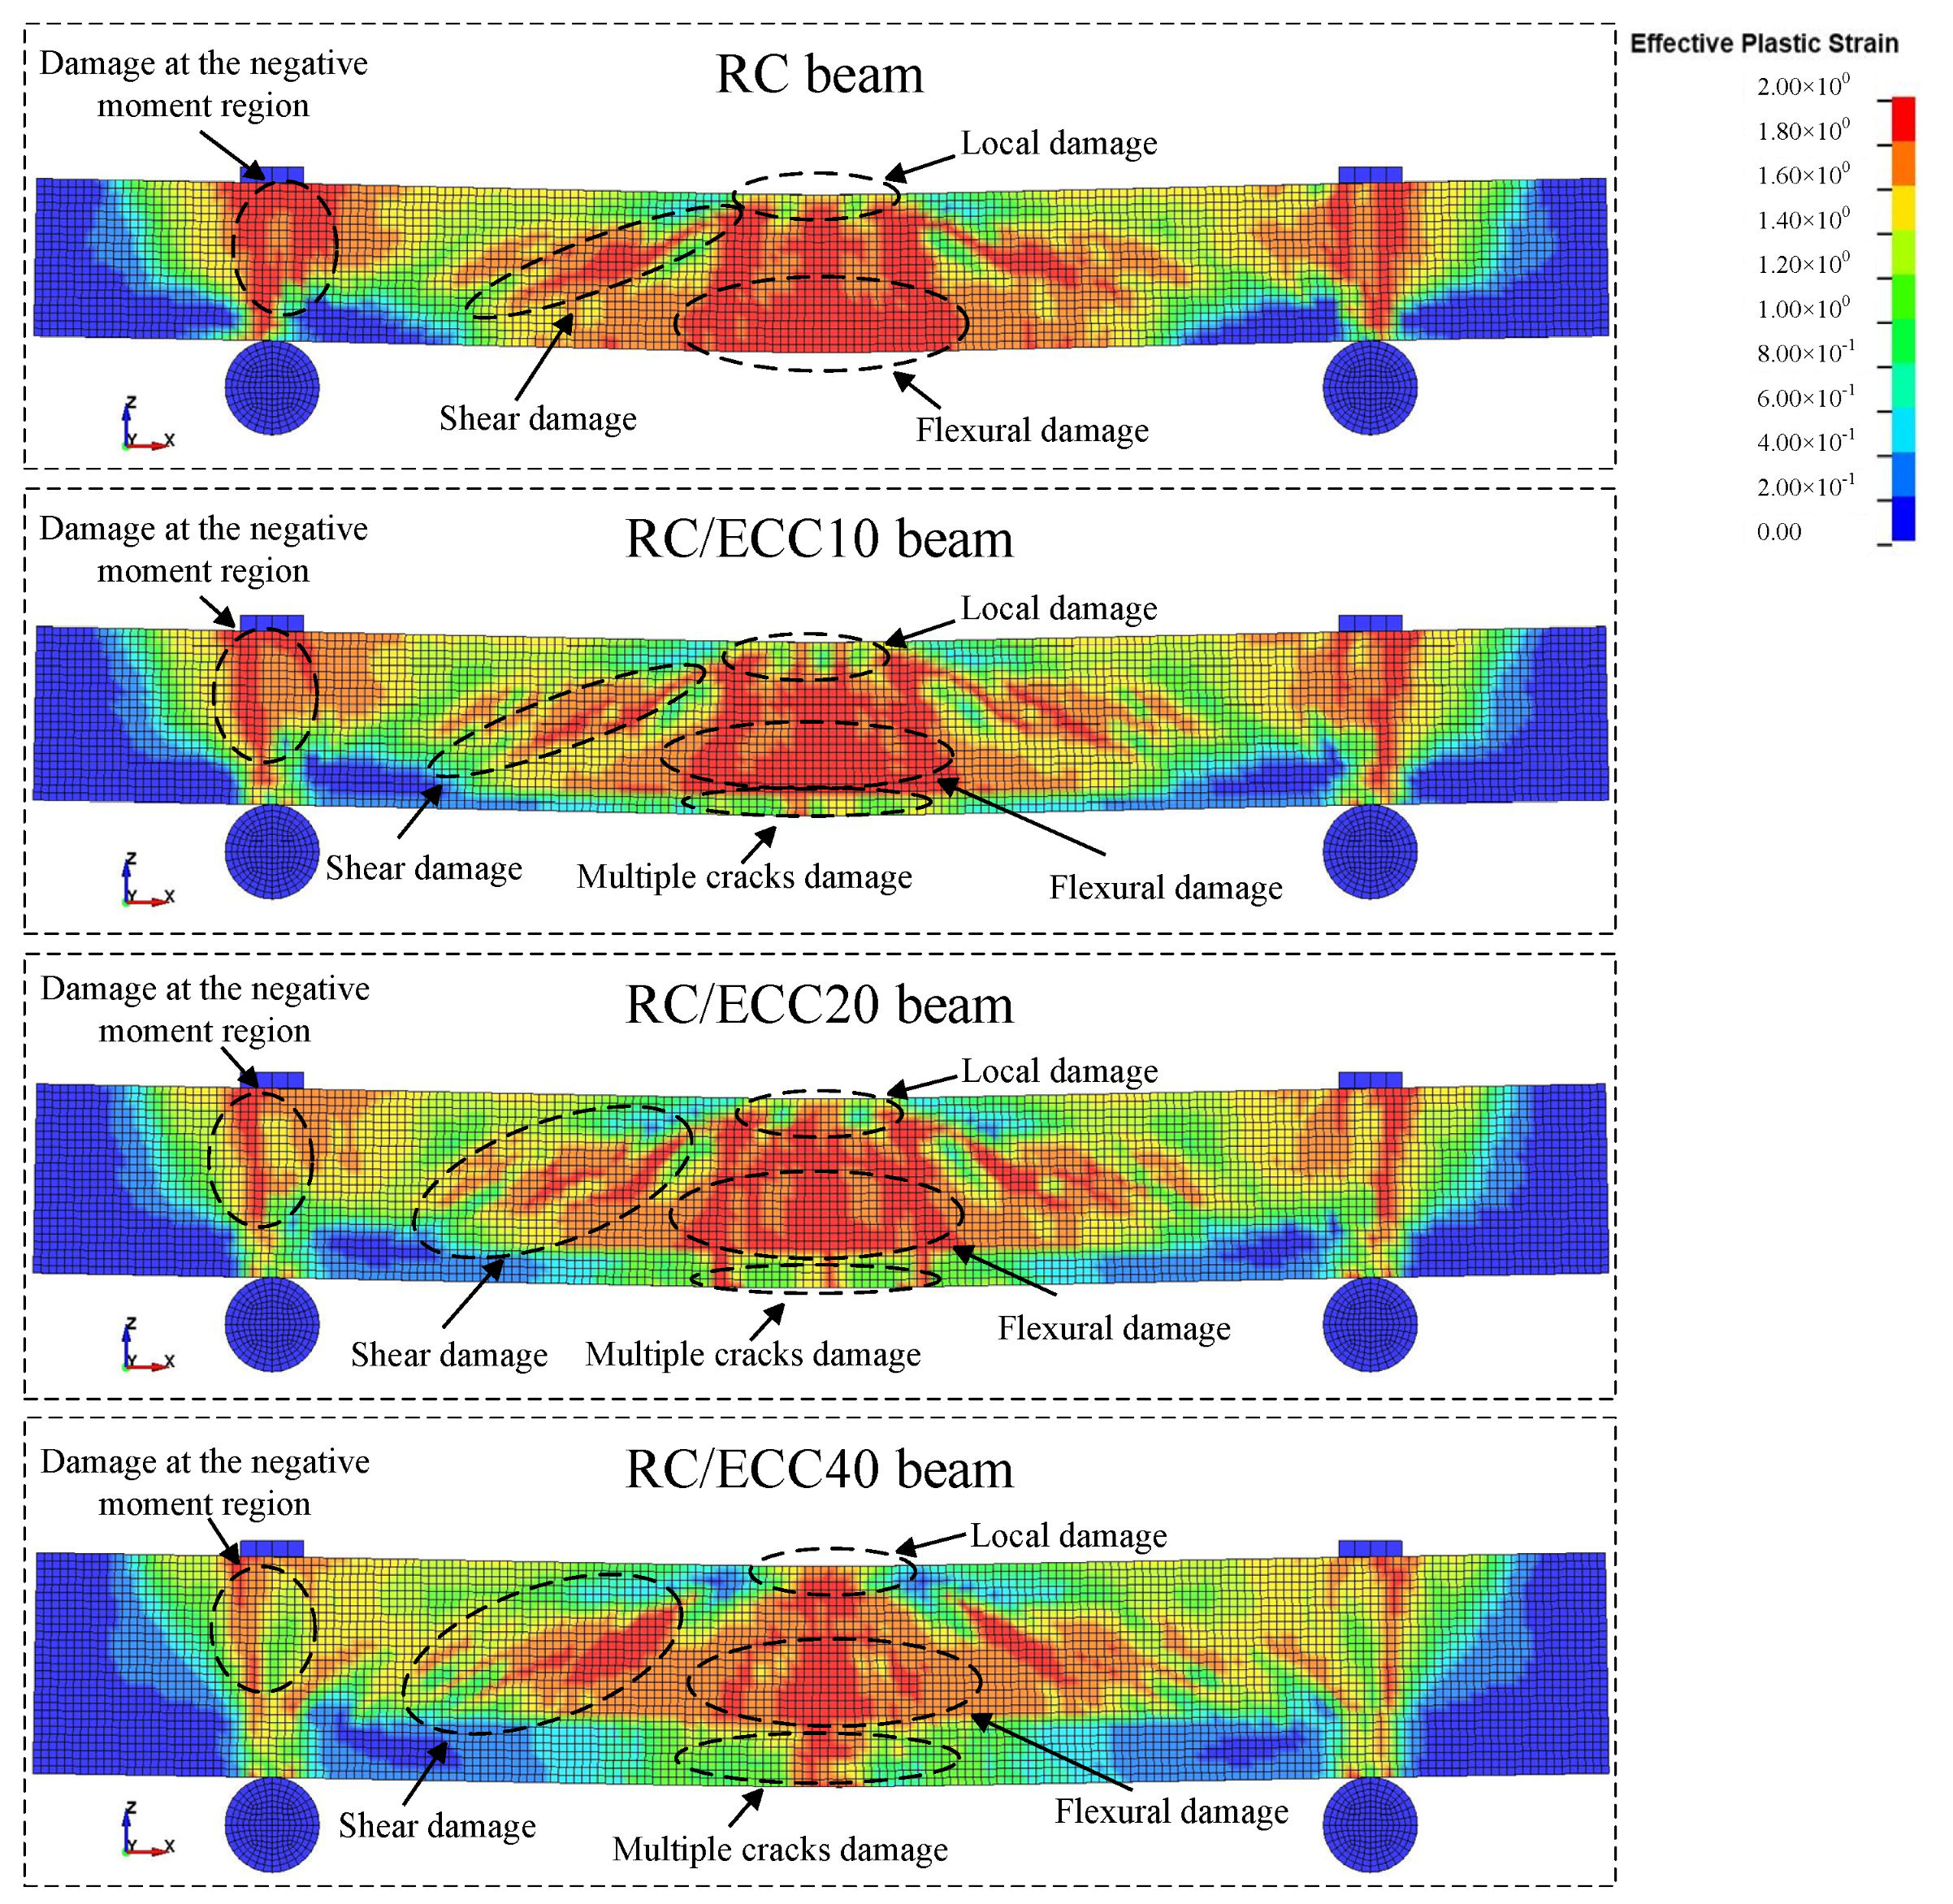
With different ECC reinforcement thicknesses and all other parameters and test conditions the same, Figure 16 shows that the damage to the RC beam in terms of effective plastic strain decreased with increasing ECC layer thickness. At the same time, the damage around the supports also exhibited the same trend.
Aside from the protected RC beam, the ECC strengthening layer itself was also damaged. The multiple crack mode of ECC was observed in cases with 10 mm and 20 mm layer thicknesses. This implies that ECC exhibited strain hardening and had not yet failed. Differently, a major concentrated damage zone appeared in the central region of the ECC layer in the 40 mm thickness case. This means the layer might already have failed.
The underlying mechanism is that in the case of a relatively thin ECC layer, the ECC layer underwent a tensile response, in which the normal stress difference within the layer was not significant. However, the bending contribution increased in the case of a relatively thick ECC layer, i.e., 40 mm; hence, the normal stress difference within the ECC layer was more significant. As a result, the lowest part of ECC might experience high stress levels and fractures. In this discussion, the 20 mm ECC provided a compromised choice, in which the ECC layer contributed to effective strengthening and did not fail. Therefore, in the strengthening design, ECC reinforcement thickness should be taken into account.
4.1.2. Mid-Span Deflection
The mid-span deflection of the beam decreased with increasing ECC strengthening layer thickness, as shown in Figure 17a. As the ECC layer can be considered part of the RC beam, the deformation resistance increased with the ECC layer thickness, thus decreasing deformation. Furthermore, applying the ECC layer increased the stiffness of the beam, hence increasing natural frequency. Consequently, the thicker the ECC strengthening layer, the earlier the deformation reached its peak, as shown in Figure 17a.
4.1.3. Impact Load
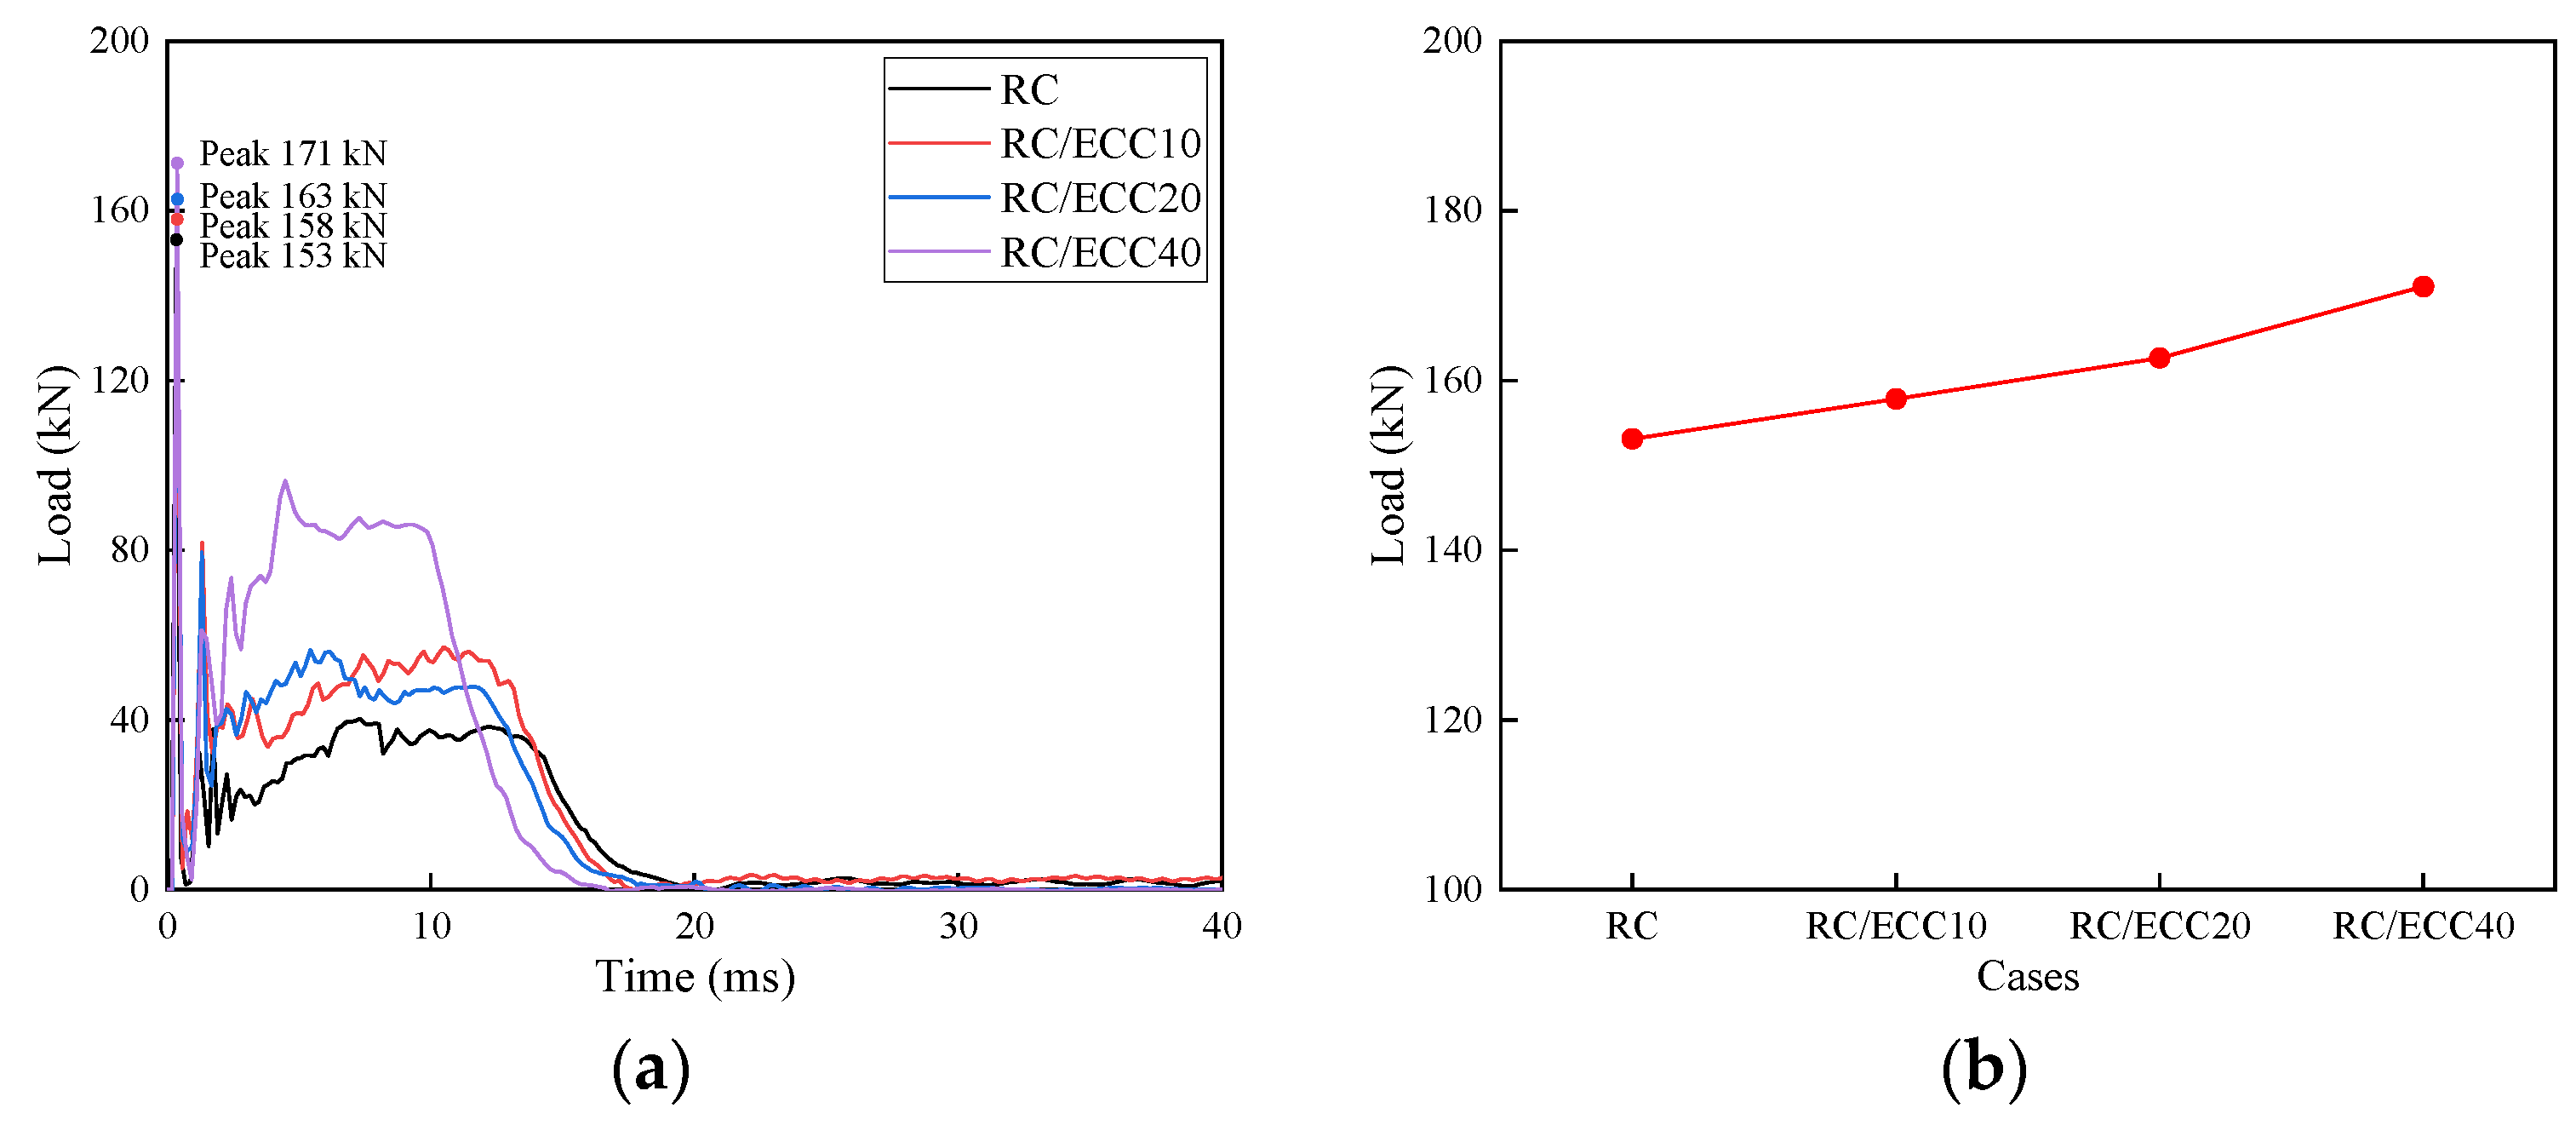
The impact load of these beams is shown in Figure 18. It was observed that the peak impact load of the RC/ECC40 beam was the highest at 171 kN. This was followed by the RC/ECC20 beam at 163 kN, followed by the RC/ECC10 beam at 158 kN, and the RC beam at 153 kN at the minimum. Previous studies have shown that the higher the effective mass of the beam, the higher the peak impact load. With ECC reinforcement, the effective mass involved in the response increases as the thickness of the member increases, and thus the peak impact load increases.
In addition, it was illustrated that the platform force of impact loading was greatest on the RC/ECC40 beam. This was followed by the RC/ECC20 beam, the RC/ECC10, and finally, the RC beam. The magnitude of the platform force was related to the stiffness of the specimen; usually, the greater the stiffness, the greater the platform force. Therefore, larger peak loads and platform forces could result in larger loads that the impactor will be subjected to, which is not desired in protective engineering design.
4.1.4. Reaction Force
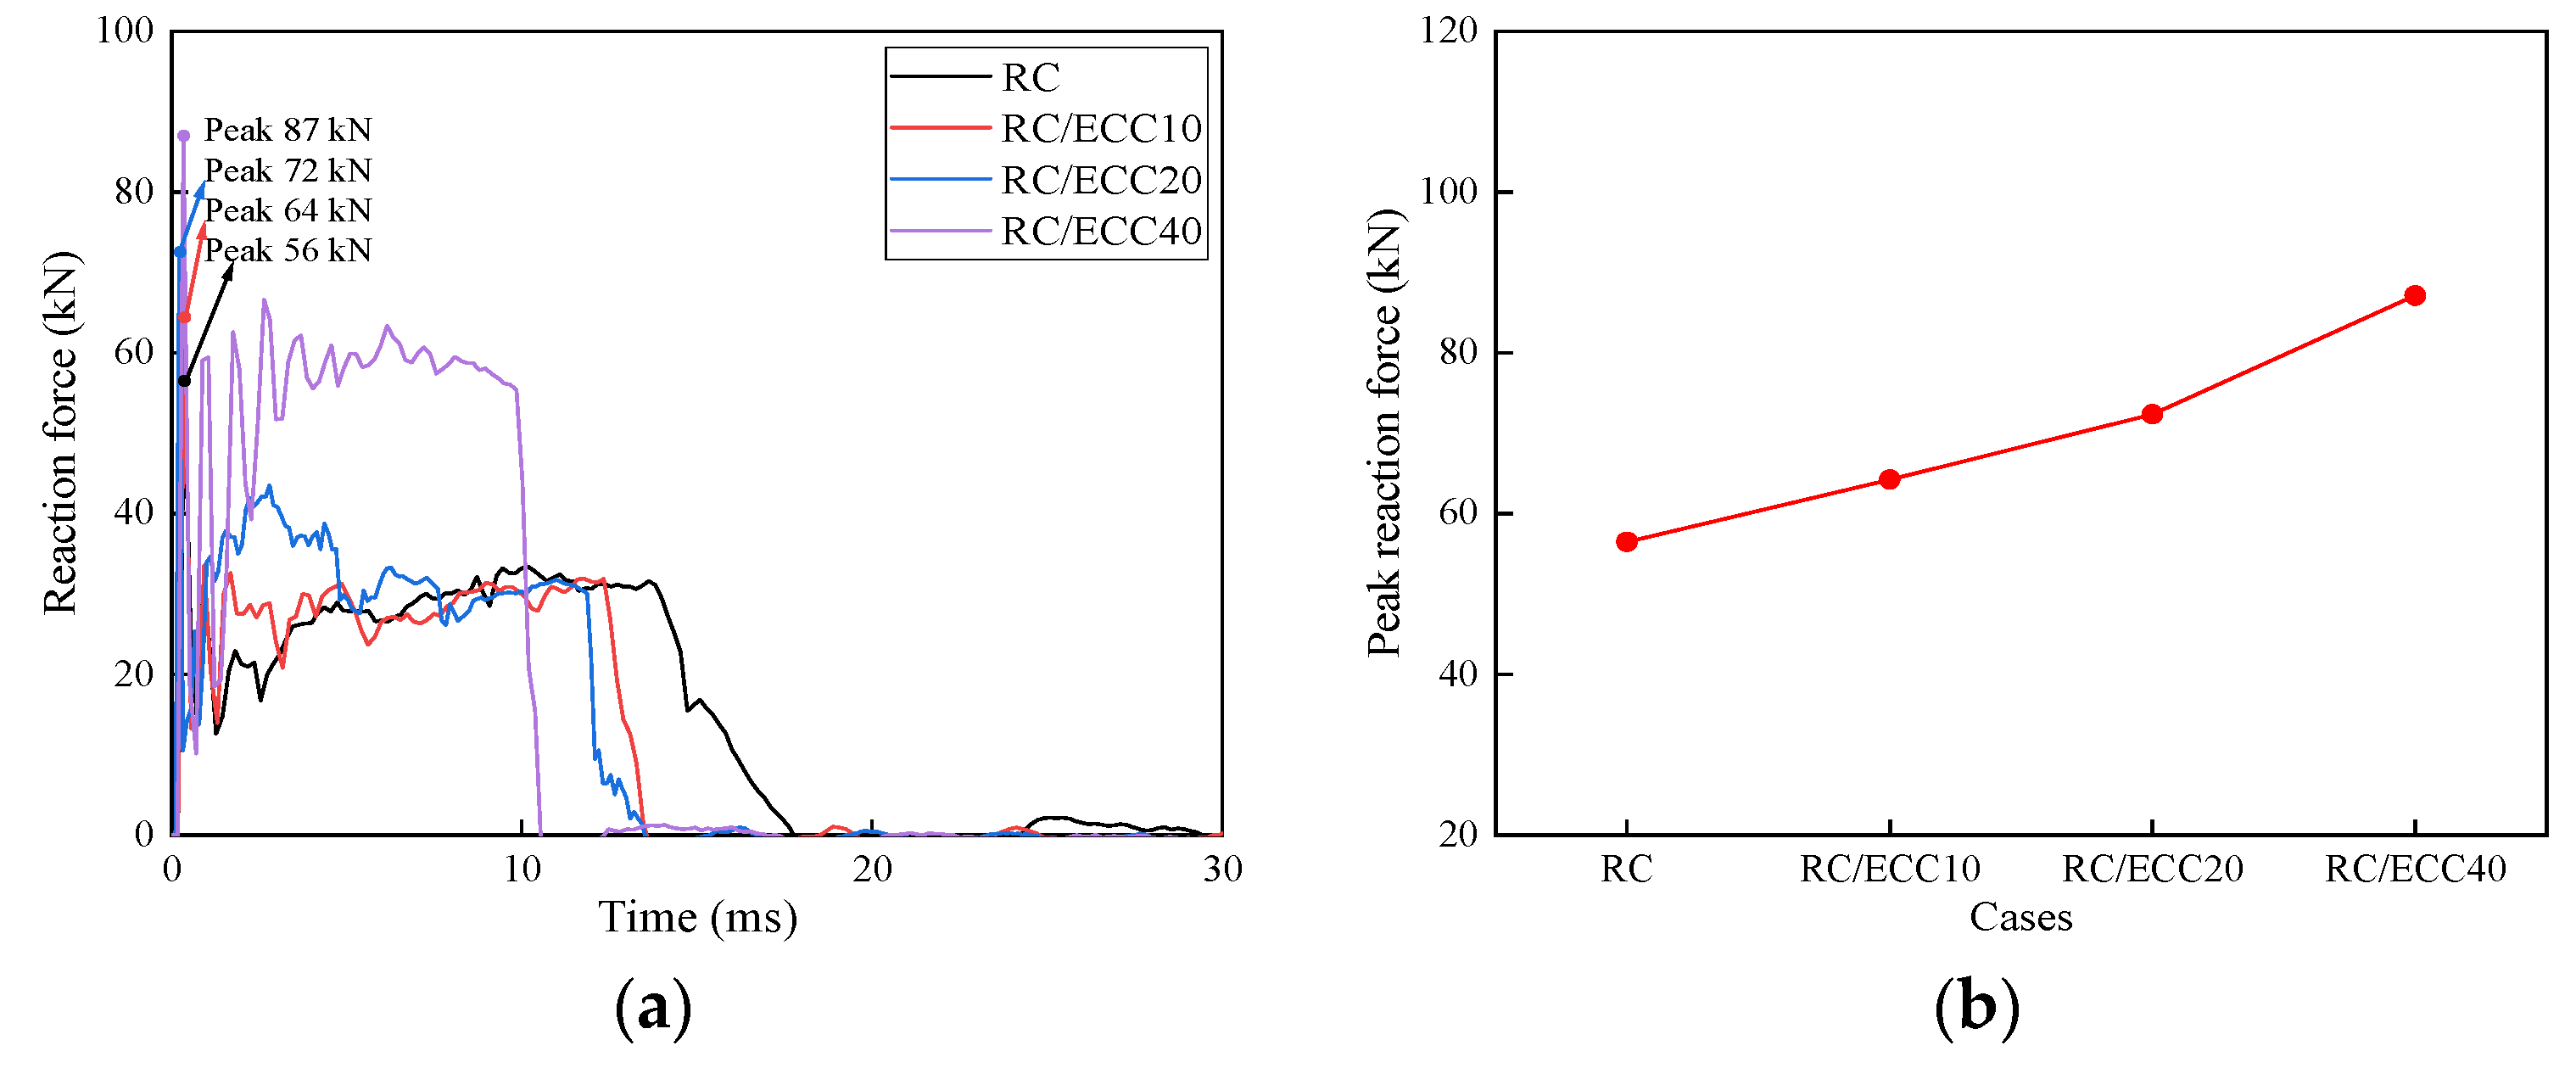
The reaction force of beams subjected to impact or other loads was often a concern, as the load was transferred to the structural members connected to the beam. In this numerical simulation, the force experienced by the supports was taken as the reaction force. Figure 19 illustrates that the reaction force increased with increasing ECC layer thickness, while the loading duration of the reaction force decreased. Further examination revealed that the impulse of the reaction force during the entire process of the impact was almost the same, regardless of the ECC layer thickness. This was due to the momentum theorem, which states that the change in momentum of a system is equal to the impulse applied to the system. While the system’s momentum change consisting of the beam with and without ECC reinforcement and the impactor was almost identical, the impulse should be more or less the same.
4.1.5. Energy Dissipation
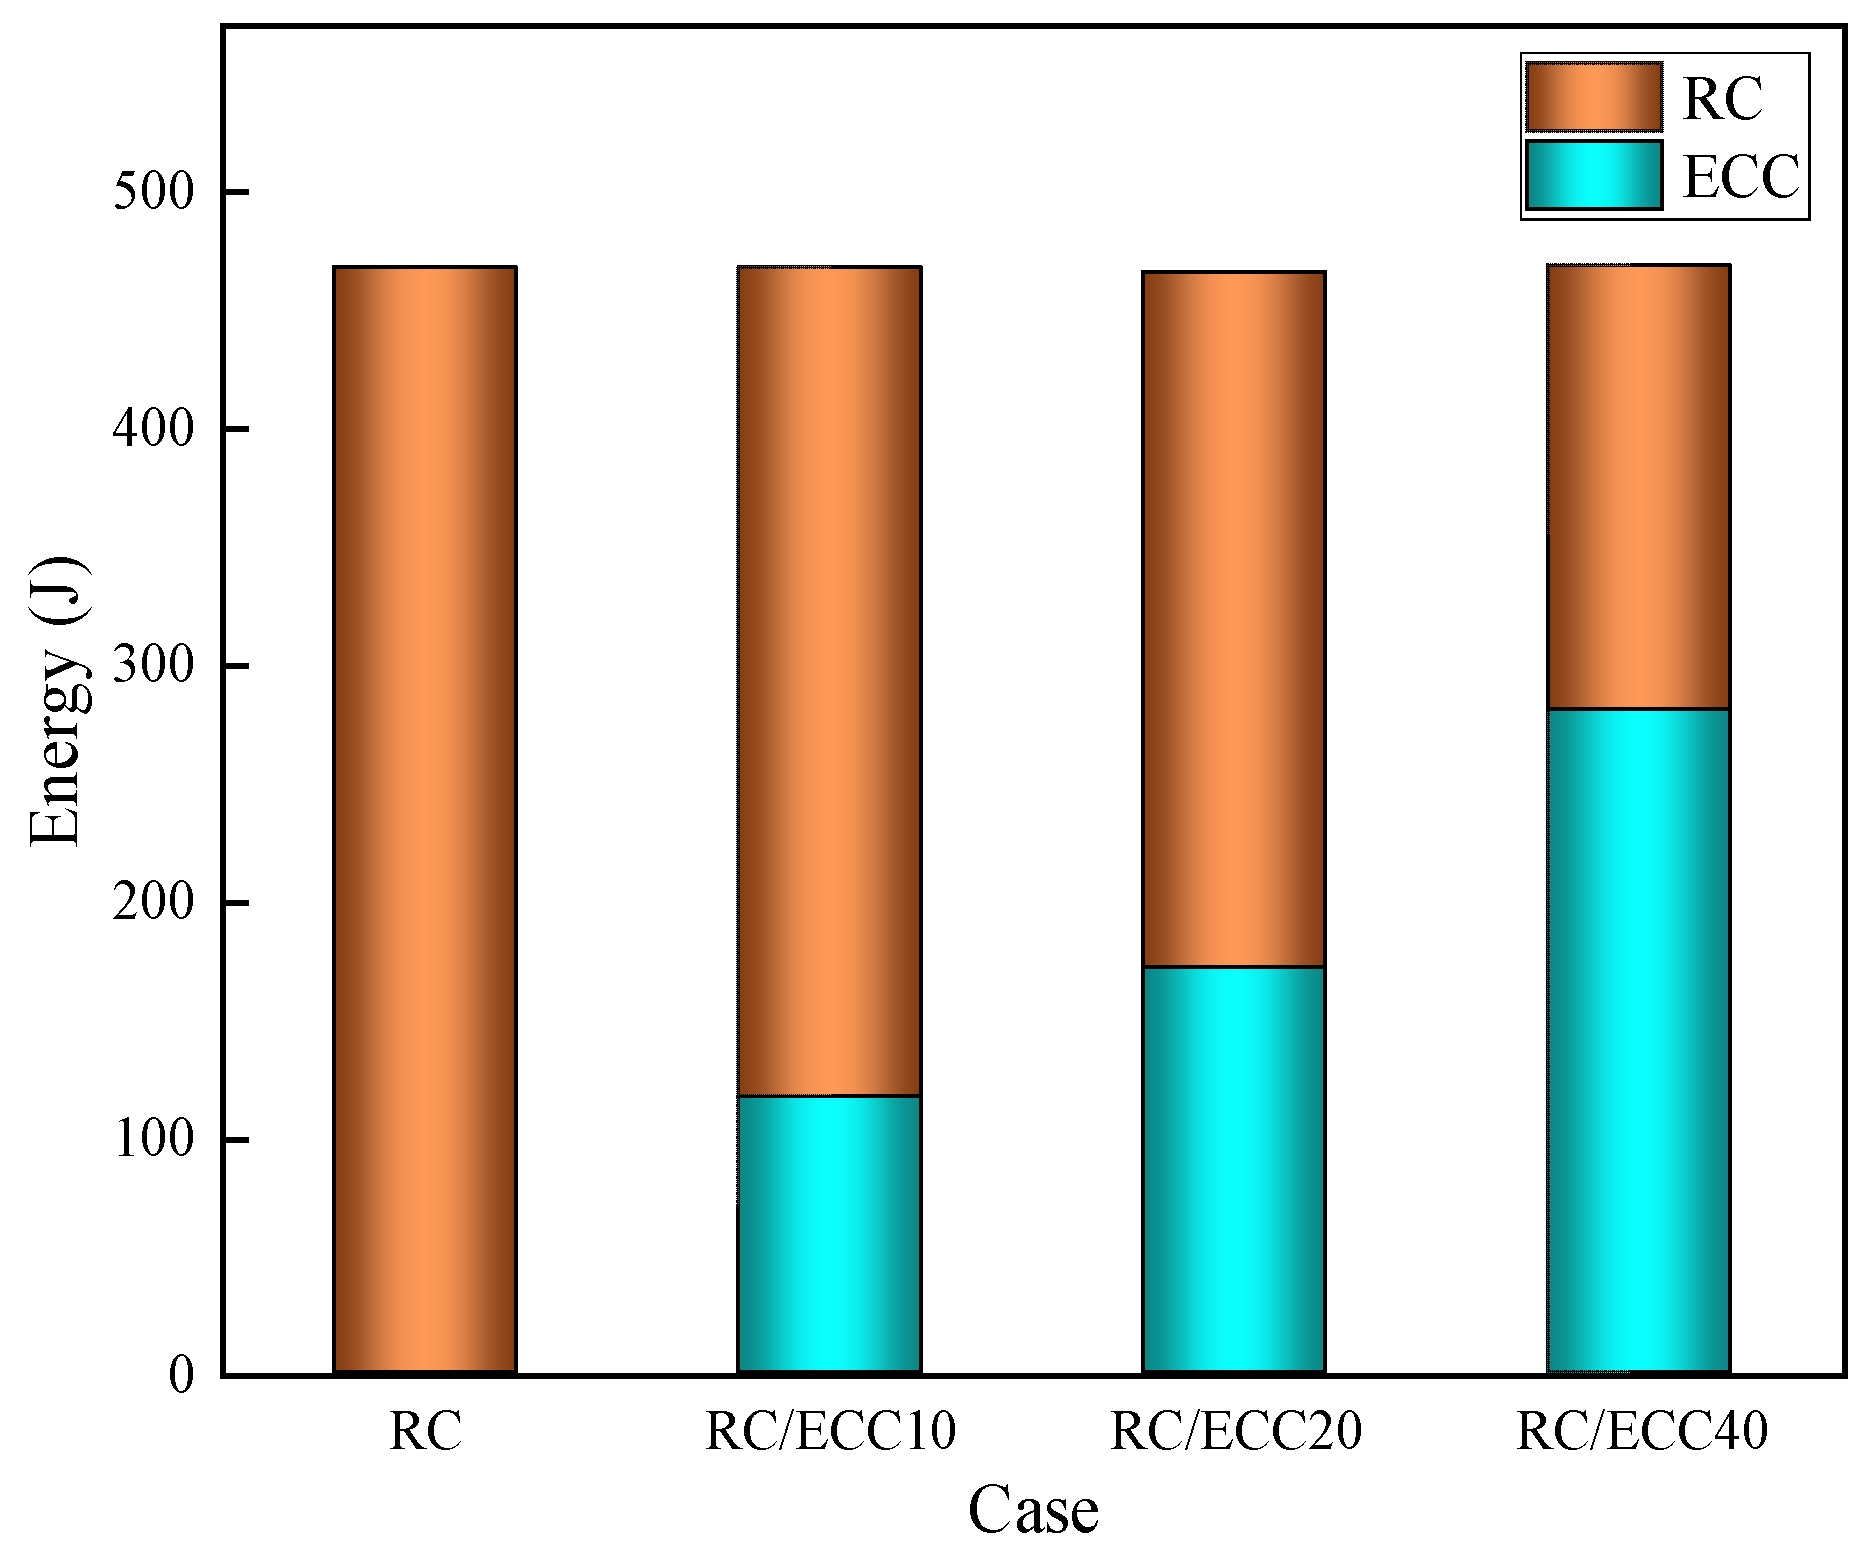
The energy dissipation capacity of the beam was also important, as the impact energy input to the system consisting of the impactor and beam must be dissipated. If the energy to the RC beam exceeds its tolerance, the beam will fail. To this end, the total energy dissipated by the RC beam–ECC layer system and the energy dissipation breakdown for the RC beam and ECC layer is provided in Table 12 and Figure 20. It was observed that the total energy of the concerned system was almost the same as the impact energy. Moreover, the portion of energy dissipated by the ECC layer increased with increasing ECC layer thickness. Consequently, the thicker the ECC layer, the less energy dissipated by the RC beam, making it safer.
4.2. ECC Reinforcement Configuration
4.2.1. Response and failure mode
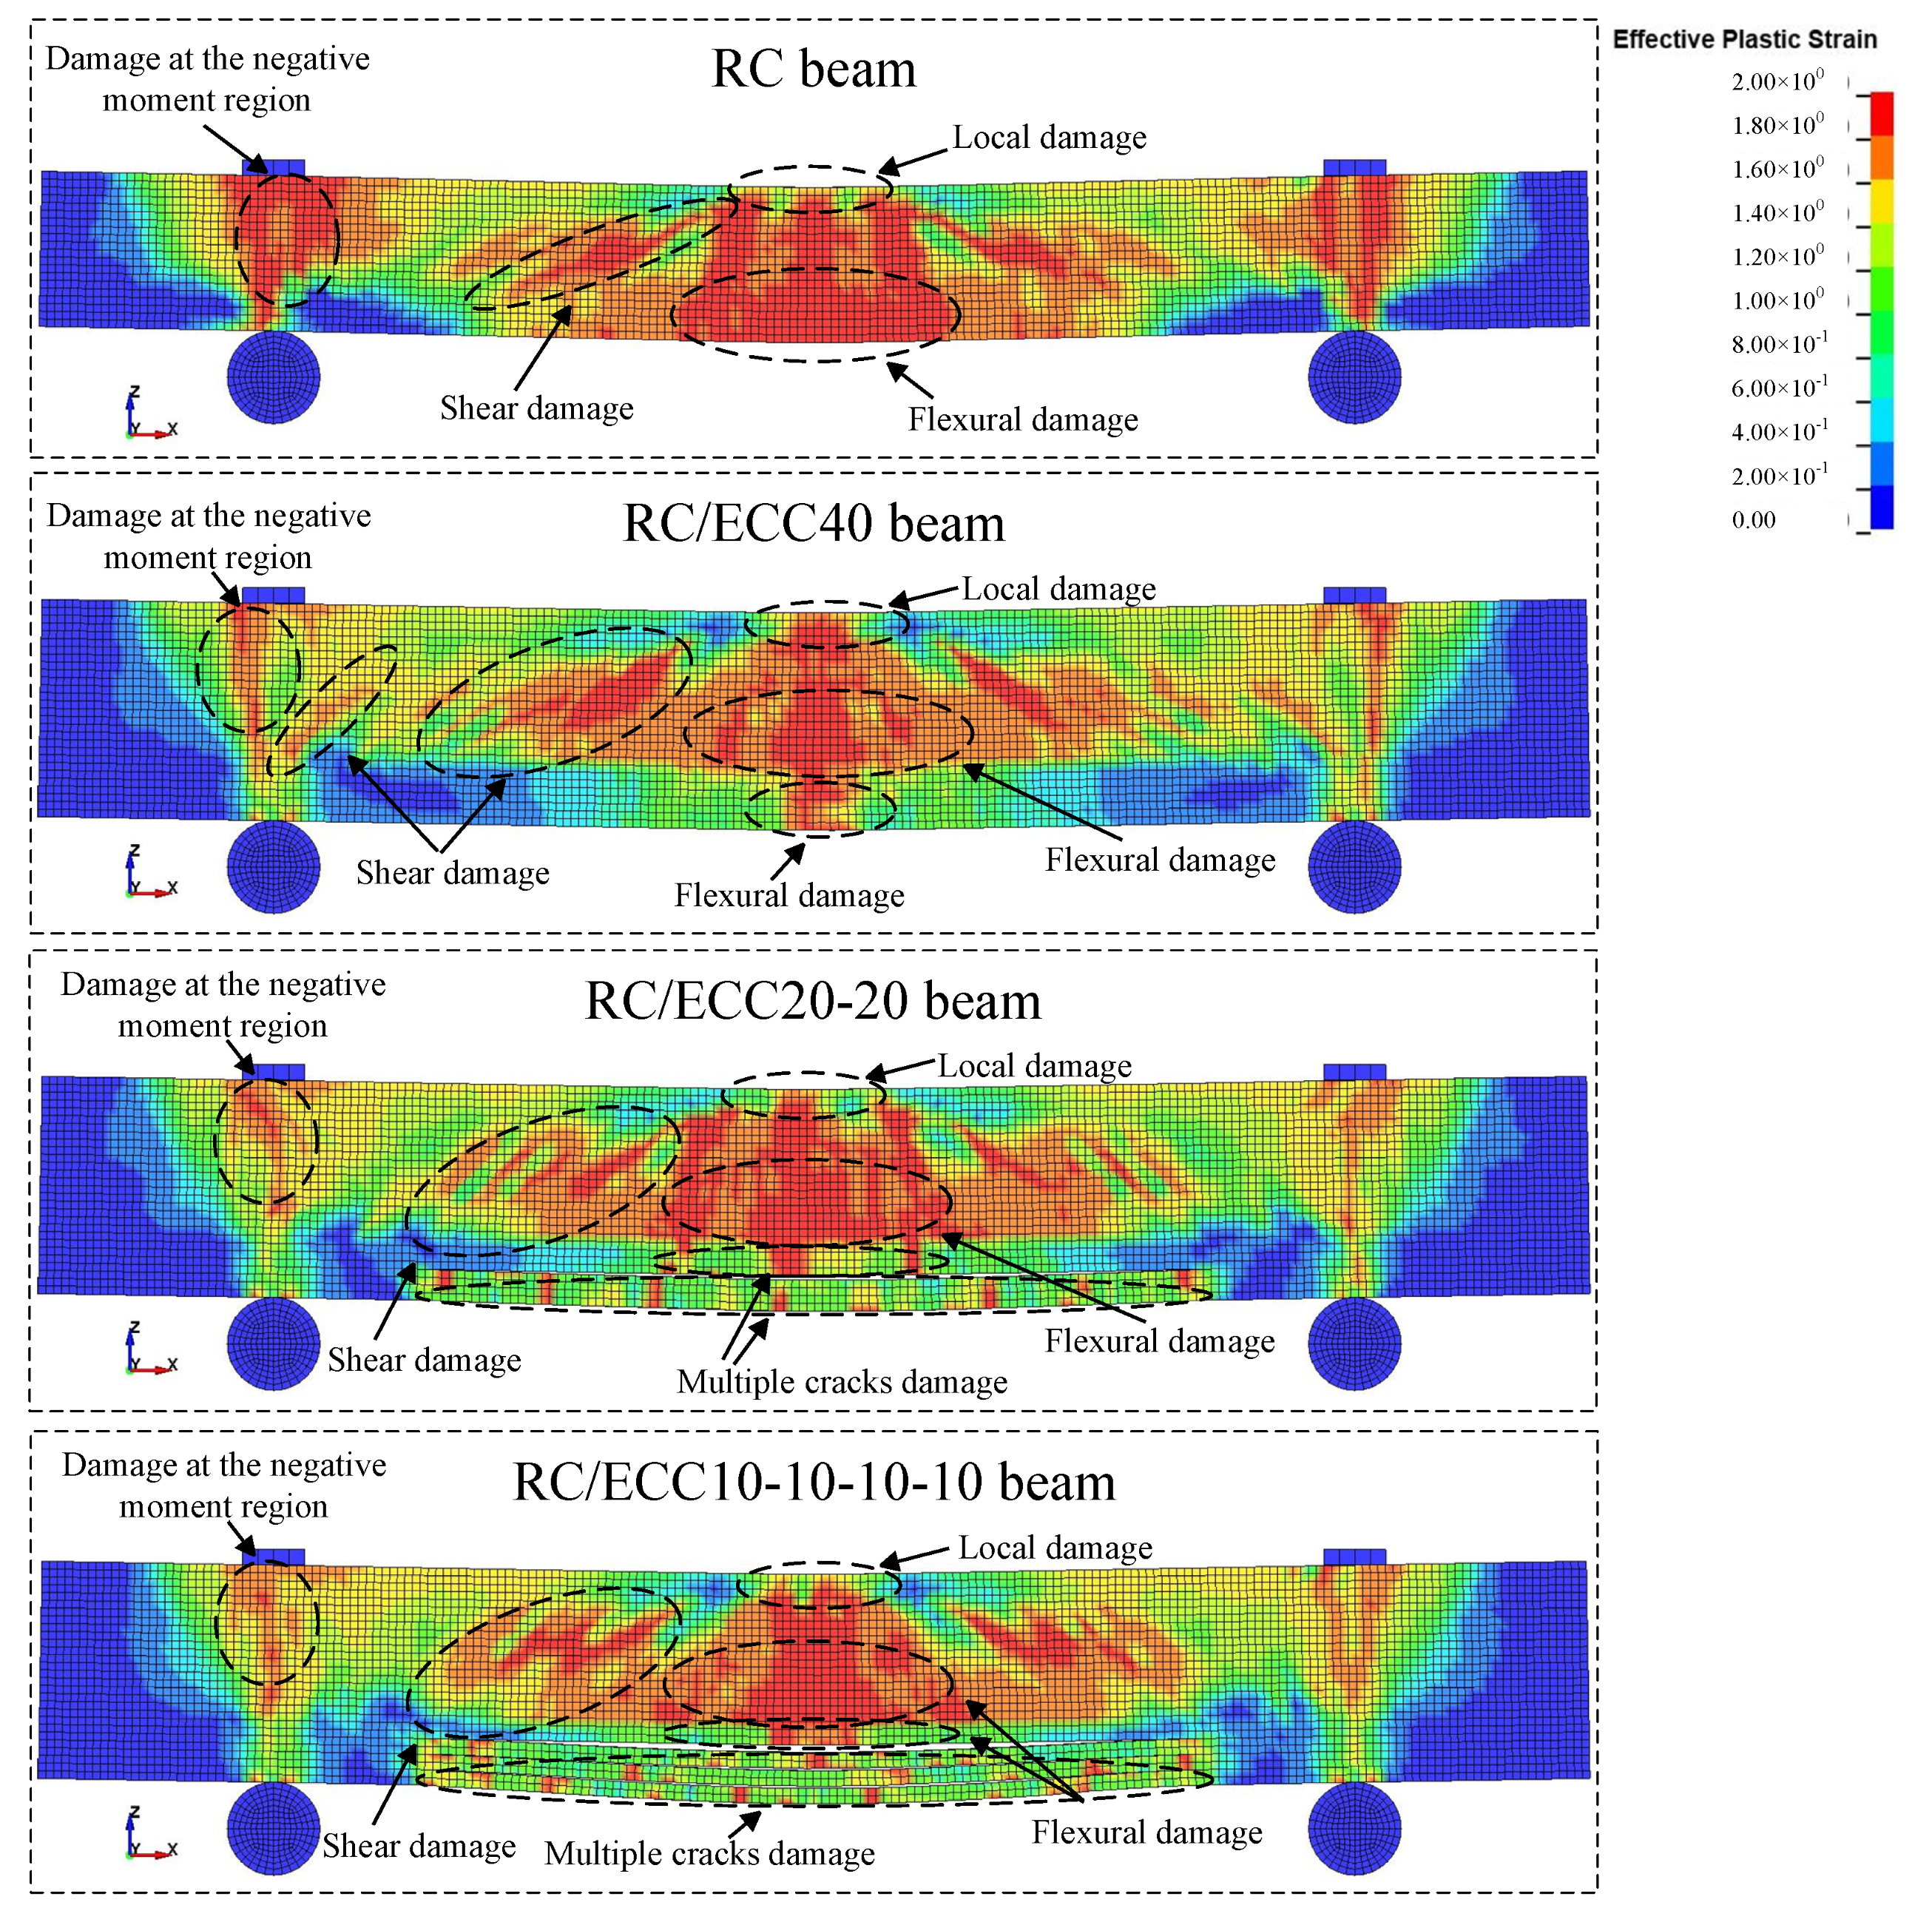
Compared with the control RC beam, the response and damage in terms of the effective plastic strain of the RC beams with different ECC reinforcement configurations were relatively less severe, as shown in Figure 21. In addition, the beam parts around the supports also exhibited the same trend. Specifically, among the three RC beams with different ECC reinforcements, the RC/ECC40 experienced more shear damage, even more severe than without ECC strengthening. The possible reason was that applying a single 40 mm ECC layer significantly increased the beam stiffness, leading to higher stress in the shear zone.
Further examination of the RC beams with ECC reinforcement revealed that while the total thickness of the ECC layer was the same, these layers underwent remarkably different response and failure patterns. An observation in common was that the ECC layer adjacent to the RC beams all experienced concentrated failure around the central region. This was likely caused by the fracture driving force from the failed RC bottom central part. Subjected to the impact load, fracture failure occurred in the central RC bottom first. The fracture propagated to the adjacent ECC layer and failed, as the connection between the RC beam and the ECC layer was firm and strong. To mitigate the possible crack propagation within the ECC layers, the ECC layer was divided into multiple layers, rather than a single layer. In so doing, the fracture propagation in ECC can be effectively terminated, and the ECC layer can be fully utilized in the ideal tension mode.
4.2.2. Mid-Span Deflection
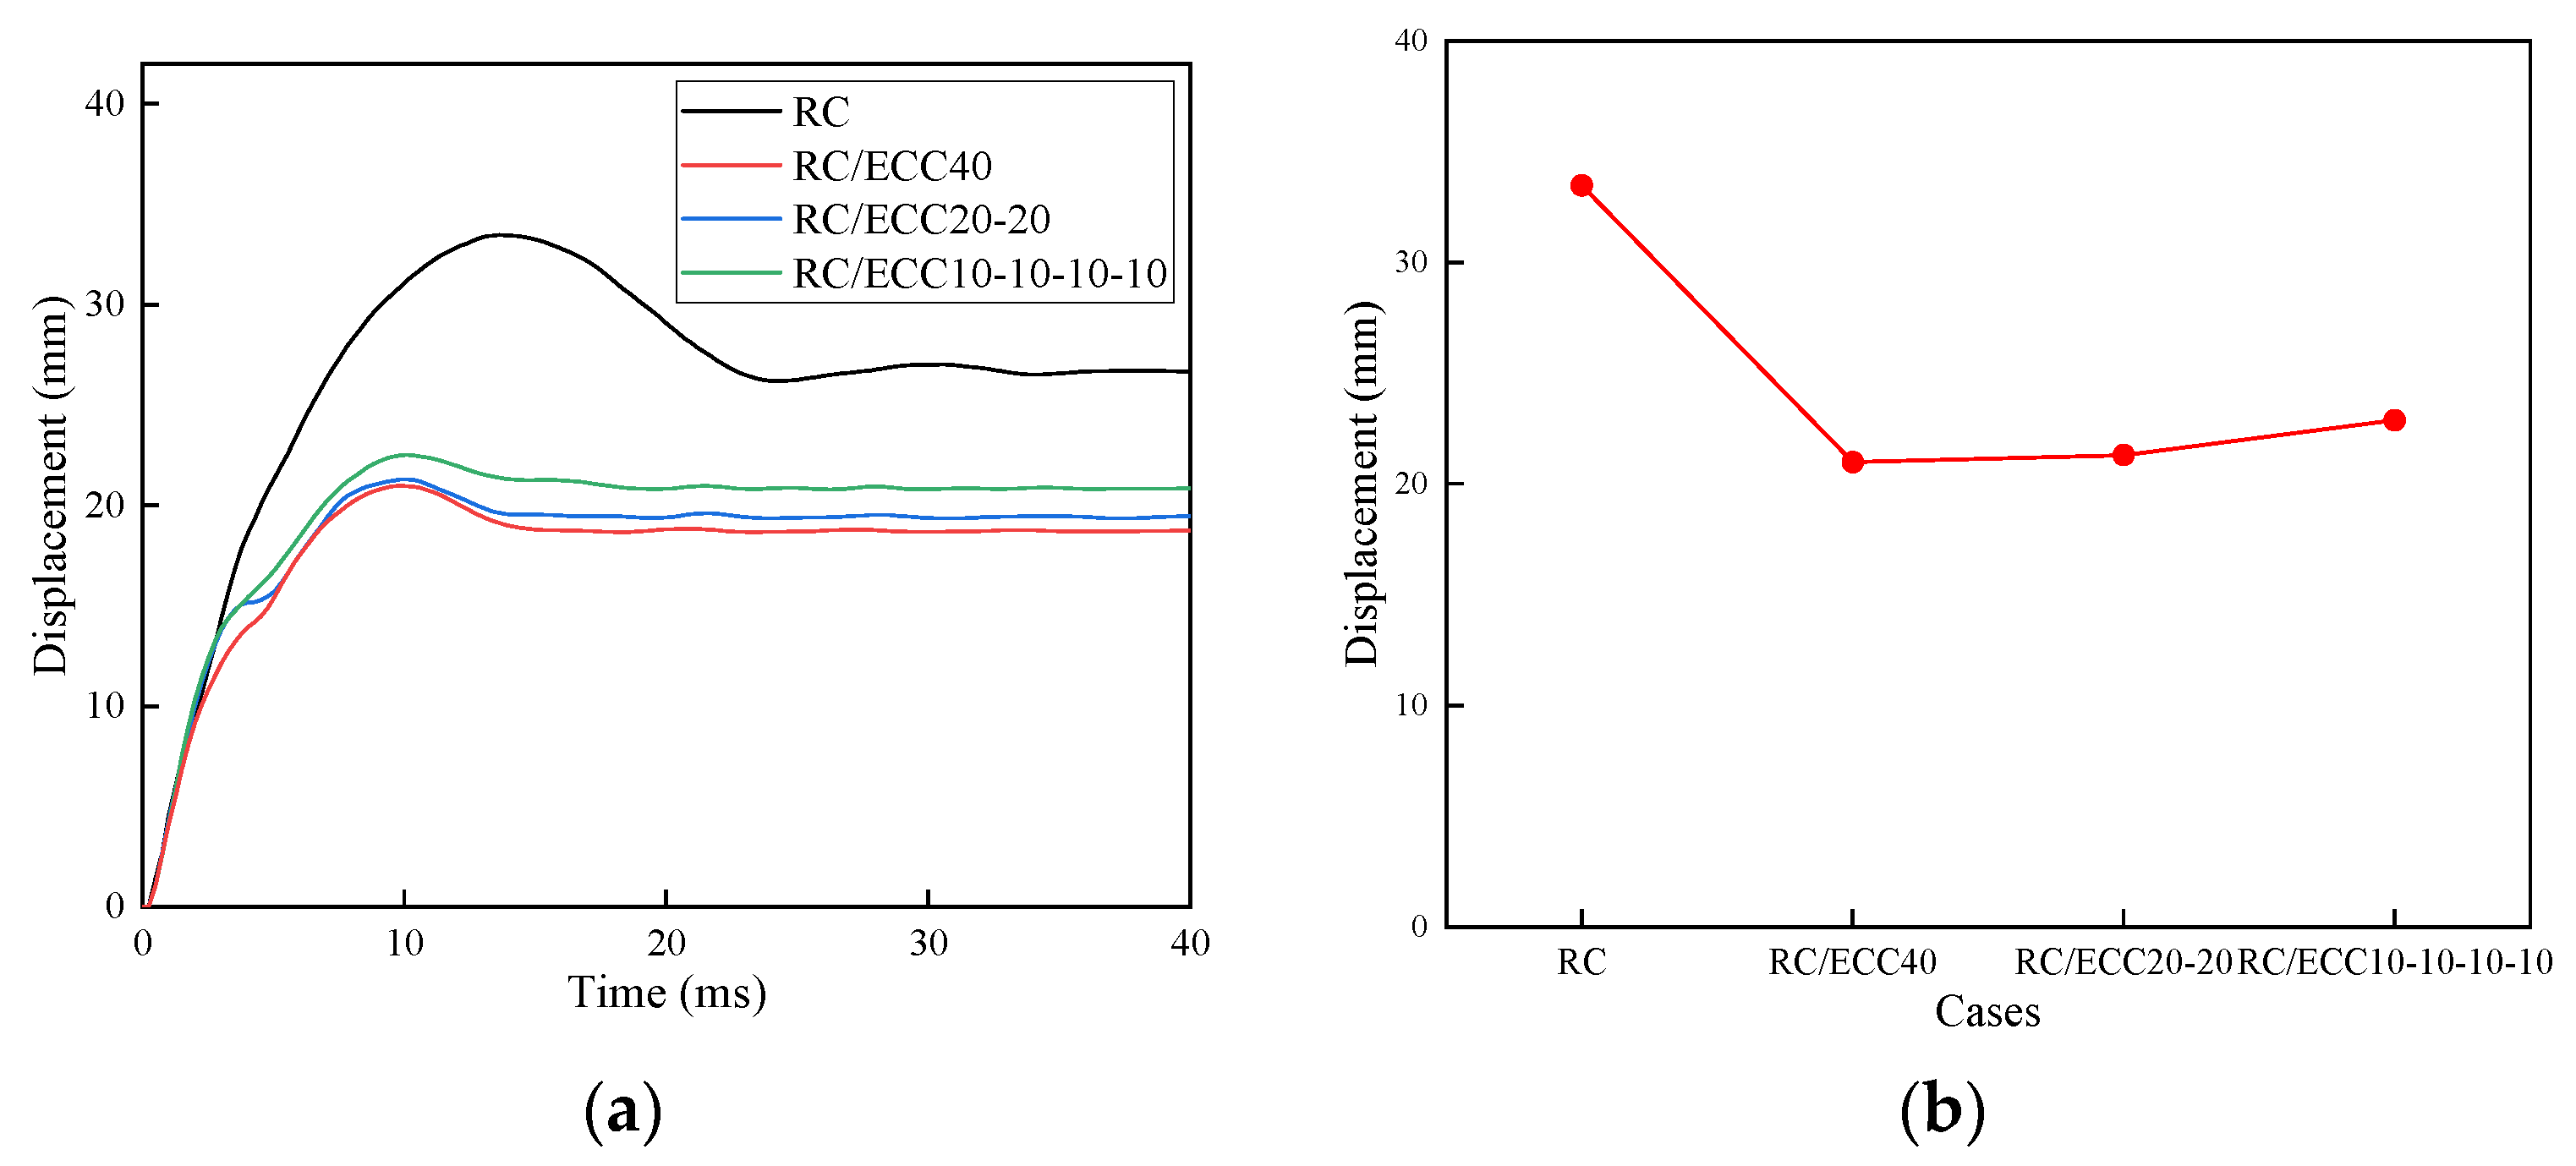
The time histories of RC beam mid-span deflection with different reinforcement suggested that with the ECC layer applied, the responses of the RC beam in terms of peak mid-span deflection were significantly reduced by applying the ECC strengthening layers, as shown in Figure 22. Furthermore, installing the ECC layers increased the stiffness of the system consisting of the RC beam and ECC layer, thus leading to a shorter natural period and hence an earlier deflection peak.
In addition, a response difference did exist among the 3 different reinforcement approaches with the same total ECC layer thickness of 40 mm subjected to the same impact load. The more layers of ECC are separated, the greater the response. The reason was that separating the ECC with more layers remarkably reduced the inter-layer shear. Consequently, vertical shear reduced vertical deformation resistance, leading to a greater response.
4.2.3. Impact Load
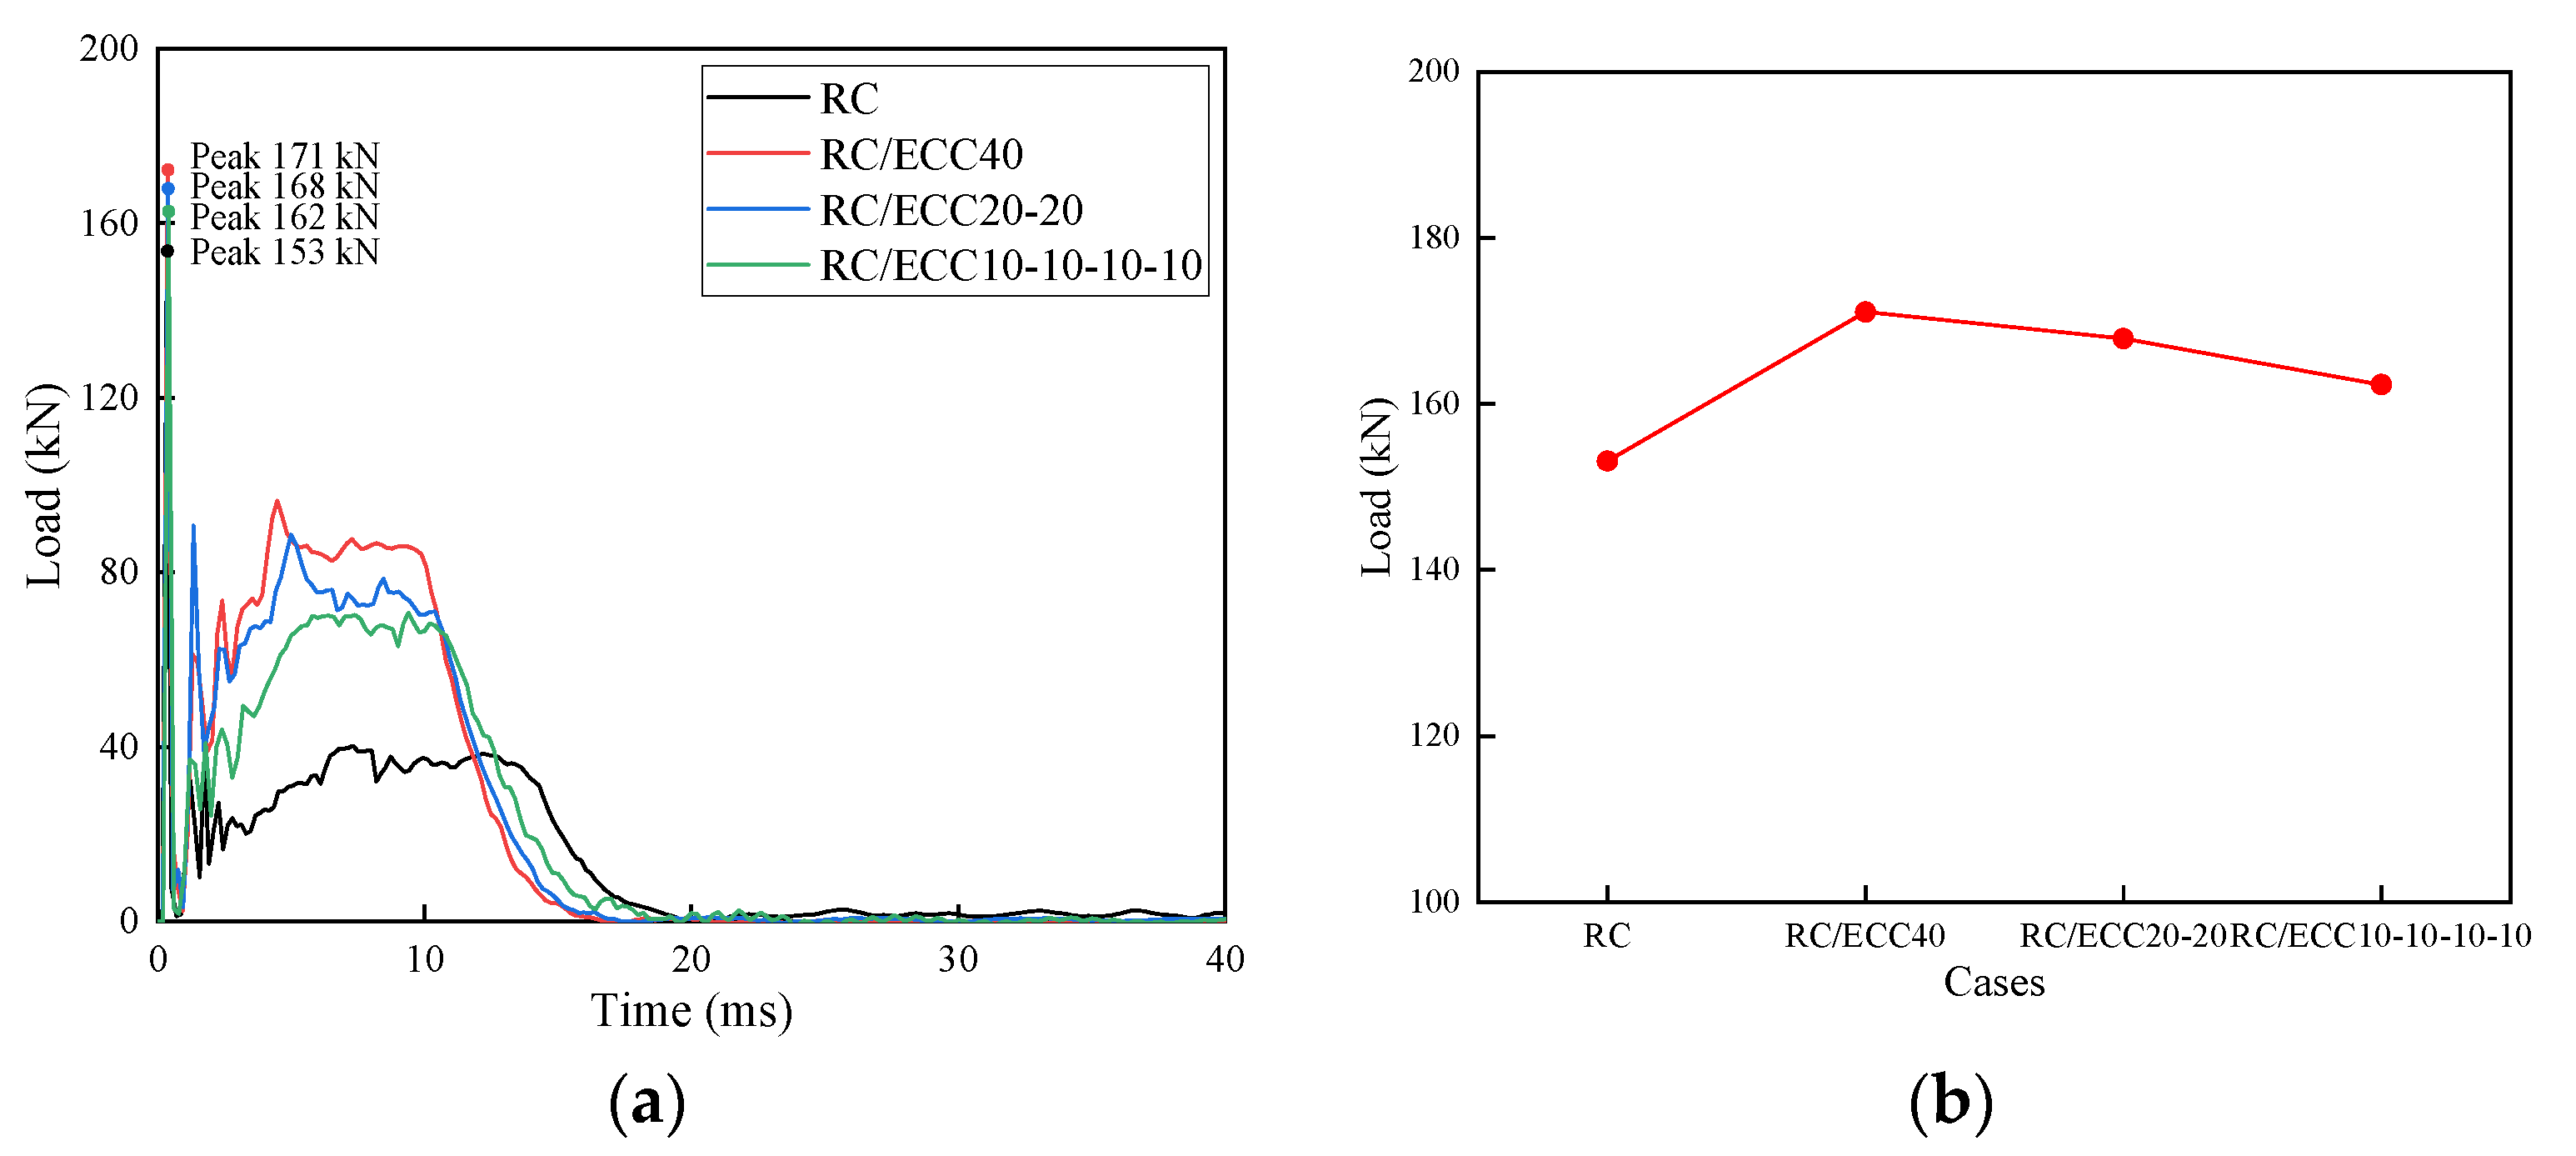
The impact load time history of those beams under low-velocity impact loads is shown in Figure 23a. The impact load of the beam increased significantly after ECC strengthening, but decreased with an increasing number of separation layer reinforcements. The peak load decreased from 171 kN of the RC/ECC40 beam to 162 kN of the RC/ECC10-10-10-10 beam, a decrease of nearly 5%, as shown in Figure 24b. This is because the effective mass of the RC/ECC10-10-10-10 beam was decreased during the response due to separation layer reinforcement. In addition, the platform force of the RC/ECC40 beam was the largest in RC/ECC members; recall that the effective stiffness of the RC/ECC40 beam was the largest. The effective stiffness of the member had reduced by the separation reinforcement layer, resulting in a lower platform force. In summary, the method of separation reinforcement layer could effectively reduce the impact load and contribute to the performance of impact resistance of the members.
4.2.4. Reaction Force
With ECC strengthening layers of different configurations, the peak of the reaction force increased, and its duration decreased, while the impulse remained almost the same, as shown in Figure 24a. Moreover, for a similar reason discussed in the preceding section, the stiffness of the system consisting of the RC beam and the ECC layer decreased with increasing ECC separate layers, accounting for the observations in Figure 24.
4.2.5. Energy Dissipation
The energy dissipation of the RC beam with different ECC reinforcement configurations is listed in Table 13 and shown in Figure 25, in which the breakdown of energy dissipation by each component is incorporated. While the impact energy input to the system consisting of the RC beam and ECC layers was the same, the 40 mm thick ECC layer dissipated the majority of energy; thus, the energy needed to be dissipated by the RC beam was significantly reduced.
Figure 25 shows that among the three 40 mm ECC reinforcement configurations, the energy absorption capacity slightly increased with increasing ECC separate layers. Moreover, within a specific layer configuration, the farther the layer is away from the RC beam, the more energy is dissipated. The underlying mechanism was that, on the one hand, the farther layers experienced relatively larger stress and strain in beam bending. On the other hand, the top ECC layer likely underwent concentrated damage at its mid-span due to the failure of the adjacent RC beam part. Recall in Figure 21, except for the ECC layer close to the RC beam exhibiting concentrated damage, all the other layers experienced a typical strain hardening response mode, suggesting there may still be some capacity for more energy input.
In summary, based on the impact mitigation performance of applying ECC strengthening layers in terms of the response and damage mode summarized in Table 14, the proposed approach in the present study effectively reduced the RC beam response and damage. In particular, separating the ECC reinforcement into multiple layers more efficiently utilized the excellent tensile performance of ECC, thus recommended for strengthening the RC beam potentially subjected to impact.
5. Conclusions
To improve the impact performance of RC beams, applying ECC reinforcement layers to the beam bottom was proposed. With a validated numerical model, the retrofit effectiveness was evaluated and discussed in detail in terms of the response and damage mode. In addition, also discussed were the mid-span deformation of the RC beam, the reaction force, and the energy dissipation, from which the following conclusions can be reached.
- The damage degree of members subjected to impact load was reduced in the central region and around the supports. The deformation was effectively controlled, and the energy dissipation capacity was significantly increased with the increasing thickness of the ECC layer. However, the ECC layer adjacent to the RC beam suffered concentrated damage around the mid-span due to the firm bonding to the beam and the beam fracture at the region.
- The impact load and transferred load were significantly increased with the increasing thickness of the ECC layer by 12% and 55.4%, respectively, for the 40 mm ECC reinforcement layer.
- The ECC separation layer reinforcement method was proposed by optimizing the reinforcement method. While sacrificing part of the deformation control capacity, the peak deflection was increased by 9%. In addition, the peak impact load and transferred load were reduced by 5% and 14%, respectively. Moreover, the energy consumption utilization of the ECC layer was improved by 21%.
- Separating the ECC reinforcement into multiple layers outperformed the counterparts with the same total ECC thickness by stopping the fracture at the interface between ECC layers.
The separating reinforcement method was applied to ECC-reinforced RC beams to achieve progressive failure to the member. The highly ductile characteristic of the ECC was sufficiently utilized, significantly improving the protection performance of ECC-reinforced RC beams subjected to impact load. While the impact performance and discussions in the present study were based on numerical simulation with a validated model, the conclusions should be further verified, preferably by testing. Therefore, in the future, an impact test of RC beams with different reinforcement approaches will be conducted to further confirm the findings. This will facilitate their application in engineering practice.
Funding
The work was supported by the National Natural Science Foundation of China (NSFC) with grant number 51778028.
Data Availability Statement
Data will be made available on request.
Conflicts of Interest
The authors declare no conflict of interest.
Glossary
| σy | Quasi-static yield strength |
| σd | Dynamic yield strength |
| C, p | Material constants for Cowper–Symonds model |
| Equivalent strain rate | |
| DIFt | Dynamic increase factor |
| ρ | Density |
| E | Young’s modulus |
| μ | Poisson’s ratio |
| aiy, aim, air | Strength surface parameter |
| P | Hydrostatic pressure |
| Δσ | Equivalent stress |
| J2 | Second invariant of the deviatoric stress tensor |
| rf | Dynamic increase factor |
| η | Damage evolution function |
| λ | Accumulated effective plastic strain |
| Increment of effective plastic strain | |
| ft | Tensile strength |
| b1, b2 | Damage parameters for the K&C model |
References
- Grebowski, K.; Wrobel, A. Architectural and urban planning solutions for the protection of heritage buildings in the context of terrorist attacks: Following the example of passive protection systems. Buildings 2022, 12, 988. [Google Scholar] [CrossRef]
- Jing, Y.; Zhang, X.; Zhou, Y.; Zhao, Y.; Li, W. Dynamic response and impact force calculation of PC box girder bridge subjected to over-height vehicle collision. Buildings 2023, 13, 495. [Google Scholar] [CrossRef]
- Cai, J.; Ye, J.B.; Chen, Q.J.; Liu, X.P.; Wang, Y.Q. Dynamic behaviour of axially-loaded RC columns under horizontal impact loading. Eng. Struct. 2018, 168, 684–697. [Google Scholar] [CrossRef]
- Yang, Y.K.; Wu, C.Q.; Liu, Z.; Li, J.; Yang, T.; Jiang, X. Characteristics of 3D-printing ultra-high performance fibre-reinforced concrete under impact loading. Int. J. Impact Eng. 2022, 164, 104205. [Google Scholar] [CrossRef]
- Li, Y.; Chen, Z.Y.; Ren, X.B.; Tao, R.; Gao, R.X.; Fang, D.N. Experimental and numerical study on damage mode of RC slabs under combined blast and fragment loading. Int. J. Impact Eng. 2020, 142, 103579. [Google Scholar] [CrossRef]
- Shi, Y.C.; Hu, Y.; Liu, S.Z.; Cui, J.; Chen, L. Mitigation of the blast load on RC column by hanging granite slabs. Eng. Struct. 2023, 280, 115668. [Google Scholar] [CrossRef]
- Daneshvar, K.; Moradi, M.J.; Ahmadi, K.; Hajiloo, H. Strengthening of corroded reinforced concrete slabs under multi-impact loading: Experimental results and numerical analysis. Constr. Build. Mater. 2021, 284, 122650. [Google Scholar] [CrossRef]
- Daneshvar, K.; Moradi, M.J.; Amooie, M.; Chen, S.Y.; Mahdavi, G.; Mariri, M.A. Response of low-percentage FRC slabs under impact loading: Experimental, numerical, and soft computing methods. Structures 2020, 27, 975–988. [Google Scholar] [CrossRef]
- Daneshvar, K.; Moradi, M.J.; Khaleghi, M.; Rezaei, M.; Farhangi, V.; Hajiloo, H. Effects of impact loads on heated-and-cooled reinforced concrete slabs. J. Build. Eng. 2022, 61, 105328. [Google Scholar] [CrossRef]
- Sahmaran, M.; Li, V.C.; Andrade, C. Corrosion resistance performance of steel-reinforced engineered cementitious composite beams. ACI Mater. J. 2008, 105, 243–250. [Google Scholar]
- Pham, T.M.; Chen, W.S.; Elchalakani, M.; Do, T.V.; Hao, H. Sensitivity of lateral impact response of RC columns reinforced with GFRP bars and stirrups to concrete strength and reinforcement ratio. Eng. Struct. 2021, 242, 112512. [Google Scholar] [CrossRef]
- Jin, H.S.; Li, F.F.; Hu, D.H. Research on the flexural performance of reinforced engineered cementitious composite beams. Struct. Concr. 2022, 23, 2198–2220. [Google Scholar] [CrossRef]
- Krishnaraja, A.R.; Kandasamy, S. Flexural Performance of Hybrid Engineered Cementitious Composite Layered Reinforced Concrete Beams. Period. Polytech.-Civ. Eng. 2019, 62, 921–929. [Google Scholar] [CrossRef]
- Perumal, R. Performance and modeling of high-performance steel fiber reinforced concrete under impact loads. Comput. Concr. 2014, 13, 255–270. [Google Scholar] [CrossRef]
- Khalil, A.; Elkafrawy, M.; Abuzaid, W.; Hawileh, R.; AlHamaydeh, M. Flexural performance of RC beams strengthened with pre-stressed iron-based shape memory alloy (fe-sma) bars: Numerical study. Buildings 2022, 12, 2228. [Google Scholar] [CrossRef]
- Orlowsky, J.; Bessling, M.; Kryzhanovskyi, V. Prospects for the use of textile-reinforced concrete in buildings and structures maintenance. Buildings 2023, 13, 189. [Google Scholar] [CrossRef]
- Pohoryles, D.A.; Melo, J.; Rossetto, T. Combined flexural and shear strengthening of RC T-beams with FRP and TRM: Experimental study and parametric finite element analyses. Buildings 2021, 11, 520. [Google Scholar] [CrossRef]
- Bahrami, A.; Agren, F.; Kollberg, K. Strengthening solutions for deep reinforced concrete beam with cutout opening. Buildings 2021, 11, 370. [Google Scholar] [CrossRef]
- Haroon, M.; Moon, J.S.; Kim, C. Performance of reinforced concrete beams strengthened with carbon fiber reinforced polymer strips. Materials 2021, 14, 5866. [Google Scholar] [CrossRef]
- Wang, W.Q.; Wu, C.Q.; Li, J. Numerical simulation of hybrid FRP-concrete-steel double-skin tubular columns under close-range blast loading. J. Compos. Constr. 2018, 22, 04018036. [Google Scholar] [CrossRef]
- Chen, W.S.; Pham, T.M.; Sichembe, H.; Chen, L.; Hao, H. Experimental study of flexural behaviour of RC beams strengthened by longitudinal and U-shaped basalt FRP sheet. Compos. Part B-Eng. 2018, 134, 114–126. [Google Scholar] [CrossRef] [Green Version]
- Ma, G.W.; Huang, Y.M.; Aslani, F.; Kim, T. Tensile and bonding behaviours of hybridized BFRP-steel bars as concrete reinforcement. Constr. Build. Mater. 2019, 201, 62–71. [Google Scholar] [CrossRef]
- Zhao, Y.J.; Huang, Y.M.; Du, H.Y.; Ma, G.W. Flexural behaviour of reinforced concrete beams strengthened with pre-stressed and near surface mounted steel-basalt-fibre composite bars. Adv. Struct. Eng. 2020, 23, 1154–1167. [Google Scholar] [CrossRef]
- Si, P.; Liu, Y.; Yan, J.B.; Bai, F.; Huang, F.L. Ballistic performance of polyurea-reinforced ceramic/metal armor subjected to projectile impact. Materials 2022, 15, 3918. [Google Scholar] [CrossRef] [PubMed]
- Zhang, Y.; Hu, J.H.; Zhao, W.D.; Hu, F.; Yu, X. Numerical simulation of the blast resistance of SPUA retrofitted CMU masonry walls. Buildings 2023, 13, 446. [Google Scholar] [CrossRef]
- More, F.M.D.S.; Subramanian, S.S. Impact of fibres on the mechanical and durable behaviour of fibre-reinforced concrete. Buildings 2022, 12, 1436. [Google Scholar] [CrossRef]
- Ahmad, J.; Burduhos-Nergis, D.D.; Arbili, M.M.; Alogla, S.M.; Majdi, A.; Deifalla, A.F. A review on failure modes and cracking behaviors of polypropylene fibers reinforced concrete. Buildings 2022, 12, 1951. [Google Scholar] [CrossRef]
- Li, G.; Tan, K.H.; Fung, T.C.; Yu, Q.J.; May, M. A coupled dynamic cohesive zone model for FRP-concrete mixed-mode separation. Compos. Struct. 2021, 268, 113872. [Google Scholar] [CrossRef]
- Ha, N.S.; Marundrury, S.S.; Pham, T.M.; Pournasiri, E.; Shi, F.; Hao, H. Effect of grounded blast furnace slag and rice husk ash on performance of ultra-high-performance concrete (UHPC) subjected to impact loading. Constr. Build. Mater. 2022, 329, 127213. [Google Scholar] [CrossRef]
- Kaya, Y.; Biricik, O.; Bayqra, S.H.; Mardani, A. Effect of fibre type and utilisation rate on dimensional stability and frost resistance of pavement mortar mixture. Int. J. Pavement Eng. 2023, 24, 2154351. [Google Scholar] [CrossRef]
- Cai, S.X.; Lin, J.H.; Fan, K.F.; Chen, Y.Y.; Wang, Z.P. Study on the bonding performance between basalt textile and concrete under freeze-thaw cycles. Eng. Fail. Anal. 2023, 146, 107095. [Google Scholar]
- Ding, Y.; Liu, J.P.; Yao, G.; Wei, W.; Mao, W.H. Cyclic bond behavior and bond stress-slip constitutive model of rebar embedded in hybrid fiber reinforced strain-hardening cementitious composites. Constr. Build. Mater. 2023, 369, 130582. [Google Scholar] [CrossRef]
- Qian, H.; Wang, X.Y.; Li, Z.A.; Zhang, Y.Y. Experimental study on re-centering behavior and energy dissipation capacity of prefabricated concrete frame joints with shape memory alloy bars and engineered cementitious composites. Eng. Struct. 2023, 277, 115394. [Google Scholar] [CrossRef]
- Zhou, H.Y.; Wu, J.H.; Wang, X.J.; Chen, Y.; Du, X.L.; Yu, S.J. Performance of engineered cementitious composite (ECC) monolithic and composite slabs subjected to near-field blast. Eng. Struct. 2023, 279, 115561. [Google Scholar] [CrossRef]
- Zhu, J.X.; Xu, L.Y.; Huang, B.T.; Weng, K.F.; Dai, J.G. Recent developments in engineered/strain-hardening cementitious composites (ECC/SHCC) with high and ultra-high strength. Constr. Build. Mater. 2022, 342, 127956. [Google Scholar] [CrossRef]
- Li, V.C. From micromechanics to structural engineering the design of cementitious composites for civil engineering applications. Doboku Gakkai Ronbunshu 1993, 471, 1–12. [Google Scholar] [CrossRef] [PubMed] [Green Version]
- Singh, M.; Saini, B.; Chalak, H.D. Performance and composition analysis of engineered cementitious composite (ECC)—A review. J. Build. Eng. 2019, 26, 100851. [Google Scholar] [CrossRef]
- Yu, K.Q.; Wang, Y.C.; Yu, J.T.; Xu, S.L. A strain-hardening cementitious composites with the tensile capacity up to 8%. Constr. Build. Mater. 2017, 137, 410–419. [Google Scholar] [CrossRef]
- Yu, K.Q.; Ding, Y.; Zhang, Y.X. Size effects on tensile properties and compressive strength of engineered cementitious composites. Cem. Concr. Compos. 2020, 113, 103691. [Google Scholar]
- Chen, Y.X.; Yu, J.; Leung, C.K.Y. Use of high strength Strain-Hardening Cementitious Composites for flexural repair of concrete structures with significant steel corrosion. Constr. Build. Mater. 2018, 167, 325–337. [Google Scholar] [CrossRef]
- Qin, F.J.; Zhang, Z.G.; Yin, Z.W.; Di, J.; Xu, L.J.; Xu, X.Q. Use of high strength, high ductility engineered cementitious composites (ECC) to enhance the flexural performance of reinforced concrete beams. J. Build. Eng. 2020, 32, 101746. [Google Scholar] [CrossRef]
- Tinoco, M.P.; Silva, F.D. Repair of pre-damaged RC beams using hybrid fiber reinforced strain hardening cementitious composites. Eng. Struct. 2021, 235, 112081. [Google Scholar] [CrossRef]
- Maalej, M.; Quek, S.T.; Zhang, J. Behavior of hybrid-fiber engineered cementitious composites subjected to dynamic tensile loading and projectile impact. J. Mater. Civ. Eng. 2005, 17, 143–152. [Google Scholar] [CrossRef]
- Ranade, R.; Li, V.C.; Heard, W.F. Tensile rate effects in high strength-high ductility concrete. Cem. Concr. Res. 2015, 68, 94–104. [Google Scholar] [CrossRef]
- Curosu, I.; Mechtcherine, V.; Millon, O. Effect of fiber properties and matrix composition on the tensile behavior of strain-hardening cement-based composites (SHCCs) subject to impact loading. Cem. Concr. Res. 2016, 82, 23–35. [Google Scholar] [CrossRef]
- Getter, D.J.; Kantrales, G.C.; Consolazio, G.R.; Eudy, S.; Fallaha, S. Strain rate sensitive steel constitutive models for finite element analysis of vessel-structure impacts. Mar. Struct. 2015, 44, 171–202. [Google Scholar] [CrossRef]
- Japan Society of Civil Engineers. Recommendations for Design and Construction of High Performance Fiber Reinforced Cement Composites with Multiple Fine Cracks; Japan Society of Civil Engineers: Tokyo, Japan, 2008. [Google Scholar]
- Xu, S.L.; Chen, B.K.; Li, Q.H.; Zhou, F.; Yin, X.; Jiang, X.; Wu, P. Experimental and numerical investigations on ultra-high toughness cementitious composite slabs subjected to close-in blast loadings. Cem. Concr. Compos. 2022, 126, 104339. [Google Scholar] [CrossRef]
- Li, Q.H.; Chen, B.K.; Xu, S.L.; Zhou, F.; Yin, X.; Jiang, X.; Wu, P. Experiment and numerical investigations of ultra-high toughness cementitious composite slabs under contact explosions. Int. J. Impact Eng. 2022, 159, 104033. [Google Scholar] [CrossRef]
- Yang, E.H.; Li, V.C. Strain-rate effects on the tensile behavior of strain-hardening cementitious composites. Constr. Build. Mater. 2014, 52, 96–104. [Google Scholar] [CrossRef]
- Xu, S.L.; Wu, P.; Li, Q.H.; Zhou, F.; Li, R. Determination of K & C model parameters for ultra-high toughness cementitious composites. J. Build. Struct. 2022, 43, 233–244. (In Chinese) [Google Scholar]
- Si, Z.H.; Liu, F.; Pan, J.W.; Dong, H. Research on impact resistance of reinforced concrete beams strengthened with carbon fiber reinforced polymer grid and engineered cementitious composites. Polymers 2022, 14, 1951. [Google Scholar] [CrossRef] [PubMed]
Figure 1.
Stress–strain curves of quasi-static test: (a) concrete under compression; (b) steel under tension.
Figure 1.
Stress–strain curves of quasi-static test: (a) concrete under compression; (b) steel under tension.

Figure 2.
Stress–strain curves of quasi-static test: (a) ECC under compression; (b) ECC under tension.
Figure 2.
Stress–strain curves of quasi-static test: (a) ECC under compression; (b) ECC under tension.

Figure 3.
Dog-bone specimen for tensile test (unit: mm): (a) specimen geometry; (b) dynamic setup.

Figure 4.
Typical stress–strain response of ECC under dynamic tension (strain rate 1/s).

Figure 5.
Tensile properties of ECC under different strain rates: (a) ultimate tensile strength; (b) tensile strain capacity.
Figure 5.
Tensile properties of ECC under different strain rates: (a) ultimate tensile strength; (b) tensile strain capacity.

Figure 6.
Dynamic increase factor of ECC under tension (data from Yang et al. [50], Ranade et al. [44]).

Figure 7.
Schematic of RC beams with different ECC reinforcement (unit: mm).

Figure 8.
Numerical model of impact tests: (a) RC beam (S1); (b) RC/ECC10 beam (S2); (c) RC/ECC20 beam (S3); (d) RC/ECC40 beam (S4); (e) RC/ECC20-20 beam (S5); (f) RC/ECC10-10-10-10 beam (S6).
Figure 8.
Numerical model of impact tests: (a) RC beam (S1); (b) RC/ECC10 beam (S2); (c) RC/ECC20 beam (S3); (d) RC/ECC40 beam (S4); (e) RC/ECC20-20 beam (S5); (f) RC/ECC10-10-10-10 beam (S6).

Figure 9.
Dynamic increase factor of ECC under compression (data from Ref. [51]).
Figure 9.
Dynamic increase factor of ECC under compression (data from Ref. [51]).

Figure 10.
Numerical models of concrete uniaxial compression test: (a) numerical model setup; (b) stress–strain relation comparison.
Figure 10.
Numerical models of concrete uniaxial compression test: (a) numerical model setup; (b) stress–strain relation comparison.

Figure 11.
Numerical simulation of ECC uniaxial compression test: (a) numerical model setup; (b) load–displacement relation comparison.
Figure 11.
Numerical simulation of ECC uniaxial compression test: (a) numerical model setup; (b) load–displacement relation comparison.

Figure 12.
Numerical simulation of ECC uniaxial tension test: (a) numerical model setup; (b) load–displacement relation comparison.
Figure 12.
Numerical simulation of ECC uniaxial tension test: (a) numerical model setup; (b) load–displacement relation comparison.

Figure 13.
Numerical models: (a) RC beam; (b) RC beam with ECC reinforcement.

Figure 14.
The comparison of response and failure modes between simulation and test: (a) RC beam; (b) RC/ECC beam.
Figure 14.
The comparison of response and failure modes between simulation and test: (a) RC beam; (b) RC/ECC beam.


Figure 15.
The comparison of the displacement time histories of the beam mid-span.

Figure 16.
Effective plastic strain contour of beams with different reinforcement thicknesses under the same impact.
Figure 16.
Effective plastic strain contour of beams with different reinforcement thicknesses under the same impact.

Figure 17.
Displacement of beam mid-spans with different reinforcement thicknesses under impact: (a) displacement time history; (b) peak displacement.
Figure 17.
Displacement of beam mid-spans with different reinforcement thicknesses under impact: (a) displacement time history; (b) peak displacement.

Figure 18.
Impact load of beams with different ECC reinforcement thicknesses under impact: (a) time histories; (b) peaks.
Figure 18.
Impact load of beams with different ECC reinforcement thicknesses under impact: (a) time histories; (b) peaks.

Figure 19.
Reaction force of beams with different ECC reinforcement thicknesses under impact: (a) time histories; (b) peaks.
Figure 19.
Reaction force of beams with different ECC reinforcement thicknesses under impact: (a) time histories; (b) peaks.

Figure 20.
Energy dissipation of beams with different reinforcement thicknesses under impact load.

Figure 21.
Effective plastic strain contour of beams with different reinforcement configurations under impact.
Figure 21.
Effective plastic strain contour of beams with different reinforcement configurations under impact.

Figure 22.
Displacement of beam mid-spans with different reinforcement configurations under impact: (a) displacement time history; (b) peak displacement.
Figure 22.
Displacement of beam mid-spans with different reinforcement configurations under impact: (a) displacement time history; (b) peak displacement.

Figure 23.
Impact load of beams with different reinforcement configurations under impact: (a) time histories; (b) peaks.
Figure 23.
Impact load of beams with different reinforcement configurations under impact: (a) time histories; (b) peaks.

Figure 24.
Reaction force of beams with different reinforcement configurations under impact: (a) time histories; (b) peaks.
Figure 24.
Reaction force of beams with different reinforcement configurations under impact: (a) time histories; (b) peaks.

Figure 25.
Energy dissipation of beams with different reinforcement configurations under impact.


Table 1.
Concrete mix proportion (unit: kg/m3).
| Cement | Sand | Coarse Aggregate | Water | SP |
|---|---|---|---|---|
| 462.5 | 596.09 | 1156.41 | 160 | 2.5 |
Table 2.
Mix proportion of ECC (unit: kg/m3).
| Cement | Fly Ash | Silica Sand | Water | HRWRA | PE Fiber |
|---|---|---|---|---|---|
| 701 | 900 | 100 | 600 | 8 | 19 |
Table 3.
Properties of PE fiber.
| Fiber Category | Density (g/cm3) | Diameter (μm) | Length (mm) | Young’s Modulus (GPa) | Tensile Strength (MPa) |
|---|---|---|---|---|---|
| PE | 0.97 | 24 | 12 | 116 | 3000 |
Table 4.
The mechanical properties of ECC material under quasi-static tension.
| Density (kg/m3) | First Crack Strength (MPa) | Ultimate Tensile Strength (MPa) | Tensile Strain Capacity (%) | Ultimate Compressive Strength (MPa) |
|---|---|---|---|---|
| 1780 | 3.2 | 8.67 | 5.61 | 68 |
Table 5.
Tensile mechanical properties of ECC.
| Case | Thickness (mm) | Strain Rate (/s) | Ultimate Tensile Strength (MPa) | Tensile Strain Capacity (%) |
|---|---|---|---|---|
| ECC-S | 13 | 10−5 | 8.67 | 5.61% |
| ECC-1 | 13 | 1 | 11.30 | 4.93% |
| ECC-10 | 13 | 10 | 14.15 | 4.15% |
| ECC-50 | 13 | 50 | 24.20 | 2.79% |
| ECC-100 | 13 | 100 | 30.22 | 2.11% |
Note: For clarification, in Table 5, the name of each case was ECC-strain rate. Strain rate represented the tensile strain rate of the test ranging from 10−5/s–100/s. ECC-100 denotes the ECC specimen at a strain rate of 100/s. S represents quasi-static tension. The strain rate was 10−5/s.
Table 6.
Numerical model program.
| Series | Cases | Dimensions (Width × Depth × Length) (mm) | ECC Thickness (mm) | Reinforcement Type | Impact Velocity (m/s) |
|---|---|---|---|---|---|
| S1 | RC | 100 × 100 × 1000 | - | - | 4.5 |
| S2 | RC/ECC10 | 100 × 110 × 1000 | 10 | single layer | 4.5 |
| S3 | RC/ECC20 | 100 × 120 × 1000 | 20 | single layer | 4.5 |
| S4 | RC/ECC40 | 100 × 140 × 1000 | 40 | single layer | 4.5 |
| S5 | RC/ECC20-20 | 100 × 140 × 1000 | 40 | double layer | 4.5 |
| S6 | RC/ECC10-10-10-10 | 100 × 140 × 1000 | 40 | four layer | 4.5 |
Note: For clarification, in Table 6, RC/ECC denotes the ECC-reinforced RC beam. RC/ECC20 denotes the ECC-reinforced RC beam; the ECC reinforcement layer was a single layer with a thickness of 20 mm. Therefore, RC/ECC20-20 denotes the ECC-reinforced RC beam; the ECC reinforcement layer was a double layer, per layer of ECC was 20 mm, and the total thickness was 40 mm.
Table 7.
Parameters of steel [48].
Table 7.
Parameters of steel [48].
| ρ (kg/m3) | E (GPa) | σy (MPa) | μ | C | p |
|---|---|---|---|---|---|
| 7800 | 203 | 425 | 0.3 | 40 | 5 |
Where ρ was the density, E was Young’s modulus, σy was the quasi-static yield strength, μ was the Poisson’s ratio, and C and p were the strain rate parameters, as shown in Equation (1).
Table 8.
The λ–η relationship [48].
Table 8.
The λ–η relationship [48].
| 0.0 | 0.0 |
| 8.0 × 10⁻⁶ | 0.85 |
| 2.4 × 10⁻⁵ | 0.97 |
| 4.0 × 10⁻⁵ | 0.99 |
| 5.6 × 10⁻⁵ | 1.0 |
| 7.2 × 10⁻⁵ | 0.99 |
| 8.8 × 10⁻⁵ | 0.97 |
| 3.2 × 10⁻⁴ | 0.5 |
| 5.2 × 10⁻⁴ | 0.1 |
| 5.7 × 10⁻⁴ | 0.0 |
| 0.0 | 0.0 |
| 0.0 | 0.0 |
| 0.0 | 0.0 |
Table 9.
EOS parameters of ECC.
| 0 | 0.0015 | 0.0043 | 0.0101 | 0.0305 | 0.0513 | 0.0726 | 0.0943 | 0.174 | 0.208 |
| Kv | Kv | 1.014 Kv | 1.065 Kv | 1.267 Kv | 1.470 Kv | 1.672 Kv | 1.825 Kv | 4.106 Kv | 5.000 Kv |
| 0 | Kv μ2 | 2.18 P2 | 3.5 P2 | 6.65 P2 | 10.03 P2 | 14.23 P2 | 21.77 P2 | 127.1 P2 | P2 |
Where μi was the volumetric strain, Ki was the elastic bulk modulus, Pi was the pressure corresponding to μi.
Table 10.
Beam parameters in the tests [52].
Table 10.
Beam parameters in the tests [52].
| Specimens | Cross Section (mm) | Span (mm) | Materials | Impact Test |
|---|---|---|---|---|
| RC beam | 150 × 250 × 2400 | 2000 | Concrete compressive strength 20.3 MPa | Drop weight 200 kg; impact height 1 m |
| RC/ECC beam | 150 × 270 × 2400 | 2000 | Concrete compressive strength 20.3 MPa; ECC compressive strength 55.16 MPa ECC ultimate tensile strength 6.66 MPa | Drop weight 200 kg; impact height 1 m |
Table 11.
Summary of the displacement of RC and RC/ECC beams.
| Case | Test (mm) | Simulation (mm) | Error (%) |
|---|---|---|---|
| RC beam | 25.0 | 27.18 | 8.7 |
| RC/ECC beam | 22.8 | 24.07 | 5.6 |
Table 12.
Summary of the energy dissipation of RC beams with different reinforcement.
| No. | Case | RC Beam (J) | ECC Layer (J) | Total Energy (J) |
|---|---|---|---|---|
| S1 | RC | 467.8 | - | 467.8 |
| S2 | RC/ECC10 | 351.1 | 116.9 | 468.0 |
| S3 | RC/ECC20 | 294.0 | 171.7 | 465.7 |
| S4 | RC/ECC40 | 187.9 | 280.7 | 468.6 |
Table 13.
Summary of the energy dissipation of beams with different thicknesses.
| No. | Cases | RC Layer (J) | ECC1 Layer (J) | ECC2 Layer (J) | ECC3 Layer (J) | ECC4 Layer (J) | Total Energy (J) |
|---|---|---|---|---|---|---|---|
| S1 | RC | 467.8 | 467.8 | ||||
| S3 | RC/ECC40 | 187.8 | 280.7 | 468.6 | |||
| S5 | RC/ECC20/20 | 161.1 | 122.9 | 184.3 | 468.3 | ||
| S6 | RC/ECC10/10/10/10 | 129.3 | 49.0 | 76.1 | 105.3 | 108.2 | 467.9 |
Note: The numbers 1, 2, 3, and 4 following ECC denote the ECC layer from top to bottom. For instance, ECC1 means the layer adjacent to the RC beam.
Table 14.
Summary of the performance of different ECC reinforcements.
| Case | Description | Peak Mid-Span Deformation (mm) | Peak Reaction Force (kN) | Energy Dissipation (J) | ||
|---|---|---|---|---|---|---|
| RC Beam | ECC Layer | Total | ||||
| S1 | RC | 33.5 | 56 | 467.8 | 467.8 | |
| S2 | RC/ECC10 | 27.3 | 64 | 351.0 | 117.0 | 468.0 |
| S3 | RC/ECC20 | 26.3 | 72 | 294.0 | 171.7 | 465.7 |
| S4 | RC/ECC40 | 21.0 | 87 | 187.8 | 280.8 | 468.6 |
| S5 | RC/ECC20-20 | 21.3 | 80 | 161.1 | 307.2 | 468.3 |
| S6 | RC/ECC10-10-10-10 | 22.9 | 75 | 129.3 | 338.6 | 467.9 |
Disclaimer/Publisher’s Note: The statements, opinions and data contained in all publications are solely those of the individual author(s) and contributor(s) and not of MDPI and/or the editor(s). MDPI and/or the editor(s) disclaim responsibility for any injury to people or property resulting from any ideas, methods, instructions or products referred to in the content. |
© 2023 by the author. Licensee MDPI, Basel, Switzerland. This article is an open access article distributed under the terms and conditions of the Creative Commons Attribution (CC BY) license (https://creativecommons.org/licenses/by/4.0/).
Share and Cite
MDPI and ACS Style
Wu, J. Impact Performance of RC Beams Reinforced by Engineered Cementitious Composite. Buildings 2023, 13, 1688. https://doi.org/10.3390/buildings13071688
AMA Style
Wu J. Impact Performance of RC Beams Reinforced by Engineered Cementitious Composite. Buildings. 2023; 13(7):1688. https://doi.org/10.3390/buildings13071688
Chicago/Turabian StyleWu, Jiehao. 2023. "Impact Performance of RC Beams Reinforced by Engineered Cementitious Composite" Buildings 13, no. 7: 1688. https://doi.org/10.3390/buildings13071688
Note that from the first issue of 2016, this journal uses article numbers instead of page numbers. See further details here.