
Assessing Embodied Carbon in Structural Models: A Building Information Modelling-Based Approach


Department of Civil Engineering, The University of Nottingham, Nottingham NG7 2RD, UK
*
Author to whom correspondence should be addressed.
Buildings 2023, 13(7), 1679; https://doi.org/10.3390/buildings13071679
Submission received: 2 June 2023
/
Revised: 26 June 2023
/
Accepted: 29 June 2023
/
Published: 30 June 2023
(This article belongs to the Special Issue Net Zero Carbon (NZC) Building Design and Construction)
Abstract
:The construction industry’s recognition of the importance of embodied carbon (EC) drives the need for streamlined early-stage EC assessment. The adoption of building information modelling (BIM) allows for integrating EC assessment into current workflows, as BIM data are fundamental to the assessment. This paper presents a BIM-based prototype tool developed to provide a quick and comprehensive assessment of EC in structural models. The prototype utilises visual programming language (VPL) and a database of external carbon factors to automate the assessment process and displays the results in a visualisation model. The prototype also offers high-level insights to support informed decision making and a detailed analysis to identify areas for optimisation. The results of this study indicate the effectiveness of the prototype in identifying EC hot spots and enabling informed decision making for optimisation. From an academic perspective, the study addresses a research gap by demonstrating the viability of integrating EC assessment in the early stages of design. In terms of practical implications, the presented prototype tool offers practitioners a solution that streamlines the assessment of EC in structural models, enabling informed decision making and identification of optimisation opportunities. In terms of policy, the research is aligned with the industry’s recognition of EC’s importance and supports sustainable building practices towards achieving net zero carbon goals.
1. Introduction
The significance of embodied carbon (EC) and greenhouse gases (GHG) is becoming increasingly prevalent as society continues to develop. Building operations and the construction sector account for nearly 40% of all global carbon emissions [1]. Net zero carbon building has emerged as a potential solution to address this issue [2]. However, new simplified methods for assessing and reducing embodied carbon are still needed to achieve net zero carbon buildings [3]. Consequently, measuring EC is becoming a focal point in the life cycle assessment (LCA) of structures, and numerous research efforts are underway to reduce it.
EC assessment is becoming a crucial activity in construction projects, with an emphasis on conducting it in the early design stages [4]. The increasing adoption of building information modelling (BIM) in the industry provides an opportunity to integrate this activity into current workflows. BIM enables the development of a model containing precise geometry and relevant data to support the design, procurement, fabrication, and construction activities required to realise building [5]. BIM data has been utilised in recent years to improve the performance of construction projects in several aspects, including, for example, construction safety [6], due to its structured nature. This information is also a fundamental component of embodied carbon assessment; therefore, integrating BIM and embodied carbon assessment has the potential to enable more comprehensive and rapid evaluation of the impact of a structure.
In recent years, incorporating EC assessment into BIM workflows has been the focus of numerous research efforts. However, a recent literature review [7] has revealed certain knowledge gaps associated with this integration, particularly highlighting the challenge of achieving interoperability of BIM software and life cycle assessment (LCA) tools. This issue encompasses various aspects, such as insufficient data within BIM models to carry out the assessment process, the need manually to add missing information, and the complexity of the assessment process for users that are unfamiliar with LCA concepts. This research aims to address this gap by demonstrating the viability of integrating EC assessment in the early stages of design within a BIM environment.
The primary aim of this research is to investigate how to incorporate EC assessment into the BIM workflow at the early design stage. The importance of this integration lies in its potential to significantly impact the sustainability of construction projects towards achieving net zero carbon buildings. The early design stage is a critical phase where key decisions regarding materials, systems, and overall design strategies are made, which can have long-lasting implications on the environmental performance of projects. By integrating EC assessment at this stage, designers and stakeholders can gain valuable insights into the embodied carbon of various design alternatives, enabling informed decision making that can result in substantial carbon savings throughout the project’s life cycle.
The remainder of this paper is structured as follows. Section 2 presents a concise literature review focused on research endeavours to incorporate EC assessment into BIM workflows. Section 3 describes the methodology adopted in this research. Section 4 further describes the process to develop the presented prototype tool for assessing EC. Section 5 presents a case study that showcases the functionality of the prototype. Section 6 situates the research within the context of existing literature. Section 7 presents the conclusions drawn from the study.
2. Literature Review
Based on a recent literature review [7], BIM-integrated life cycle assessment (LCA) approaches can be classified into three types based on the flow of data exchange. The Type I approach involves exporting BIM data and combining it with carbon emission factors sourced from different databases, typically in spreadsheet format. The assessment occurs outside of the BIM environment. In the Type II approach, carbon emission factors are incorporated directly into BIM tools, leveraging the full potential of BIM technology as both a data source and a visualisation platform. The Type III approach entails importing BIM data into dedicated LCA software tools and performing the assessment directly within the LCA-specific tools. In this approach, BIM data are utilised as input for the LCA software.
Several examples of each of these three types can be found in the literature, each with inherent limitations that have hindered incorporating LCA and, in particular, EC assessment into the BIM workflow. For example, Structural Carbon Tool [8], classified under Type I, utilises project data obtained from a BIM model material quantity takeoff and estimates the EC of different element categories using carbon factors from the Inventory of Carbon and Energy (ICE) [9], an open and freely available database of carbon emissions considering a cradle-to-gate perspective. The ICE database is assembled from published information and life cycle assessment sources in the UK. A drawback of this type of tool is that there is no connection between the assessment and the BIM model, meaning that the results cannot be visualised within the BIM model and that any changes to the design require going through the assessment process again.
Tools that adopt the Type II approach incorporate carbon factors directly within the BIM environment through plugins or API extensions. An example of this is the BIM extension proposed by Oti and Tizani [10], where carbon factors from the ICE database are also utilised. However, in this approach, the carbon factors are input directly into the developed system linked to the BIM tool. One advantage of Type II tools over Type I tools is that any changes made to the model are automatically reflected in the EC assessment, thereby reducing the time required to evaluate new options. However, a limitation of this type of tool is that the carbon factors need to be monitored and updated as more accurate data become available. For instance, adjustments may be necessary to account for emissions during transportation, construction, operation, or end-of-life processes, effectively modifying the boundary conditions of the factors.
In the Type III EC assessment approach, BIM data are utilised as input for a dedicated separate LCA tool. A recent example is the study of Xu et al. [11], which intends to address the recognised issues of this approach, such as data interoperability between BIM and LCA tools, the manual capturing of BIM data into the LCA tool, and the lack of methods for assessing carbon emissions at multiple spatial levels. However, a limitation of this approach is that stakeholders in projects with limited budgets may not have access to dedicated LCA tools, which can restrict their ability to perform comprehensive EC assessments, especially at the earlier design stages where critical decisions are made.
It is worth noting that LCA methods that do not rely on BIM data are also prevalent in the literature. For example, in [12], the life cycle assessment of three clean energy technologies was conducted without this type of information. In this research, the focus is on embodied carbon assessment, a subset of LCA, and, more specifically, BIM-enabled embodied carbon assessment.
Despite numerous research efforts to streamline the incorporation of EC assessment into the BIM workflow, the widespread adoption of this practice in the industry has not been fully realised. This is evident from recent initiatives that urge practitioners to establish carbon targets and strive to reduce the carbon footprint of their projects [13,14]. One possible explanation for this slow adoption is the existing research gap concerning the challenge of achieving interoperability of BIM software and EC assessment tools, which results in a manually intensive and complex assessment process that hinders a quick and comprehensive assessment early when key decisions are made. In this paper, we present a prototype tool primarily intended for use in the early design stage to conduct a rapid assessment of EC in structural models. The prototype rates the overall structure and provides insights at both a high level, to facilitate informed decision making, and at a detailed level, to support designers in identifying hot spots and elements with potential for optimisation. The prototype achieves this by retrieving carbon factors from an external database and incorporating them into a BIM environment using a visual programming language (VPL). The assessment results are then displayed in both a visualisation model and a comprehensive results report.
3. Research Method
The underlying research strategy adopted in this study is based on the design science research methodology [15] considering that it is particularly suited for the development and evaluation of new artefacts used to address practical problems. Design science research seeks to enhance technology via the creation of innovative artefacts that solve problems [16], and it is viewed as a robust research methodology for addressing construction management problems [17,18]. The first two steps of this methodology consist of identifying a practically relevant problem and placing it within the context of existing knowledge. As a response, the literature review presented above revealed that at present the full potential of BIM as an enabling factor for embodied carbon assessment has not yet been fully utilised to streamline early-stage analysis for designers.
Steps three and four of the design science research methodology consist of suggesting and designing a solution to the identified problem. Therefore, this paper introduces a novel BIM-based prototype tool for assessing the EC in structural models. To develop the prototype, the steps outlined in [19] were adopted. In particular, the steps corresponding to Phase II (Specification), which involves choosing a prototyping method and tool, and Phase III (Design), which involves formulating the design criteria and creating the prototype, align closely with steps three and four of the design science methodology. In Phase II, digital prototyping using a visual programming language (VPL) was chosen as the prototyping method. To implement this method, Autodesk Dynamo (v. 2.16) was selected as the prototyping tool. Moving to Phase III, the functional requirements and system architecture of the proposed prototype were defined. These functional requirements were formulated to address the problem identified through the literature review.
Step five of the design science research methodology focuses on demonstrating the practical utility of the developed artefact. This step is aligned with Phase IV (Results) of the prototyping process adopted from [19]. To accomplish this, an illustrative case study was designed to validate whether the functional requirements of the prototype were successfully met. Section 5 of this paper focuses on the outcome of this step.
4. Development of the Prototype for Assessing Embodied Carbon
The primary motivation behind developing the prototype embodied carbon assessment tool was to seamlessly integrate the process of EC assessment into the BIM workflow. To achieve this aim, the system was developed using Autodesk Dynamo and Autodesk Revit 2023 (v. 23.1.10.4) to facilitate direct analysis and calculation of EC within BIM software. The design process began by formulating a list of functional requirements and designing the system architecture. Next, Dynamo scripts were developed to meet the sought functionality of the prototype. Finally, a practical illustrative example was devised to test the capabilities of the prototype and demonstrate its utility.
4.1. Functional Requirements
The proposed system was designed to meet the following functional requirements, specifically formulated to address the problem identified through the literature review:
First, the system calculates the embodied carbon of each relevant BIM object in the model (i.e., structural elements). This involves identifying the element type, identifying the element’s material, retrieving the material’s corresponding EC factor, obtaining the element’s volume and mass, and performing the embodied carbon calculation. Second, the system calculates the total EC of the structure taking into account all the relevant BIM objects by adding the embodied carbon contribution of each. Third, the system calculates an EC score for the overall project by dividing the total embodied carbon by the gross internal area.
Fourth, the system provides a rating for the overall structure based on established rating systems using the calculated EC score. Fifth, the system visually represents the EC distribution within the model through a colour-coded display. This feature highlights EC hot spots employing a dynamic colour code range based on element category. Finally, the system generates a comprehensive report that includes a summary of key EC data, a key for the colour code in the visualisation model per element category, graphical data insights, project equivalent EC emissions, total embodied carbon figures, and the project’s ratings.
4.2. System Architecture
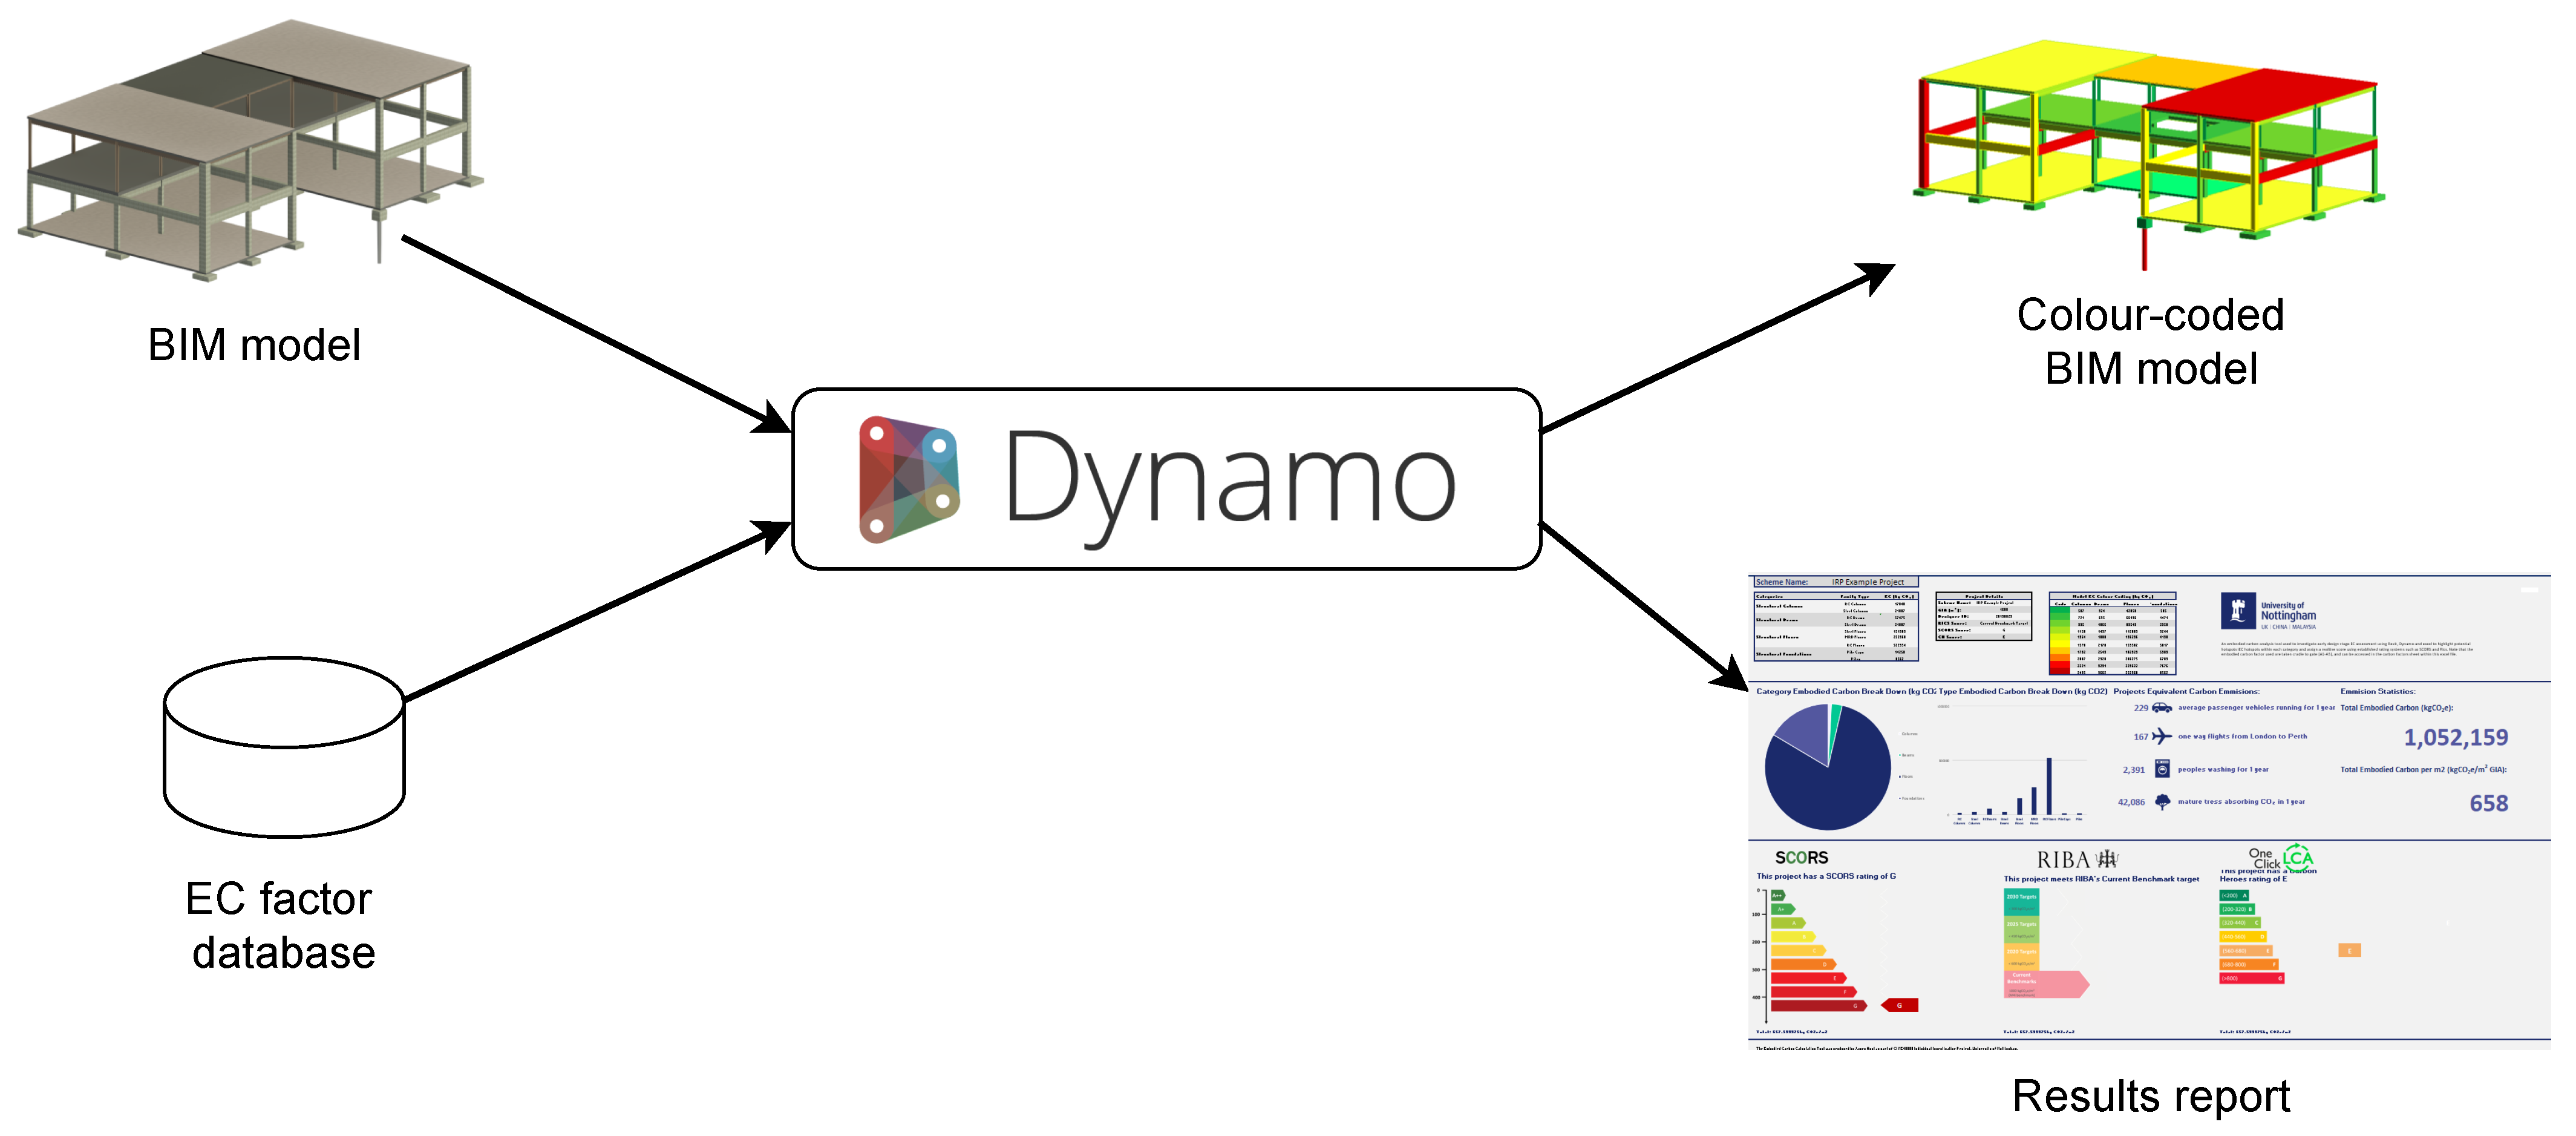
Figure 1 depicts the system architecture of the proposed prototype, showcasing its inputs and outputs. The system operates by taking input from two main sources: a BIM model and an EC factor database [9]. The BIM model contains the structural elements that require EC assessment, while the EC factor database incorporates the embodied carbon factors associated with commonly used materials in structural models, considering a cradle-to-gate perspective [9]. Notably, by retrieving the embodied carbon factors from an external database instead of directly inputting them into Dynamo scripts, this method allows for easy future updates in case more accurate factors become available.
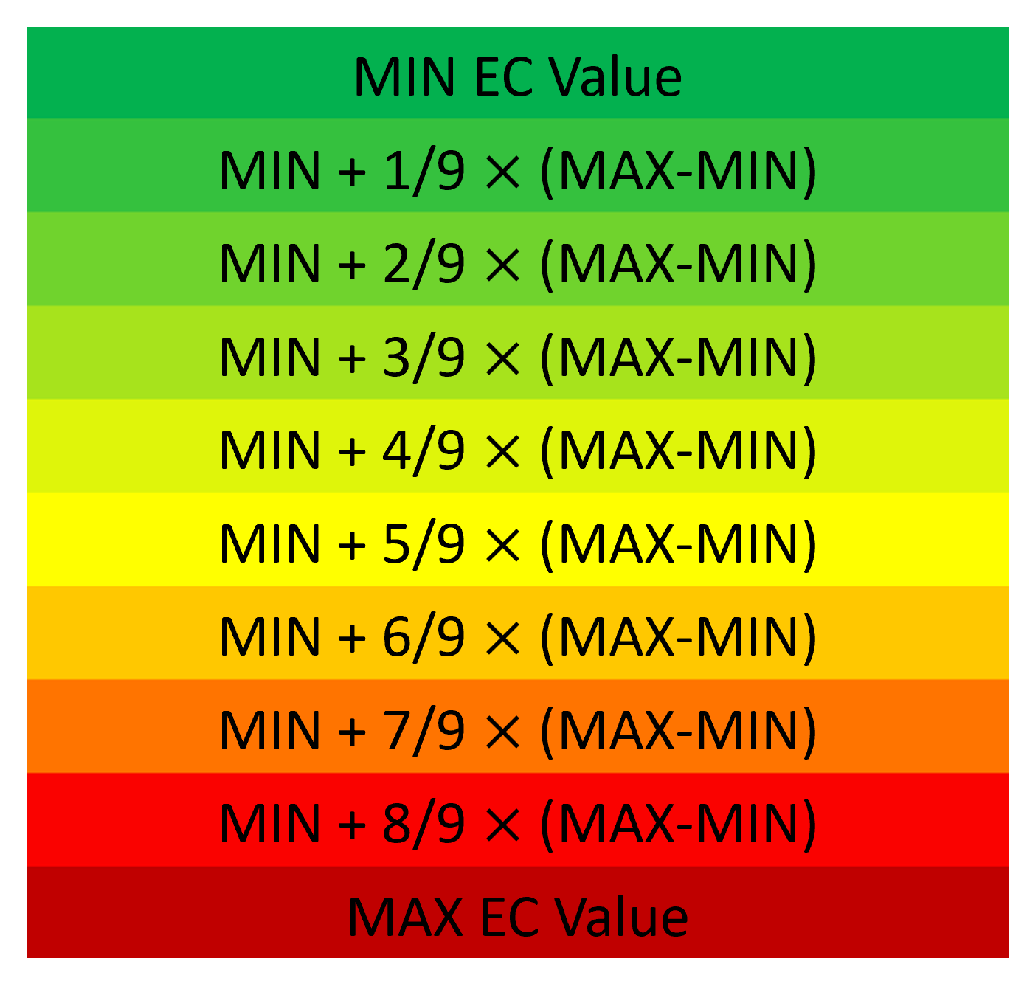
The prototype provides EC insights through two distinct outputs: a colour-coded BIM model and a results report. In the output BIM model, elements are coloured according to their embodied carbon contribution utilising a dynamic green-to-red scale determined by the minimum and maximum embodied carbon values within each element category, as illustrated in Figure 2. This approach was implemented to avoid the overemphasis of specific elements, such as floors, as the primary EC contributors solely based on their size and mass in comparison to other elements within the model. By applying the colour coding to each element category, the visualisation effectively highlights the relative impact of different elements, supporting designers in identifying hot spots and elements that have the potential for optimisation.
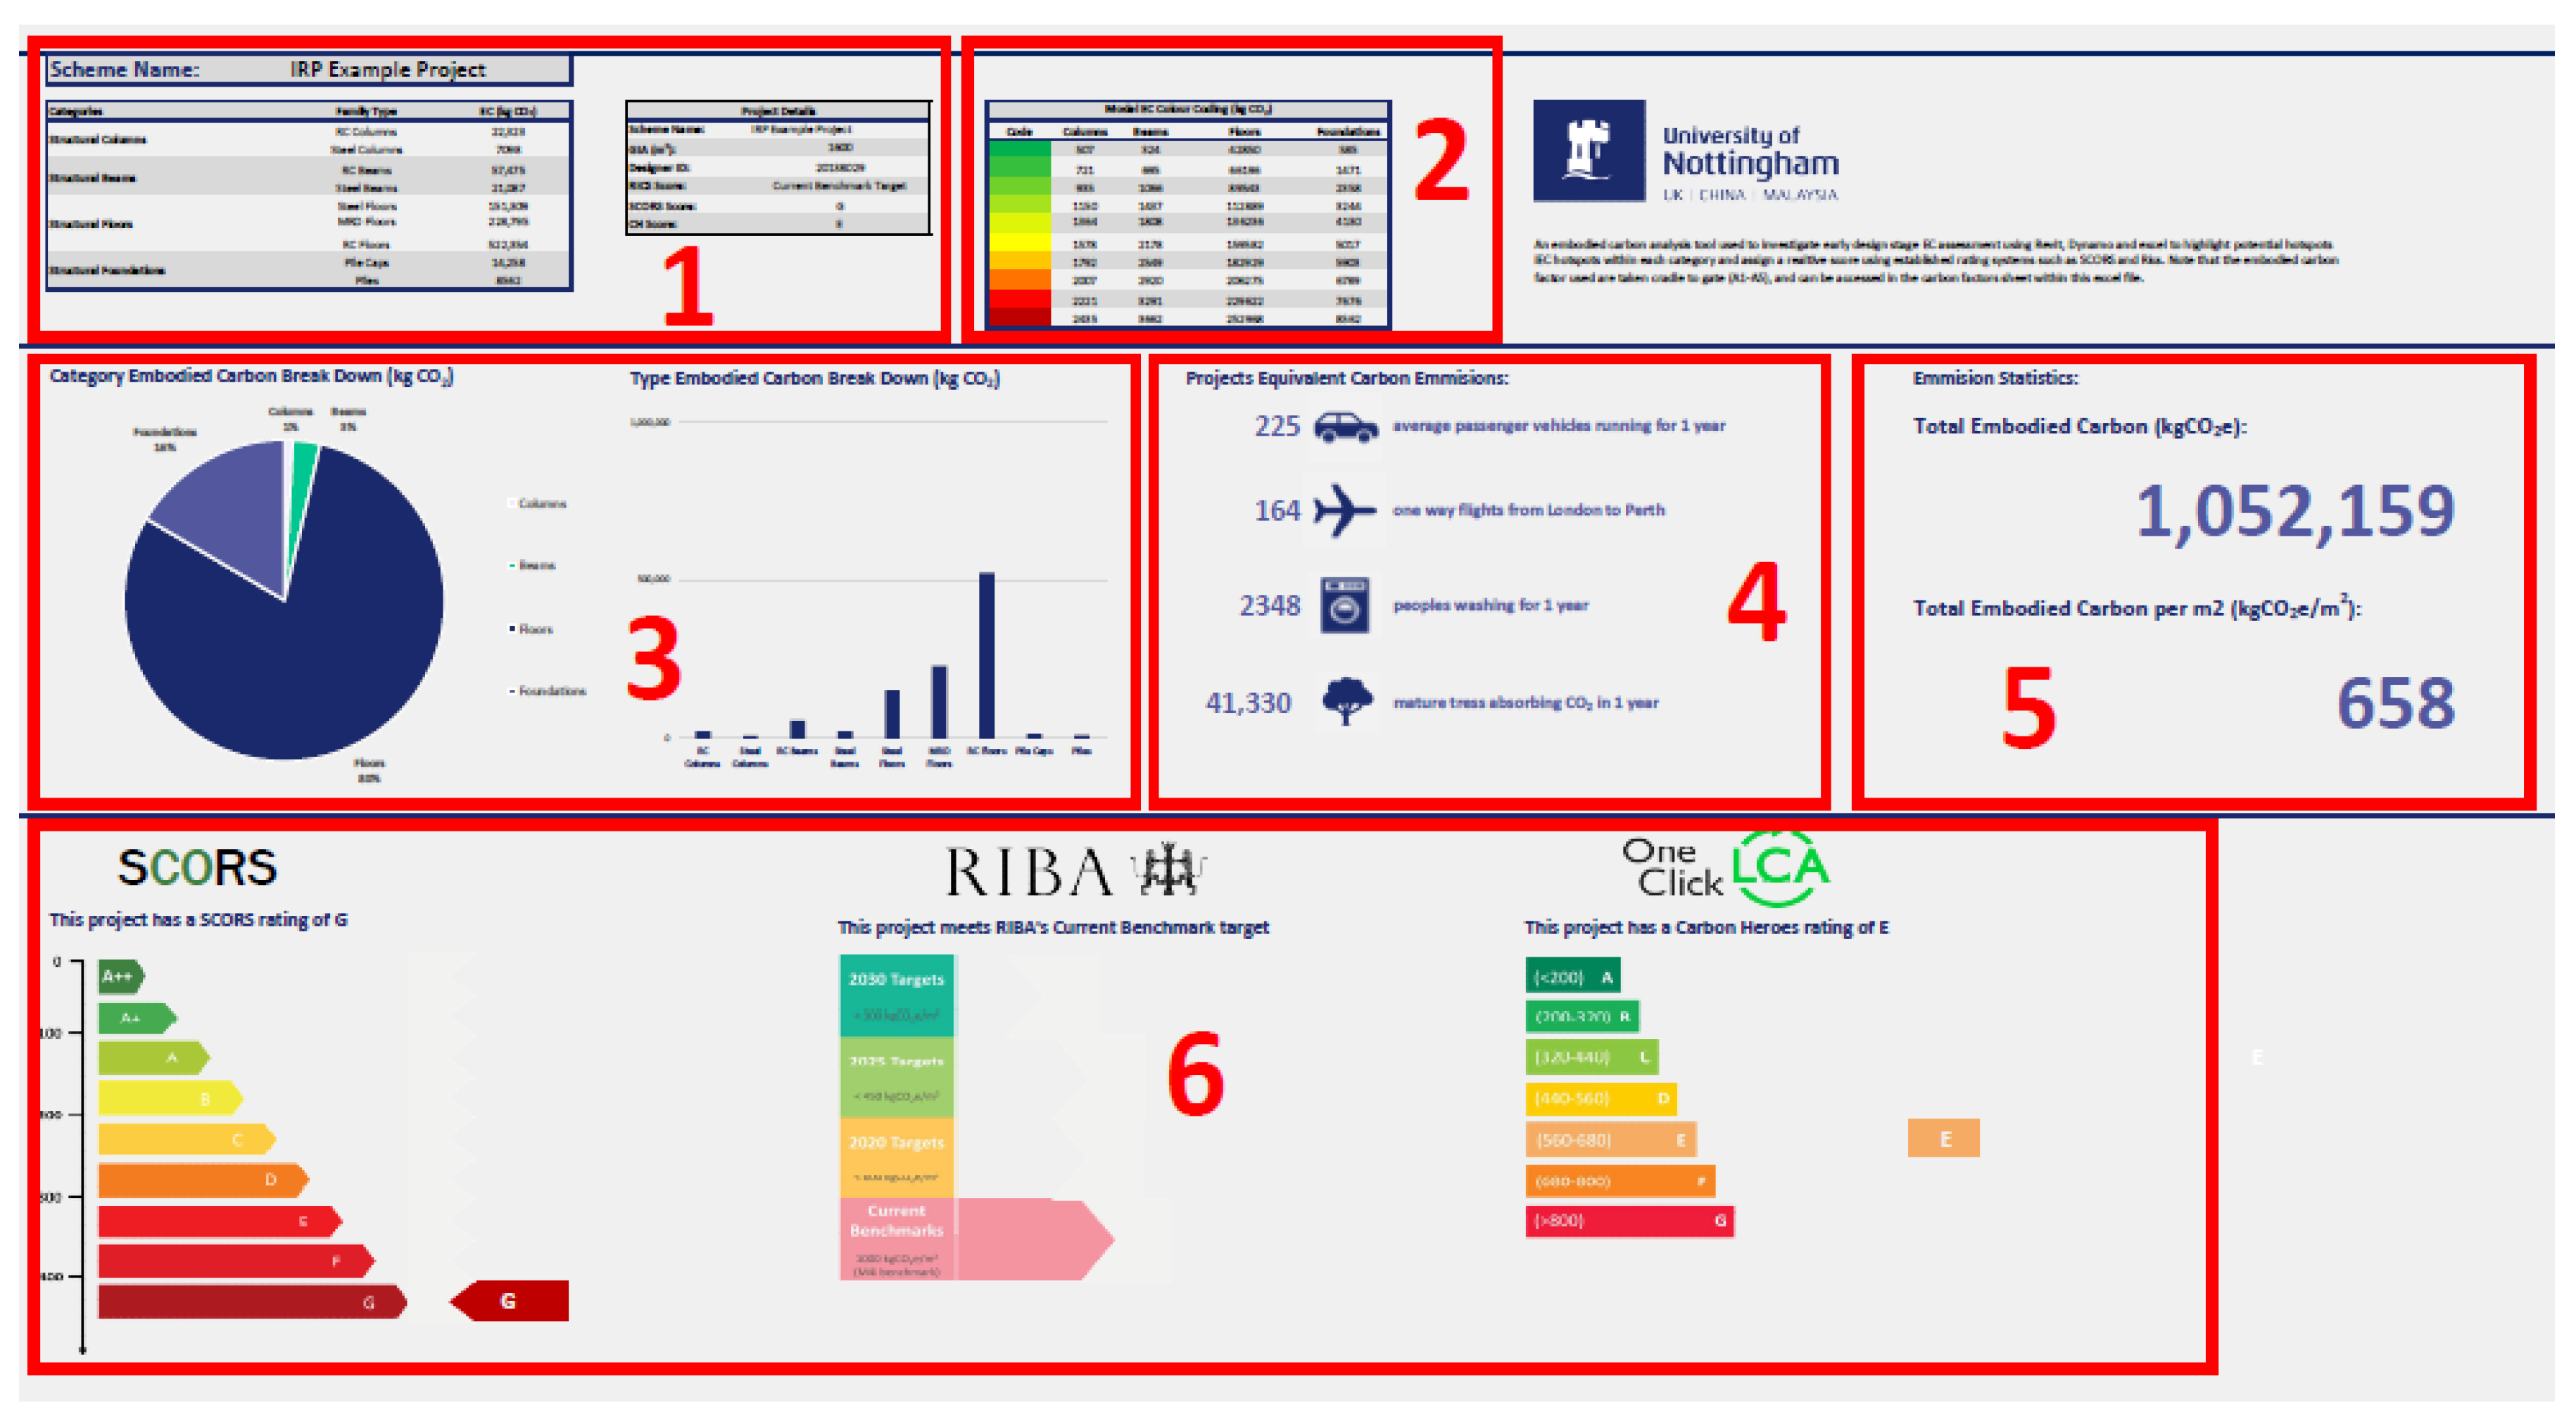
The results report is generated from the EC data calculated in Dynamo and exported to an Excel spreadsheet. The report is divided into six sections: (1) Summary of key EC data, which presents a summary of the key embodied carbon data for each element category in the model. It offers an overview of the embodied carbon contributions from different element categories, enabling stakeholders to identify the categories with the highest embodied carbon footprint; (2) Colour code key, which provides a key to the colour code used in the visualisation model, helping designers understand the significance of the different colours; (3) Graphical data insights, which includes pie and bar charts that visually represent the EC breakdown per element category to facilitate a clear understanding of the relative contribution of different categories to the overall embodied carbon of the structure; (4) Project equivalent emissions, which provides the structure’s emission in kg CO2e compared to a passenger vehicle running for 1 year, a one-way flight from London to Perth, a person washing for 1 year, and a mature tree absorbing CO2 for 1 year, allowing stakeholders to comprehend the environmental impacts of the structure in relatable terms; (5) Key figures of the project, which presents the total embodied carbon and total embodied carbon per m2, facilitating high-level decision making and comparison with sustainability goals; and (6) Project rating, which provides the project’s rating according to three established rating systems [13,14,20], allowing for benchmarking and comparison. Figure 3 illustrates the distribution of these six sections within the report.
4.3. Implementation
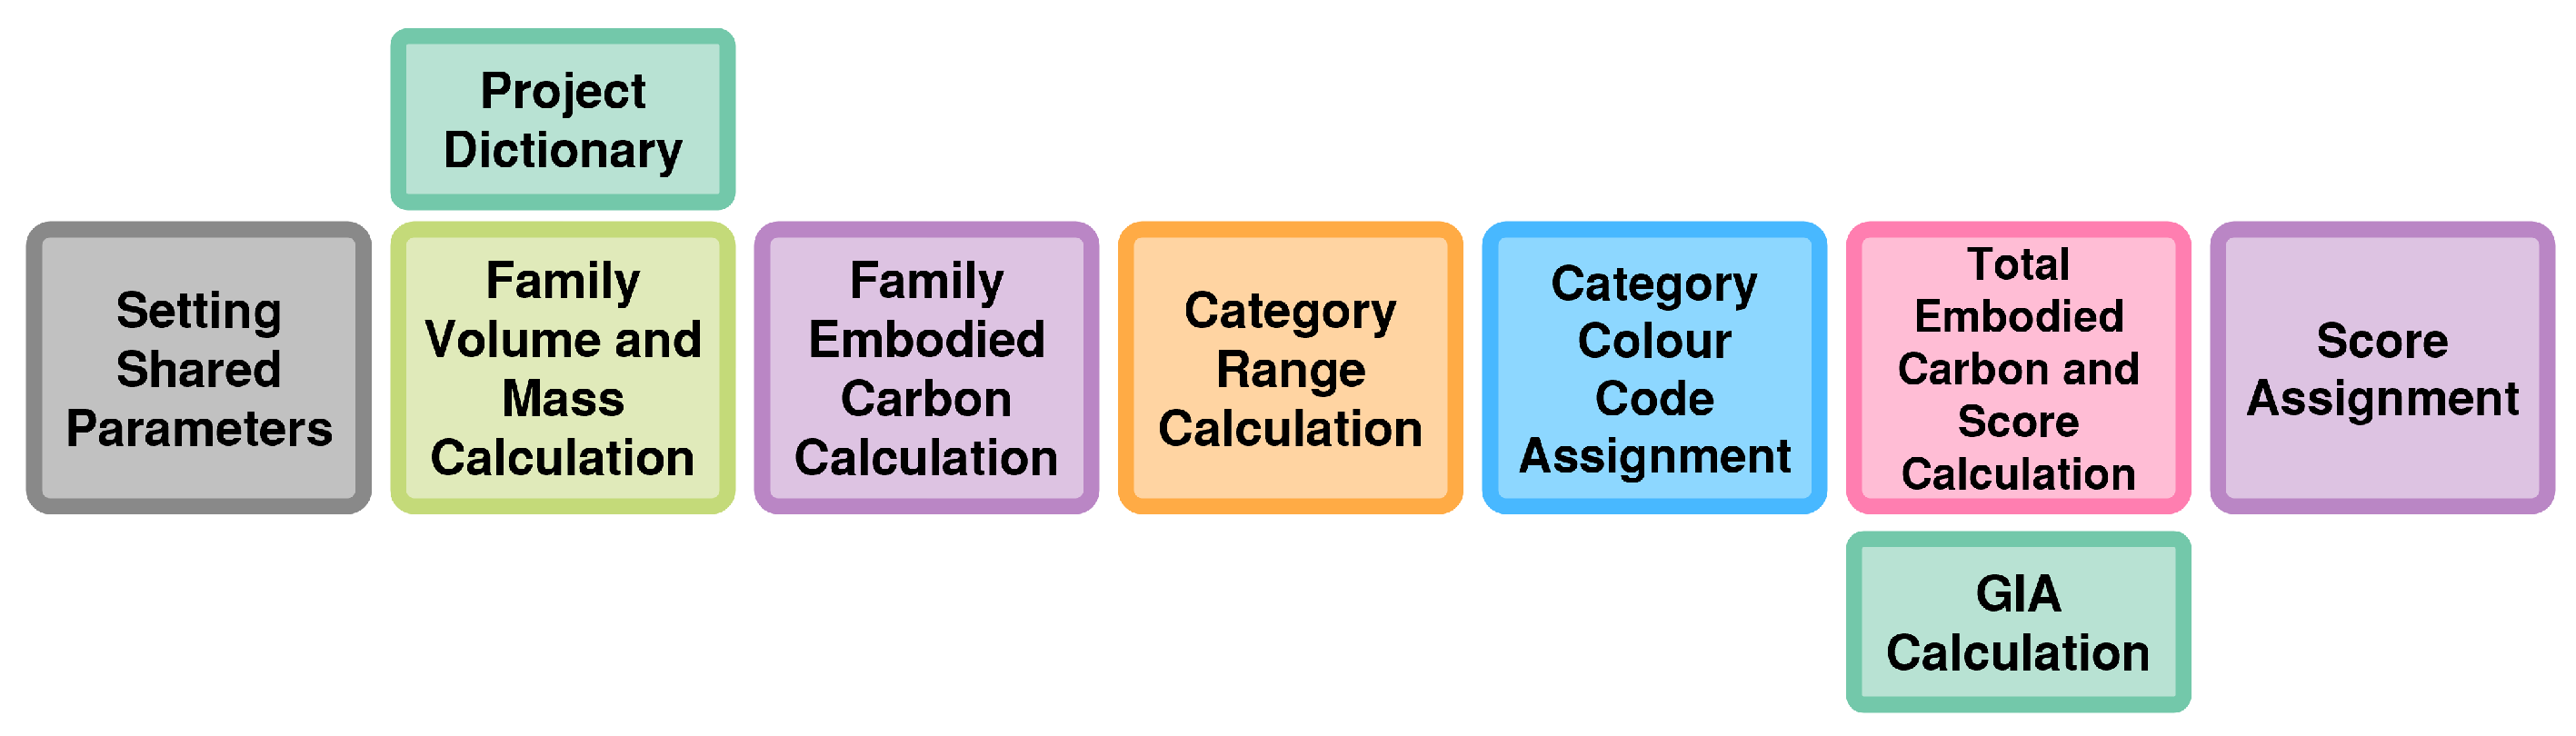
The proposed prototype embodied carbon assessment tool was implemented through visual programming language scripts (sequence of instructions written using a visual programming language) developed in Autodesk Dynamo [21], an open source visual programming platform for designers. Figure 4 provides an overview of the Dynamo script, which is subdivided into nine modules.
4.3.1. Setting Project Parameters
This module automatically assigns new parameters to relevant BIM elements within the model, allowing their values to be populated and used in subsequent calculations. Notably, the values for these parameters can also be inspected in the output visualisation model. An important parameter that is introduced is the ”Embodied Carbon” parameter, which will hold the element’s embodied carbon contribution expressed in kg CO2e once the calculation process is complete. Another parameter set up in this module is the ”Material Density”, which is utilised to calculate the mass of the element.
4.3.2. Project Dictionaries
This module establishes a connection between the extracted material information from the BIM model and the corresponding EC factor retrieved from the EC factor database. This relationship enables accurate embodied carbon calculations based on the specific materials defined in the model. The keys and values of the dictionaries were defined in a spreadsheet that can be read by the Dynamo script. The EC factors utilised in this research were obtained from the Inventory of Carbon and Energy (ICE) database [9] and consider a cradle-to-gate perspective. It is important to note that the adopted approach allows for customisation in the future, should more accurate or relevant factors become available. By utilising an external database and establishing a flexible system, the prototype EC assessment tool can easily incorporate updated or improved EC factors, ensuring it provides accurate and reliable assessments based on the most current information.
4.3.3. Family Volume and Mass Calculation
In order to calculate the volume and mass of each material in the structural model, relevant BIM objects in the model were separated into two types, namely homogeneous elements and compound elements. Building element categories consisting of a single material, such as steel beams, were considered homogeneous elements, and their volumes were directly extracted from the model by the Dynamo script. Building element categories consisting of two or more materials, such as reinforced concrete columns, were considered compound elements. The prototype EC assessment tool was conceived to be used during the early design stage when the precise volume of reinforcement is still unknown. Therefore, the volume of steel was obtained as a function of the concrete volume and considering average quantities of reinforcement steel per m3 in concrete [22]. Notably, once the designers specify the steel and concrete volumes accurately in the detail design stage, a more accurate embodied carbon assessment can be performed by extracting the exact information available in a higher-level-of-detail BIM model. Once the volumes are obtained, the mass of the elements is calculated using the “Material Density” parameter assigned in the “Setting project parameters” (Section 4.3.1) module, expressed in kg/m3, and the volume, expressed in m3, using Equation (1).
4.3.4. Family Embodied Carbon Calculation
This module calculates the EC contributions of individual elements as well as the total EC contribution of each element category within the model. The EC contribution of individual BIM objects is calculated by multiplying their mass by their corresponding carbon factor expressed in kg CO2e/kg, retrieved from the EC factor database. The EC of compound materials was obtained by adding the EC contribution of each of their constituent materials. The calculation is performed using Equation (2). Subsequently, the total EC contribution of each element category within the model is calculated by aggregating the EC values of each element belonging to that specific category.
4.3.5. Category Range Calculation
In this module, the previously calculated EC values are ranked in ascending order, from the minimum to the maximum value within each element category. The purpose of this ranking is to assign the values to the colour code scale in the visualisation model dynamically, as illustrated in Figure 2 above. Furthermore, the position of each element in the ranking relative to other elements within the same category is also calculated.
4.3.6. Category Colour Code Assignment
In this module, a green-to-red colour scheme is assigned based on the category EC range calculated above. The scheme is then applied to the elements to generate the visualisation model. This is achieved by using the Dynamo node “Element.OverideColorInView”, which changes the colours of BIM objects within the model based on their EC value and the corresponding category colour scale.
4.3.7. GIA Calculation
This module calculates the approximate gross internal area (GIA) of the model, which is used to generate a score for the overall structure. To achieve this, floor elements are first identified. Next, their areas are individually calculated and summed together. It is worth noting that in this calculation, the module does not consider factors such as perimeter wall thickness and external projections, which are typically excluded in traditional GIA calculations. The justification for this approach is that the proposed tool is intended for use in the early design stage, where a quick and informative assessment is necessary to support decision-making processes. Nevertheless, during the detail design stage, adjustments can be made to the GIA calculation to account for these exclusions, resulting in more accurate ratings.
4.3.8. Total Embodied Carbon and Score Calculation
This module first calculates the total EC of the structure. This is achieved by summing the EC contribution of each element within the model. Subsequently, it calculates a score expressed in kg CO2e/m2 by dividing the total EC by the gross internal area, as shown in Equation (3).
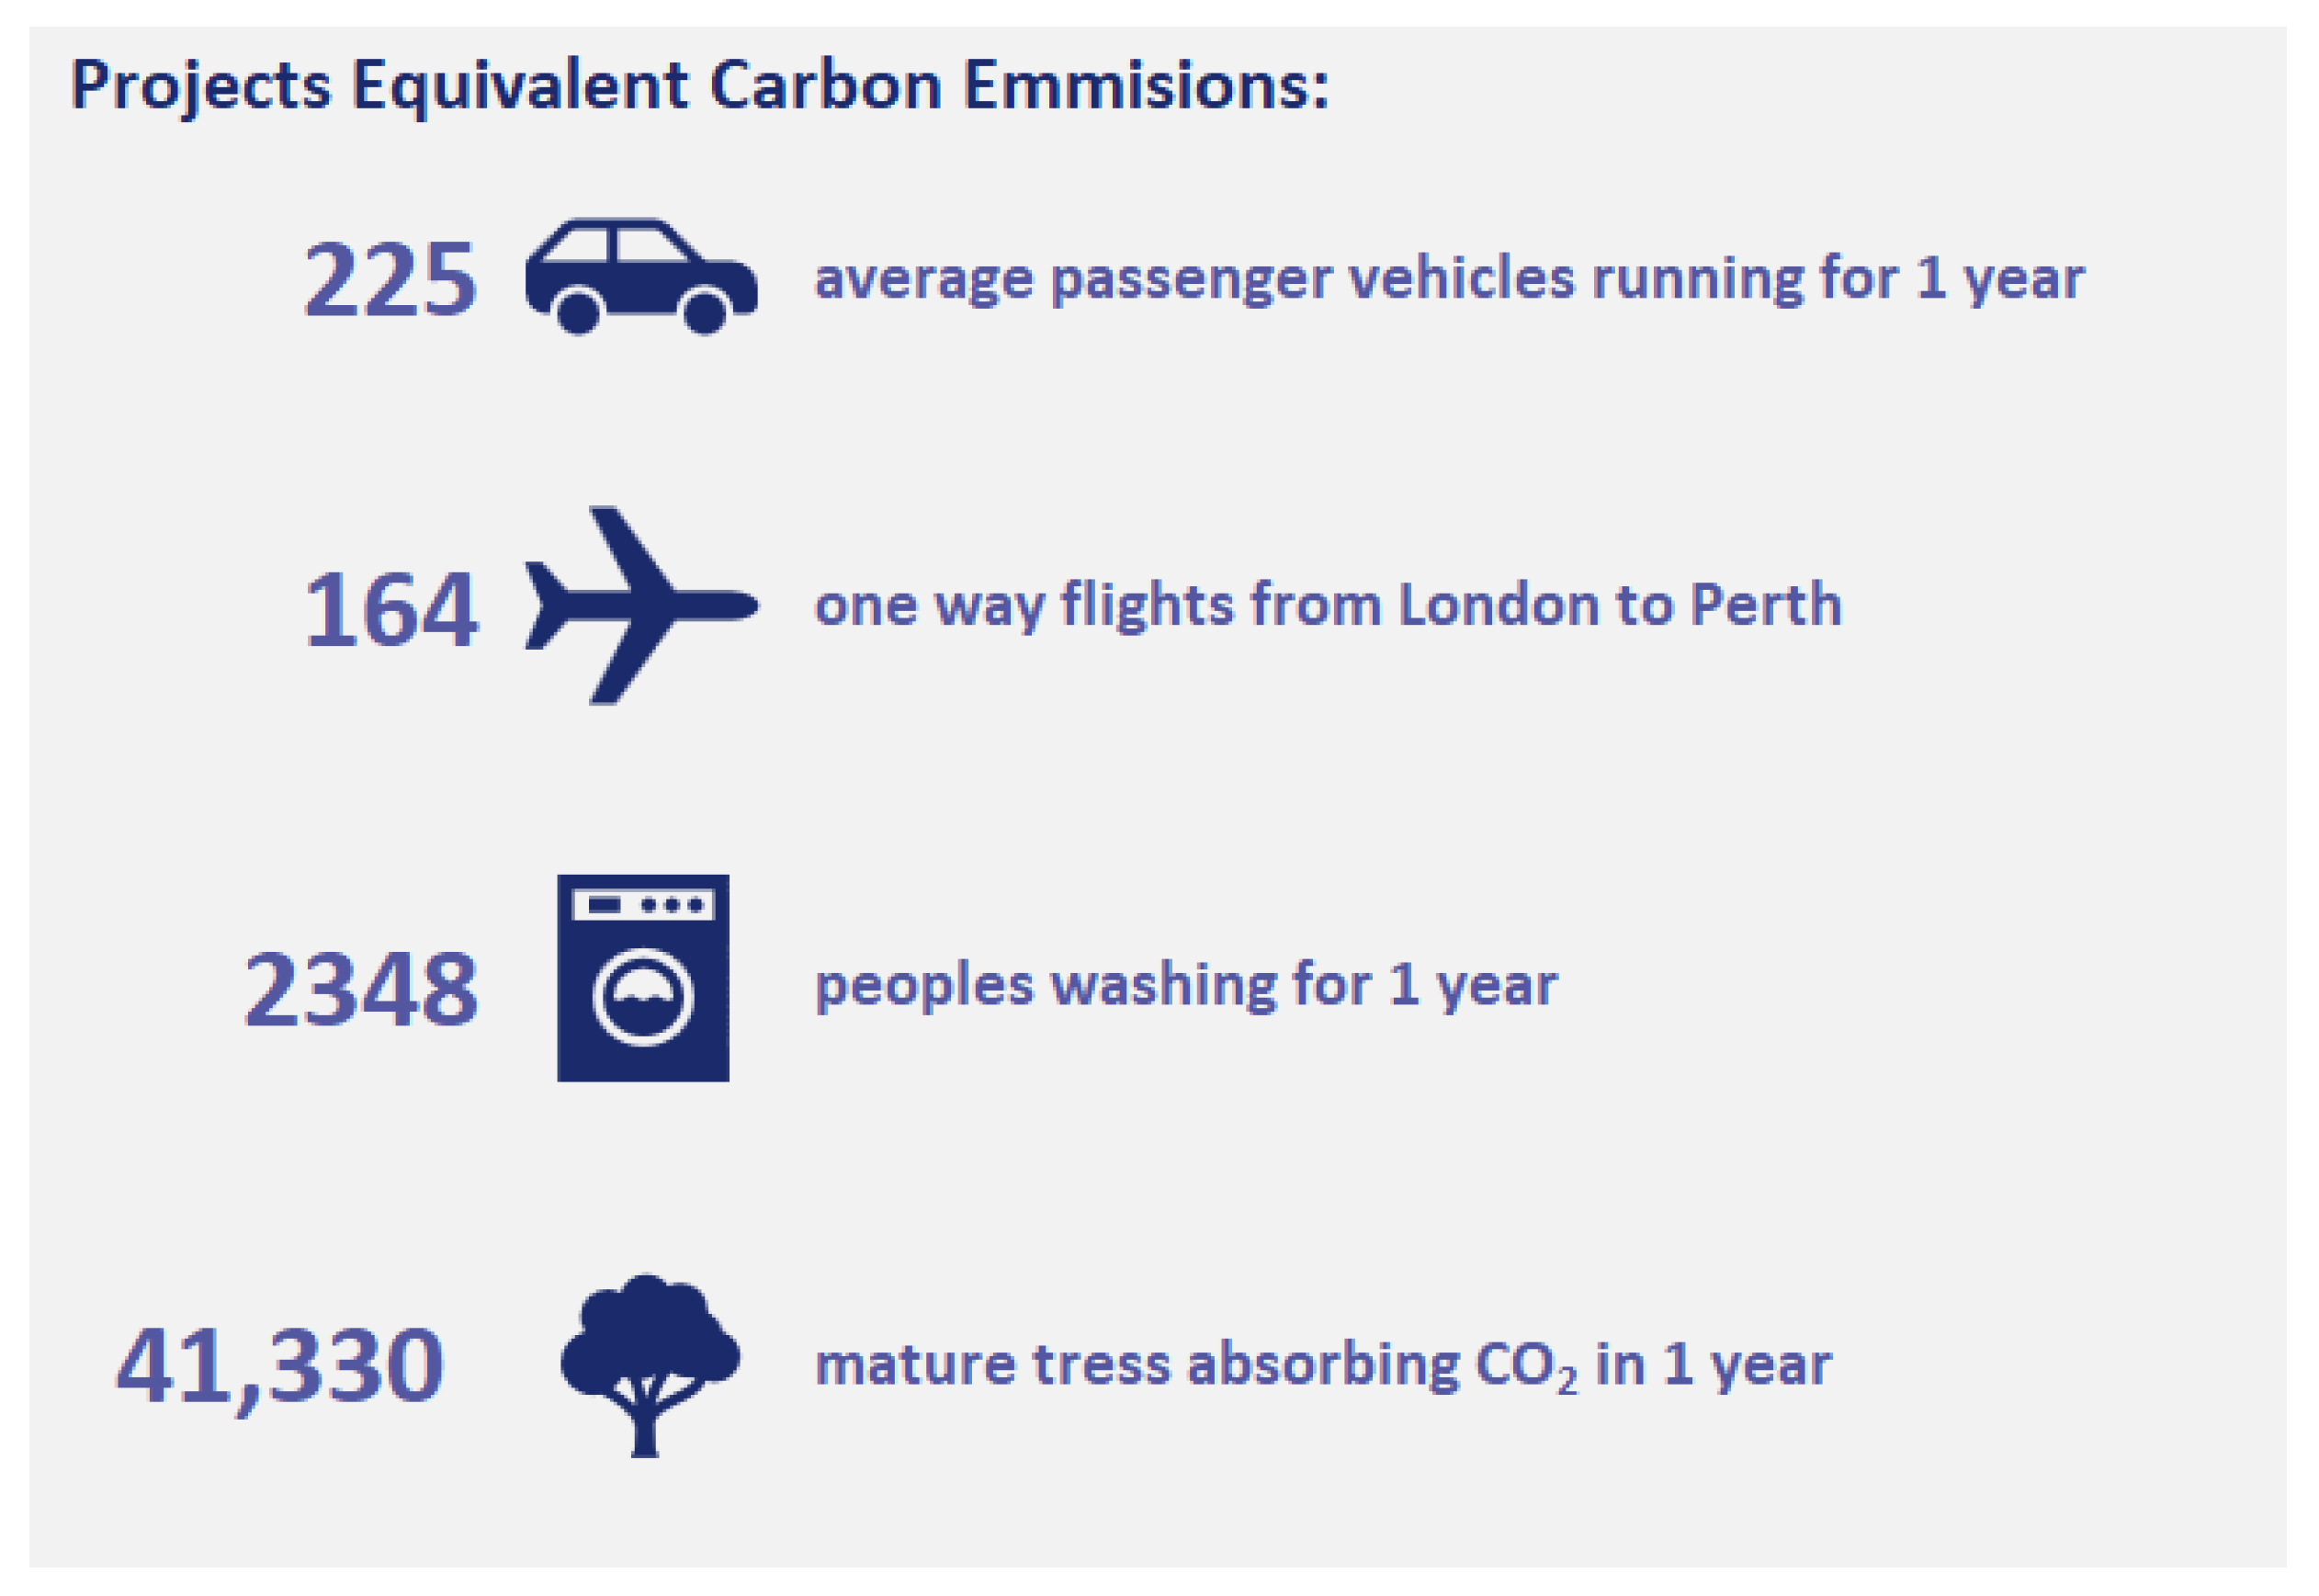
This module also calculates the project’s EC emissions equivalent to different activities to provide stakeholders who may not be familiar with EC values a means to comprehend the environmental impact of their project in a more relatable manner. To achieve this, the total EC of the structure is compared to the values provided in Table 1.
4.3.9. Score Assignment
5. Demonstration of the Prototype Tool for EC Assessment
A key aspect of the design science research methodology adopted in this study consists of the practical demonstration of the utility of the designed artefact, in line with the constructive approach to research [27]. In order to showcase the functionality of the proposed prototype tool, a practical illustrative example was designed. The example involved the creation of a structural model for a simple two-storey building using Autodesk Revit. The model incorporates diverse elements, including steel and reinforced concrete beams and columns, a selection of floor slabs composed of different materials, as well as pad foundations and piles. It is important to note that the inclusion of such a variety of structural elements and materials was primarily intended to verify and demonstrate the functionality of the prototype, rather than to suggest an optimal structural scheme. Subsequently, the prototype tool was utilised to assess the EC of the model, and the results were compared to manual calculations. The purpose was to validate the prototype’s capability to accurately assess the EC of various types of elements within the structural model. By employing this practical illustrative example, the study aims to provide tangible evidence of the prototype’s effectiveness and its potential application in real design projects.
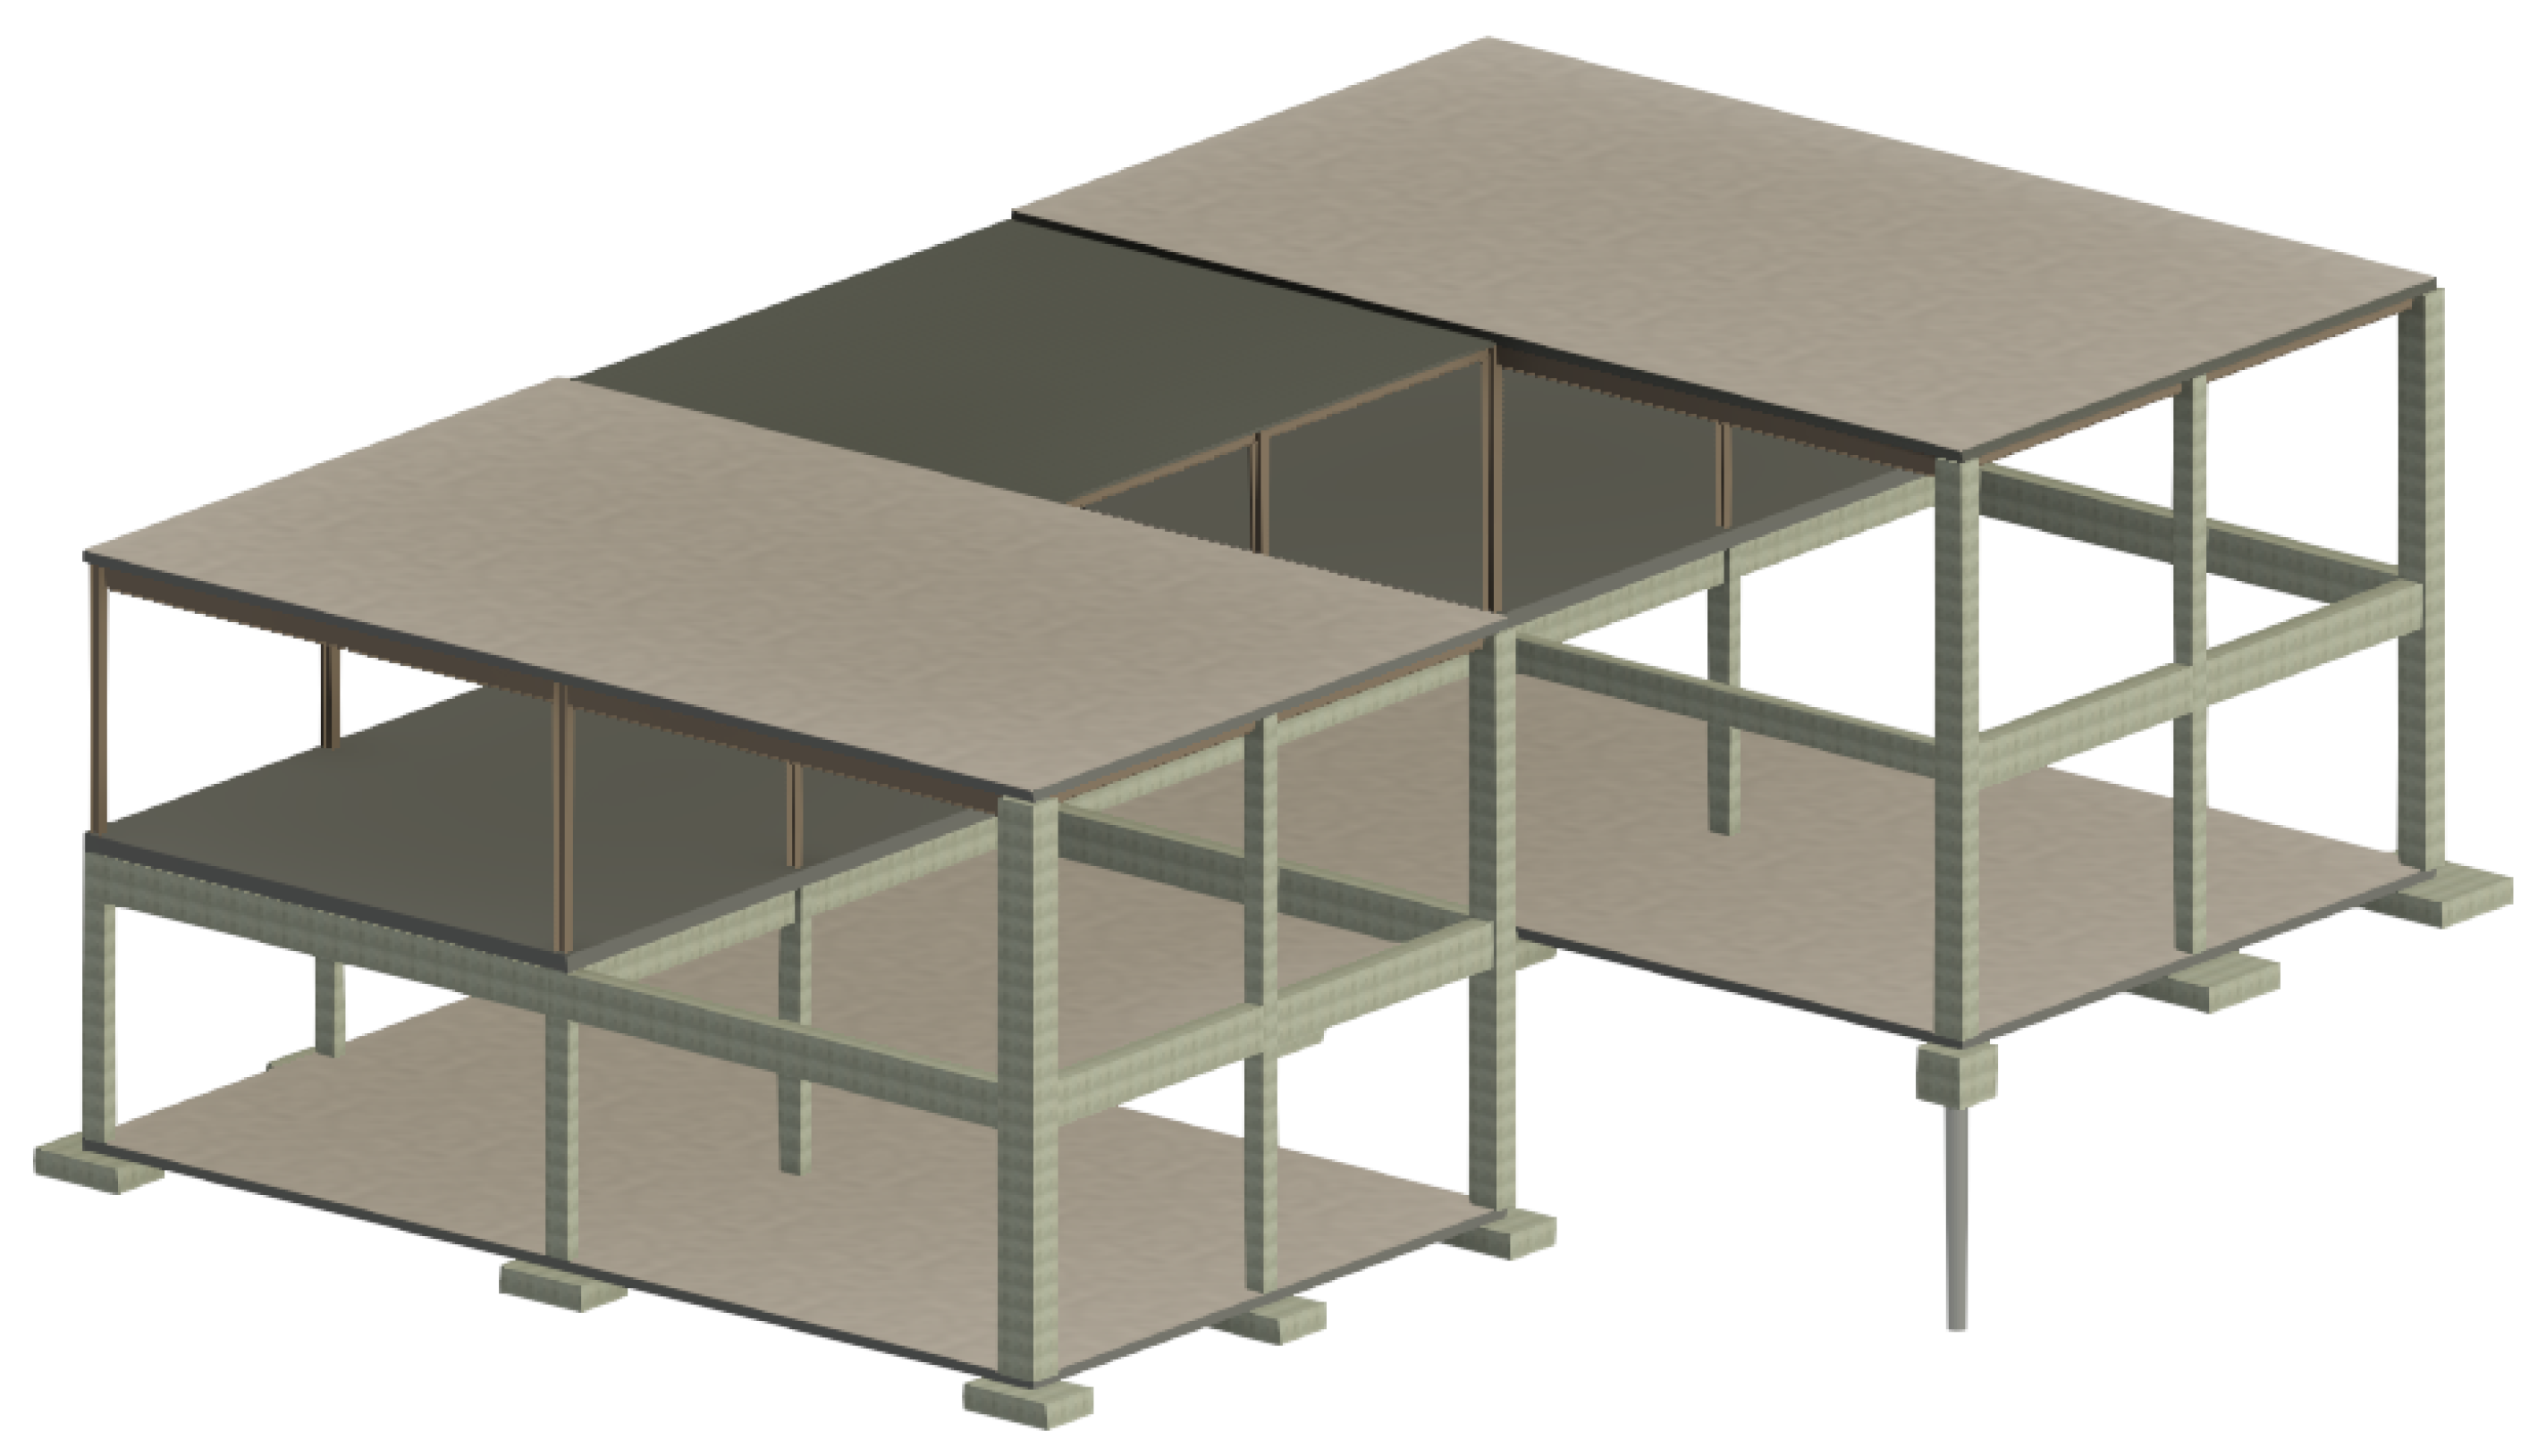
5.1. Example Structural Model
Figure 5 depicts the 3D model of the structure utilised to demonstrate the functionality of the prototype tool for assessing EC. As shown in the figure, the model contains diverse element types, which would not necessarily be present at the same time in an optimal structural scheme. This variety, however, allows for demonstrating the capability of the tool to assess EC in different types of BIM object categories and materials.
5.2. Outputs of the Prototype Tool
The proposed BIM-based prototype tool for assessing EC in structural models was utilised in the example structural model by executing the Dynamo script within the Revit BIM environment. The following outputs were obtained from the implementation of the tool.
5.2.1. Visualisation Model
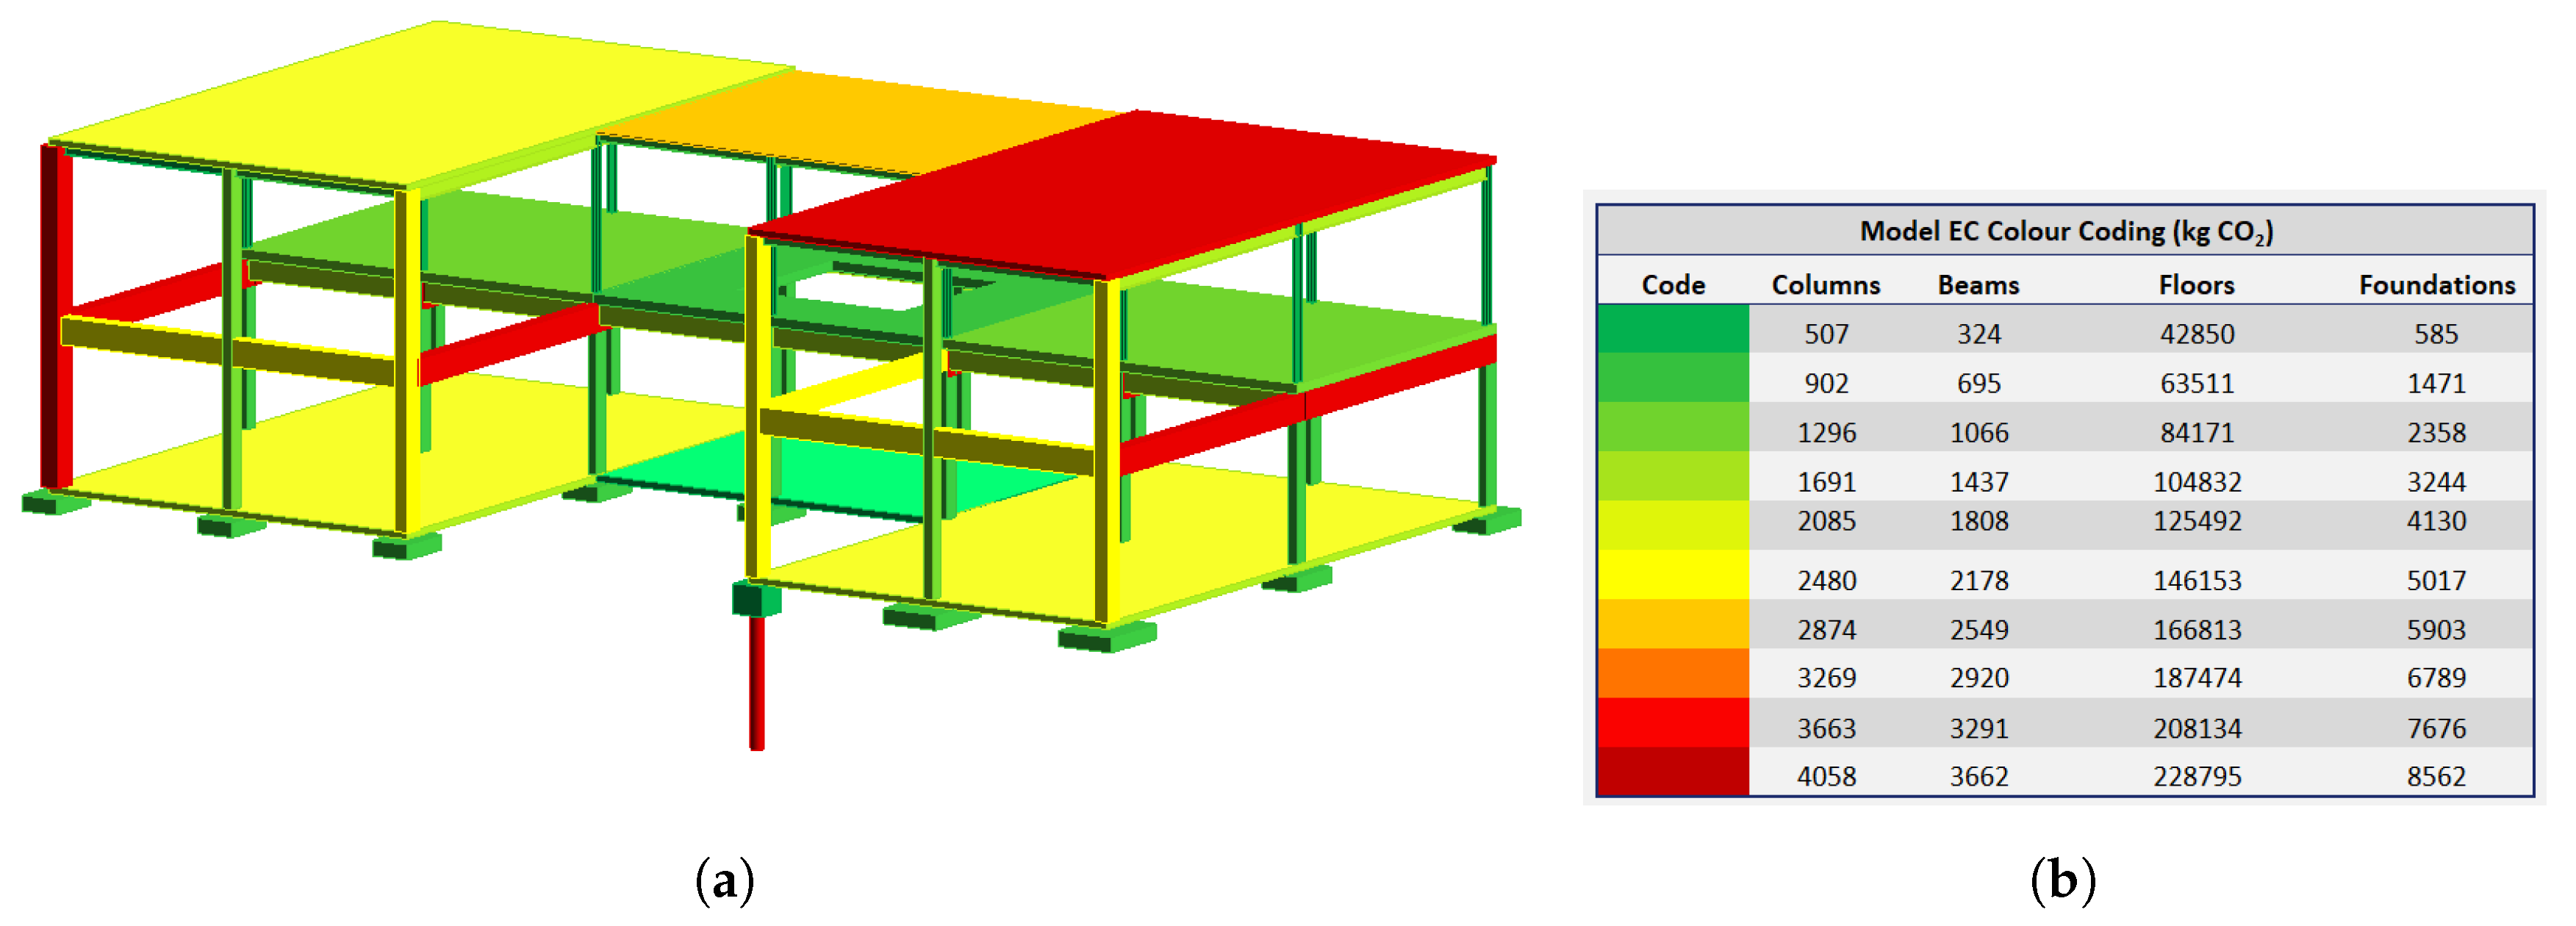
Figure 6a shows the colour-coded model with green-to-red colour scales applied by element category. The figure shows the element of each category with the highest EC contribution highlighted in red, while the elements with lower EC values are displayed in green. As previously discussed, this approach prevents larger elements, such as floor slabs, from being disproportionately highlighted as the higher EC contributors due to their mass, thereby not allowing designers to spot beams or columns that may have the potential to be optimised.
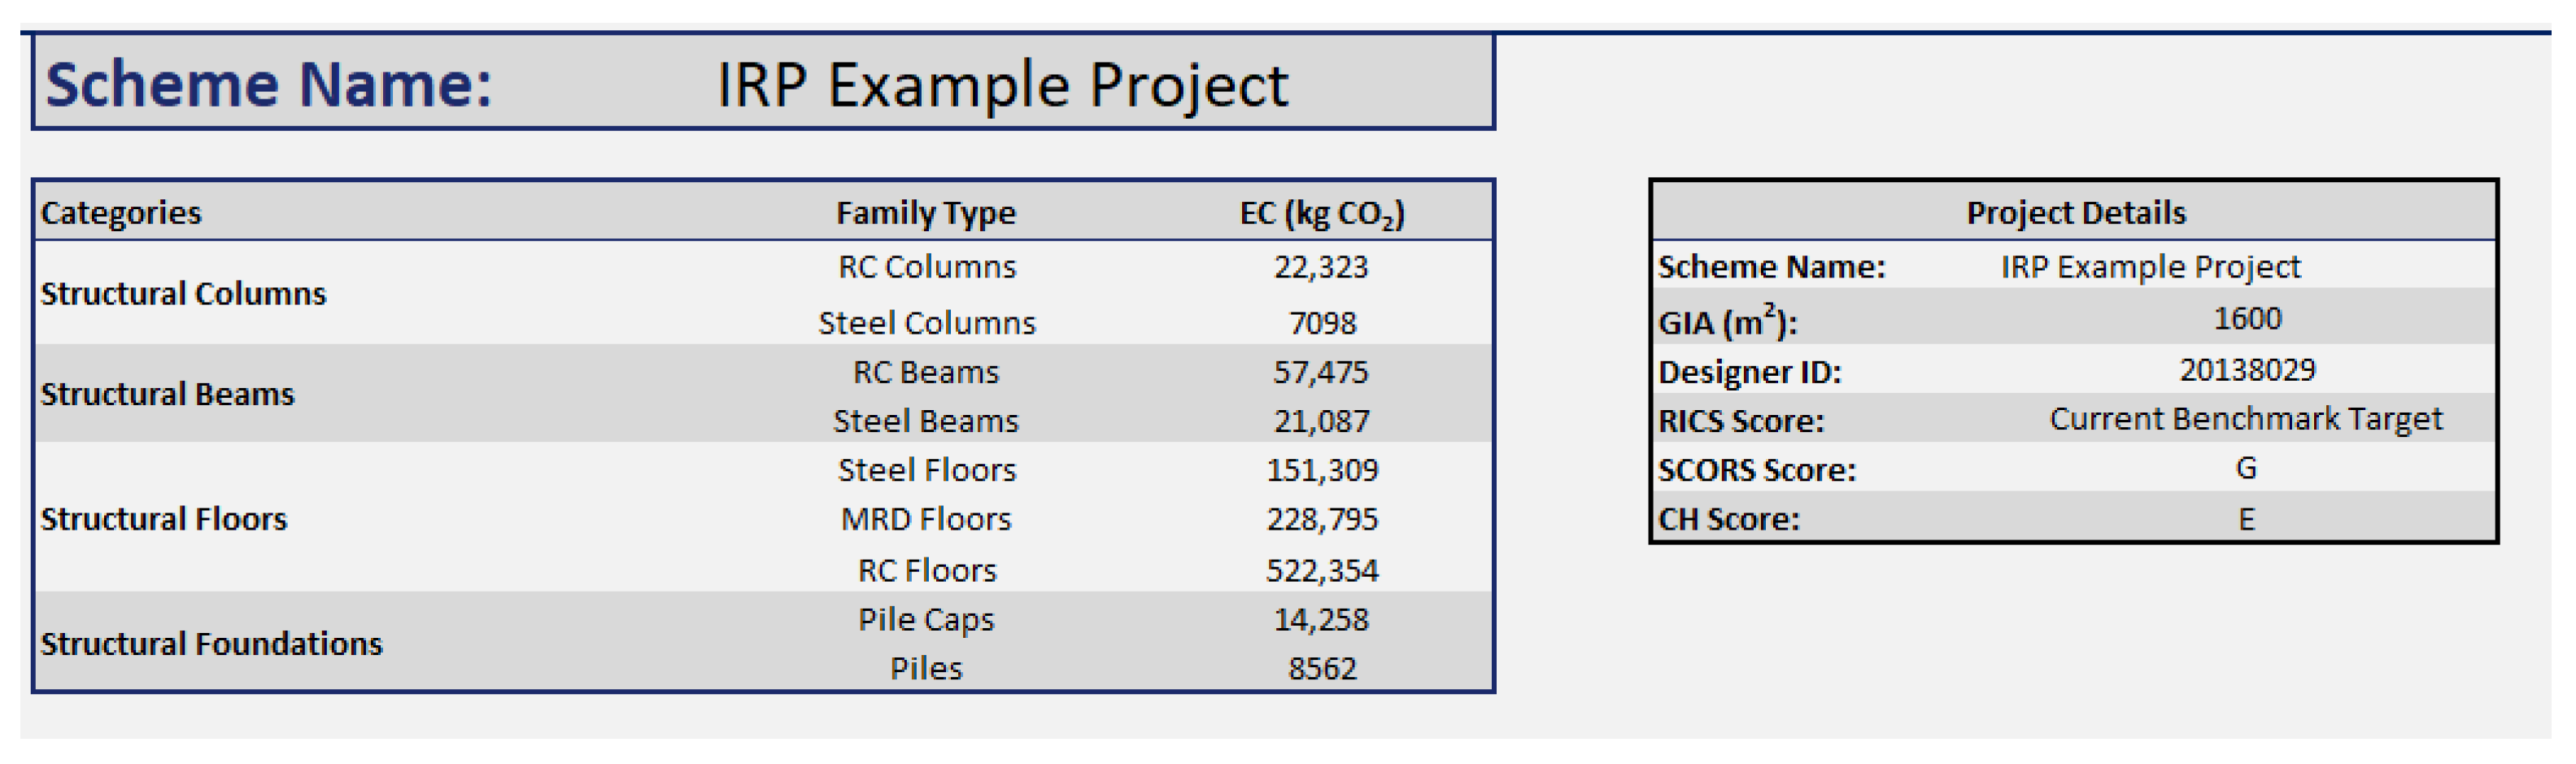
5.2.2. Summary of key EC data
Figure 7 shows the first section of the results report, providing an overview of the EC contributions for each element category in the model, further broken down per material. As expected, the floor elements have higher EC values. Notably, the visualisation model does not exclusively highlight floors, due to the adopted approach of applying a dynamic colour scale by element category. Additionally, the summary provides the ratings of the structure, although section six contains a more visual representation of these ratings.
5.2.3. Colour Code Key
As part of the results report, a key to the dynamic colour scale applied to each element category is provided. Figure 6b shows the key corresponding to the visualisation model of the example structural model. The value of implementing a category-based colour scale is effectively demonstrated in this example. By adopting this approach, it becomes apparent that the floor slab with the lowest EC contribution, highlighted in green, has an impact nearly ten times greater than that of the column with the highest EC. This finding highlights the significance of considering all elements within a structural model when aiming to reduce embodied carbon. If the focus were solely on reducing the EC of the slabs, the opportunity to optimise the columns may have been overlooked. Although the potential impact of optimising the columns may be comparatively smaller, other factors such as structural capacity need to be considered. In certain cases, making smaller changes to elements like columns may be the only feasible option for reducing EC while maintaining the necessary structural requirements.
5.2.4. Graphical Data Insights
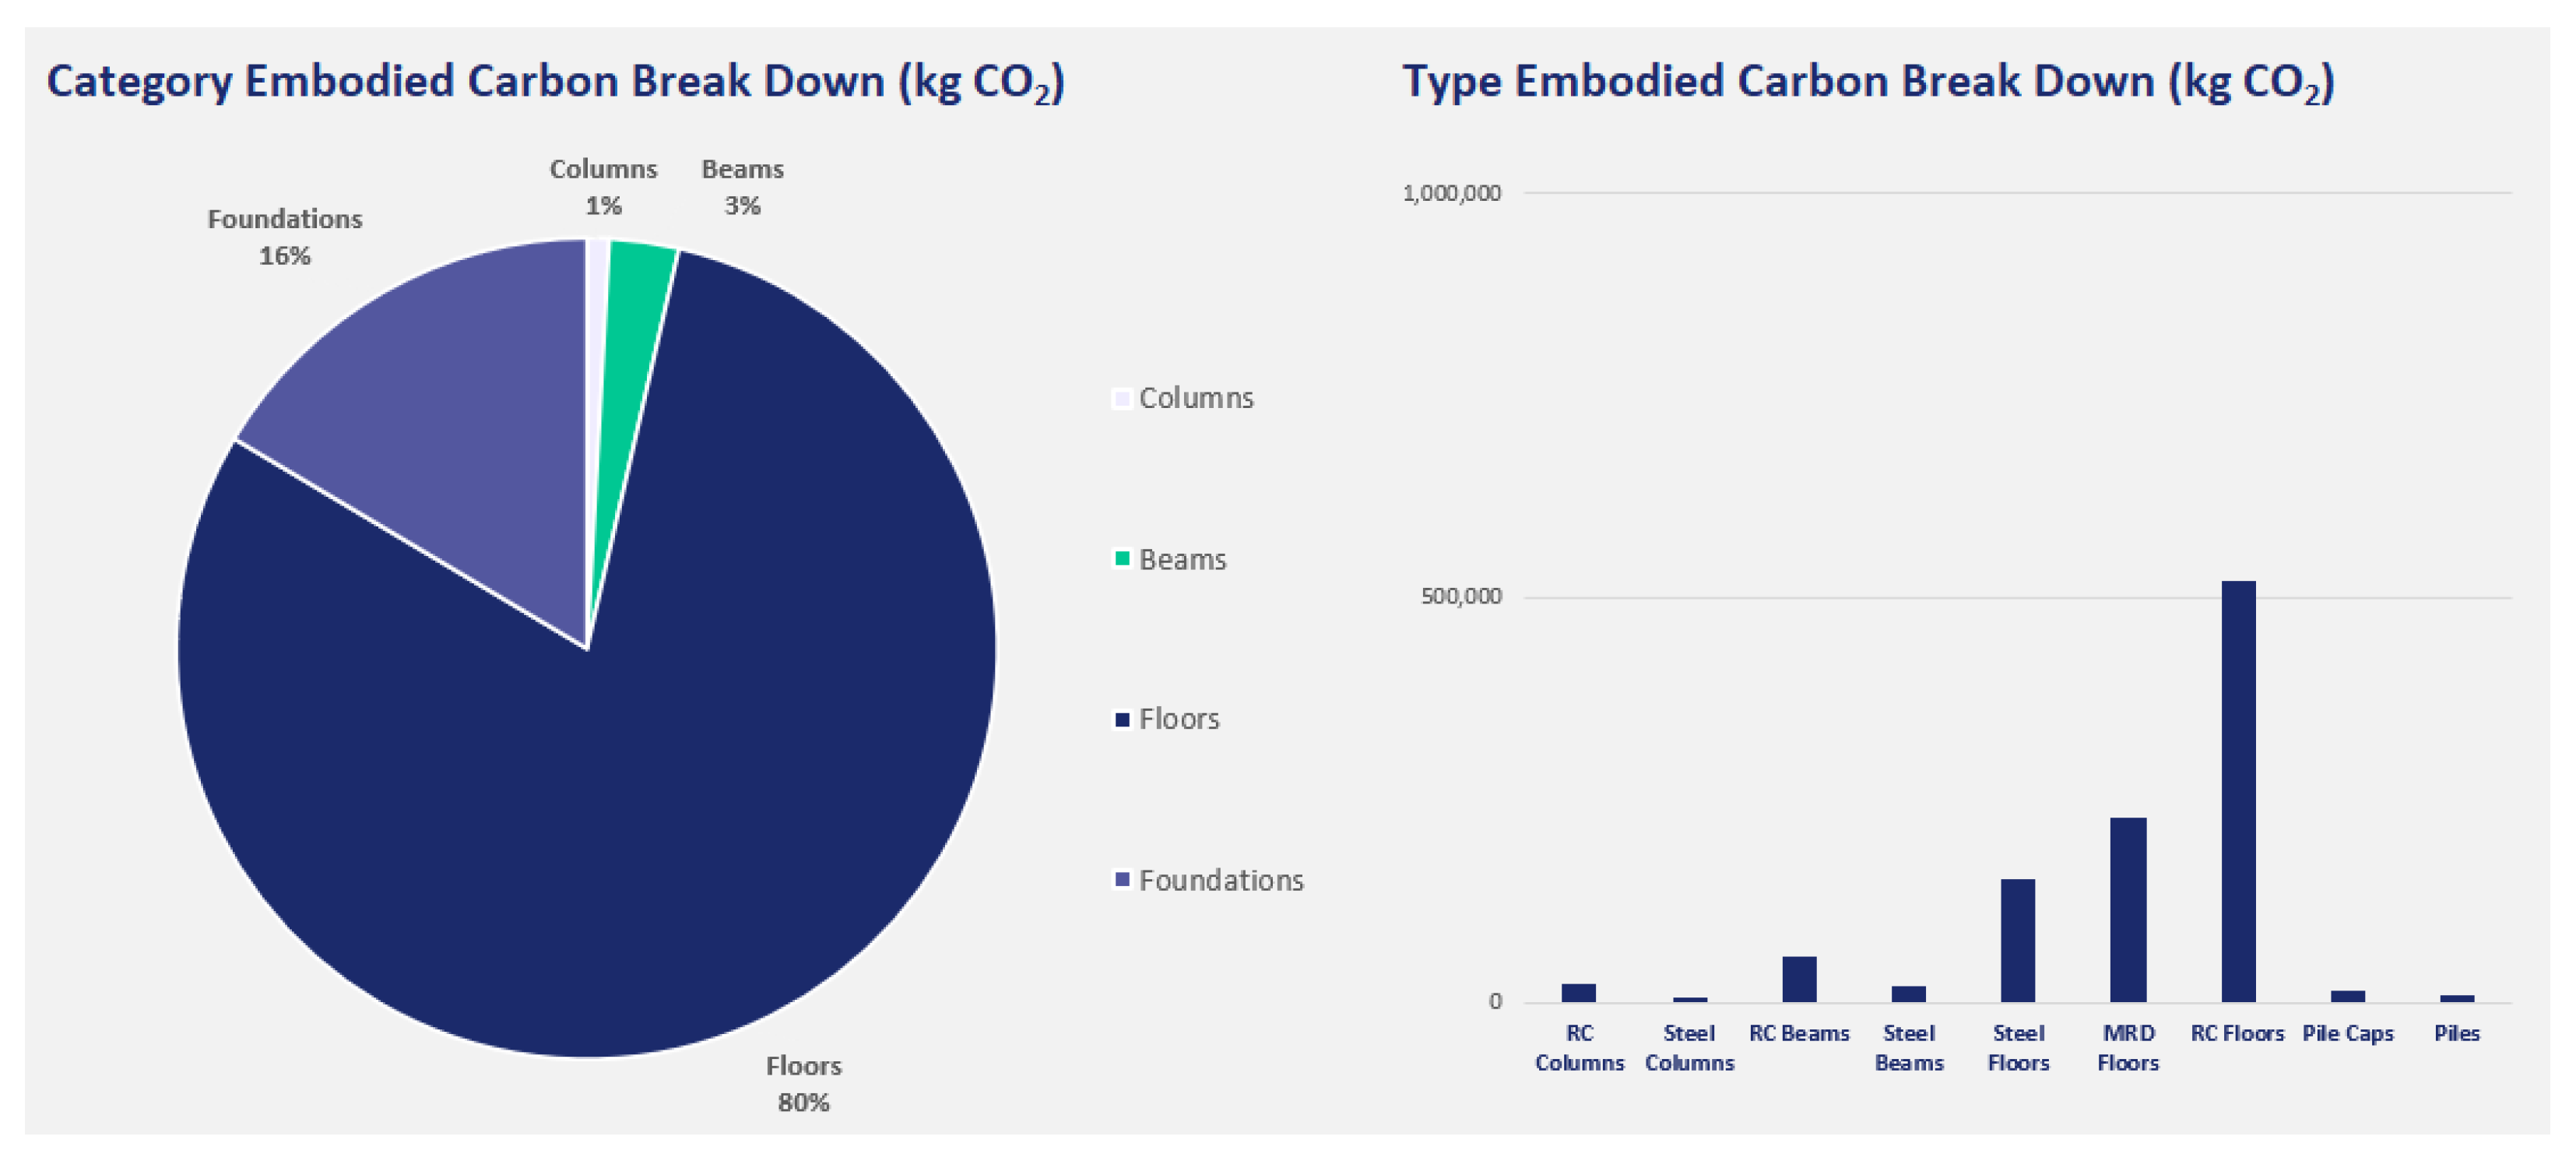
Figure 8 presents the graphical data insights obtained from the analysis of the example structural model. The pie chart on the left-hand side shows that the EC contribution of the floors in the example scheme is the largest. Following floors, foundations represent the second largest contributor, accounting for nearly a quarter of the total EC.
5.2.5. Project Equivalent Emissions
Understanding a project’s EC emissions without a suitable scale can make the amounts difficult to comprehend to stakeholders unfamiliar with EC values. Figure 9 shows the project’s EC emissions compared to more relatable activities to bridge the gap between technical EC calculations and practical understanding, facilitating meaningful discussion points and greater awareness of the project’s environmental impact.
5.2.6. Key Figures of the Project
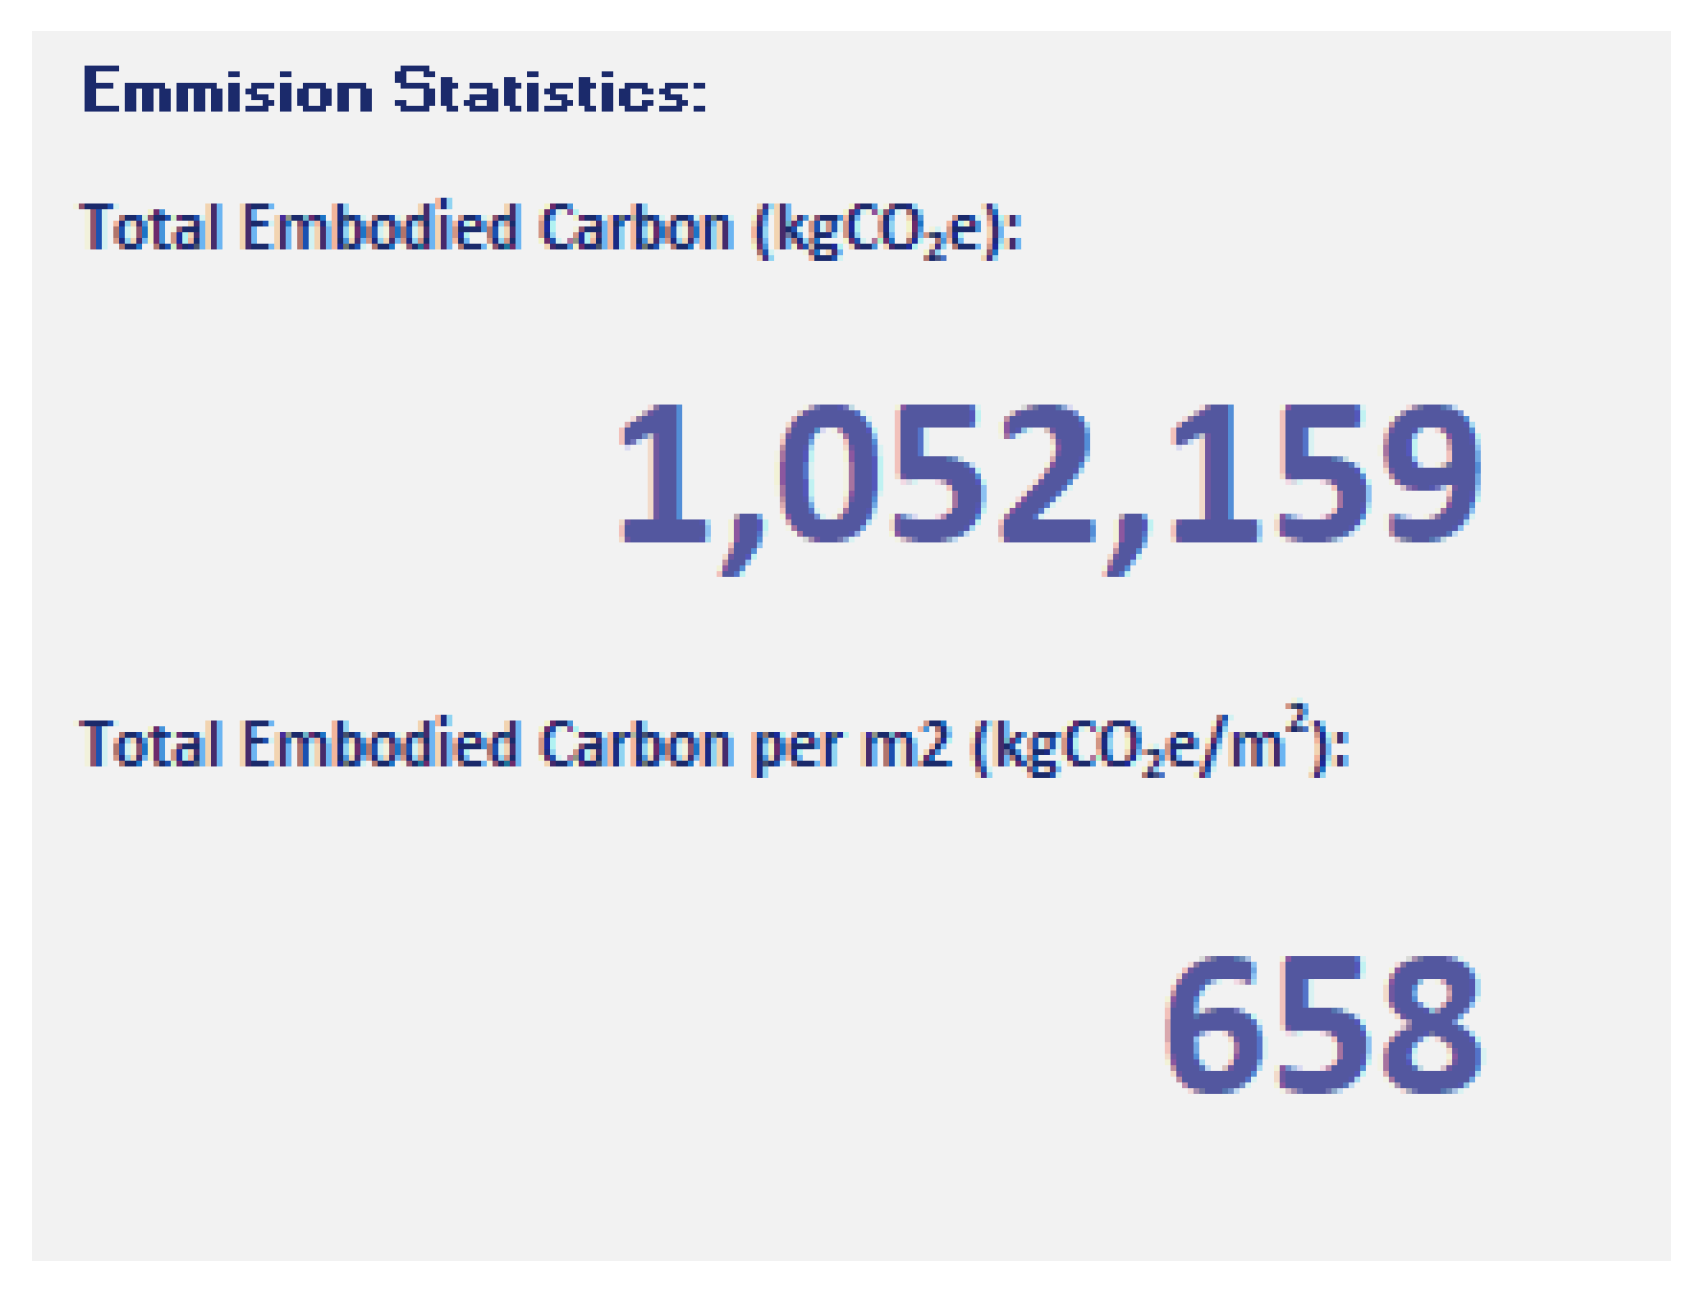
Figure 10 presents two key metrics related to the EC assessment of the example structure: the total EC and the total EC per square metre (m2). The first metric, the total EC, provides an overall measure of the EC within the structure, representing the cumulative EC contributions of all the elements in the model. The second metric, the total EC per m2, offers a normalised measure by taking into account the size of the structure calculating the ratio of the total EC to the gross internal area of the building. This more standardised metric can be compared across different projects or used as a benchmark.
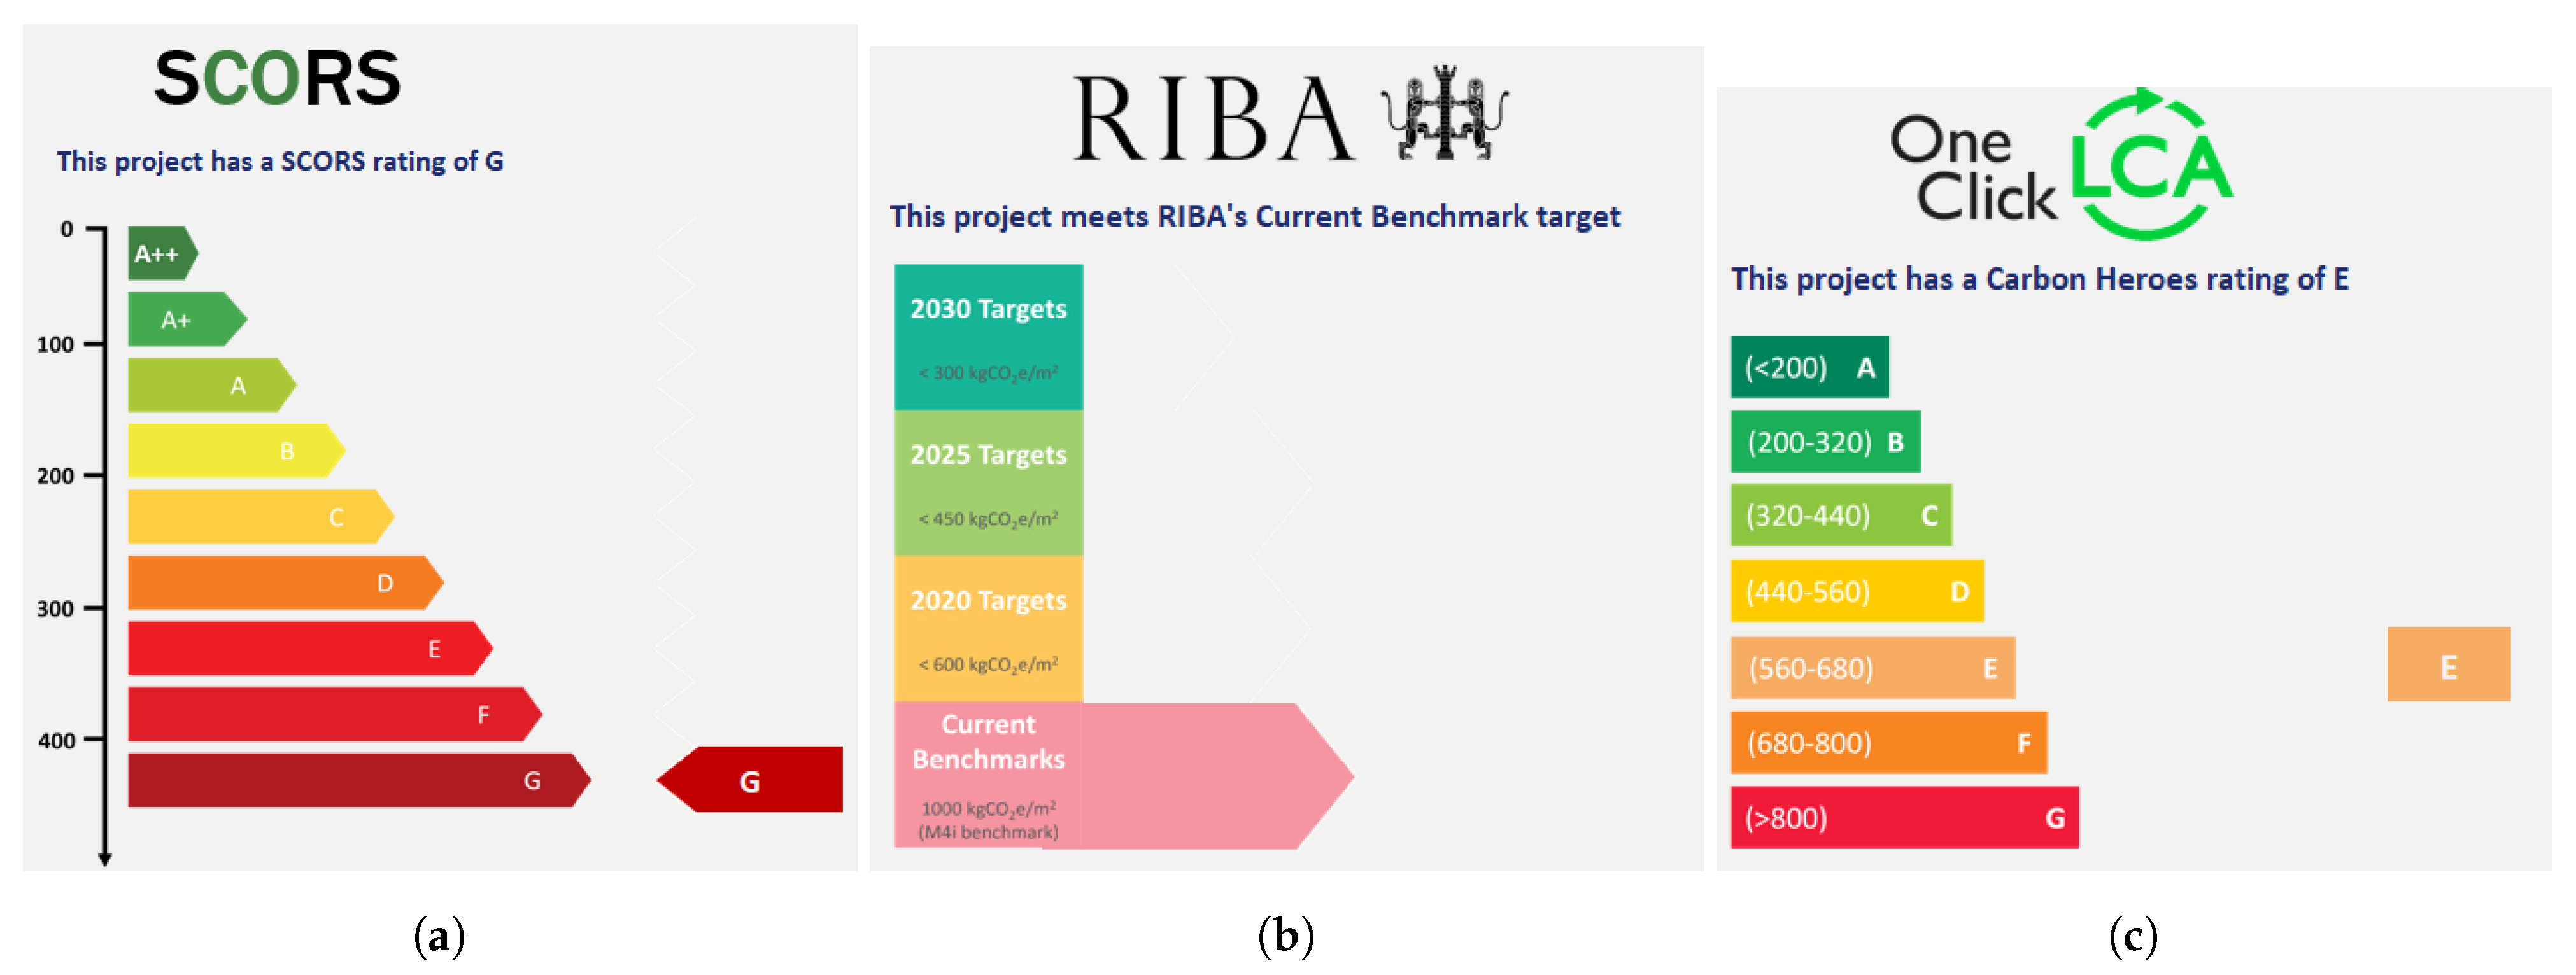
5.2.7. Project Rating
Figure 11 shows the project’s rating according to three established rating schemes. It is worth noting that several redundant elements were intentionally incorporated into the example structural proposal in order to showcase the ability of the prototype tool to assess the EC of various element categories and materials. Consequently, it is not surprising that the overall rating of the structure, as determined by the three schemes, is unfavourable. The significance of providing this rating information to decision-makers lies in its ability to facilitate a quick assessment of the project’s environmental performance, prompting the setting of targets to improve the rating of the structural proposal.
5.3. Verification of Results
The results of the proposed prototype tool for assessing EC in structural models were compared to those of three existing EC assessment tools, namely the Structural Carbon Tool [8], Beacon [28], and the Construction Carbon Tool [29]. Table 2 provides an overview of the comparison results. The table reveals that the prototype tool and the Structural Carbon Tool yielded similar outcomes. This alignment is anticipated, since both tools utilise EC factors from the ICE carbon factors database [9]. A notable disparity emerges between the results of the prototype tool and those of Beacon. This discrepancy can be attributed to the fact that Beacon classifies compound elements as “unknown” when reinforcement factors are undefined in the example structural model. As discussed, the prototype tool is primarily intended for use during the early design stages, where such information may not yet be available. Lastly, the results obtained from the Construction Carbon Tool rely solely on system type and GIA as inputs, resulting in relatively vague estimates of EC.
6. Discussion
Utilising BIM data for embodied carbon assessment offers promising opportunities for advancing sustainability practices in the construction industry and has been the focus of numerous research efforts, as evidenced by recent literature reviews [7]. A common thread in these studies is the strong emphasis on implementing the integration of BIM and environmental assessment methods at the earlier stages of design [11,30,31]. This is in alignment with our proposed approach, which focuses on enabling informed decision making by providing a comprehensive EC assessment that involves scoring the overall project and highlighting individual elements that can be improved by the designers.
In this research, a visual programming language was used to link EC factors to BIM objects. This approach has also been employed by other researchers in the field with similar results [30,32,33,34]. The consistent use of a VPL across multiple research endeavours highlights its effectiveness in facilitating the integration of EC factors into BIM models and enhancing the accuracy of EC assessment.
Visualising embodied carbon metrics within BIM models serves as a powerful tool for identifying potential hot spots or areas of concern in terms of embodied carbon. This approach supports designers and stakeholders in easily identifying elements or components that are candidates for improvement or optimisation. This approach is in line with recent research and industry efforts aimed at leveraging the visualisation capabilities of BIM and the growing recognition of the value of visual representations in understanding data [30,31,35].
Incorporating rating systems into the assessment of EC can help decision-makers to contextualise the environmental impact of their projects and achieve their sustainability targets. Our proposed prototype tool leverages BIM data to implement established rating systems, streamlining their adoption for early-stage calculations, as advocated by [13].
7. Conclusions
The main contribution of this study is the development and demonstration of a BIM-based prototype tool for assessing the embodied carbon of structural models. By utilising BIM as a powerful visualisation tool and data repository, the study demonstrates the viability of incorporating embodied carbon assessment into the building information modelling workflow at an early design stage, thereby facilitating informed decision making. The EC assessment tool provides valuable information for a wide range of stakeholders, namely a summarised overview of the project’s EC for a high-level evaluation, and a detailed colour-coded BIM model that enables designers to focus on areas that can be improved. The proposed approach has the potential to improve sustainability practices in the construction industry and play a part in tackling the global fight against climate change.
From an academic perspective, the study addresses a research gap by demonstrating the viability of integrating EC assessment in the early stages of design. In terms of practical implications, the presented prototype tool offers practitioners a solution that streamlines the assessment of EC in structural models, enabling informed decision making and the identification of optimisation opportunities. In terms of policy, the research is aligned with the industry’s recognition of EC importance and supports sustainable building practices towards achieving net zero carbon goals.
The limitations of this research and directions for future work include the following: (1) The prototype tool only considers material data and element volume or mass when performing the EC assessment, overlooking other significant factors that may hinder the modification of elements with high embodied carbon. For instance, factors such as increased structural load, which may result in elements with larger dimensions or additional reinforcement, are not considered. As a result, designers need to refine their choices to reduce embodied carbon while meeting project specifications. (2) The current version of the tool focuses on assessing EC from a cradle-to-gate perspective, which means it considers the carbon emissions associated with material production but excludes factors like transportation and construction. While a valuable baseline assessment is still provided, insights could be enhanced by incorporating additional parameters to account for carbon emissions during transportation to the construction site, effectively expanding the tool’s boundary condition to a cradle-to-site perspective. (3) Implementing the tool in a real-life project is still needed to fully validate its effectiveness and usefulness and to collect user perspectives on the prototype.
Author Contributions
Conceptualization, C.A.O.-S. and J.H.; methodology, J.H.; software, J.H.; validation, J.H. and C.A.O.-S.; formal analysis, J.H.; investigation, J.H.; resources, C.A.O.-S.; data curation, J.H.; writing—original draft preparation, J.H. and C.A.O.-S.; writing—review and editing, J.H. and C.A.O.-S.; visualization, J.H. and C.A.O.-S.; supervision C.A.O.-S.; project administration, C.A.O.-S. All authors have read and agreed to the published version of the manuscript.
Funding
This research received no external funding.
Institutional Review Board Statement
Not applicable.
Informed Consent Statement
Not applicable.
Data Availability Statement
The data presented in this study are available on request from the corresponding author.
Conflicts of Interest
The authors declare no conflict of interest.
References
- Bowles, W.; Cheslak, K.; Edelson, J. Lifecycle GHG Impacts in Building Codes; NBI New Buildings Institute: Portland, OR, USA, 2022. [Google Scholar]
- Ohene, E.; Chan, A.P.C.; Darko, A. Prioritizing barriers and developing mitigation strategies toward net-zero carbon building sector. Build. Environ. 2022, 223, 109437. [Google Scholar] [CrossRef]
- Tirelli, D.; Besana, D. Moving toward net zero carbon buildings to face Global Warming: A narrative review. Buildings 2023, 13, 684. [Google Scholar] [CrossRef]
- Orr, J.; Gibbons, O.; Arnold, W. A brief guide to calculating embodied carbon. Struct. Eng. 2020, 98, 22–27. [Google Scholar] [CrossRef]
- Azhar, S. Building information modeling (BIM): Trends, benefits, risks, and challenges for the AEC industry. Leadersh. Manag. Eng. 2011, 11, 241–252. [Google Scholar] [CrossRef]
- Li, R.Y.M. An Economic Analysis on Automated Construction Safety; Springer: Singapore, 2018. [Google Scholar] [CrossRef]
- Teng, Y.; Xu, J.; Pan, W.; Zhang, Y. A systematic review of the integration of building information modeling into life cycle assessment. Build. Environ. 2022, 221, 109260. [Google Scholar] [CrossRef]
- Gowler, P.; Arnold, W. An introduction to the structural carbon tool. Struct. Eng. 2021, 99, 14–15. [Google Scholar] [CrossRef]
- Hammond, G.P.; Jones, C.I. Embodied energy and carbon in construction materials. Proc. Inst. Civ. Eng.-Energy 2008, 161, 87–89. [Google Scholar] [CrossRef] [Green Version]
- Oti, A.H.; Tizani, W. BIM extension for the sustainability appraisal of conceptual steel design. Adv. Eng. Inform. 2015, 1, 28–46. [Google Scholar] [CrossRef]
- Xu, J.; Teng, Y.; Pan, W.; Zhang, Y. BIM-integrated LCA to automate embodied carbon assessment of prefabricated buildings. J. Clean. Prod. 2022, 374, 133894. [Google Scholar] [CrossRef]
- Wang, L.; Wang, Y.; Du, H.; Zuo, J.; Li, R.Y.M.; Zhou, Z.; Bi, F.; Garvlehn, M.P. A comparative life-cycle assessment of hydro-, nuclear and wind power: A China study. Appl. Energy 2019, 249, 37–45. [Google Scholar] [CrossRef]
- Arnold, W.; Cook, M.; Cox, D.; Gibbons, O.; Orr, J. Setting carbon targets: An introduction to the proposed SCORS rating scheme. Struct. Eng. 2020, 98, 8–12. [Google Scholar] [CrossRef]
- RIBA. RIBA 2030 Climate Challenge Version 2; Royal Institute of British Architects: London, UK, 2021. [Google Scholar]
- Hevner, A.R.; March, S.T.; Park, J.; Ram, S. Design Science in Information Systems Research. MIS Q. 2004, 28, 75–105. [Google Scholar] [CrossRef] [Green Version]
- vom Brocke, J.; Hevner, A.; Maedche, A. Introduction to design science research. In Design Science Research. Cases; Springer: Berlin/Heidelberg, Germany, 2020. [Google Scholar] [CrossRef]
- Khan, S.; Tzortzopoulos, P. Using design science research and action research to bridge the gap between theory and practice in lean construction research. In Proceedings of the 26th Annual Conference of the International Group for Lean Construction, Chennai, India, 18–22 July 2018; pp. 209–219. [Google Scholar] [CrossRef] [Green Version]
- Schimanski, C.P.; Pradhan, N.L.; Chaltsev, D.; Monizza, G.P.; Matt, D.T. Integrating BIM with Lean Construction approach: Functional requirements and production management software. Autom. Constr. 2021, 132, 103969. [Google Scholar] [CrossRef]
- Arnowitz, J.; Arent, M.; Berger, N. Effective Prototyping for Software Makers; Elsevier: San Francisco, CA, USA, 2010; pp. 21–25. [Google Scholar]
- Pasanen, P.; Castro, R. Carbon Heroes Benchmark Program–whole building embodied carbon profiling. IOP Conf. Ser. Earth Environ. Sci. 2019, 323, 012028. [Google Scholar] [CrossRef]
- Autodesk. Dynamo v2.0. Available online: https://dynamobim.org/ (accessed on 19 June 2023).
- One Click LCA. Average Quantities of Reinforcement in Concrete. Available online: https://oneclicklca.zendesk.com/hc/en-us/articles/360020943800-Average-Quantities-of-Reinforcement-in-Concrete (accessed on 26 May 2023).
- Environmental Protection Agency. Tailpipe Greenhouse Gas Emissions from a Typical Passenger Vehicle. Available online: https://www.epa.gov/greenvehicles/greenhouse-gas-emissions-typical-passenger-vehicle (accessed on 29 May 2023).
- The Guardian. Carbon Footprint per Passenger of Return Flights from London to Select Destinations (in kg of CO2). Available online: https://www.statista.com/statistics/1029998/worldwide-return-flight-carbon-footprint-uk/ (accessed on 21 March 2023).
- Bernes-Lee, M.; Clark, D. What’s the Carbon Footprint of … a Load of Laundry? Available online: https://www.theguardian.com/environment/green-living-blog/2010/nov/25/carbon-footprint-load-laundry (accessed on 21 March 2023).
- EcoTree. How Much CO2 Does a Tree Absorb? Available online: https://ecotree.green/en/how-much-co2-does-a-tree-absorb (accessed on 21 March 2023).
- Kasanen, E.; Lukka, K.; Siitonen, A. The constructive approach in management accounting research. J. Manag. Account. Res. 1993, 5, 243–264. [Google Scholar]
- Tomasetti, T. Beacon. Available online: https://core-studio.gitbook.io/beacon (accessed on 29 May 2023).
- Build Carbon Neutral. Construction Carbon Tool. Available online: http://www.buildcarbonneutral.org (accessed on 29 May 2023).
- Röck, M.; Hollberg, A.; Habert, G.; Passer, A. LCA and BIM: Visualization of environmental potentials in building construction at early design stages. Build. Environ. 2018, 140, 153–161. [Google Scholar] [CrossRef]
- Santos, R.; Costa, A.; Silvestre, J.; Vandenbergh, T.; Pyl, L. BIM-based life cycle assessment and life cycle costing of an office building in Western Europe. Build. Environ. 2020, 169, 106568. [Google Scholar] [CrossRef]
- Kiamili, C.; Hollberg, A.; Habert, G. Detailed assessment of embodied carbon of HVAC systems for a new office building based on BIM. Sustainability 2020, 12, 3372. [Google Scholar] [CrossRef] [Green Version]
- Hollberg, A.; Genova, G.; Habert, G. Evaluation of BIM-based LCA results for building design. Autom. Constr. 2020, 109, 102972. [Google Scholar] [CrossRef]
- Anwar, R.A. Enhancing the Integration of Sustainability Assessment within Dynamic BIM Enabled Design Projects; University of Northumbria at Newcastle: Newcastle upon Tyne, UK, 2022. [Google Scholar]
- Dibe, M.; Bowles, J.; Osment, M.; Wong, C.; Doboš, J. Visualizing Carbon in 3D Repo: From BIM to ZERO. In Proceedings of the 27th International Conference on Web3D Technology, Evry-Courcouronnes, France, 2–4 November 2022. [Google Scholar]
Figure 1.
System architecture.

Figure 2.
Colour code range based on EC value.

Figure 3.
Distribution of sections within the output report. (1) Summary of key EC data. (2) Colour code key. (3) Graphical data insights. (4) Project equivalent emissions. (5) Key figures of the project. (6) Project rating.
Figure 3.
Distribution of sections within the output report. (1) Summary of key EC data. (2) Colour code key. (3) Graphical data insights. (4) Project equivalent emissions. (5) Key figures of the project. (6) Project rating.

Figure 4.
Overview of the Dynamo script.

Figure 5.
Example structural model.

Figure 6.
Visualisation model of example structural model. (a) Colour-coded structural model. (b) Results report—Key for colour coding.
Figure 6.
Visualisation model of example structural model. (a) Colour-coded structural model. (b) Results report—Key for colour coding.

Figure 7.
Results report—Summary of key EC data.

Figure 8.
Results report—Graphical data insights.

Figure 9.
Results report—Project equivalent emissions.

Figure 10.
Results report—Key figures of the project.


Table 1.
EC emissions of relatable activities.
| Activity | EC Emissions (kg CO2e) |
|---|---|
| A passenger vehicle running for 1 year [23] | 4600 |
| A one-way ticket from London to Perth [24] | 1577 |
| A person washing for 1 year [25] | 440 |
| A mature tree absorbing CO2 for 1 year [26] | 25 |
Table 2.
Comparison results of EC assessment tools.
| EC Assessment Tool | Total EC (t CO2e) | Total EC per m2 (kg CO2e/m2) |
|---|---|---|
| Prototype tool | 1033 | 646 |
| Structural Carbon Tool | 1048 | 655 |
| Beacon | 778 | 485 |
| Construction Carbon Tool | 455 | 284 |
Disclaimer/Publisher’s Note: The statements, opinions and data contained in all publications are solely those of the individual author(s) and contributor(s) and not of MDPI and/or the editor(s). MDPI and/or the editor(s) disclaim responsibility for any injury to people or property resulting from any ideas, methods, instructions or products referred to in the content. |
© 2023 by the authors. Licensee MDPI, Basel, Switzerland. This article is an open access article distributed under the terms and conditions of the Creative Commons Attribution (CC BY) license (https://creativecommons.org/licenses/by/4.0/).
Share and Cite
MDPI and ACS Style
Hunt, J.; Osorio-Sandoval, C.A. Assessing Embodied Carbon in Structural Models: A Building Information Modelling-Based Approach. Buildings 2023, 13, 1679. https://doi.org/10.3390/buildings13071679
AMA Style
Hunt J, Osorio-Sandoval CA. Assessing Embodied Carbon in Structural Models: A Building Information Modelling-Based Approach. Buildings. 2023; 13(7):1679. https://doi.org/10.3390/buildings13071679
Chicago/Turabian StyleHunt, James, and Carlos A. Osorio-Sandoval. 2023. "Assessing Embodied Carbon in Structural Models: A Building Information Modelling-Based Approach" Buildings 13, no. 7: 1679. https://doi.org/10.3390/buildings13071679
Note that from the first issue of 2016, this journal uses article numbers instead of page numbers. See further details here.