Article

Analysis of Carbon Emission Reduction Paths for the Production of Prefabricated Building Components Based on Evolutionary Game Theory

1
School of Construction Engineering, Shenzhen Polytechnic, Shenzhen 518055, China
2
School of Economics and Management, Jilin Jianzhu University, Changchun 130119, China
*
Authors to whom correspondence should be addressed.
Buildings 2023, 13(6), 1557; https://doi.org/10.3390/buildings13061557
Submission received: 5 May 2023 / Revised: 6 June 2023 / Accepted: 16 June 2023 / Published: 19 June 2023
(This article belongs to the Section Building Energy, Physics, Environment, and Systems)

Abstract

:
Prefabricated buildings are gradually being promoted from pilot demonstration to scale, to combat climate change and improve energy conservation and emission reduction in the building sector. Despite the carbon emission of assembled structures being substantially lower than that of cast-in-place buildings due to the significant reduction in energy demand during the materialization process, there is still a lot of room for improvement. This study looks at the strategy choices made by manufacturers of prefabricated building components in relation to lowering carbon emissions from the standpoint of manufacturing prefabricated building components. By building a dynamic evolutionary game model between two parties, we investigate the evolutionary process of the strategy chosen by prefabricated building component manufacturers and the government, analyzing the evolutionary stability of each side’s strategy choice, and finally using Matlab tools to simulate the effectiveness of the evolutionary stability. The study findings indicate that (1) low-carbon production costs, local government incentives and sanctions, and corporate low-carbon production benefits are the main influencing factors for manufacturers of prefabricated building components to adopt low-carbon production techniques; and that (2) the cost of regulation under low-carbon production methods and the local government performance assessment system are the key elements affecting regulations by the local government. Based on this finding, we suggest corresponding countermeasures in three areas, including investigating new low-carbon technology options for businesses, developing a new carbon emission accounting subsidy mechanism, and improving the regulatory framework of the government, to provide an efficient pathway for the growth of a low-carbon economy.

1. Introduction

1.1. Background

During the 75th session of the United Nations General Assembly in September 2020, president Xi Jinping sincerely pledged that “carbon dioxide emissions peak before 2030 and achieve carbon neutrality before 2060”. To achieve this goal, China must be pragmatic and arrange its economy, society, and resources to enable low-carbon, green, and circular development [1]. About 1.5 billion tons of emissions are attributable to the building sector and its connected businesses. The construction sector and its linked businesses generate nearly 40% of greenhouse emissions according to the 2019 Global Status Report on buildings and construction released by the International Energy Agency and the United Nations Environment Programme [2]. To ensure economic growth, it is crucial to address the issue of carbon emission reduction in the building industry. One of the most successful strategies for ensuring the construction industry’s sustainable growth is the industrialization of the sector. One of the most effective strategies to ensure the sustainability of the construction sector is to industrialize it [3]. Compared to traditional cast-in-place buildings, prefabricated buildings can reduce carbon emissions by 472.23 kg/m2 [4]. As shown in Table 1, China has recently established a number of regulations to encourage the growth of prefabricated buildings. In conclusion, it is clear that assembly-type construction will continue to be the direction in which China’s construction industry develops. As a result, local government control over local producers of assembly-type building components is a key component of the country’s efforts to reduce carbon emissions. The manufacturing of prefabricated building components—which encompasses both the production of materials used in prefabricated structures and the production of prefabricated components—is the subject of this article, since it is the highest source of carbon emissions per unit of time. Therefore, it is critical to consider and investigate feasible strategies for cutting carbon emissions during the production of prefabricated building components in China.

1.2. Literature Review

1.2.1. Carbon Emissions in the Construction Industry

Numerous scholars domestically and abroad have conducted studies on carbon emissions in the building industry. Mao et al. [5] compared the carbon emissions of semi-prefabricated buildings and cast-in-place buildings, and pointed out that the carbon emissions of semi-prefabricated buildings are slightly smaller than those of cast-in-place buildings. Prefabricated buildings and conventional cast-in-place buildings were used as the research subjects by Zhou et al. [6].They divided the carbon emissions of buildings into five stages: factory building material production, component transportation, on-site installation, use, and demolition. They then proposed carbon emission calculation methods for each stage, calculated the total carbon emissions of prefabricated buildings and conventional cast-in-place buildings at the five stages, and reported their findings. Prefabricated structures emit far lesser carbon emissions than conventional cast-in-place structures do. Yang et al. [7] found that wood buildings may cut carbon emissions by 11% when compared to conventional reinforced-concrete buildings after comparing the life-cycle carbon emissions of wood buildings with those of ordinary reinforced-concrete buildings. Joseph Lai et al. [8] conducted an analysis of several commercial buildings in Hong Kong to investigate the main factors that currently affect carbon emissions in commercial buildings. The study was based on reliable data from these buildings over the past six months, and the results showed that the floor area of the building and the current age of the building played a positive role in carbon emissions, but the unit carbon emissions of small buildings were generally higher than those of large buildings. Zhang et al. [9] modeled the stochastic effects of the population, wealth, and technology diffusion to classify cities into three major categories and investigate the existence of their differences. The results show that there is an inverted U-shaped relationship between carbon dioxide emissions and the economic growth of cities, and that the level of technology also directly affects the level of carbon emissions, but there is room for growth at the level of technology. Yu et al. [10] developed an extended stochastic impact model with population, affluence, and technology regression (STIRPAT) to assess the effect of household factors on household CO2 emissions using statistical data from the Jiangsu Province for the years 2005–2019. You et al. [11] developed a carbon emission simulation model in the context of carbon peaking and carbon neutrality in China, which considers climate regions, building types and end services, and is modified by building metabolism quantification techniques. The findings indicate the need to adopt carbon capture, utilization, and storage technologies to achieve the “last mile” of building neutrality in China. Recent research on carbon emissions from prefabricated buildings has focused on the simulation of carbon emissions. The simulation of carbon emissions has been the focus of recent research on carbon emissions from prefabricated buildings. Guo et al. [12] proposed a dual-objective approach to optimize the cost and carbon emission by analyzing the relationship between carbon emission and the cost of prefabricated buildings, using an improved optimization algorithm to solve the problem. Through the analysis of actual cases, the results show that when the prefabrication rate is 35–40%, companies can achieve better carbon emission reduction by appropriately increasing the cost. When the prefabrication rate is higher than 40%, the carbon emission reduction effect that can be obtained by significantly increasing the cost is limited. Wang et al. [13] take prefabricated components, the basic components of prefabricated buildings, as the research object and clues based on statistical methods. The actual carbon emission performance of transportation vehicles loaded with different quantities of components was simulated, and the carbon emission coefficients and related parameter sets of transportation vehicles were experimentally measured. The results of the study show that the model has a good interpretation of the measured data and can better reflect the real situation of the carbon emission of prefabricated buildings at the transportation stage of prefabricated components, which improves the accuracy of carbon emission calculation at this stage. Li et al. [14] developed a whole-life-cycle accounting system based on BIM technology to accurately and efficiently calculate the carbon emissions of precast concrete buildings and verify the effect of energy saving and emission reduction.

1.2.2. Evolutionary Game Theory

The study of game theory and dynamic evolutionary processes, which have their roots in behavioral ecology and biological evolution, are combined in the new theory known as evolutionary game theory. Evolutionary games are designed to refine the multiple equilibrium puzzles of classical games and demonstrate that some equilibrium strategies can be generated by a limited number of interactions between individuals [15], and they have been used extensively in economics and management research in recent years. At the same time, there is a wealth of papers that introduce evolutionary game theory into the analysis of government and corporate behavior regarding environmental governance and low carbon, with the main literature summarized as follows. Tian et al. [16] used a system dynamics model to guide subsidy policies to promote the diffusion of green supply chain management in China, analyzed the relationship between stakeholders such as the government, enterprises, and consumers through evolutionary game theory, and simulated the diffusion process of green supply chain management, with a model case study of China’s automobile manufacturing industry. The results suggest that manufacturer subsidies promote the proliferation of green supply chain management more than consumers, and that environmental awareness is another key influencing factor. By coordinating producers and retailers to find a synergistic alliance, judging their strategies and triggering green practices with maximum benefits, Barari et al. [17] apply an evolutionary game approach to provide the best economic benefits and solutions, thus confirming existing sustainability indicators and providing a comprehensive view of supply chain systematics from an environmental management perspective, including the impact and advantages of management, using the environment as a key element of economic motivation. Based on an in-depth study of the placement of VMs (virtual machines), Xiao et al. [18] successfully solve the challenges faced by dynamic VM locations by building a computational model of energy consumption and a new algorithm of evolutionary game theory, and propose and describe a solution to the problem of optimizing VMs toward energy consumption. Zhao et al. [19] propose an evolutionary game model created by applying system dynamics to simulations to explore the possible responses of companies through a case study of Chinese air conditioning companies and develop incentives to promote the implementation of carbon emission reduction labeling programs. He et al. [20] considered developers, consumers, and the government as the core stakeholders in the development of green buildings, constructed a two-stage game model including developers, consumers, and the government, and found that government subsidies have a positive impact on the development of green buildings, and the effect of subsidies to consumers is better than that of subsidies to developers. Cohen et al. [21] address the problem of few green buildings in Israel by using the game theory to analyze the barriers that prevent the expansion and upgrading of green buildings in Israel, and suggest steps that might help overcome them.

1.2.3. The Application of Evolutionary Game Theory in Prefabricated Buildings

An evolutionary game analysis of prefabricated buildings focuses on promoting the development of prefabricated buildings. Huang et al. [22] analyzed the allocation ratio of the incremental cost inputs of prefabricated buildings based on game theory for the phenomenon that the market share of prefabricated, assembled houses is relatively low. Under the condition of the bounded rationality of consumer participation, an evolutionary game theory of the government and real estate companies was established. The validity of the game theory is then verified by means of empirical analysis, so as to provide a reference for the relevant departments to promote the large-scale development of prefabricated, assembled houses. Song et al. [23] established a four-party evolutionary game model consisting of construction units, real estate developers, home buyers, and government departments under the government regulatory system by analyzing the entire interest chain of prefabricated construction projects. The aim is to study the influence of government management and economic strategies on policies to promote prefabricated buildings. Using evolutionary game theory and system dynamics, Li et al. [24] developed a new model to determine the payoff risk of prefabricated buildings, which provides a reference to further promote incentive policies for prefabricated building projects. Based on evolutionary game theory, Yuan et al. [25] studied the evolutionary decision-making behavior and stabilization strategies of three stakeholders: the government, real estate developers, and homebuyers. The results of the study show that the government plays a dominant role at the initial stage; and as the assembled residential construction industry matures, government intervention in the assembled residential construction market gradually decreases and eventually withdraws from the market. Shen et al. [26] analyze the prefabricated housing subsidy mechanism through an evolutionary game model and simulation to theoretically determine the scope, amount, and end-time of the subsidy. The empirical analysis shows that the model can help the government formulate a reasonable and optimal subsidy policy within the budget to stimulate developers and consumers.

1.3. Research Problems and Main Contributions

The literature study reveals that although there are more studies on the carbon emissions of assembled structures, the majority of these studies concentrate on the calculation of these emissions and have the following issues: (1) the primary objective is the calculation of carbon emission statistics for the whole-life cycle of the building, and the associated methods for reducing carbon emissions are not suggested; and (2) the evolutionary game study of encouraging green building development from a macro viewpoint is the main focus of the literature on environmental governance and low-carbon behavior of the government and enterprises through evolutionary game theory, while research on the micro direction is lacking.
In order to address the aforementioned issues, we employ an evolutionary game model to examine the micro perspective of the game relationship between the government and businesses on carbon emission reduction, analyze the strategic decisions made by local governments and producers of prefabricated building components in a low-carbon environment, and determine the influencing factors of carbon emission reduction by businesses. Based on this analysis, we make recommendations for local governments.
The main contributions of this paper are as follows: (1) improving game theory research by broadening the research field to include the construction industry, which is closely related to carbon emissions and helps achieve the national target for reducing emissions, as well as providing theoretical underpinnings for the growth of low-carbon economies; (2) the game between manufacturers of prefabricated building components and the local governments is investigated using the game theory methodology, and a game model is established between the manufacturers of prefabricated building components and local governments that overcomes the limitations of the process mechanism previously disregarded.

2. Methodology

2.1. Model Assumptions and Construction

Evolutionary game theory assumes that under the assumption of limited rationality, the participants cannot reach the ideal state when making decisions and are influenced by multiple factors when making decision choices [27]. In the evolution of the optimal equilibrium point during the game process, the choice of strategies by the participating agents is often not optimal [28]. Therefore, during the evolutionary process, the participating subjects change their own state in order to choose the optimal strategy, learn continuously, and then choose the optimal strategy to keep the system in a stable state. It is solved by calculating the payoff functions of the game subjects to construct the replicated dynamic equations of multiple parties, and solving the optimal equilibrium points under different evolutionary paths via the Jacobi matrix [29].
In this study, we develop an evolutionary game model due to two factors: first, from the perspective of economic tools, developing an evolutionary game model is a natural and effective way to address the problem of subject behavior choice; and second, developing an evolutionary game model is a method that is simple to comprehend and apply. It is crucial to consider the influence of the government when deciding on the enterprise behavior because the cost and benefit of the enterprise are necessary for the benefit maximization principle, and the cost and benefit of the enterprise are significantly influenced by government behavior. This study uses the evolutionary game technique to look at how firms and the government make behavioral decisions based on the two aforementioned criteria.

2.1.1. Model Assumptions

In order to construct an evolutionary game model and analyze the strategies implemented by the game subjects, the stability of the equilibrium point, and the influence relationship between the elements [30], the following assumptions are made:
Assumption 1. 
The evolutionary game model includes two stakeholders: the government and the manufacturers of prefabricated building components. They have limited rationality, can make independent decisions, and aim to maximize their benefits. In addition, they can adjust their strategies according to the changes in external conditions.
Assumption 2. 
The government’s strategy space A = “regulation, no regulation”, “regulation” means that the government takes effective regulatory measures to promote the reduction in carbon emissions by component manufacturers; “no regulation” means that the government does not take active regulatory measures due to financial constraints and cost pressures. The government does not take active regulatory measures due to financial constraints and cost pressures. The strategy space for prefabricated building component manufacturers are low-carbon production methods and traditional production methods.
Assumption 3. 
The proportion of the government’s “regulatory” strategy is x (0 ≤ x ≤ 1), the proportion of those who choose the “non-regulatory” strategy is 1 − x; the proportion of manufacturers of prefabricated building components who choose the low-carbon production strategy is y (0 ≤ y ≤ 1). The proportion of those who choose the traditional production strategy is 1 − y.
Assumption 4. 
The cost of low-carbon production for prefabricated building component manufacturers is Cl, such as the use of advanced production technology, low-carbon research technology investment, low-carbon equipment introduction, etc. The cost of traditional production is Ct, because Cl requires more cost investment than Ct, so Cl > Ct. The prefabricated building component manufacturers can receive incentives and subsidies from the government when they adopt low-carbon production measures. This is denoted as Se.
Assumption 5. 
The benefits to be gained by prefabricated building component manufacturers when adopting a low-carbon production strategy is El, and the benefits to be gained by prefabricated building component manufacturers when adopting a traditional production strategy is Et.
Assumption 6. 
The cost of government supervision of prefabricated building component manufacturers is Cg, e.g., the cost of human and material resources for government departments; and the potential benefit to the government when prefabricated building component manufacturers adopt low-carbon production is Ep, e.g., the improvement of government image and the reduction of carbon reduction costs. Since the higher-level government will assess the performance of the local government in environmental management, the performance incentive that the government receives from the higher-level government is Sa, and the cost of the government’s measures to control environmental pollution when the prefabricated building component manufacturer adopts the traditional production strategy is Cp.
Assumption 7. 
When the manufacturer of prefabricated building components adopts a traditional production strategy, the government penalizes it as F1, and if the government chooses not to regulate whether the manufacturer adopts the low-carbon strategy, the probability of being found by the higher government department is β (0 ≤ β ≤ 1); at this time, the manufacturer of prefabricated building components is still penalized as F1, and the government is penalized by the higher government as F2, such as administrative accountability.

2.1.2. Model Construction

Based on the above assumptions, the benefit matrices of the four governments and the manufacturers of prefabricated building components when both parties choose different strategies can be obtained, as shown in Table 2.

2.2. Evolutionary Stability Analysis of Game Models

2.2.1. Dynamic Equation Analysis for the Replication of Government Regulatory Measures

The expected benefits of the government’s choice to regulate or not regulate, and the average expected benefits ( E 1 1 , E 1 2 , E 1 ¯ ) [31], respectively, are:
E 11 = y ( S a + E p C s ) + ( 1 y ) ( S a C p ) = S a + y E p y C s + ( y 1 ) C p
E 12 = y E p + ( 1 y ) ( C p β F 2 ) = y E P + ( y 1 ) C P + ( y 1 ) β F 2
E 1 ¯ = x E 11 + ( 1 x ) E 12
The replication dynamics equation for government strategy choice [32] is
F ( x ) = d x / d t = x ( E 11 E 1 ¯ ) = x   [ E 11 x E 11 + ( x 1 ) E 12 ] = x ( 1 x ) ( E 11 E 12 ) = x ( 1 x ) [ S a y C s + ( 1 y ) β F 2 ]

2.2.2. Analysis of Dynamic Equations for the Replication of Production Measures by Manufacturers of Prefabricated Building Components and Parts

The expected returns and average expected returns ( E 2 1 , E 2 2 , E 2 ¯ ) of the manufacturers of prefabricated building components choosing low-carbon or conventional production are as follows:
E 21 = x ( E l + S e C l ) + ( 1 x ) ( E l + S e C l ) = E l + S e C l
E 22 = x ( E t C t F l ) + ( 1 x ) ( E t C t β F l ) = E t C t x F 1 ( 1 x ) β F 1
E 2 ¯ = y E 21 + ( 1 y ) E 22
F ( y ) = d y / d t = y ( E 21 E 2 ¯ ) = y [ E 21 y E 21 + ( y 1 ) E 22 ] = y ( 1 y ) ( E 21 E 22 ) = y ( 1 y ) [ E l + S e C l E t + C t + x F 1 + ( 1 x ) β F 1 ]

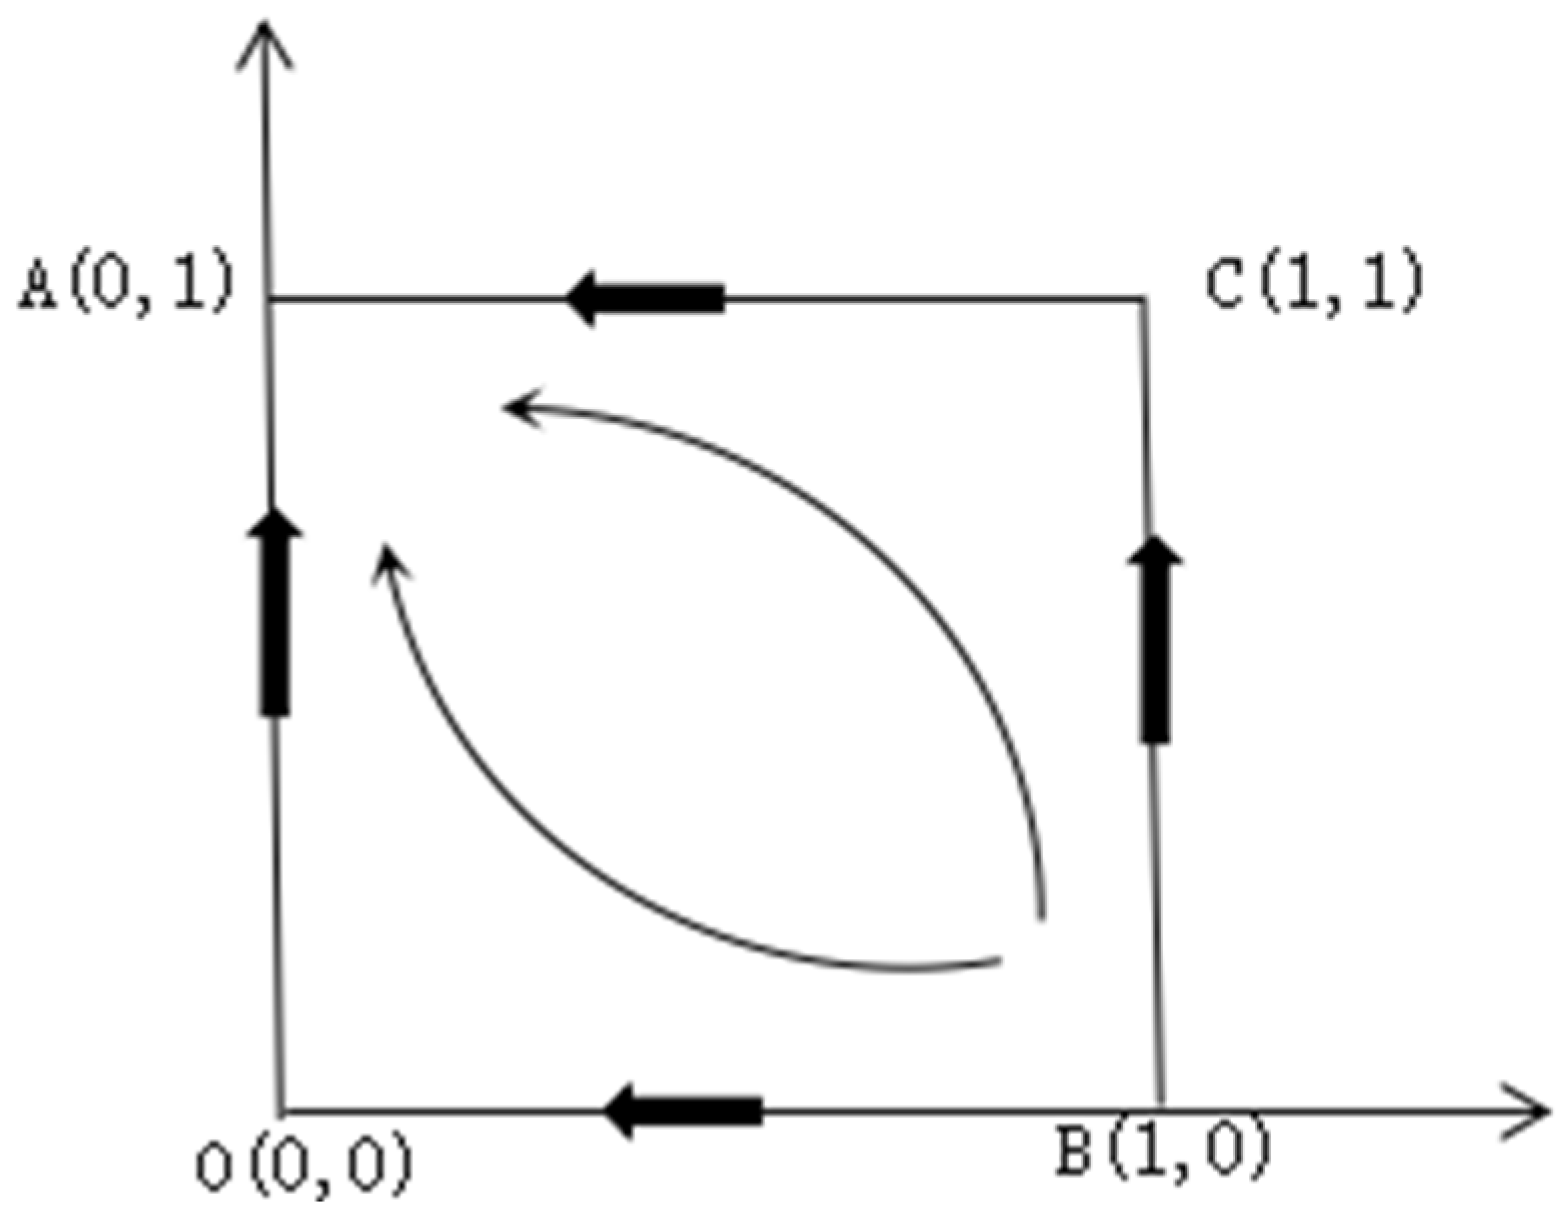
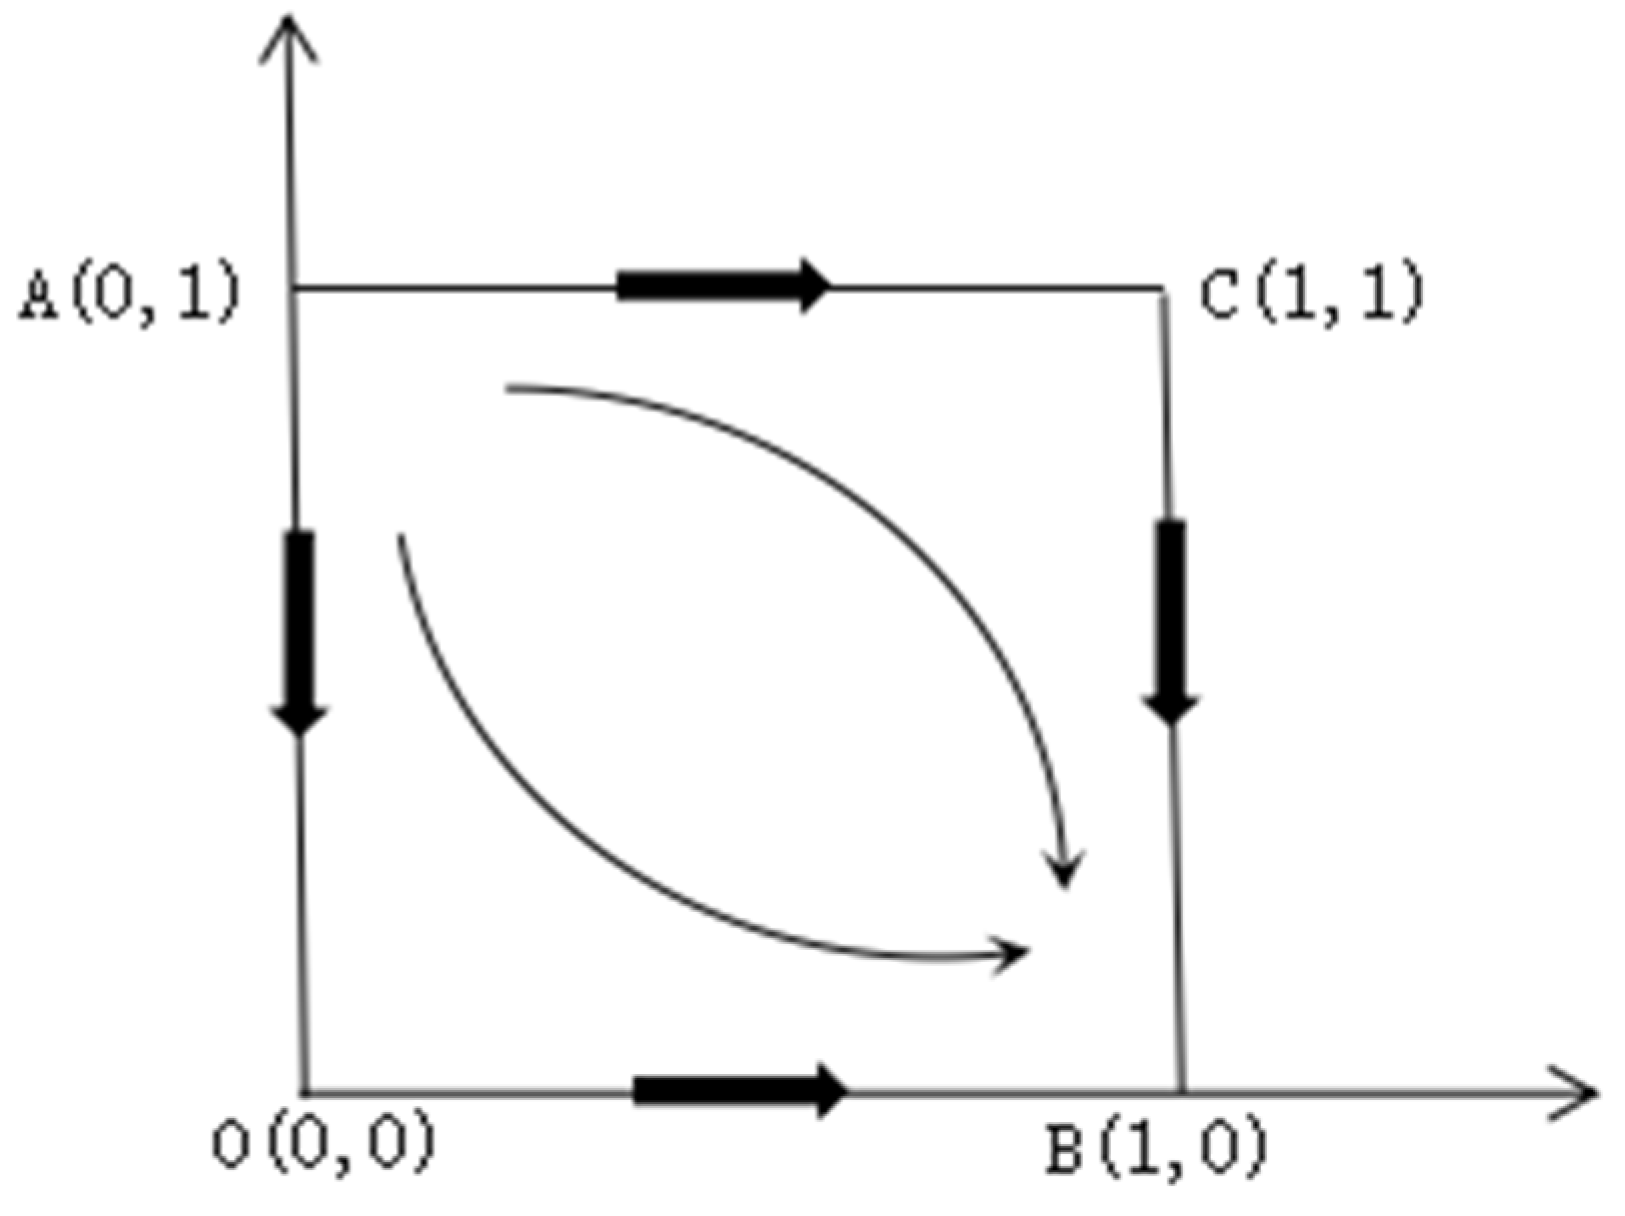
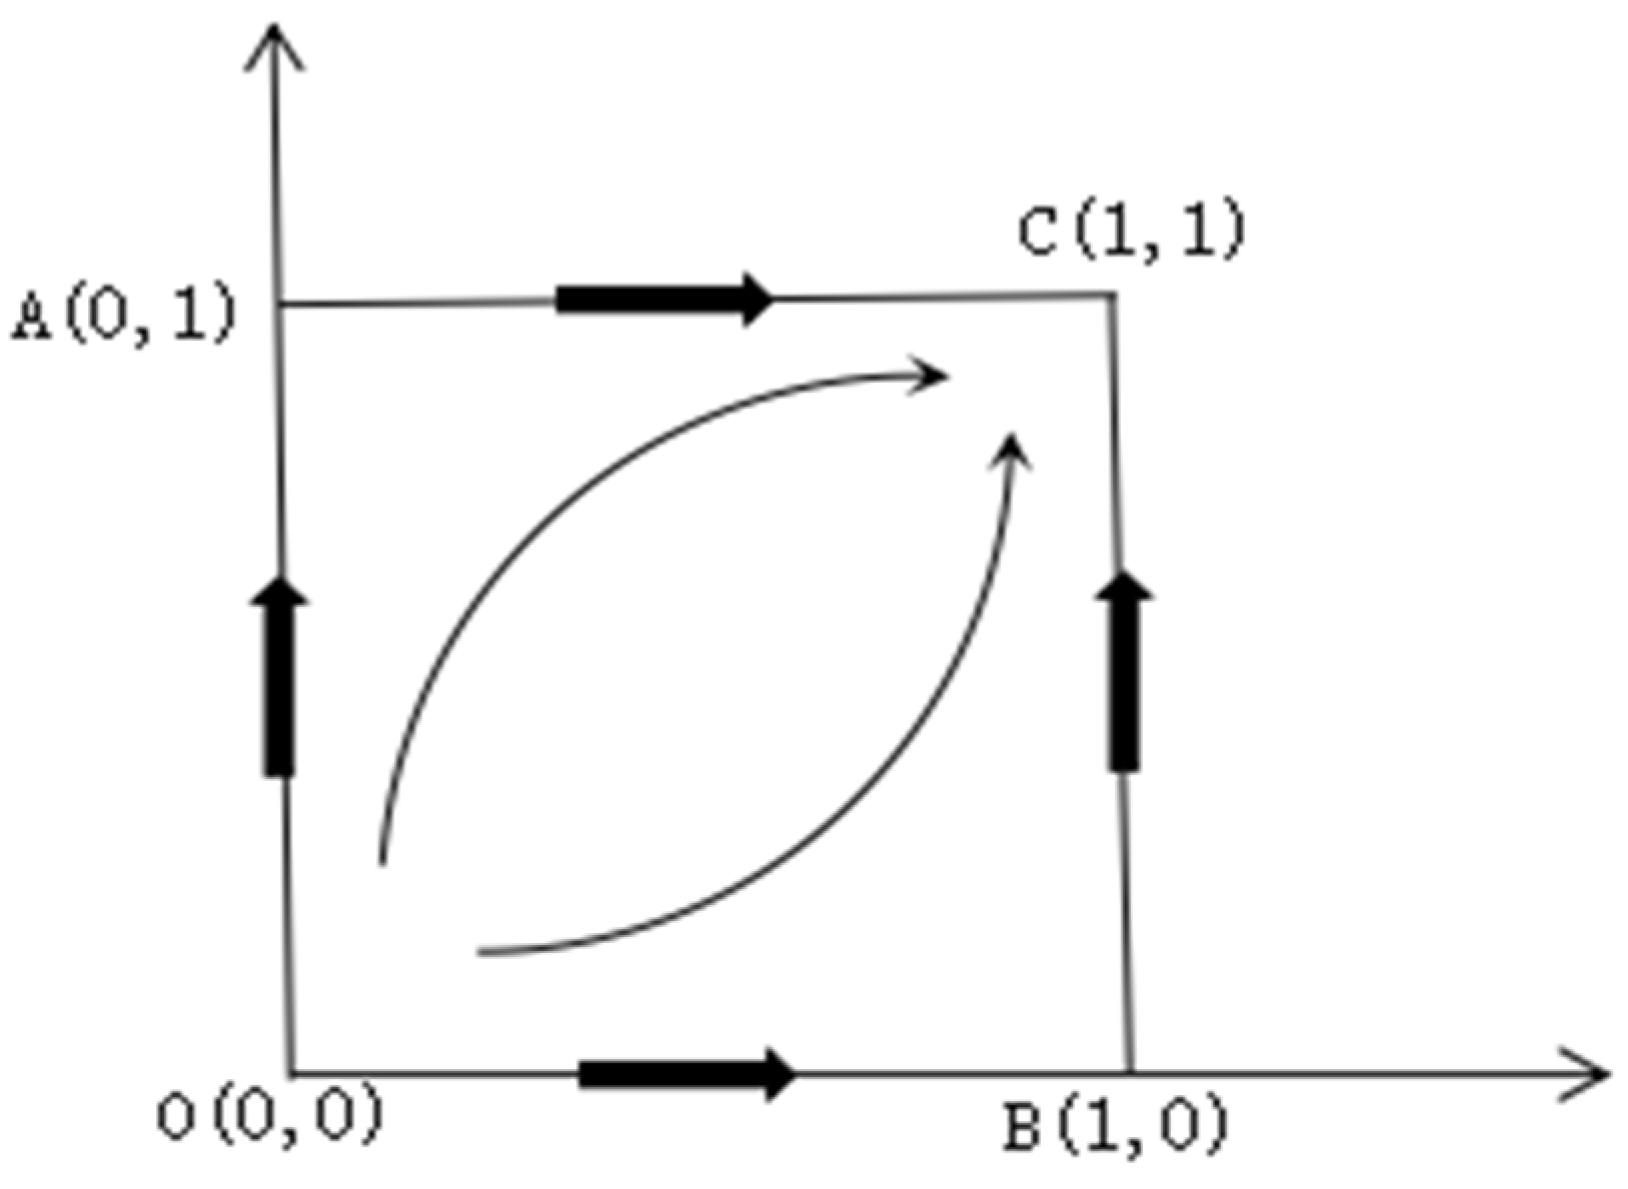
2.2.3. Stability Analysis of the Evolutionary Strategy of Both Game Subjects

Evolutionary stable strategy (ESS) [33] means that each game player continuously learns and adjusts their strategy to maximize their own interests, and finally achieves the evolutionary stable state of the system. The system will evolve and stabilize. The replication dynamics equation between the government and the manufacturers of prefabricated building components can be obtained as follows:
{ F ( x ) = d x / d t = x ( 1 x ) [ S a y C s + ( 1 y ) β F 2 ] F ( y ) = d y / d t = y ( 1 y ) [ E l + S e C l E t + C t + x F 1 + ( 1 x ) β F 1 ]
From the above two replication dynamics equations of F(x) and F(y), the replication dynamics system [34] of the game between both the government and the manufacturers of prefabricated building components can be obtained. Let F(x) = 0 and F(y) = 0, five local equilibrium points can be obtained as A1 (0, 0), A2 (0, 1), A3 (1, 0), A4 (1, 1), and A5 (x1, y1).
Where: x 1 = ( β F 1 + E t + C l E l S e C t ) / [ ( 1 β ) F 1 ]
y 1 = ( S a + β F 2 ) / ( C s + β F 2 )
The Jacobi matrix [35] of the two-sided evolutionary game system is:
J = ( J 1 J 2 J 3 J 4 ) = ( F ( x ) x F ( x ) y F ( y ) x F ( y ) y ) = ( ( 1 2 x ) [ S a y C s + ( 1 y ) β F 2 ] x ( x 1 ) ( C s + β F 2 ) y ( 1 y ) F 1 ( 1 β ) ( 1 2 y ) [ E l + S e C l E t + C t + x F 1 + ( 1 x ) β F 1 ] )
According to the method proposed by Friedman, the stability of the evolutionary equilibrium point can be derived from the local stability analysis of the Jacobi matrix of the system [36]. The equilibrium point is the evolutionary stability strategy (ESS) if the two conditions of (1) the trace of the Jacobi matrix is less than zero, i.e., J1 + J4 < 0, and (2) the determinant of the Jacobi matrix is greater than zero, i.e., the determinant of J = J1 J4 − J2 J3 > 0 are satisfied. Bringing A5 (x1, y1) into the Jacobi matrix, we can see that J1 = 0 and J4 = 0, i.e., J1 + J4 = 0, which does not satisfy the condition of evolutionary stability strategy, so it is only necessary to discuss the stability of A1 (0, 0), A2 (0, 1), A3 (1, 0), and A4 (1, 1).
Using Lyapunov to judge the stability of the first method, for all Jacobi matrix eigenvalues have a real part, the equilibrium point is asymptotically stable, otherwise, it is unstable or uncertainty point [37]. The stability of the equilibrium point is analyzed, as shown in Table 3.
Corollary 1: When Sa < Cs and El + Se − Cl > Et − Ct − βF1, A2 (0, 1) can satisfy the condition of evolutionary stability strategy. At this point, Sa + Ep − Cs < Ep can be obtained from Sa < Cs, and the benefits of active government regulation are smaller than the costs when the manufacturers of prefabricated building components choose a low-carbon production strategy, and the optimal strategy chosen by the government is no regulation. From El + Se − Cl > Et − Ct − βF1, it is clear that the benefits of low-carbon production are higher than the benefits of conventional production under the government’s non-regulatory measures, and the optimal strategy for assembly component manufacturers is low-carbon production. The phase diagram of the evolution of the government and the prefabricated building component manufacturers is shown in Figure 1.
Corollary 2: When Sa > −βF2 and El + Se − Cl < Et − Ct − F1, A3 (1, 0) can satisfy the condition of evolutionary stabilization strategy. From Sa > −βF2, we can get Sa − Cp > −βF2 − Cp, and we know that when the manufacturers of prefabricated building components choose the traditional production method, the benefits of government regulation are higher than the benefits when there is no regulation, and the optimal strategy of the government is regulation. From El + Se − Cl < Et − Ct − F1, it is clear that the benefits of low-carbon production are lower than the benefits of traditional production when the government regulates the prefabricated building component manufacturers. The phase diagram of the evolution of the government and the prefabricated building component manufacturers is shown in Figure 2.
Corollary 3: A4 (1, 1) can satisfy the condition of evolutionary stabilization strategy when Sa > Cs and El + Se − Cl > Et − Ct − F1. From Sa > Cs we can get Sa + Ep − Cs > Ep, we know that the benefit of government regulation is greater than the cost of government supervision, and the optimal strategy chosen by the government is regulation at this time. From El + Se − Cl > Et − Ct − F1, it can be seen that the benefits of low-carbon production for prefabricated building component manufacturers are higher than the benefits of traditional production methods when the government adopts regulatory measures, so the optimal strategy for prefabricated building component manufacturers is to adopt low-carbon production methods. The evolutionary phase diagram between the government and the prefabricated building component manufacturers is shown in Figure 3.
The values of the determinant and trace corresponding to the Jacobi matrix J for Corollaries 1, 2, and 3, respectively, are found, and the stability of their evolution is shown in Table 4 below Where “+” means the eigenvalue is positive number, “−” means the eigenvalue is negative number, and “±” means the eigenvalue cannot be determined as positive or negative.

3. Results and Discussion

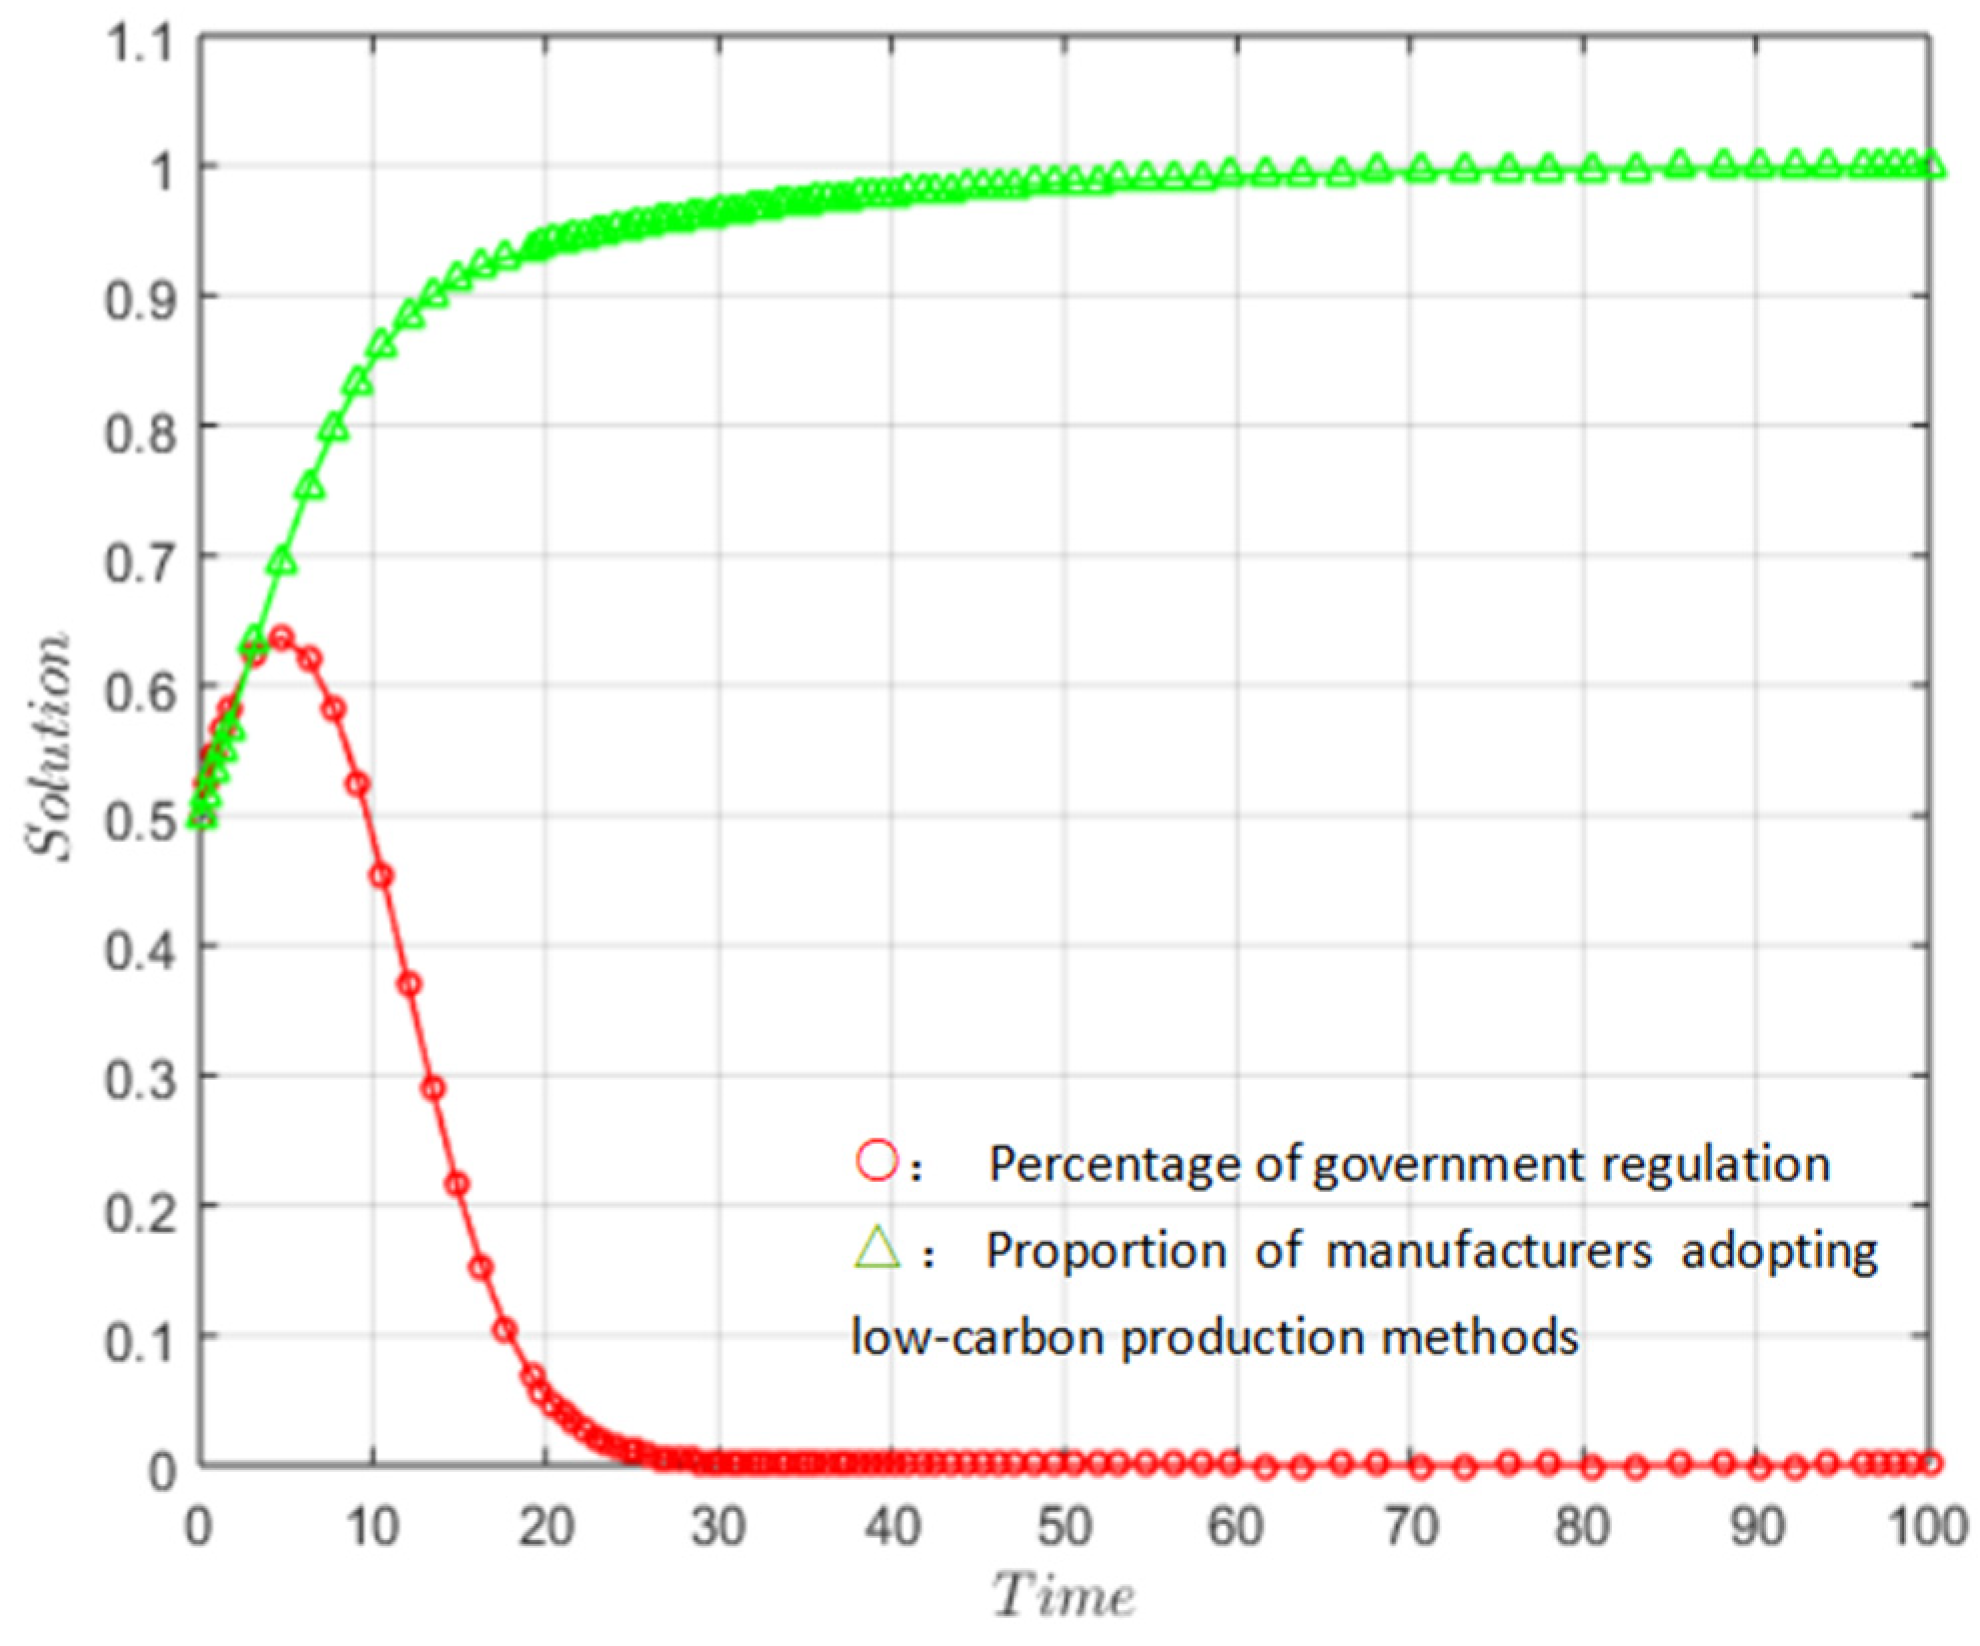
3.1. Simulation Analysis and Results

To verify the validity of the above evolutionary stability analysis, the evolutionary process of the behavior of government, prefabricated building component manufacturers is numerically simulated using Matlab2016b by assigning corresponding values to the model according to the constraints. The simulation analysis code is in the Appendix A.
Corollary 1 A2 (0, 1) can satisfy the condition of evolutionary stabilization strategy (ESS) when Sa < Cs and El + Se − Cl > Et − Ct − βF1. Let the initial ratio of the government adopting the regulatory strategy and the prefabricated building component manufacturers adopting the low-carbon production strategy be (0.5, 0.5), the initial time is 0, and the specific values of the parameters are El = 0.3, Et = 0.4, Ep = 0.8, Cl = 0.6, Ct = 0.2, Cs = 0.8, Cp = 0.3, F1 = 0.7, F2 = 0.7, β = 0.7, Sa = 0.4, and Se = 0.06. The simulation results for replicating the system of dynamics equations evolving 100 times against time are shown in Figure 4.
As shown in Figure 4, with the increase in the number of simulations, the proportion of government regulation evolves from 0.5 to 0, while the proportion of prefabricated building component manufacturers adopting low-carbon production evolves from 0.5 to 1, and finally reaches a stable state, and the simulation results verify that Corollary 1 is upheld; that is, the government finally chooses the “no regulation” strategy and manufacturers. The simulation results verify the validity of Corollary 1; that is, the government finally chooses the “no regulation” strategy and the manufacturers choose the “low-carbon production” strategy. From the simulation results of Corollary 1, it can be seen that when the local government’s performance incentive is less than the cost of regulating manufacturers, the government eventually tends to choose not to regulate; when the benefits of low-carbon production are greater than the benefits of traditional production, manufacturers will tend to adopt low-carbon production even if the local government does not regulate.
According to Corollary 2, when Sa > −βF2 and El + Se − Cl < Et − Ct − F1, A3 (1, 0) can satisfy the condition of evolutionary stabilization strategy. Let the initial proportions of the government adopting the regulatory strategy and the prefabricated building component manufacturers adopting the low-carbon production strategy be (0.5, 0.5), and the parameters are taken as El = 0.3, Et = 0.4, Ep = 0.6, Cl = 0.8, Ct = 0.2, Cs = 0.8, Cp = 0.3, F1 = 0.5, F2 = 0.7, β = 0.7, Sa =0.4, and Se = 0.06, respectively. The simulation results of the system of dynamics equations evolving 100 times against time are shown in Figure 5.
As shown in Figure 5, with the increase in the number of simulations, the proportion of government regulation evolves from 0.5 to 1, while the proportion of prefabricated building component manufacturers adopting low-carbon production evolves from 0.5 to 0, and finally reaches a stable state, which verifies that Corollary 1 is upheld, i.e., the government finally chooses the “regulation” strategy, and manufacturers choose the simulation results verify the validity of Corollary 1; that is, the government finally chooses the “regulation” strategy and the manufacturers choose the “traditional production” strategy. From the simulation results of Corollary 1, it is clear that when the benefits of low-carbon production are smaller than those of traditional production, the optimal strategy of manufacturers is to maintain the traditional production mode, even if the local government strengthens its regulatory intensity, and manufacturers will ignore the government regulation for their own benefit and still adopt the traditional production mode.
According to Corollary 3, when Sa > Cs and El + Se − Cl > Et − Ct − F1, A4 (1, 1) can satisfy the condition of evolutionary stabilization strategy. Let the initial ratio of the government’s regulatory strategy and the low-carbon production strategy adopted by the manufacturers of prefabricated building components be (0.5, 0.5), and the parameter values are El = 0.4, Et = 0.5, Ep = 0.7, Cl = 0.9, Ct = 0.3, Cs = 0.5, Cp = 0.4, F1 = 0.8, F2 = 0.8, β = 0.8, Sa = 0.9, and Se = 0.05 to satisfy the above conditions of the evolutionary stabilization strategy. The simulation results of replicating the system of dynamics equations evolving 100 times against time are shown in Figure 6.
As shown in Figure 6, with the increase in the number of simulations, the proportion of government regulation evolves from 0.5 to 1, while the proportion of prefabricated building component manufacturers adopting low-carbon production evolves from 0.5 to 1, and finally reaches a stable state, which verifies that Corollary 3 is upheld; that is, the government finally chooses the “regulation” strategy and manufacturers choose the “low-carbon production” strategy. The simulation results verify the validity of Corollary 3; that is, the government finally chooses the “regulation” strategy and the manufacturers choose the “low-carbon production” strategy. The simulation results from Corollary 3 show that when the local government obtains higher government performance rewards than the cost of regulating manufacturers, the government will tend to choose the regulatory strategy; when the benefits of low-carbon production are greater than those of traditional production, manufacturers of prefabricated building components will choose low-carbon production under the government’s active regulatory strategy, and this evolutionary stable strategy is the ideal state.
As can be seen from the discussion above, the simulation analysis is valid and consistent with the results of each party’s stability analysis, offering helpful practical aid for the exploration of carbon reduction paths in the production of integrated building components.

3.2. Discussion

Previous studies on environmental governance and low-carbon behavior of the government and manufacturers through evolutionary game theory primarily encourage the development of green buildings from a macroscopic perspective, and the current research on carbon emission of prefabricated buildings primarily takes the calculation of carbon emission data of the whole-life cycle of prefabricated buildings as the main goal, without proposing any corresponding carbon emission reduction pathways.
Based on prior research, this paper examines the interplay between local governments and businesses in reducing carbon emissions, examines the manufacturers of prefabricated building components’ strategic decisions in a low-carbon environment and the influencing factors of businesses in reducing carbon emissions, and makes recommendations for local governments to encourage low-carbon production in businesses to provide a theoretical foundation for low-carbon economies.
On the basis of the discussion above, the following suggestions are made:
  • To lower the cost of low-carbon production, manufacturers must research new low-carbon technology through scientific and technological innovation. The most important factor is technical expertise. To lower the cost of low-carbon production, firms should collaborate with universities or scientific research organizations and set up low-carbon research and development centers. In order to minimize the cost of low-carbon research and development, manufacturers can collaborate with universities or research institutes to create university–enterprise and university–research partnerships. Low-carbon research and development centers can also be located at universities or other academic institutions. New tools and inventive abilities can be used to implement low-carbon technological transformation for the high-carbon emissions of building material production.
  • The government can establish regionally suitable methods and standards for carbon emission accounting, make precise subsidies using a carbon emission assessment mechanism, and provide tax and financial benefits to the low-carbon construction industry to create an incentive system. On the premise of directing the construction industry to reduce carbon emissions, the government offers a predetermined amount of subsidies and assistance for low-carbon technology and equipment with discernible outcomes, in order to further encourage a better and faster development of the national economy.
  • Government regulation is the primary element determining whether manufacturers of prefabricated building components move to low-carbon production. It is vital to develop the related low-carbon supervision regulations in line with the principle of administration according to law so that the government’s oversight authority can be clearly regulated, and the legitimate rights and interests of relevant firms can be guaranteed. The government can also reduce the cost of regulation by creating a public reporting system, hiring an independent monitoring organization, creating a committee to control carbon emissions, etc. The higher-level government should also set up a related performance assessment procedure in order to improve local governments’ zeal for regulation.
We only take into account the game relationship between the government and manufacturers in this paper, but in reality, the issue of reducing carbon emissions from the production of assembled parts is not just a problem for the government and manufacturers, and we do not take into account the effects of changes in various significant parameters on the evolutionary path. We therefore plan to conduct a tripartite or quadratic evolutionary game analysis for the reduction in carbon emissions from the manufacture of assembled parts, as well as a sensitivity analysis to determine the effects of changes in the key parameters on the evolutionary route.

4. Conclusions

The goal of this study is to examine the different scenario effects on the evolutionary pathways adopted by the government and prefabricated building component producers. Through simulation analysis using MATLAB2016b, the correctness of the conclusions is verified. The study reveals that:
  • Manufacturers often embrace low-carbon production even in the absence of local government regulation when the benefits outweigh the benefits of conventional production. The local government finally has a tendency to decide not to regulate when its performance incentives are lower than the expense of doing so.
  • When the benefits of low-carbon production are less attractive than those of traditional production, manufacturers should continue using that mode of production. Manufacturers will continue to operate in this way for their own gain, even if the local government tightens its regulations.
  • Under the government’s active regulatory strategy, producers of prefabricated building components will select the low-carbon production mode when the advantages of low-carbon production outweigh those of traditional production, and when the local government’s performance incentives outweigh the cost of regulating producers.

Author Contributions

Investigation, Methodology, Project administration, Funding acquisition, T.C. and Q.W.; Writing—original draft, Validation, Visualization, W.G. and X.X.; Resources, Software, Supervision, R.D. and X.D. All authors have read and agreed to the published version of the manuscript.

Funding

The National Natural Science Foundation of China (NSFC), “Research on the principle and method of collaborative optimization of prefabricated building components based on multi-intelligent body path planning” (Project No. 52078305).

Data Availability Statement

The data underlying the results presented in the study are available within the manuscript.

Conflicts of Interest

The authors declare no conflict of interest.

Appendix A. Simulation Analysis Code

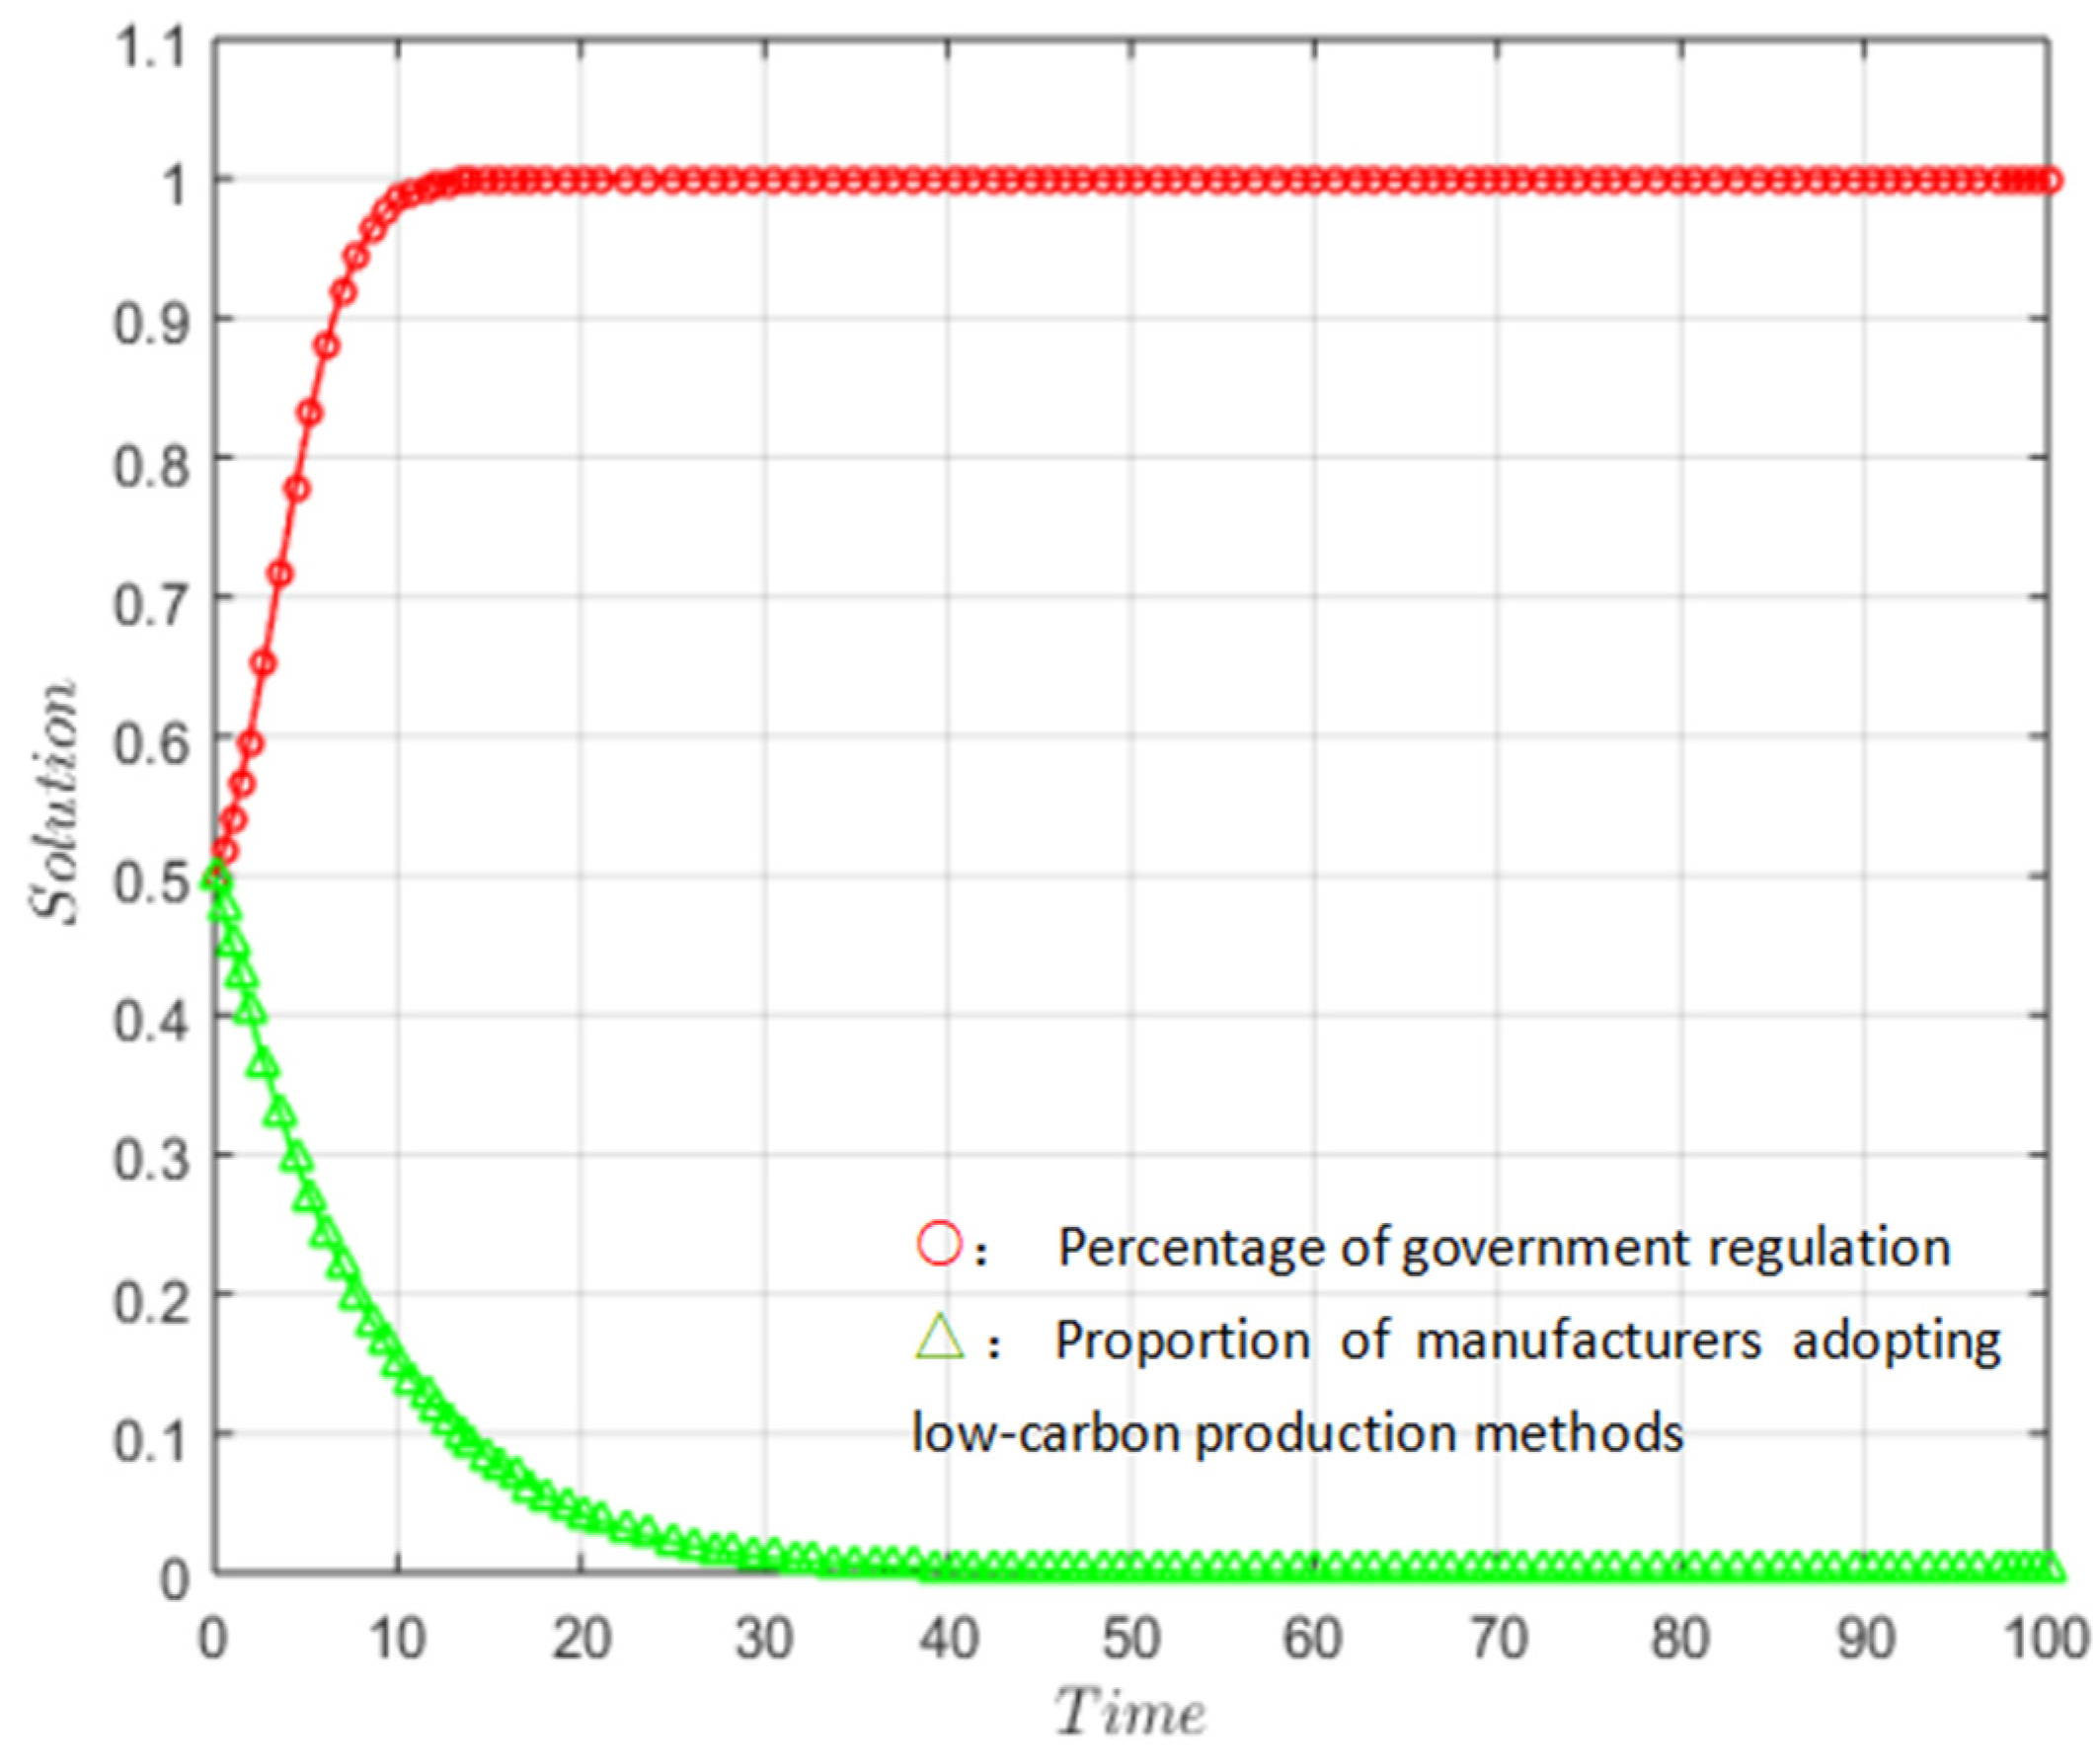
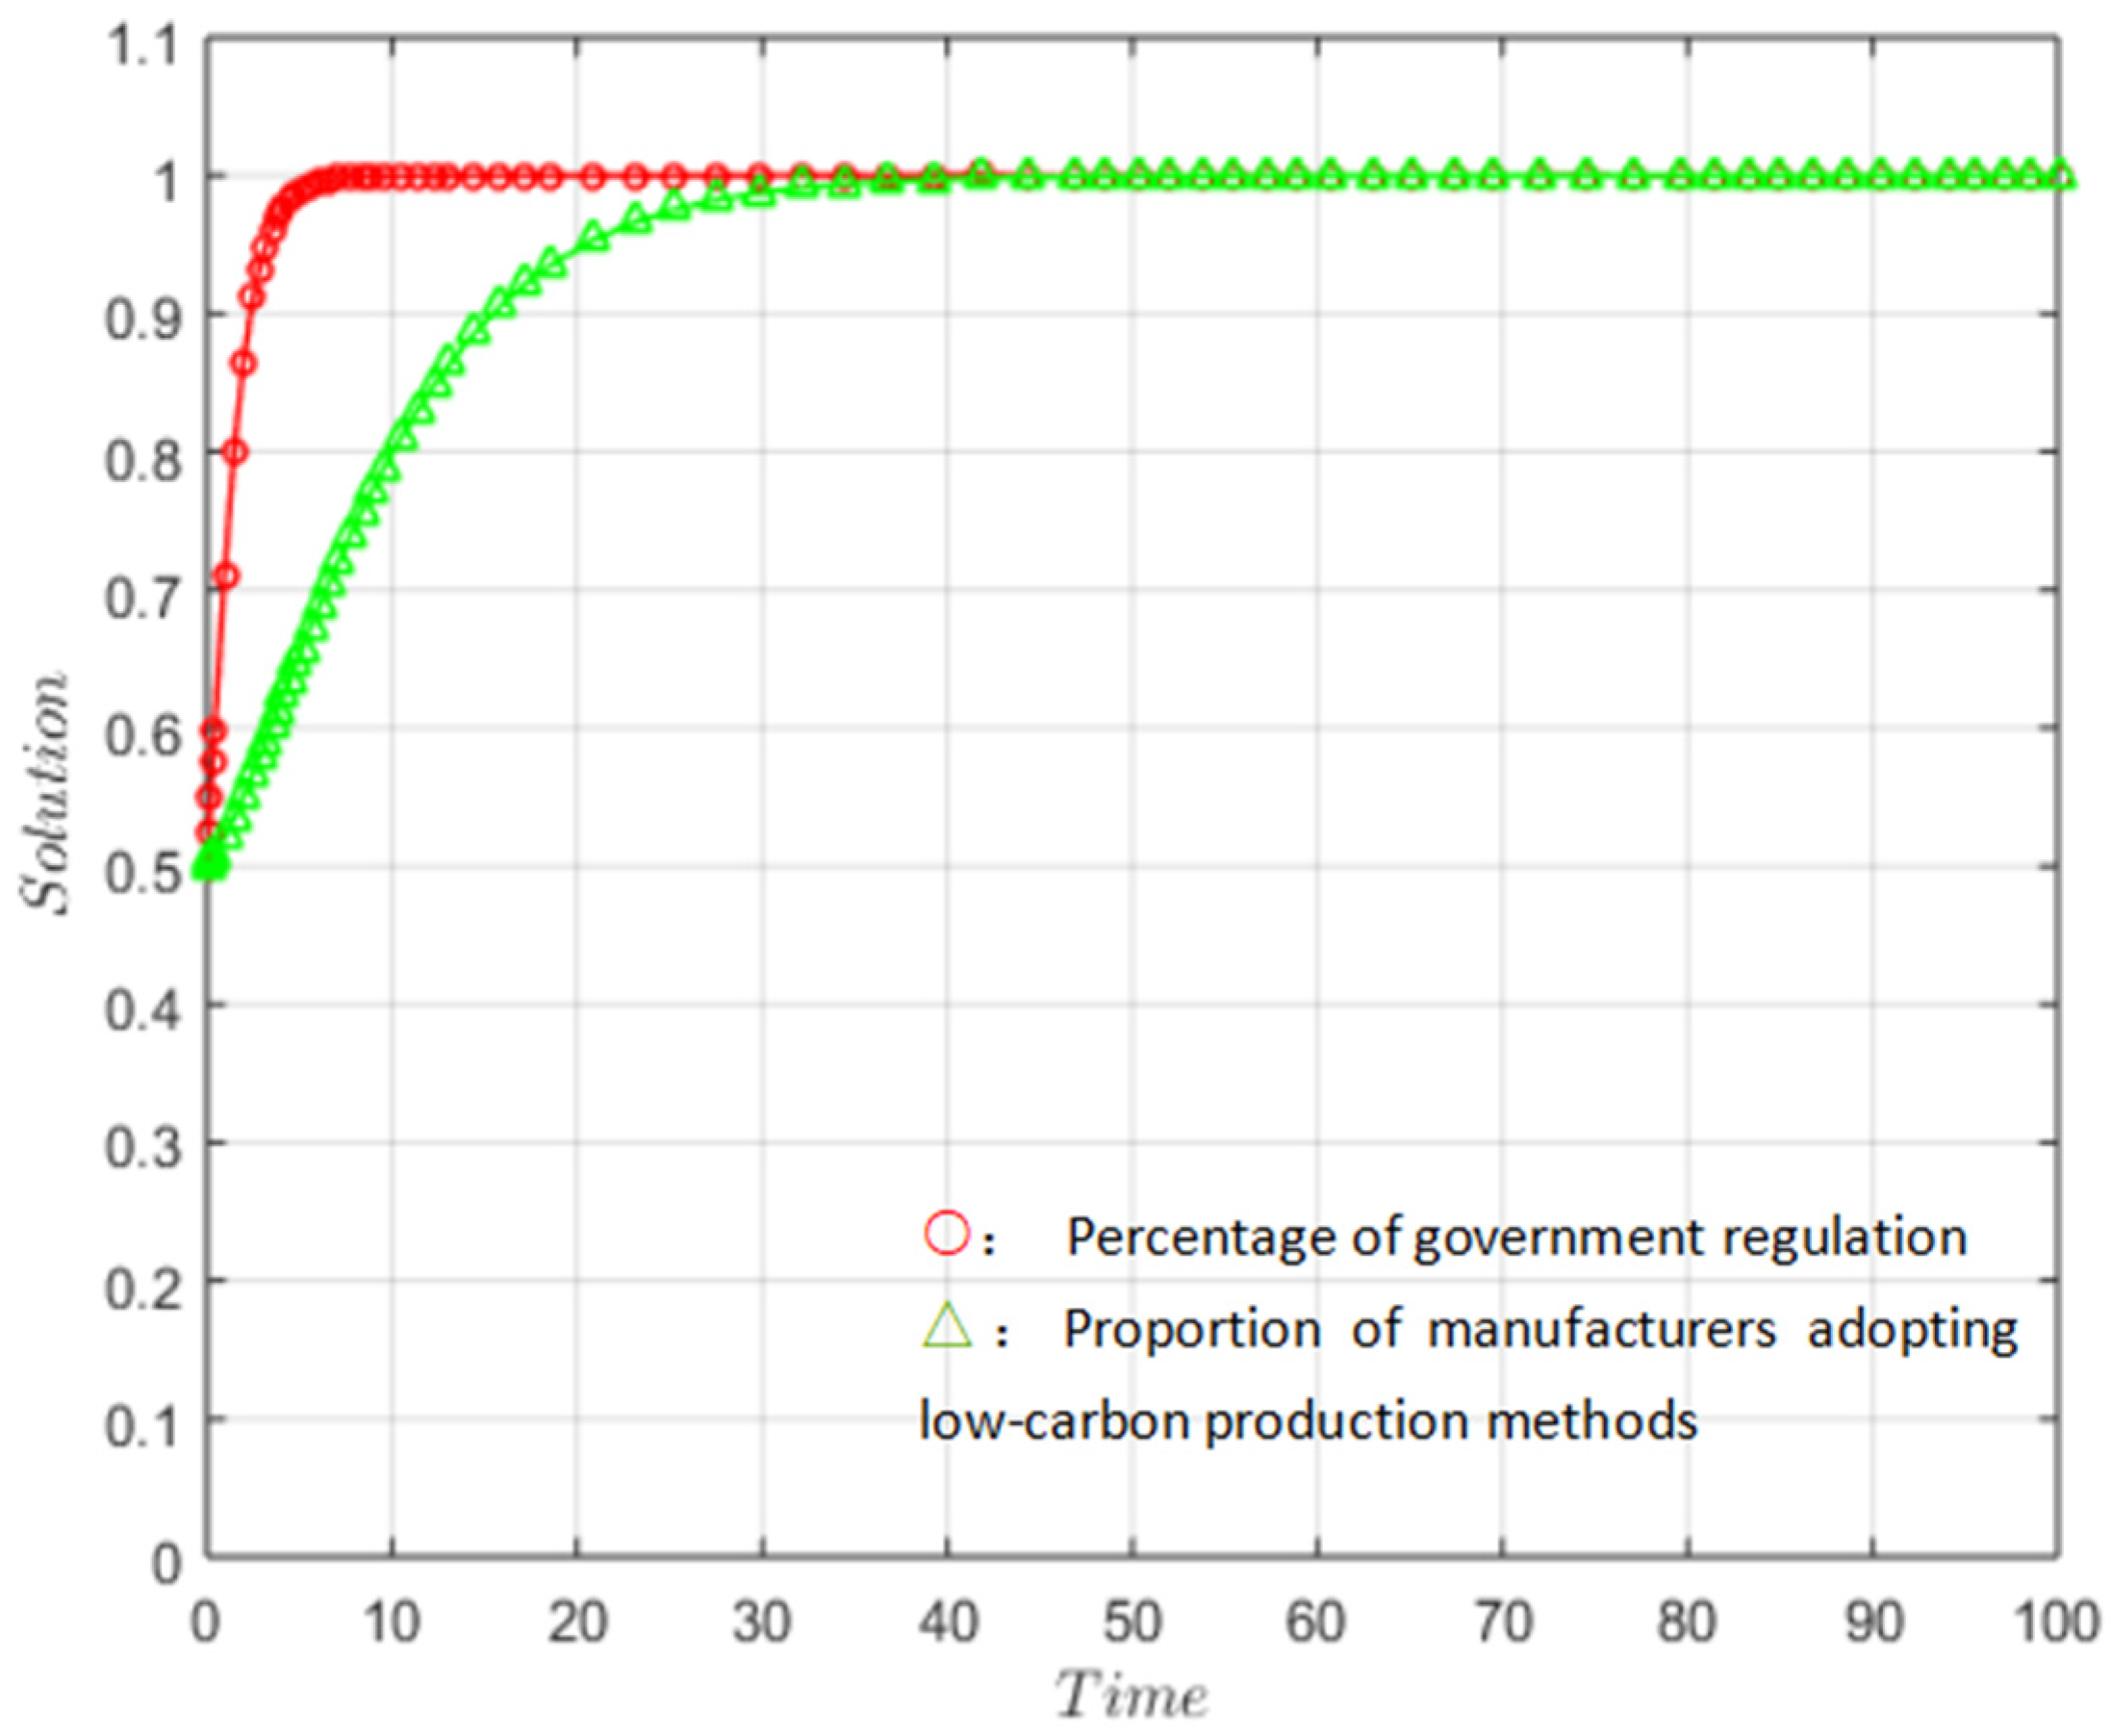
% xiangxian.m
function dydt=xiangxian(t,y,cl,ct,se,el,et,ep,cs,cp,sa,f1,f2,bt)
dydt=zeros(2,1);
dydt(1)=y(1)*(1-y(1))*(sa-y(2)*cs+(1-y(2))*bt*f2);
dydt(2)=y(2)*(1-y(2))*(el+se-cl-et+ct+y(1)*f1+(1-y(1))*bt*f1);
end

Simulation of Figure 4 code:
% xiangxian1.m
%%%%%%%%%%%%%%%%%%%%%%%%%%%%%%%%%%%%%%%%%%%%%%%%the 1rd image
clc;
clear;
cl=0.6,ct=0.2,se=0.06,el=0.3,et=0.4,ep=0.8,cs=0.8,cp=0.3,sa=0.4,f1=0.7,f2=0.7,bt=0.7;
set(0,‘defaultfigurecolor’,‘w’)
% the 1st X,Y
[t,y]=ode45(@(t,y) xiangxian(t,y,cl,ct,se,el,et,ep,cs,cp,sa,f1,f2,bt),[0 100],[0.5 0.5]);
points=1:1:length(t);
figure(1)
plot(t,y(:,1),‘ro-’,‘linewidth’,1,‘markersize’,4,‘markerindices’,points);
hold on
plot(t,y(:,2),‘g^-’,‘linewidth’,1,‘markersize’,5,‘markerindices’,points);
grid on
hold on
set(gca,‘XTick’,[0:10:100],‘YTick’,[0:0.1:1.1])
axis([0 100 0 1.1])
xlabel(‘$Time$’,‘interpreter’,‘latex’,‘Rotation’,0);
ylabel(‘$Solution$’,‘interpreter’,‘latex’);

Simulation of Figure 5 code:
% xiangxian2.m
%%%%%%%%%%%%%%%%%%%%%%%%%%%%%%%%%%%%%%%%%%%%%%%%the 1rd image
clc;
clear;
cl=0.8,ct=0.2,se=0.06,el=0.3,et=0.4,ep=0.6,cs=0.8,cp=0.3,sa=0.4,f1=0.5,f2=0.7,bt=0.7;
set(0,‘defaultfigurecolor’,‘w’)
% the 1st X,Y
[t,y]=ode45(@(t,y) xiangxian(t,y,cl,ct,se,el,et,ep,cs,cp,sa,f1,f2,bt),[0 100],[0.5 0.5]);
points=1:1:length(t);
figure(1)
plot(t,y(:,1),‘ro-’,‘linewidth’,1,‘markersize’,4,‘markerindices’,points);
hold on
plot(t,y(:,2),‘g^-’,‘linewidth’,1,‘markersize’,5,‘markerindices’,points);
grid on
hold on
set(gca,‘XTick’,[0:10:100],‘YTick’,[0:0.1:1.1])
axis([0 100 0 1.1])
xlabel(‘$Time$’,‘interpreter’,‘latex’,‘Rotation’,0);
ylabel(‘$Solution$’,‘interpreter’,‘latex’);

Simulation of Figure 6 code:
%%%%%%%%%%%%%%%%%%%%%%%%%%%%%%%%%%%%%%%%%%%%%%%%the 1rd image
clc;
clear;
cl=0.9,ct=0.3,se=0.05,el=0.4,et=0.5,ep=0.7,cs=0.5,cp=0.4,sa=0.9,f1=0.8,f2=0.8,bt=0.8;
set(0,‘defaultfigurecolor’,‘w’)
% the 1st X,Y
[t,y]=ode45(@(t,y) xiangxian(t,y,cl,ct,se,el,et,ep,cs,cp,sa,f1,f2,bt),[0 100],[0.5 0.5]);
points=1:1:length(t);
figure(1)
plot(t,y(:,1),‘ro-’,‘linewidth’,1,‘markersize’,4,‘markerindices’,points);
hold on
plot(t,y(:,2),‘g^-’,‘linewidth’,1,‘markersize’,5,‘markerindices’,points);
grid on
hold on
set(gca,‘XTick’,[0:10:100],‘YTick’,[0:0.1:1.1])
axis([0 100 0 1.1])
xlabel(‘$Time$’,‘interpreter’,‘latex’,‘Rotation’,0);
ylabel(‘$Solution$’,‘interpreter’,‘latex’);

References

  1. Lu, Y.C.; Dai, J.Q.; Wang, L.N.; Liu, Y.; Wu, C.F. The impact of the energy transition on China’s economy under the carbon peaking and carbon neutrality goals. Therm. Sci. 2022, 26, 4043–4056. [Google Scholar] [CrossRef]
  2. Liu, G.W.; Yang, H.; Fu, Y.; Mao, C.; Xu, P.P.; Hong, J.K.; Li, R.Y. Cyber-physical system-based real-time monitoring and visualization of greenhouse gas emissions of prefabricated construction. J. Clean. Prod. 2020, 246, 119059. [Google Scholar] [CrossRef]
  3. Li, J.J.; Lu, S.; Wang, W.L.; Huang, J.; Chen, X.X.; Wang, J.Y. Design and Climate-Responsiveness Performance Evaluation of an Integrated Envelope for Modular Prefabricated Buildings. Adv. Mater. Sci. Eng. 2018, 2018, 2565320. [Google Scholar] [CrossRef] [Green Version]
  4. Dou, Y.D.; Sun, X.L.; Ji, A.K.; Wang, Y.N.; Xue, X.L. Development strategy for prefabricated construction projects: A tripartite evolutionary game based on prospect theory. Eng. Constr. Archit. Manag. 2023, 30, 105–124. [Google Scholar] [CrossRef]
  5. Mao, C.; Shen, Q.P.; Shen, L.Y.; Tang, L.Y.N. Comparative study of greenhouse gas emissions between off-site prefabrication and conventional construction methods: Two case studies of residential projects. Energy Build. 2013, 66, 165–176. [Google Scholar] [CrossRef] [Green Version]
  6. Zhou, F.; Ning, Y.B.; Guo, X.R.; Guo, S.D. Analyze Differences in Carbon Emissions from Traditional and Prefabricated Buildings Combining the Life Cycle. Buildings 2023, 13, 874. [Google Scholar] [CrossRef]
  7. Yang, X.Y.; Zhang, S.C.; Wang, K. Quantitative study of life cycle carbon emissions from 7 timber buildings in China. Int. J. Life Cycle Assess. 2021, 26, 1721–1734. [Google Scholar] [CrossRef]
  8. Lai, J.; Lu, M.X. Analysis and benchmarking of carbon emissions of commercial buildings. Energy Build. 2019, 199, 445–454. [Google Scholar] [CrossRef]
  9. Zhang, S.X.; Li, Z.F.; Ning, X.; Li, L. Gauging the impacts of urbanization on CO2 emissions from the construction industry: Evidence from China. J. Environ. Manag. 2021, 288, 112440. [Google Scholar] [CrossRef]
  10. Yu, S.W.; Zhang, Q.; Li Hao, J.; Ma, W.T.; Sun, Y.; Wang, X.C.; Song, Y. Development of an extended STIRPAT model to assess the driving factors of household carbon dioxide emissions in China. J. Environ. Manag. 2023, 325, 116502. [Google Scholar] [CrossRef] [PubMed]
  11. You, K.R.; Ren, H.; Cai, W.G.; Huang, R.P.; Li, Y.L. Modeling carbon emission trend in China’s building sector to year 2060. Resour. Conserv. Recycl. 2023, 188, 106679. [Google Scholar] [CrossRef]
  12. Guo, F.; Zhang, Y.Z.; Chang, C.G.; Yu, Y. Carbon Emissions of Assembly Buildings Constrained by Flexible Resource: A Study on Cost Optimization. Buildings 2023, 13, 90. [Google Scholar] [CrossRef]
  13. Wang, H.N.; Zhang, H.; Hou, K.M.; Yao, G. Carbon emissions factor evaluation for assembled building during prefabricated component transportation phase. Energy Explor. Exploit. 2021, 39, 385–408. [Google Scholar] [CrossRef]
  14. Li, X.J.; Xie, W.J.; Xu, L.; Li, L.L.; Jim, C.Y.; Wei, T.B. Holistic life-cycle accounting of carbon emissions of prefabricated buildings using LCA and BIM. Energy Build. 2022, 266, 112136. [Google Scholar] [CrossRef]
  15. Kontogiannis, S.; Spirakis, P. Counting stable strategies in random evolutionary games. In Algorithms and Computation; Deng, X., Du, D., Eds.; Springer: Berlin/Heidelberg, Germany, 2005; Volume 3827, pp. 839–848. [Google Scholar]
  16. Tian, Y.H.; Govindan, K.; Zhu, Q.H. A system dynamics model based on evolutionary game theory for green supply chain management diffusion among Chinese manufacturers. J. Clean. Prod. 2014, 80, 96–105. [Google Scholar] [CrossRef]
  17. Barari, S.; Agarwal, G.; Zhang, W.J.; Mahanty, B.; Tiwari, M.K. A decision framework for the analysis of green supply chain contracts: An evolutionary game approach. Expert Syst. Appl. 2012, 39, 2965–2976. [Google Scholar] [CrossRef]
  18. Xiao, Z.J.; Jiang, J.M.; Zhu, Y.Y.; Ming, Z.; Zhong, S.H.; Cai, S.B. A solution of dynamic VMs placement problem for energy consumption optimization based on evolutionary game theory. J. Syst. Softw. 2015, 101, 260–272. [Google Scholar] [CrossRef]
  19. Zhao, R.; Zhou, X.; Han, J.J.; Liu, C.L. For the sustainable performance of the carbon reduction labeling policies under an evolutionary game simulation. Technol. Forecast. Soc. Chang. 2016, 112, 262–274. [Google Scholar] [CrossRef]
  20. He, L.H.; Chen, L.Y. The incentive effects of different government subsidy policies on green buildings. Renew. Sustain. Energy Rev. 2021, 135, 110123. [Google Scholar] [CrossRef]
  21. Cohen, C.; Pearlmutter, D.; Schwartz, M. Promoting green building in Israel: A game theory-based analysis. Build. Environ. 2019, 163, 106227. [Google Scholar] [CrossRef]
  22. Huang, Q.Y.; Wang, J.W.; Ye, M.W.; Zhao, S.M.; Si, X. A Study on the Incentive Policy of China’s Prefabricated Residential Buildings Based on Evolutionary Game Theory. Sustainability 2022, 14, 1926. [Google Scholar] [CrossRef]
  23. Song, Y.H.; Wang, J.W.; Liu, D.H.; Huangfu, Y.R.; Guo, F.; Liu, Y.P. The Influence of Government’s Economic Management Strategies on the Prefabricated Buildings Promoting Policies: Analysis of Quadripartite Evolutionary Game. Buildings 2021, 11, 444. [Google Scholar] [CrossRef]
  24. Li, X.J.; Wang, C.; Alashwal, A.; Bora, S. Game analysis on prefabricated building evolution based on dynamic revenue risks in China. J. Clean. Prod. 2020, 267, 121730. [Google Scholar] [CrossRef]
  25. Yuan, M.Q.; Li, Z.F.; Li, X.D.; Li, L.; Zhang, S.X.; Luo, X.W. How to promote the sustainable development of prefabricated residential buildings in China: A tripartite evolutionary game analysis. J. Clean. Prod. 2022, 349, 131423. [Google Scholar] [CrossRef]
  26. Shen, K.C.; Li, X.D.; Cao, X.Y.; Zhang, Z.H. Prefabricated housing subsidy analysis in China based on an evolutionary game model. J. Civ. Eng. Manag. 2021, 27, 553–570. [Google Scholar] [CrossRef]
  27. Traulsen, A.; Glynatsi, N.E. The future of theoretical evolutionary game theory. Philos. Trans. R. Soc. B Biol. Sci. 2023, 378, 20210508. [Google Scholar] [CrossRef] [PubMed]
  28. Hodgson, G.M.; Huang, K.N. Evolutionary game theory and evolutionary economics: Are they different species? J. Evol. Econ. 2012, 22, 345–366. [Google Scholar] [CrossRef]
  29. Lempert, D. On Evolutionary Game Theory and Team Reasoning. Rev. D Econ. Polit. 2018, 128, 423–446. [Google Scholar] [CrossRef]
  30. Li, X.Y.; Giaimo, S.; Baudisch, A.; Traulsen, A. Modeling evolutionary games in populations with demographic structure. J. Theor. Biol. 2015, 380, 506–515. [Google Scholar] [CrossRef] [PubMed]
  31. Browne, C.; Maire, F. Evolutionary Game Design. Ieee Trans. Comput. Intell. Ai Games 2010, 2, 1–16. [Google Scholar] [CrossRef] [Green Version]
  32. Uyttendaele, P.; Thuijsman, F.; Collins, P.; Peeters, R.; Schoenmakers, G.; Westra, R. Evolutionary Games and Periodic Fitness. Dyn. Games Appl. 2012, 2, 335–345. [Google Scholar] [CrossRef] [Green Version]
  33. Cheng, D.Z.; Xu, T.T.; Qi, H.S. Evolutionarily Stable Strategy of Networked Evolutionary Games. Ieee Trans. Neural Netw. Learn. Syst. 2014, 25, 1335–1345. [Google Scholar] [CrossRef]
  34. Gokhale, C.S.; Traulsen, A. Evolutionary games in the multiverse. Proc. Natl. Acad. Sci. USA 2010, 107, 5500–5504. [Google Scholar] [CrossRef] [PubMed] [Green Version]
  35. Ji, S.F.; Zhao, D.; Luo, R.J. Evolutionary game analysis on local governments and manufacturers’ behavioral strategies: Impact of phasing out subsidies for new energy vehicles. Energy 2019, 189, 116064. [Google Scholar] [CrossRef]
  36. Aktas, R.; Cekim, B.; Cevik, A. Extended jacobi matrix polynomials. Util. Math. 2013, 92, 47–64. [Google Scholar]
  37. Zhao, T.; Liu, Z.X. A novel analysis of carbon capture and storage (CCS) technology adoption: An evolutionary game model between stakeholders. Energy 2019, 189, 116352. [Google Scholar] [CrossRef]
Figure 1. Phase diagram of Corollary 1.
Buildings 13 01557 g001
Figure 2. Phase diagram of Corollary 2.
Buildings 13 01557 g002
Figure 3. Phase diagram of Corollary 3.
Buildings 13 01557 g003
Figure 4. Simulation results of the stability point (0, 1).
Buildings 13 01557 g004
Figure 5. Simulation results of the stability point (1, 0).
Buildings 13 01557 g005
Figure 6. Simulation results of the stability point (1, 1).
Buildings 13 01557 g006
Table 1. China’s prefabricated building-related policy documents.
DateDocumentsMain Content
February 2016Several Opinions on Further Strengthening the Management of Urban Planning and ConstructionIncrease policy backing and aim to reach 30% prefabricated houses in new construction in around 10 years. Actively and consistently promote buildings using steel frames.
January 2017Comprehensive Work Plan for Energy Conservation and Emission Reduction in the 13th Five-Year PlanPutting into practice the strategy for the development of the green building industry chain, using green building practices, promoting of energy-efficient green building materials, and using steel construction.
February 2017The State Council Standing ConferenceIn order to raise the quality of architectural design and construction, intelligent and assembly-style structures are being encouraged.
March 2018Notice on the Issuance of Work Points for 2018Promote assembly-style rehabilitation of existing structures to conduct assembly-style ultra-low energy consumption and high-quality green building demonstrations.
June 2018The three-year plan of action to win the Blue Sky Defense WarConstruction sites around the establishment of the management list, in accordance with regional circumstances and the continuous development of assembly-type buildings, are expected to be completed by the end of 2018.
March 2019Highlights of the 2019 Work of the Department of Construction Market Supervision of the Ministry of Housing and Urban-Rural DevelopmentConduct a housing pilot project using steel-assembled construction techniques, with a specific percentage of the projects in the pilot area doing so.
May 2022Opinions on Promoting Urbanization with the County as an Important CarrierPromote assembly-style structures, energy-efficient doors and windows, green building materials, green lighting, and completely implement green construction as green buildings are actively developed.
Table 2. Government–evolutionary game payoff matrix for manufacturers of prefabricated building components.
Behavioral StrategiesManufacturer of Prefabricated Building Parts and Components
Low-Carbon Production yTraditional Production 1 − y
GovernmentRegulation xSa + Ep − Cs; El + Se − ClSa − Cp; Et − Ct − F1
No regulation 1 − xEp; El + Se − Cl−Cp − βF2; Et − Ct − βF1
Table 3. Equilibrium point stability analysis.
Balancing PointJacobi Matrix EigenvaluesStable Conditions
λ1λ2
A1 (0, 0)Sa + βF2El + Se − Cl − Et + Ct + βF1λ1 < 0; λ2 < 0
A2 (0, 1)Sa − Cs−(El + Se − Cl − Et + Ct + βF1)λ1 < 0; λ2 < 0
A3 (1, 0)−(Sa + βF2)El + Se − Cl − Et + Ct + F1λ1 < 0; λ2 < 0
A4 (1, 1)−(Sa − Cs)−(El + Se − Cl − Et + Ct + F1)λ1 < 0; λ2 < 0
Table 4. Stability of the equilibrium points of Corollary 1, 2, and 3.
Balancing PointCorollary 1Corollary 2Corollary 3
λ1λ2Stabilityλ1λ2Stabilityλ1λ2Stability
A1 (0, 0)++Instability point+±Instability point++Instability point
A2 (0, 1)ESS±±Instability point+Instability point
A3 (1, 0)±Instability pointESS+Instability point
A4 (1, 1)+±Instability point±+Instability pointESS
Disclaimer/Publisher’s Note: The statements, opinions and data contained in all publications are solely those of the individual author(s) and contributor(s) and not of MDPI and/or the editor(s). MDPI and/or the editor(s) disclaim responsibility for any injury to people or property resulting from any ideas, methods, instructions or products referred to in the content.

