
Shading Calculation Methods and Regulation Simplifications—The Portuguese Case
by
 ,
,
Marta Fernandes Oliveira
1,
Paulo Mendonça
2,*,
Martin Tenpierik
3,
Pedro Santiago
4,
José F. Silva
5 and
Lígia Torres Silva
1 1
CTAC Research Centre, Engineering School, University of Minho, 4800-058 Guimarães, Portugal
2
Lab2Pt Research Centre, School of Architecture, Art and Design, University of Minho, 4800-058 Guimarães, Portugal
3
Faculty of Architecture and the Built Environment, Delft University of Technology, 2628 BL Delft, The Netherlands
4
Department of Architecture and Urbanism, Fernando Pessoa University, 4249-004 Porto, Portugal
5
PROMETEUS Research Centre, School of Technology and Management, Polytechnic Institute of Viana do Castelo, 4900-348 Viana do Castelo, Portugal
*
Author to whom correspondence should be addressed.
Buildings 2023, 13(6), 1521; https://doi.org/10.3390/buildings13061521
Submission received: 26 April 2023
/
Revised: 22 May 2023
/
Accepted: 30 May 2023
/
Published: 13 June 2023
Abstract
:How to analyse the omissions of thermal regulations and evaluate methodologies that provide building execution or thermal certificates that do not correspond to reality and usually incur costs? We can start by analysing different simulation methods and shading calculations that provide solar gains and shadow optimisation. After evaluating how the regulations define the calculation assumptions and how this calculation is performed, the discrepancies (simplifications) that the regulations allow or ignore are presented, and it is exemplified using two case studies. Using the Portuguese regulation as a case study, it leads to incorrect conclusions or assumptions due to unequal access to solar radiation or the shading factor calculation that experiences the omission of angles or time periods. Therefore, the aim is to propose a calculation process (premises) that minimises the discrepancies between simulation (optimisation strategy) and reality (applicability of strategies) for sustainable output.
1. Introduction
One of the “Goals of the United Nations 2030 Agenda for Sustainable Development” is to ensure access to affordable, reliable, sustainable and modern energy for all (SDG7) [1]. Reducing the energy demand of buildings and prioritising urban forms that reconcile energy gains simultaneously with building/energy regulations could be one solution to achieve the goal. The European Union applies a methodology to calculate the energy performance of buildings according to the common general framework determined in Annex I of the European Directive 2010/31/EU, which determines the rules regarding the formulation of the calculation used to determine the energy performance of buildings. The implementation of the Energy Performance of Buildings Directive (EPBD) aims to develop a common strategy towards achieving nearly zero-energy buildings (NzEB) from 2020 onwards [2,3].
The purpose of this article is to provide an overview of the available literature, namely case studies that simulate or measure solar shading. This overview intends to promote future research, and considering this aim, the proposed methodology is a survey of the Global and European context but uses the practical case of Portugal.
This study is based on the findings of a scoping literature review, which is useful for mapping the scope of information published on a given scientific topic to examine and identify knowledge gaps. In this situation, resolving knowledge gaps or performing more extensive assessments of narrower selections of papers might be appropriate.
1.1. Selecting Shadow Case Studies
The objective of an investigation based on a case study focuses on exploring a theory that is intended to be put into practice or to simulate reality or a context. The importance of case studies lies in presenting proposals, detecting problems, needs and/or opportunities to correct or learn new methods so as to apply theories in practical cases. The validation of the exploration goes through the rigor and exact transposition of the theoretical proposal to a practical environment [4].
Reflecting on the various types of case study design, this technique can help answer specific research questions [5,6,7,8,9]. The chosen studies were selected and listed from the Scopus database using the following criteria: shadow studies with an experimental or practical component, facade shading calculations, omitting research exclusively focusing on rooftops or with photovoltaics interest. Table 1 displays the chosen examples of shadow studies.
The selected studies explore different methodologies to evaluate shadows, namely using a direct approach or indirect, using surrounding buildings that affect the transmitted solar radiation energy and shadows.
1.2. Selecting Shadow Calculation Methods
Evaluation methods [27] that demonstrate greater or lesser accuracy when calculating the shade factor in buildings have economic consequences on building use, and predictive models are beneficial alternatives when analysing energy performance [45,46].
The intentional integration of shading factors to limit solar gains through windows of glazed facades, considering the thermal needs of the spaces, is one of the most captivating passive techniques. The calculation of the shading factor (Fs) during the heating and cooling seasons is used, and the market has many options that simulate, model and analyse solar shadows.
The methodologies used to determine the shade in a given objective vary greatly. The literature search that was conducted classified the techniques into four categories to identify those that have the ability to calculate the shading factor: techniques in a CAD (computer-aided design) environment, methods using a digital elevation model (MDE), on-site obstruction recording devices of obstructions on-site and procedures permitted by Portuguese law are some examples of these methods, compiled in the following table.
The self-shaded points, that is, the situations in which it is the facade itself that is shaded, must be taken into account in the methodology and/or software which allows one to dissociate the notions of undifferentiated shading and shading caused by obstructions according to the definition of the shading factor [47].
1.3. Legislative Requirements
Before 1990, in Portugal, there were no thermal requirements in buildings. It was only when Decree-Law no. 40/90 came into force that the first thermal legal instrument was created, namely the Regulation of Thermal Performance Characteristics of Buildings (RCCTE) [48].
In 2002, the European Directive 2002/91/CE was established including the “Energy Performance of Buildings Directive” (EPBD), establishing the minimum requirements for the built environment (new and existing). As the residential sector was responsible for more than 40% of the EU’s final energy consumption, Directive 2002/91/EC indicated that by January 2006, all member states had to implement the regulatory requirements [49]. The European Union and the member states defined goals concerning the rational use of energy resources through the Kyoto Protocol to reduce carbon dioxide gas emissions into the atmosphere.
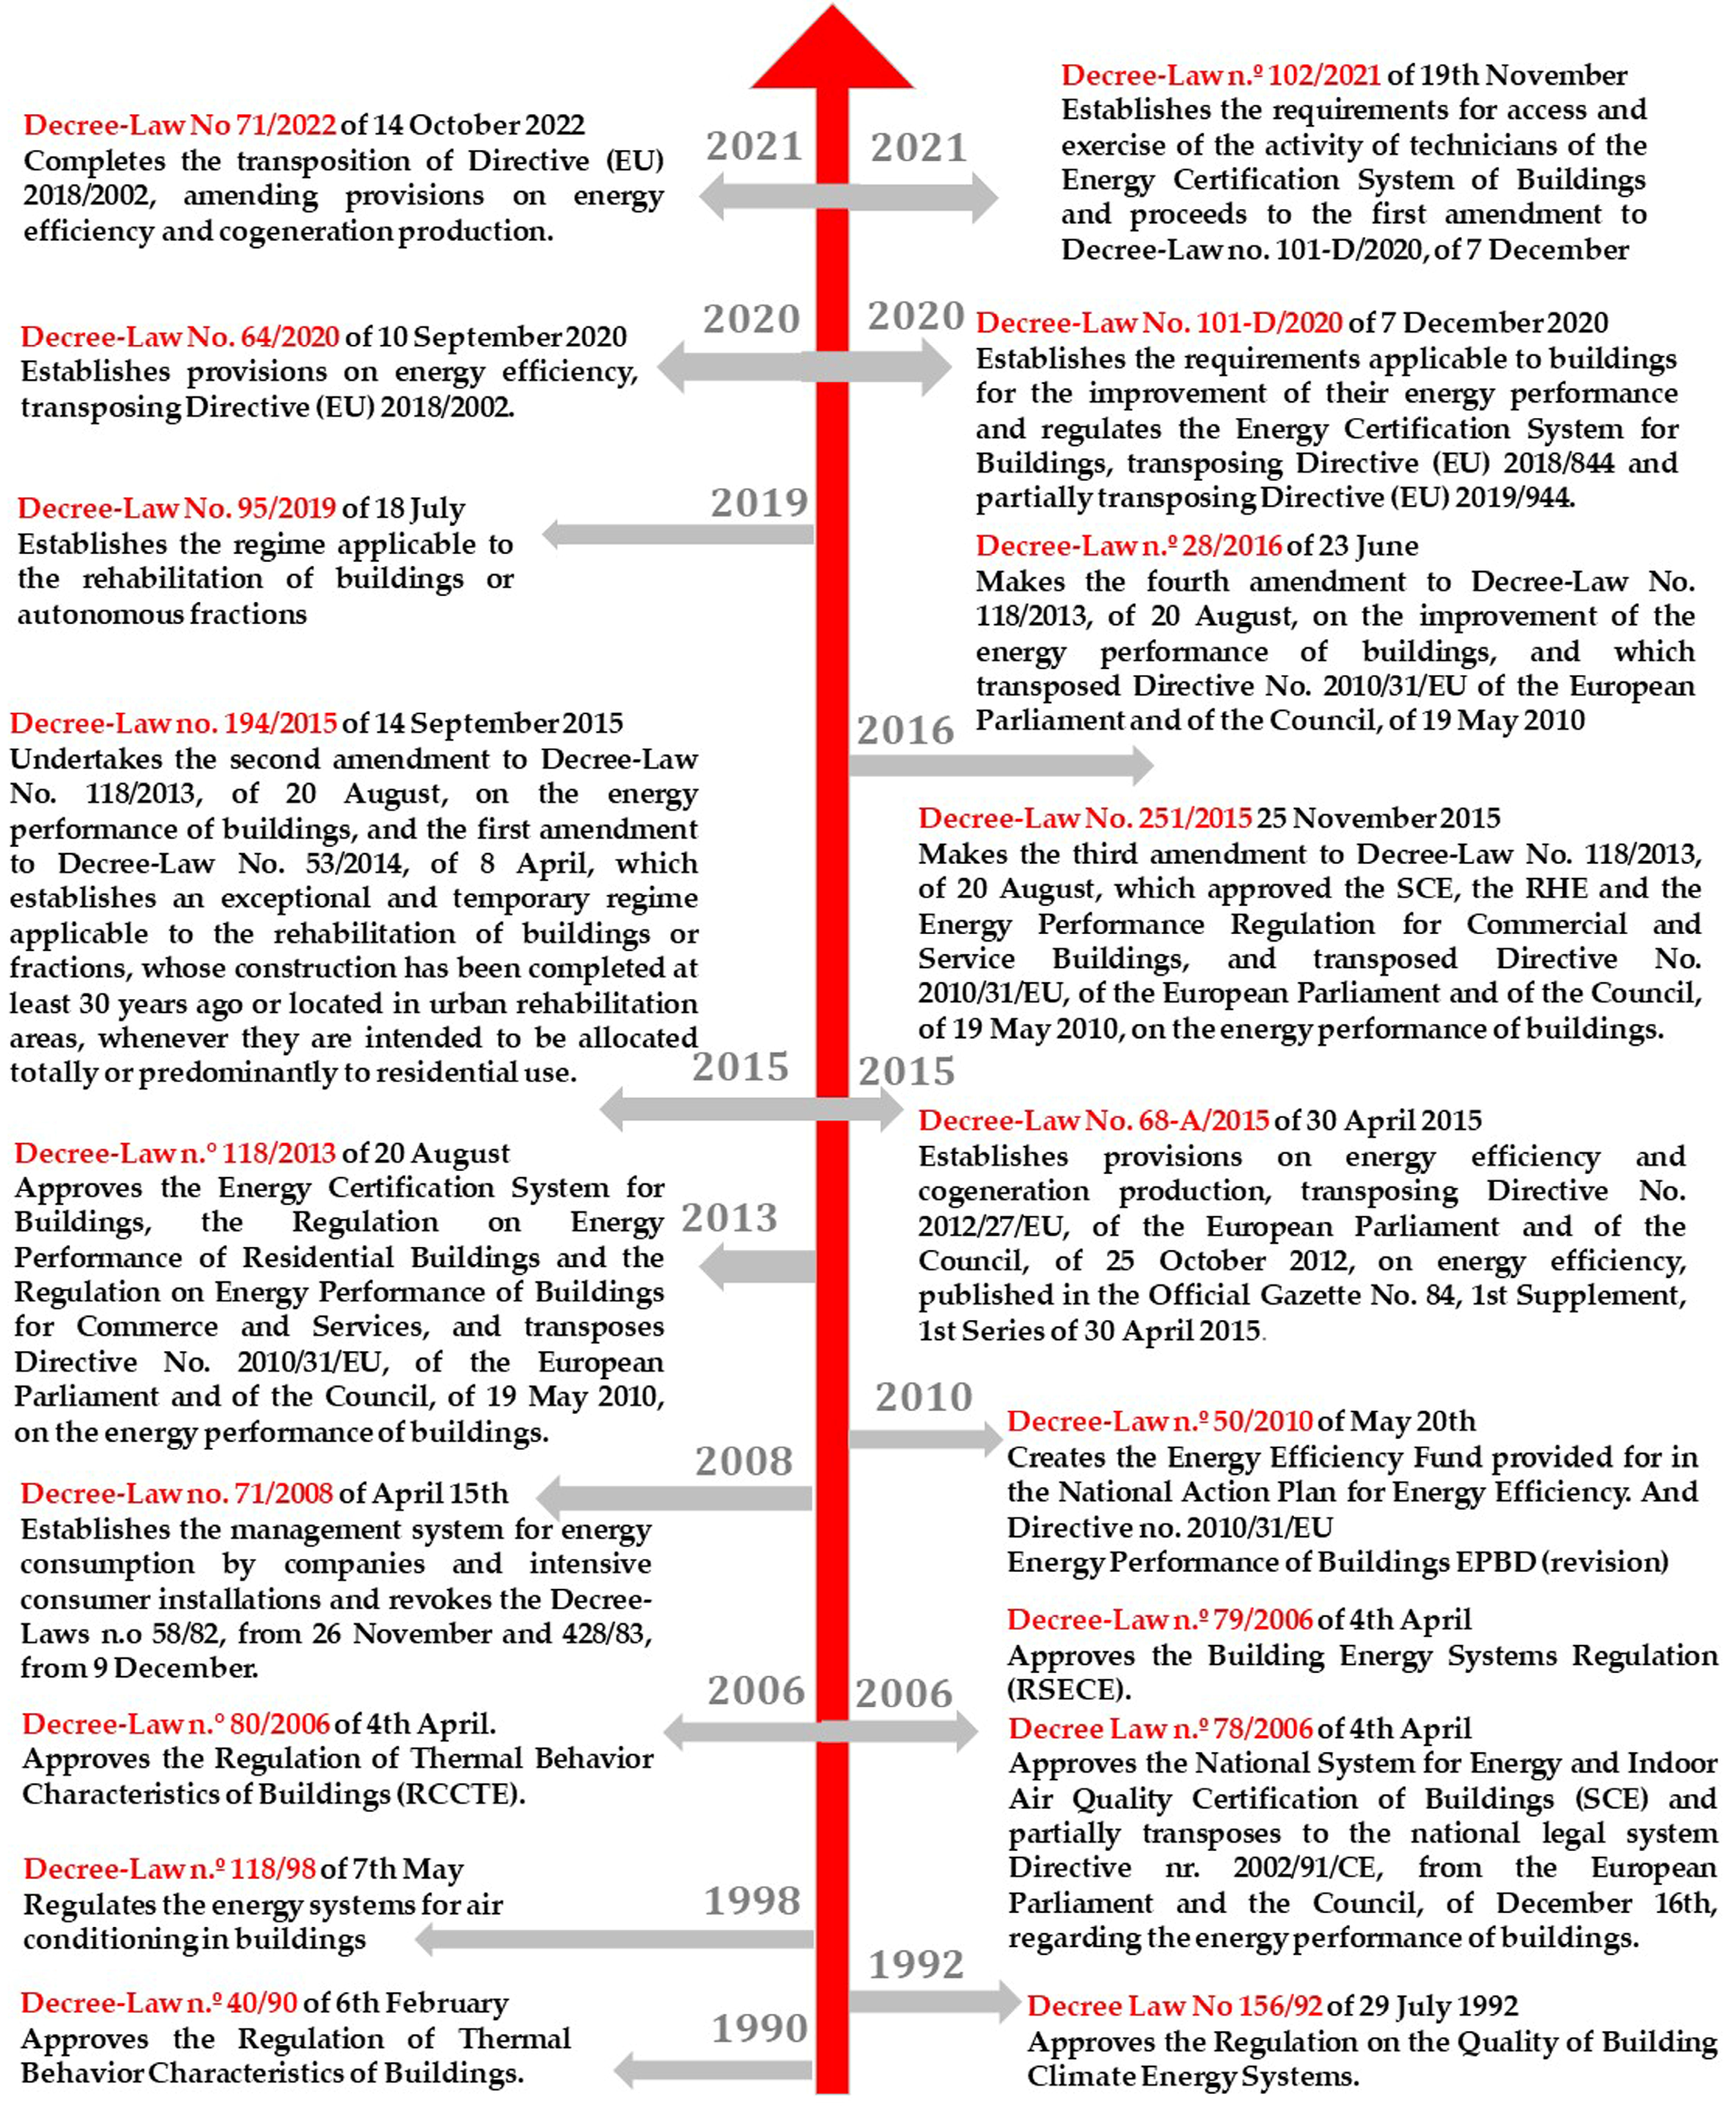
In 2013, Portugal integrated the REH—Regulations for the Energy Performance of Residential Buildings (former RCCTE) and the RECS—Regulation on the Energy Performance of Commerce and Services Buildings (former RSECE) in a single diploma after publishing Decree-Law no. 118/2013, which ensured not only the transposition of Directive no. 2010/31/EU but also a revision of the national legislation or the promotion of the energy performance of buildings through the Energy Certification System of Buildings (SCE) [50]. Moreover, Decree-Law No. 71/2022 of 14 October completes the transposition of Directive (EU) 2018/2002, amending provisions on energy efficiency and cogeneration production.
The harmonisation and updating of national (energy) legislation [51] aimed not only to comply with European standards but also to promote energy efficiency in buildings, its systematisation and scope of application to reduce thermal losses and increase the quality and durability of the built constructions and its evolution as reflected in the timeline in Figure 1.
The system for calculating the shading factor has not changed despite the evolution of thermal regulations in Portugal in the various components, including housing (from the RCCTE to the current REH), services and commerce (from the RSECE to the current RECS) or the Energy Certification System of Buildings (SCE). Using the examples provided below, we will see that the omission of angles, undifferentiation of horizontal obstacles or the interpolations of data and angles have occurred and have an impact on the actual calculation of solar shading and the respective solar optimisation of buildings.
2. Methodology
The strategy was to identify the research keywords, find relevant studies (specifically solar and shadow studies), select studies (namely shadow calculations) in a certain context (global, European and Portuguese) and then aggregate, summarise and present them in Table 1 and Table 2.
The purpose of this study is to investigate the premises and the calculation methods that estimate the solar shading factor, presenting different methodologies, and to compare the findings with the two methods suggested by Portuguese law.
The approach is also utilised to uncover research generalisations through a thorough and valid strategy for mapping the study area, as well as to discover the measures and characteristics of previous research on the subject. The intention of the article is not to present comparative results of calculations or software but rather, regardless of the software used, to present the assumptions of the calculation that is defined.
2.1. Portuguese Calculation Methodology
There are two ways to determine a building’s shading factor according to Portuguese law. The first applies the calculation methodology described in Order (extract) no. 15793-K/2013 (Ministry of Economy and Employment, 2013c) based on the current obstruction angles, and the second takes into account the simplification criteria that assign a shade class to each glazed element in accordance with Order (extract) no. 15793-E/2013 [66].
The calculation methodology is the most detailed process in the Portuguese legislation to calculate the shading factor (). It presupposes the calculation of the obstruction angles of the existing shading sources. It is not completely necessary to analyse possible obstacles on-site. This approach considers three components of the shading factor, according to Equation (1):
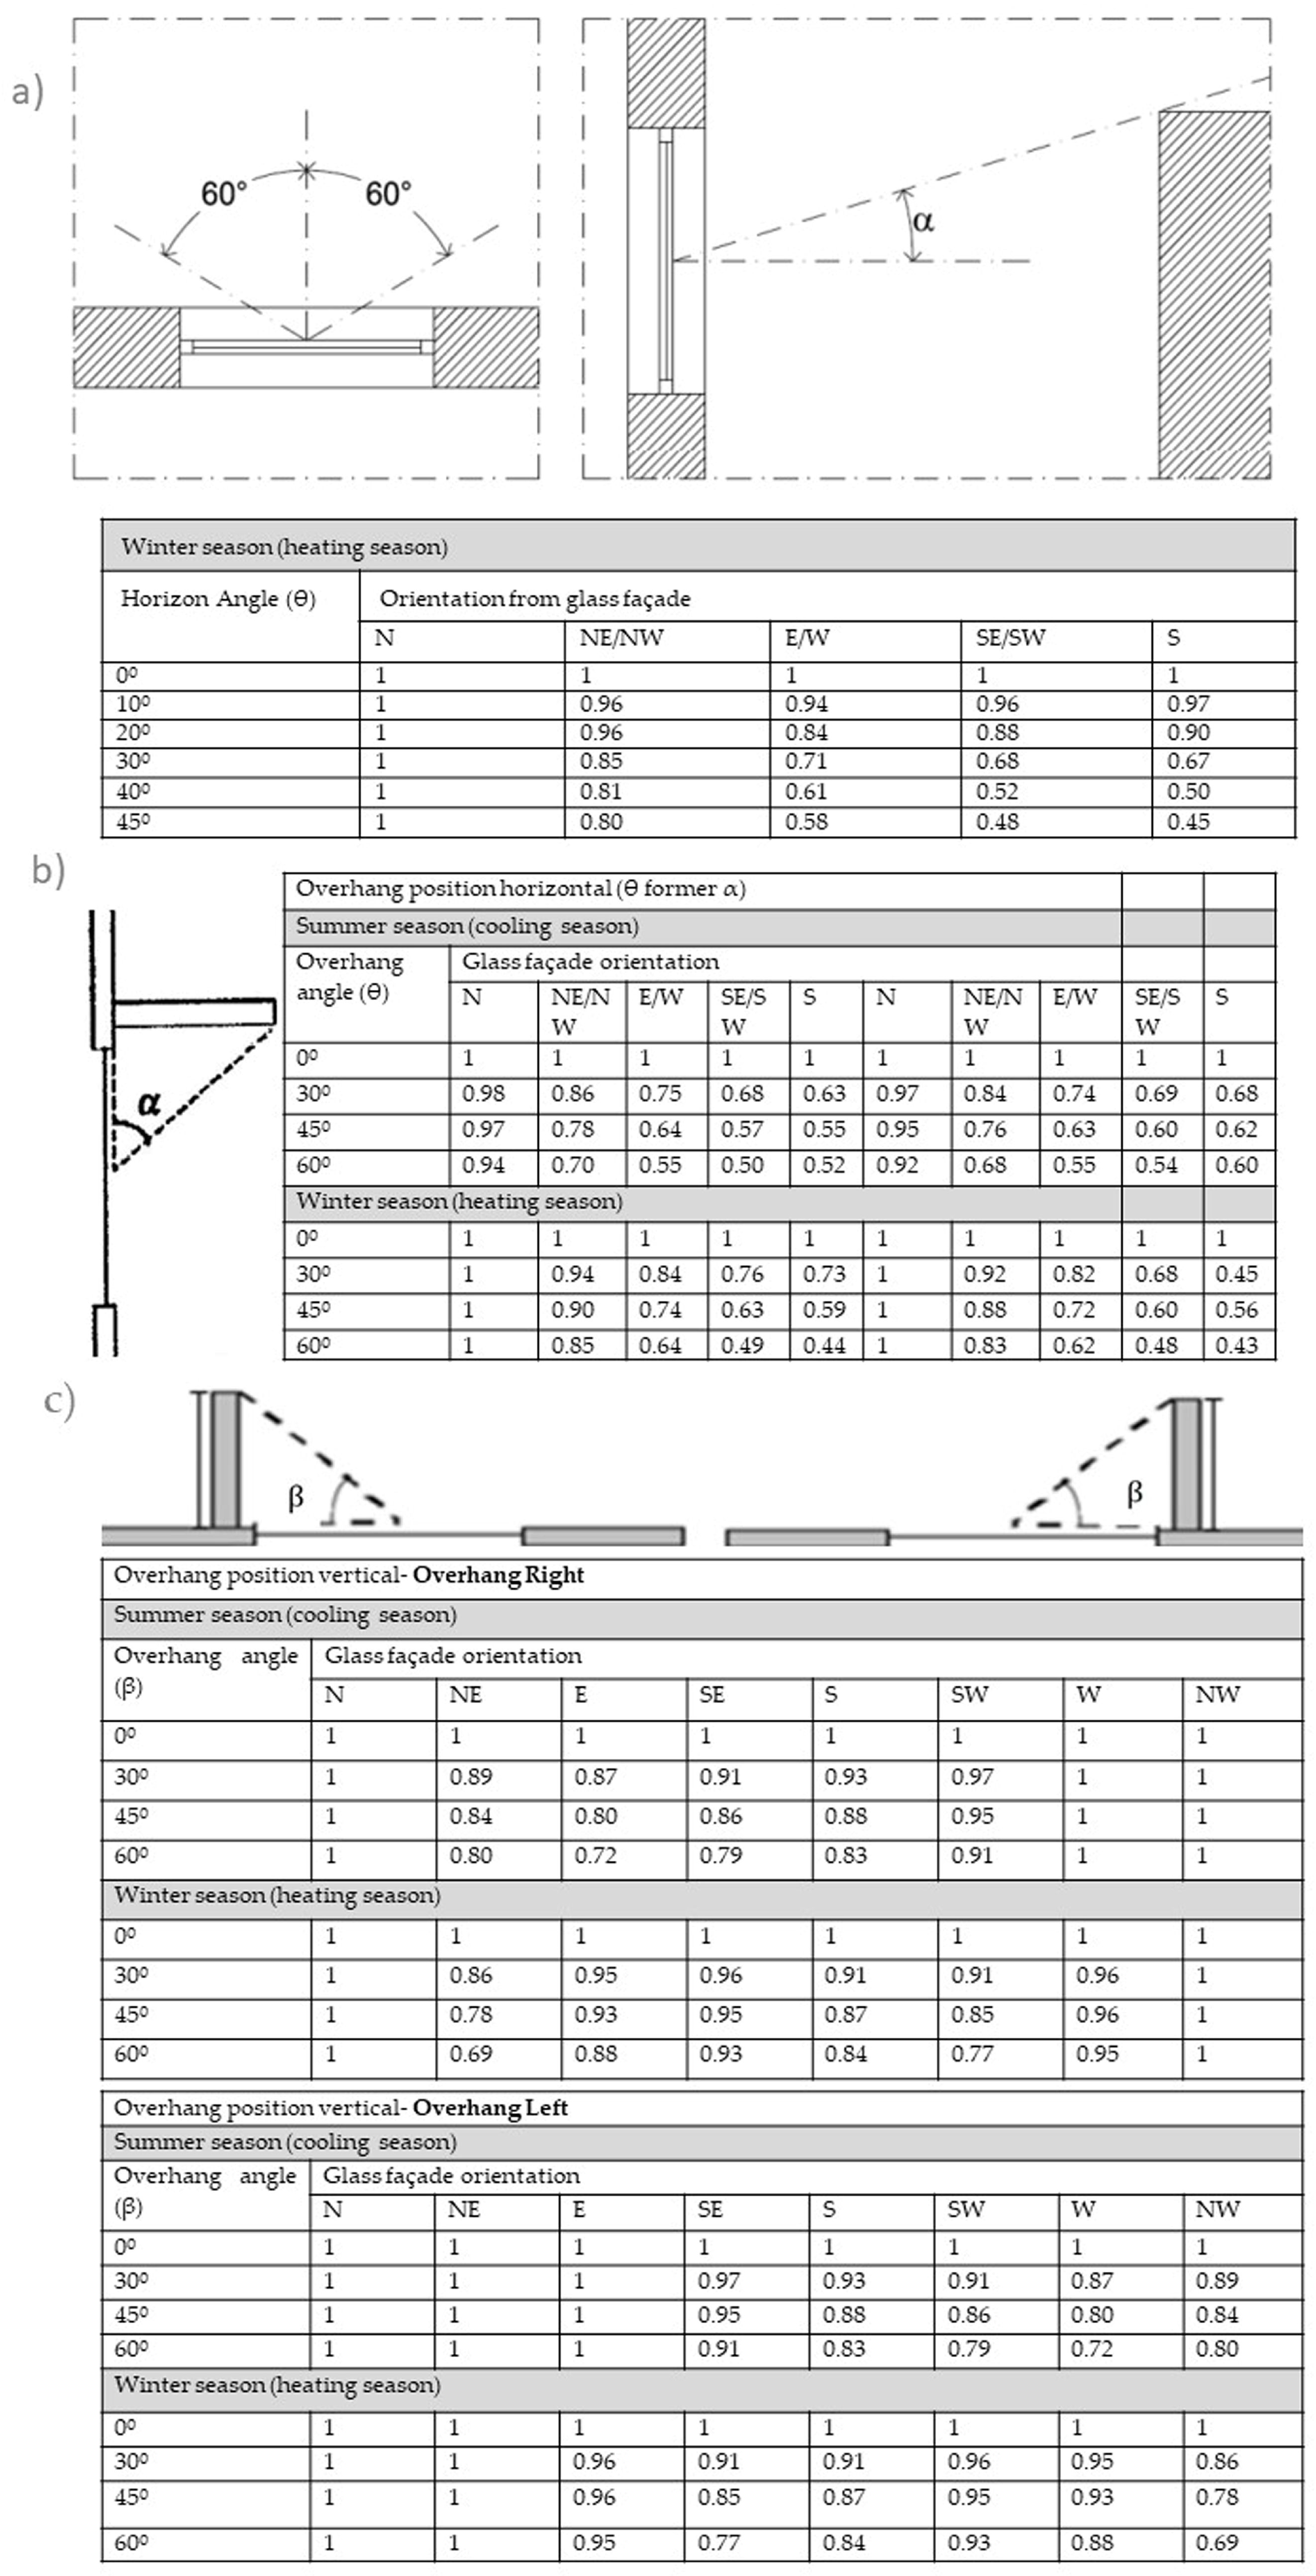
where corresponds to the shading factor from vertical elements next to the window, including vertical canopies, other bodies or parts of a building, and represents the shading factor by horizontal elements overlying the window, including canopies and balconies [63]. is the horizon shading factor by obstructions external to the building, and it is represented in Figure 2. in addition to the horizontal and vertical shading factors.
2.1.1. Horizon Shading Factor
As shown in Figure 3, a straight line is drawn between the centre of the window and the highest point of the largest existing obstruction between two vertical planes at 60 degrees to either side of the window based on the calculation of the shading caused by the obstruction in the horizon in the heating season.
The current law assumes that the horizon has a value of 1 in all orientations because it ignores the horizon’s contribution to shading in the cooling station [66]. The horizon angle (Figure 2) is the angle formed by the provided trace and the horizontal plane, and it is determined by Equation (2):
where is the obstruction elevation(m), is the window’s centre point elevation (m), and is the horizontal separation between the obstruction and the window facade (m).
The information in Figure 3 is used to assign a horizon shading factor after assigning the facade orientation to each value acquired from the previous procedure. The values of the horizon shading factor for eight different azimuths can be seen in Figure 3. If the facade’s orientation differs from those specified, the current value of the nearest orientation is used. The corresponding horizon shading factors are averaged for situations where the facade has an intermediate orientation between two of the azimuths indicated in Figure 3.
In the absence of available information for determining the reference angle, the value of should be estimated by using a default horizon angle of 45° in the case of urban environments and 20° in the case of isolated buildings located outside of urban regions. After defining this, the value of the horizon shading factor is derived from Table 15 of Order No. 15793-K/2013, and for horizon angles greater than 45°, a horizon shading factor equivalent to the 45° angle is adopted.
The shading factor is interpolated to account for the range of values according to Equation (3), where and represent the shading factor of the inferior and superior bounds of the interpolation interval, respectively, and and correspond to the horizon angles of these same limits. This is done to overcome the limitation mentioned above.
2.1.2. Shading Factor for Horizontal or Vertical Obstruction
Similar to the procedure mentioned above, the contributions of the horizontal and vertical elements are estimated as functions of the horizontal (θ) and vertical (β) blind spot angles, respectively. The angle formed by the plane of the facade and a straight line between the shading source’s tip and the window’s centre is known as the horizontal visor angle or vertical visor angle, respectively [66].
From the previous tables, only three parameters need to be determined by the evaluator at the site: the desired season (summer or winter), the orientation of the glazed facade and the angles between the centre of the glazing and the edge of the overhangs (horizontal θ or vertical β), that is, to determine whether the overhang’s length (or the height of the obstacle) is greater or less than the distance from the obstacle to the facade under study. It is now simpler to compute the shade factor in buildings due to this short assessment that streamlines the entire procedure described in the previous point [67].
The shading factor by horizontal elements is one of many factors taken into account by the current regulation, which recommends an approach for estimating the solar benefits achieved through the glazed regions. The values of the shading factor are given in Figure 3 by the current regulation for this purpose.
The angle is the intersection of two planes: the plane containing the wall’s outside surface and the plane enclosed by the midline and end of the horizontal shading element. The factor’s value, which ranges from 0 to 1, shows how much solar radiation actually enters the glazed facade as opposed to how much would fall in the absence of the horizontal shade.
It can be deduced that the higher the horizon angle, as well as the obstruction angles for horizontal and vertical elements, the lower the values of , and and, consequently, the lower the value of the obstruction factor [41,42].
It is essential to strive to maximise these advantages during the winter, promoting a low value and minimise them during the summer to reduce the global nominal energy consumption for air cooling, promoting a high value. As Portugal is one of the European nations with more intense solar radiation. Regulations in Portugal require using a procedure for assessing solar gains during both the heating and cooling seasons to determine the building’s energy requirements.
3. Results and Portuguese Case
Portugal has about 3.6 million residential buildings, which contribute to about 30% of the national primary energy consumption (electricity), mainly for heating and cooling systems, domestic hot water, lighting and electrical equipment use. These values have increased in recent years due to the need for greater indoor comfort, especially in residential buildings. Thus, new measures needed to be adopted to reduce energy consumption in this sector and, preferably, through passive and sustainable solutions [68].
According to the 2021 Census data, the ratio of housing units per building is approximately 1.7 (5.9 million residences/3.6 million residential buildings). What this tells us is that Portugal has few multi-family buildings (generally high-rise construction) [69].
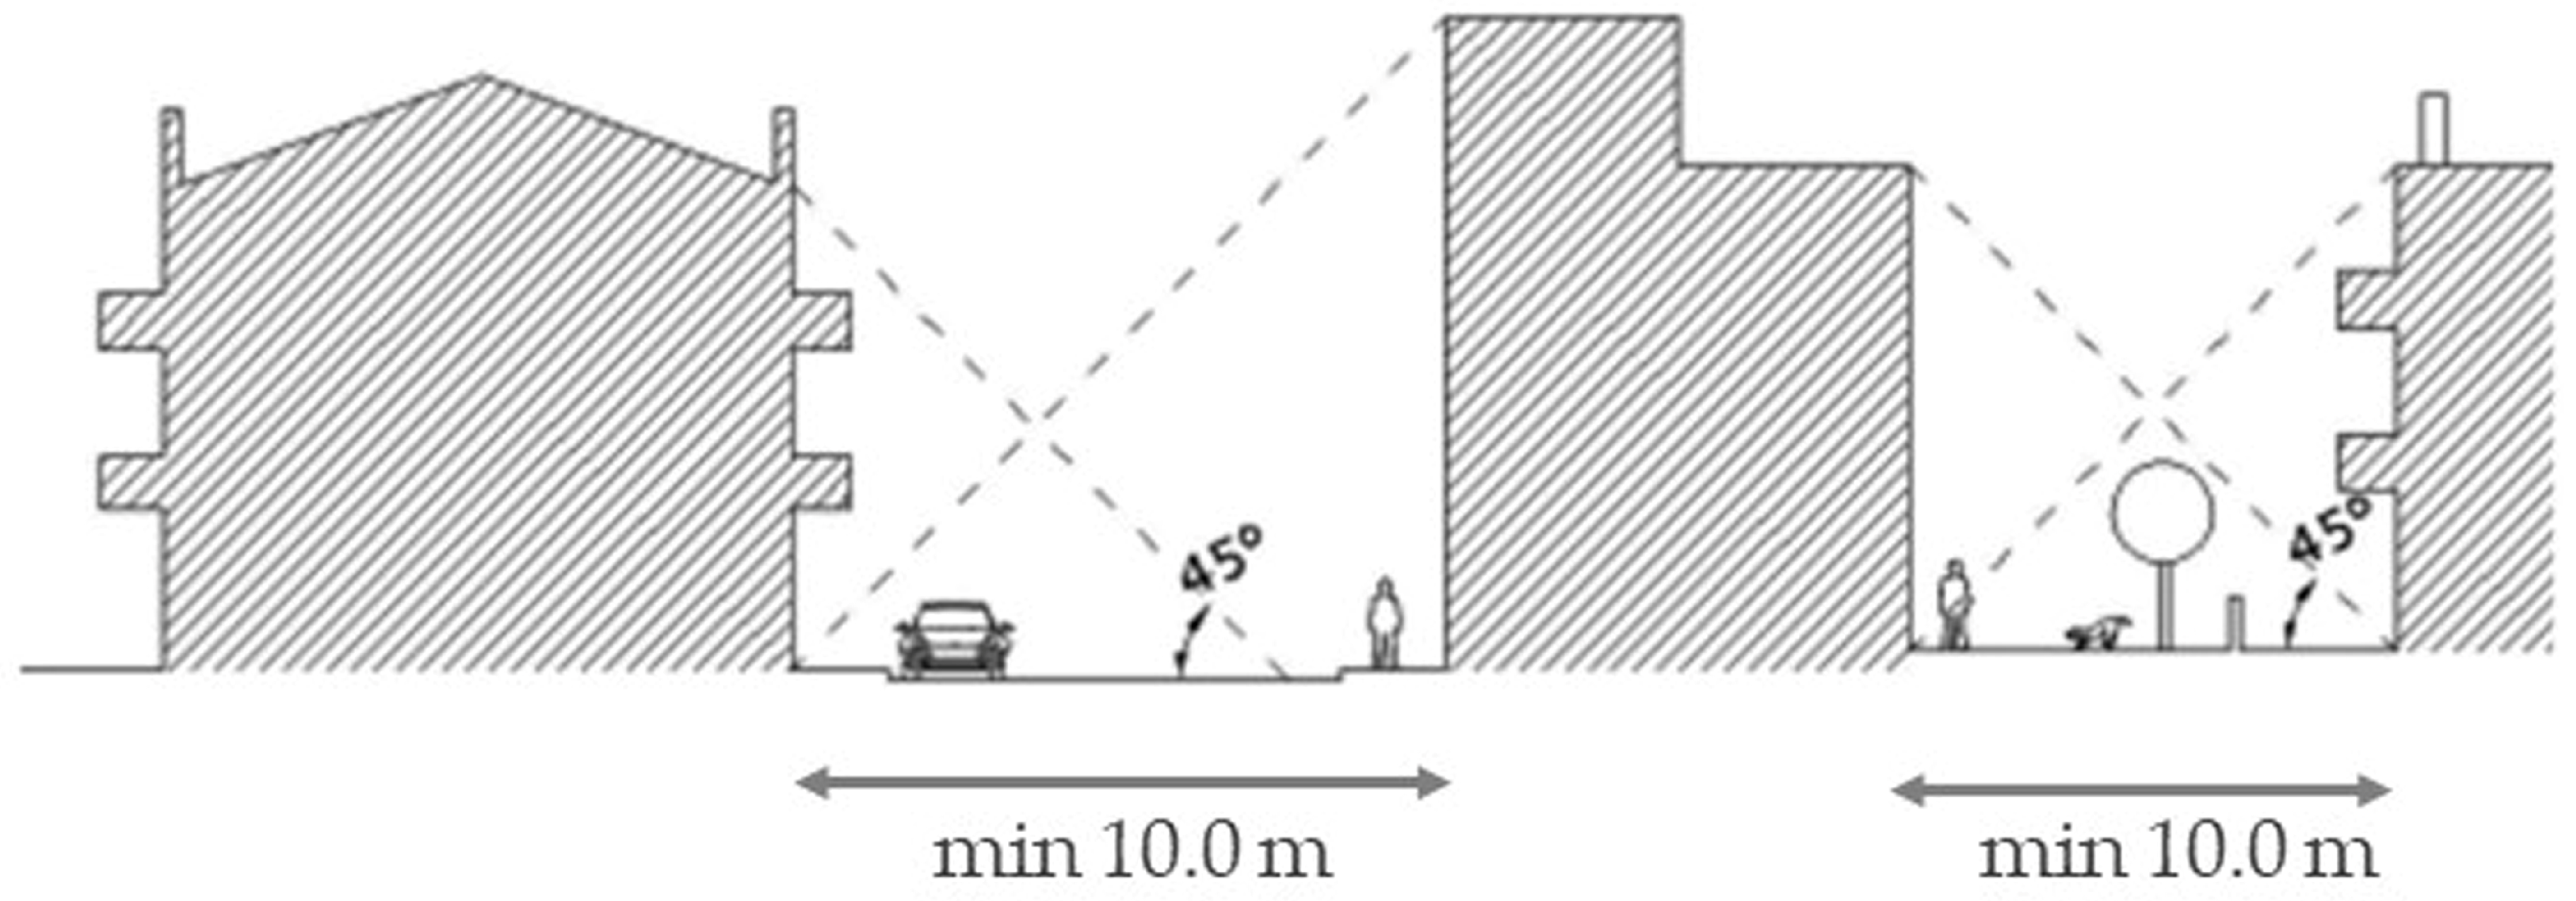
When we calculate the energy demand per square metre, high-rise buildings typically consume less energy than single-family buildings. However, if we calculate the heat gains in the winter, high-rise constructions have a higher energy consumption due to the first floors receiving less solar radiation compared to the other floors of the building. Normally, this factor has to do with the 45 degrees between buildings, which is exemplified in Figure 3.
![Buildings 13 01521 g003]()
Figure 3.
Example of the application of the 45° based on the 59th to 62nd articles of Decree-Law No. 38382 (RGEU) [70].
Figure 3.
Example of the application of the 45° based on the 59th to 62nd articles of Decree-Law No. 38382 (RGEU) [70].

The exemplification demonstrates how urban form impacts the incident solar radiation on the building facades according to their orientation. In the Portuguese case, the General Regulation for Urban Buildings (RGEU) defines the basic premise of ensuring the minimum conditions of sunlight and natural lighting of buildings, given by the 45° angle between buildings, and specifically, article 59 refers to the height of buildings while article 60 has to do with the distance between neighbouring building [70]. So the higher a building and its surroundings are, the less access to solar radiation the first floors will have, and in the winter, this factor has an impact on energy consumption for heating. Studying the relationship between the width and height of buildings in relation to the street is also another way to ensure the minimum insolation conditions of buildings, and Figure 1 demonstrates it.
To study the building envelope in an urban context, namely the optimisation of radiation and solar orientation using the basic premise (45° angle between buildings) and the resulting shadow study, the solar radiation needs to be measured reaching the facades, and different scenarios need to be simulated in a digital environment to evaluate, measure and transpose them to reality. In fact, 45° is not a calculation variable in the Portuguese case—it is only taken as the default value of in its simplified method when we do not measure the real shading angles due to a lack of information. In that case, 45° is the reference because of the RGEU. However, only in that case.
The proposed objective is to study the shading factor and its impact on solar gains throughout the year (summer and winter seasons).
3.1. Discussion of the Gaps of Thermal Regulation in Portugal, Compromising the Angles of Obstruction
The Portuguese thermal regulation strategy produces identical outcomes for circumstances that are in fact distinct. The reason for this is that the method for calculating the shading factor ignores the impacts of the distance from the shading system to the glazed space and instead bases its calculation on the angle of obstruction, measured from the middle of the window facade. It follows that the regulation assigns the same shading correction factor for two situations with the same angle but different distances from the skylight to the window, resulting in solar gains with equal values (if in all other respects, the two situations are identical), even though reality demonstrates that the two situations can be different.
In the Portuguese context, the case study carried out by Silva and Henriques [39] is an example of the discrepancy of angles and mode of calculation that the Portuguese thermal regulation defines. They select a general case of a south-facing glass facade and depict the shadow masks created by shading systems with the same shading angle (α) “30°, 45°,60°” but at various distances from the window facade and the horizontal shading system. The analysis was conducted using a latitude of 39°N, which is the value recommended by Portuguese thermal regulation to represent the territories of the mainland and the Azores, as can be seen in Table 3.
Silva and Henriques [39] found, by analysing the three obstruction angles, that with a greater length between the horizontal element and the span (l’) during the cooling season, the facade will be completely shaded. Additionally, the time period of the partial shading of the glazed facade will be shorter the longer the distance (l’), particularly during the heating season.
This means that for a south-facing facade, at the same angle “θ” (former “α”), the larger the distance between the horizontal element and the glazed opening, the bigger the solar gains in the winter and the lower the gains in the summer, helping to reduce energy use for air conditioning and increasing a building’s energy efficiency.
Since the shading factor is solely calculated using the angle “θ” which ignores the distance from the horizontal element to the window gap (l’), the technique for determining solar gains through the window from the Portuguese regulation does not take this fact into account.
Silva and Henriques [39] state that existing regulations should take into account two angles designated as αi and αv. They base their argument on the idea that a south-facing glazed facade does not shade itself at solar noon as long as the height of the sun is less than an angle of 90°- αi. However, if the height of the sun is higher than the 90°-αv angle, complete shading of the glazed facade is obtained. According to the method for dimensioning horizontal shading elements for south-oriented facades, for a 39° N latitude, all windows should be at a significant angle in the shade at solar noon for a significant portion of the cooling season and at a significant angle (it should be αv = 21°) in the sun for a significant portion of the heating season (it should be αi = 57°).
3.2. Discussion of the Gaps in Thermal Regulation in Portugal, Compromising Calculation Periods
As in the previous example, the proposal presented corresponds to an omission in the Portuguese thermal regulation, where, for example, the equinoxes of the spring and autumn represent two more seasons that should be considered in a solar or/and shading evaluation to have more intermediate variables for the simulation of the shading computation. Because of its impact, either by omission or by excess, it can lead to design decisions with high energy and construction costs by not taking this factor into consideration.
The duration of the heating season differs according to the location where the study is conducted. In general, the longer the season lasts, the further north we are in the country. According to Order (extract) No. 15793-F/2013, the heating season in our proposal for the city of Viana do Castelo lasts 6.3 months, beginning with the first of ten consecutive days with an average daily temperature below 15 °C and in agreement with the climate files of the region of the last 30 years. It was concluded that the heating season is 6.3 months. In terms of the cooling season, Order (extract) No. 15793-F/2013 reiterates that it lasts four months, from 1 June to 30 September, regardless of the year or region of the nation [71].
In the Portuguese climatic pattern, the energy needed to cool buildings in the summer is significantly less than that required to heat them in the winter [26,44,72]. The solar height regulates the incidence of radiation on the facades; in the summer, it significantly reduces the conditioning of the urban form in terms of facade shade, nearly ensuring their entire exposure during the daytime period. Because the sun is lower in the sky in the winter, it accentuates the relationship between the shading of the facades and the urban environment.
For the shading calculation, the adopted methodology was the modelling of the building and its urban context including the block where it is inserted, the terrain with its topography and existing buildings that border the surrounding streets. The modulation was made using a BIM (Building Information Modelling) program (Archicad) that allowed articulation with Grasshopper 3D—a plugin for Rhino 3D, which is the main parametric modelling tool [73,74,75].
Energy-related simulations are based on the case from Energy Plus Weather Format (Epw), the file is validated with the INETI Synthetic data for Portugal and by the public Portuguese Instituto de Meteorologia (Institute of Meteorology). Ladybug is a Grasshopper plugin that can simulate and create building envelopes for sun and shadow studies [76,77,78]. The case study used Ladybug to define the components of solar radiation analysis (volumes and geometries) so that the object of analysis is both the object and the context (surroundings) [28,76,79].
The demonstrative case study consists of a multi-family residential building located in Viana do Castelo, a city in the north of Portugal, and the legislation identifies its location as Climate Zones I1 and V1 (Winter 1 and Summer 1). The urban context is a historical settlement with narrow streets and buildings with an average height of three floors. The eastern, western and northern quadrants are consolidated with pre-existing construction, while the southern quadrant is more open with the presence of notable buildings such as a chapel. The building presents a closed block configuration with interior courtyards. The height is similar to the surrounding area.
The analyses were performed for four specific dates of the year, the two solstices and the two equinoxes. It can be observed that in terms of different hours of the day, the shadows in the autumn and spring equinoxes are identical. The facade presented in this research is the south-west-facing façade, and, on the solstices, the shadows are very distinct, as can be seen in Table 4.
The results of the analysis present a clear difference between the four times of the year concerning solar availability on various parts of the facade (Table 4). The area facing the nearest building has less solar radiation than the rest during the winter solstice. On the summer solstice, the same building only casts a shadow on the lower floor of the facade. However, during the equinoxes, the facade clearly shows a different area subject to a shadow. The number of sun hours changes considerably throughout the four periods of the year.
The analysis shows that if the intermediate seasons are not calculated, the solar analysis and the shading calculation will be very different from reality. However, the Portuguese thermal law considers that only the heating season and the cooling season, as mentioned above, should be calculated, and it is a weighted average between the mentioned periods. Thus, as expected, it is not accurate to consider it representative of a heating season or cooling season when so many differences in solar radiation or shade production occur.
Our proposal would be to calculate the whole heating season period (to optimise the gains) and the whole cooling season period to optimise the losses. This factor needs to be included in building design studies and analyses to prevent mistakes and increase the building’s comfort and thermal efficiency, it would be important to incorporate these premises into Portuguese law, and it is expected to have some effect on lowering the energy impact of buildings in national energy consumption.
4. Conclusions
This article’s goal was to highlight the significance of the legislative component and its implementation. This is a global concern, and whenever an international or European standard is transposed for each country, a series of assumptions, parameters, scopes or limitations are taken into account in each application, and it is sometimes necessary to add or define with more specifications (with more details and more assumptions) or exceptions that are not generalisable.
The Portuguese regulation demonstrated that it can lead to incorrect conclusions or assumptions when it gives scope for generalisations or simplifications. A practical example is the use of the simplification rules allowed in the execution of thermal certificates, and in most cases, the evaluations do not correspond to reality. Due to its simplicity of use compared to the more time-consuming technique mentioned in Table 2, Portuguese experts currently choose this method for certification, although they obtain a generalised/generic analysis. Considering the importance of the energy certification, which influences a building’s patrimonial value, in the construction or rectification of the building for better energy performance, the overvaluation or undervaluation of a given factor, such as the shading factor, may force the implementation of measures for excess or deficit in the creation or rectification of buildings.
The proposed methodology aimed to analyse and demonstrate regulatory generalisations that provide a less accurate assessment of reality, and each of the case studies demonstrates some simplifications and proposes solutions to overcome these generalisations (Table 3 and Table 4). Since this process is occurring and usually it incurs costs, typically in the insulation or heating/cooling of the buildings, this reality might not lead to real nearly zero-energy buildings (nZEBs).
In the given scenario, it is possible to consider that the validity of the proposal sometimes clashes with the political-legislative premises, and the decisions are taken regardless of whether the executed proposal was the best technical option. The lack of interaction between systems, including legislation, may add incongruities by excess or by omission, as has been seen, that prevent the optimisation of solutions, in this case, energy reduction or urban sustainability [80].
Author Contributions
Conceptualisation, M.F.O., P.M. and L.T.S.; Funding acquisition, M.F.O., P.M. and L.T.S.; Investigation, M.F.O., P.M. and L.T.S.; Writing—original draft, M.F.O.; Writing—review and editing, M.F.O., P.M., M.T., P.S., J.F.S. and L.T.S. All authors have read and agreed to the published version of the manuscript.
Funding
This work was financed by Foundation for Science and Technology (FCT) (Grant SFRH/BD/2018)/MCTES through national funds (PIDDAC) under the R&D Centre for Territory, Environment and Construction (CTAC), under reference UID/04047/2020, and the Landscapes, Heritage and Territory Laboratory (Lab2PT) Center of Design and Technology (DeTech).
Data Availability Statement
Not applicable.
Acknowledgments
The authors gratefully acknowledge the funding support of the Foundation for Science and Technology (FCT) and the Centre for Territory, Environment and Construction (CTAC).
Conflicts of Interest
The authors declare no conflict of interest.
References
- Development Goals|United Nations Development Programme. Available online: https://www.undp.org/sustainable-development-goals (accessed on 3 April 2023).
- Aelenei, L. NZEB, Passive Solutions and Integration in Façades. 2022. Available online: https://www.lneg.pt/wp-content/uploads/2022/05/laura-aelenei-4-maio-2022.pdf (accessed on 4 May 2022).
- Silva, S.M.; Mateus, R.; Marques, L.; Ramos, M.; Almeida, M. Contribution of the Solar Systems to the NZEB and ZEB Design Concept in Portugal—Energy, Economics and Environmental Life Cycle Analysis. Sol. Energy Mater. Sol. Cells 2016, 156, 59–74. [Google Scholar] [CrossRef] [Green Version]
- Crowe, S.; Cresswell, K.; Robertson, A.; Huby, G.; Avery, A.; Sheikh, A. The Case Study Approach. BMC Med. Res. Methodol. 2011, 11, 100. [Google Scholar] [CrossRef] [Green Version]
- Reinhart, C.F.; Cerezo Davila, C. Urban Building Energy Modeling—A Review of a Nascent Field. Build. Environ. 2016, 97, 196–202. [Google Scholar] [CrossRef] [Green Version]
- Swan, L.G.; Ugursal, V.I. Modeling of End-Use Energy Consumption in the Residential Sector: A Review of Modeling Techniques. Renew. Sustain. Energy Rev. 2009, 13, 1819–1835. [Google Scholar] [CrossRef]
- Li, W.; Zhou, Y.; Cetin, K.; Eom, J.; Wang, Y.; Chen, G.; Zhang, X. Modeling Urban Building Energy Use: A Review of Modeling Approaches and Procedures. Energy 2017, 141, 2445–2457. [Google Scholar] [CrossRef]
- Harish, V.S.K.V.; Kumar, A. A Review on Modeling and Simulation of Building Energy Systems. Renew. Sustain. Energy Rev. 2016, 56, 1272–1292. [Google Scholar] [CrossRef]
- Allegrini, J.; Orehounig, K.; Mavromatidis, G.; Ruesch, F.; Dorer, V.; Evins, R. A Review of Modelling Approaches and Tools for the Simulation of District-Scale Energy Systems. Renew. Sustain. Energy Rev. 2015, 52, 1391–1404. [Google Scholar] [CrossRef]
- Ryerson, C.C. Mapping Solar Access in High Relief Areas for Regional Energy Planning. Prof. Geogr. 1984, 36, 345–352. [Google Scholar] [CrossRef]
- Belakehal, A.; Tabet, A.K. Shading and shadowing: Concepts for an interactive strategy between solar control and aesthetics in the design of the facade. Reference to arid zones. Renew. Energy 1996, 8, 323–326. [Google Scholar] [CrossRef]
- Al-Sallal, K.A. Solar Access/Shading and Building Form: Geometrical Study of the Traditional Housing Cluster in Sana’a. Renew. Energy 1996, 8, 331–334. [Google Scholar] [CrossRef]
- Belakehal, A.; Tabet, A.K. Experimental Assessment of Shading and Shadowing Strategy, Case of Facade’s Cantilevered Volumes. Reference to Dwellings in Arid Lands. Int. J. Ambient Energy 2000, 21, 179–186. [Google Scholar] [CrossRef]
- Capeluto, I.G. Energy Performance of the Self-Shading Building Envelope. Energy Build. 2003, 35, 327–336. [Google Scholar] [CrossRef]
- Bourbia, F.; Awbi, H. Building Cluster and Shading in Urban Canyon for Hot Dry Climate: Part 2: Shading Simulations. Renew. Energy 2004, 29, 291–301. [Google Scholar] [CrossRef]
- Chua, K.J.; Chou, S.K. Evaluating the Performance of Shading Devices and Glazing Types to Promote Energy Efficiency of Residential Buildings. Build. Simul. 2010, 3, 181–194. [Google Scholar] [CrossRef]
- Hayman, S. Limits of Accuracy of Graphical Solar Access and Shadow Studies. Archit. Sci. Rev. 2011, 32, 15–20. [Google Scholar] [CrossRef]
- Grynning, S.; Time, B.; Matusiak, B. Solar Shading Control Strategies in Cold Climates—Heating, Cooling Demand and Daylight Availability in Office Spaces. Sol. Energy 2014, 107, 182–194. [Google Scholar] [CrossRef] [Green Version]
- Shukla, K.N.; Rangnekar, S.; Sudhakar, K. Comparative Study of Isotropic and Anisotropic Sky Models to Estimate Solar Radiation Incident on Tilted Surface: A Case Study for Bhopal, India. Energy Rep. 2015, 1, 96–103. [Google Scholar] [CrossRef] [Green Version]
- Aksamija, A. Design Methods for Sustainable, High-Performance Building Facades. Adv. Build. Energy Res. 2015, 10, 240–262. [Google Scholar] [CrossRef]
- De Simón-Martín, M.; Díez-Mediavilla, M.; Alonso-Tristán, C. Shadow-Band Radiometer Measurement of Diffuse Solar Irradiance: Calculation of Geometrical and Total Correction Factors. Sol. Energy 2016, 139, 85–99. [Google Scholar] [CrossRef] [Green Version]
- Lee, K.S.; Han, K.J.; Lee, J.W. The Impact of Shading Type and Azimuth Orientation on the Daylighting in a Classroom-Focusing on Effectiveness of Façade Shading, Comparing the Results of Da and Udi. Energies 2017, 10, 635. [Google Scholar] [CrossRef] [Green Version]
- Sari, D.P.; Laksana, P.J.B. Optimization Building Performance in Early Design Stage Using Integrated Dynam-Ic Model. Modul 2020, 20, 151–156. [Google Scholar] [CrossRef]
- Kimm, G. Actual and Experiential Shadow Origin Tagging: A 2.5D Algorithm for Efficient Precinct-Scale Modelling. Int. J. Archit. Comput. 2020, 18, 41–52. [Google Scholar] [CrossRef]
- Garreau, E.; Berthou, T.; Duplessis, B.; Partenay, V.; Marchio, D. Solar Shading and Multi-Zone Thermal Simulation: Parsimonious Modelling at Urban Scale. Energy Build. 2021, 249, 111176. [Google Scholar] [CrossRef]
- Dagher, S.; Akhozheya, B.; Slimani, H. Energy Analysis Studying the Effect of Solar Shading on Daylight Factors and Cooling Hours in an Extreme Weather. Energy Rep. 2022, 8, 443–448. [Google Scholar] [CrossRef]
- Wen, J.; Yang, S.; Xie, Y.; Yu, J.; Lin, B. A Fast Calculation Tool for Assessing the Shading Effect of Surrounding Buildings on Window Transmitted Solar Radiation Energy. Sustain. Cities Soc. 2022, 81, 103834. [Google Scholar] [CrossRef]
- Wen, J.; Xie, Y.; Yang, S.; Yu, J.; Lin, B. Study of Surrounding Buildings’ Shading Effect on Solar Radiation through Windows in Different Climates. Sustain. Cities Soc. 2022, 86, 104143. [Google Scholar] [CrossRef]
- Wang, X.; Zhang, X.; Zhu, S.; Ren, J.; Causone, F.; Ye, Y.; Jin, X.; Zhou, X.; Shi, X. A Novel and Efficient Method for Calculating Beam Shadows on Exterior Surfaces of Buildings in Dense Urban Contexts. Build. Environ. 2023, 229, 109937. [Google Scholar] [CrossRef]
- SalazarIi Trujillo, J.H. Solar Performance and Shadow Behaviour in Buildings. Case Study with Computer Modelling of a Building in Loranca, Spain. Build. Environ. 1998, 33, 117–130. [Google Scholar] [CrossRef]
- Carneiro, C.; Morello, E.; Desthieux, G.; Golay, F. Urban Environment Quality Indicators: Application to Solar Radiation and Morphological Analysis on Built Area. In Proceedings of the 3rd WSEAS International Conference on Visualization, Imaging and Simulation, Faro, Portugal, 3–5 November 2010; pp. 141–148. [Google Scholar]
- Grifoni, R.C.; Lapucci, D.; Petrucci, E.; Prenna, E. Method to Define a Solar Energy Platform for Historical City Centers and Identification of New Scenarios for Sustainability. In Proceedings of the IEEE 16th International Conference on Environment and Electrical Engineering (EEEIC), Florence, Italy, 7–10 June 2016. [Google Scholar]
- Kite, S. Shadow-Makers: A Cultural History of Shadows in Architecture; Bloomsbury Academic: London, UK, 2017. [Google Scholar]
- Valladares-Rendón, L.G.; Schmid, G.; Lo, S.L. Review on Energy Savings by Solar Control Techniques and Optimal Building Orientation for the Strategic Placement of Façade Shading Systems. In Energy and Buildings; Elsevier: Amsterdam, The Netherlands, 2017; pp. 458–479. [Google Scholar]
- Vartholomaios, A. A Parametric Sensitivity Analysis of the Influence of Urban Form on Domestic Energy Consumption for Heating and Cooling in a Mediterranean City. Sustain. Cities Soc. 2017, 28, 135–145. [Google Scholar] [CrossRef]
- Alagoz, M.; Beyhan, F. Methods to Discover the Optimum Building Envelope in the Context of Solar Data. Gazi Univ. J. Sci. 2020, 33, 318–340. [Google Scholar] [CrossRef]
- Kanters, J.; Gentile, N.; Bernardo, R. Planning for Solar Access in Sweden: Routines, Metrics, and Tools. Urban, Plan. Transp. Res. 2021, 9, 347–367. [Google Scholar] [CrossRef]
- Silva, A.P.D. Energy Efficiency of Buildings Located in the Municipality of Évora: A Case Study. Master’s Thesis, University of Évora, Évora, Portugal, 2009. Available online: http://hdl.handle.net/10174/13004 (accessed on 14 December 2022).
- Silva, J.J.C.; Henriques, P.M.C. Proposal for a New Methodology for Calculating the Shading Factor of Glazed Spans by Horizontal Elements. Construction Congress 2012, Ed.; University of Coimbra: Coimbra, Portugal, 2012; pp. 1–9. [Google Scholar]
- Lopes, A.B. Harmonised Methodology for Evaluating Thermal Behaviour and Energy Performance of Buildings: Study of Solar Gains; University of Coimbra: Coimbra, Portugal, 2016; Available online: http://hdl.handle.net/10316/38729 (accessed on 1 May 2023).
- Ferreira, S.F. Impact of the New Regulations on Energy Certification of Buildings, Superior Institute of Engineering, University of Algarve, Faro, Portugal. 2016. Available online: http://hdl.handle.net/10400.1/8448 (accessed on 3 April 2023).
- Costa, J.M.S. Evaluation of the Potential for Optimising the Thermo-Energetic Behaviour of Residential Buildings. Master’s Thesis, School of Engineering, University of Minho, Braga, Portugal, 2016. Available online: https://hdl.handle.net/1822/49816 (accessed on 4 June 2023).
- Da Carreira, R.F.C. Determination of Shading Factors Using 3D Models. Master’s Thesis, Energy and Environmental Engineering, Faculty of Sciences, University of Lisbon, Lisbon, Portugal, 2017. Available online: https://repositorio.ul.pt/handle/10451/32041 (accessed on 3 April 2023).
- Brito, M.C.; Redweik, P.; Catita, C.; Freitas, S.; Santos, M. 3D Solar Potential in the Urban Environment: A Case Study in Lisbon. Energies 2019, 12, 3457. [Google Scholar] [CrossRef] [Green Version]
- Silva, S.M. Sustainability and Comfort in Buildings. Ph.D. Thesis, Civil Engineering, University of Minho, Braga, Portugal, 2009. Available online: https://hdl.handle.net/1822/10245 (accessed on 5 April 2023).
- Fortunato, V.; Rato, V. Architectural Integration of Optimised Solar Shading. ISTAR-RN 2017, 15, 4–23. Available online: http://hdl.handle.net/10071/18144 (accessed on 5 April 2023).
- Cascone, Y.; Corrado, V.; Serra, V. Calculation Procedure of the Shading Factor under Complex Boundary Conditions. Sol. Energy 2011, 85, 2524–2539. [Google Scholar] [CrossRef]
- Decree-Law No 49/90 (RCCTE); Official Journal of the Republic No 31/1990, Series I of 6 February 1990: Portugal. 1990. Available online: https://dre.pt/dre/detalhe/diario-republica/31-1990-4394525 (accessed on 5 April 2023).
- Directive 2002/91/EC of the European Parliament and of the Council of 16 December 2002 (EPBD). 2002. Available online: https://eur-lex.europa.eu/legal-content/PT/TXT/?uri=celex%3A32002L0091 (accessed on 5 April 2023).
- Decree-Law No. 118/2013 (SCE, REH, RECS); Portugal. 2013, pp. 4988–5005. Available online: https://drehttps//dre.pt/application/conteudo/499237 (accessed on 5 April 2023).
- Letras, S.G.M. Nominal Energy Demand in Residential Buildings Comparison between the Methodologies of the RCCTE, REH and 5R1C Model. Master’s Thesis, University of Lisbon, Lisbon, Portugal, 2014. Available online: http://hdl.handle.net/10451/16107 (accessed on 5 April 2023).
- Sombrero. Available online: http://nesa1.uni-siegen.de/softlab/download/SOMBRERO_Manual.pdf (accessed on 5 April 2023).
- Shading Analysis. Available online: http://andrewmarsh.com/software/app-shading/ (accessed on 5 April 2023).
- ShadowFX—Sun and shadow analysis. Available online: http://www.shadowfx.com/ (accessed on 5 April 2023).
- TownScope. Available online: http://www.townscope.com/ (accessed on 5 April 2023).
- Sunhoursplugin. Available online: https://www.sunhoursplugin.com/ (accessed on 5 April 2023).
- Gosol. Available online: http://www.gosol.de/gosol-software.html (accessed on 5 April 2023).
- Analysis SOL-AR-Laboratório de Eficiência Energética em Edificações. Available online: https://labeee.ufsc.br/downloads/softwares/analysis-sol-ar (accessed on 5 April 2023).
- ArcGIS Spatial Analyst -Solar Analysis. Available online: https://www.esriuk.com/software/arcgis/extensions/spatialanalyst/key-features/solar (accessed on 5 April 2023).
- SunEye 210 Shade Tool. Available online: https://www.solmetric.com/buy210.html (accessed on 5 April 2023).
- Solar Pathfinder—Solar Site Analysis. Available online: https://www.solarpathfinder.com/ (accessed on 5 April 2023).
- Horicatcher -Meteonorm. Available online: https://meteonorm.com/en/product/horicatcher (accessed on 5 April 2023).
- Order (Extract) No. 15793-K/2013; Official Journal of the Republic No 234/2013, 3rd Supplement, Series II of 2013-12-03, Portugal. 2013, pp. 35088-(58)–35088-(87). Available online: https://dre.pt/dre/detalhe/despacho-extrato/15793-k-2013-2975224 (accessed on 5 April 2023).
- ENVI-Met. Available online: https://www.envi-met.com/pt-pt/estudantes/#analise-solar (accessed on 5 April 2023).
- Ladybug. Available online: https://www.ladybug.tools/ladybug.html (accessed on 5 April 2023).
- Order (Extract), No. 15793-E/2013; Official Journal of the Republic No 234/2013, 3rd Supplement, Series II de 2013-12-03, Portugal. Available online: https://dre.pt/dre/detalhe/despacho-extrato/15793-e-2013-2975218 (accessed on 5 April 2023).
- Cunha, M.M.F. Glazed Openings—Insolation Geometry—Optimisation of the Dimensioning of Solar Protection Elements; 2005. Available online: https://paginas.fe.up.pt/~vpfreita/mce04004_geometria_de_insolacao.pdf (accessed on 5 April 2023).
- Agency for Energy (ADENE). Available online: https://www.adene.pt/ (accessed on 14 May 2023).
- National Institute of Statistics (INE). Portugal 2021 Census. Available online: https://censos.ine.pt/xportal/xmain?xpgid=censos21_main&xpid=censos21&xlang=pt (accessed on 5 April 2023).
- Decree-Law, No. 38 382 (RGEU); The Journal of the Government n. 1951. Available online: https://dre.pt/dre/legislacao-consolidada/decreto-lei/1951-120610500-201155062 (accessed on 5 April 2023).
- Order (Extract) No. 15793-F/2013; Portugal. 2013, pp. 35088-(26)–35088-(31). Available online: https://dre.pt/dre/detalhe/despacho-extrato/15793-f-2013-2975219 (accessed on 5 April 2023).
- Coutinho, H.M.S. Relation between Urban Form and Solar Radiation on Buildings. Master’s Thesis, Civil and Environmental Engineering, Higher School of Technology and Management, Polytechnic Institute of Viana do Castelo, Viana do Castelo, Portugal, 2018. Available online: https://repositorio.ipvc.pt/handle/2 (accessed on 2 May 2023).
- Archicad—BIM. Available online: https://graphisoft.com/solutions/archicad#archicad (accessed on 15 May 2023).
- Grasshopper—Algorithmic Modeling for Rhino. Available online: https://www.grasshopper3d.com/ (accessed on 14 May 2023).
- Rhino 6 for Windows and Mac. Available online: https://www.rhino3d.com/ (accessed on 14 June 2020).
- Ouria, M. Solar Energy Potential According to Climatic and Geometrical Parameters of Cities and Buildings: A Case-Study from Tabriz City- Iran. Urban Clim. 2019, 28, 100469. [Google Scholar] [CrossRef]
- Elwy, I.; Ibrahim, Y.; Fahmy, M.; Mahdy, M. Outdoor Microclimatic Validation for Hybrid Simulation Workflow in Hot Arid Climates against ENVI-Met and Field Measurements. Energy Procedia 2018, 153, 29–34. [Google Scholar] [CrossRef]
- Kharvari, F. An Empirical Validation of Daylighting Tools: Assessing Radiance Parameters and Simulation Settings in Ladybug and Honeybee against Field Measurements. Sol. Energy 2020, 207, 1021–1036. [Google Scholar] [CrossRef]
- Forouzandeh, N.; Tahsildoost, M.; Zomorodian, Z.S. A Review of Web-Based Building Energy Analysis Applications. J. Clean. Prod. 2021, 306, 127251. [Google Scholar] [CrossRef]
- Merline, M.A.; Vimalathithan, R. Smart City: Issues and Research Challenges in Implementation. In Proceedings of the 2017 IEEE International Conference on Smart Grid and Smart Cities (ICSGSC), Singapore, 23–26 July 2017; IEEE: Piscataway, NJ, USA, 2017; pp. 263–266. [Google Scholar]
Figure 1.
Chronogram of Thermal Regulation Evolution in Portugal.

Figure 2.
Example of a horizon angle (images and table) (a), horizontal angle overhang (image and table) (b) and vertical (left and right overhang) (c). Values in the tables are for cooling station and in the heating season for Portugal mainland. Adapted from Ministry of Economy and Employment [63].


Table 1.
Shadow case studies.
| Context | Year | Case Study | Objective Topics |
|---|---|---|---|
| Global | 1984 | Ryerson [10] | Compares if computed shadows and shadows measured from aerial photography are reliable and accurate during the mapping procedure. |
| 1996 | Belakehal [11] | Maximises the shading on the facade by optimising its components, using experimental aesthetic facade components to control solar radiation as the energy-related function and the aesthetical expression of its design. | |
| 1996 | Al-Sallal [12] | Investigates the geometrical relationships between the building form and the sun’s location and motion at critical times of the year. | |
| 2000 | Belakehal [13] | Classifies optimal variants of the facade that can provide recommendations for a shading strategy optimisation according to solar orientation. | |
| 2003 | Capeluto [14] | The model allows for the generation of the building shape in a way that the building facades are self-shaded during a required period determined by the designer. | |
| 2004 | Bourbia [15] | Study indicates that street canyon orientation (and not only the H/W ratio) has a considerable effect on solar shading and urban microclimate. Solar access to streets can always be decreased by increasing H/W to larger values. | |
| 2010 | Chua [16] | Demonstrated how the design of shading devices and the selection of glazing type impact the cooling load of high-rise residential buildings. Comparing results from the model simulations, the half egg-crate louver was found to be the most suitable shading device for residential buildings facing the north and south orientations. | |
| 2011 | Hayman [17] | Study about solar access and overshadowing of public and private open space in urban areas as the density and the height of buildings increase. All methods of analysis require a knowledge of the relative position of the sun. | |
| 2014 | Grynning [18] | Solar shading systems are vital to reduce the cooling demand of an office, and the simulations show that the choice of shading strategy can have an impact on the energy. | |
| 2015 | Shukla [19] | Studies solar access and overshadowing of public and private open space in urban areas as the density and the height of buildings increase. Detect limited periods of the day and small differences between the real and nominal location that could result in a proposed development application being denied. | |
| 2015 | Aksamija [20] | Controls the physical environmental factors that must be considered during the design process. | |
| 2016 | Simón-Martín et al. [21] | Presentation of various methods of measuring diffuse solar irradiance; shadowing devices are some of the most commonly used in solar research all over the world. | |
| 2017 | Lee et al. [22] | This study explores how the pattern and different characteristics are evaluated by varying facade shading types and considering their impact on daylighting metrics, with changes in the facade shading types, input parameters and azimuth orientations. | |
| 2020 | Sari [23] | During the early design stage, studies the process and the energy simulation, combining parametric software (Climate Consultant, Rhino/Grasshopper, Honeybee, Ladybug and DIVA) allowing more accuracy to allow a better energy analysis (solar, shade, etc.). | |
| 2020 | Kimm [24] | Study that describes in detail the algorithm which builds on precedents for 2.5D raster calculation of shadows. | |
| 2021 | Garreau [25] | Finds a compromise between the available data, the different modelling, thermal zoning models and solar shading models that analyse data using the same methodology, assessing the modelling parsimony. | |
| 2022 | Dagher [26] | Makes use of shadows to minimise solar transmission and heat gains in extreme weather. A study to reduce solar gains that can be an appropriate method to also improve thermal comfort without compromising the daylight factor. | |
| 2022 | Wen et al. [27] | Understands how buildings can be arranged to maximise the beneficial effect of shading in summer while minimising its adverse effect in winter would support the energy efficiency of urban buildings in different climate conditions (studies in China). | |
| 2022 | Wen et al. [28] | Studies how the different designs of surrounding buildings affect the window-transmitted solar radiation energy (WTSRE) of the target building by performing a parametric study using EnergyPlus and proposes a method that can rapidly assess the shading effect of surrounding buildings at the design stage based on the databases obtained from the parametric study. | |
| 2023 | Wang et al. [29] | Using the existing neighbourhood judgement criterion, shadow calculation methods evaluate its effectiveness in two case studies. Both calculations are accurate and effective and improved when the proposed criterion was integrated. | |
| European | 1998 | Trujillo [30] | Evaluates methods to calculate building performance under direct solar radiation and the energetic benefit when two different alternatives of solar protection are applied. |
| 2010 | Carneiro, C. et al. [31] | Studies urban environment quality (UEQ) using different techniques and proposes a correct definition of indicators (solar, shadow, etc.) related to urban developments. | |
| 2016 | Grifoni, R.C. et al. [32] | A case study that begins by estimating solar radiation and then evaluates useful parameters, such as the sky view factor and shadows. | |
| 2017 | Kite [33] | Chronological framework that reveals the key places and moments where shadows shape architecture in different and dynamic ways. | |
| 2017 | Valladares-Rendón et al. [34] | The aim of this research is to establish and recommend the most effective and balanced solutions to decrease insolation and increase energy savings while balancing daylighting and visibility. Four main classes were reviewed: facade self-shading, shading devices, window-to-wall ratio and building orientation. | |
| 2017 | Vartholomaios [35] | Studies strategies of high urban compactness and passive solar design and the synergy that can be achieved at different urban densities. | |
| 2020 | Alagoz and MBeyhan [36] | Lists advantages and disadvantages of different methods aimed to reach an optimum solution by considering the potential to create shadows on the building. | |
| 2021 | Kanters [37] | A study of urban planners working in Swedish municipalities that identifies a baseline, gaps and needs of solar-shadow-energy analysis. | |
| Portuguese | 2009 | Silva [38] | Study of the thermal behaviour of a building “case”, subject to different situations, including different orientations, different types of window shading and other components with impact. |
| 2012 | Silva and Henriques [39] | Studies a new methodology for calculating the shading factor, namely the shading factor for horizontal elements. | |
| 2016 | Lopes [40] | Lists comparative studies of the four calculation methodologies to have a better understanding of the methodological differences. | |
| 2016 | Ferreira [41] | Analyses the differences between the current regulations provided for houses (REH) and the previous regulations (RCCTE) to study what the main changes are in the calculation methodology and energy performance rating. | |
| 2016 | Costa [42] | Evaluates in what way the parameters related to the assessment of heat-energetic performance influence their own performance. | |
| 2017 | Carreira [43] | Explores procedures to estimate the shadow factor, comparing methods provided in the Portuguese regulation and evaluating their accuracy. | |
| 2019 | Brito, M. et al. [44] | Studies the difficulties in assessing solar potential in urban areas: contiguous or neighbouring buildings not included in the study area cast shadows on the studied buildings; thus, for a large study area, a mosaic of areas with a significant overlap is required to avoid overestimation of incident irradiation. |
Table 2.
Selection of different shadow calculation methods available on the market (adapted: Carreira [43]).
Table 2.
Selection of different shadow calculation methods available on the market (adapted: Carreira [43]).
| Method/Software | Calculation | Advantages | Disadvantages |
|---|---|---|---|
| Calculation Typology—CAD (computer-aided design) | |||
| SOMBRERO [52] | Geometric coefficient of shadow | Low cost User friendly | Does not calculate Fs, by default (quantifies shadow on object) |
| SHADING [53] | Geometric coefficient of shadow | Low cost User friendly | Does not calculate Fs, by default (quantifies shadow on object) |
| ShadowFX [54] | Geometric coefficient of shadow | Low cost User friendly | Does not calculate Fs, by default (quantifies shadow on object) |
| TownScope [55] | Radiation maps and shadow duration | Calculates several parameters in a single simulation | Implementation of auxiliary routines to obtain Fs |
| Sunhours [56] | Shading factor (complementary) | Easy building (Sketchup extension) | Does not calculate Fs, by definition (refers to shading loss) |
| Calculation Typology—MDE (digital elevation models) | |||
| GOSOL [57] | Shadow map Sun diagrams | Allows the importation of CAD models | Use an MDT Needs routine calculation for Fs Existence of auto-shaded spots |
| SOL [58] | Shadow map and global direct and diffuse radiation | Uses multidimensional scaling data (MDS) (obstructions already represented) | Lacks Fs calculation routine Existence of auto-shaded spots |
| Solar Analyst [59] | Sun diagrams, shadow map and global direct and diffuse radiation | Uses MDS An extension of ArcGis | Needs the algorithm for calculating Fs Non-existence of auto-shaded spots |
| On-site obstruction recording devices | |||
| SunEye 210 Shade Tool [60] | Sun diagrams | Portability Easy to use Adaptability | High cost Lacks algorithm for calculating Fs |
| Solar Pathfinder [61] | Sun path diagram | It can be used any time of the day or the year, in either cloudy or clear weather | Works on a reflective principle rather than actually showing shadows |
| HORIcatcher [62] | Sun diagrams | Easy and fast tool Supplied with a digital camera | Lacks algorithm for calculating Fs |
| The methodologies defined in Portuguese law | |||
| Calculation methodologies [63] | Shading factor | Calculation of Fs, as a function of the specific angles of obstruction and orientation | Requires auxiliary tool to calculate the obstruction angles Time-consuming process |
| Simplification rules [63] | Shading factor | Easy application Fast No auxiliary tools needed | May prove inaccurate by including only 3 shading classes Local analysis |
| Other combined methods | |||
| Envi-met [64] | Shadow casting Reflection analysis | Calculates several parameters in a single simulation | High cost |
| Ladybug [65] | Shadow map Sun path diagram Sun diagrams Global direct and diffuse radiation | Free Calculates several parameters in a single simulation A plugin for Rhino and Revit Interaction with CAD and BIM | Not a stand-alone Needs a definition to calculate |
Table 3.
Shading schemes with identical α angles and distinct l’ distances and proposed angles by Silva and Henriques to be used in determining the shading factor for elements (dark grey represents total span shading and light grey represents the Partial shade of the span). Source: Silva and Henriques [39].
| Shading Schemes with Identical α Angles and Distinct l’ Distances | Shadow Masks South Facing Facade θ = 30° | Shadow Masks South Facing Facade, θ = 45° | Shadow Masks South Facing Facade, θ = 60° |
|---|---|---|---|
 |  |  |  |
 |  |  |  |
 |  |  |  |
 |  |  |  |
| Proposed angles by Silva and Henriques (2012) to be used in determining the shading factor | |||
 | |||
Table 4.
Solar and shadow study in different periods of the year in a block of the city of Viana do Castelo (our case study).
Table 4.
Solar and shadow study in different periods of the year in a block of the city of Viana do Castelo (our case study).
| Periods of the Year That Must be Taken into Account when Calculating Shading | ||||
|---|---|---|---|---|
 Figure Adopted from The National Weather Service (NWS) | ||||
| Hours | Autumnal Equinox | Winter Solstice | Vernal Equinox | Summer Solstice |
| 12 h–13 h |  |  |  |  |
| 14 h–15 h |  |  |  |  |
| 16 h–17 h |  |  |  |  |
| 18 h–19 h |  |  |  |  |
| Sun hours of each day | ||||
 |  |  |  |  |
Disclaimer/Publisher’s Note: The statements, opinions and data contained in all publications are solely those of the individual author(s) and contributor(s) and not of MDPI and/or the editor(s). MDPI and/or the editor(s) disclaim responsibility for any injury to people or property resulting from any ideas, methods, instructions or products referred to in the content. |
© 2023 by the authors. Licensee MDPI, Basel, Switzerland. This article is an open access article distributed under the terms and conditions of the Creative Commons Attribution (CC BY) license (https://creativecommons.org/licenses/by/4.0/).
Share and Cite
MDPI and ACS Style
Oliveira, M.F.; Mendonça, P.; Tenpierik, M.; Santiago, P.; Silva, J.F.; Silva, L.T. Shading Calculation Methods and Regulation Simplifications—The Portuguese Case. Buildings 2023, 13, 1521. https://doi.org/10.3390/buildings13061521
AMA Style
Oliveira MF, Mendonça P, Tenpierik M, Santiago P, Silva JF, Silva LT. Shading Calculation Methods and Regulation Simplifications—The Portuguese Case. Buildings. 2023; 13(6):1521. https://doi.org/10.3390/buildings13061521
Chicago/Turabian StyleOliveira, Marta Fernandes, Paulo Mendonça, Martin Tenpierik, Pedro Santiago, José F. Silva, and Lígia Torres Silva. 2023. "Shading Calculation Methods and Regulation Simplifications—The Portuguese Case" Buildings 13, no. 6: 1521. https://doi.org/10.3390/buildings13061521
Note that from the first issue of 2016, this journal uses article numbers instead of page numbers. See further details here.