Article

Model Test of Surrounding Rock Temperature Field under Different Drainage Structures and Insulation Conditions in High Cold Tunnel

1
Shangqiu Institute of Technology, Shangqiu 476000, China
2
School of Highway, Chang’an University, Xi’an 710064, China
3
State Key Laboratory for Geomechanics and Deep Underground Engineering, China University of Mining and Technology, Xuzhou 221116, China
*
Author to whom correspondence should be addressed.
Buildings 2023, 13(6), 1503; https://doi.org/10.3390/buildings13061503
Submission received: 22 April 2023 / Revised: 31 May 2023 / Accepted: 8 June 2023 / Published: 10 June 2023
(This article belongs to the Special Issue Advances and Applications in Geotechnical and Structural Engineering)

Abstract

:
Improper layout of drainage structures and inadequate insulation measures in high-altitude cold areas have resulted in varying degrees of frost damage in numerous tunnels during operation. To address this issue and propose a viable drainage structure layout scheme, this paper analyzes and studies the temperature field distribution characteristics of the lower surrounding rock and drainage structure around high-altitude cold tunnels, as well as the layout of the central drainage ditch and anti-cold water leakage hole. Based on physical model test results of cold area tunnels, the distribution characteristics of the temperature field around the tunnel drainage structure under different insulation conditions are obtained, and a control equation of temperature change along the depth direction is proposed. By comparing and analyzing the differences in temperature field and water flow characteristics of drainage structures under different insulation methods, the setting conditions of different drainage structures are determined. Furthermore, the function relationship between the freezing depth of the lower surrounding rock of the tunnel arch and the air temperature inside the tunnel is established, and the curve of the on-site tunnel freezing depth change is predicted. This study provides valuable insights into the design and construction of drainage structures and insulation measures for high-altitude cold tunnels, ultimately contributing to the prevention of frost damage and ensuring safe and efficient tunnel operation.

1. Introduction

With the large-scale development of western construction, the tunnels built in the region are no longer sufficient to meet the needs of regional development. As a result, tunnels are gradually extending to high-latitude, high-altitude, and harsh cold areas with extremely difficult natural conditions [1,2]. Building tunnels in high-altitude areas presents more complex climate conditions, geological conditions, and technical problems [3,4]. Moreover, it is crucial to consider the impact of severe cold weather on the frost resistance of the tunnel entrance structure and drainage facilities, as well as the safety of tunnel operation during the operation period. Among these challenges, a series of high-altitude problems such as tunnel drainage freezing and drainage pipeline frost heave in cold regions are significant factors causing tunnel diseases [5].
Insulation measures for tunnels in cold regions are of utmost importance as they can prevent structural freezing, cracking, and deformation, which can ultimately affect the safety and service life of the tunnel. To address this issue, foreign scholars have conducted extensive research on insulation measures for tunnels in cold regions. For instance, Wang [6] proposed a composite insulation lining that boasts better mechanical performance and insulation effect. Additionally, Wang proposed a fast construction method for insulation lining, which effectively suppresses icing and avoids frost damage. Gao et al. (2022) suggested a tunnel air curtain insulation system that uses solar power generation [7]. This system intelligently controls the operation group, jet angle, and speed of the air curtain based on parameters such as indoor temperature and wind speed to prevent cold intrusion into the tunnel and maintain a temperature above 0 °C inside the tunnel. Ma et al. (2018) established a numerical thermal-humidity coupling model for seasonal frozen zone tunnels, analyzed the influence of insulation effect and insulation layer position on thermal state, and constructed a method for thermal conductivity and thickness of insulation layer, thereby obtaining the relationship between insulation effect, thermal conductivity, and thickness [8]. Cui et al. (2021) designed a new type of external insulation lining to prevent severe frost damage to high-speed railway tunnels in cold regions [9]. This lining not only prevents block falling and water intrusion in cold region tunnels but also extends the durability and effectiveness of insulation materials. The quality of tunnel insulation measures directly affects the service life and safety performance of the tunnel. Therefore, it is necessary to adopt scientific and reasonable insulation measures to ensure the normal operation of the tunnel. As such, how to implement effective insulation measures for tunnels in cold regions is a critical issue in the construction process of the tunnel.
During the construction of tunnels in cold regions, the harsh weather conditions in the tunnel site area and the inadequate setting of drainage facilities can lead to frost damage problems in about 80% of tunnels in cold regions, which can affect the normal operation of the tunnel. In severe cases, it can cause major traffic accidents and pose significant challenges for later maintenance and prevention [10,11]. Traditional leakage blocking and lining damage treatment techniques are no longer sufficient, and new research on drainage structures is necessary [12]. To address this issue, Zhou et al. (2022) studied the optimization design of the central drainage ditch burial depth for highway tunnels in seasonal freezing areas through numerical simulation and established a transient heat transfer model involving heat conduction and phase change [13]. Zhu (2021) used MIDAS/GTS to model a tunnel in a cold region and determined the appropriate burial depth for the anti-freezing drainage tunnel based on the mechanical properties and deformation changes in tunnels in cold regions [14]. Liu et al. (2011) analyzed the causes of disease in the Osaka Mountain Tunnel and introduced the basic principles, ideas, and specific measures for the treatment of diseases such as leakage, insulation, and lining reinforcement in the Osaka Mountain high-altitude tunnel. Liu also analyzed the application of the current Chinese drainage tunnel system and conducted numerical simulations to propose an optimal drainage tunnel location determination method for landslide prevention [15]. Luo et al. (2012) proposed a structural form using a composite lining and a freezing-prevention measure with a central ditch, deep central ditch, thermal protection layer, and drainage hole chamber according to the degree of frost damage [16]. Fu et al. (2022) analyzed the degradation of analytical solutions using the Taylor equation and series expansion theorem based on theoretical analysis and derived a calculation expression for the tunnel water inflow rate involving blocking parameters by considering on-site tests during tunnel construction [17]. Zing and Anagnostou (2018) considered the seepage force acting on the ground near the tunnel working face and quantitatively analyzed the influence of hydraulic heterogeneity and advanced drainage through limit equilibrium calculations [18]. Yi and Jimenez (2021) used numerical models of shallow tunnels with different support pressure values to study the relationship between surface subsidence caused by advanced drainage wells at the tunnel working face and tunnel face stability [19]. The research results of the above scholars fully demonstrate that waterproofing is the foundation, drainage is the core, and anti-freezing is the key for tunnels in high-altitude regions [16].
However, current research on insulation and drainage for tunnels in cold regions primarily focuses on theoretical and numerical analysis. Due to the challenges in conducting on-site testing of the temperature around the surrounding rock and drainage structures in the lower part of the tunnel in cold regions, such as the difficulty in burying temperature sensors, there are limited on-site testing experiments and insufficient results. Therefore, this article conducted indoor model experiments to simulate drainage tests for tunnels under no insulation and arch insulation conditions. The study investigated the axial and radial temperature distribution around the surrounding rock and drainage structures in the lower part of the tunnel in high-altitude cold regions. The research results are of significant importance for understanding the temperature distribution around the surrounding rock and drainage structures in the lower part of the tunnel. They provide valuable reference and guidance for tunnel engineering design.

2. Introduction to Model Experiments

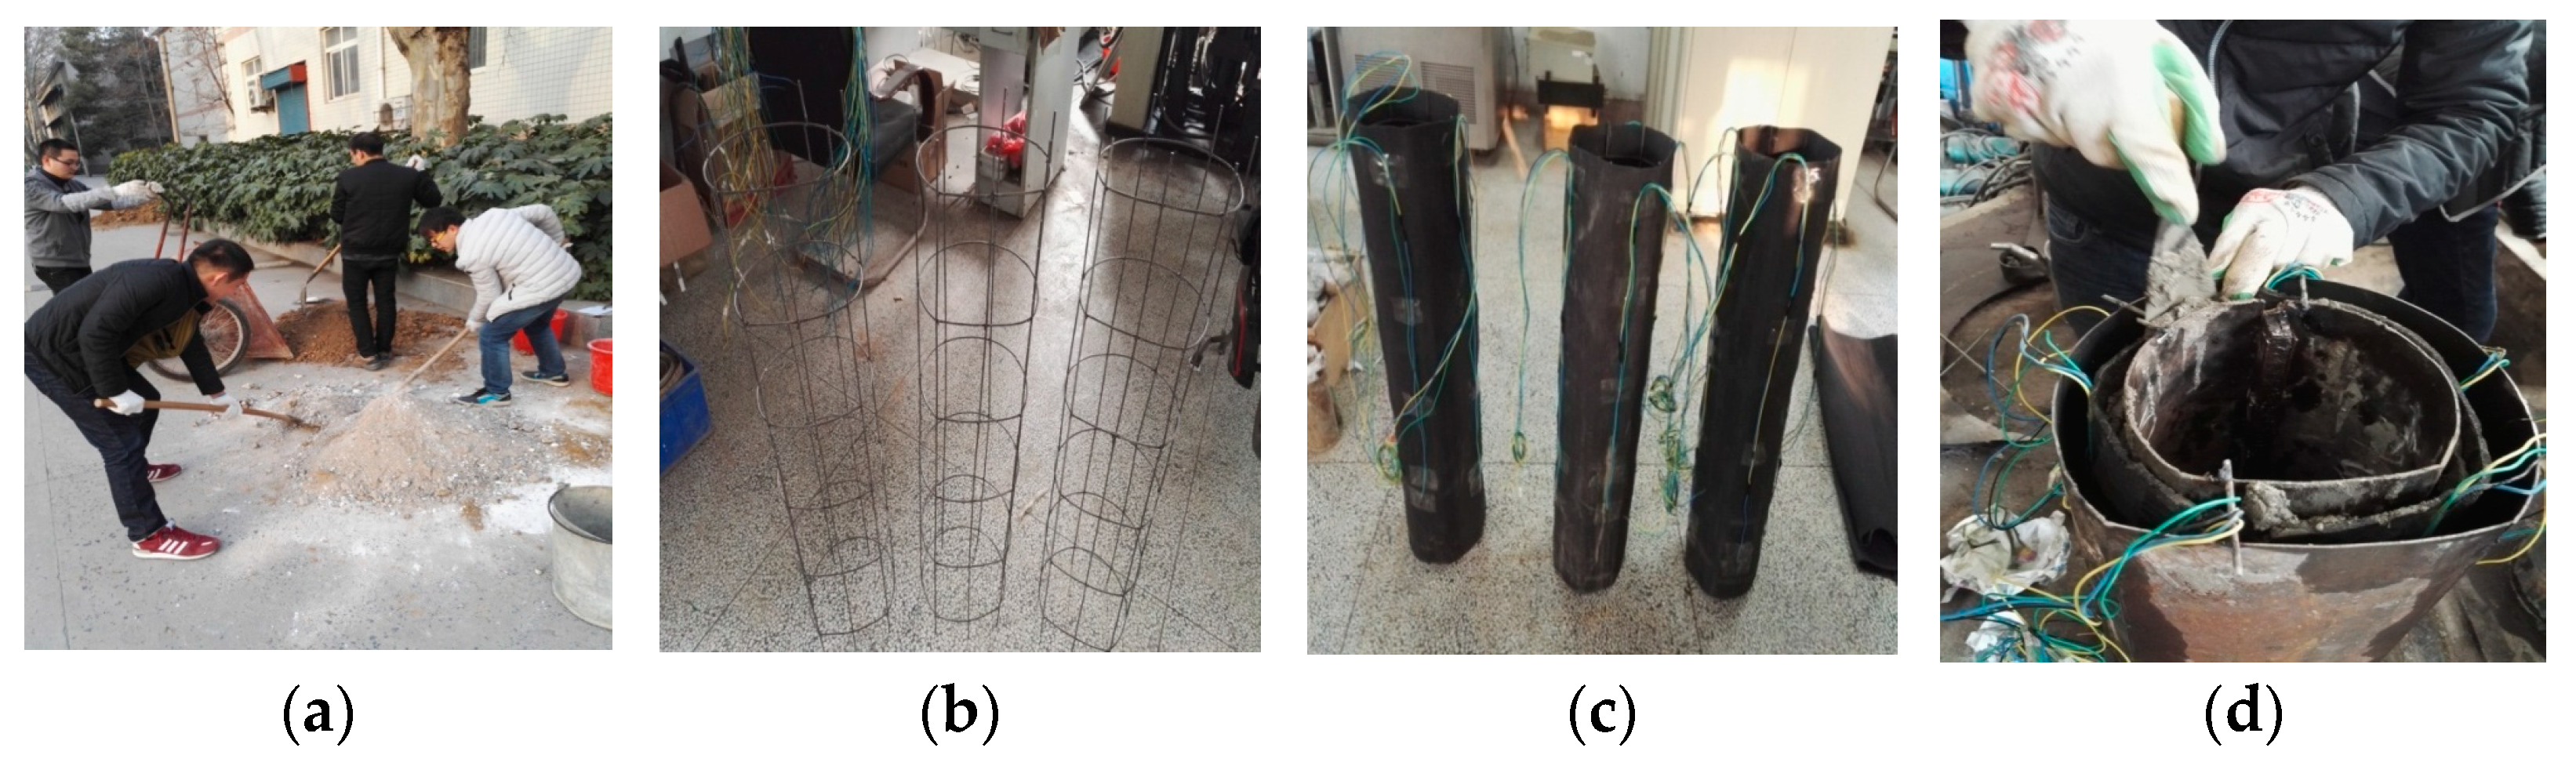
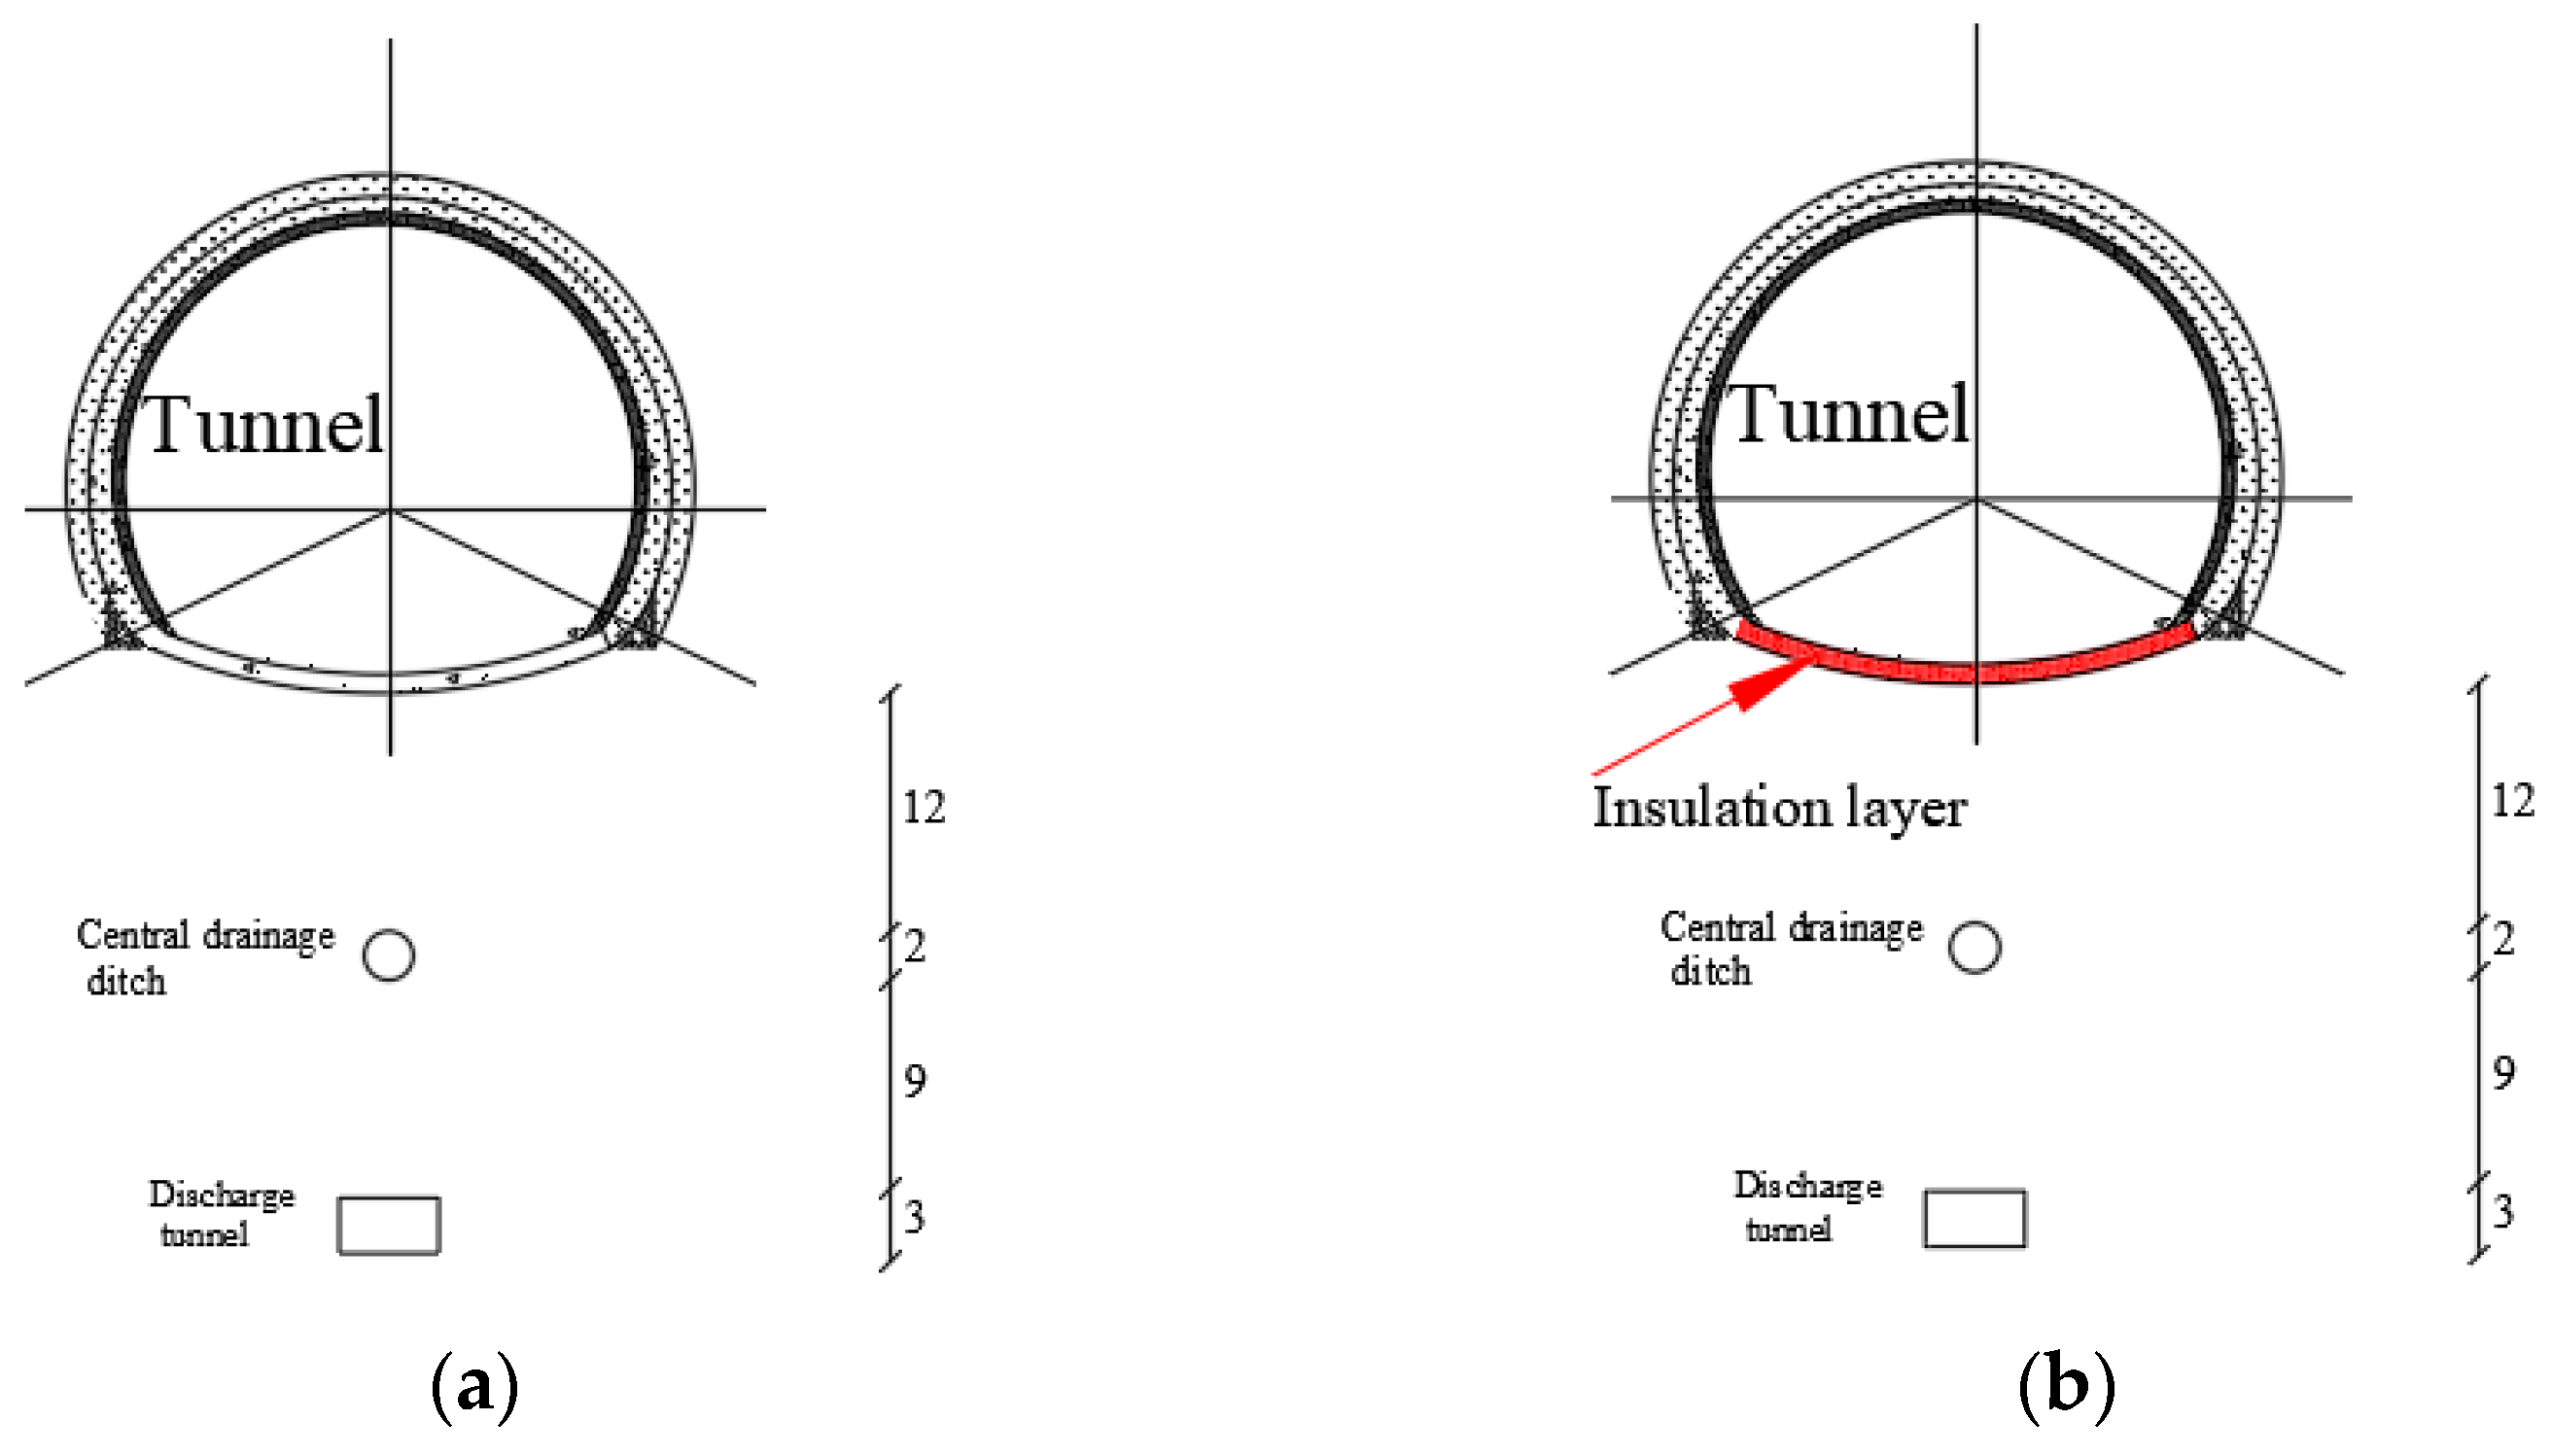
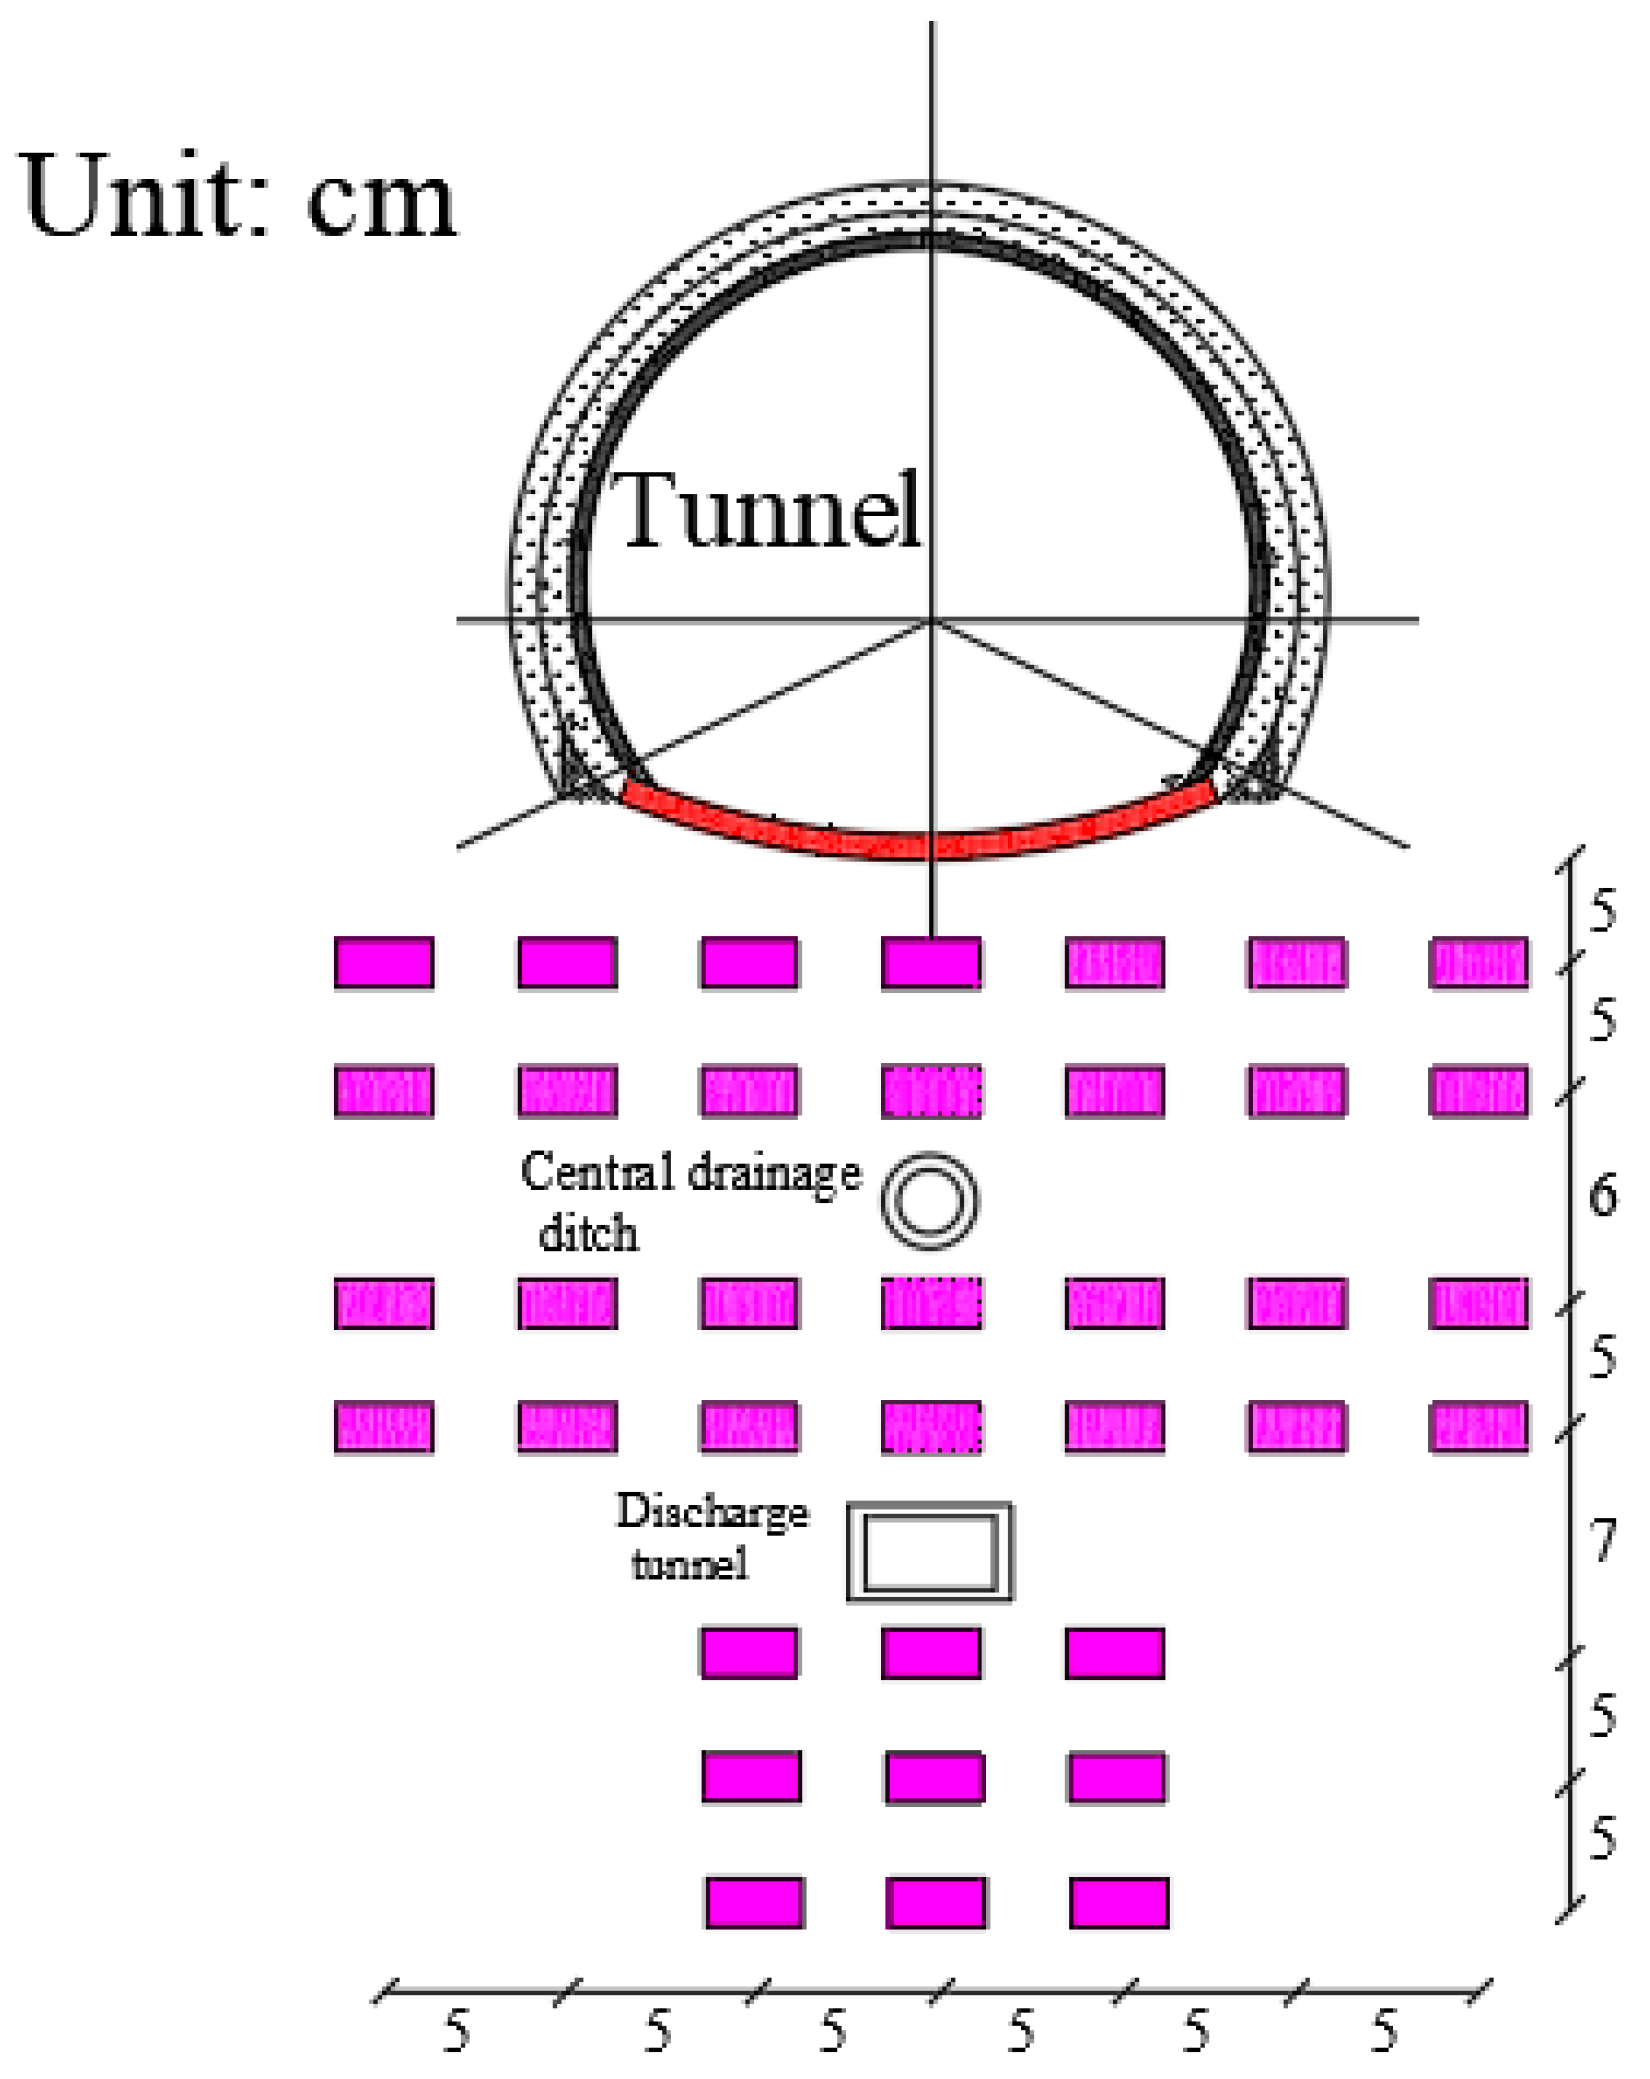
2.1. Model Test Design

The main method employed in this article is based on high-altitude and cold area tunnels that have already been constructed and opened to traffic. The study utilizes similarity theory to scale down the tunnel prototype, and a frozen soil model test cooling system is employed to cool the model tunnel and simulate the freezing conditions of the tunnel during the cold season. An external fan is used to simulate tunnel ventilation, and the wind speed at different cross-sectional positions inside the tunnel is measured in real-time using a wind speed sensor. The temperature inside the tunnel, lining temperature, upper surrounding rock temperature, and lower arch surrounding rock temperature are tested, and the temperature distribution law of the tunnel temperature field is compared and analyzed to determine the tunnel insulation method, as well as the insulation form of the tunnel drainage type and drainage structure.
The model test method is primarily based on similarity theory and dimensional analysis [20]. The original prototype is downscaled by a specific ratio to obtain a similar model, which is then tested under specific conditions. The experimental data collected through the model test are processed and analyzed, and the results are upscaled to the original prototype based on established similarity relationships to obtain data and results under prototype conditions.
To meet the on-site working conditions, the tunnel model must satisfy geometric similarity, time and temperature similarity, and similarity in thermal conductivity and specific heat capacity. The specific similarity criteria can be referred to the research method of Lai et al. (2018) [21].
Considering factors such as test feasibility and limitations, a final geometric scale ratio of 1:24 was determined for the entire length of the 3020 m tunnel prototype. When conducting scaled model tests for tunnel structures with a relatively large aspect ratio, variable rate models are necessary. The lengthwise variable scale ratio of the tunnel model was set at 41.94, and the resulting length of the scaled tunnel model was 125.84 m.
Taking into account the limitations of the test site conditions and the practicalities of the experiment, a scale ratio of 1:24 was determined for the burial depth of the drainage structures. As a result, the center drainage ditch was reduced to a depth of 12 cm, and the antifreeze drainage hole was reduced to a depth of 19 cm. Additionally, the pipe diameter for the center drainage ditch was set at 2.0 cm.

2.2. Proportioning of Test Materials

The final mix ratio of the lining concrete was determined to be: water:cement:sand:stone = 0.38:1:1.11:2.72, with a thermal conductivity coefficient of 2.410 W/m·K, which is approximately equal to the thermal conductivity coefficient of the model standard C25 concrete, which is 2.461 W/m·K.
The material mix ratio of the surrounding rock is: water:sand:lime:stone:soil = 0.35:1.5:0.2:0.6:2.0, and the thermal conductivity coefficient is taken as the average value of the thermal conductivity coefficients of different types of rocks used, which is 2.64 W/m·K.

2.3. Model Test Design Scheme

The thermal conductivity coefficient of the surrounding rock material in the tunnel model is similar to that of the surrounding rock in the actual tunnel. Reasonable material mix ratios were obtained through proportioning tests, and various materials were mixed uniformly according to the proportioning test results. After the mold was made, the model was poured. To prevent the model hill from being too heavy, the concrete strength grade can be appropriately increased, and C30 grade concrete can be used. The on-site pouring process is shown in Figure 1. The production of the tunnel model follows the research plan of Liu et al. (2015) [22].
In the experiment, PVC pipes were utilized to represent the central drainage ditch and the cold-proof drainage hole, which were connected by an 8 mm hose. An 8 mm hose was used to connect the two. A water tank was positioned at a certain distance above the top of the tunnel, and the outlet of the water tank was connected to the PVC pipe. A drainage valve was installed on the PVC pipe to regulate the water flow by adjusting the valve. Figure 2 illustrates the layout of the drainage system.
The drainage test is divided into two working conditions. Working condition 1 is the temperature field and water flow rate test of the tunnel drainage structure without insulation, and working condition 2 is the temperature field and water flow rate test of the tunnel drainage structure with insulation on the arch. The specific insulation conditions are shown in Figure 3.
Layout of temperature sensors, central drainage ditches, and anticold drainage tunnels.
The settings of temperature sensors and drainage structures are shown in Figure 4 and Figure 5.
From the cross-sectional and longitudinal layout diagram of the temperature sensor, the temperature sensors are arranged in a cross-sectional manner. The distance from the central drainage ditch to the arch is defined as 1, and the depth of other measuring points is defined as a multiple of the depth of the central drainage ditch. Therefore, the depths of the measuring points at different depths are 5/13 times, 10/13 times, 16/13 times, 21/13 times, 28/13 times, 33/13 times, and 38/13 times the depth of the central drainage ditch.
The longitudinal temperature sensors are arranged by defining the full length of the model tunnel as 1. The different depths of the cross-section are expressed as a percentage of the full length of the tunnel. For example, at a depth of 5 cm, it is represented as 1/60 of the full length of the tunnel. The same representation method is used for other cross-sectional positions.

3. Experimental Results and Analysis

3.1. Analysis of Drainage Test Results in Tunnel without Insulation

We analyzed the transverse and axial distribution of the temperature field around the lower surrounding rock and drainage structure of a tunnel without insulation conditions, and studied the water flow rate and flow velocity characteristics of the drainage structure.

3.1.1. Temperature Distribution Characteristics around Drainage Structures of Each Tunnel Cross Section

According to the temperature change curve presented in Figure 6, it is evident that during the freezing process, the temperature trend is not uniform at a distance of 1/60 of the tunnel length from the outside entrance of the tunnel. Specifically, at the position where the depth of the central drainage ditch is 5/13 to 10/13 times the tunnel depth, the temperature values of each measuring point decreased rapidly in the initial stage of freezing. Before the freezing time reached 50 h, the temperature continued to decrease significantly, with a high rate of temperature drop. Although the temperature value continued to decrease after 50 h of freezing time, the magnitude and rate of temperature change slowed down until the temperature tended to be stable.
At the position where the depth of the central drainage ditch is 16/13 to 21/13 times the tunnel depth, the temperature change lags behind. Within the range of 0–20 h of freezing time, the temperature slowly decreases with the increase in freezing time. At 20 h, the temperature value changes significantly, and with the increase in freezing time, the temperature decreases rapidly. When the freezing time reaches 60 h, the temperature slowly decreases and gradually tends to be stable.
At the position where the depth of the central drainage ditch is 28/13 to 38/13 times the tunnel depth, the lag phenomenon of temperature change is even more pronounced. In the early stages of freezing, the temperature change curve is flatter. After the freezing time reaches 35 h, the temperature amplitude changes significantly, and the temperature decreases rapidly with the increase in freezing time. Both the magnitude and rate of temperature change increase sharply. After 65 h, the temperature value gradually changes smoothly and tends to be stable.
At the location where the depth of the central drainage ditch is 5/13 times the tunnel depth, it is situated closest to the cold air flow and is significantly impacted by the external air environment. As a result, the temperature decreases rapidly, and with an increase in depth, the temperature value gradually weakens due to the influence of external cold air, causing a lag in temperature change.
Based on the data presented in Figure 7, it can be observed that the maximum temperature difference between each measuring point at the same depth position in the tunnel cross-section is approximately 1.7 °C, occurring at depths of 10/13 and 16/13 times the central drainage ditch. This observation was made at a distance of 1/60 of the tunnel length outside of the tunnel entrance.
Moreover, it can be concluded that the influence of external environmental temperature changes on rock and soil decreases gradually as the depth increases, starting from the tunnel arch position. The shallow soil layer is more sensitive to external atmospheric temperature changes and is significantly affected by them. Consequently, temperature values of each measuring point gradually increase with increasing depth.
There is a negative temperature distribution in the range of approximately 17/13 times the central drainage ditch depth to the arch depth. There is also a negative temperature distribution around the central drainage ditch, with the lowest temperature being approximately −1.2 °C, and the maximum temperature difference being 0.6 °C. On the other hand, the area surrounding the anti-freezing drainage hole displays a positive temperature distribution, with a temperature range between 1.6 °C and 3.0 °C. The lowest temperature is 1.6 °C, and the maximum temperature difference is approximately 1.4 °C.
The centerline position of the tunnel exhibits the minimum temperature of the surrounding rock at the bottom of the tunnel. The lowest temperature of −2.0 °C is observed at a depth of 5/13 times the central drainage ditch, while the minimum temperature value at a depth of 38/13 times the central drainage ditch is 4.8 °C. With an increase in depth, the minimum temperature of the surrounding rock at the bottom of the tunnel gradually increases at the same depth position. Furthermore, as the depth increases, the temperature at each position tends to be more positive. This trend is more pronounced at greater depths.
The curve in the figure indicates that, although the temperature at different depths exhibits a lag phenomenon with changes in freezing time, the timing of this phenomenon varies. The lag phenomenon becomes more pronounced at greater depths, resulting in longer lag times for the freezing temperature. Table 1 presents the time at which the lag phenomenon occurs for each depth.

3.1.2. Temperature Distribution Characteristics around the Tunnel Axial Drainage Structure

Figure 8a–g depict the temperature change curves at different depths of the central drainage ditch, which are 5/13, 10/13, 16/13, 21/13, 28/13, 33/13, and 38/13 times the depth of the central drainage ditch. As evident from the curve, the temperature is highest at a depth of 7/30 of the tunnel length and lowest at a depth of 1/60 of the tunnel length. The overall trend in temperature change shows a gradual decrease with the decrease in tunnel depth. However, due to the relatively large influence of cold air on the sensors near the tunnel entrance section and the significant exchange of cold and hot air, the temperature near the tunnel entrance is relatively low. As the tunnel depth decreases, the temperature of each measuring point in the lower surrounding rock at the same horizontal position gradually decreases. Despite this, the amplitude of temperature change is not significant, and the overall change is relatively gentle. For instance, taking the depth of the central drainage ditch at 5/13 times as an example, the temperature difference between two measuring points at different depths at a depth of 1/60 and 7/30 of the tunnel length is maintained between 1.3 °C and 1.8 °C. Additionally, the temperature value at a position 15 cm on both sides of the centerline of the tunnel is lower than that at the centerline position by about 0.4–0.6 °C.
By fitting the temperature change curves in Figure 8a–g, it is found that the temperature inside the tunnel varies with depth according to a quadratic polynomial T = B 1 x 2 + B 2 x + B 3 . The parameters of the fitting curves at different burial depths are shown in Table 2.
As shown in Figure 9a–g that the temperature change curves at different distances outside the tunnel entrance at depths of the central drainage ditch, which are 5/13, 10/13, 16/13, 21/13, 28/13, 33/13, and 38/13 times the depth of the central drainage ditch. As evident from the curve, the temperature is highest at a distance of 1/60 of the tunnel length from the tunnel entrance and gradually decreases as the distance from the tunnel entrance increases. The overall trend in temperature change shows a gradual decrease in temperature values with the increase in distance from the tunnel entrance. While the temperature of the lower surrounding rock gradually decreases as the distance from the tunnel entrance increases, the amplitude of temperature decrease is small. Compared to the temperature change inside the tunnel, the decrease is only slightly larger. For instance, taking the depth of the central drainage ditch at 5/13 times as an example, the temperature difference between measuring points at different depths at a distance of 1/60 and 1/12 of the tunnel length from the tunnel entrance is approximately between 1.1 °C and 1.5 °C. Moreover, the temperature value at the centerline position of the tunnel is the lowest, and the temperature gradually increases from the centerline position to both sides of the tunnel. The maximum temperature difference between the two sides of the tunnel and the centerline position is approximately between 1.4 °C and 1.8 °C.
As shown in Figure 10a,e that the temperature change trend along the axis at a position of 10 cm on both sides of the tunnel centerline is relatively consistent. From a depth of 7/30 of the tunnel length to the tunnel entrance section, the temperature values at different depths below the tunnel arch decrease as the tunnel depth decreases. The temperature value outside the tunnel at a distance of 1/12 of the tunnel length from the tunnel entrance is the lowest. Negative temperatures are observed around the central drainage ditch from a depth of 5–10 cm along the tunnel axis.
When the position is 5 cm away from the tunnel centerline along the axis, the temperature gradually decreases as the tunnel depth decreases from 7/30 of the tunnel length to 1/12 of the tunnel length outside the tunnel entrance. The highest temperature at the same position appears at a depth of 7/30 of the tunnel length, while the lowest temperature appears at 1/12 of the tunnel length outside the tunnel entrance. Negative temperatures exist around the central drainage ditch, but the distribution of negative temperatures is slightly different. All measurement points around the anti-freeze drainage hole indicate positive temperatures. Therefore, it can be concluded that the temperature gradually decreases from the inside to the outside of the tunnel as the depth decreases.
In other words, Figure 10b–d show that the temperature change trend along the axis is relatively consistent at a position 5 cm away from the centerline of the tunnel on both sides. As the tunnel depth decreases, the temperature gradually decreases from 7/30 of the tunnel length to 1/12 of the tunnel length outside the tunnel entrance. The highest temperature at this location appears at a depth of 7/30 of the tunnel length, while the lowest temperature appears at 1/12 of the tunnel length outside the tunnel entrance. Negative temperatures exist around the central drainage ditch, but the distribution of negative temperatures is slightly different. All measurement points around the anti-freeze drainage hole indicate positive temperatures. Therefore, it can be concluded that the temperature gradually decreases from the inside to the outside of the tunnel as the depth decreases.
In summary, below the arch, at different depths, except for a position of 15 cm on both sides of the centerline, most positions in the cross-section show that the temperature of each measuring point gradually increases along the longitudinal direction of the tunnel from outside to inside with the increase in depth, following a quadratic function of T = B 1 x 2 + B 2 x + B 3 , and the temperature change amplitude gradually decreases with the increase in tunnel depth.

3.2. Analysis of Drainage Test Results under Tunnel Invert Insulation Conditions

In this model test, the influence of setting insulation layer at the inverted arch position on the temperature around the tunnel portal drainage structure was studied, including the temperature distribution characteristics of the tunnel drainage structure at each cross-section position and in the axial direction.

3.2.1. Temperature Distribution Characteristics around Drainage Structures at Each Cross Section of Tunnel

In Figure 11a–g is the temperature curve with freezing time at the buried depth of the central drainage ditch 5/13, 10/13, 16/13, 21/13, 28/13, 33/13, and 38/13 times, respectively. Figure 12 shows the temperature contour map and vector map of the tunnel cross-section.
Based on the temperature change curve in Figure 11, the temperature change trend at the tunnel entrance during the tunnel freezing process varies with different depths. At a depth of 5/13 to 10/13 times the depth of the central drainage ditch, the temperature values of each measuring point rapidly decrease in the early stage of freezing. Before reaching 45 h of freezing time, the temperature continues to decrease with a high rate of temperature decrease and a large decrease amplitude. The temperature change inflection point occurs at 45 h of freezing time, and the slope of the temperature change curve changes from about −0.3 to −0.15. Although the temperature value continues to decrease with the increase in freezing time, the amplitude and rate of temperature change slow down until the temperature value tends to be stable. At a depth of 16/13 to 21/13 times the depth of the central drainage ditch, the temperature change lags behind. Within the range of 0–20 h of freezing time, the temperature slowly decreases with a relatively gentle temperature change rate of about −0.15. At 20 h, the temperature value changes significantly, and the slope of the temperature change curve changes from about −0.1 to about −0.3, with a rapid decrease in temperature with the increase in freezing time. When the freezing time reaches 60 h, the temperature change rate decreases to about 0.1 °C/h, and the temperature gradually tends to be stable. At a depth of 28/13 to 38/13 times the depth of the central drainage ditch, the lag phenomenon of temperature change is more obvious. In the early stage of freezing, the temperature change curve is flatter, and the temperature decrease rate is about 0.1 °C/h–0.15 °C/h. After 30 h of freezing time, the temperature amplitude changes significantly, and the temperature rapidly decreases with a sharp increase in the amplitude and rate of temperature change, with the temperature decrease rate increasing to about 0.3 °C/h–0.4 °C/h. After 60 h, the temperature value gradually changes smoothly and tends to be stable.
At a depth of 5/13 times the depth of the central drainage ditch, the distance from the cold air flow is the shortest, which makes it highly vulnerable to the external air environment. The temperature values of each measuring point decrease rapidly with external air temperature. As the depth increases, the impact of the external cold air weakens, which results in a lag in temperature change. At the beginning of freezing, the temperature changes gradually. However, with an increase in freezing time, the range of influence of the cold air expands, causing the temperature of the lower surrounding rock to drop rapidly.
By fitting the temperature freezing time variation curves at different burial depths, it can be seen that although there are differences in the temperature variation patterns at different burial depths, the overall temperature values vary according to the cubic polynomial T = C + B 1 t + B 2 t 2 + B 3 t 3 . The fitting results are shown in Table 3.
Based on Figure 12a,b, the temperature change pattern of the tunnel cross-section shows that at the same depth, the temperature values gradually increase from the centerline of the tunnel to the positions on both sides of the centerline. The temperature is the lowest at the centerline of the tunnel, and the maximum temperature difference between the two sides ranges between 1.5 °C to 2.0 °C.
The freezing environment temperature has a significant influence on the temperature of each measuring point at the shallow buried position below the arch. However, as the depth increases, the influence of atmospheric temperature changes on the temperature of each measuring point gradually weakens. The exchange of cold and hot air also decreases, resulting in an increase in temperature.
There is a negative temperature distribution zone in the range from the depth of 21/13 times the depth of the central drainage ditch to the depth of the arch. The area around the central drainage ditch has a negative temperature distribution ranging from about −0.7 °C to −1.1 °C, with a minimum temperature of about −1.1 °C. On the other hand, the area around the anti-freeze drainage hole has a positive temperature distribution, with a temperature change range of about 1.5 °C to 3.0 °C, a minimum temperature of about 1.5 °C, and a maximum temperature difference of about 1.5 °C.
At a depth of 5/13 times the depth of the central drainage ditch, the minimum temperature value is −1.5 °C, while at a depth of 38/13 times the depth of the central drainage ditch, the minimum temperature value is 5.1 °C. As the depth increases, the minimum temperature inside the lower surrounding rock of the tunnel gradually increases, resulting in a temperature difference of about 6.5 °C within the test area. Figure 13 shows the lag time plots under different burial depths.

3.2.2. Temperature Distribution Characteristics around Tunnel Axial Drainage Structure

In Figure 14a–g shows the temperature variation curves at different depths of the tunnel at 5/13, 10/13, 16/13, 21/13, 28/13, 33/13, and 38/13 times the burial depth of the central drainage ditch.
Based on the curve in Figure 14, the temperature at the tunnel entrance is the lowest, and as the tunnel depth increases, the temperature at each position gradually increases. Overall, the temperature change indicates a gradual increase with the increase in tunnel depth. Through data fitting, the temperature change along the depth direction approximately follows a cubic polynomial T = C + B 1 x + B 2 x 2 + B 3 x 3 . The temperature inside the lower surrounding rock of the tunnel gradually increases with the increase in tunnel depth, but the amplitude of temperature rise is relatively small. For instance, at a depth of 5/13 times the depth of the central drainage ditch, the rate of temperature increase along the tunnel depth gradually decreases. At a position 15 cm to the left of the centerline of the tunnel, the temperature of the lower surrounding rock of the tunnel increases by 0.4 °C/5 cm as the tunnel depth increases from 1/60 to 1/30 of the tunnel length, and increases by 0.1 °C/5 cm as the tunnel depth increases from 1/15 to 7/30 of the tunnel length, which is significantly smaller than before.
Figure 15 shows the contour and vector maps of longitudinal temperature changes at different positions on the tunnel cross-section.
Based on Figure 15a,e, the temperature variation trend along the axis at a position 10 cm to the left and right of the centerline of the tunnel is similar. From 7/30 of the tunnel length to the tunnel entrance, the temperature values at different depths below the tunnel arch decrease as the tunnel depth decreases. The temperature value reaches its lowest point at a position 1/12 of the tunnel length away from the tunnel entrance outside the tunnel. Negative temperatures start to appear around the central drainage ditch near the tunnel entrance.
Based on Figure 15b–d, the temperature variation trend along the axis at a position 5 cm to the left and right of the centerline of the tunnel is similar. From a depth of 7/30 of the tunnel length to a position 1/12 of the tunnel length away from the tunnel entrance outside the tunnel, the temperature decreases as the depth decreases. The highest temperature at the same position occurs at a tunnel depth of 7/30 of the tunnel length, and the lowest temperature occurs at a position 1/12 of the tunnel length away from the tunnel entrance outside the tunnel. Negative temperatures are distributed around the central drainage ditch at a position 5 cm to the left and right of the centerline of the tunnel; however, the distribution of negative temperatures is slightly different. There are no negative temperatures around the anti-freezing drainage holes, and the temperature at each measuring point is positive. The temperature variation trend indicates a gradual decrease from inside the tunnel to outside as the depth decreases.
To summarize, the temperature variation trend in the surrounding rock at different depths below the tunnel is consistent. At positions 5 cm, 10 cm, and 5 cm to the left and right of the centerline of the tunnel, the temperature of the surrounding rock gradually increases with the increase in tunnel depth. The temperature increase is more significant at smaller tunnel depths and decreases as the tunnel depth increases. Additionally, the longitudinal temperature variation curve of the tunnel follows a third-order polynomial T = C + B 1 x + B 2 x 2 + B 3 x 3 form. Insulating the tunnel arch results in a temperature increase in about 0.3 °C to 0.9 °C around the central drainage ditch compared to the non-insulated condition, causing significant changes in the temperature field. However, long-distance negative temperature zones still exist around the central drainage ditch.

4. Conclusions

(1)
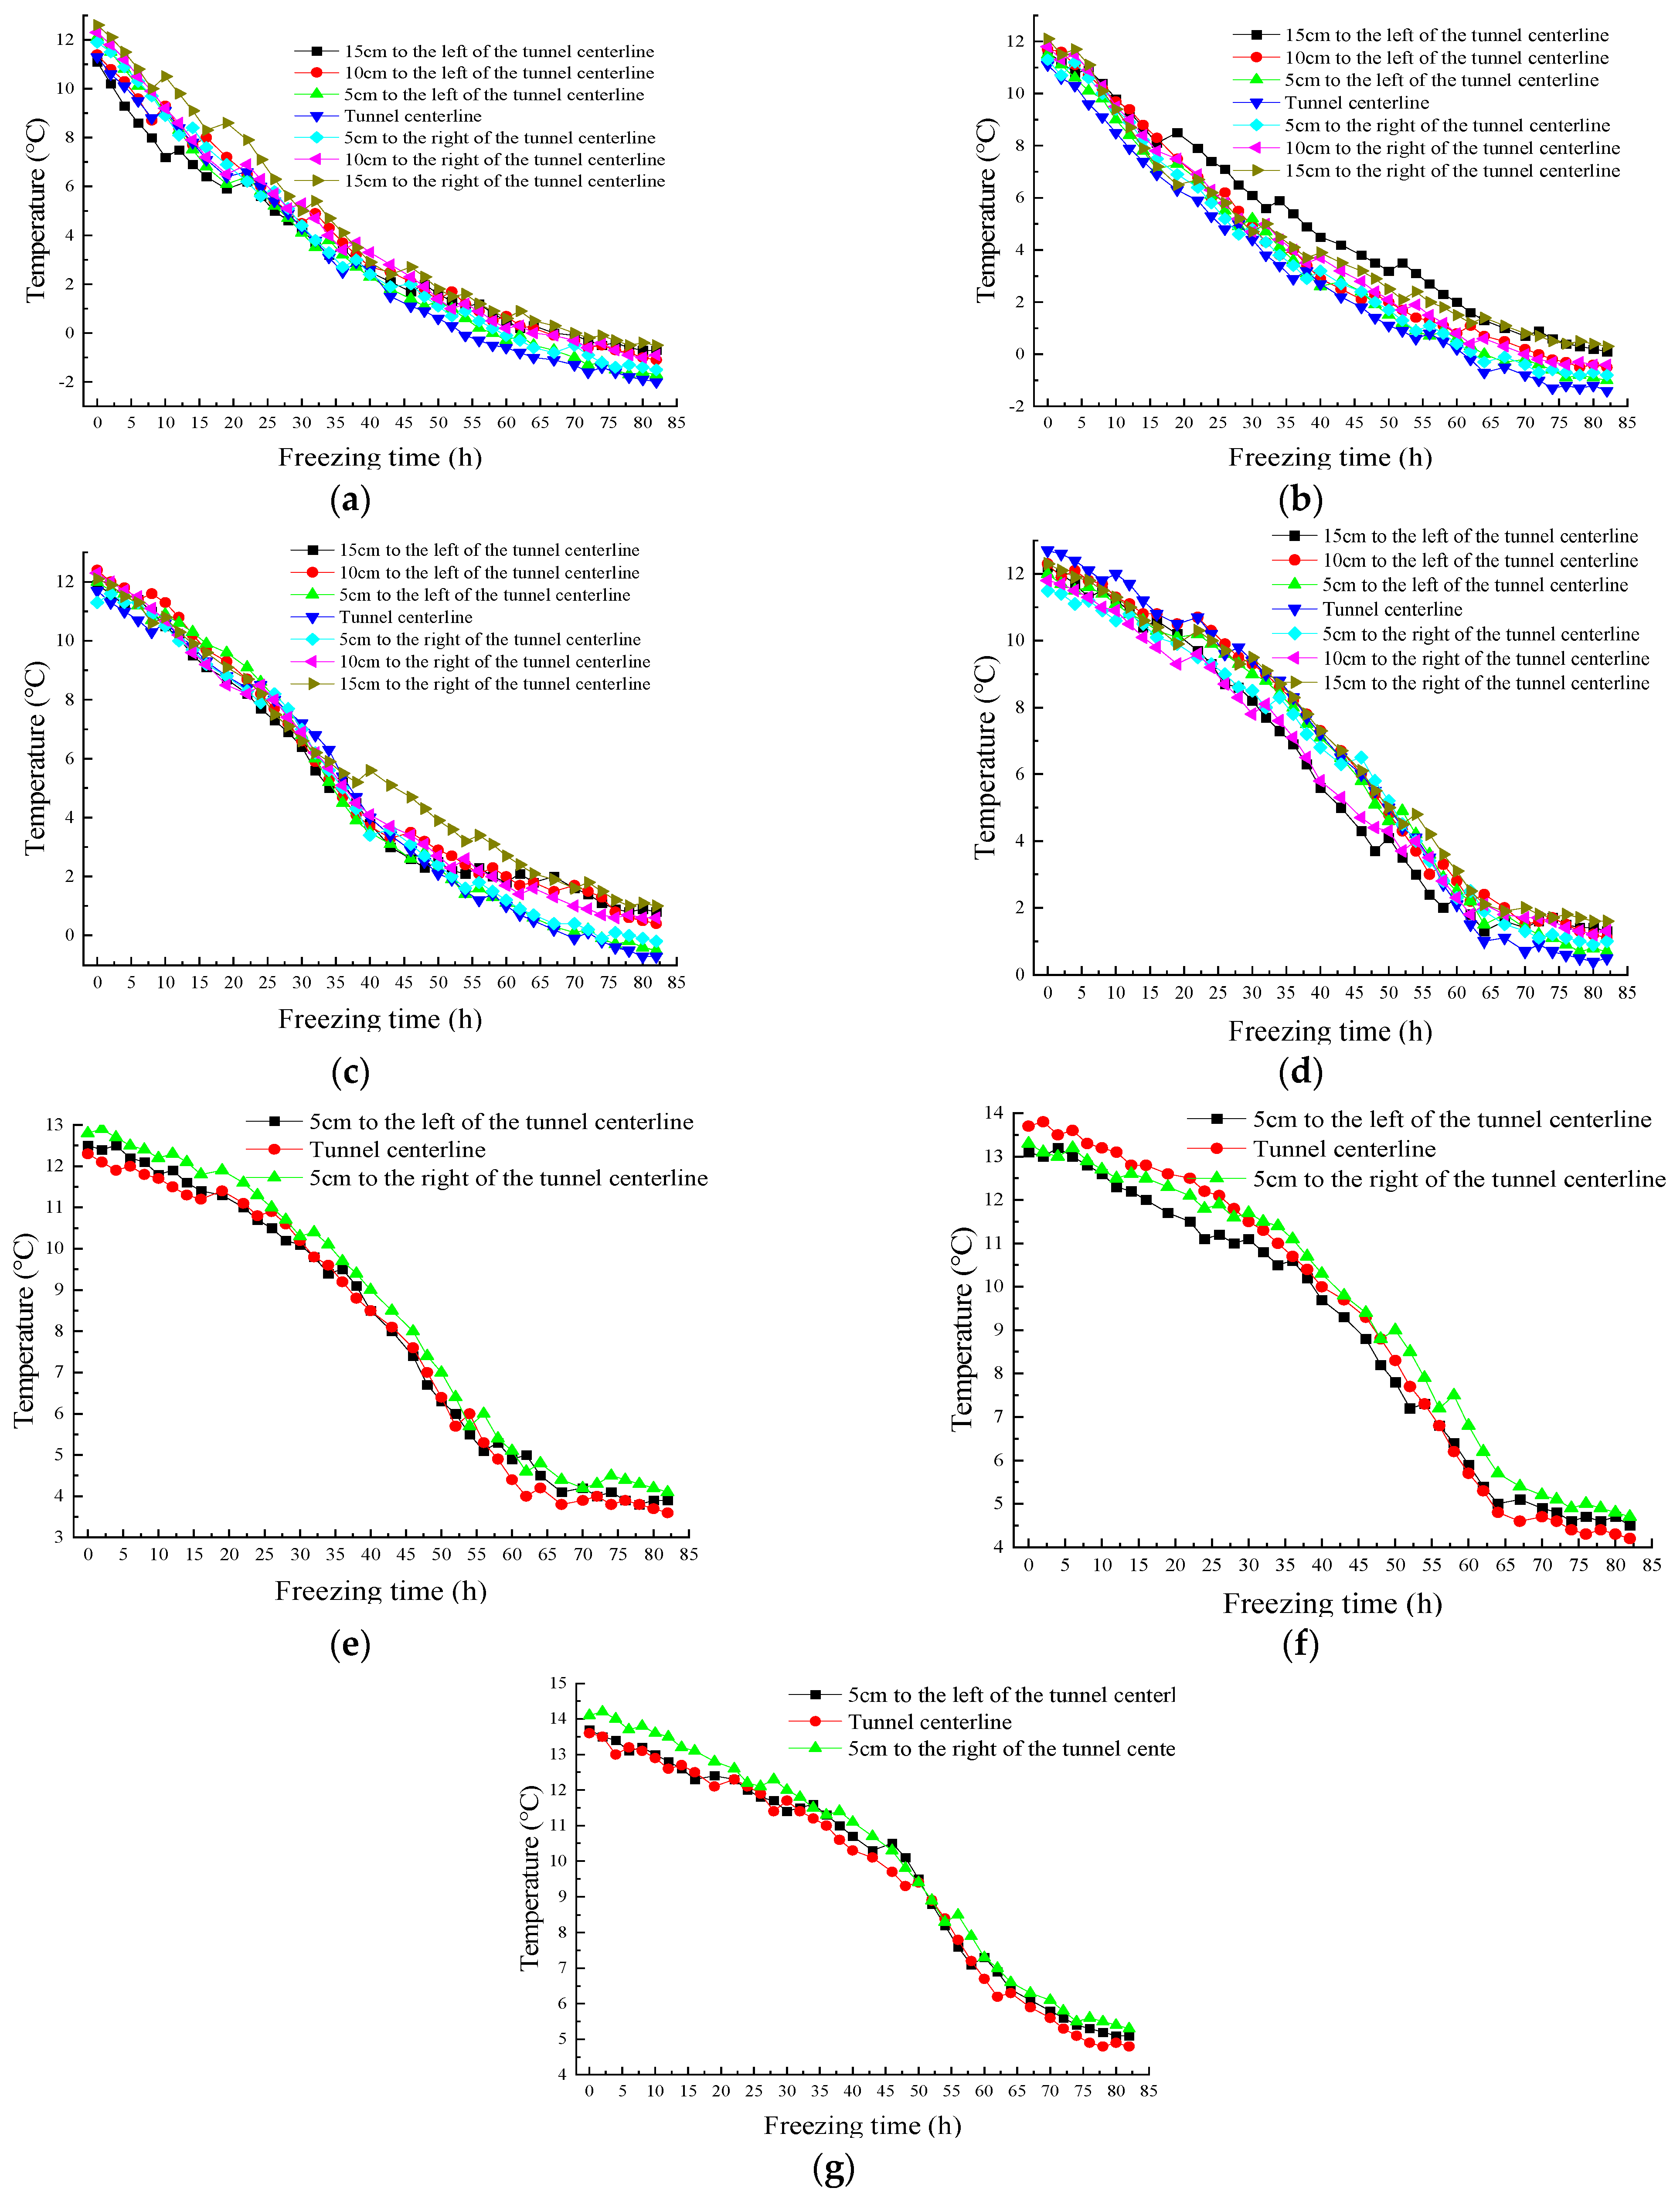
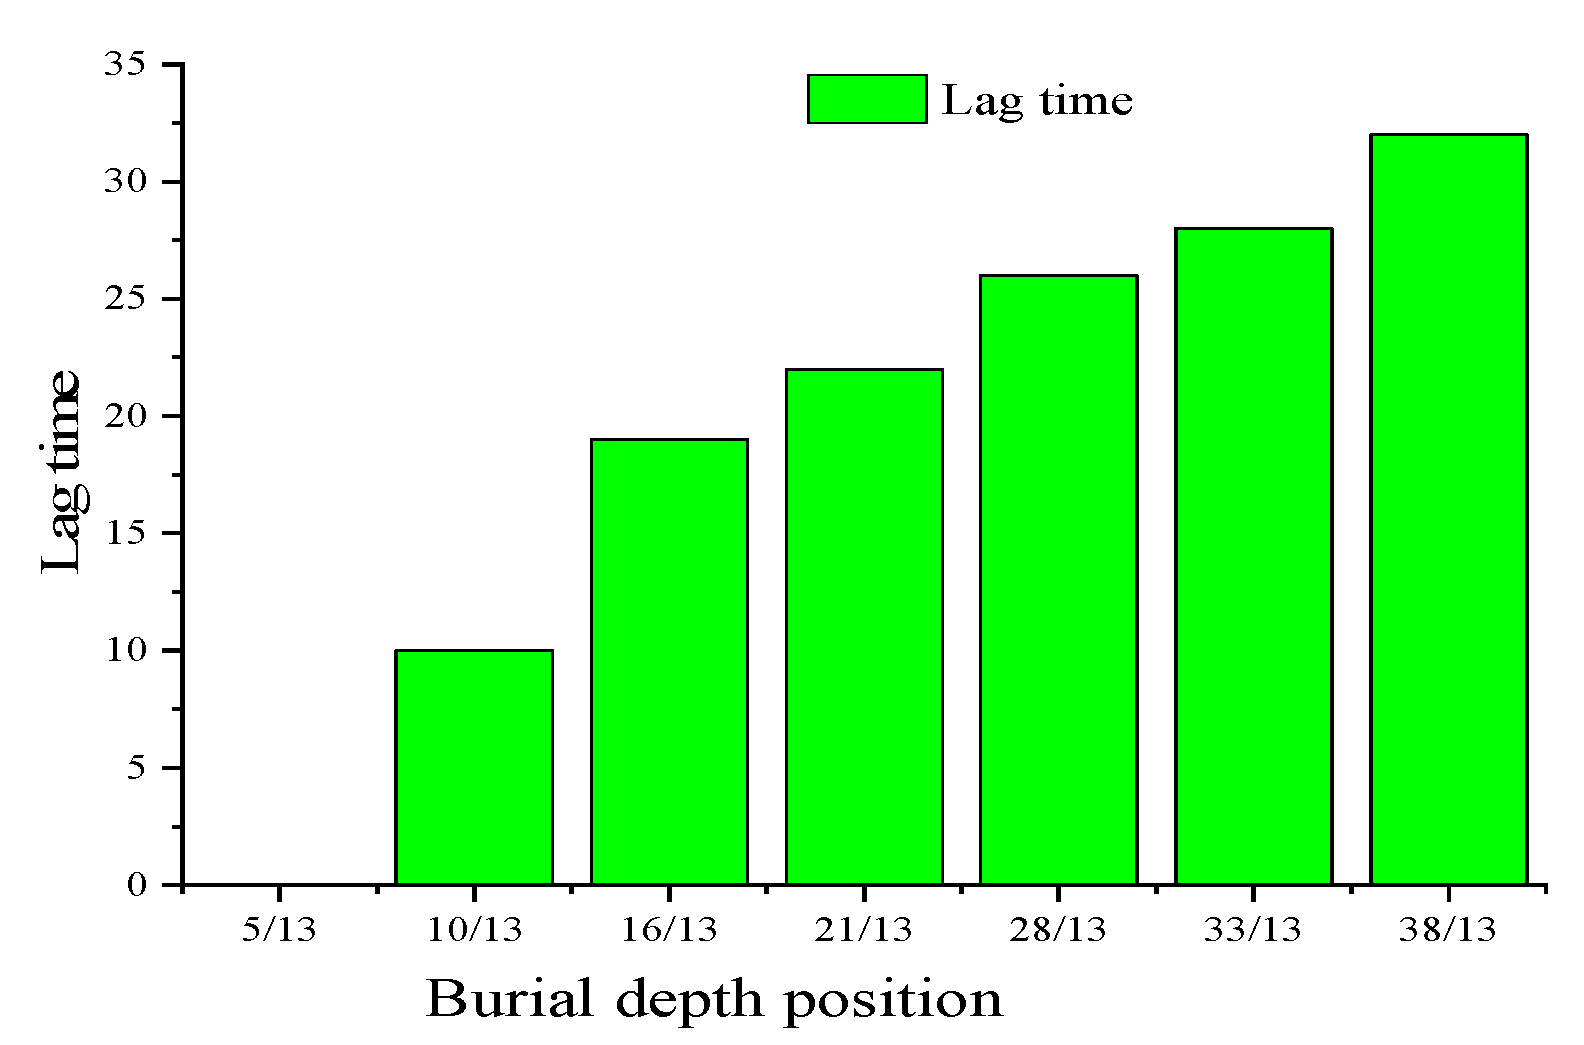
Based on the model test results, the temperature variation curves of each measuring point with freezing time under different insulation conditions follow the function distribution of T = C + B 1 t + B 2 t 2 + B 3 t 3 , where t represents the freezing time. When the depth of the surrounding rock at the bottom of the tunnel is significant, there is a lag phenomenon in the temperature variation with freezing time. The depth of the surrounding rock directly affects the lag time of temperature variation, with a more substantial depth resulting in a longer lag time and a more pronounced lag phenomenon.
(2)
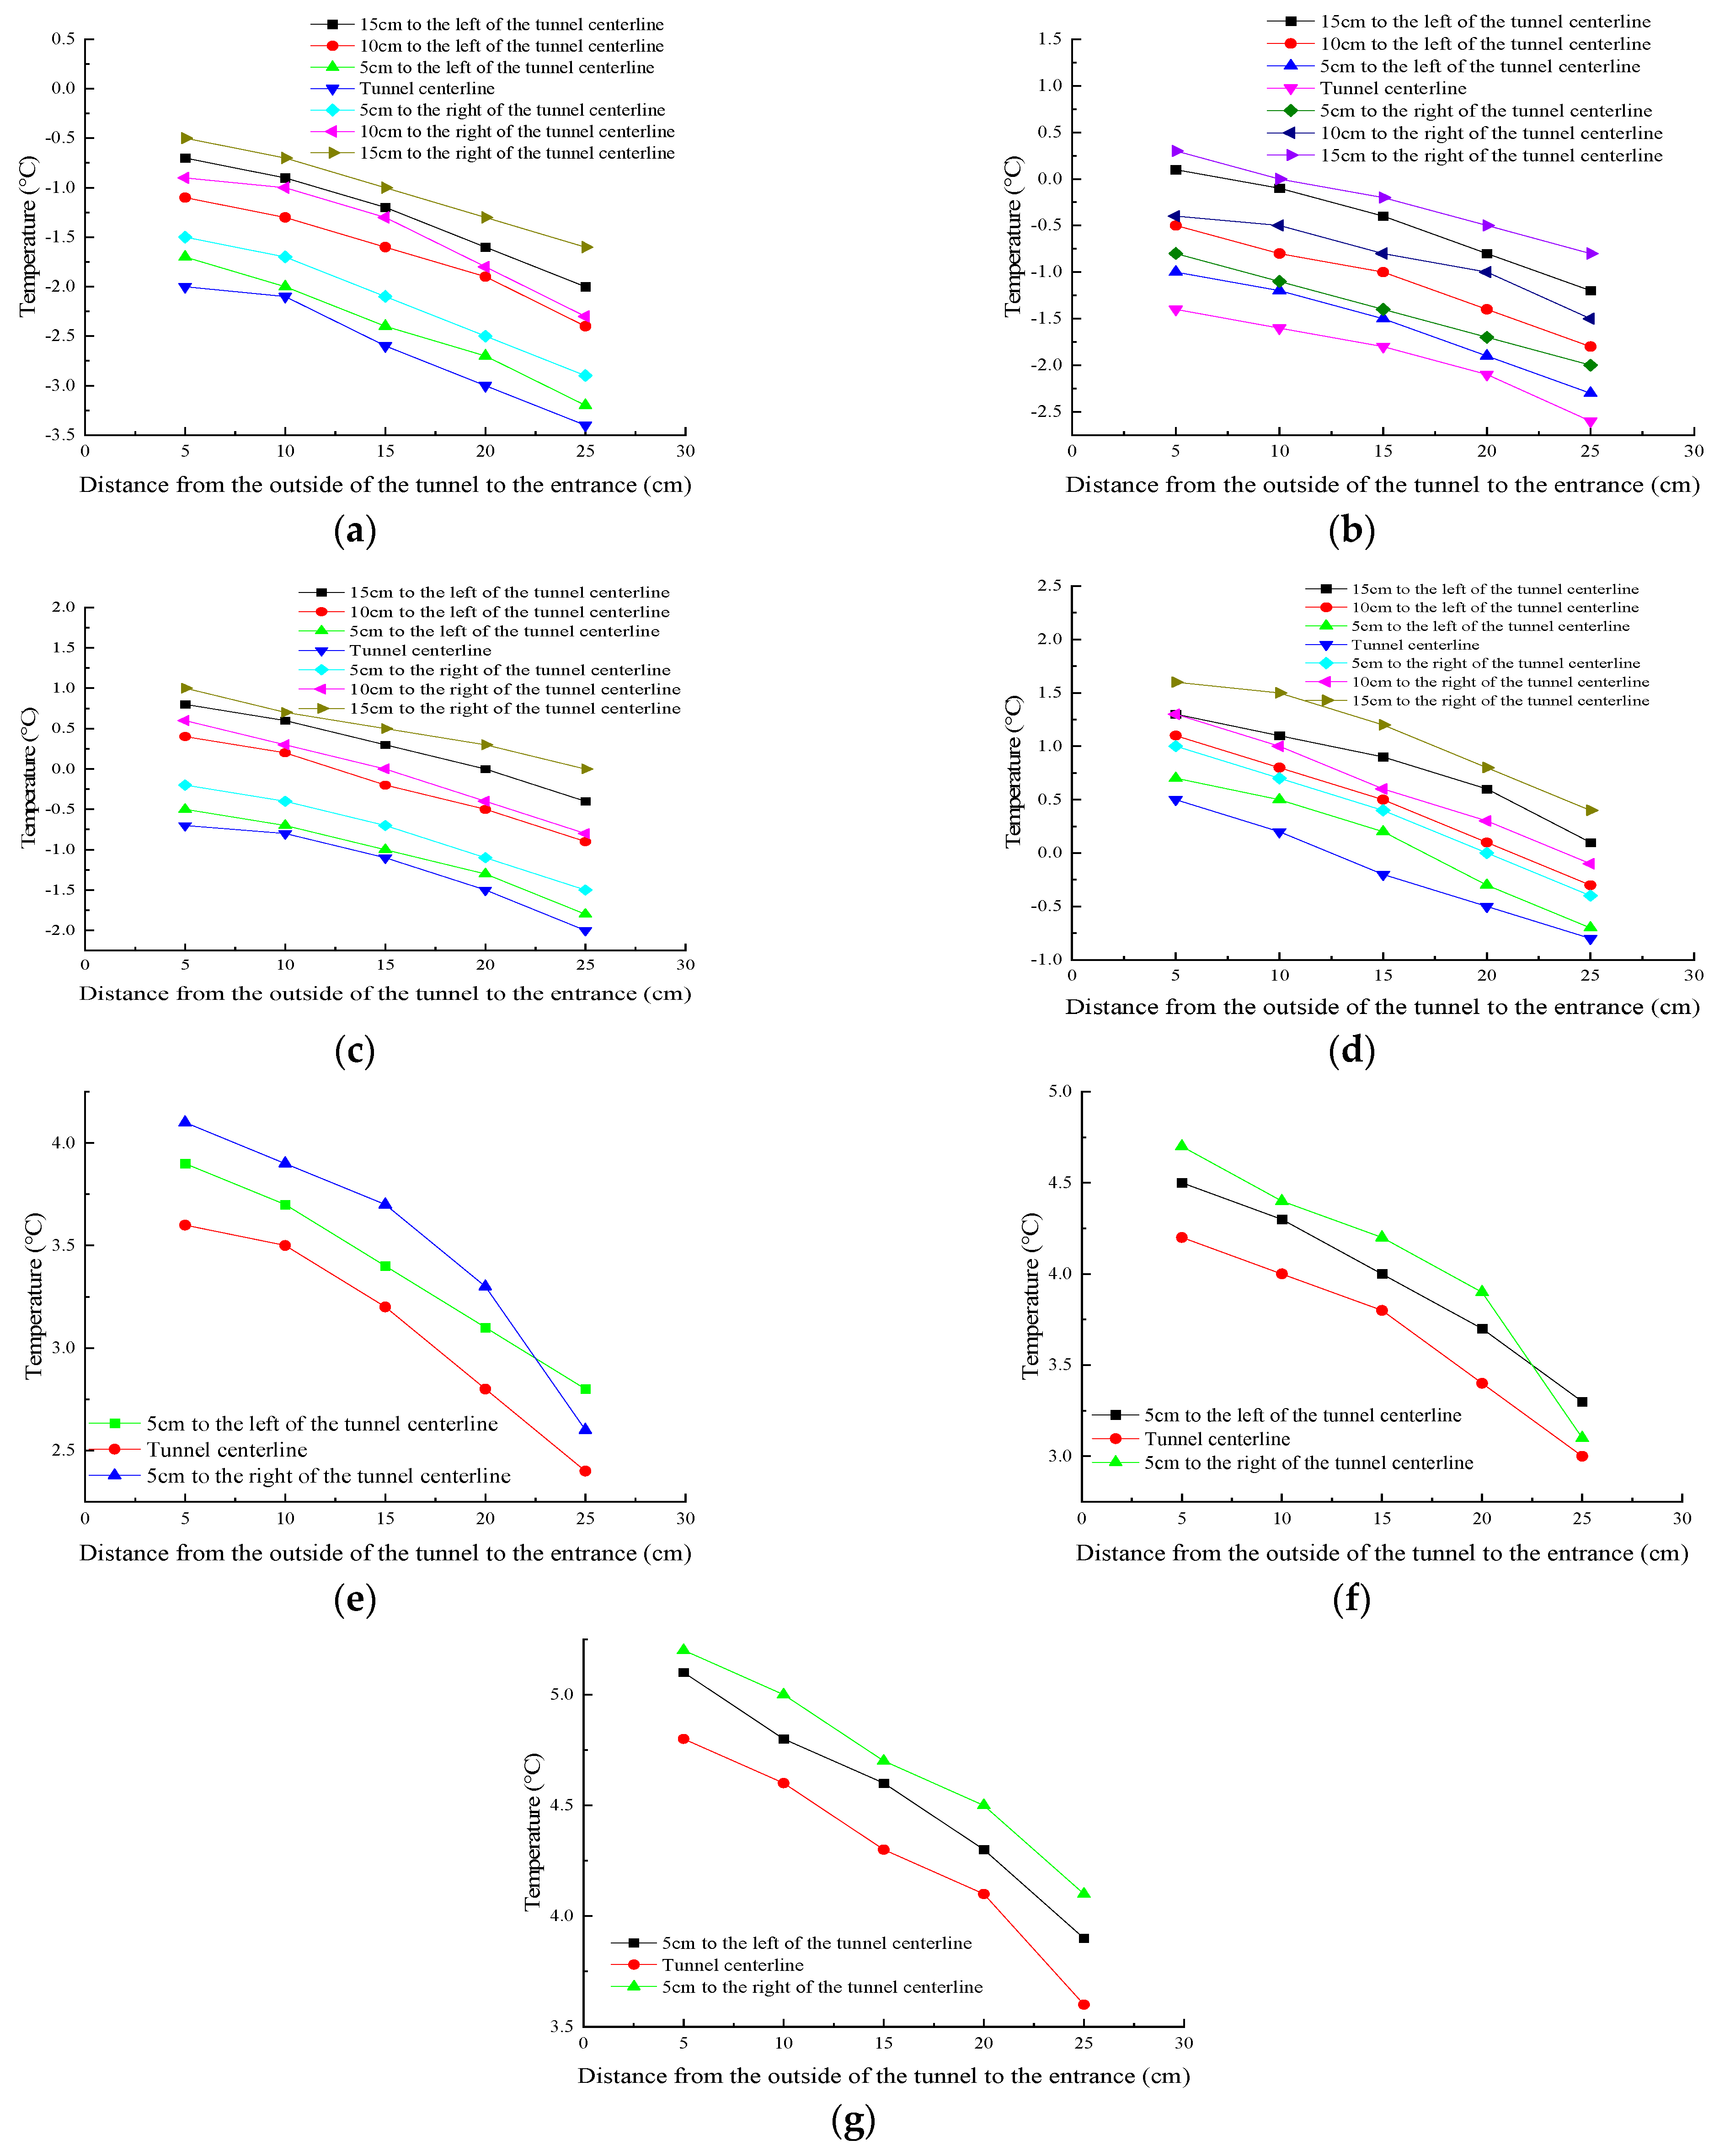
In the absence of insulation, the temperature variation of the surrounding rock at different depths below the tunnel, except for the position 15 cm on each side of the centerline, follows a quadratic function T = B 1 x 2 + B 2 x + B 3 along the longitudinal direction of the tunnel. As the depth inside the tunnel increases from outside, the temperature of each measuring point gradually rises, while the magnitude of temperature change gradually decreases with increasing depth.
(3)
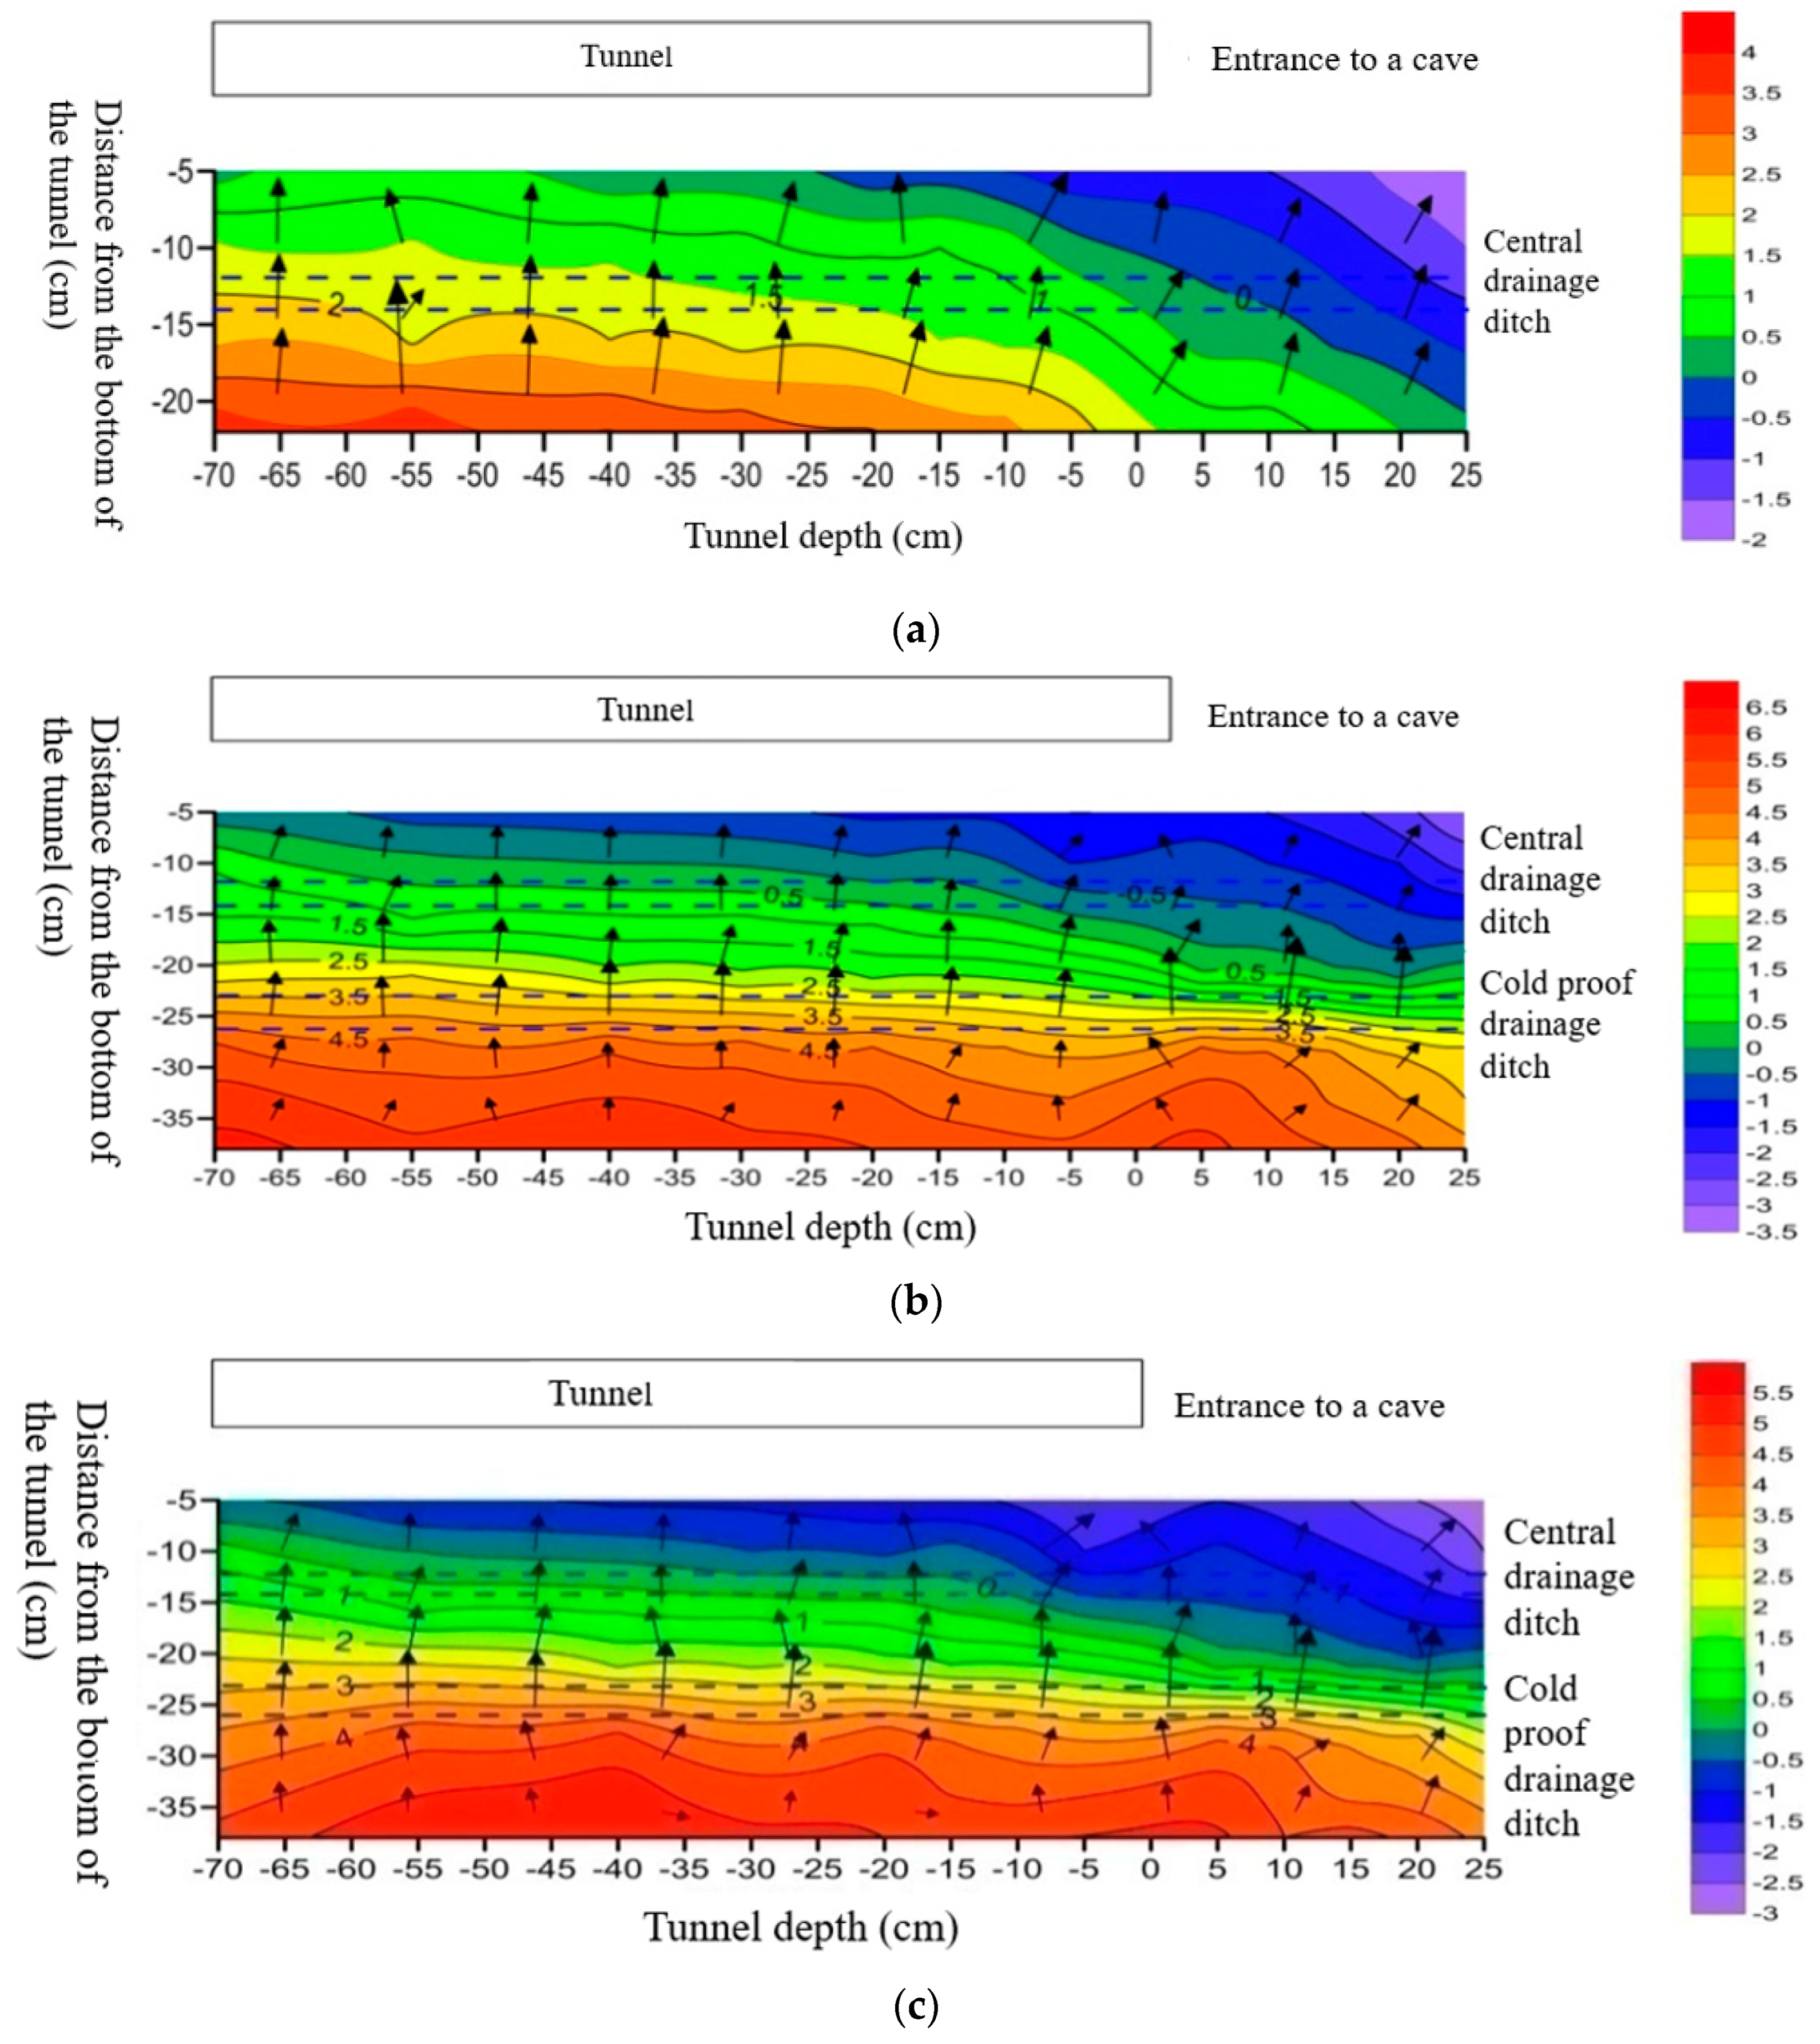
Compared to the non-insulated condition, insulation under various conditions results in an increase in temperature values at each measuring point of the tunnel drainage structure. The measuring points surrounding the central drainage ditch exhibit a significant rise in temperature values. The negative temperature area around the central drainage ditch reduces significantly, as the negative temperature zone shifts towards the tunnel entrance. These results suggest that insulation exerts a positive effect on the central drainage ditch by providing anti-freezing protection.
(4)
The variation of freezing depth with depth in the model test conforms to a quadratic polynomial form. By establishing a functional relationship between the freezing depth of the lower arch of the model tunnel and the air temperature inside the tunnel, and utilizing the similarity of the freezing depth–temperature relationship, the actual freezing depth of the tunnel can be roughly estimated by combining the measured air temperature inside the tunnel. This provides a basis for the layout of drainage structures.
The numerical simulation performed in the article only investigated the distribution pattern of the temperature field. However, for tunnel surrounding rocks with a high water content, the influence of seepage cannot be neglected. Therefore, future research will involve a coupled analysis of both the temperature field and the seepage field.

Author Contributions

Project management is overseen by X.Z., while data processing and analysis in the paper is led by L.J. J.Z. is responsible for organizing and revising the paper; L.T. for verifying the experimental results, and L.L. for writing and editing the manuscript. All authors have read and agreed to the published version of the manuscript.

Funding

This research received no external funding.

Data Availability Statement

We declare that we have no financial and personal relationships with other people or organizations that can inappropriately influence our work, there is no professional or other personal interest of any nature or kind in any product, service and/or company that could be construed as influencing the position presented in, or the review of, the manuscript entitled.

Conflicts of Interest

The authors declare no conflict of interest.

References

  1. Inokuma, A.; Inano, S. Road tunnels in Japan: Deterioration and countermeasures. Tunn. Undergr. Space Technol. 1996, 11, 305–309. [Google Scholar] [CrossRef]
  2. Okada, K.; Fujii, T. Icicle and frost heave prevention by adiabatic treatment in existing tunnel. In Proceedings of the Ground Freezing 97: Frost Action in Soils, Lulea, Sweden, 15–17 April 1997; pp. 461–467, ISBN 90-5410-872-X. [Google Scholar]
  3. Sun, Z.Y.; Zhang, D.L.; Fang, Q.; Dui, G.S.; Chu, Z.F. Analytical solutions for deep tunnels in strain-softening rocks modeled by different elastic strain definitions with the unified strength theory. Sci. China Tech. Sci. 2022, 65, 2503–2519. [Google Scholar] [CrossRef]
  4. Sun, Z.Y.; Zhang, D.L.; Fang, Q.; Huangfu, N.Q.; Chu, Z.F. Convergence-confinement analysis for tunnels with combined bolt–cable system considering the effects of intermediate principal stress. Acta Geotech. 2022, 1–26. [Google Scholar] [CrossRef]
  5. Zhang, Y.; Xia, C.; Zhou, S.; Hu, Y.; Zhang, J. A new sustainable energy based freeze proof method for drainage system in cold-region tunnels: A case study of Tianshan Shengli Tunnel. Case Stud. Therm. Eng. 2022, 34, 102020. [Google Scholar] [CrossRef]
  6. Wang, L.; Zhang, C.; Cui, G.; Wang, X.; Ye, Z. Study on the performance of the new composite thermal insulation lining for the railway operational tunnel in cold regions. Case Stud. Therm. Eng. 2022, 36, 102098. [Google Scholar] [CrossRef]
  7. Gao, Y.; Zhu, Z.; Ding, Y.; Geng, J.; Bao, X.; Zhou, J. Study on Tunnel Air Curtain Insulation System for Cold Areas. Adv. Civ. Eng. 2022, 2022, 3069123. [Google Scholar] [CrossRef]
  8. Ma, Q.; Luo, X.; Lai, Y.; Niu, F.; Gao, J. Numerical investigation on thermal insulation layer of a tunnel in seasonally frozen regions. Appl. Therm. Eng. 2018, 138, 280–291. [Google Scholar] [CrossRef]
  9. Cui, G.; Ma, J.; Wang, L.; Wang, X.; Wang, D. A new off-wall insulation liner for high-speed railway tunnels in cold regions. Case Stud. Therm. Eng. 2021, 28, 101652. [Google Scholar] [CrossRef]
  10. Wu, H.; Zhong, Y.; Xu, W.; Shi, W.; Shi, X.; Liu, T. Experimental investigation of ground and air temperature fields of a cold-region road tunnel in NW China. Adv. Civ. Eng. 2020, 2020, 4732490. [Google Scholar] [CrossRef]
  11. Zeng, Y.; Liu, K.; Zhou, X.; Fan, L. Tunnel temperature fields analysis under the couple effect of convection-conduction in cold regions. Appl. Therm. Eng. 2017, 120, 378–392. [Google Scholar] [CrossRef]
  12. ZHANG, S.L.; Feng, Q.Z.; Ying, G.G.; Zhang, D.L. Study of Causes of Highway Tunnel Leakage and Field Test of New Drainage Material. J. Highw. Transp. Res. Dev. 2013, 30, 86–91. [Google Scholar]
  13. Zhou, Y.; Li, M.; Zhang, D.; Suo, X.; Zhang, X.; Dong, K. Optimal Design of Central Drainage Ditch Buried Depth for Highway Tunnel in Seasonally Frozen Region. KSCE J. Civ. Eng. 2022, 26, 1674–1682. [Google Scholar] [CrossRef]
  14. Zhu, W. Analysis on the appropriate buried depth of the cold-proof drainage hole of the tunnel in the cold region. Teh. Vjesn. 2021, 28, 922–933. [Google Scholar] [CrossRef]
  15. Liu, H.J.; Zheng, J.Y.; Cheng, C.G.; Huang, L.H. Rehabilitation project of the Dabanshan highland road tunnel. Chongqing Daxue Xuebao (Ziran Kexue Ban) 2011, 34. [Google Scholar] [CrossRef]
  16. Luo, Y.B.; Chen, J.X.; Chao, H.L. Division of frost damage grades and its prevention measures in tunnel. In Advanced Materials Research; Trans Tech Publications Ltd.: Wollerau, Switzerland, 2012; Volume 535, pp. 1977–1984. [Google Scholar] [CrossRef]
  17. Fu, H.L.; An, P.T.; Wu, Y.M.; Li, J.; Chen, L. Influence of asymmetric blockage of the drainage system of a deep-buried tunnel on water gushing. J. Mt. Sci. 2022, 19, 2075–2085. [Google Scholar] [CrossRef]
  18. Zingg, S.; Anagnostou, G. Tunnel face stability and the effectiveness of advance drainage measures in water-bearing ground of non-uniform permeability. Rock Mech. Rock Eng. 2018, 51, 187–202. [Google Scholar] [CrossRef]
  19. Yi, C.; Senent, S.; Jimenez, R. Tunnel face stability considering drainage and surface settlements. In Geotechnical Aspects of Underground Construction in Soft Ground; CRC Press: Boca Raton, FL, USA, 2021; pp. 732–737. [Google Scholar] [CrossRef]
  20. Wang, X. Finite Element Method; Tsinghua University Press: Beijing, China, 2003. [Google Scholar]
  21. Liu, L.; Li, Z.; Liu, X.; Li, Y. Frost front research of a cold-region tunnel considering ventilation based on a physical model test. Tunn. Undergr. Space Technol. 2018, 77, 261–279. [Google Scholar] [CrossRef]
  22. Shen, S.; Xia, C.; Huang, J.; Li, Y. Influence of seasonal melt layer depth on the stability of surrounding rock in permafrost regions based on the measurement. Nat. Hazards 2015, 75, 2545–2557. [Google Scholar] [CrossRef]
Figure 1. Prefabrication of model device. (a) Mixing of surrounding rock materials; (b) Model tunnel steel wire mesh layout; (c) Insulation layer and sensor layout; (d) Concrete pouring.
Buildings 13 01503 g001
Figure 2. Layout of drainage system. (a) Schematic diagram of drainage structure; (b) Drainage structure layout.
Buildings 13 01503 g002
Figure 3. Insulation scheme for tunnel drainage structure. (a) Condition 1 (b) Condition 2.
Buildings 13 01503 g003
Figure 4. Cross section layout of temperature sensor.
Buildings 13 01503 g004
Figure 5. Longitudinal layout of temperature sensor.
Buildings 13 01503 g005
Figure 6. Relationship between temperature and freezing time at the buried depth of the central drainage ditch (a) 5/13 x; (b) 10/13 x; (c) 16/13 x; (d) 21/13 x; (e) 28/13 x; (f) 33/13 x; (g) 38/13 x.
Buildings 13 01503 g006
Figure 7. Temperature changes at different locations on the tunnel transverse section. (a) Temperature contour map of tunnel transverse; (b) Temperature vector map of tunnel transverse.
Buildings 13 01503 g007
Figure 8. Longitudinal temperature change curve at different positions in the tunnel. (a) 5/13 x; (b) 10/13 x; (c) 16/13 x; (d) 21/13 x; (e) 28/13 x; (f) 33/13 x; (g) 38/13 x.
Buildings 13 01503 g008
Figure 9. Longitudinal temperature change curve at different positions outside the tunnel. (a) 5/13 x; (b) 10/13 x; (c) 16/13 x; (d) 21/13 x; (e) 28/13 x; (f) 33/13 x; (g) 38/13 x.
Buildings 13 01503 g009
Figure 10. Vector diagram of longitudinal temperature changes at different locations of the tunnel. (a) Temperature variation vector map at 10 cm on the left side of the tunnel centerline; (b) Temperature variation vector map at 5 cm on the left side of the tunnel centerline; (c) Vector map of temperature changes at the centerline of the tunnel; (d) Temperature variation vector map at 5 cm on the right side of the tunnel centerline; (e) Temperature variation vector map at 10 cm on the right side of the tunnel centerline.
Buildings 13 01503 g010aBuildings 13 01503 g010b
Figure 11. Relationship between temperature and freezing time at the buried depth of the central drainage ditch. (a) 5/13 x; (b) 10/13 x; (c) 16/13 x; (d) 21/13 x; (e) 28/13 x; (f) 33/13 x; (g) 38/13 x.
Buildings 13 01503 g011
Figure 12. Cross section temperature variation curve at a distance of 1/60 tunnel length from the tunnel entrance outside the tunnel. (a) Temperature contour map of tunnel cross-section. (b) Temperature vector map of tunnel cross-section.
Buildings 13 01503 g012
Figure 13. Lag time diagram at different burial depths.
Buildings 13 01503 g013
Figure 14. Longitudinal temperature variation curves at different locations inside the tunnel. (a) 5/13 x; (b) 10/13 x; (c) 16/13 x; (d) 21/13 x; (e) 28/13 x; (f) 33/13 x; (g) 38/13 x.
Buildings 13 01503 g014
Figure 15. Vector diagram of longitudinal temperature change at different positions in the tunnel. (a) Temperature variation vector map at 10 cm on the left side of the tunnel centerline; (b) Temperature variation vector map at 5 cm on the left side of the tunnel centerline; (c) Vector map of temperature changes at the centerline of the tunnel; (d) Temperature variation vector map at 5 cm on the right side of the tunnel centerline; (e) Temperature variation vector map at 10 cm on the right side of the tunnel centerline.
Buildings 13 01503 g015aBuildings 13 01503 g015b
Table 1. Lag time of temperature changes at different burial depths.
Place(5/13) x(10/13) x(16/13) x(21/13) x(28/13) x(33/13) x(38/13) x
Lag time (h)061619303236
Table 2. Table of fitting curve parameters at different burial depth positions.
Place(5/13) x(10/13) x(16/13) x(21/13) x(28/13) x(33/13) x(38/13) x
Parameter
Buildings 13 01503 i001−4.48648 × 10⁻⁴−4.69414 × 10⁻⁴ −3.49877 × 10⁻⁴ −3.99026 × 10⁻⁴ −4.48142 × 10⁻⁴ −3.45785 × 10⁻⁴ −1.91049 × 10⁻⁴
Buildings 13 01503 i0020.055040.067140.055750.055440.058290.045950.03238
Buildings 13 01503 i003−1.39648−0.900560.181531.447153.090853.650924.33775
Buildings 13 01503 i0040.982570.970090.984550.971570.980010.987420.97223
Table 3. Statistical table of parametric statistics of fitting curve.
Place(5/13) x(10/13) x(16/13) x(21/13) x(28/13) x(33/13) x(38/13) x
Parameter
C11.8825211.0098911.9803712.1970413.264512.0079512.71308
Buildings 13 01503 i005−0.08473−0.03438−0.123670.00465−0.042910.05250.08816
Buildings 13 01503 i006−0.00691−0.00694−0.00427−0.00749−0.00387−0.00565−0.00694
Buildings 13 01503 i0077.79507 × 10−57.14938 × 10−55.08039 × 10−57.1517 × 10−53.75898 × 10−54.85517 × 10−56.01058 × 10−5
Buildings 13 01503 i0080.994490.996340.99430.995170.993970.991490.99082
Disclaimer/Publisher’s Note: The statements, opinions and data contained in all publications are solely those of the individual author(s) and contributor(s) and not of MDPI and/or the editor(s). MDPI and/or the editor(s) disclaim responsibility for any injury to people or property resulting from any ideas, methods, instructions or products referred to in the content.

