

Additional Stress of Soil and Surface Settlement during Tunnel Shield Construction
Power China Guiyang Engineering Corporation, Ltd., Guiyang 550081, China
*
Author to whom correspondence should be addressed.
Buildings 2023, 13(6), 1437; https://doi.org/10.3390/buildings13061437
Submission received: 11 April 2023
/
Revised: 24 May 2023
/
Accepted: 29 May 2023
/
Published: 31 May 2023
(This article belongs to the Special Issue Leading-Edge in Computational Methods for Tunnelling and Underground Construction)
Abstract
:To study the influence of shield excavation on the surrounding soil, and to control the influence of the shield excavation of the subway tunnel on the surface settlement and the deformation of the surrounding buildings, it is necessary to study the additional stress of the surrounding soil caused by the tunnel shield excavation and the law of surface settlement. Combined with a shield construction project of a subway tunnel, this article uses the Mindlin solution in elastic mechanics to obtain three-dimensional calculation formulas for the additional thrust on the shield cutter head surface and the additional stress and displacement field caused by the friction force between the shield shell and the soil contact interface on the surrounding soil. The Loganathan ground movement pattern is used to determine the soil movement mode. The source–sink method is used to study the formula for calculating the three-dimensional additional stress of the soil around the shield tunnel caused by ground loss. The results show that when the shield is digging, the ground goes through five stages, namely the uplift of the ground before the arrival of the shield cutter head, surface settlement when the shield reaches the surface subsides when the shield tail of the shield passes through, the passage of the shield tail of the shield, surface settlement when the lining is separated from the shield, and consolidation and settlement after the shield passes through.
1. Introduction
With the increase in population, economic growth, social progress, fast urban development, and increasingly severe urban traffic, simply increasing and widening roads and urban interchanges not only cannot solve the problem but also becomes a competition for land with other environmental issues of resources. Referring to the construction experience of other cities, a large number of urban overpasses have brought various disadvantages, resulting in increasingly severe environmental problems such as noise and dust [1,2]. The development of underground space resources and the development of the subway transportation industry have become the necessary means for the development of a metropolis [3,4]. Due to its advantages in waterproofing, soil adaptability, disturbance range to surrounding soil, and degree of mechanization, tunnel shield construction has significant advantages over the hidden excavation method in controlling ground settlement and deformation [5,6]. However, the shield tunneling construction plan and construction nodes heavily depend on the geological conditions of the strata. It is required to understand the geological conditions of the strata and make corresponding contingency measures in advance for specific problems. When tunnels pass through buildings (structures) and rivers that are sensitive to geological deformation, a construction plan should be prepared [7]. It is necessary to prepare safety assessment reports in areas with complex geological conditions and sudden changes, such as groundwater development and geological changes in strata, to avoid or reduce the occurrence of construction risks [8]. Within the scope of influence of shield tunneling construction, measures such as direct passage, foundation treatment, and reinforcement, and avoidance are adopted according to the control standards for surface settlement and building settlement to ensure the smooth progress of subway shield tunneling construction [9].
During the construction process of shield tunneling, it is inevitable to cause disturbance to the surrounding soil, leading to soil movement. Ground loss is the main cause of soil deformation during shield tunneling construction [10]. A large number of engineering-measured data show that the normal distribution curve can better fit the measured land settlement curve, so the Peck formula is widely used. The Peck formula assumes that the soil is undrained and incompressible in volume, and the volume of the ground settlement trough is equal to the loss volume of the soil [11]. When the ground loss is equal, the maximum settlement of the ground above the tunnel axis calculated under different soil conditions is different, and the settlement generated by better soil conditions is larger. However, existing tunnel ground movement patterns are independent of soil conditions [12]. When assuming that the soil is not drained, the maximum settlement calculated under different soil conditions is the same. This cannot explain the above phenomenon, so it is necessary to study the ground movement pattern and ground settlement theoretical calculation formula of shield tunneling.
At this stage, when researchers from various countries study the impact of tunnel shield construction on the surface deformation and the surrounding surface structures (structures), relying on specific examples of shield construction projects, the main methods proposed include empirical methods, field test methods, and numerical calculation methods, model test method, etc., have achieved many creative results [13]. Some scholars have adopted a cross-sectional two-dimensional plane strain model to simulate the stress and strain of the strata caused by shield tunneling. By applying different loads on each construction section of the shield tunneling, they analyzed the horizontal and vertical displacement of the strata considering the influence of the shield tail detachment load [14]. Some scholars have used two-dimensional finite element methods to simulate and analyze buildings with different distances and positions from the tunnel axis. The research results indicate that tunnels and buildings are interactive entities. Due to the inherent stiffness of buildings, the amount of surface deformation caused by tunnels increases. Tunnel shield excavation in turn can also cause additional stress and deformation of buildings. When the ratio of the horizontal distance between the centerline of adjacent structures and the longitudinal axis of the tunnel to the outer diameter of the tunnel is between 0.5 and 2.0, it will cause greater ground settlement [15]. Due to the complexity of the soil itself, such as the variable formation conditions of soil, complex stress history conditions, different crustal stress distribution, diverse boundary conditions, etc., the analytical solution can only be obtained after simplifying the problem and putting forward corresponding assumptions [16]. The theoretical methods proposed by various scholars are only aimed at simple geological conditions and cannot consider underground construction conditions, so only theoretical guidance is provided.
Scholars have proposed stress and displacement solutions for incompressible soil in an elastic half-space and provided strain solutions for an elastic isotropic homogeneous body considering formation losses at a certain depth near the ground surface [17]. In theoretical analysis, the source–sink method is used to eliminate the influence of the free surface, thus obtaining a three-dimensional ground deformation formula. Based on the two-dimensional solution of the unified ground movement pattern for shield tunneling, some scholars believe that the ground loss rate is variable, and derive a three-dimensional solution of soil deformation caused by ground loss to calculate the vertical settlement and lateral horizontal displacement of a point in the soil [18]. Scholars have used the source and sink method to analyze the displacement field distribution during tunnel shield construction based on the spatial distribution of ground loss using three-dimensional numerical methods and obtain the additional stress distribution generated by the surrounding soil during shield construction [19]. Using this three-dimensional numerical method to develop corresponding programs, a certain underground tunnel was calculated and verified, and it was found that it was in good agreement with the measured data.
This article uses the elastic mechanic’s formula to solve the stress at a point in the soil and the source–sink method to obtain the additional thrust on the excavation surface of the shield, the friction force between the shield shell and the surrounding soil, and the distribution area and pattern of the additional stress field caused by the loss of the shield tail soil on the surrounding soil. Based on the settlement curve generated by the longitudinal settlement points of the ground caused by tunnel shield excavation according to the construction sequence, the variation patterns of surface settlement in five stages during shield tunneling are analyzed. The purpose of this study is to study the impact of shield excavation on surrounding soil and the impact of subway tunnel shield excavation on surface settlement deformation and deformation of surrounding buildings, obtain regional shield construction experience, provide theoretical background for shield construction of subway tunnel in similar strata, and ensure the safety and applicability of surface buildings during shield excavation.
2. Materials and Methods
2.1. Project Overview
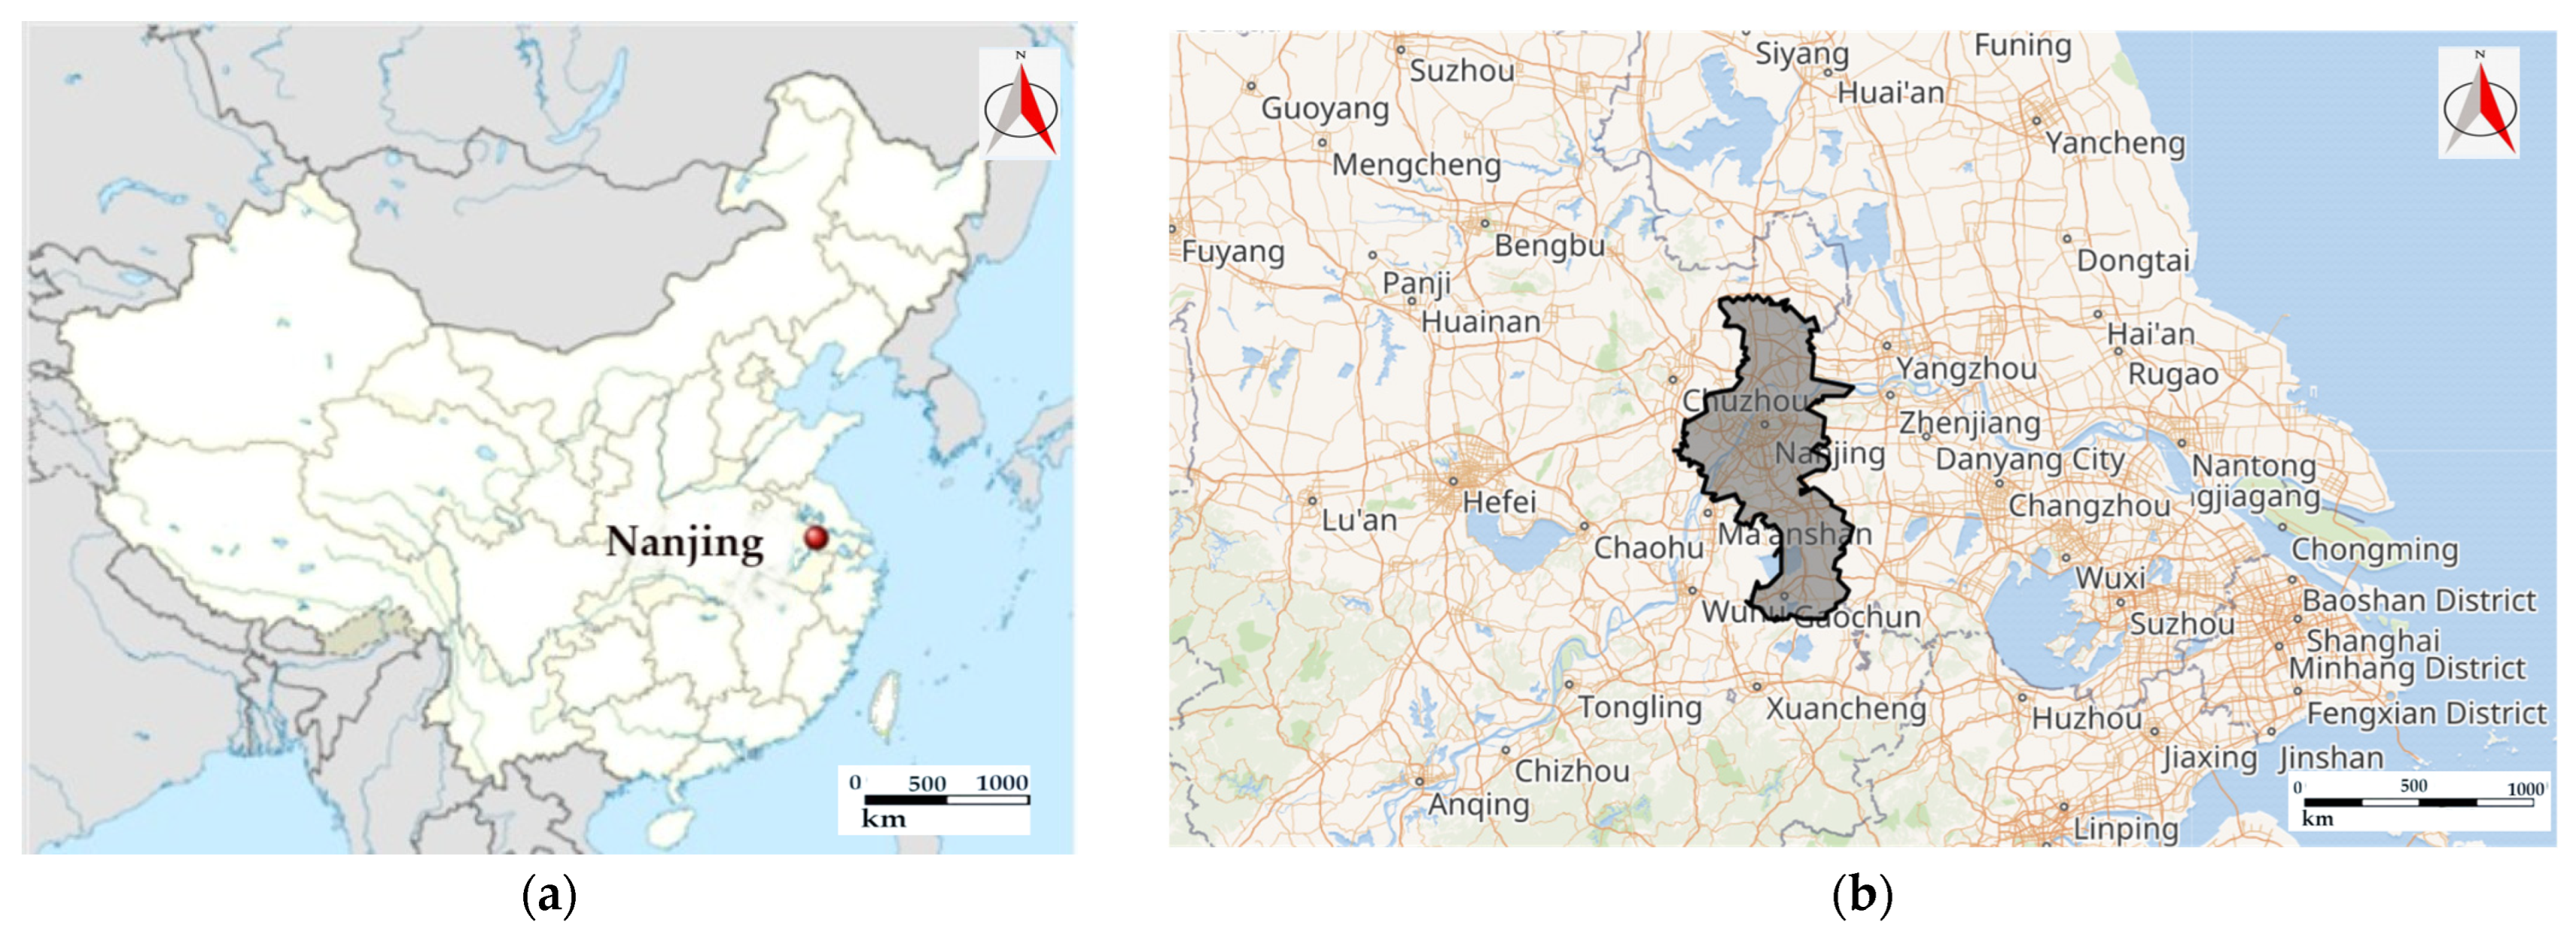
The on-site engineering geological data used in this paper are all from the detailed geotechnical investigation report of a certain section of a subway line. The shield construction parameters and monitoring data used in this article are sourced from the on-site measurement results of China Railway Fifth Bureau Chengtong Company. The length of this section is 869.49 m, which are two parallel single-track tunnels. The earth pressure balance shield method is used for construction. The tunnel section is circular, with an inner diameter of 5.50 m and an outer diameter of 6.20 m. The elevation of the rail top is 5.29–16.34 m, the depth of the bottom plate is about 14.40–26.80 m, and the thickness of the covering soil is 9.30–20.70 m. The study area includes city-level cultural relics protection buildings such as St. Paul’s Church and the Bank of Communications. The location of the study area is shown in Figure 1a,b. The specific shield construction route is shown in Figure 1c.
The distribution of layers crossing the shield tunneling section is shown in Table 1.
Within the study area, Layer–3d3–4 silty sand, Layer–3b4+c3 silty clay, and muddy silty clay with thin layers of silt are prone to collapse, resulting in water flow and sand flow. Layer–3b1–2 silty clay, Layer–4b1–2 silty clay, and Layer–4b2–3 silty clay mixed with fine sand are also easily collapsed soil layers. In addition, the thickness of the overlying soil above the confined aquifer below the bottom plate at the entrance of the northern section of the tunnel cannot meet the requirements for checking the stability against seepage. The upper part of the tunnel body near the northern end of the tunnel is located in the liquefiable soil Layer–3d3–4 fine sand.
According to the Code for Geological Survey of Railway Engineering (TB10012–2007) [20] and Code for Design of Railway Tunnels (TB10003–2005) [21], the basic classification of surrounding rock and the classification of geotechnical engineering construction are carried out for each soil layer on this site. The classification of the tunnel surrounding the rock and soil is shown in Table 2.
The geotechnical characteristics parameters of each soil layer are shown in Table 3.
2.2. Surface Settlement Monitoring
The field measurement system includes surface settlement monitoring instruments and shield tunneling-related parameter monitoring instruments. In order to accurately reflect the settlement of adjacent buildings and ground during shield tunneling, it is generally stipulated that the measurement error should be less than 1/10 to 1/20 of the deformation value. It is required to use a precision level (S1 or S05 level) for settlement observation. The level used in this study is Trimble DiNi Digital Level. It can achieve high horizontal and vertical distance measurements with high accuracy. The measurement error in the horizontal direction is 0.3 mm/km, and the measurement error in the vertical direction is 10 s.
Before the shield excavation, ground settlement monitoring points are set up within the influence range of the shield excavation along the line; 159 surface monitoring points are arranged along the left line of the tunnel axis, and 148 surface monitoring points are arranged on the right line. This article conducts statistics on the four key parameters of the shield construction section studied: total thrust, shield propulsion speed, cutter head torque, grouting pressure, and data from 32 settlement monitoring points. There are a total of 15 surface settlement points corresponding to the longitudinal axis of the right line tunnel in the cross-section in the study area and a total of 17 surface settlement points corresponding to the longitudinal axis of the left line tunnel. The longitudinal ground settlement value of the tunnel after the instantaneous settlement of the soil after the shield tunneling was selected. Record and organize the shield construction parameters corresponding to the settlement points on the right and left lines from the daily shield construction diary.
The soil layer passed through by the shield tunneling on the right line is composed of silty clay (–3b1–2) and silty clay (–4b1–2). The statistics of parametric statistics of the right line are shown in Table 4.
The soil layer crossed by the left line has properties of silty clay (–3b1–2) and silty clay (–4b1–2). Parametric statistics of the left line are shown in Table 5.
From the statistical results of surface settlement in the interval, it can be seen that the surface settlement caused by shield tunneling in this geological section is relatively small. The average surface settlement value on the right line is 3.42 mm, with a maximum value of 6.28 mm. The average surface settlement value on the left line is 2.52 mm, with a maximum value of 4.32 mm. In the construction section of the shield tunneling section, the progress is stable, and the shield tunneling speed is maintained at five cycles per day. The grouting pressure is set reasonably, and the control effect of formation settlement is obvious. It can provide a reference for the control of shield tunneling construction parameters, as well as construction organization and management in areas with similar geological and hydrological conditions.
2.3. Theoretical Hypothesis
The shield tunnel studied is constructed along a straight line in the normally consolidated soft soil, and the deflection of the shield tunnel is not considered. The basic assumptions are as follows.
- (1)
- The soil is undrained and consolidated, and only the soil deformation during construction is considered, and the post-construction settlement of the soil is not considered. The post-construction settlement of soil is a long-term process, and if it is considered in the model, it may require more complex models and parameter estimation methods, which will increase the difficulty and uncertainty of the model and also have a certain impact on the accuracy of the results.
- (2)
- The soil under study is a homogeneous linear elastic semi-infinite body.
- (3)
- The shield excavation surface is the load action surface, and the front additional thrust distribution is approximated as a circular uniform load.
- (4)
- The friction force between the shield shell and the surrounding soil is evenly distributed.
- (5)
- Shield excavation only considers its spatial position changes, and does not consider time effects.
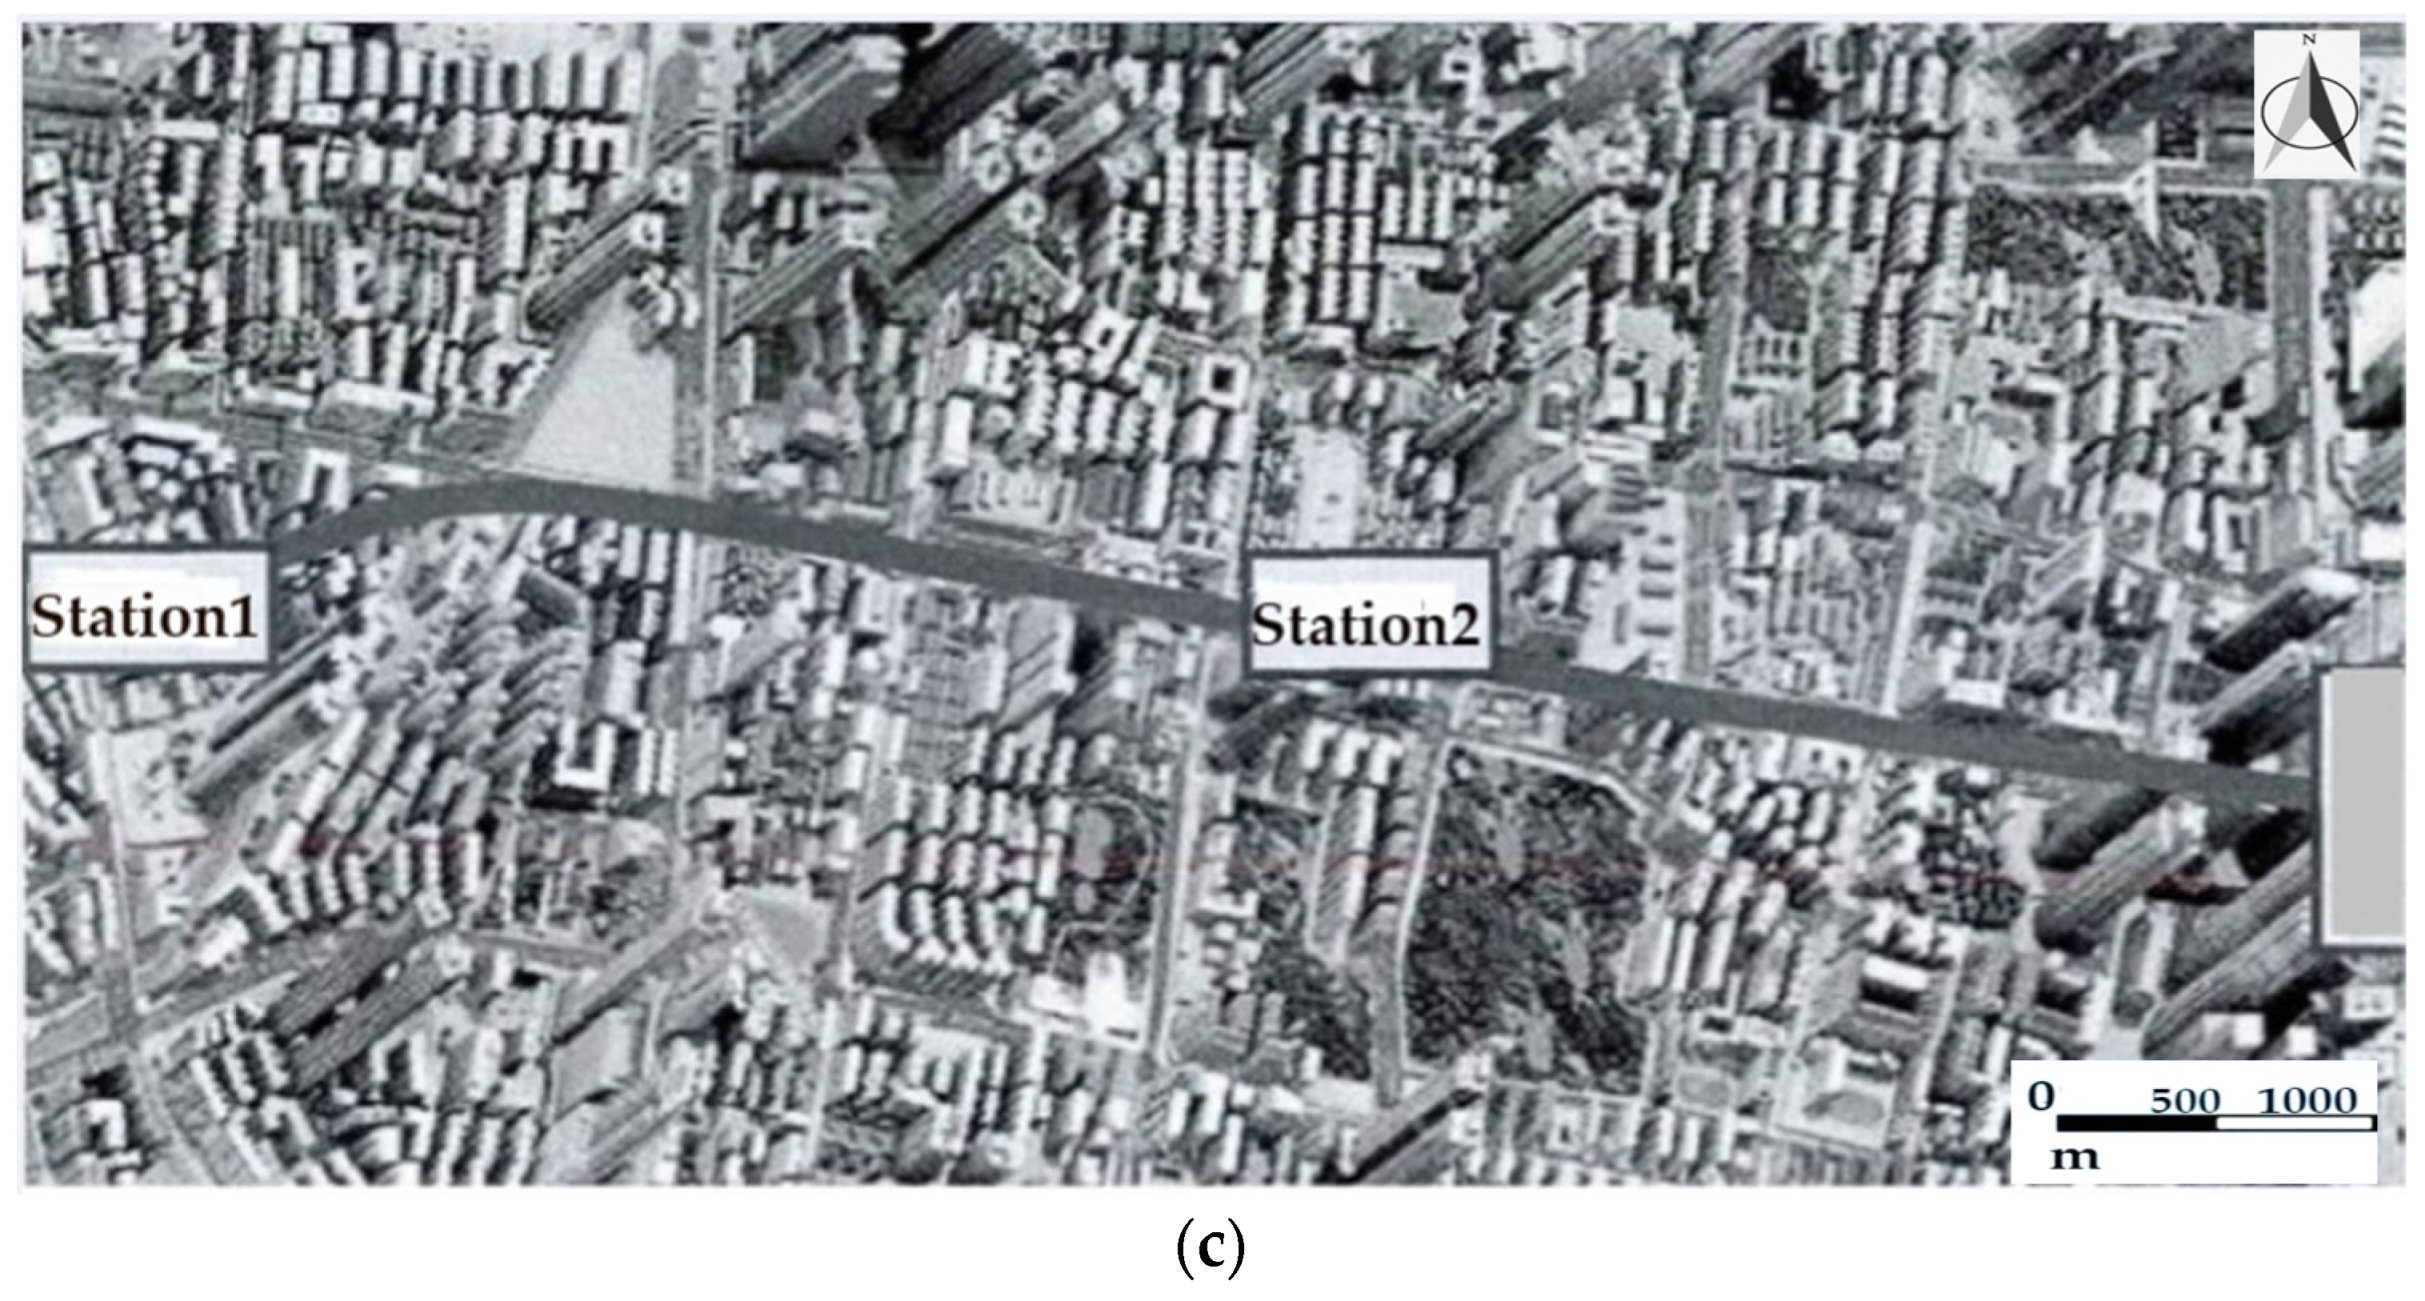
The coordinate system used in this article and the stress model of the soil around the shield tunnel are shown in Figure 2.
2.4. Additional Stress and Deformation of Soil Caused by Ground Loss
Tunnel shield construction itself is a process of changing the displacement and stress fields of the surrounding soil. During tunnel shield construction, the stress field response of the surrounding soil layer is not only related to the physical and mechanical parameters of the soil itself, but also to shield construction parameters such as additional thrust of the shield, the friction force between the shield shell and the surrounding soil interface, and ground loss. The research methods for soil stress fields generally focus on numerical simulation and on-site and indoor experiments, and there is relatively little research on stress field response in theoretical calculations. This article uses the Loganathan ground movement pattern to determine the ground movement pattern and uses the source–sink method to study the three-dimensional additional stress calculation formula of the soil around the shield tunnel caused by ground loss.
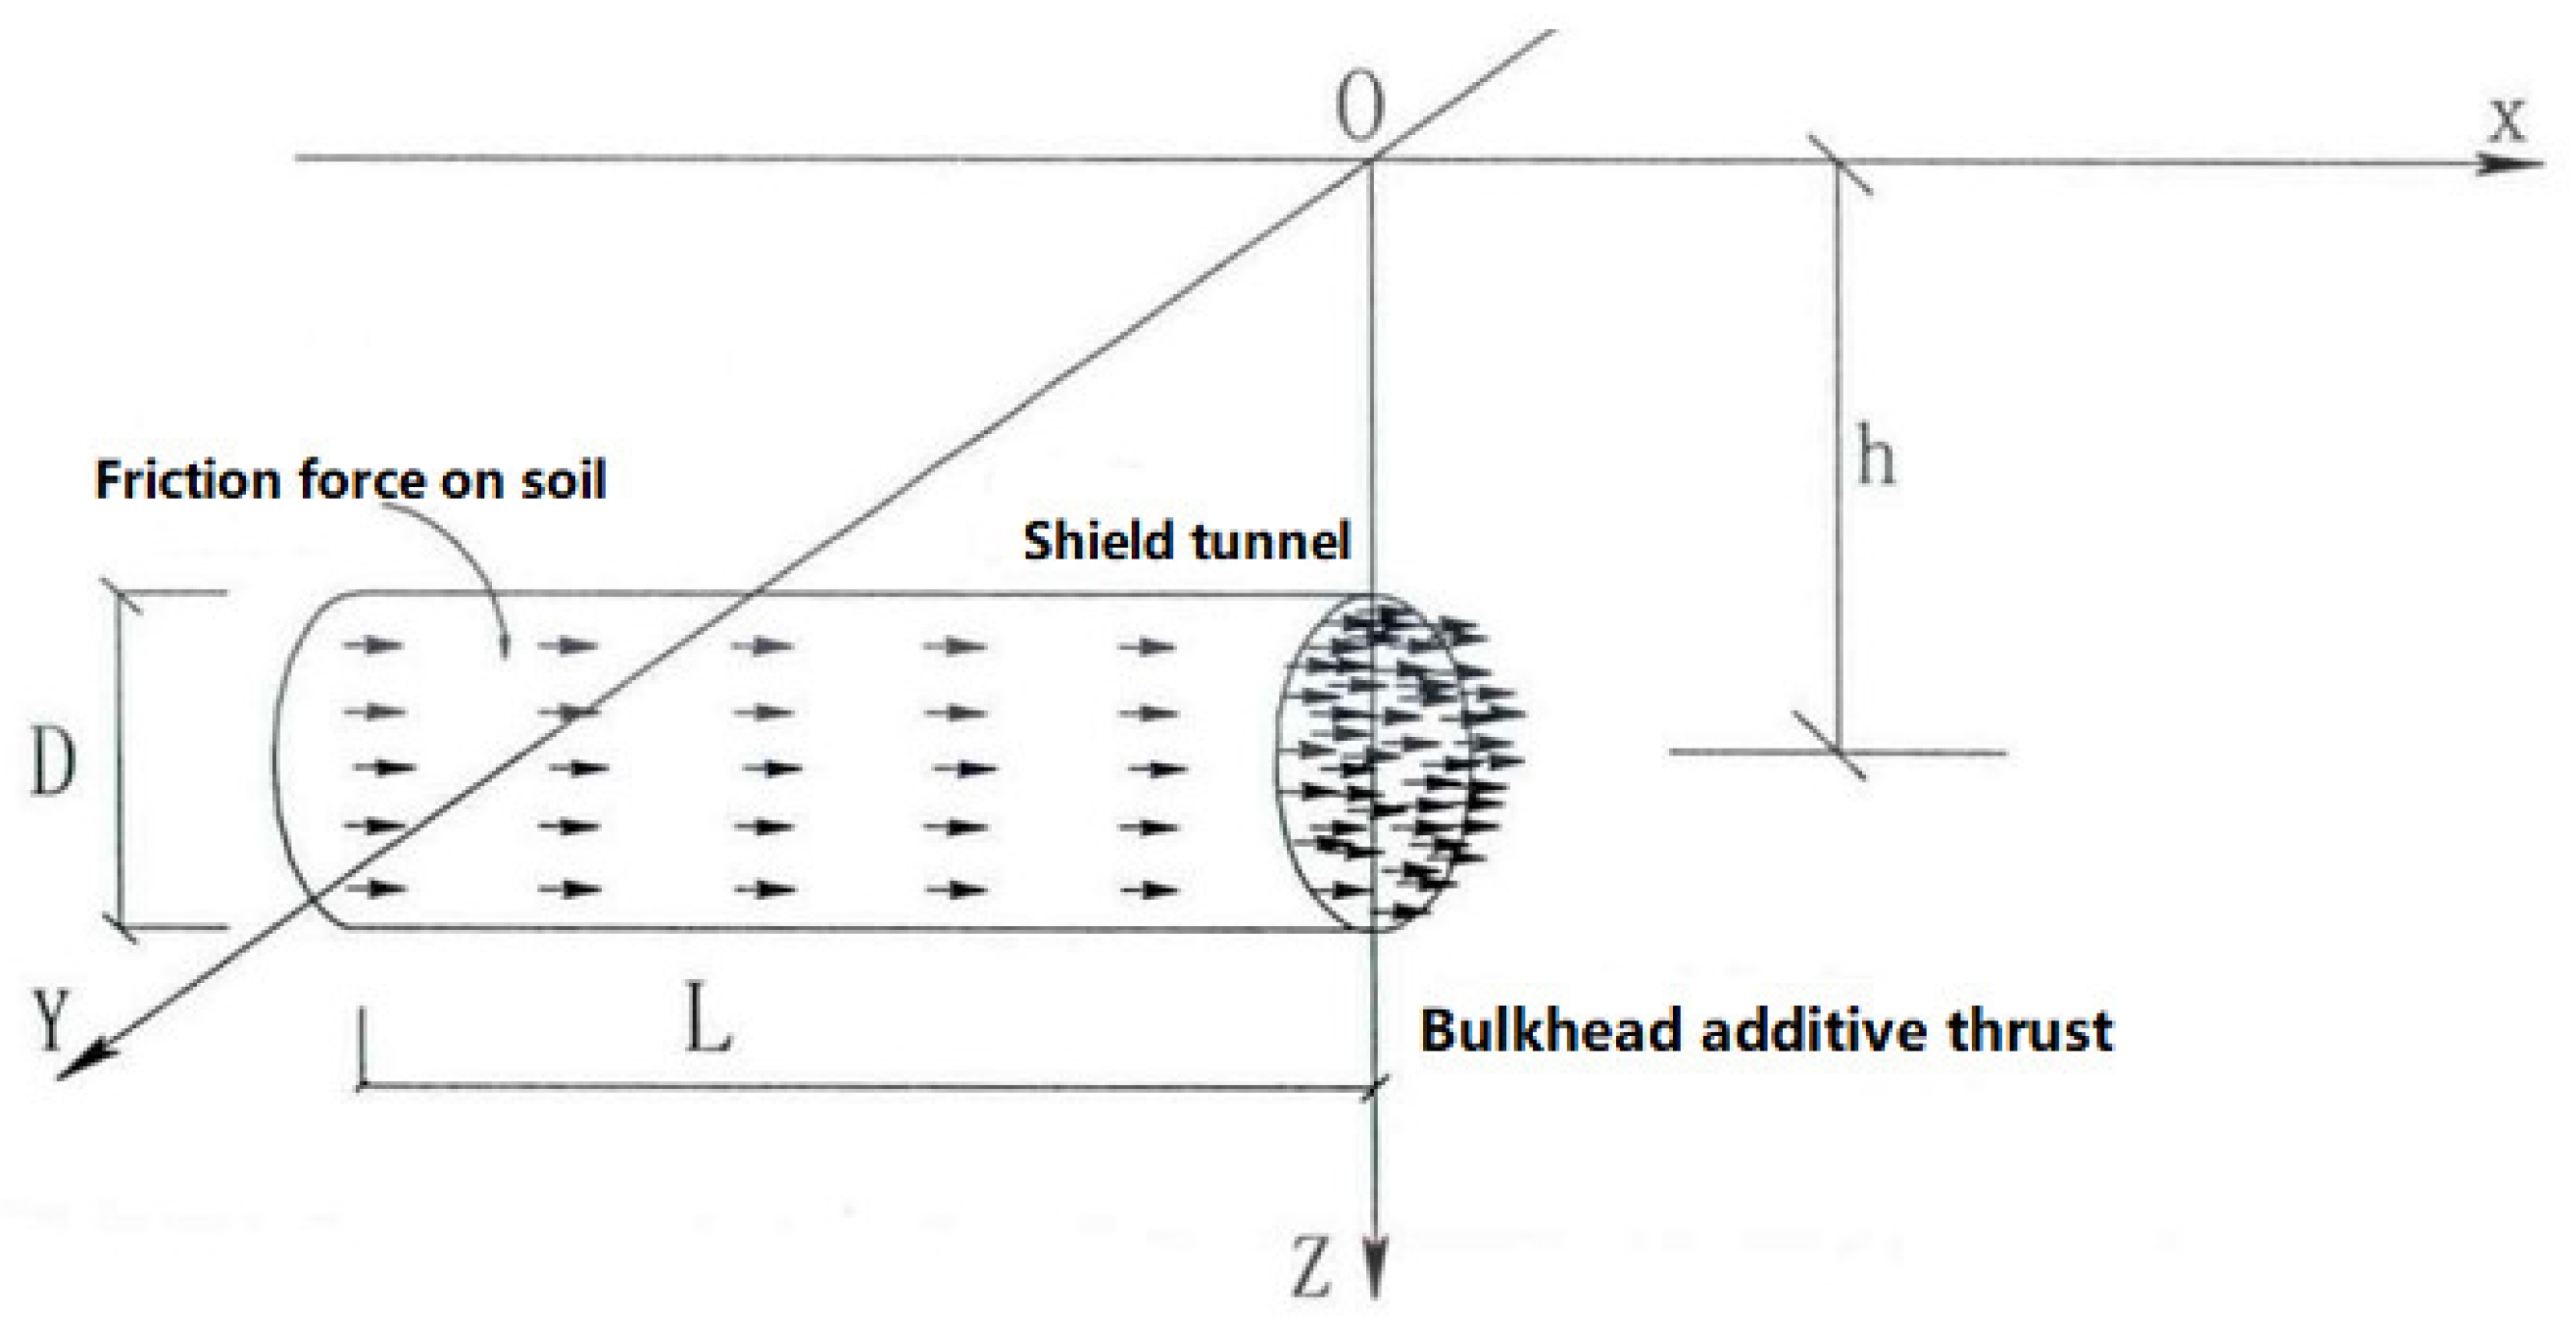
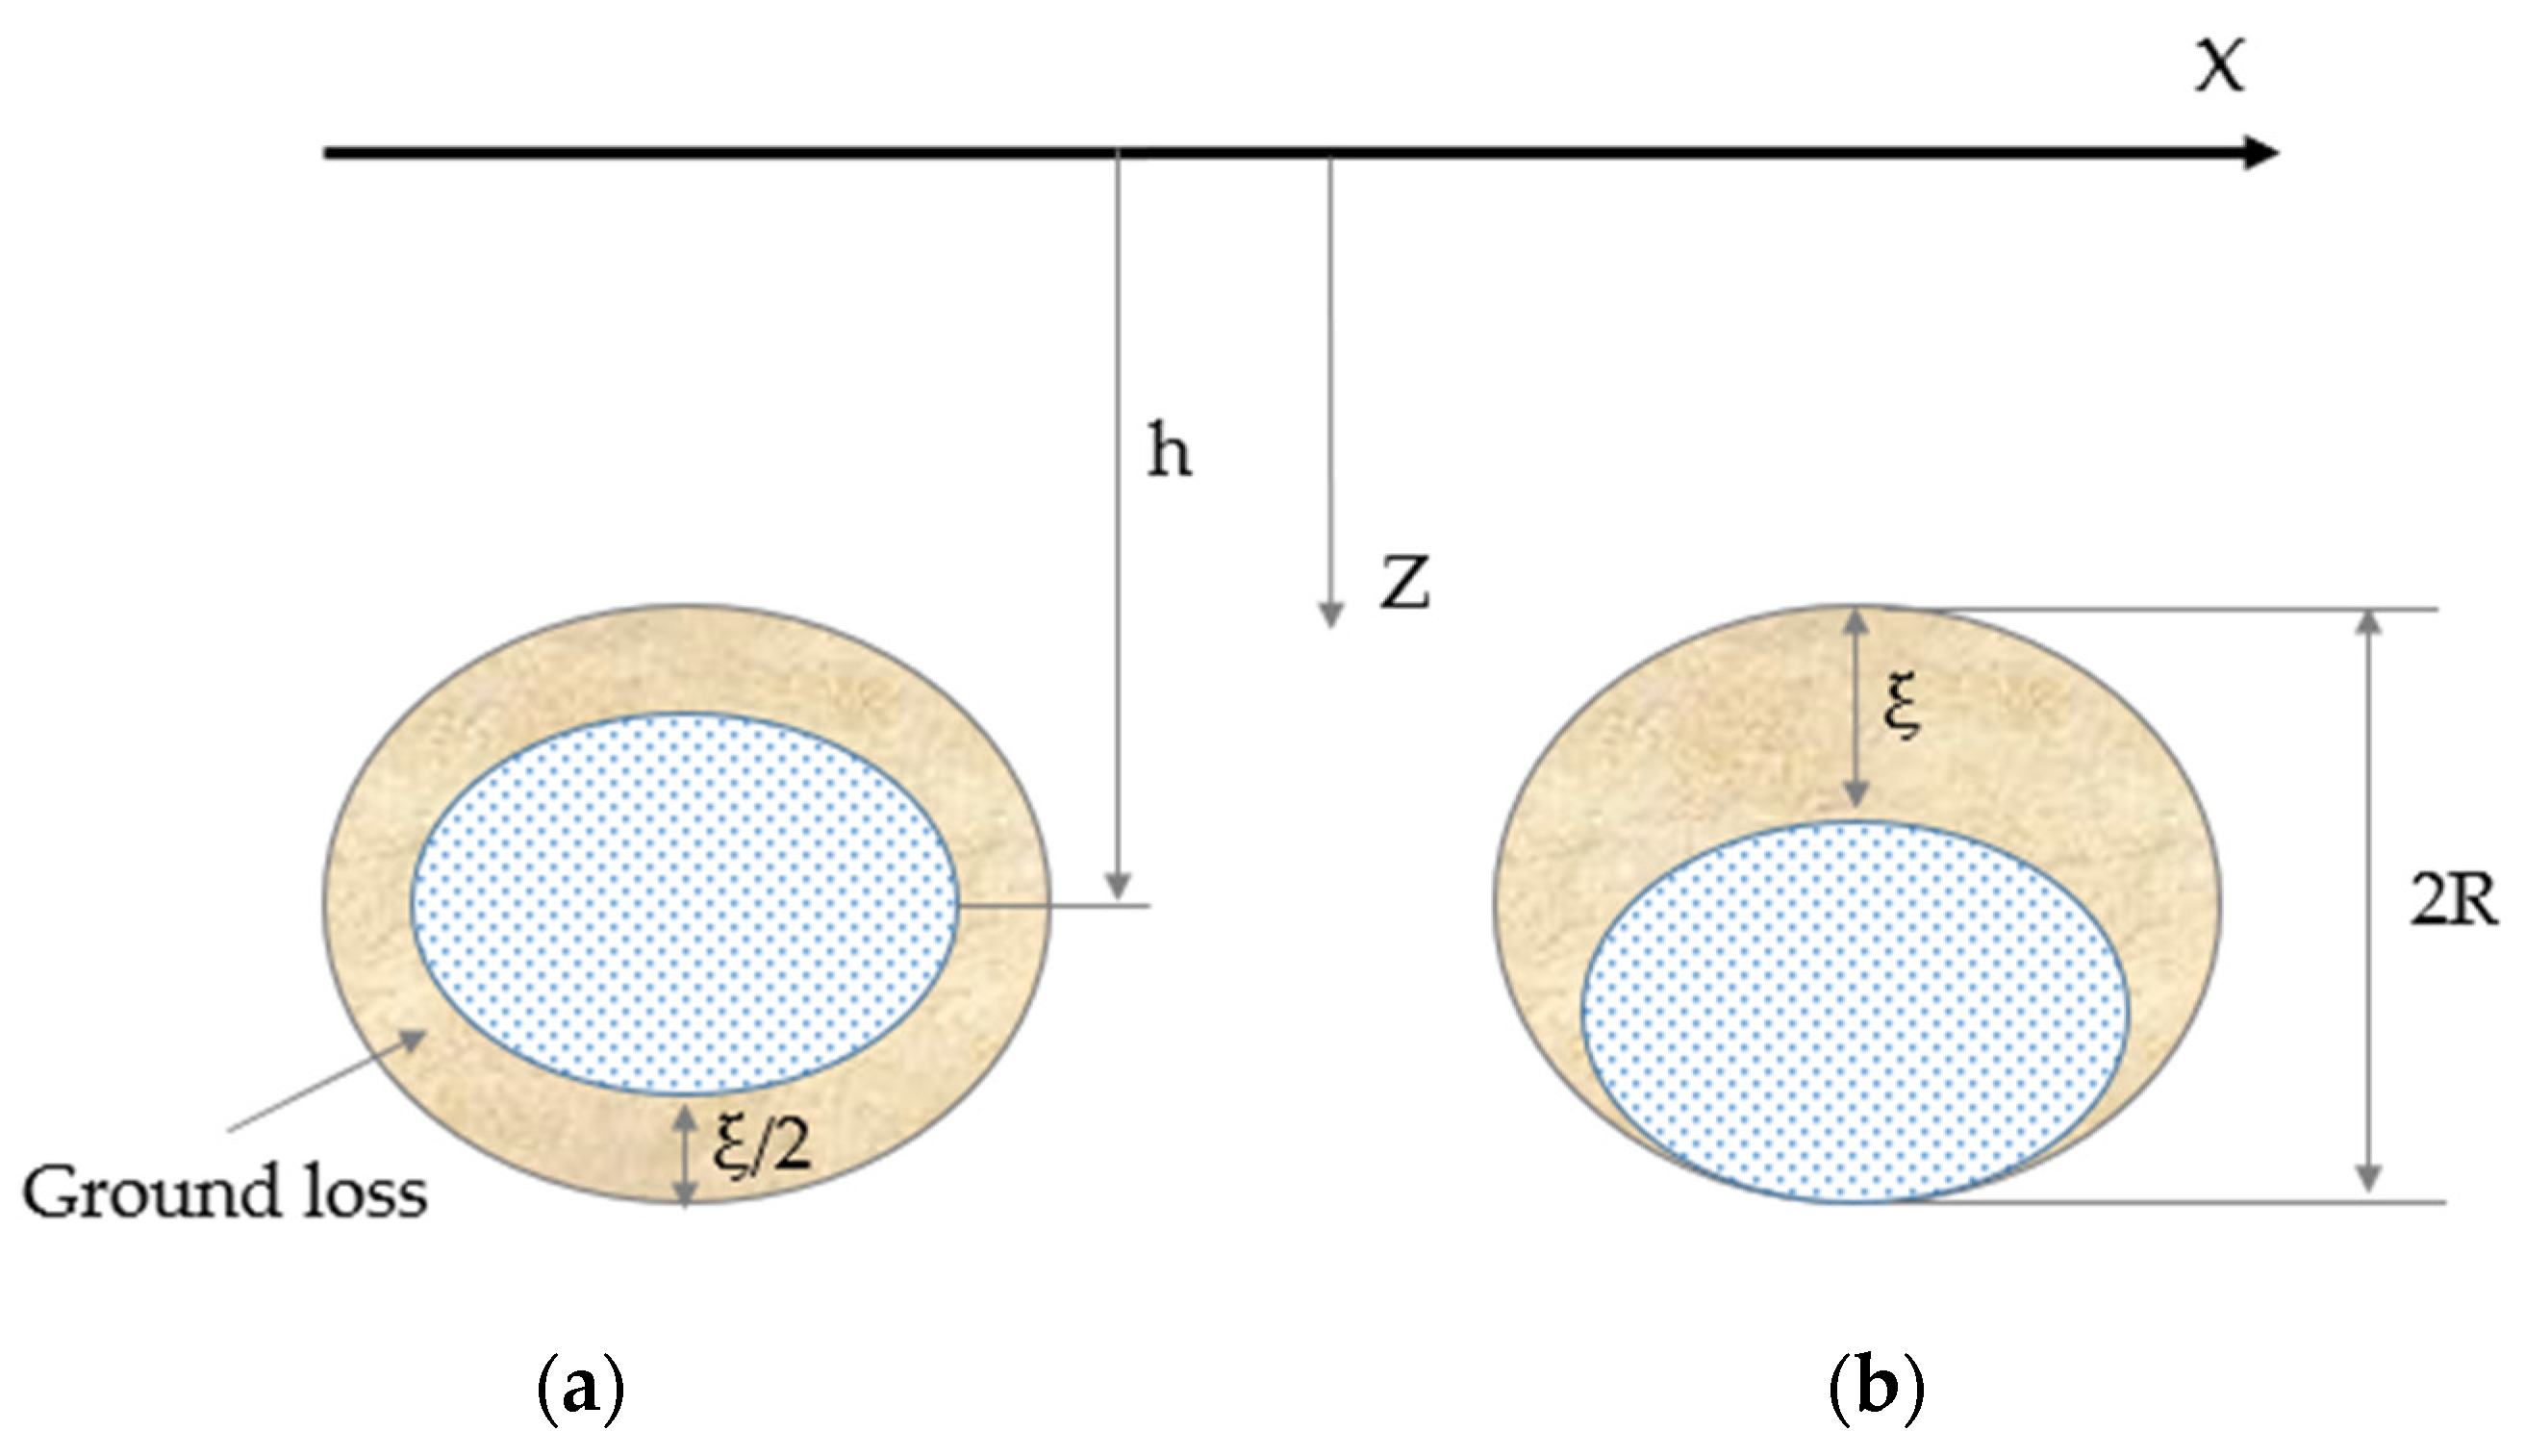
Ground loss is defined as the difference between the actual excavated soil volume and the completed tunnel volume during shield construction. It is the main reason for the stratum settlement caused by shield construction. In the case of undrained and uncompressed soil volume, the horizontal surface will be reduced. The settlement follows a normal curve distribution. To avoid the kowtow phenomenon in the process of shield construction, a slightly upward thrust attitude is generally adopted. When the lining is separated from the shield tail due to the influence of its weight, the lining will exert pressure on the lower soil, resulting in a small amount of movement in the lower soil, while the loosened surrounding soil will produce elastic–plastic soil displacement in the direction of the shield excavation surface. In general, we can consider soil as a uniform linear elastic semi-infinite body, but in specific cases, when the soil is subjected to extreme stress or deformation, it may also exhibit elastic–plastic behavior. In this case, more complex elastic–plastic models are needed to analyze and calculate the deformation and displacement of the soil. Based on the above actual situation, some scholars [22] proposed a ground loss model with two circles tangent to each other on the ground loss model of Sagaseta [23] where the soil moves into a uniformly distributed center. The specific ground loss model is shown in Figure 3.
In Figure 3, the elliptical shape is in some cases related to factors such as soil properties and loss direction. For example, under infiltration conditions, the flow line of the soil will deflect and converge. Moreover, as the depth increases, the density of the streamline will gradually decrease, forming an elliptical loss area.
Sagaseta proposed the source–sink method in 1987 to solve the displacement field problem caused by the ground loss in an elastic semi-infinite body. The virtual boundary condition of the semi-infinite body is solved by using a mirror image source.
The steps of source–sink analysis are as follows:
- (1)
- The true source is in an isotropic linear elastic semi-infinite body, which produces normal stress and shear stress τ0 on the ground.
- (2)
- There is a sink that produces an expansion effect above the ground corresponding to the source, which generates a normal stress − in the opposite direction and τ0 in the same direction on the ground, then the normal stress originally not on the ground is eliminated, and the generated stress is accumulated with the stress generated by the source in the first step, and the resultant stress is calculated.
- (3)
- The normal stress generated by the source and the sink is offset, and the ground produces twice the shear stress, and the additional shear stress generated by the sink is reversed to the surface to eliminate the residual shear stress on the ground.
Some scholars [24] assume that the volume is constant and a hole with an interval radius of α (unit: m) collapses and the soil moves radially, the relationship formula for any point from the hole is obtained as follows:
From the Formula (1), S represents displacement, m. r is the distance from any point to the hole, m. It can be concluded that the displacement in the X, Y, and Z directions generated at any point (x, y, z) by the interval radius a (unit: m) at the point () is:
In Formula (2),
The displacement in the X, Y, and Z directions generated by the mirror point () corresponding to the source and the same volume expansion of the source (x, y, z) is:
In Formula (4),
The additional stress (unit: kPa) in the X, Y, and Z directions generated by the superposition of the first and second steps to the surrounding soil (x, y, z) are:
Among them, E is the elastic modulus, MPa. μ is the Poisson’s ratio of the soil.
React the shear forces generated in the first and second steps on the surface of the soil, and integrate the Cerruti solution of the horizontal force acting on the surface of a linear elastic semi-infinite body to obtain the additional stresses in the X, Y, and Z directions generated at any point (x, y, z) in the third step of the soil:
In Formula (11),
The additional stress generated by these three steps is accumulated, and the gap of radius a at a point () in the semi-infinite body is generated at any point (x, y, z) in the X, Y, and Z directions. The total additional stress component expression is:
The buried depth of the Barcelona Subway Network [25] axis is h = 10.0 m, and the diameter is D = 8.0 m. The soil is reddish–brown clay. The equivalent ground loss parameter ξ = 31 mm, which is η = 0.77%. Due to poor soil quality, the distance between the focal point and the center point of the tunnel is d = 0. The results show that the calculation results of this method are in good agreement with the measured values. When µ = 0.5, the maximum settlement value calculated by the Loganathan formula is consistent with the lower bound solution in this paper, and the ground settlement curve calculated by the method in this paper is very close to the calculation result of the Loganathan formula, verifying the correctness of the method in this paper.
The additional thrust on the shield excavation surface will cause the soil in front of the cutter head to undergo a compression loading stage. The frictional force at the interface between the shield shell and the surrounding soil can cause the shear failure of the soil in a certain area around the shield shell. The detachment of the shield tail from the lining will create a building gap between the lining and the soil, causing radial displacement of the surrounding soil and unloading. Synchronous grouting pressure will have a loading effect on the soil around the shield tunnel. The undisturbed natural soil has obvious anisotropy, and after being subjected to certain stress and strain, it can induce anisotropy, cause changes or damage to the spatial structure of the soil, cause deformation of the soil, and affect the stress–strain relationship of the soil for further loading [26].
3. Results
Starting from Sagaseta’s source–sink method, the additional soil stress values generated by the first two steps and the third step of surface shear stress obtained by the source–sink method are superimposed, as shown in Formulas (13)–(15), to study the additional soil stress generated at the tail of the shield. In this paper, the left section of a certain section of a subway line is studied, and the Loganathan ground movement pattern is used for calculation. The numerical integration of the function is carried out by using MATLAB R2021a [27] to obtain the distribution law of the additional stress components generated by the shield tail ground loss in the soil around the shield on the X-axis and Z-axis. The relationship between the damping ratio of the settlement trough VL and the equivalent ground loss parameter ξ is:
where R is the tunnel radius.
The damping ratio of the settlement trough formation VL = 0.529%, which can be substituted into Formula (16) to obtain ξ = 0.067 m. In this section, the burial depth of the shield tunnel axis is h = 22 m. If the excavation area of the shield is set to A1 and the area becomes A2 after the cross-section constricts, then there is ΔA = A1 − A2, where the burial depth of the central axis of the A1 circular cross–section is h and the radius is R. The buried depth of the axis in the A2 circular section is h + ξ/2, and the radius is R − ξ/2. After repeated calculations, the additional stress range of the soil layer caused by shield tunneling is about 20 m in front of the shield tail. Therefore, the distance of the ground loss studied in this article in the direction of shield tunneling is 30 m, which is L = 30 m.
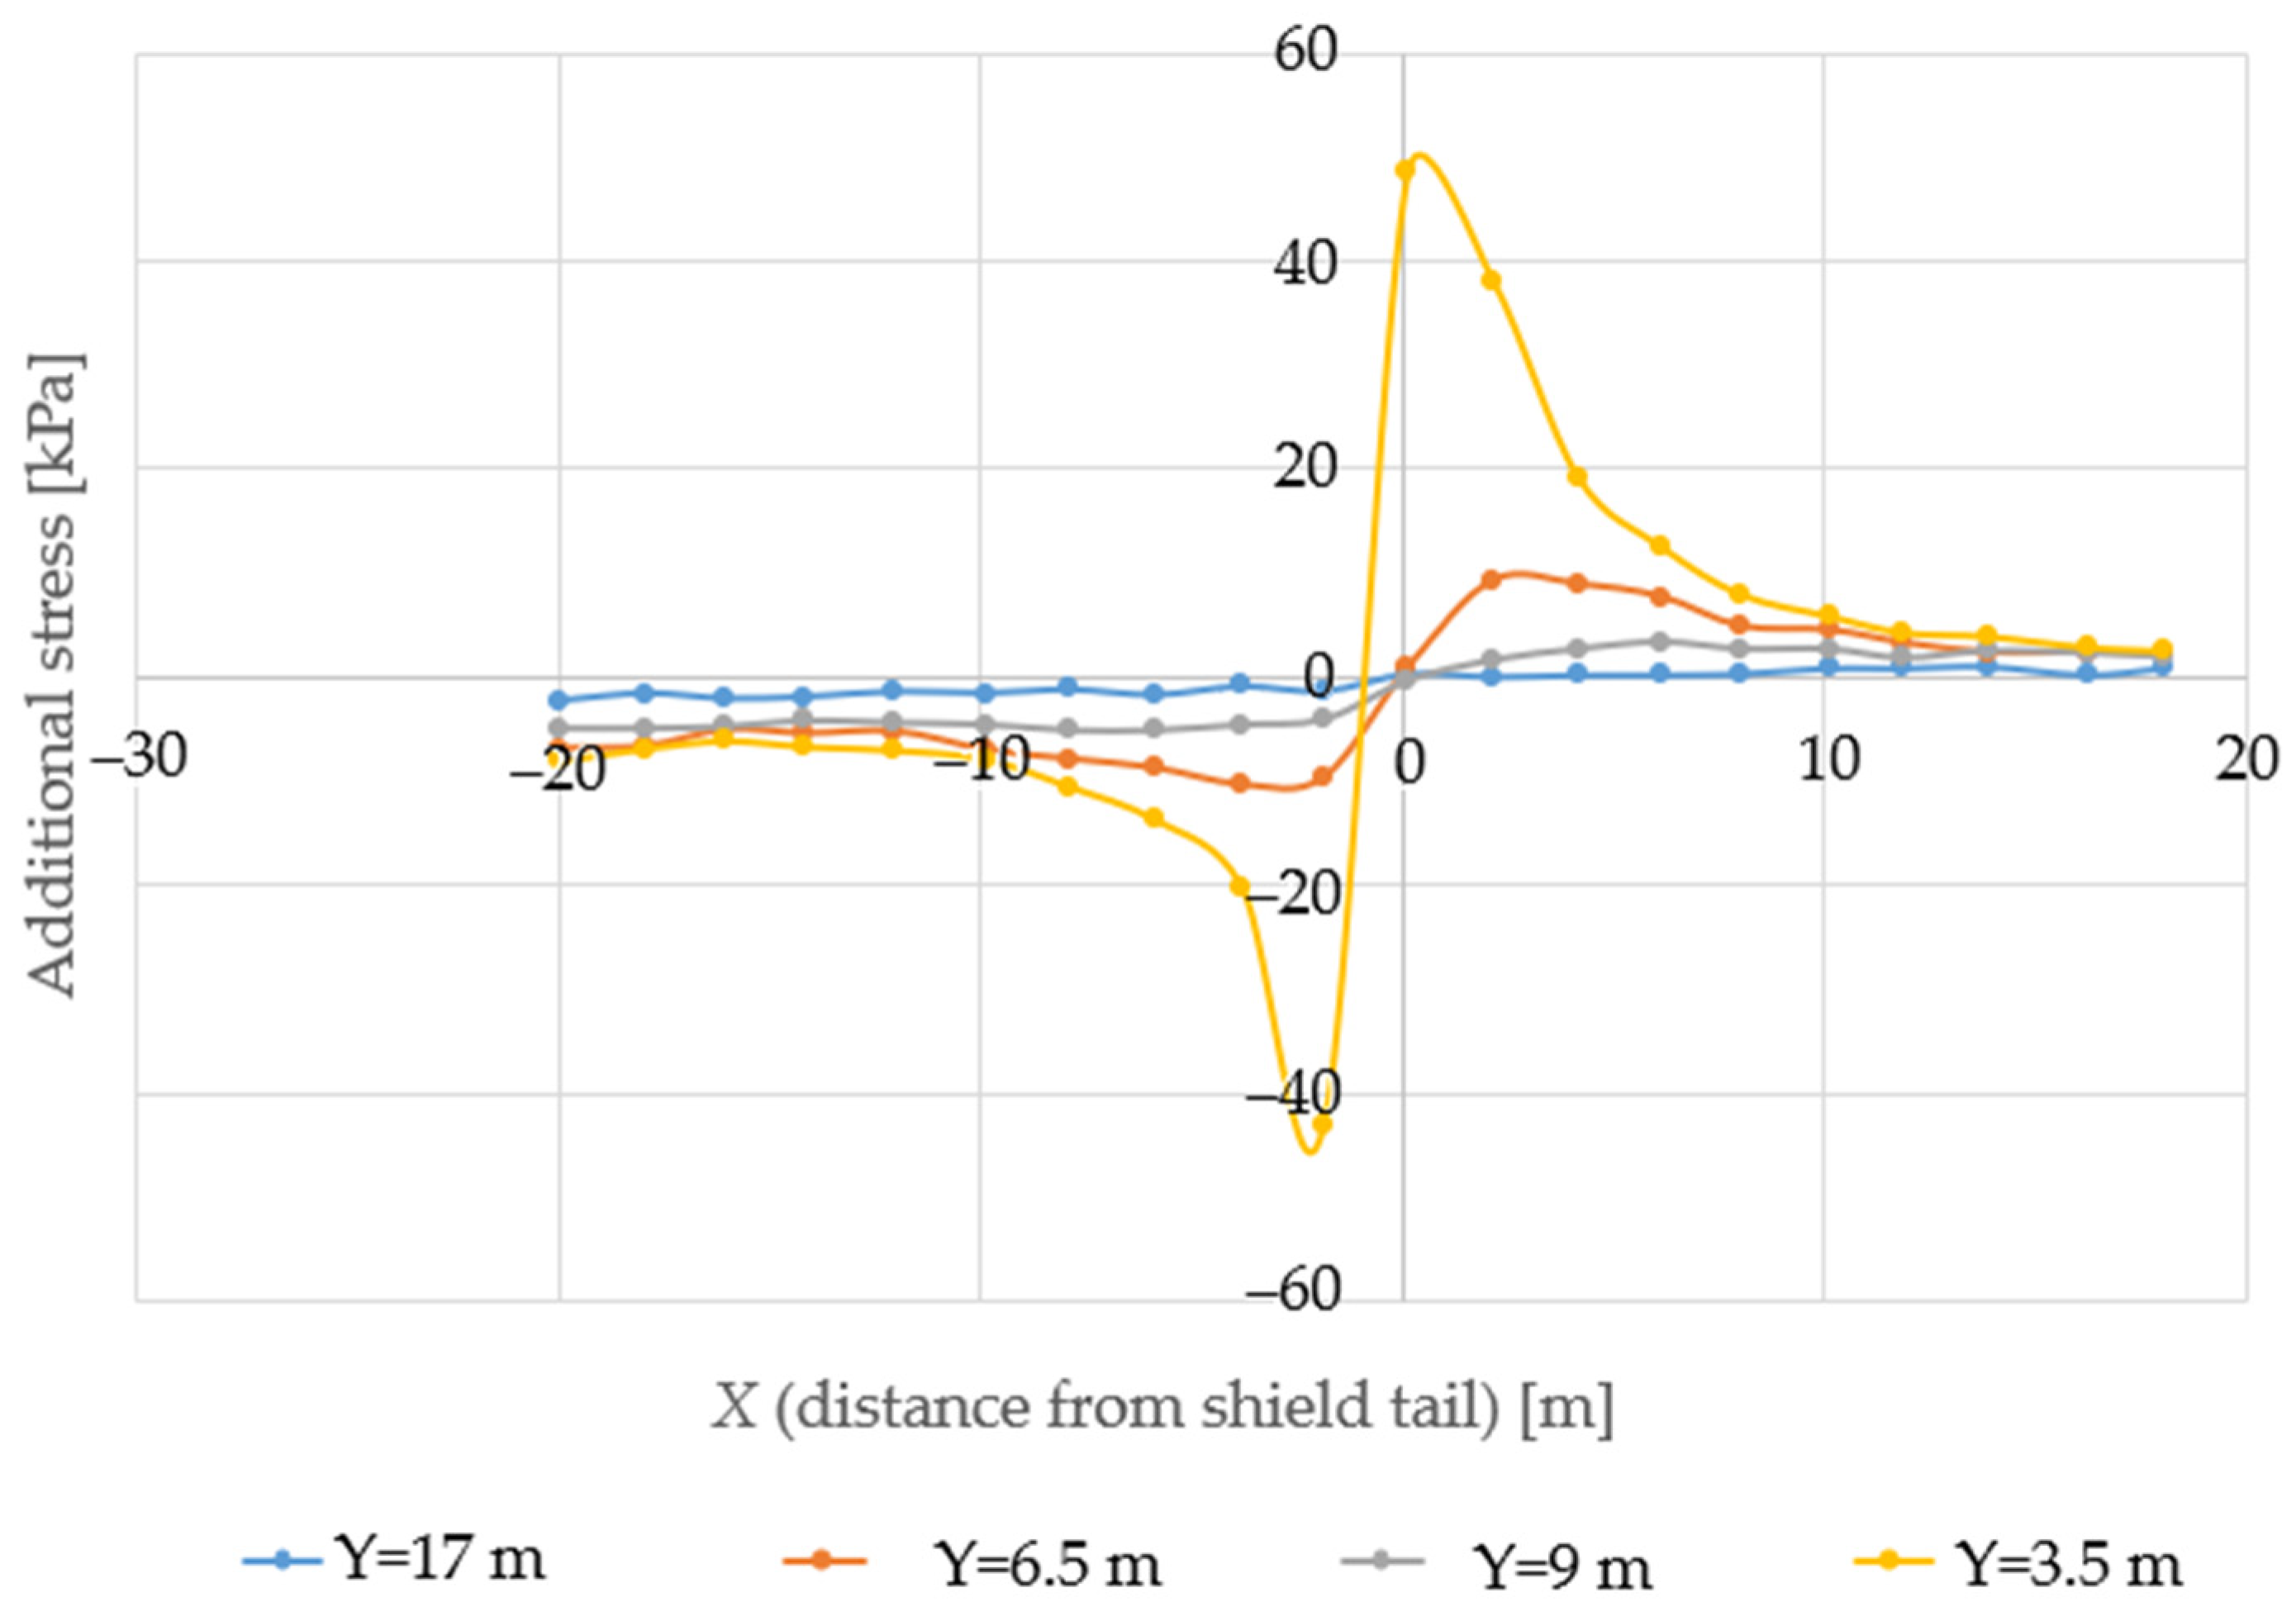
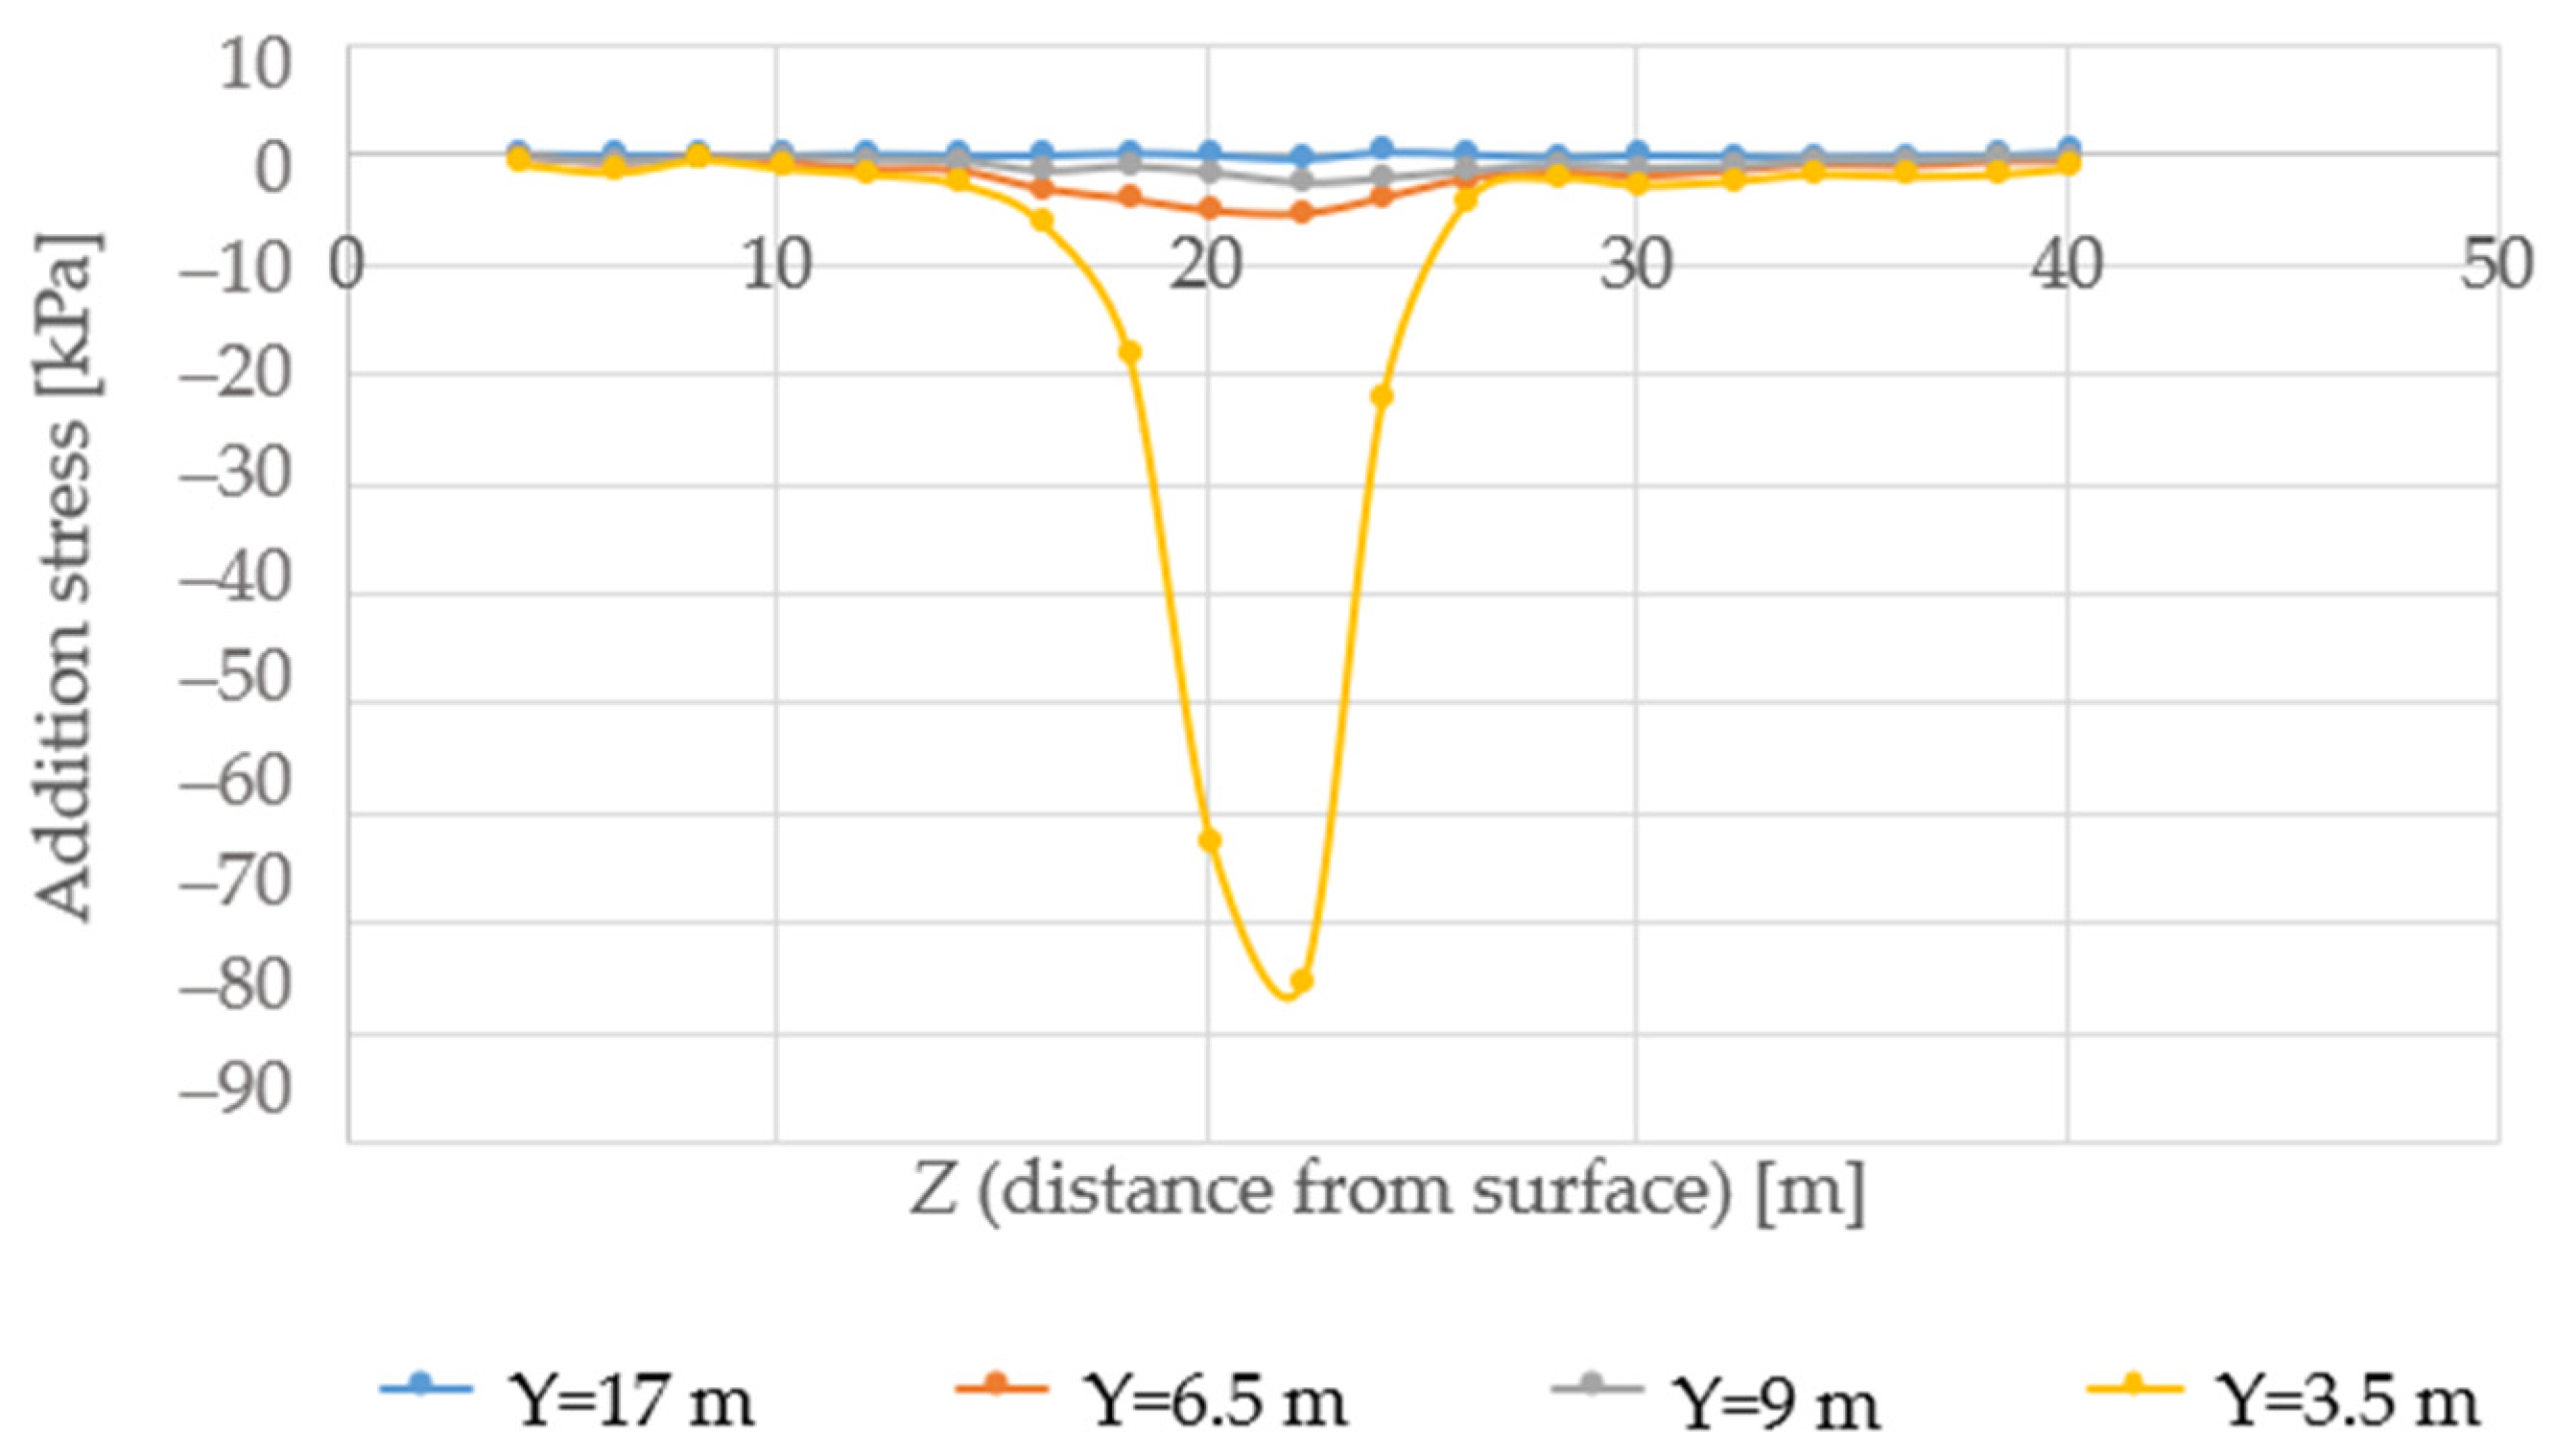
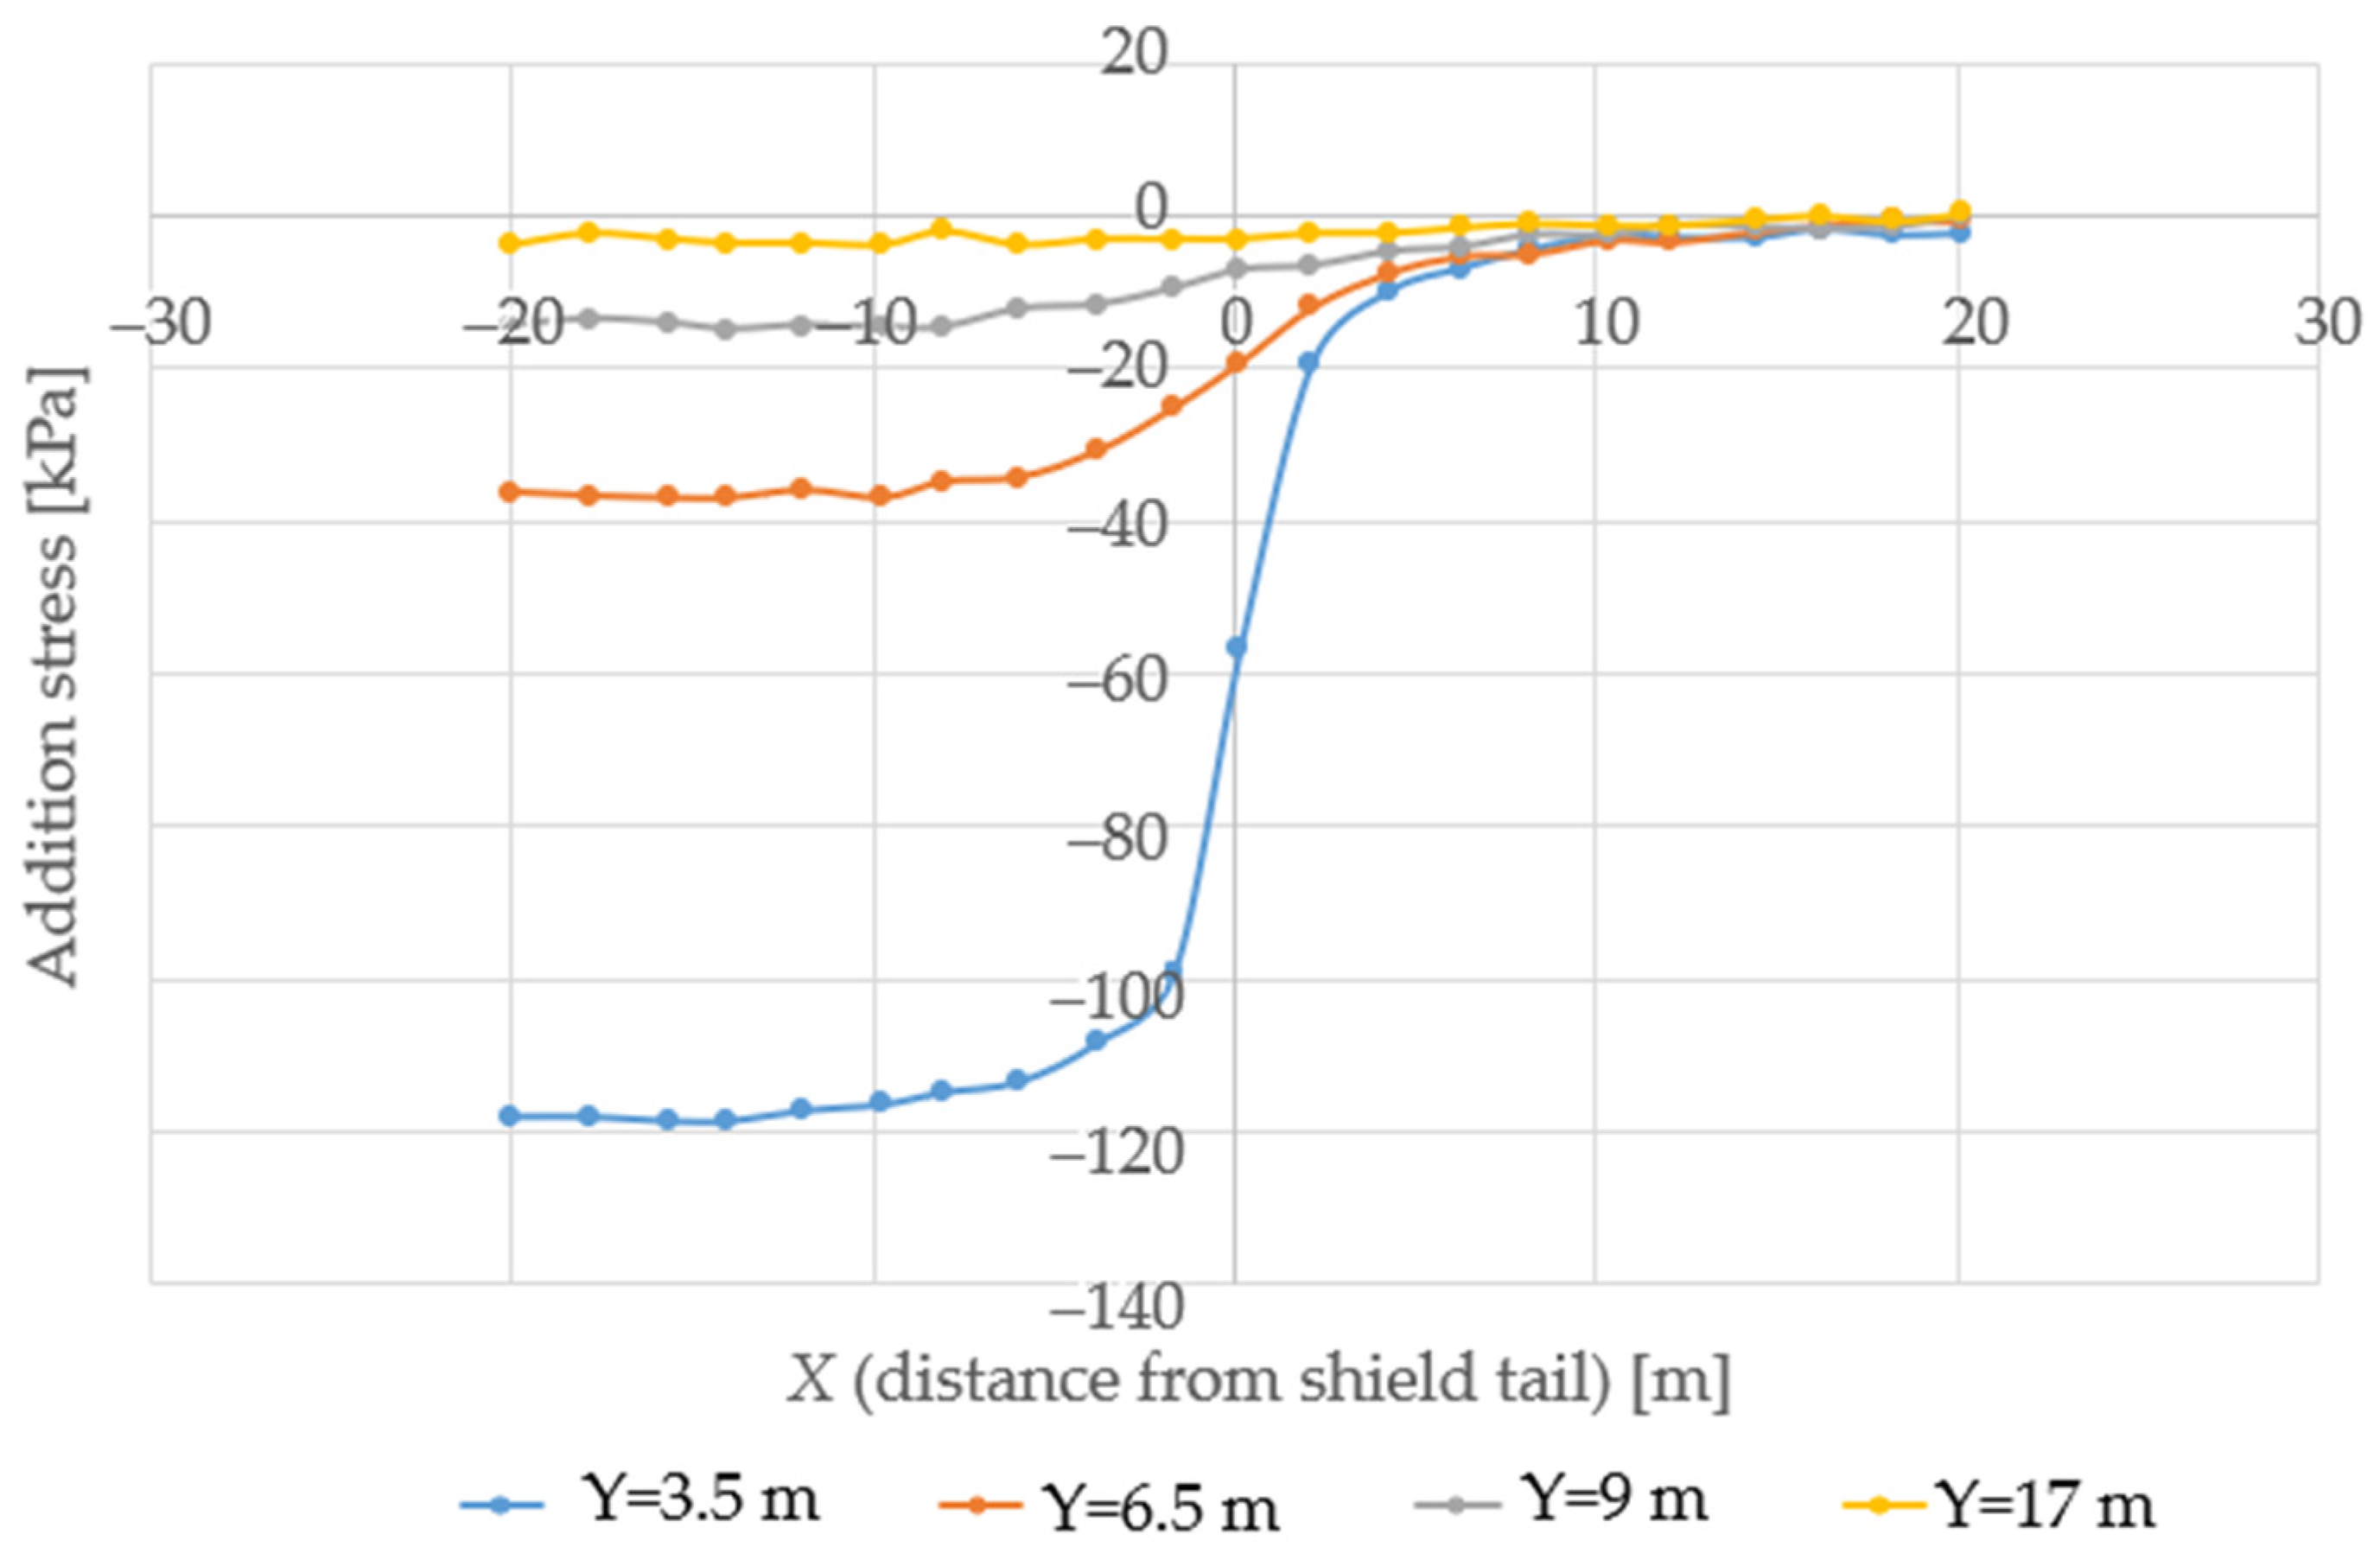
According to on-site investigation data, the soil layer that the shield tunneling passes through is composed of silty clay (–3b1–2) and silty clay (–4b1–2). To simplify the calculation, the two layers of soil are considered uniform soil layers. The compressive modulus of the uniform soil layer is taken as the weighted compressive modulus of the two layers of soil, Es = (Es1 + Es2)/2 = 7.5465 MPa. Using the elastic modulus of soil E = (1 − 2 2/(1 − μ)Es, calculate E = 5.526 MPa. The additional stress value generated by the ground loss caused by shield tunneling on the surrounding soil layer can be obtained. At Z = 22 m, that is, at the axis of the shield, the distribution curve of the additional stress of the shield tail soil along the X axis caused by the ground loss is shown in Figure 4. The ground loss at −1 m away from the shield tail (0 m is the position of the shield tail) leads to the distribution curve of the additional stress of the shield tail soil along the axial direction as shown in Figure 5.
From Figure 4 and Figure 5, it can be seen that in the X-axis direction, the additional stress of the soil behind the shield tail is the additional tensile stress. Specifically, it causes the loosening of the surrounding soil. Its range of action is about 10 m (1.6 × D) from the tail of the shield. The closer it is to the tail of the shield, the greater its value, while in front of the tail of the shield, there is an additional compressive stress zone. Its value and distribution are anti-symmetric concerning the additional tensile stress zone at the shield tail (0 m). The uneven settlement of the strata caused by the additional stress of compression and tension will cause the building in the forward direction of the shield to undergo bending deformation. In the Y-axis direction, the additional stress decays rapidly, and its value tends to zero at 9.50 m (1.5 × D) away from the central axis of the shield. At the X = −1 m section, as shown in Figure 5, the additional tensile stress is symmetrical about the shield. The impact range is 8 m (1.3 × D), and the closer it is to the shield, the greater its value.
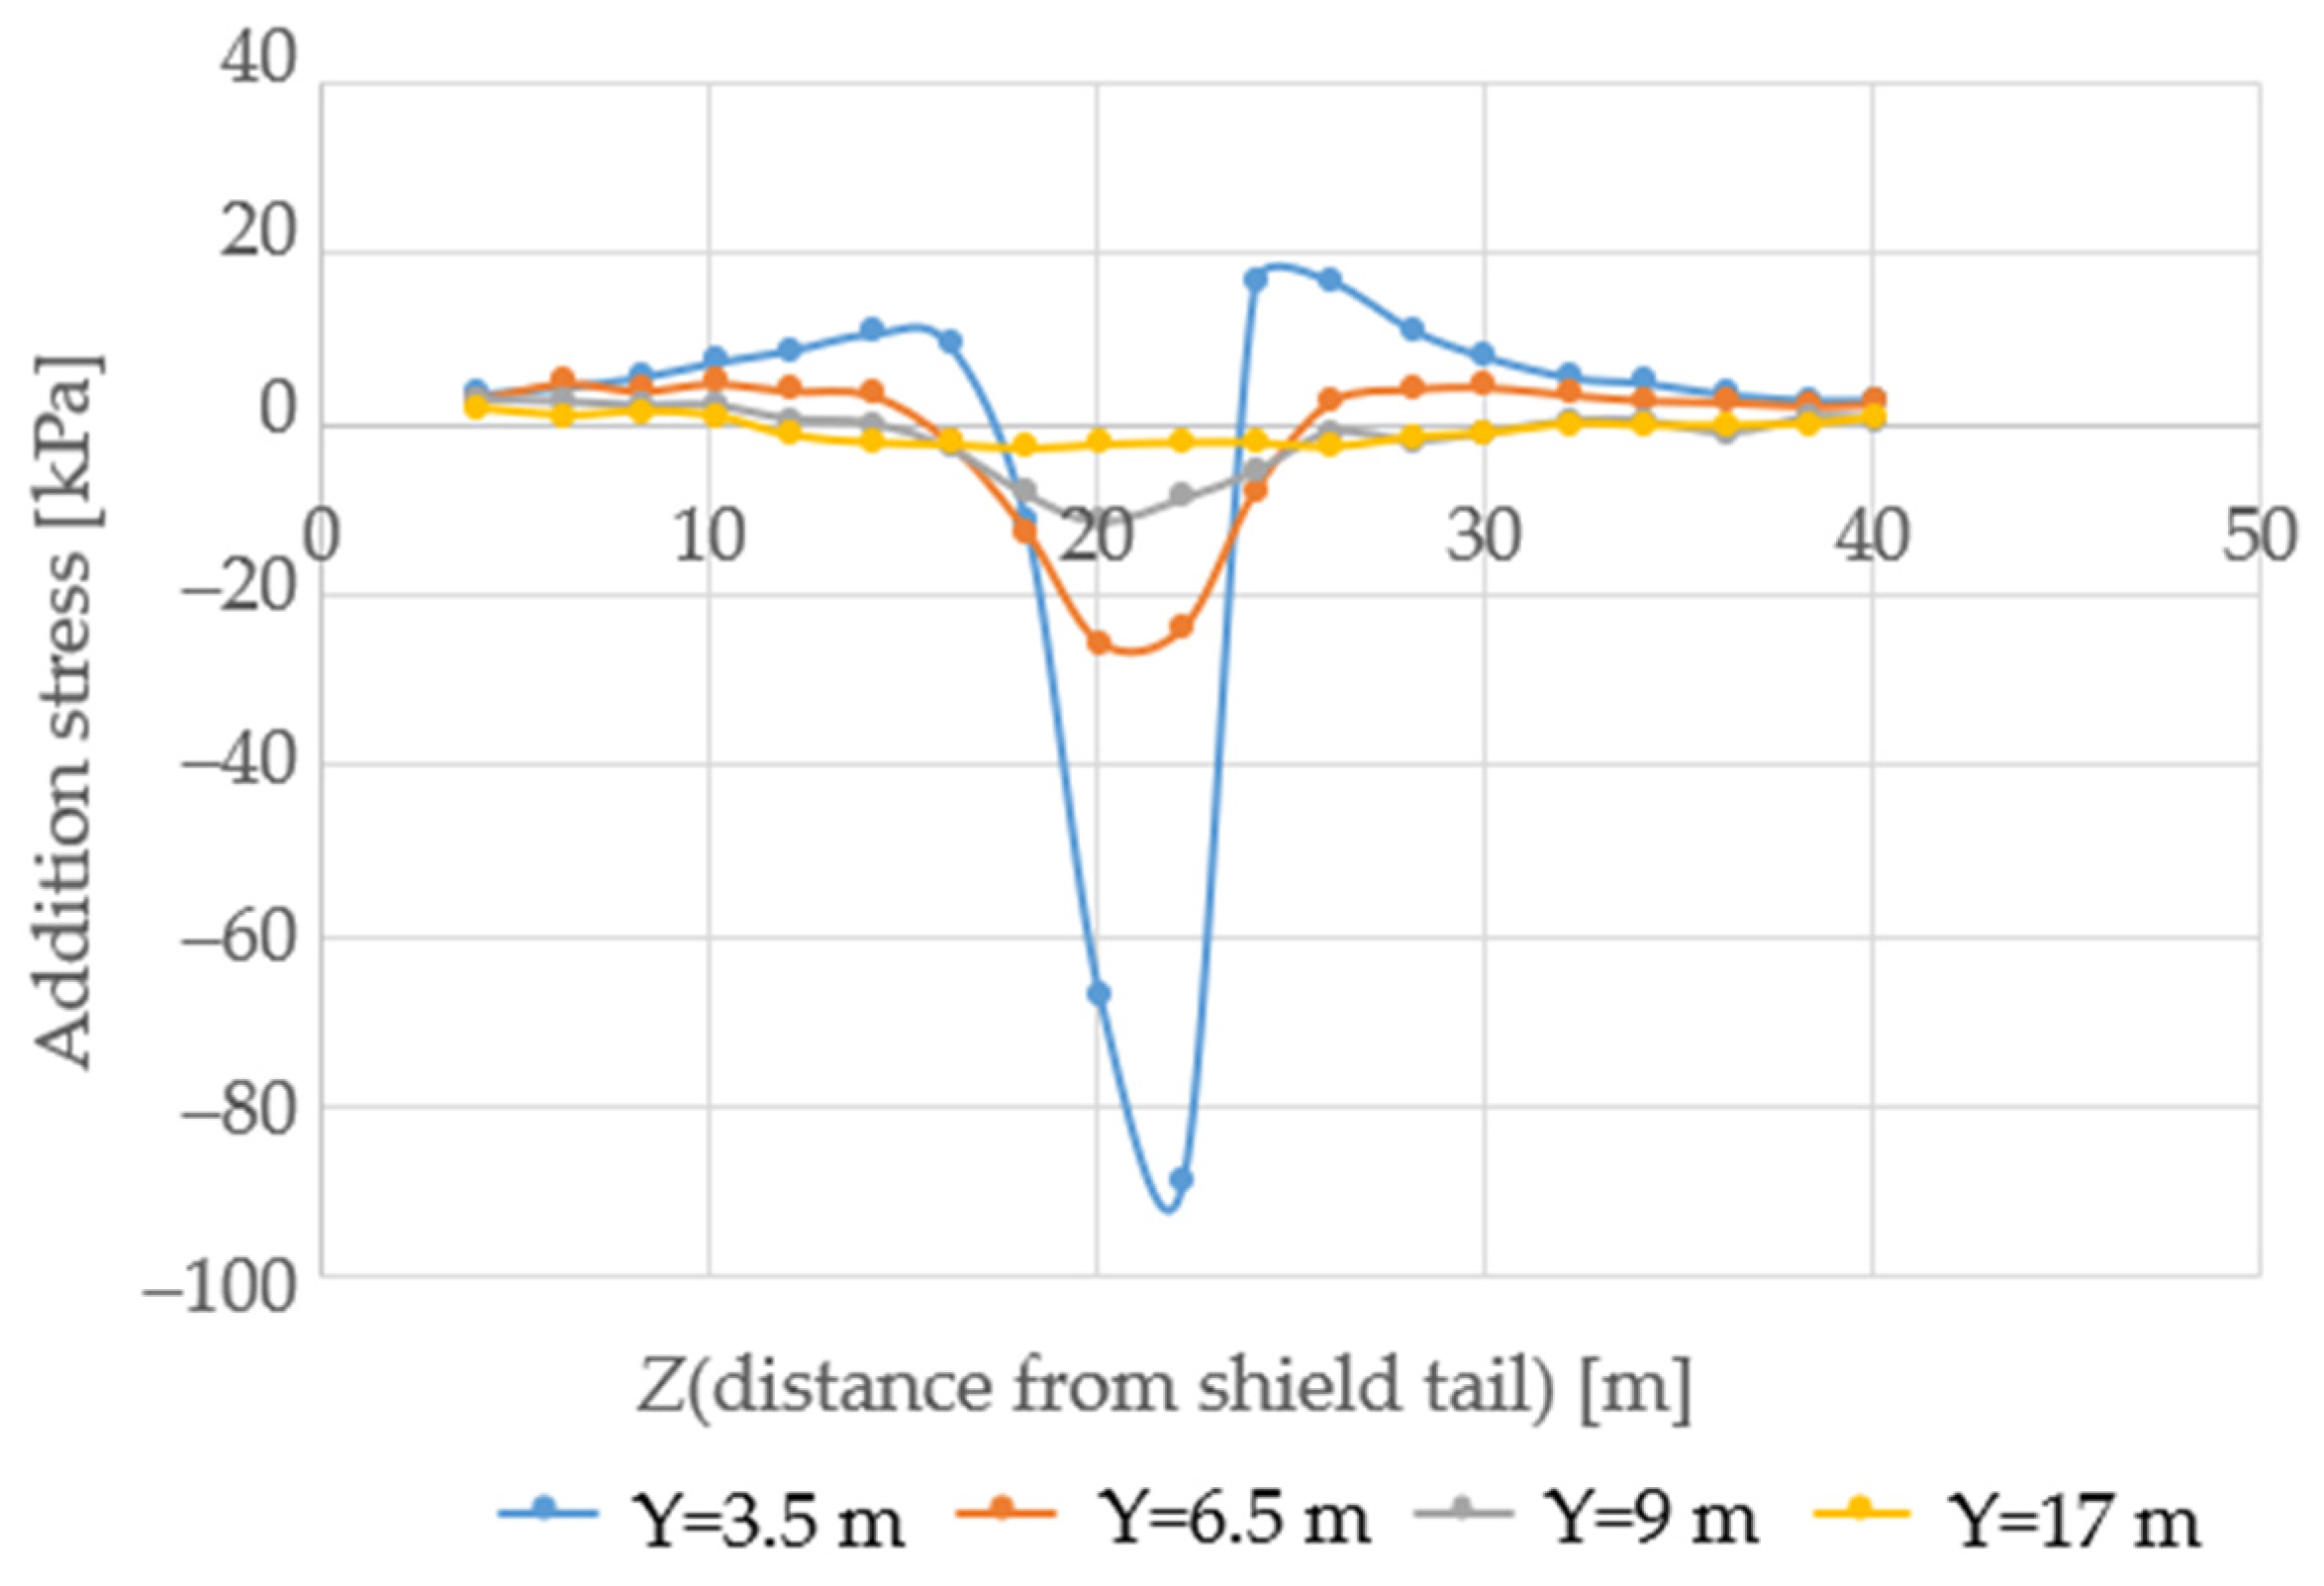
At the central axis of the shield, the ground loss causes the shield tail additional stress distribution curve along the X-axis direction as shown in Figure 6. The ground loss at X = −1 m from the shield tail (0 m is the position of the shield tail) leads to the distribution curve of the additional stress of the shield tail soil along the Z-axis direction as shown in Figure 7.
It can be seen from Figure 6 and Figure 7 that the value of the additional stress generated in the radial direction of the shield is relatively large, and the value of the additional tensile stress behind the shield tail remains unchanged. The additional stress decays rapidly in the Y-axis direction, leading to uneven settlement of the lateral surface and lateral deflection of the surrounding buildings. At X = −1 m, it can be seen that the range of additional tensile stress becomes smaller, and finally tends to zero.
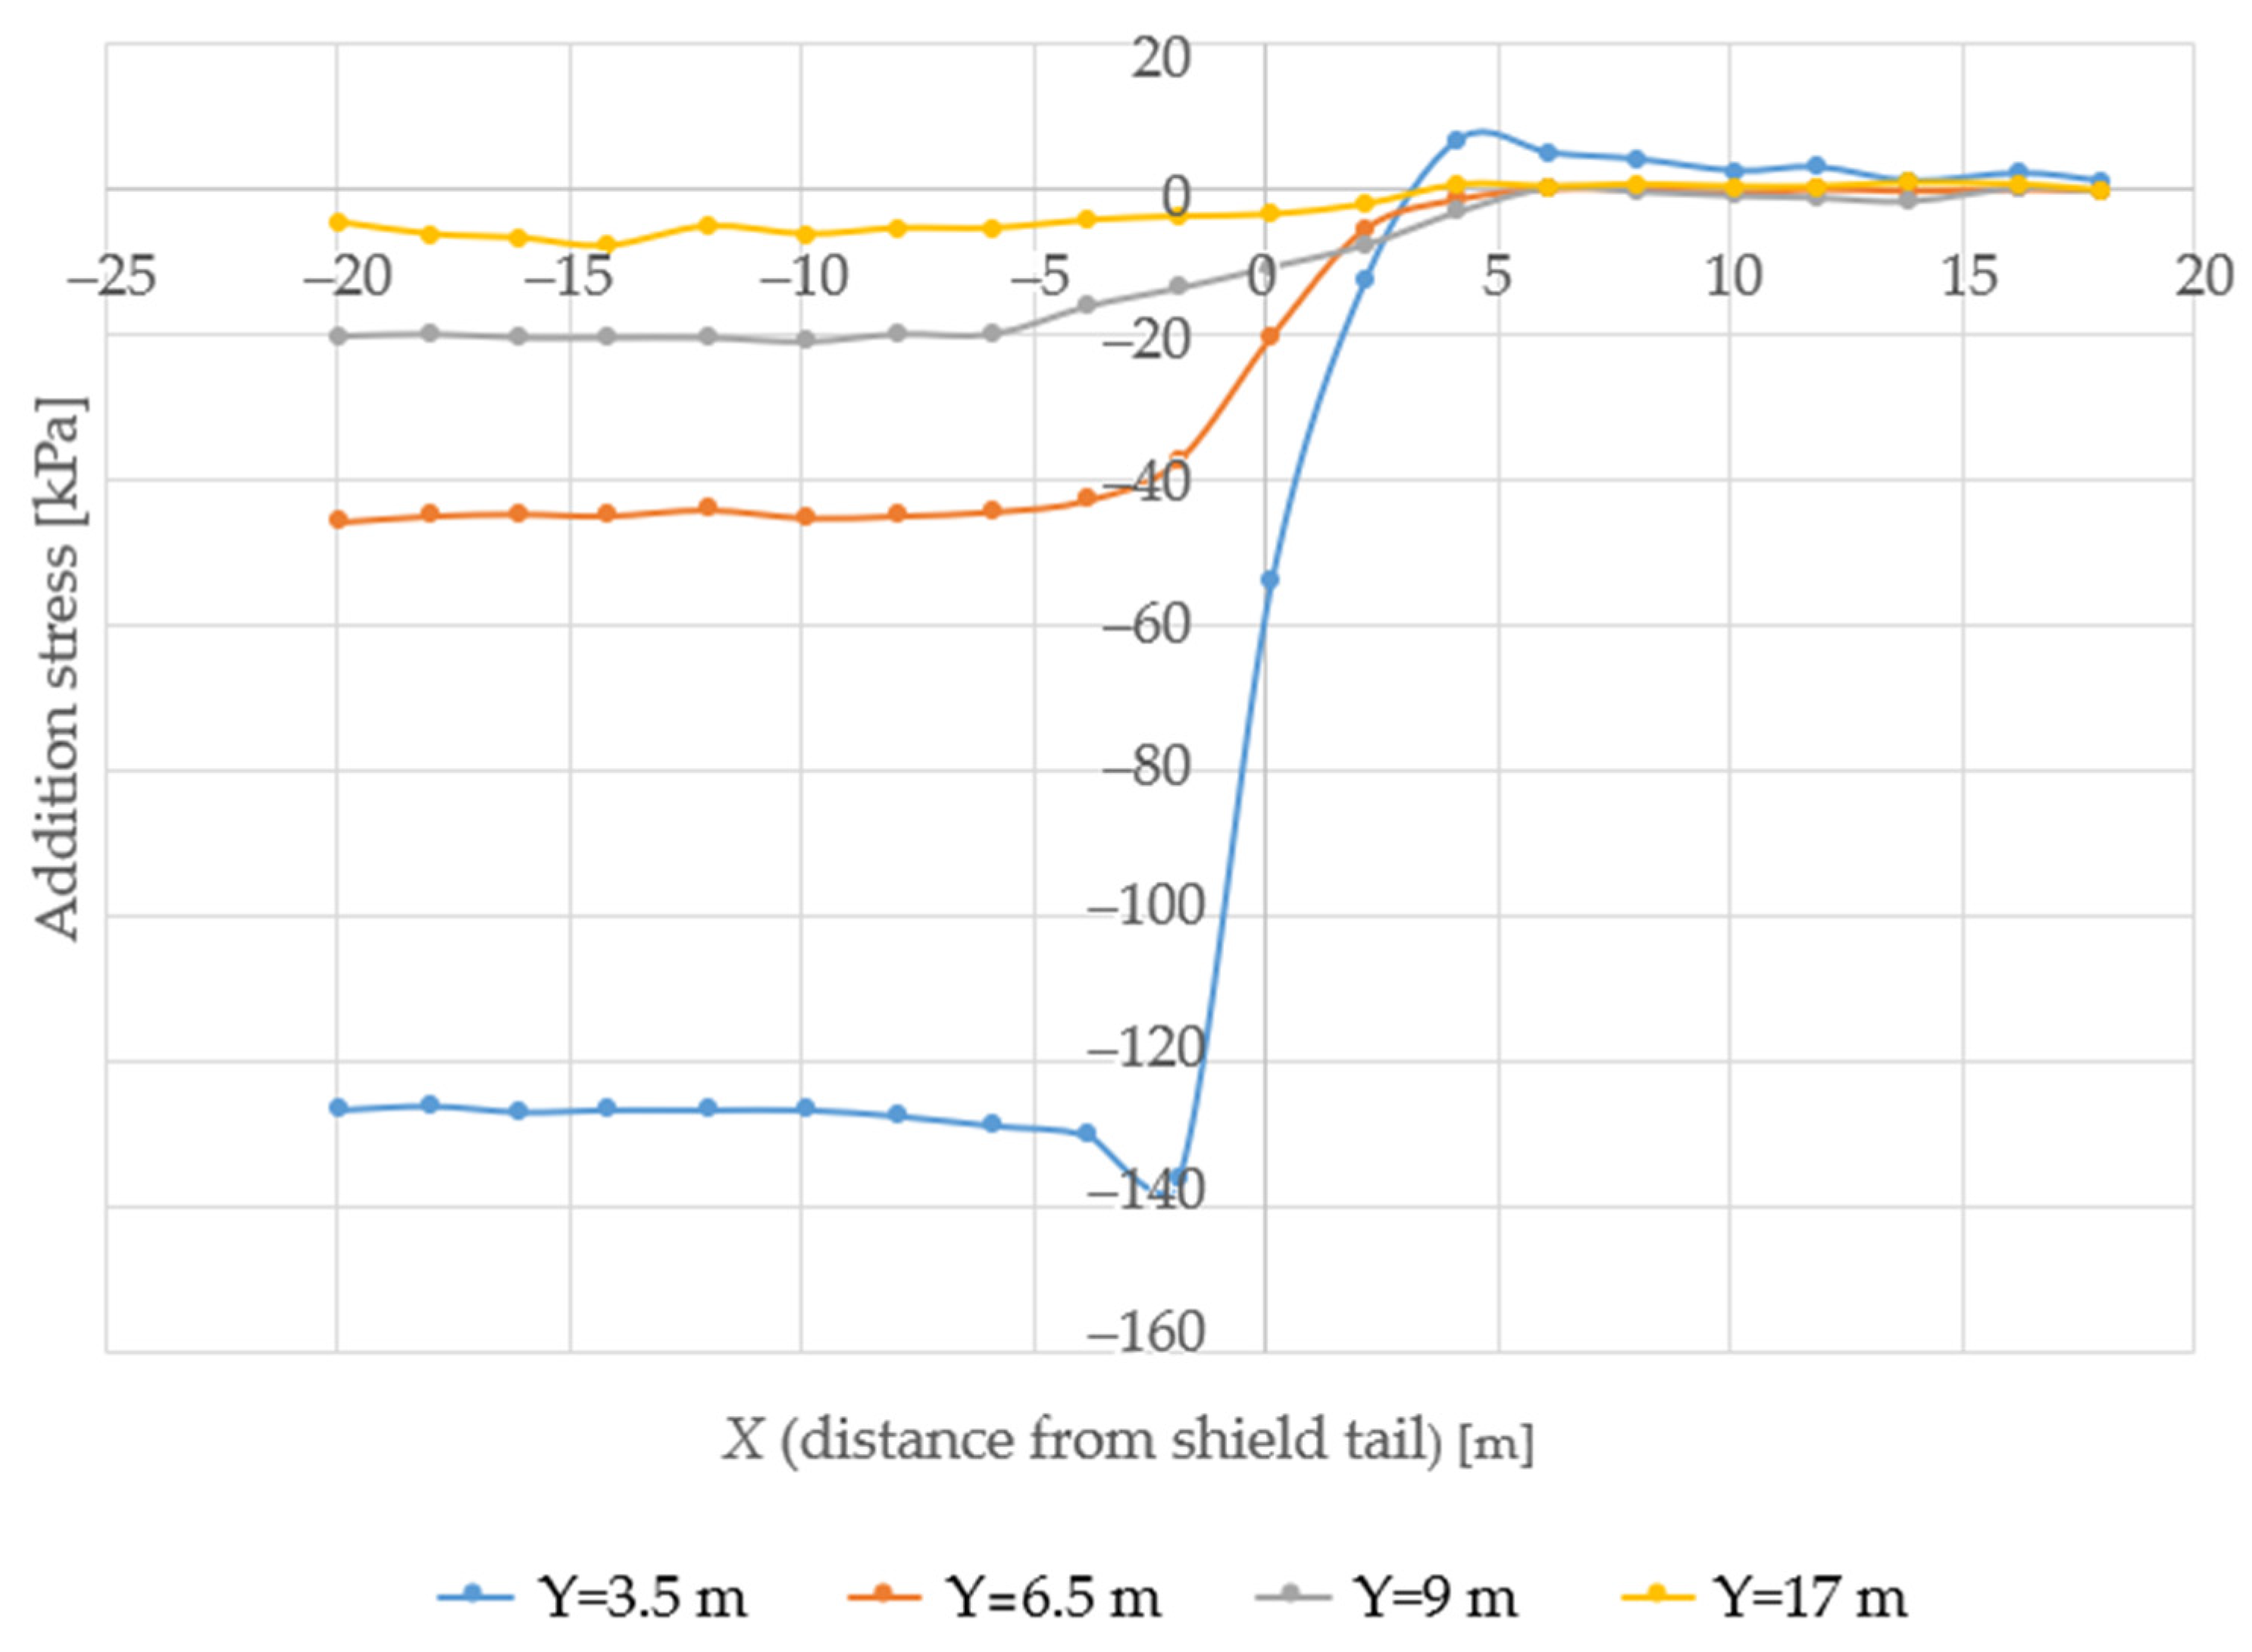
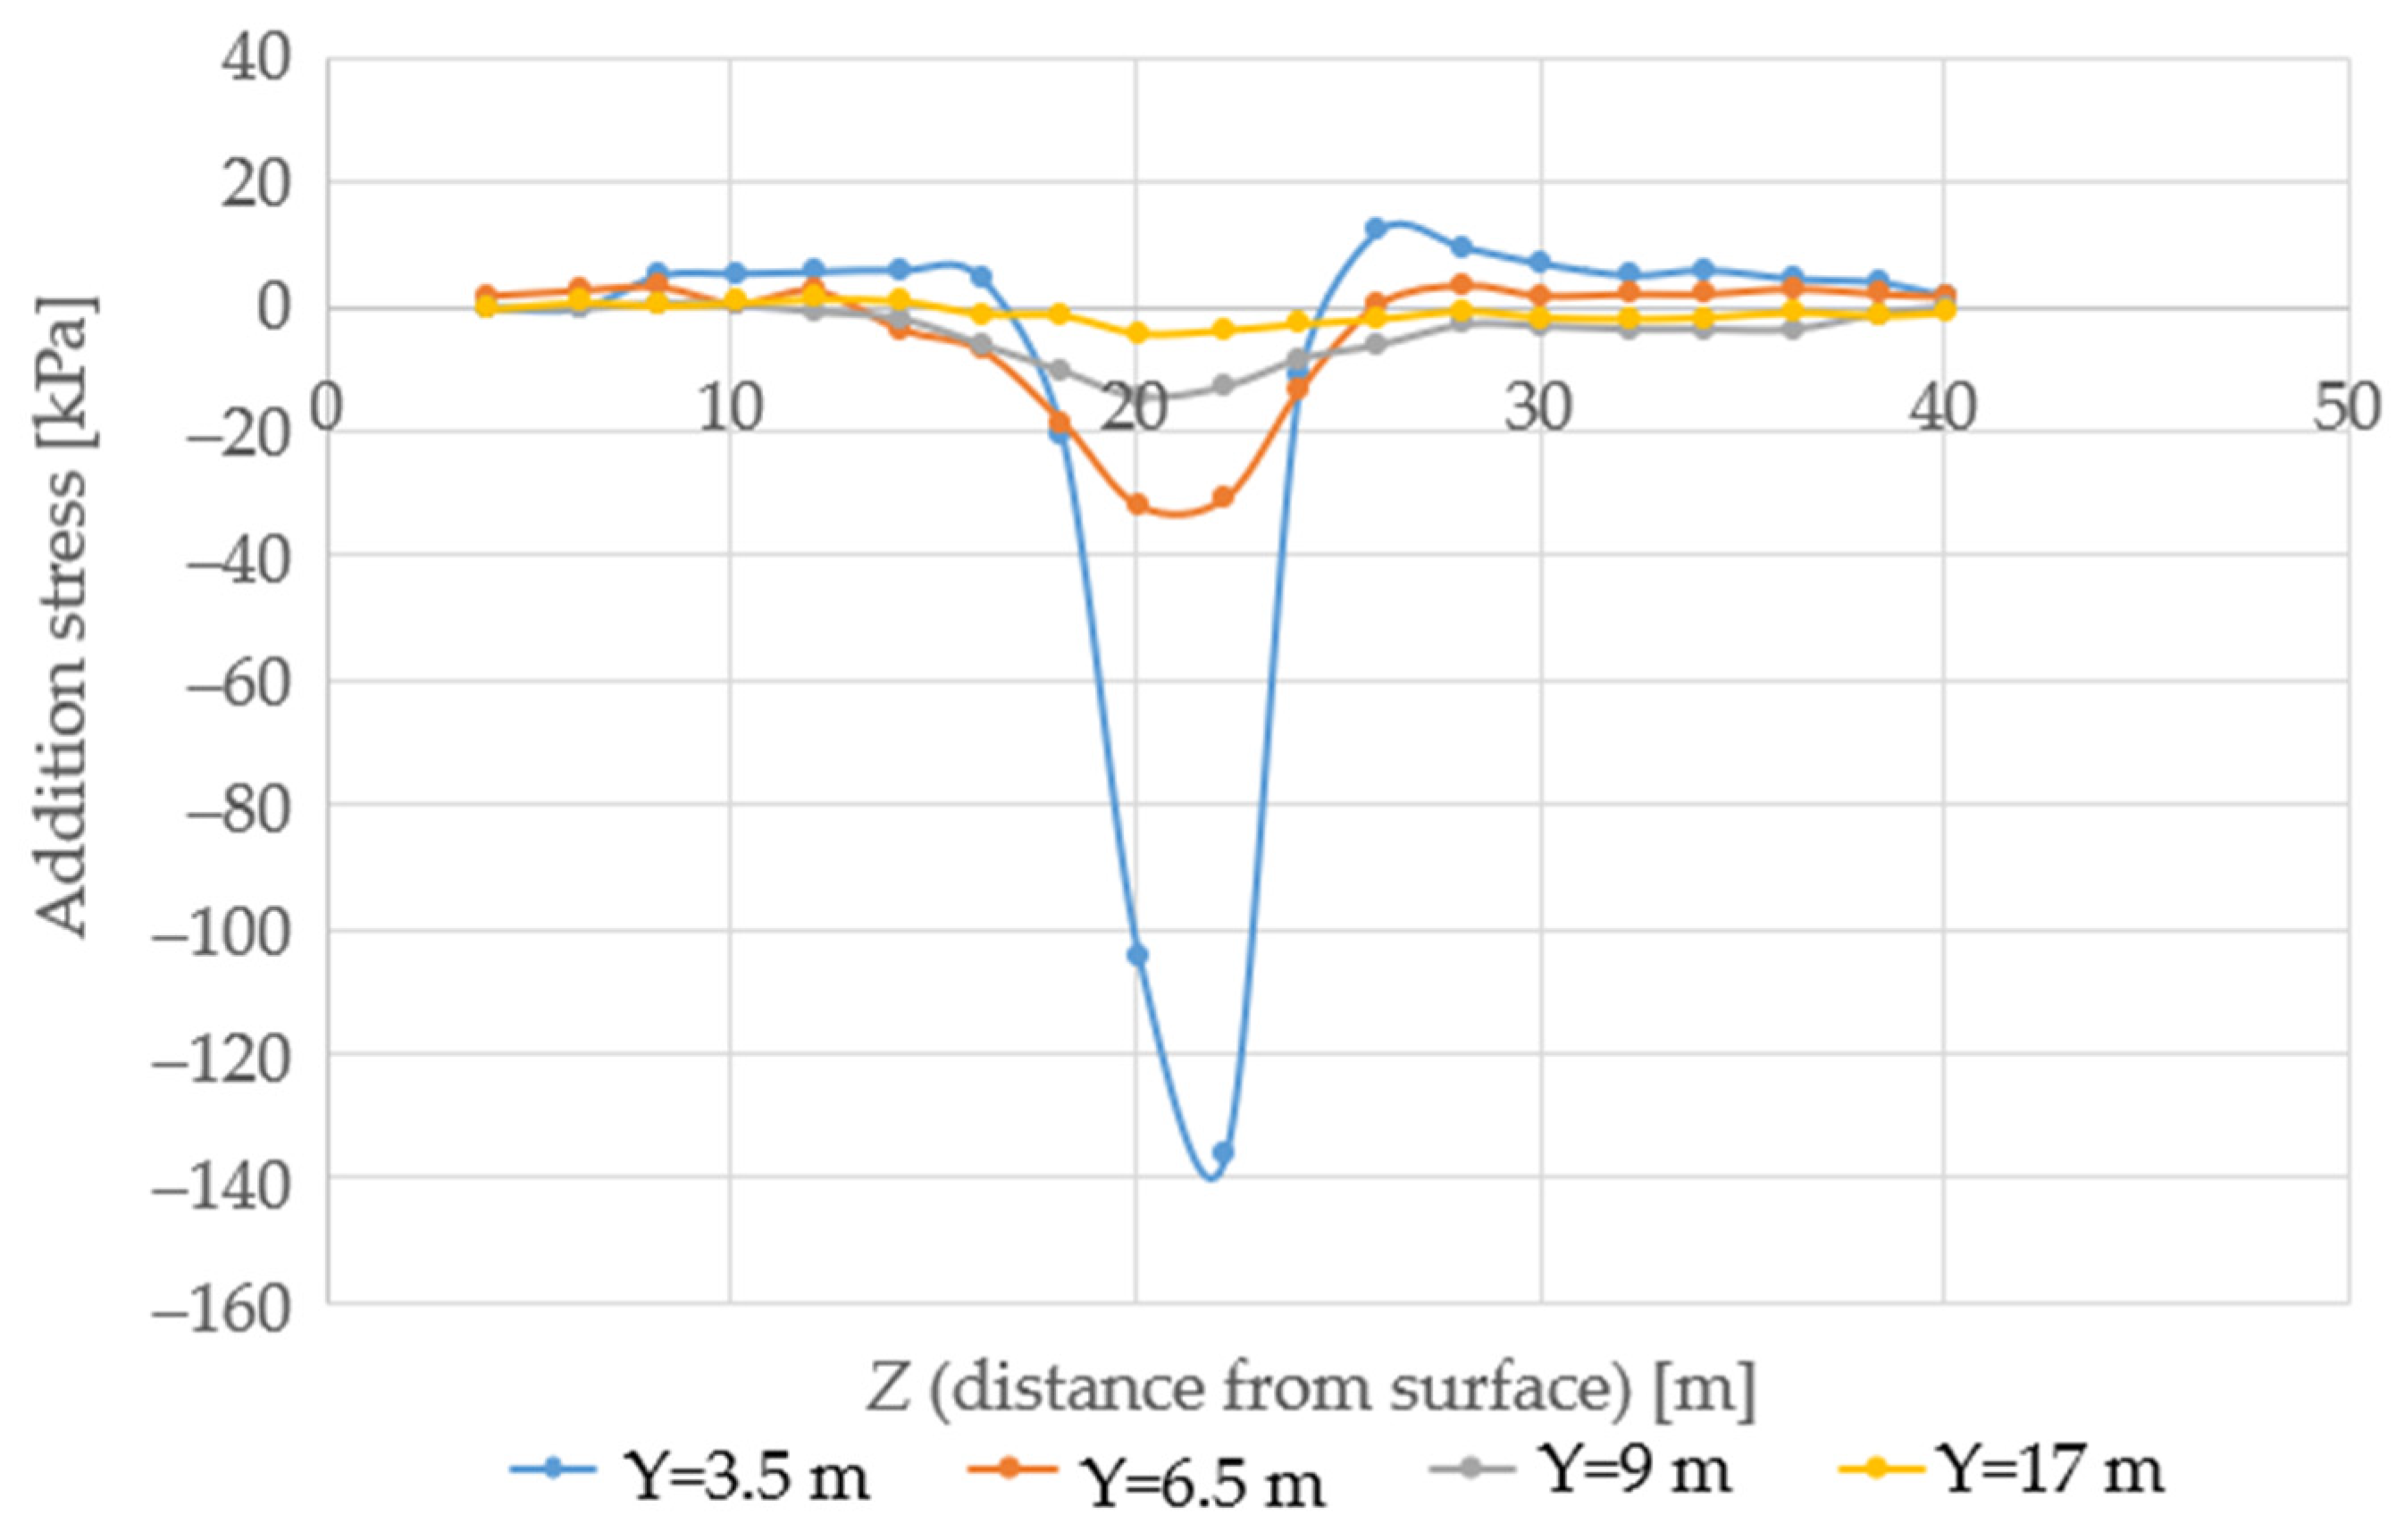
At the central axis of the shield, the ground loss causes the shield tail additional stress σz3 along the X-axis direction distribution curve as shown in Figure 8. The ground loss at −1 m from the shield tail (0 m is the position of the shield tail) leads to the distribution curve of the additional stress σz3 of the shield tail soil along the Z-axis direction as shown in Figure 9.
It can be seen from Figure 8 and Figure 9 that the additional stress in the two radial directions of the shield is larger than the shield advancing direction and the distribution of σz3 is similar to the distribution of σy3. The additional stress is stable behind the shield tail, and the further away it is from the central axis of the shield in the Y-axis direction, the smaller the σz3, and the faster the attenuation. From the distribution of σz3 on the X = −1 m section, the additional stress range in the Z-axis direction is 16–26 m due to ground loss. The farther away from the shield, the additional stress value quickly decays toward zero. σz3 causes surface settlement, which is the cause of the overall settlement of surface buildings.
4. Discussion
The shield tunneling construction of the subway in the study area is located in the downtown area, and there are practical difficulties in making the cross-section of the lateral settlement groove on the tunnel surface. Therefore, the longitudinal surface settlement value analysis of the left and right lines of the section tunnel is selected.
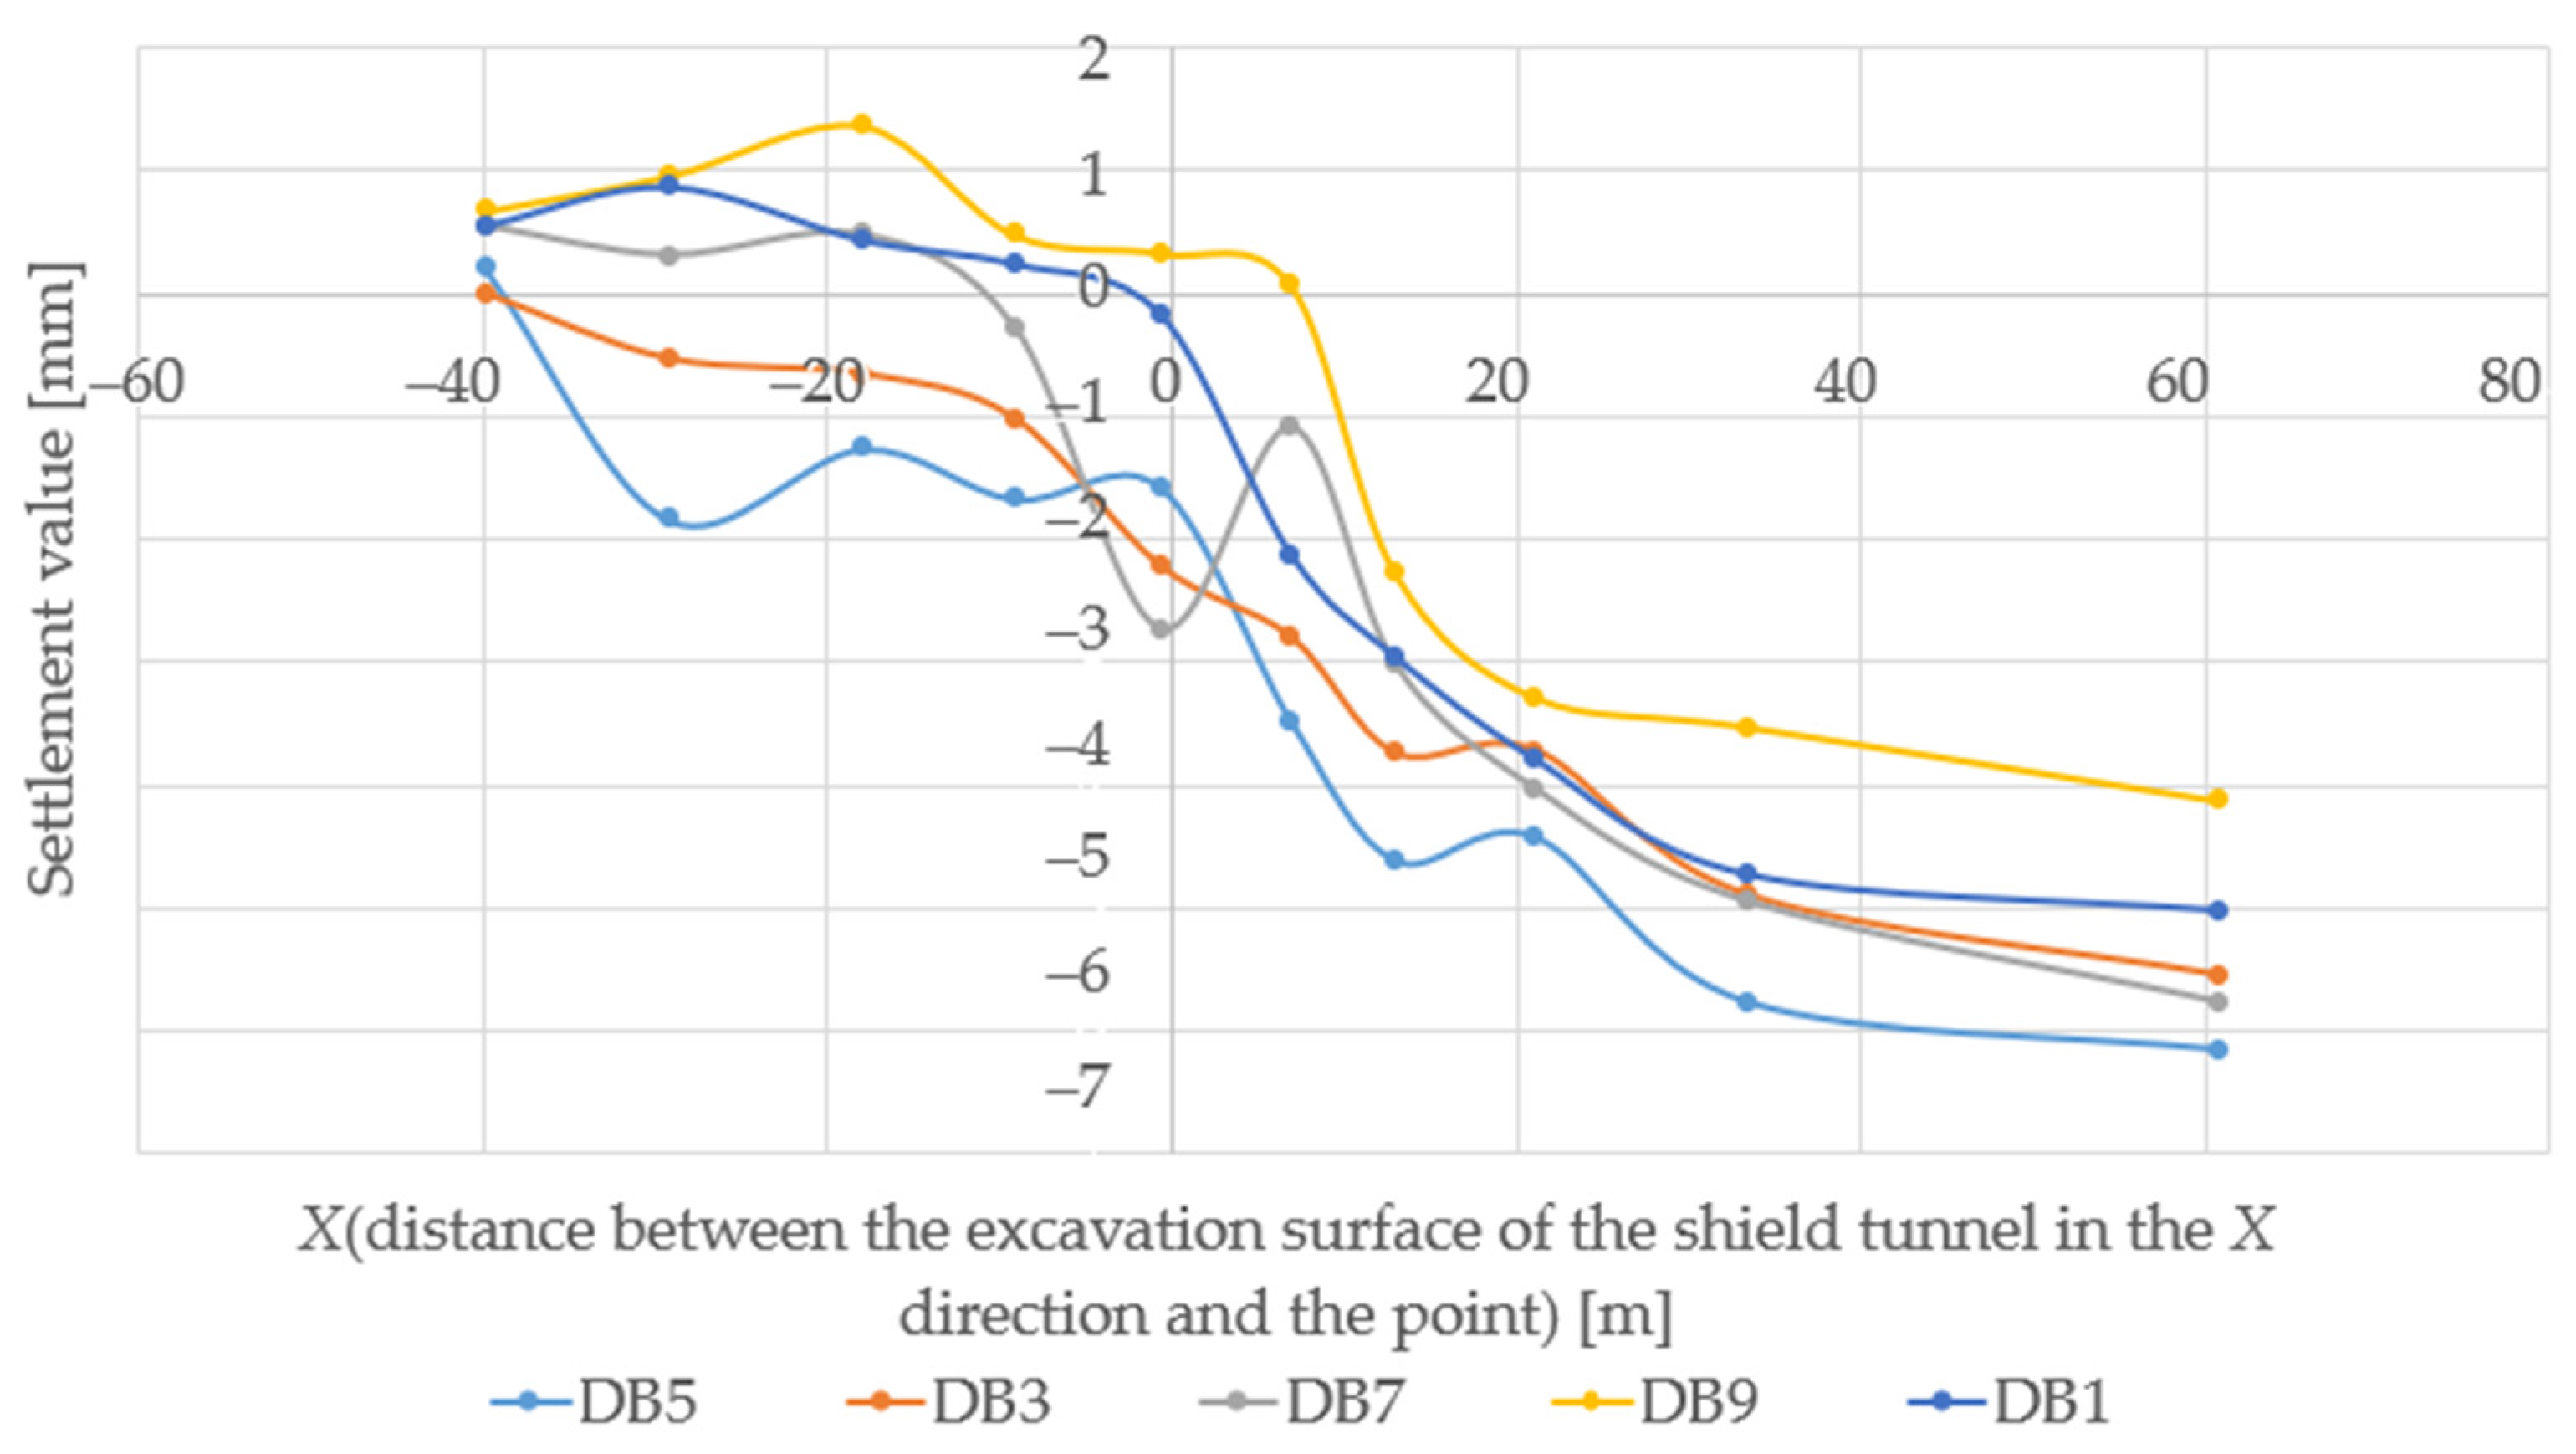
For the silty clay section along the vertical line on the right, five points DB1, DB3, DB5, DB7, and DB9 are selected on the center line of the tunnel, and the ground settlement data measured on site are used. The results are shown in Figure 10.
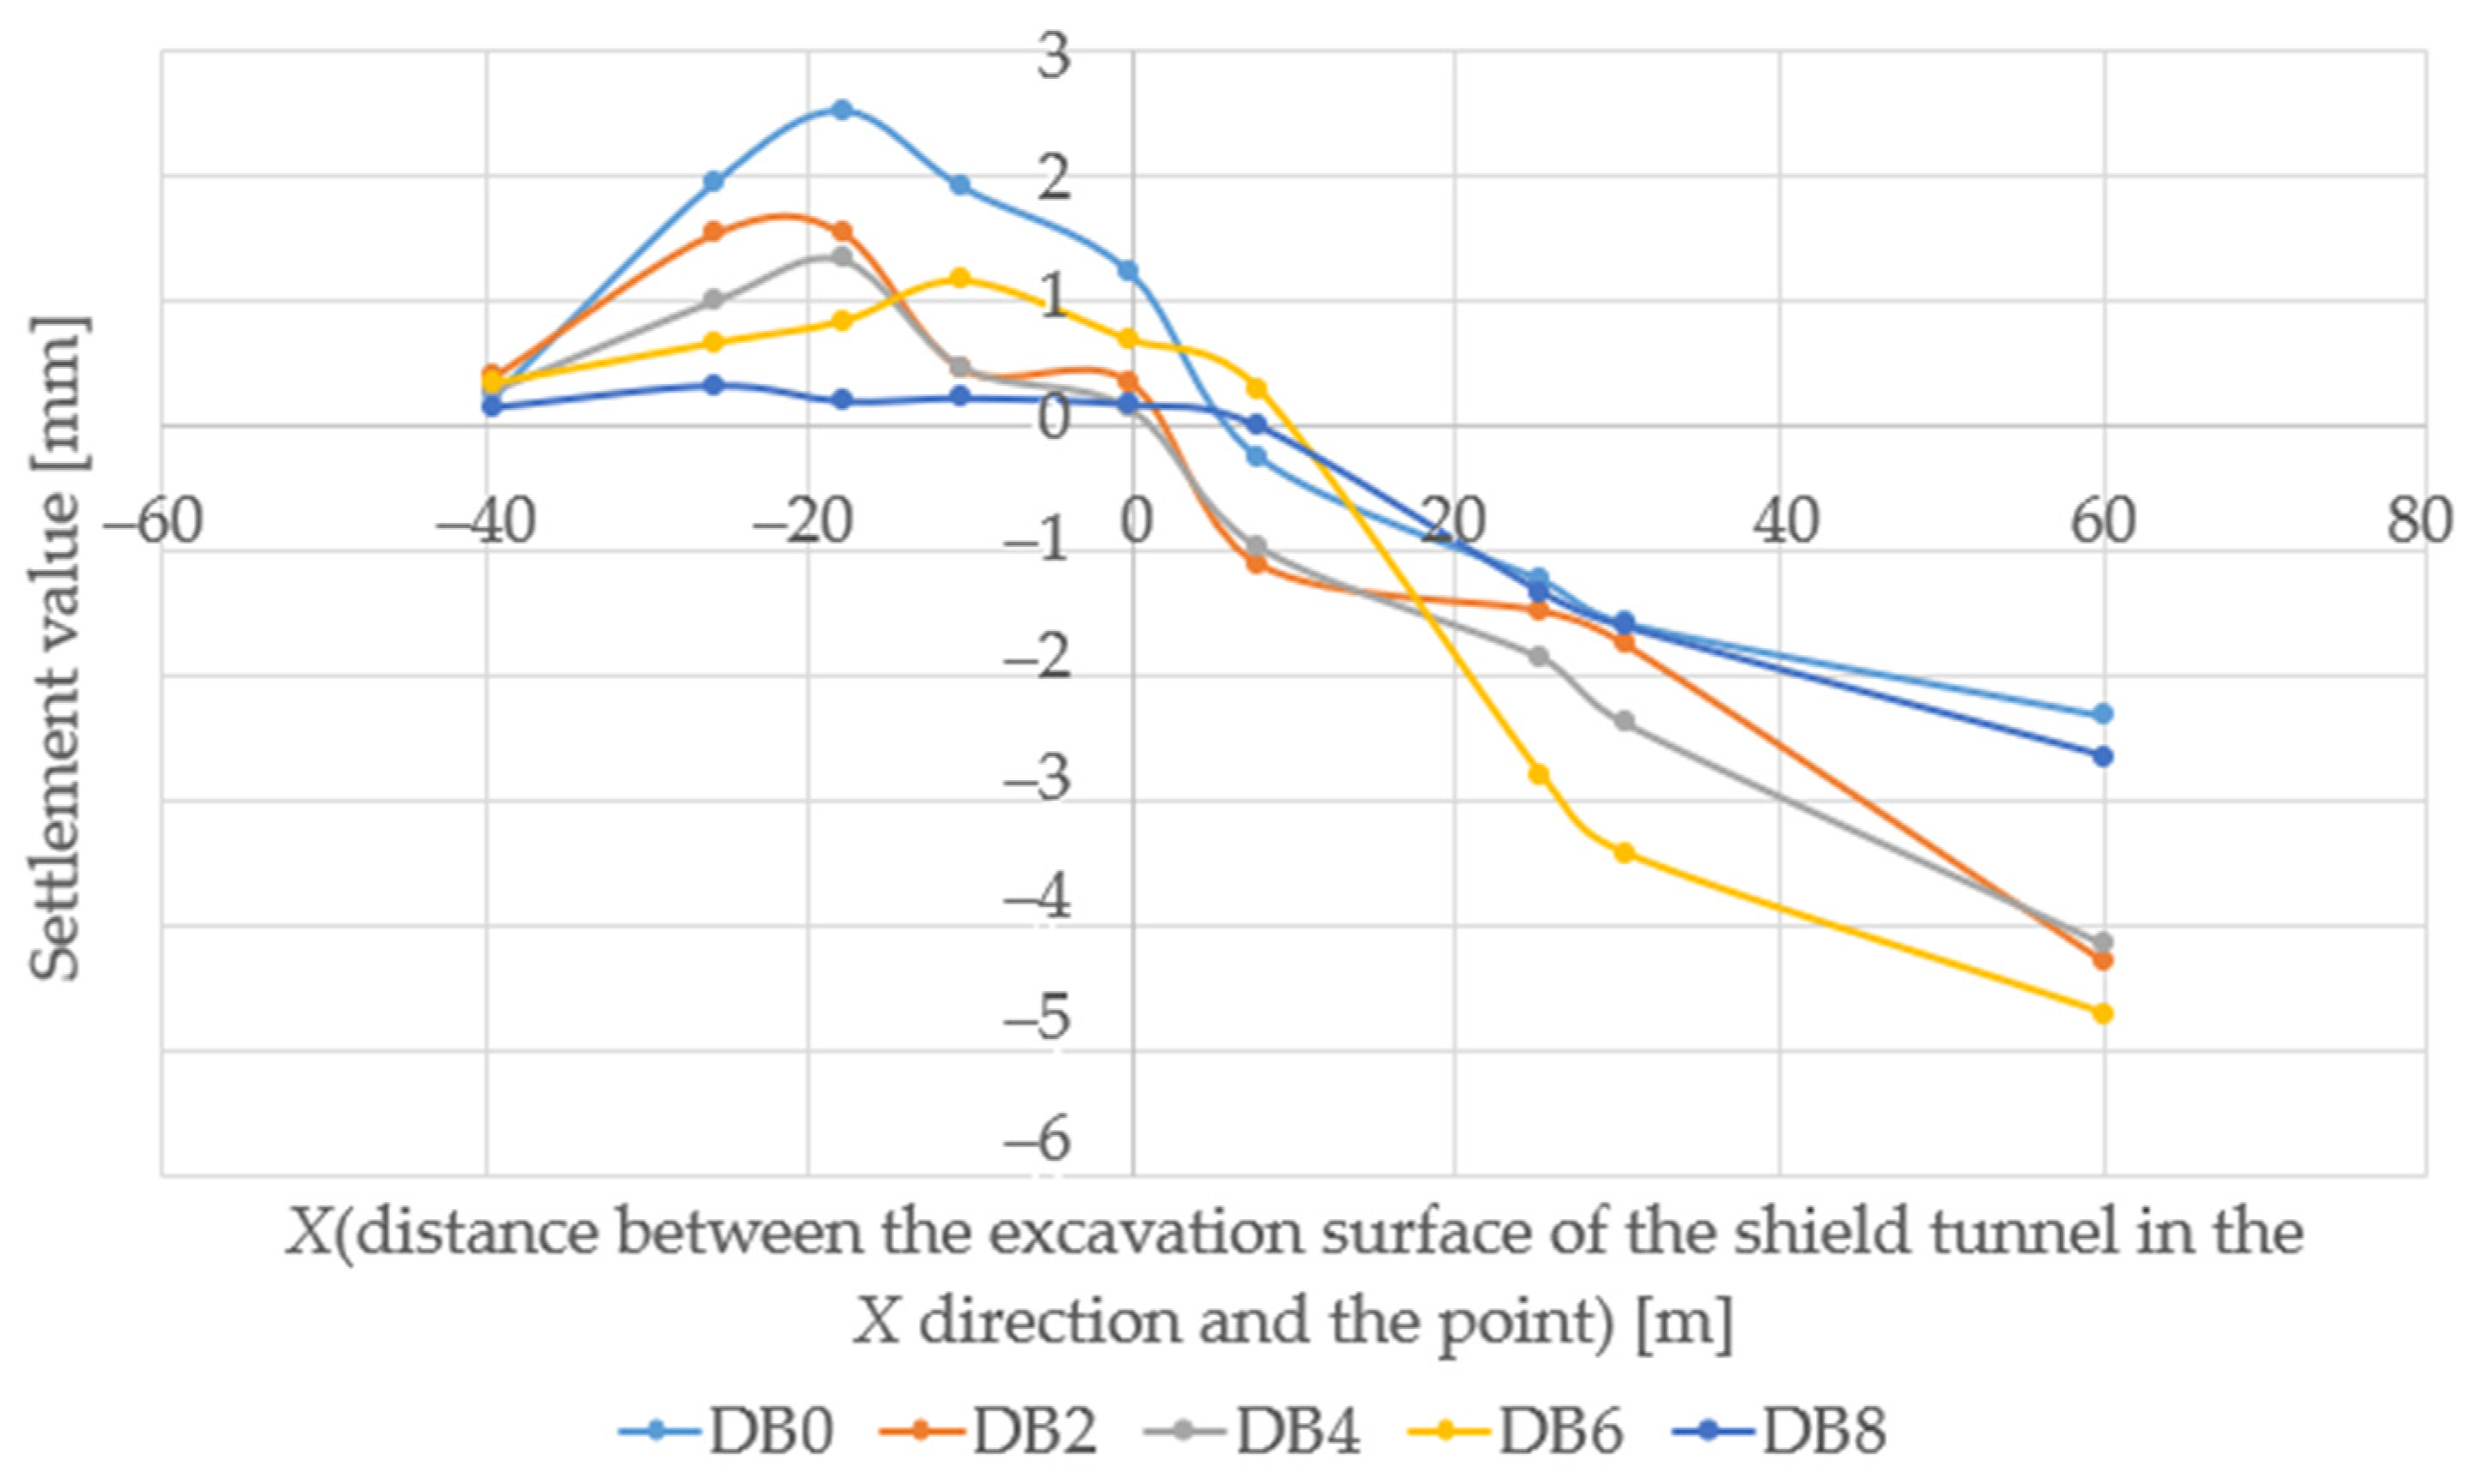
In the silty clay section in the vertical interval along the left line, five points DB0, DB2, DB4, DB6, and DB8 are selected on the centerline of the surface tunnel, and the longitudinal settlement curve is drawn using the field–measured surface settlement data, as shown in Figure 11.
From the analysis of Figure 10 and Figure 11, it can be concluded that the surface settlement on the central axis of the left and right tunnels follows the advancement of shield tunnel excavation. Although the five curves do not match, the basic trends are consistent, and the surface settlement can be divided into five stages:
(1) The uplift of the ground before the arrival of the shield cutter head. In this project, the groundwater level is high. To avoid the impact of shield construction on the surrounding strata as much as possible, the advancing speed is relatively fast, and the pressure of the soil bin is relatively large, that is, the shield cutter head exerts a relatively large additional thrust on the excavation surface soil, which squeezes the front of the excavation. At this time, the shear strength of the soil is exerted, and it enters the passive limit equilibrium state, and the soil moves forward as a whole. Among the eight selected points, except for points DB3 and DB5, which are affected by nearby buildings and have no uplift, the remaining six points have an obvious uplift phenomenon in the range of 40 m (6.2 × D) in front of the cutter head incision front, and the maximum uplift value is 2.47 mm, which is smaller than the surface uplift limit. At this stage, it is necessary to pay attention to the adjustment of the propelling speed and direction of the shield, to control the amount of excavation to ensure the dynamic balance and stability of the soil pressure in the soil tank, and to avoid excessive fluctuation of the additional thrust of the shield excavation surface.
(2) Surface settlement when the shield reaches. When the shield cutter head reaches the measuring point range of 6 m (1.0 × D) − 3 m (0.5 × D), there is a process of surface settlement in the relative uplift stage of the surface, of which the maximum relative settlement is 1.09 mm, accounting for about 14.80% of the entire settlement. This process takes a short time, because the additional thrust of the cutter head disappears, and the elastic deformation of the soil generated by the additional thrust of the cutter head is restored. Due to the influence of the cutter head cutting the soil, the upper soil is affected by the hoop shear force, the unloading stress of the soil is released, and part of the scattered soil enters the soil bin, resulting in the loss of the upper soil layer and obvious settlement.
(3) The surface subsides when the shield tail of the shield passes through. When the shield body passes through the measuring point, the corresponding point on the ground will have a slight bulge process. This is mainly because the shield body will exert friction and shear force on the surrounding soil during the forward process to squeeze the surrounding soil, causing the soil to move radially outward.
(4) Surface settlement when the lining is separated from the shield. When the shield passes through the measuring point, due to the friction between the shield shell and the soil interface, the shear force will be generated in a certain area of the soil, so that the soil will be damaged by shearing. When the shield passes through the damaged area, the damaged soil will move in the direction of the building interval created by the lining breaking away from the shield tail. When the lining is separated from the shield body, the synchronous grouting amount between the outer diameter of the lining and the soil does not fill the interval or does not reach the predetermined strength, and the surrounding soil moves radially under the action of earth pressure. Under the action of its weight, the lining separated from the shield body will sink, which will lead to the release of the surrounding soil stress, the soil layer will have a large displacement, and the surface settlement will suddenly increase. The maximum settlement of this section is the right line surface settlement value of 2.44 mm, accounting for 33.48% of the entire settlement.
The separation of the lining from the shield tail accounts for a large proportion of the total settlement, so the settlement should be strictly controlled. The main control methods are the grouting amount and grouting pressure of the shield tail. The setting of the grouting amount and grouting pressure directly affects the grouting effect, which is ultimately reflected in the surface deformation. To achieve a good grouting effect, it is necessary to strictly control the proportion of synchronous grouting materials, so that it has good stability, fluidity, suitable initial setting time, and strictly set the grouting pressure.
(5) Consolidation and settlement after the shield tunneling. After the shield passes, the excess pore water pressure in the soil dissipates and tends to be stable. At the same time, because the strength of the synchronous grouting body is fully exerted, there is no major disturbance in the surrounding soil layer. After the shield passes, it begins to stabilize about 20 m from the shield tail, and the disturbed soil is re-consolidated. The stratum of this project is silty clay, and the re-consolidation time will last for a long time.
Due to the disturbance caused by the early construction of the right tunnel on the left track, the total thrust of the shield, the advancing speed of the shield, the torque of the cutter head, and the grouting pressure of the formation on the left track have been correspondingly increased before construction. The standard deviation of each construction parameter is smaller. According to the on-site measured surface settlement values analysis, the adjustment and optimization of construction parameters on the left line have reduced the surface settlement caused by shield tunneling. Thus, it can be seen that optimizing the construction parameters of existing tunnels under similar geological conditions can guide the construction of proposed tunnels and achieve good ground settlement control effects.
Using ABAQUS 2020 software [28], a shield excavation simulation was conducted on a double-track tunnel considering the influence of ground buildings, and the longitudinal time series settlement curves of surface settlement points on the left and right longitudinal axes of the double-track tunnel were obtained. By comparison, it can be seen that the time history settlement value of the longitudinal settlement point calculated by ABAQUS finite element software is generally larger than the measured value. The pattern of surface uplift in front of the excavation surface caused by shield tunneling is consistent. There is a significant difference between the calculated settlement and the measured value after the shield tunnel passes, but the trend of soil settlement stability after the shield tunnel passes is still consistent. The actual surface settlement can be predicted based on the calculated settlement curve, and the shield construction parameters can be optimized. By establishing standards for building settlement and tilt safety control and comparing numerical simulations to calculate settlement values, evaluating the risk level of buildings passing through tunnels can ensure the safety and applicability of buildings within the scope of shield tunneling construction.
After processing the numerical simulation results, the settlement values of the double-track tunnel on the cross-section in the study area can be obtained, as shown in Table 6. Then, this article compares the settlement values in Table 6 with those calculated by stochastic medium theory, Peck formula, modified Peck formula, and measured values.
For the shield tunneling construction project in the study area, among the three calculated settlement values the stochastic medium theory calculation value is the most consistent with the measured value. When using the Powell method to calculate the surface settlement value, an optimization algorithm is used for the objective function to obtain the optimal parameters. Compared to the least squares method, it is more effective to back-calculate the parameters of the Peck formula. After modifying the Peck formula, this article compares the obtained building settlement curve with the curve obtained from the original Peck formula. Although it cannot be completely consistent with the on-site measured values, there is a significant improvement in the accuracy of predicting surface settlement caused by shield tunneling construction. For ABAQUS finite element simulation, its effect is between that of stochastic medium theory and that of the Peck formula.
In summary, it can be concluded that the calculated surface settlement values based on stochastic medium theory are most consistent with the measured values. The calculated values of the modified Peck formula are relatively consistent. There is a deviation between the numerical analysis results and the measured values, and the Peck formula calculation results have the greatest deviation. From the comparative analysis of the results, it can be concluded that using ABAQUS finite element software to establish a three-dimensional numerical model to simulate and analyze the impact of excavation of double–track tunnel shield on surface settlement and predict its impact range, which can achieve results that are consistent with the measured values to guide construction.
5. Conclusions
To study the influence of shield tunneling on surrounding soil and control the influence of shield tunneling on surface settlement and deformation of surrounding buildings, it is necessary to study the additional stress of surrounding soil and the law of surface settlement caused by shield tunneling.
- (1)
- In this paper, the source–sink method is applied, and the Loganathan ground movement pattern is used to obtain the additional stress field function of the surrounding soil layer caused by the loss of the shield tail soil. The function is numerically integrated by MATLAB programming to obtain the distribution law of the additional stress components on the X-axis and Z-axis of the shield tail ground loss in the surrounding soil of the shield.
- (2)
- Combined with the longitudinal settlement curve measured on site, the paper analyzes the five stages experienced by the ground surface during shield excavation, namely the uplift of the ground before the arrival of the shield cutter head, surface settlement when the shield reaches, the surface subsides when the shield tail of the shield passes through. the passage of the shield tail of the shield, surface settlement when the lining is separated from the shield, and consolidation and settlement after the shield passes through.
- (3)
- ABAQUS finite element software is used to establish a three-dimensional model of shield excavation in a double-track tunnel to simulate the tunnel excavation process. The results indicate that three-dimensional numerical simulation can be used to predict surface settlement before the start of shield excavation, to guide the prior selection of shield excavation construction parameters.
However, this article only studied the impact of shield tunneling on the settlement of surface soil layers and did not conduct a specific analysis of the internal forces generated by surface settlement on surface buildings. It also did not quantify the construction risks of shield tunneling passing through or under buildings.
Author Contributions
Conceptualization, Y.L. and X.B.; methodology, H.P.; software, B.Z.; validation, Y.Z., Y.L. and X.B.; formal analysis, H.P.; investigation, B.Z.; resources, Y.Z.; data curation, X.B.; writing—original draft preparation, Y.L.; writing—review and editing, X.B.; funding acquisition, H.P. All authors have read and agreed to the published version of the manuscript.
Funding
This research was funded by the Self-established scientific research projects of enterprises “Research on key technology of full period monitoring in deep buried ultra-long TBM tunnels”, grant number ZL2021-22.
Data Availability Statement
The article includes the figures and tables that this study utilized to support its conclusions.
Acknowledgments
This work was supported by the Self–established scientific research projects of enterprises “Research on key technology of full period monitoring in deep buried ultra–long TBM tunnels” (No. ZL2021-22).
Conflicts of Interest
The authors declare no conflict of interest.
List of Symbols
| Symbols | Meaning |
| ξ | The equivalent ground loss parameter, m |
| h | The burial depth of the shield tunnel axis, m |
| τ | The shear stress, kPa |
| The additional stress, kPa | |
| α | The interval radius of the hole, m |
| r | Distance from any point to the hole, m |
| S | Displacement, m |
| x | The horizontal distance between the calculated point and the acting point of the horizontal force, m |
| y | The lateral distance between the calculated point and the acting point of the horizontal force, m |
| z | The burial depth of the calculated point, m |
| c | The burial depth of the horizontal force acting point, m |
| E | The elastic modulus, MPa |
| μ | Poisson’s ratio of the soil, [-] |
| R | Tunnel radius, m |
| t | Time, s |
| D | The diameter of the shield excavation surface, m |
| d | The distance between the focal point and the center point of the tunnel, m |
| VL | The damping ratio of the settlement trough, [-] |
| A1 | The excavation area of the shield, m2 |
| A2 | The constricted section area, m2 |
| L | The distance of the ground loss, m |
| Kh | The permeability performance in the horizontal direction, cm·s–1 |
| Kv | The permeability performance in the vertical direction, cm·s–1 |
References
- Chen, Z.; He, Q.; Su, X.; Yuan, Y.; Chen, S. The Opening Conditions of the Metro and Its Early Characteristics: A Historical Perspective. Tunn. Undergr. Space Technol. 2021, 108, 103732. [Google Scholar] [CrossRef]
- Nichodemus, A.; Cas Press, C. Environmental Pollution and Associated Health Hazards to Host Communities (Case Study: Niger Delta Region of Nigeria). Cent. Asian J. Environ. Sci. Technol. Innov. 2020, 1, 30–42. [Google Scholar] [CrossRef]
- Zhu, M.; Gong, X.; Gao, X.; Liu, S.; Yan, J. Remediation of Damaged Shield Tunnel Using Grouting Technique: Serviceability Improvements and Prevention of Potential Risks. J. Perform. Constr. Facil. 2019, 33, 04019062. [Google Scholar] [CrossRef]
- Yang, H.; Shi, H.; Jiang, X.; Liu, C.; Yu, L. Study on Influence of Construction Process of Double–Line Shield Tunnels on Frame Structure. Geotech. Geol. Eng. 2021, 39, 1465–1484. [Google Scholar] [CrossRef]
- Zhang, Q.; Wu, K.; Cui, S.; Yu, Y.; Zhang, Z.; Zhao, J. Surface Settlement Induced by Subway Tunnel Construction Based on Modified Peck Formula. Geotech. Geol. Eng. 2019, 37, 2823–2835. [Google Scholar] [CrossRef]
- Kádár, P.; Temesvári, Z.M.; Szén, I. Innovative Solutions in the 125 Years’ Old Budapest Metro No.1. In Proceedings of the 2020 IEEE 3rd International Conference and Workshop in Óbuda on Electrical and Power Engineering (CANDO–EPE), Budapest, Hungary, 18–19 November 2020. [Google Scholar]
- Yan, T.; Shen, S.-L.; Zhou, A.; Lyu, H.-M. Construction Efficiency of Shield Tunnelling through Soft Deposit in Tianjin, China. Tunn. Undergr. Space Technol. 2021, 112, 103917. [Google Scholar] [CrossRef]
- Shi, C.; Cao, C.; Lei, M. An Analysis of the Ground Deformation Caused by Shield Tunnel Construction Combining an Elastic Half–Space Model and Stochastic Medium Theory. KSCE J. Civ. Eng. 2017, 21, 1933–1944. [Google Scholar] [CrossRef]
- Geyin, M.; Maurer, B.W. An Analysis of Liquefaction–Induced Free–Field Ground Settlement Using 1000+ Case Histories: Observations vs. State Pract. Predict. 2019, 489–498. [Google Scholar] [CrossRef]
- Alnmr, A.; Ray, R.P. Review of the Effect of Sand on the Behavior of Expansive Clayey Soils. Acta Tech. Jaurinensis 2021, 14, 521–552. [Google Scholar] [CrossRef]
- Shreyas, S.K.; Dey, A. Application of Soft Computing Techniques in Tunnelling and Underground Excavations: State of the Art and Future Prospects. Innov. Infrastruct. Solut. 2019, 4, 46. [Google Scholar] [CrossRef]
- Amare, M.D.; Tompai, Z. A Review on Factors Affecting the Resilient Modulus of Subgrade Soils. Acta Tech. Jaurinensis 2022, 15, 99–109. [Google Scholar] [CrossRef]
- Alnmr, A. Material Models to Study the Effect of Fines in Sandy Soils Based on Experimental and Numerical Results. Acta Tech. Jaurinensis 2021, 14, 651–680. [Google Scholar] [CrossRef]
- Liu, W.; Wu, B.; Shi, P.; Xu, X. Analysis on Face Stability of Rectangular Cross–Sectional Shield Tunneling Based on an Improved Two–Dimensional Rotational Mechanism. Acta Geotech. 2021, 16, 3725–3738. [Google Scholar] [CrossRef]
- Baghbani, A.; Baghbani, H.; Shalchiyan, M.M.; Kiany, K. Utilizing Artificial Intelligence and Finite Element Method to Simulate the Effects of New Tunnels on Existing Tunnel Deformation. J. Comput. Cogn. Eng. 2022. [Google Scholar] [CrossRef]
- Liu, B.; Xi, D.; Xu, P. Study on the Interaction of Metro Shield Tunnel Construction Under–Crossing the Existing Longhai Railway. Geotech. Geol. Eng. 2020, 38, 2159–2168. [Google Scholar] [CrossRef]
- Zhang, W.; Gu, X.; Zhong, W.; Ma, Z.; Ding, X. Review of Transparent Soil Model Testing Technique for Underground Construction: Ground Visualization and Result Digitalization. Undergr. Space 2022, 7, 702–723. [Google Scholar] [CrossRef]
- Cai, W.; Zhu, H.; Liang, W. Three–Dimensional Tunnel Face Extrusion and Reinforcement Effects of Underground Excavations in Deep Rock es. Int. J. Rock. Mech. Min. Sci. 2022, 150, 104999. [Google Scholar] [CrossRef]
- Ayasrah, M.; Qiu, H.; Zhang, X. Influence of Cairo Metro Tunnel Excavation on Pile Deep Foundation of the Adjacent Underground Structures: Numerical Study. Symmetry 2021, 13, 426. [Google Scholar] [CrossRef]
- Guo, W.; Ma, J. BIM Process and Application in Geological Exploration of Rail Transit Engineering in Mountainous Cities. IOP Conf. Ser. Earth Environ. Sci. 2021, 669, 012009. [Google Scholar] [CrossRef]
- Yong, H.; Xianglian, M.; Xiewen, H.; Liguo, Z.; Zhewei, W.; Shihui, D.; Wenzhong, Z.; Xingqiang, C.; Feng, L. Major Engineering Geological Problems and Countermeasures Along Traffic Corridor from Ya’An to Nyingchi. J. Eng. Geol. 2021, 29, 307–325. [Google Scholar] [CrossRef]
- Lee, K.M.; Rowe, R.K.; Lo, K.Y. Settlement Owing to Tunnelling. I. Estimating the Gap Parameter. Can. Geotech. J. 1992, 29, 929–940. [Google Scholar] [CrossRef]
- Sagaseta, C. Analysis of Undrained Soil Deformation Due to Ground Loss. Géotechnique 1987, 37, 301–320. [Google Scholar] [CrossRef]
- Li, S.; Zhang, Z.; Mei, G.; Lin, D.; Yu, J.; Qiu, R.; Su, X.; Lin, X.; Lou, C. Utilization of BIM in the Construction of a Submarine Tunnel: A Case Study in Xiamen City, China. J. Civ. Eng. Manag. 2021, 27, 14–26. [Google Scholar] [CrossRef]
- Filbà, M.; Salvany, J.M.; Jubany, J.; Carrasco, L. Tunnel Boring Machine Collision with an Ancient Boulder Beach during the Excavation of the Barcelona City Subway L10 Line: A Case of Adverse Geology and Resulting Engineering Solutions. Eng. Geol. 2016, 200, 31–46. [Google Scholar] [CrossRef]
- Todaro, C.; Carigi, A.; Martinelli, D.; Peila, D. Study of the Shear Strength Evolution over Time of Two–Component Backfilling Grout in Shield Tunnelling. Case Stud. Constr. Mater. 2021, 15, e00689. [Google Scholar] [CrossRef]
- Arvan, P.A.; Arockiasamy, M. Energy–Based Approach: Analysis of a Laterally Loaded Pile in Multi–Layered Non–Linear Elastic Soil Strata. Geotechnics 2022, 2, 570–598. [Google Scholar] [CrossRef]
- Boldini, D.; Losacco, N.; Franza, A.; DeJong, M.J.; Xu, J.; Marshall, A.M. Tunneling–Induced Deformation of Bare Frame Structures on Sand: Numerical Study of Building Deformations. J. Geotech. Geoenviron. Eng. 2021, 147, 04021116. [Google Scholar] [CrossRef]
Figure 1.
Sketch map of interval engineering. (a,b) The location of the study area; (c) The specific shield construction route.
Figure 1.
Sketch map of interval engineering. (a,b) The location of the study area; (c) The specific shield construction route.


Figure 2.
Model of stress on surrounding soil caused by shield tunneling construction.

Figure 3.
Sketch map of Sagaseta ground loss model and Loganathan ground loss model. (a) Sagaseta 1987 [23]; (b) Lee 1997 [22].

Figure 4.
Distribution curve of additional stress along the X-axis of shield tail soil caused by ground loss.
Figure 4.
Distribution curve of additional stress along the X-axis of shield tail soil caused by ground loss.

Figure 5.
Distribution curve of the additional stress of the shield tail soil along the axial direction.
Figure 5.
Distribution curve of the additional stress of the shield tail soil along the axial direction.

Figure 6.
Distribution curve of the additional stress of the shield tail soil along the X-axis.

Figure 7.
Distribution curve of the additional stress of the shield tail soil along the Z-axis direction.
Figure 7.
Distribution curve of the additional stress of the shield tail soil along the Z-axis direction.

Figure 8.
Distribution curve of additional stress σz3 along the X-axis of shield tail soil caused by ground loss.
Figure 8.
Distribution curve of additional stress σz3 along the X-axis of shield tail soil caused by ground loss.

Figure 9.
Distribution curve of the additional stress σz3 of the shield tail soil along the Z-axis direction.
Figure 9.
Distribution curve of the additional stress σz3 of the shield tail soil along the Z-axis direction.

Figure 10.
Settlement curve of the vertical surface settlement point on the right line.

Figure 11.
Settlement curve of the vertical surface settlement point on the left line.


Table 1.
Distribution of layers crossing the shield tunneling section.
| Layer | Proportion |
|---|---|
| –4b2–3 silty clay | 56.7% |
| –3b4+d3 silty clay and silt interbedding | 26.2% |
| –3b1–2 silty clay | 16.9% |
| –3d3 fine sand | 0.2% |
Table 2.
Classification of surrounding rocks and soil classification.
| Layer | Name | Surrounding Rock Classification | Construction Level |
|---|---|---|---|
| –3b4+d3 | Silty clay and silt interbedding | VI | I |
| –3d3 | Slightly dense (locally loose) silt | VI | I |
| –3b1–2 | Hard plastic silty clay | V | II |
| –46b2–3 | Soft plastic powder adhesive | VI | I |
| –4a3–4 | Soft flow plastic clay | VI | I |
| –4b1–2 | Hard plastic silty clay | V~VI | II |
Table 3.
Geotechnical characteristics parameters of the soils.
| Layer | Natural Bearing Capacity/kPa | Elastic Modulus/ (MN/m2) | Poisson’s Ratio of Soil | Permeability Coefficient/ (cm·s−1) | |
|---|---|---|---|---|---|
| kh | kv | ||||
| –4b2–3 silty clay | 170 | 4 | 0.31 | 9.55 × 10⁻⁸ | 1.28 × 10⁻⁷ |
| –3b4+d3 silty clay and silt interbedding | 100 | 37 | 0.41 | 1.58 × 10⁻⁴ | 2.20 × 10⁻⁴ |
| –3b1–2 silty clay | 150 | 7 | 0.33 | 3.92 × 10⁻⁷ | 6.47 × 10⁻⁶ |
| –3d3 fine sand | 220 | 16 | 0.35 | 7.50 × 10⁻² | 9.30 × 10⁻² |
Table 4.
Parameter analysis results of the right line passing through silty clay (–3b1–2) and silty clay (–4b1–2).
Table 4.
Parameter analysis results of the right line passing through silty clay (–3b1–2) and silty clay (–4b1–2).
| Parameter | Average | Standard Deviation | Kurtosis | Skewness | Minimum Value | Maximum Value | Median | Mode |
|---|---|---|---|---|---|---|---|---|
| Total thrust (t) | 1277.74 | 1277.74 | −0.44 | 0.76 | 1100 | 1580 | 1250 | 1200 |
| Propulsion speed (mm/min) | 42.87 | 10.32 | −0.12 | −0.85 | 15 | 56 | 45 | 50 |
| Cutter head torque (kNm) | 1966.54 | 407.81 | 0.90 | 1.08 | 1100 | 3400 | 1800 | 1800 |
| Grouting pressure (bar) | 3.89 | 1.19 | −0.02 | 0.46 | 1.30 | 7.80 | 3.70 | 3.70 |
| Surface settlement (mm) | 3.42 | 0.76 | 0.96 | 0.52 | 1.20 | 6.28 | 3.87 | / |
Table 5.
Parameter analysis results of the left line passing through silty clay (–3b1–2) and silty clay (–4b1–2).
Table 5.
Parameter analysis results of the left line passing through silty clay (–3b1–2) and silty clay (–4b1–2).
| Parameter | Average | Standard Deviation | Kurtosis | Skewness | Minimum Value | Maximum Value | Median | Mode |
|---|---|---|---|---|---|---|---|---|
| Total thrust (t) | 1421.02 | 77.11 | 0.02 | 0.36 | 1250 | 1600 | 1420 | 1400 |
| Propulsion speed (mm/min) | 55.12 | 8.64 | 1.19 | −0.94 | 22 | 72 | 58 | 60 |
| Cutter head torque (kNm) | 2100 | 191.03 | 0.83 | −0.19 | 1500 | 2500 | 2100 | 2000 |
| Grouting pressure (bar) | 5.41 | 1.15 | −0.51 | −0.17 | 2.60 | 7.90 | 5.40 | 5.10 |
| Surface settlement (mm) | 2.52 | 0.93 | 0.91 | 0.48 | 1.09 | 4.32 | 2.37 | / |
Table 6.
ABAQUS calculation of double–track superimposed settlement value of cross section in the study area.
Table 6.
ABAQUS calculation of double–track superimposed settlement value of cross section in the study area.
| The double track | Position/m | −24.50 | −22.80 | −20.80 | −17.20 | −14.00 | −11.30 | −8.90 | −6.90 | −4.30 | −1.60 |
| Settlement value/mm | 1.67 | 1.68 | 1.98 | 2.53 | 3.08 | 3.61 | 4.12 | 4.57 | 5.14 | 5.41 | |
| Position/m | 1.00 | 3.60 | 6.30 | 8.90 | 11.50 | 14.10 | 16.80 | 19.40 | 21.70 | 24.40 | |
| Settlement value/mm | 5.34 | 4.95 | 4.31 | 3.55 | 2.76 | 2.04 | 1.42 | 0.92 | 0.56 | 0.24 | |
| Position/m | 27.60 | 31.20 | 35.50 | ||||||||
| Settlement value/mm | 0.03 | 0.03 | 0.03 | ||||||||
Disclaimer/Publisher’s Note: The statements, opinions and data contained in all publications are solely those of the individual author(s) and contributor(s) and not of MDPI and/or the editor(s). MDPI and/or the editor(s) disclaim responsibility for any injury to people or property resulting from any ideas, methods, instructions or products referred to in the content. |
© 2023 by the authors. Licensee MDPI, Basel, Switzerland. This article is an open access article distributed under the terms and conditions of the Creative Commons Attribution (CC BY) license (https://creativecommons.org/licenses/by/4.0/).
Share and Cite
MDPI and ACS Style
Li, Y.; Bian, X.; Peng, H.; Zhu, B.; Zhou, Y. Additional Stress of Soil and Surface Settlement during Tunnel Shield Construction. Buildings 2023, 13, 1437. https://doi.org/10.3390/buildings13061437
AMA Style
Li Y, Bian X, Peng H, Zhu B, Zhou Y. Additional Stress of Soil and Surface Settlement during Tunnel Shield Construction. Buildings. 2023; 13(6):1437. https://doi.org/10.3390/buildings13061437
Chicago/Turabian StyleLi, Ying, Xiaowei Bian, Hao Peng, Baoqiang Zhu, and Yilin Zhou. 2023. "Additional Stress of Soil and Surface Settlement during Tunnel Shield Construction" Buildings 13, no. 6: 1437. https://doi.org/10.3390/buildings13061437
Note that from the first issue of 2016, this journal uses article numbers instead of page numbers. See further details here.