Article

Experimental Research on the Creep Behavior of the Interface of Compacted Loess and High-Density Polyethylene Geogrid

1
School of Civil Engineering, Xi’an University of Architecture & Technology, Xi’an 710055, China
2
Shaanxi Key Laboratory of Geotechnical and Underground Space Engineering, Xi’an 710055, China
*
Author to whom correspondence should be addressed.
Buildings 2023, 13(5), 1353; https://doi.org/10.3390/buildings13051353
Submission received: 2 January 2023 / Revised: 2 May 2023 / Accepted: 8 May 2023 / Published: 22 May 2023
(This article belongs to the Collection Innovation of Materials and Technologies in Civil Construction)

Abstract

:
The stability of geogrid-reinforced soil structure is closely related to the interface characteristics between geogrid and soil. However, the creep behavior of the soil–geogrid interface is still unrevealed. In this study, using a modified stress-controlled pullout device, influence of the normal pressure, dry density, and water content on creep behavior of interface of compacted loess and high-density polyethylene (HDPE) geogrid is investigated. A three-parameter empirical model and a Merchant element model were established through fitting analysis. Analysis results show that the normal pressure, dry density, and water content have significant effects on the creep shear displacement of the reinforced soil interface. Under the same pullout level, creep displacement of the interface increases with the increase of water content and decreases with the increase of dry density and normal pressure. Both the three-parameter empirical model and Merchant element model can describe the creep characteristics of the reinforced soil interface. The Merchant model is more accurate in the early stage, while the three-parameter empirical model is more suitable for predicting the long-term creep deformation of the interface of compacted loess and geogrid.

1. Introduction

In engineering practice, as an effective reinforcement material, geogrid has been widely used in embankments [1,2,3], railway foundations [4,5,6], filling slopes [7,8], and retaining walls [9,10,11,12] due to its good engineering properties and low cost. It was proven that the engineering behavior of the geogrid-reinforced soil structures is influenced by property of soil (the density, grain size and shape, water content, and strength) [13,14,15] and geogrid (geometry, type, stiffness, and roughness) [16,17] as well as their interface. The geogrid is mostly made of polymer which has stable behavior [18]. On the other hand, the property of the interface of soil and geogrid are more uncertain and less predictable.
The mechanical property of the interface of soil and geogrid plays an important role in the stability and performance of reinforced soil structures [19,20]. Several experimental and numerical studies have been performed to investigate the strength and deformation properties of the soil–geogrid interface. Hatami et al. [21] investigated the pullout performance and interactions of geogrids with base layer aggregates in roadway applications under different in-isolation properties of different geogrids. Esmaeili and Pourrashnoo [22] investigated the effect of encasement of ballast with geogrid on shear behavior using a large-scale direct shear apparatus. Mirzaeifar et al. [23] studied the possibility of using fine-grained soil as backfill material of geosynthetic-reinforced walls and slopes through a laboratory study on pullout behavior of geogrids in granular layers. Moreover, with the help of Particle Image Velocimetry (PIV), the soil–geogrid interactions at different gravimetric water contents (GWC) values were investigated. Pullout resistance offered by geogrid depends primarily on the properties of structural fill, geometrical and mechanical properties of the geogrid, and normal stress at which the test is conducted [24]. The relationship between soil properties and geogrid properties with pullout resistance is nonlinear and complex. To predict the behavior of the soil–geogrid interface, Pant and Ramana [25] proposed a prediction method for pullout interaction coefficient using data driven machine learning regression algorithms. Their proposed model gives 90% accuracy in prediction of pullout interaction coefficient compared to laboratory test results. Using test data of large-scale direct shear tests, He et al. [26] established a nonlinear hyperbolic model to describe the relationship between shear stress and shear displacement of the clay–geogrid interfaces. As a result, the relation between water content and shear strength at the clay–geogrid interfaces was revealed.
In filling foundations and filling slopes, the geogrids in reinforced soil are mostly in time-varying tensile state due to the construction process and settlement deformation of soil. Under the long-term tensile state, the interface slip strain may increase over time, which is called the shear creep behavior. If the creep deformation of the soil–geogrid interface grows too large, the stress in soil structure may be redistributed, which could lead to instability or collapse of the soil structure due to excessive deformation. Creep behaviors of different soils have been fully investigated in previous studies [27]: Lian et al. [28] conducted triaxial creep tests and scanning electron microscopy (SEM) tests on intact loess to investigate the influence of the dry–wet cycle on the creep characteristics and microstructural evolution. Zhu et al. [29] studied the spatial–temporal variations of the postconstruction settlement of high fill embankments based on an empirical formula fitted by in situ monitored data. Construction recommendations were also given. Based on a test section of a high filling airport constructed on a thick loess foundation, Zhu and Li [30] investigated the creep behavior of both intact compacted loess under high pressure and different initial conditions [31]. As for the creep behavior of geogrid, considering the influence of the reinforced soil on the creep characteristics of the geogrid, Wang et al. [32] carried out a series of creep tests using a self-developed pullout test device, and found that compared with unconstrained conditions, the creep deformation of geogrid under the constraint of reinforced soil is reduced by 11.5% at most, and the ability to resist the creep deformation is better. Yeo and Hsuan [33] performed an experimental study on the tensile creep behavior of polyethylene-terephthalate (PET) and high-density polyethylene (HDPE) geogrids using five test methods: the short and long-term stepped isothermal method (SIM), the short and long-term time–temperature superposition (TTS), and the conventional method. They concluded that the Weibull model was able to predict the linear and non-linear creep behavior up to 100 years based on 10 h creep testing data and fitting analysis. Zou et al. [34] investigated the creep behavior and stress relaxation of HDPE geogrids under four sustained load levels. Research results showed that the working stress of geogrids should be less than 40% of ultimate tensile strength.
Most of the existing studies were focused on the creep properties of soil or geogrid using laboratory tests (direct shear test, pullout test) and numerical simulation methods. Nevertheless, there is no study on creep behavior of the interface of soil and geogrid as far as we know, which is also an important influencing factor of the stability and strength of reinforced soil structure.
In this paper, a modified pullout test device was used to conduct the creep deformation pullout test of the interface of compacted loess and HDPE geogrid. The effects of normal pressures, dry density, and water content on the creep property of interface of compacted loess and HDPE geogrid were studied. A three-parameter empirical model and a Merchant model for the interface creep behavior were studied through fitting analysis. Research results can provide reference for the prediction of the engineering behavior of reinforced soil structure.

2. Materials and Methods

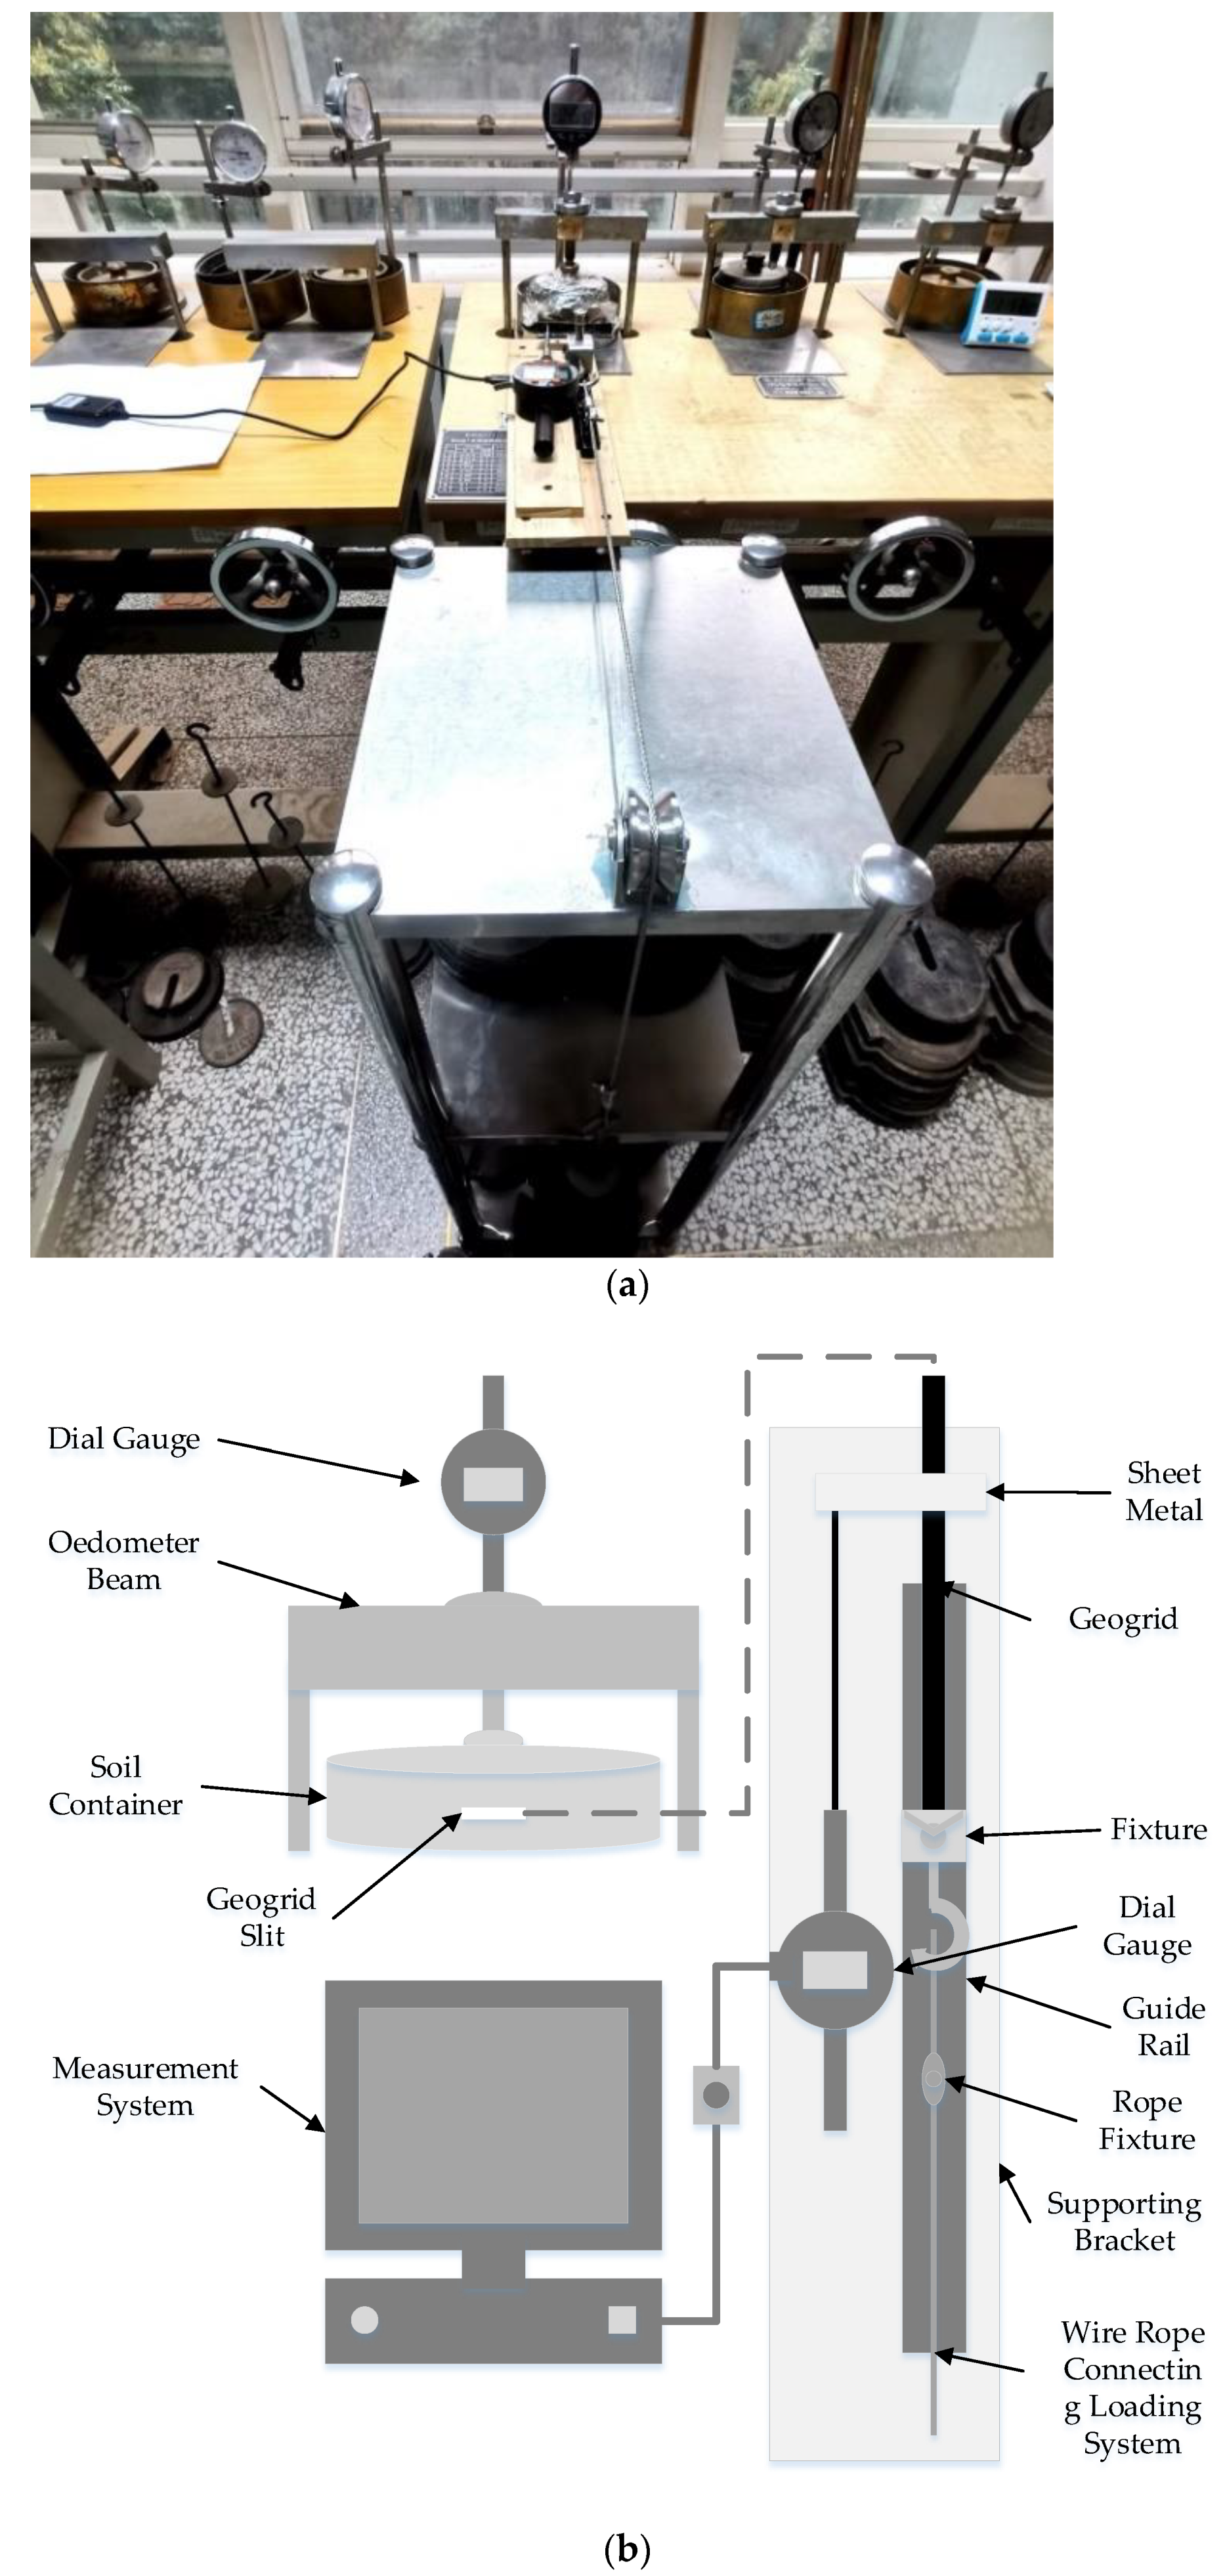
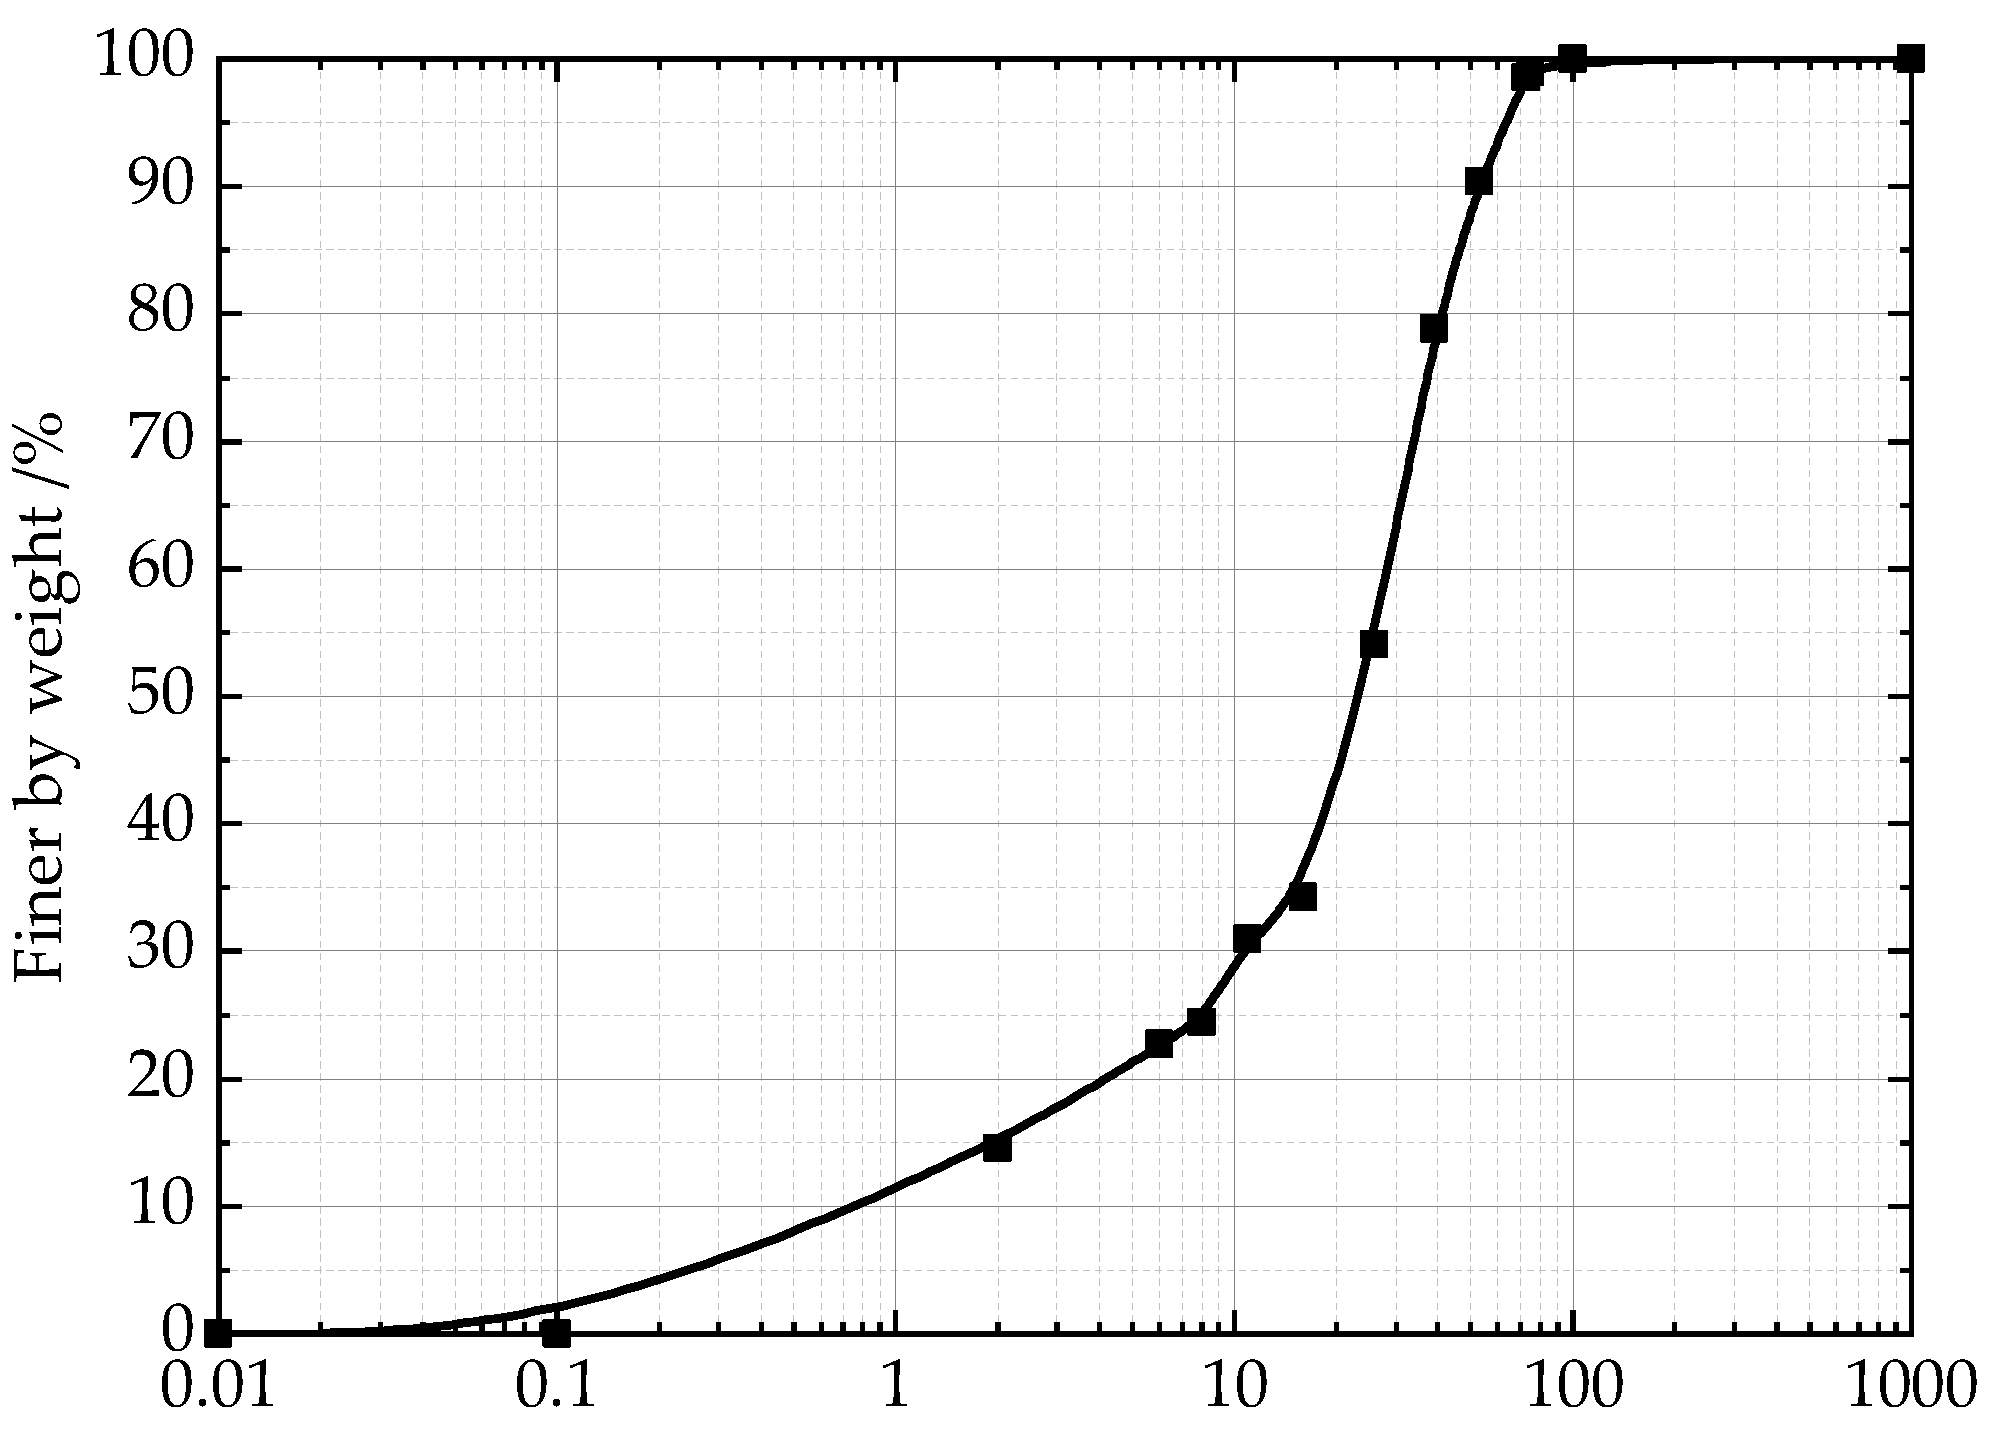
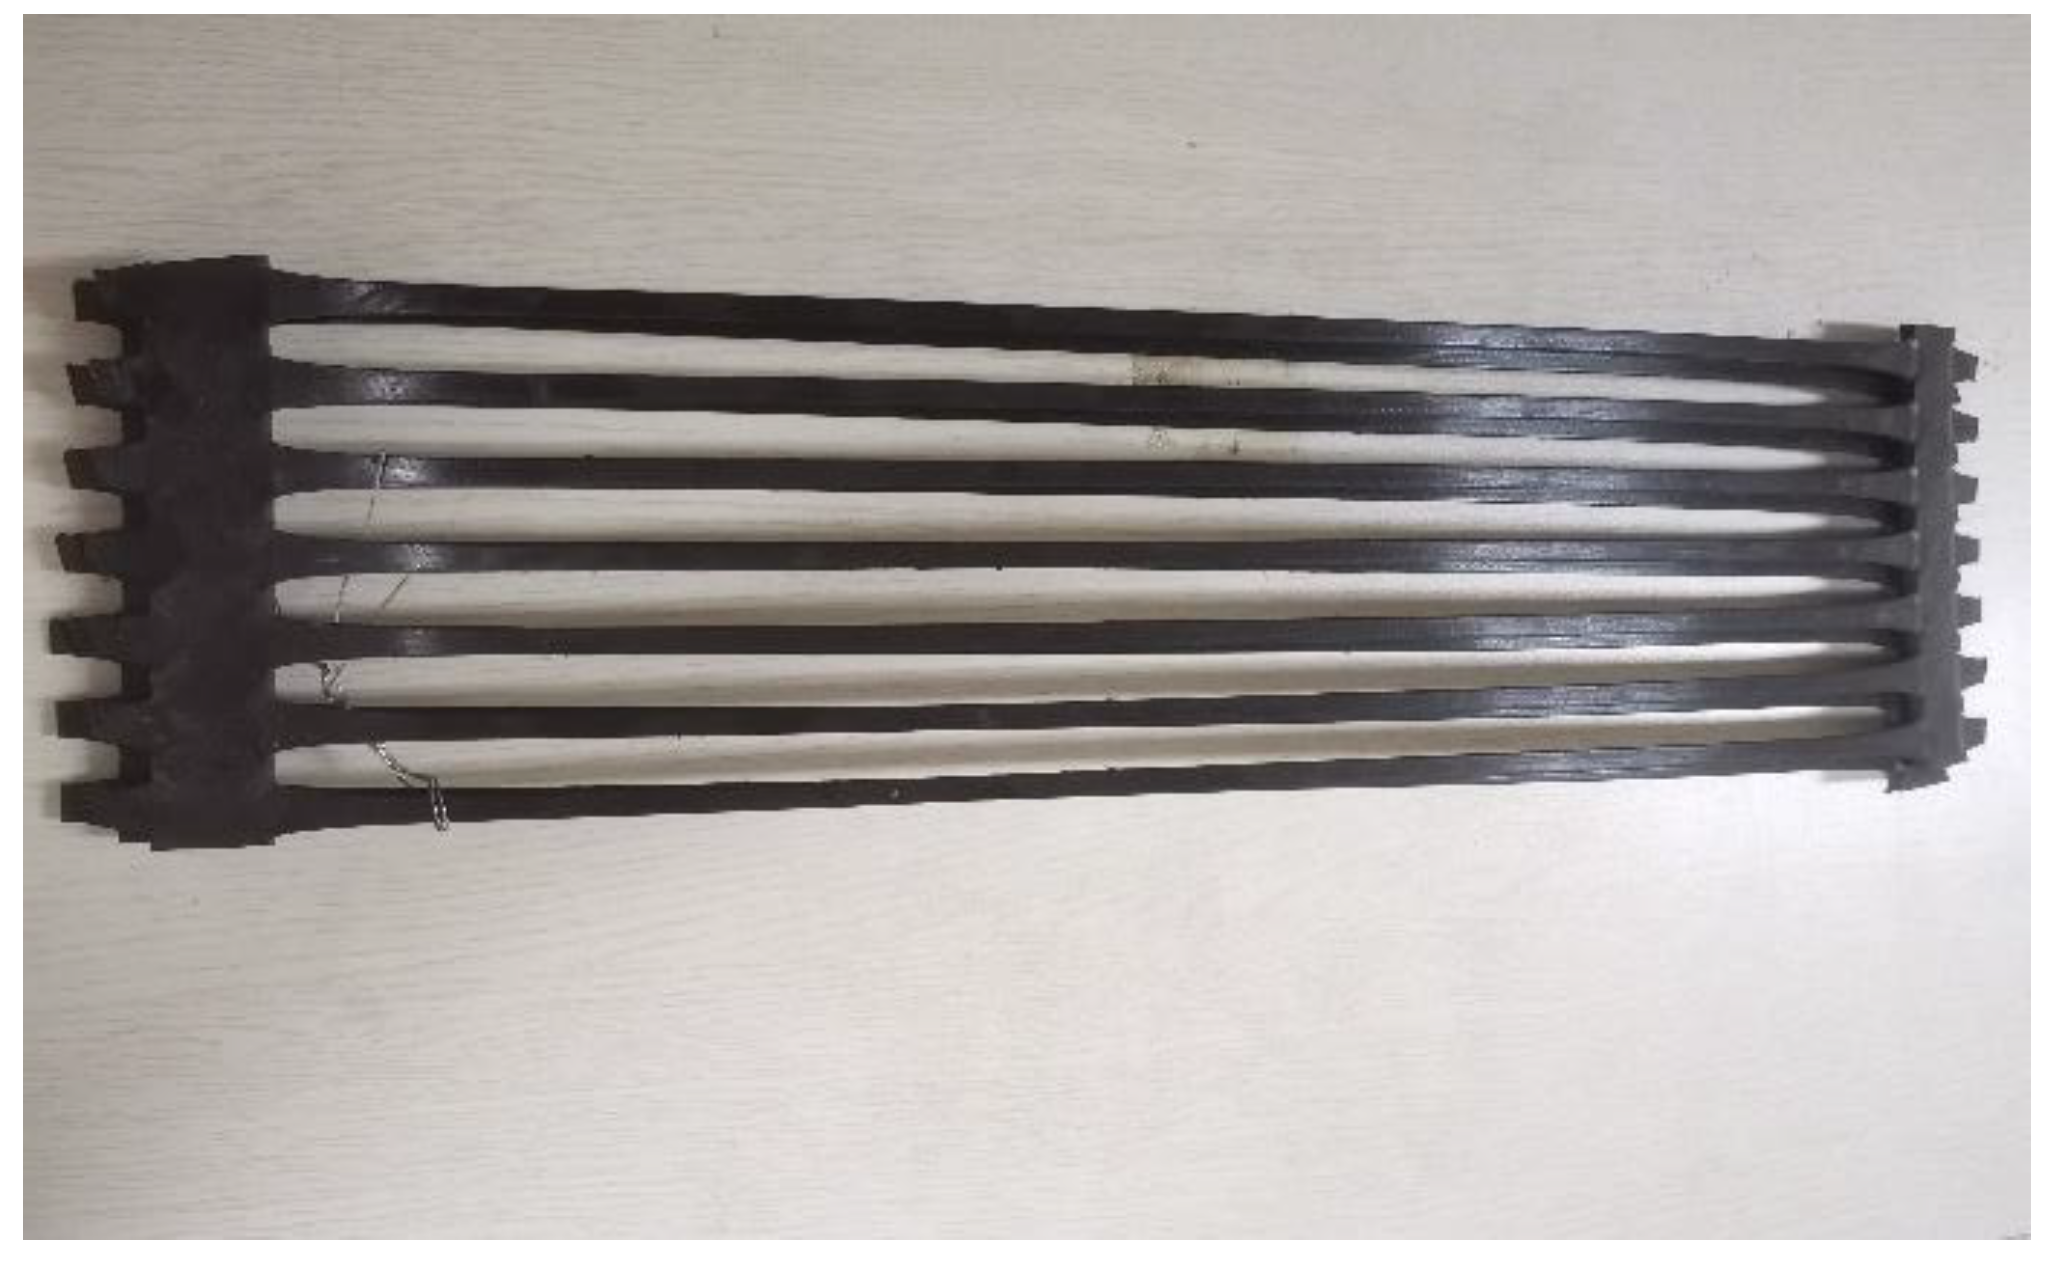
2.1. Soil and Test Device

To reveal the interface creep behavior between compacted loess and geogrid, a stress-controlled pullout test device was needed. In our study, an oedometer was modified to achieve the above objectives. As shown in Figure 1, the modified pullout test device consisted of the following components: a normal pressure application system, a constant tensile load system, a measurement system, and a soil sample mold that is compatible with geogrid specimen. The normal pressure application system is provided by the original oedometer device. The constant tensile load system is realized through a pulley block and counterweights. The original consolidation container is modified to serve as a sample mold. The effective size of the mold is 7.98 cm in diameter and 2 cm in height, which is the most commonly used dimension for both consolidation tests and direct shear tests. A 1 cm long and 0.3 cm high narrow slit is cut in the middle of the height of the mold, so that the geogrid can stretch out from the mold through the slit and connect with the load system. Such dimension is big enough for the strip to pass through, and not too big to influence the stress state of the soil sample. The measurement system uses a dial indicator and a data collecting system to record the displacement of the pullout length of the geogrid. The data measurement system can automatically collect data at any time interval. In the initial stage of the test, the data are collected every 30 s, and gradually increased to 1–5 h according to the change rate of the deformation.
The test soil sample is collected from the high fill project in the new campus of Yan’an University, Yan’an City, Shaanxi Province. The soil sample is mainly composed of silt, containing a small amount of silty clay, which belongs to Q3 loess (also known as “Malan Loess”) [35]. Basic geotechnical tests were conducted to obtain the basic properties of the soil samples. Table 1 shows the resulting physical and mechanical properties. The grading curve is shown in Figure 2. According to the Unified Soil Classification System (USCS), the sampled soil was classified as lean silt (ML). Based on X-ray diffraction analysis according to test standard (GB/T 50123) [36], the chemical composition of the sampled soil was obtained. The content of SiO2 ranged from 50 to 60%, Al2O3 ranged from 9 to 12%, CaO ranged from 7 to 10%, MgO ranged from 1 to 3%, Fe2O3 ranged from 4 to 5%, and K2O ranged from 2%. The mineral composition is mainly composed of quartz, feldspar, and carbonate minerals. Through a laboratory compaction test, the optimal water content and maximum dry density of soil samples were obtained as 13.50% and 1.785 g/cm3, respectively. In the tests of the present study, samples with different water content were prepared by water film transfer method [37] for humidification and placed in a moisturizing cylinder for 48 hours before use [38].
High density polyethylene (HDPE) one-way geogrid is used in the test, as shown in Figure 3. The width of the transverse rib and the width of the longitudinal rib of the geogrid are 19 mm and 5 mm, respectively. The thickness of the transverse rib and the thickness of the longitudinal rib are 3.3 mm and 1 mm, respectively. The peak strain is 11.28%. Other basic mechanical properties are shown in Table 2. The single geogrid used in the test is cut from the unidirectional geogrid sample, and the actual length of the single geogrid is determined by the specimen mold.

2.2. Test Method

In order to investigate the influence of normal pressure, dry density, and water content on interface creep behavior between compacted loess and geogrid, three groups of pullout tests were designed as shown in Table 3. Disturbed loess at the required dry density and water content was statically pressed into mold in two layers, and a strip of geogrid was buried between two soil layers and reaching out from the slit in the middle of the mold. The geogrid is placed on the guide rail to ensure a constant tension direction and connected to the counterweights through a fixture and wire rope. A sheet metal was bonded to the beginning of the extended geogrid to install the probe of the displacement sensor. Thus, the pullout displacement can be automatically recorded by the data measurement system connected with the sensor. The pullout process is stress controlled by applying different counterweights during 3–6 stages. During the test, it was found that when the pullout stress is smaller than 40% of the ultimate pullout stress, creep deformation may not occur. On the other hand, if the pullout stress is greater than 70% of the ultimate pullout stress, the geogrid will be pulled in a rather short time. Therefore, the stress level in the tests was controlled at 45%, 55%, and 65% of the ultimate pullout stress for each condition. The convergence criterion of the test was set such that the deformation is smaller than 0.01 mm increment within 24 h. It should be noted that the maximum deformation of geogrid under ultimate pullout load was 0.0008 mm, which is far less than the convergence criterion. Hence, the influence of the deformation of the geogrid was ignored. The observed creep deformation will be treated as the relative slip deformation between soil and geogrid. Standard GB/T 50123 (published by Ministry of Housing and Urban Rural Development of China) was used for the above tests in our study.

3. Results

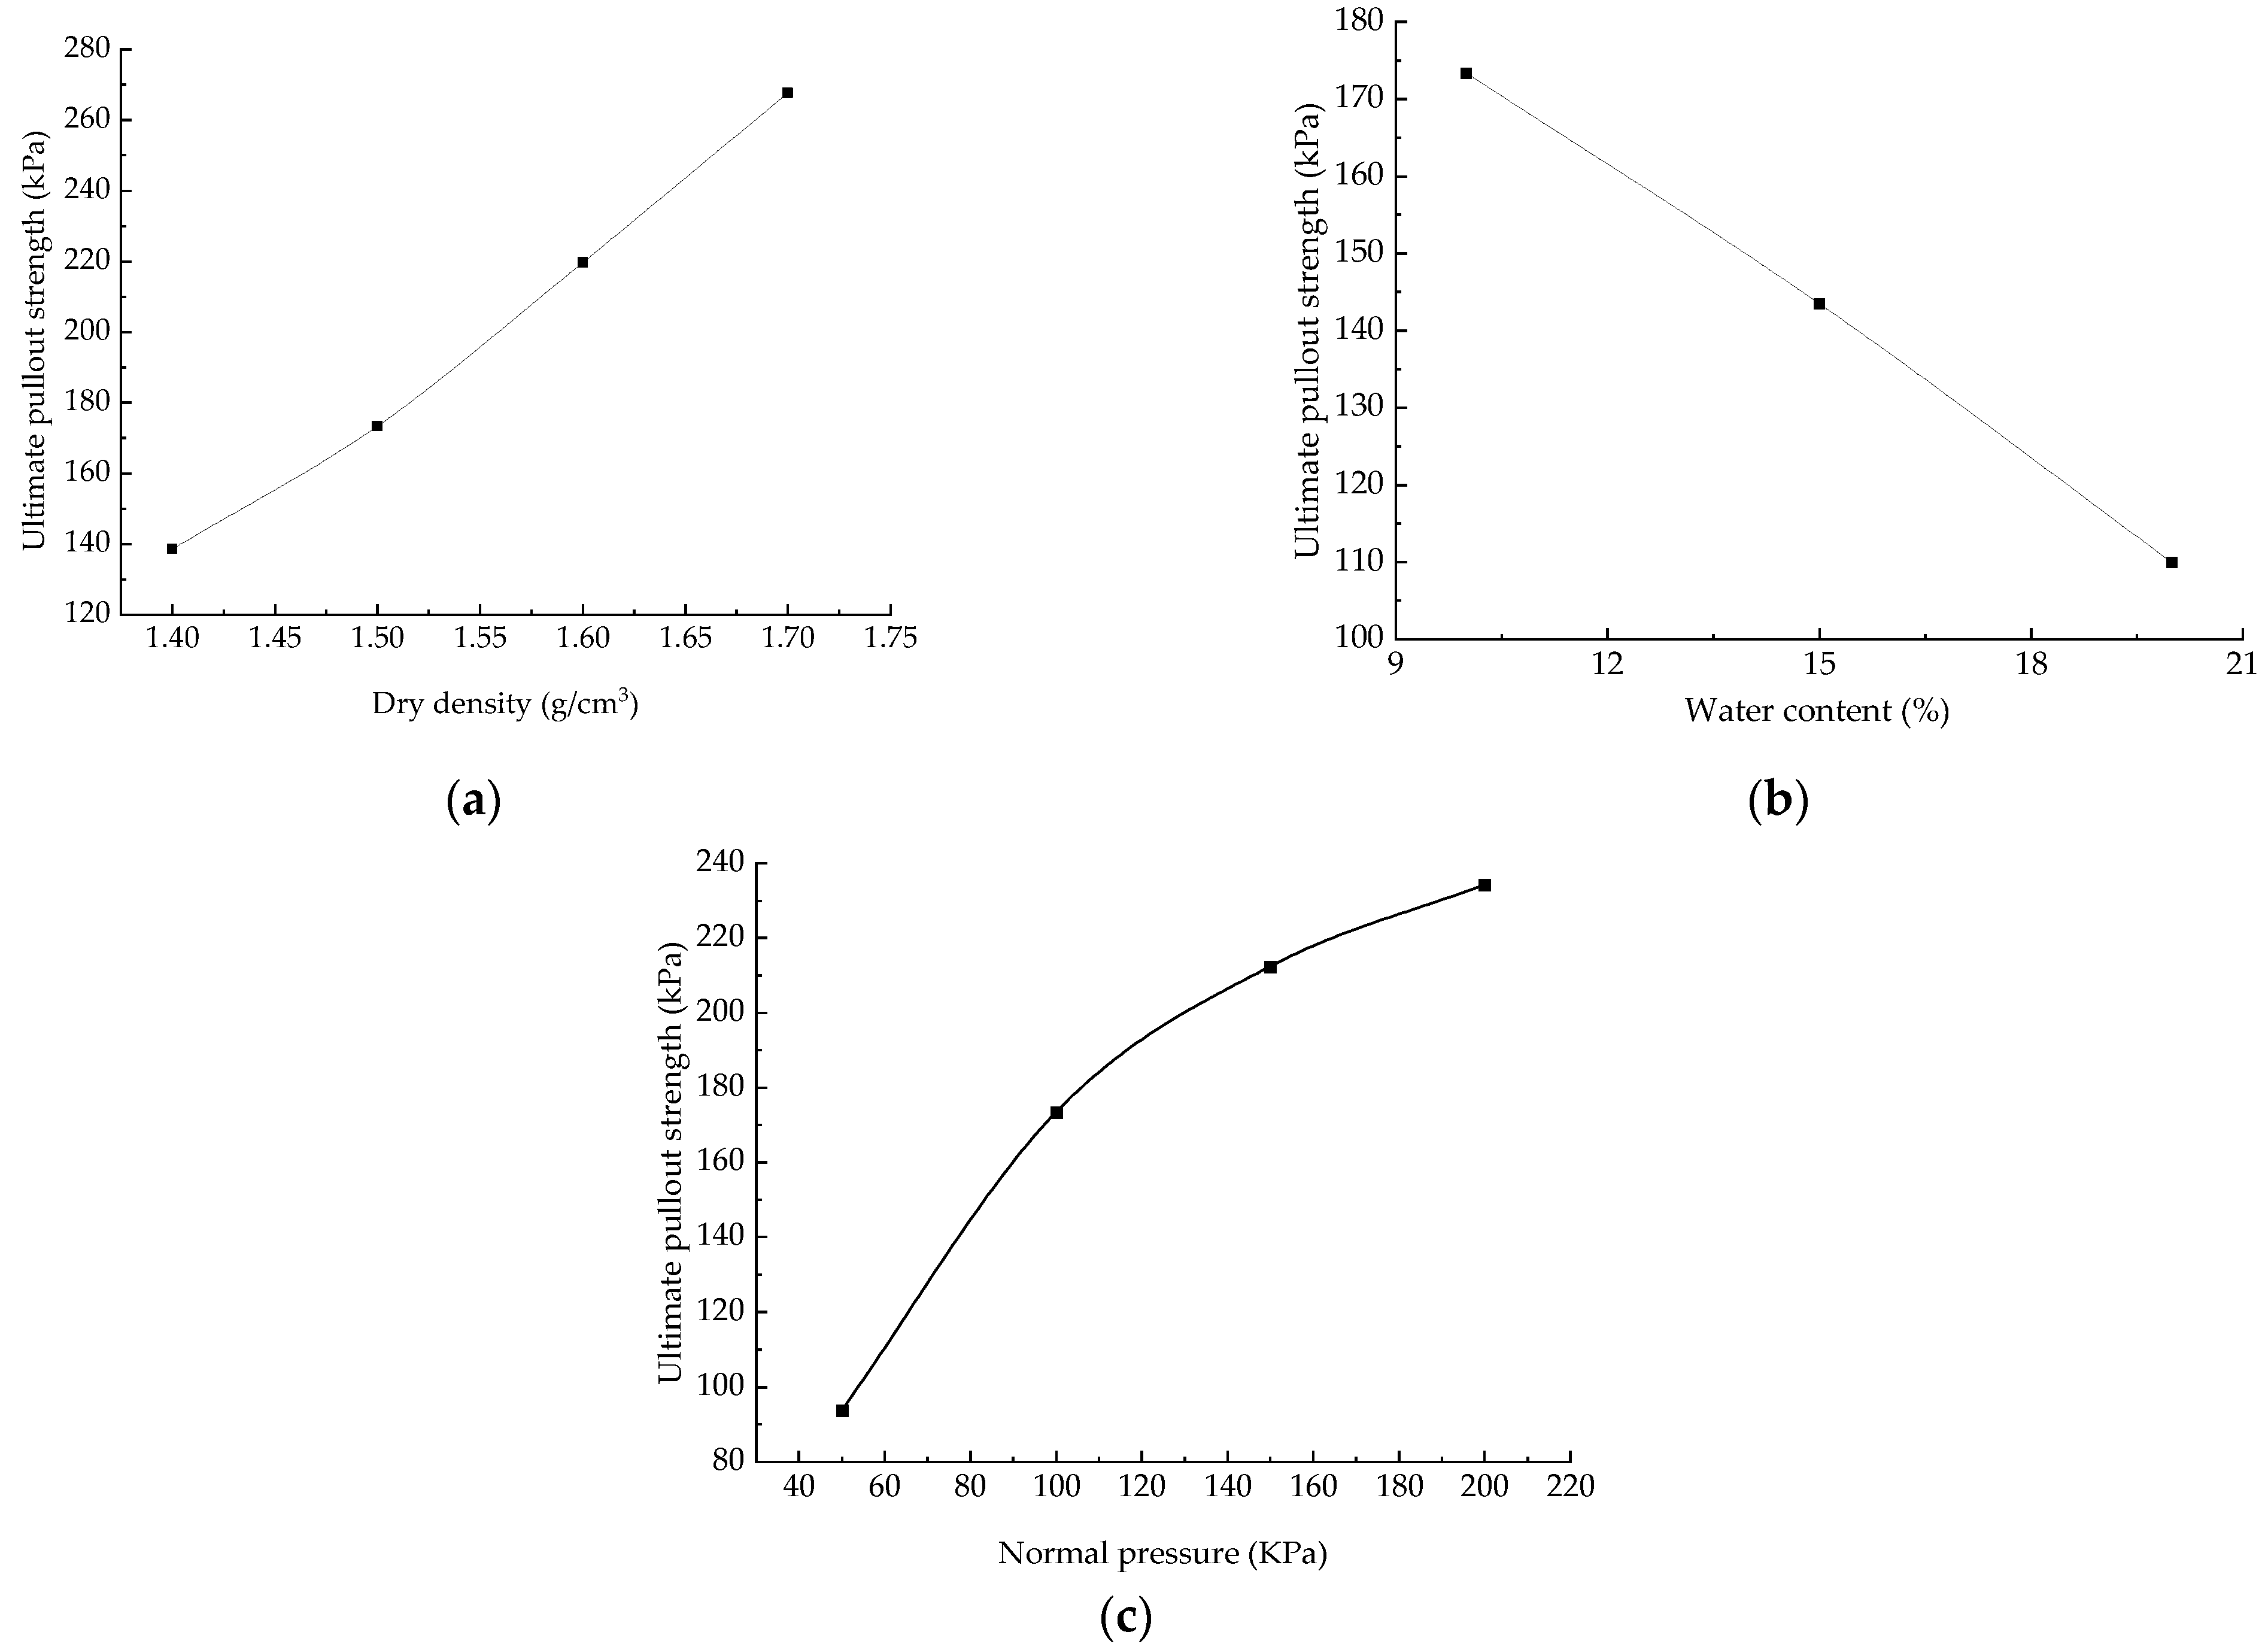
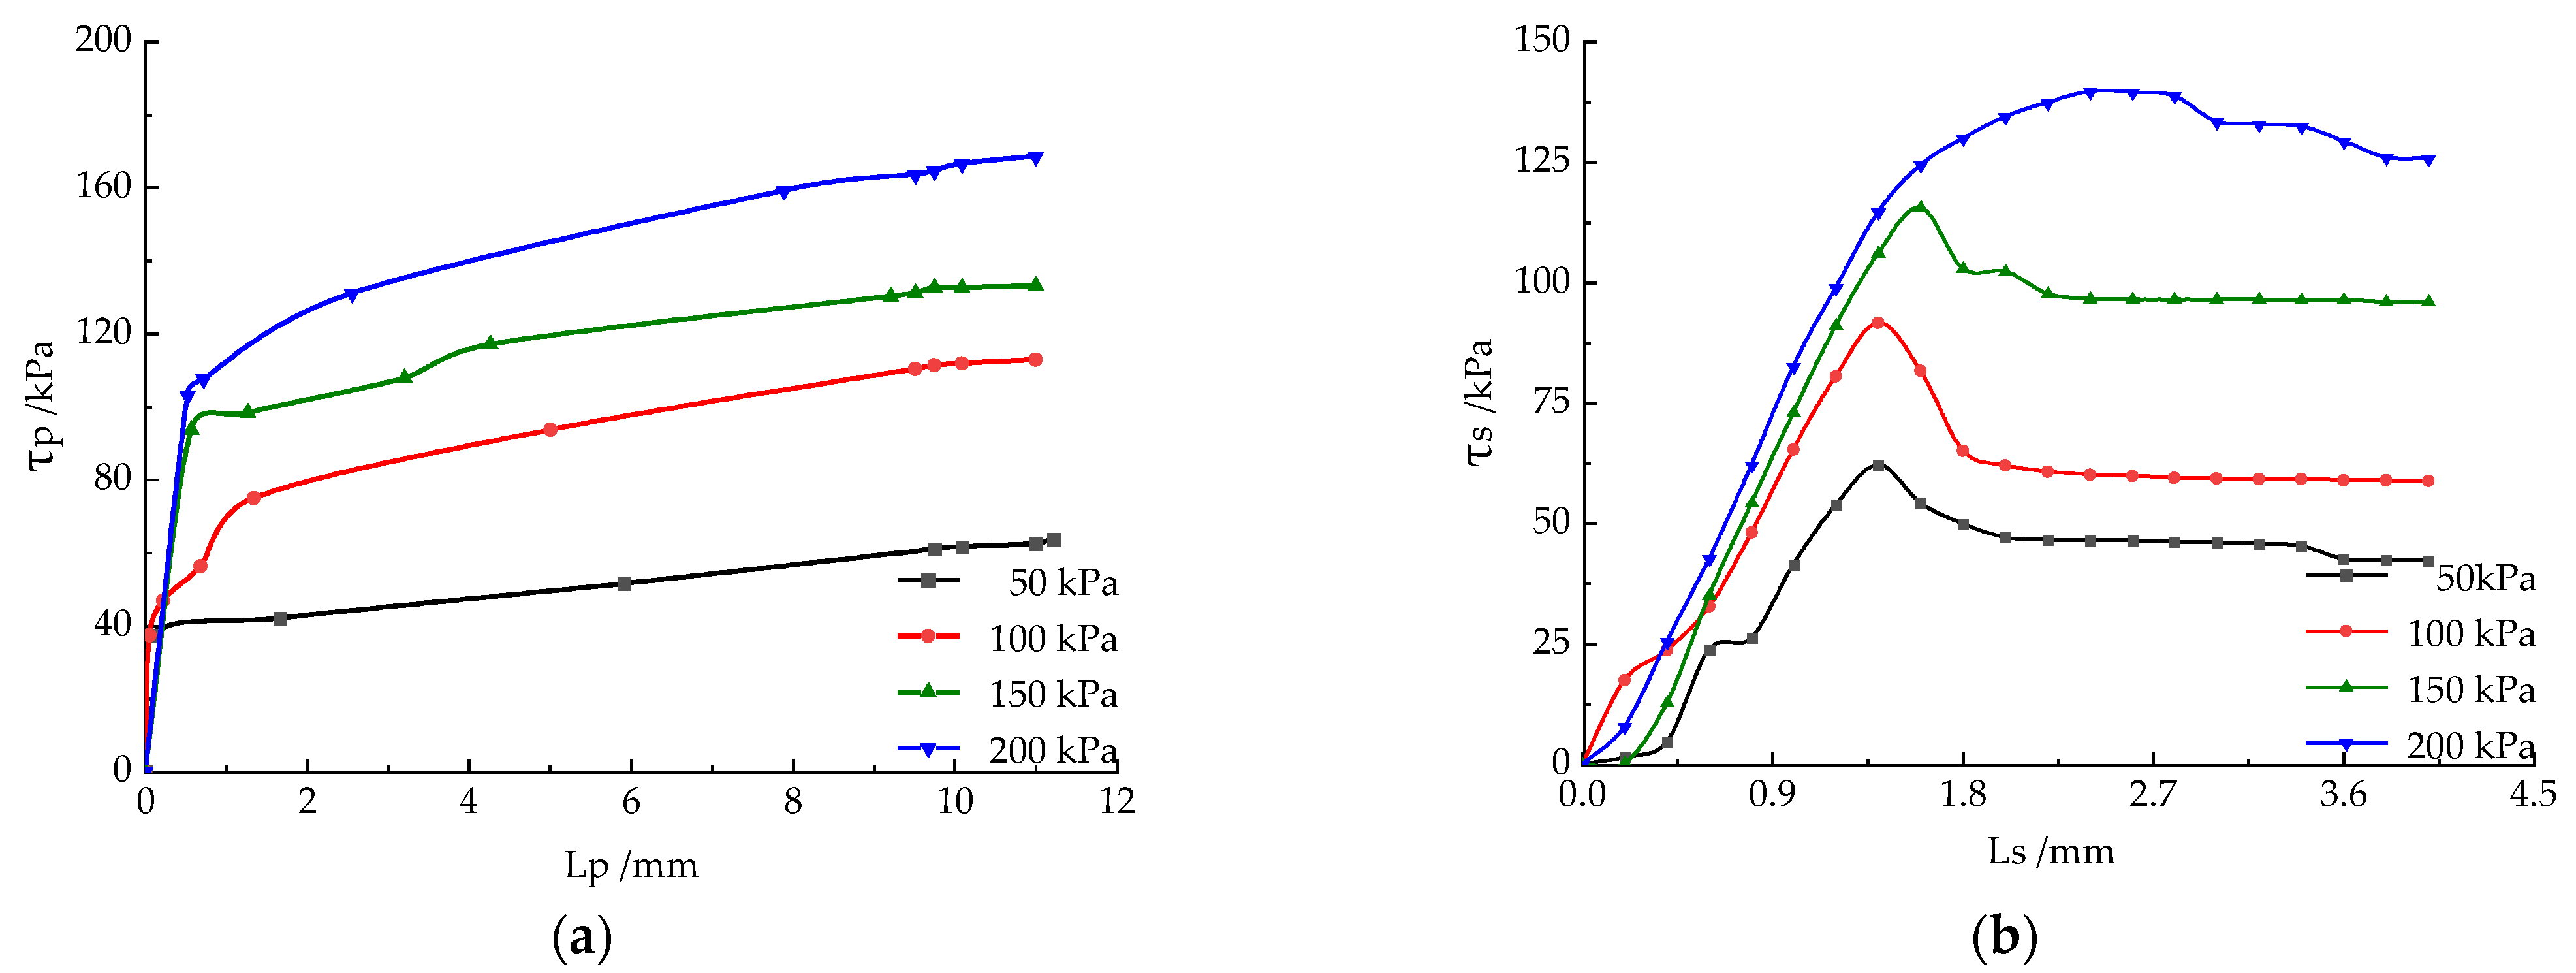
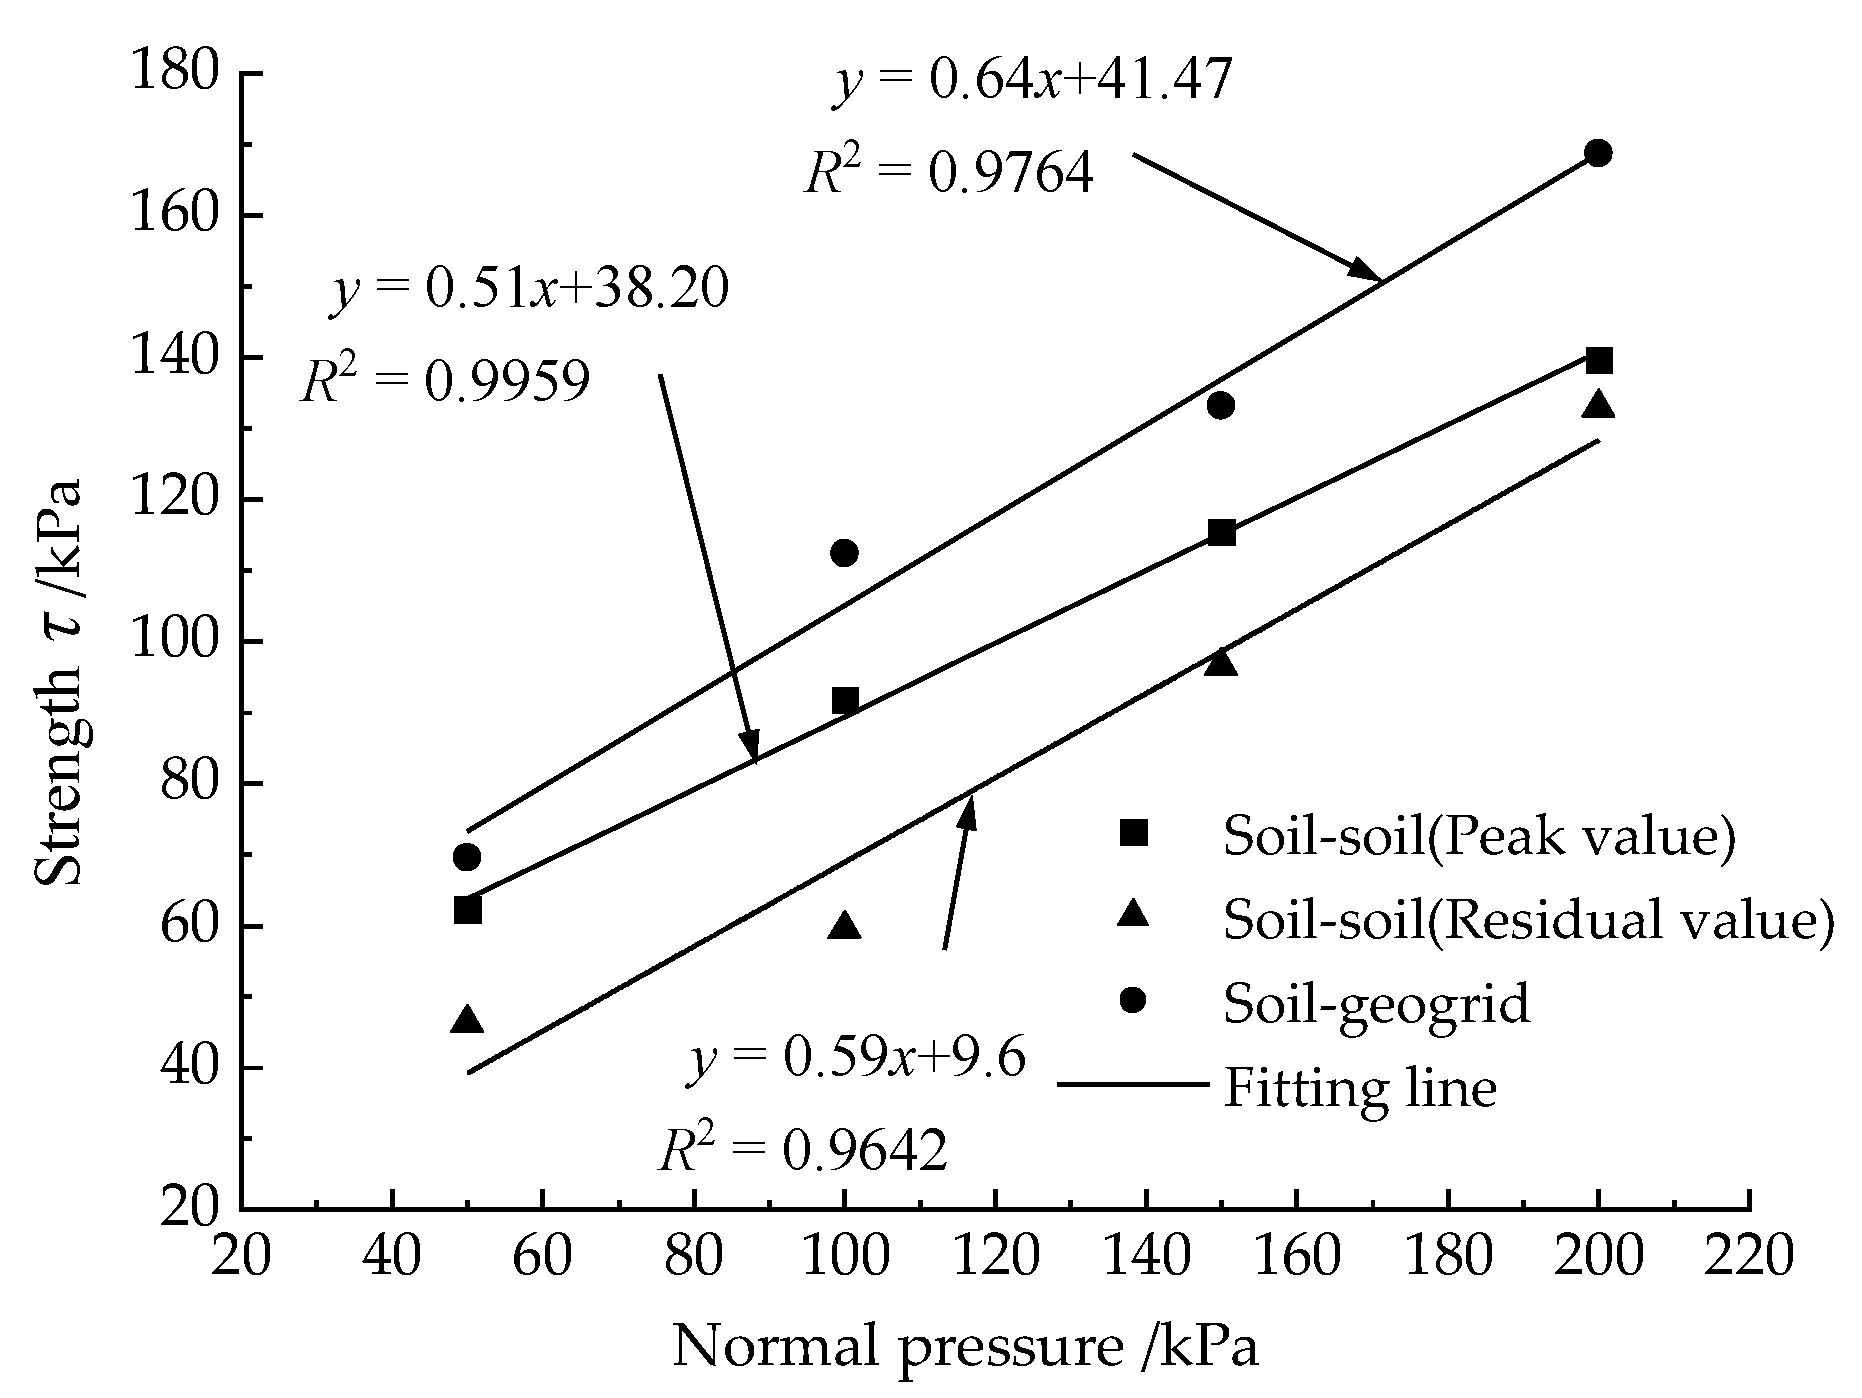
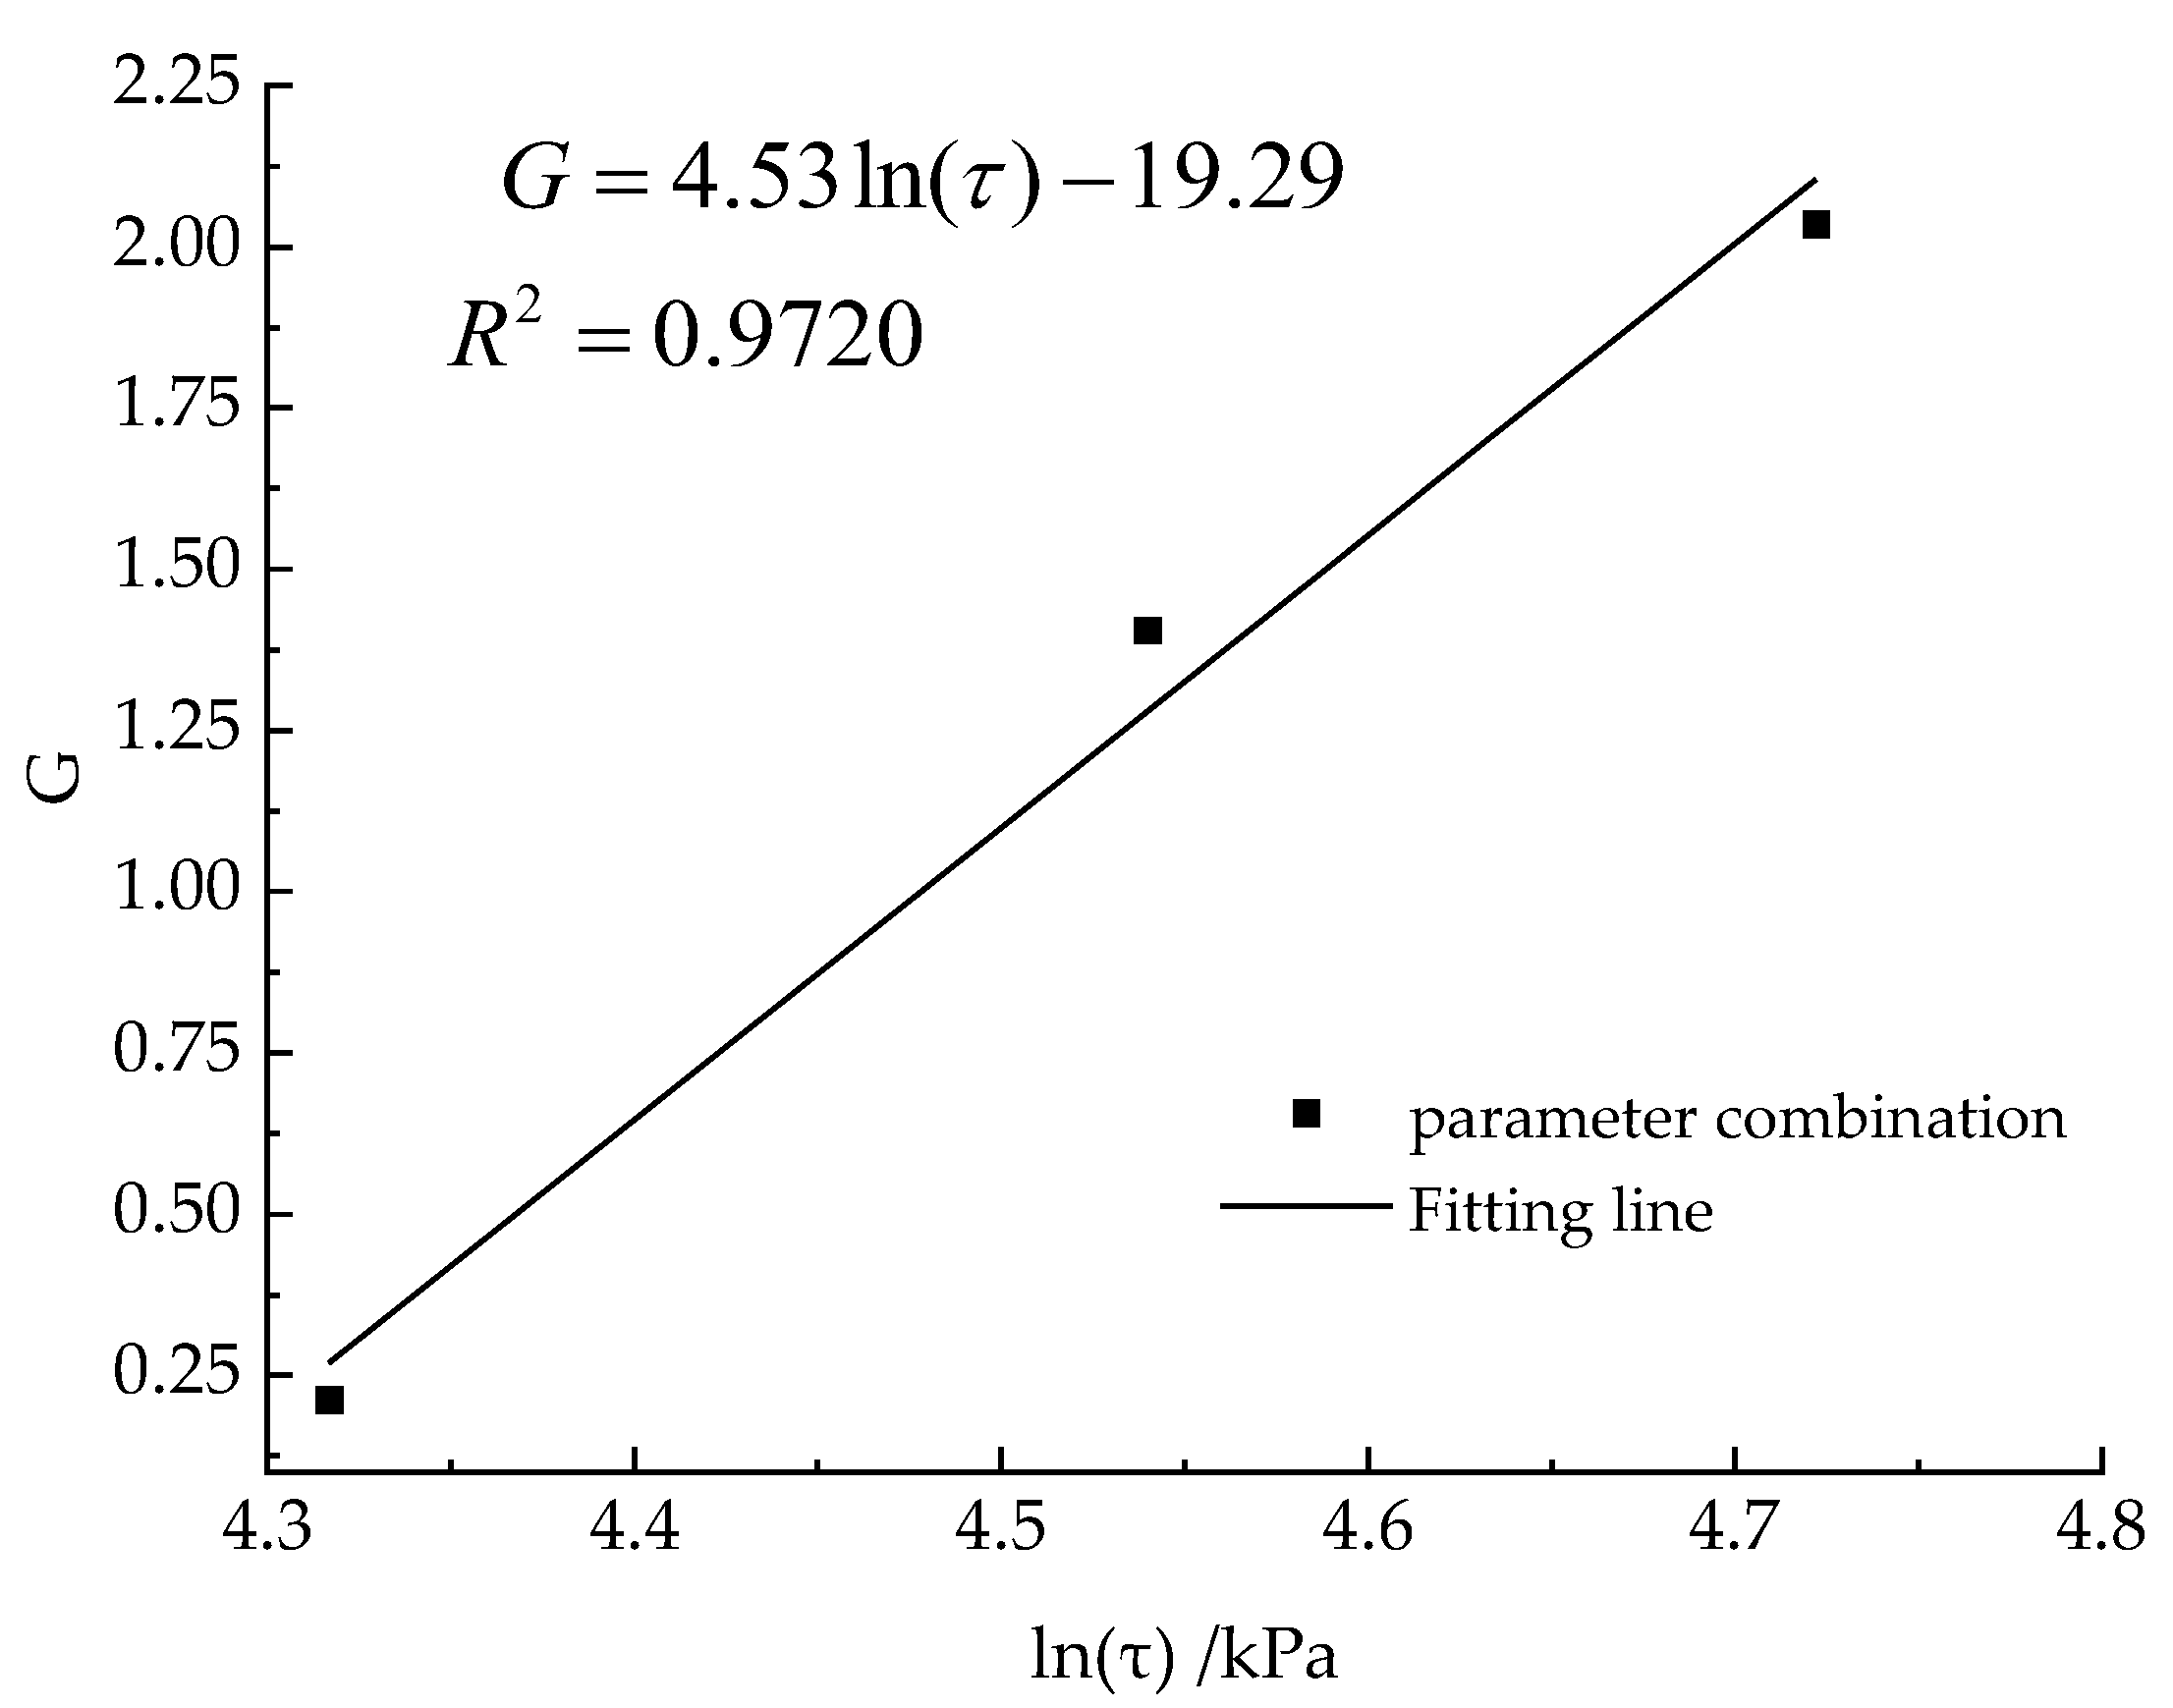
3.1. Frictional Behavior of the Contact Interface

Before the creep test, the ultimate pullout stress was obtained through tests. Results are shown in Figure 4. It can be seen that normal pressure, dry density, and water content affect the ultimate pullout stresses greatly. Their relations are approximately linear. Ultimate pullout stress increases with the increase of dry density of the compacted loess because a denser soil means that more particles will be in contact with the surface of the geogrid causing a higher surface friction and mechanical occlusion. An increase in water content diminishes the friction properties of the interface of soil and geogrid leading to a lower ultimate pullout stress [39]. Finally, ultimate pullout stress increases with the increase of normal pressure [40]. This is due to the friction property of the interface of the two materials. These conclusions are similar to those found in the literature [23].
Furthermore, direct shear tests were conducted to make a comparison of the interface property of soil–soil and soil–geogrid. Figure 5 shows the relation curve of shear and pullout stress displacement relationship curve of the soil–soil and the soil–geogrid interfaces. The shear stress and pullout stress of the interface were calculated through Equations (1) and (2), respectively:
τ s = T s A s
τ p = T p 2 A p
where, Ts and Tp are the shear force obtained from shear tests and pullout tests, respectively; As and Ap are the area of contacted faces of soil and geogrid in direct shear test and pullout test, respectively.
It can be seen from Figure 5 that the pullout force of the reinforced soil interface increases nonlinearly with the increase of the horizontal displacement. With the increase of normal pressure, the pullout force required under the same horizontal displacement of the soil–geogrid interface gradually increases. Under all normal pressure, the relationship curve of shear stress and shear displacement of direct shear test show a strain softening pattern. The greater the normal pressure applied, the greater the shear displacement needed for a given peak shear stress. Both peak values and residual values of the results of direct shear tests were recorded and their relations with normal pressure are shown in Figure 6. On the other hand, the displacement–stress curves of the pullout tests were of the strain-hardening type. The relationship between pullout strength and normal pressure is also shown in Figure 6. The cohesion and internal friction angle of loess through direct shear test are 38.20 kPa and 27.14°, respectively, for peak strength, and for the residual strength, the indexes are 9.6 kPa and 30.6°, respectively. As for the pullout strength of the interface of compacted loess and geogrid, the cohesion is 41.47 kPa, and the internal friction angle is 32.44°. It is clear that the internal friction angle of the four test results is similar while cohesion varied greatly. The internal friction angle of the residual strength is closer to pullout strength. This is because the residual strength can better reflect the frictional behavior of the soil.

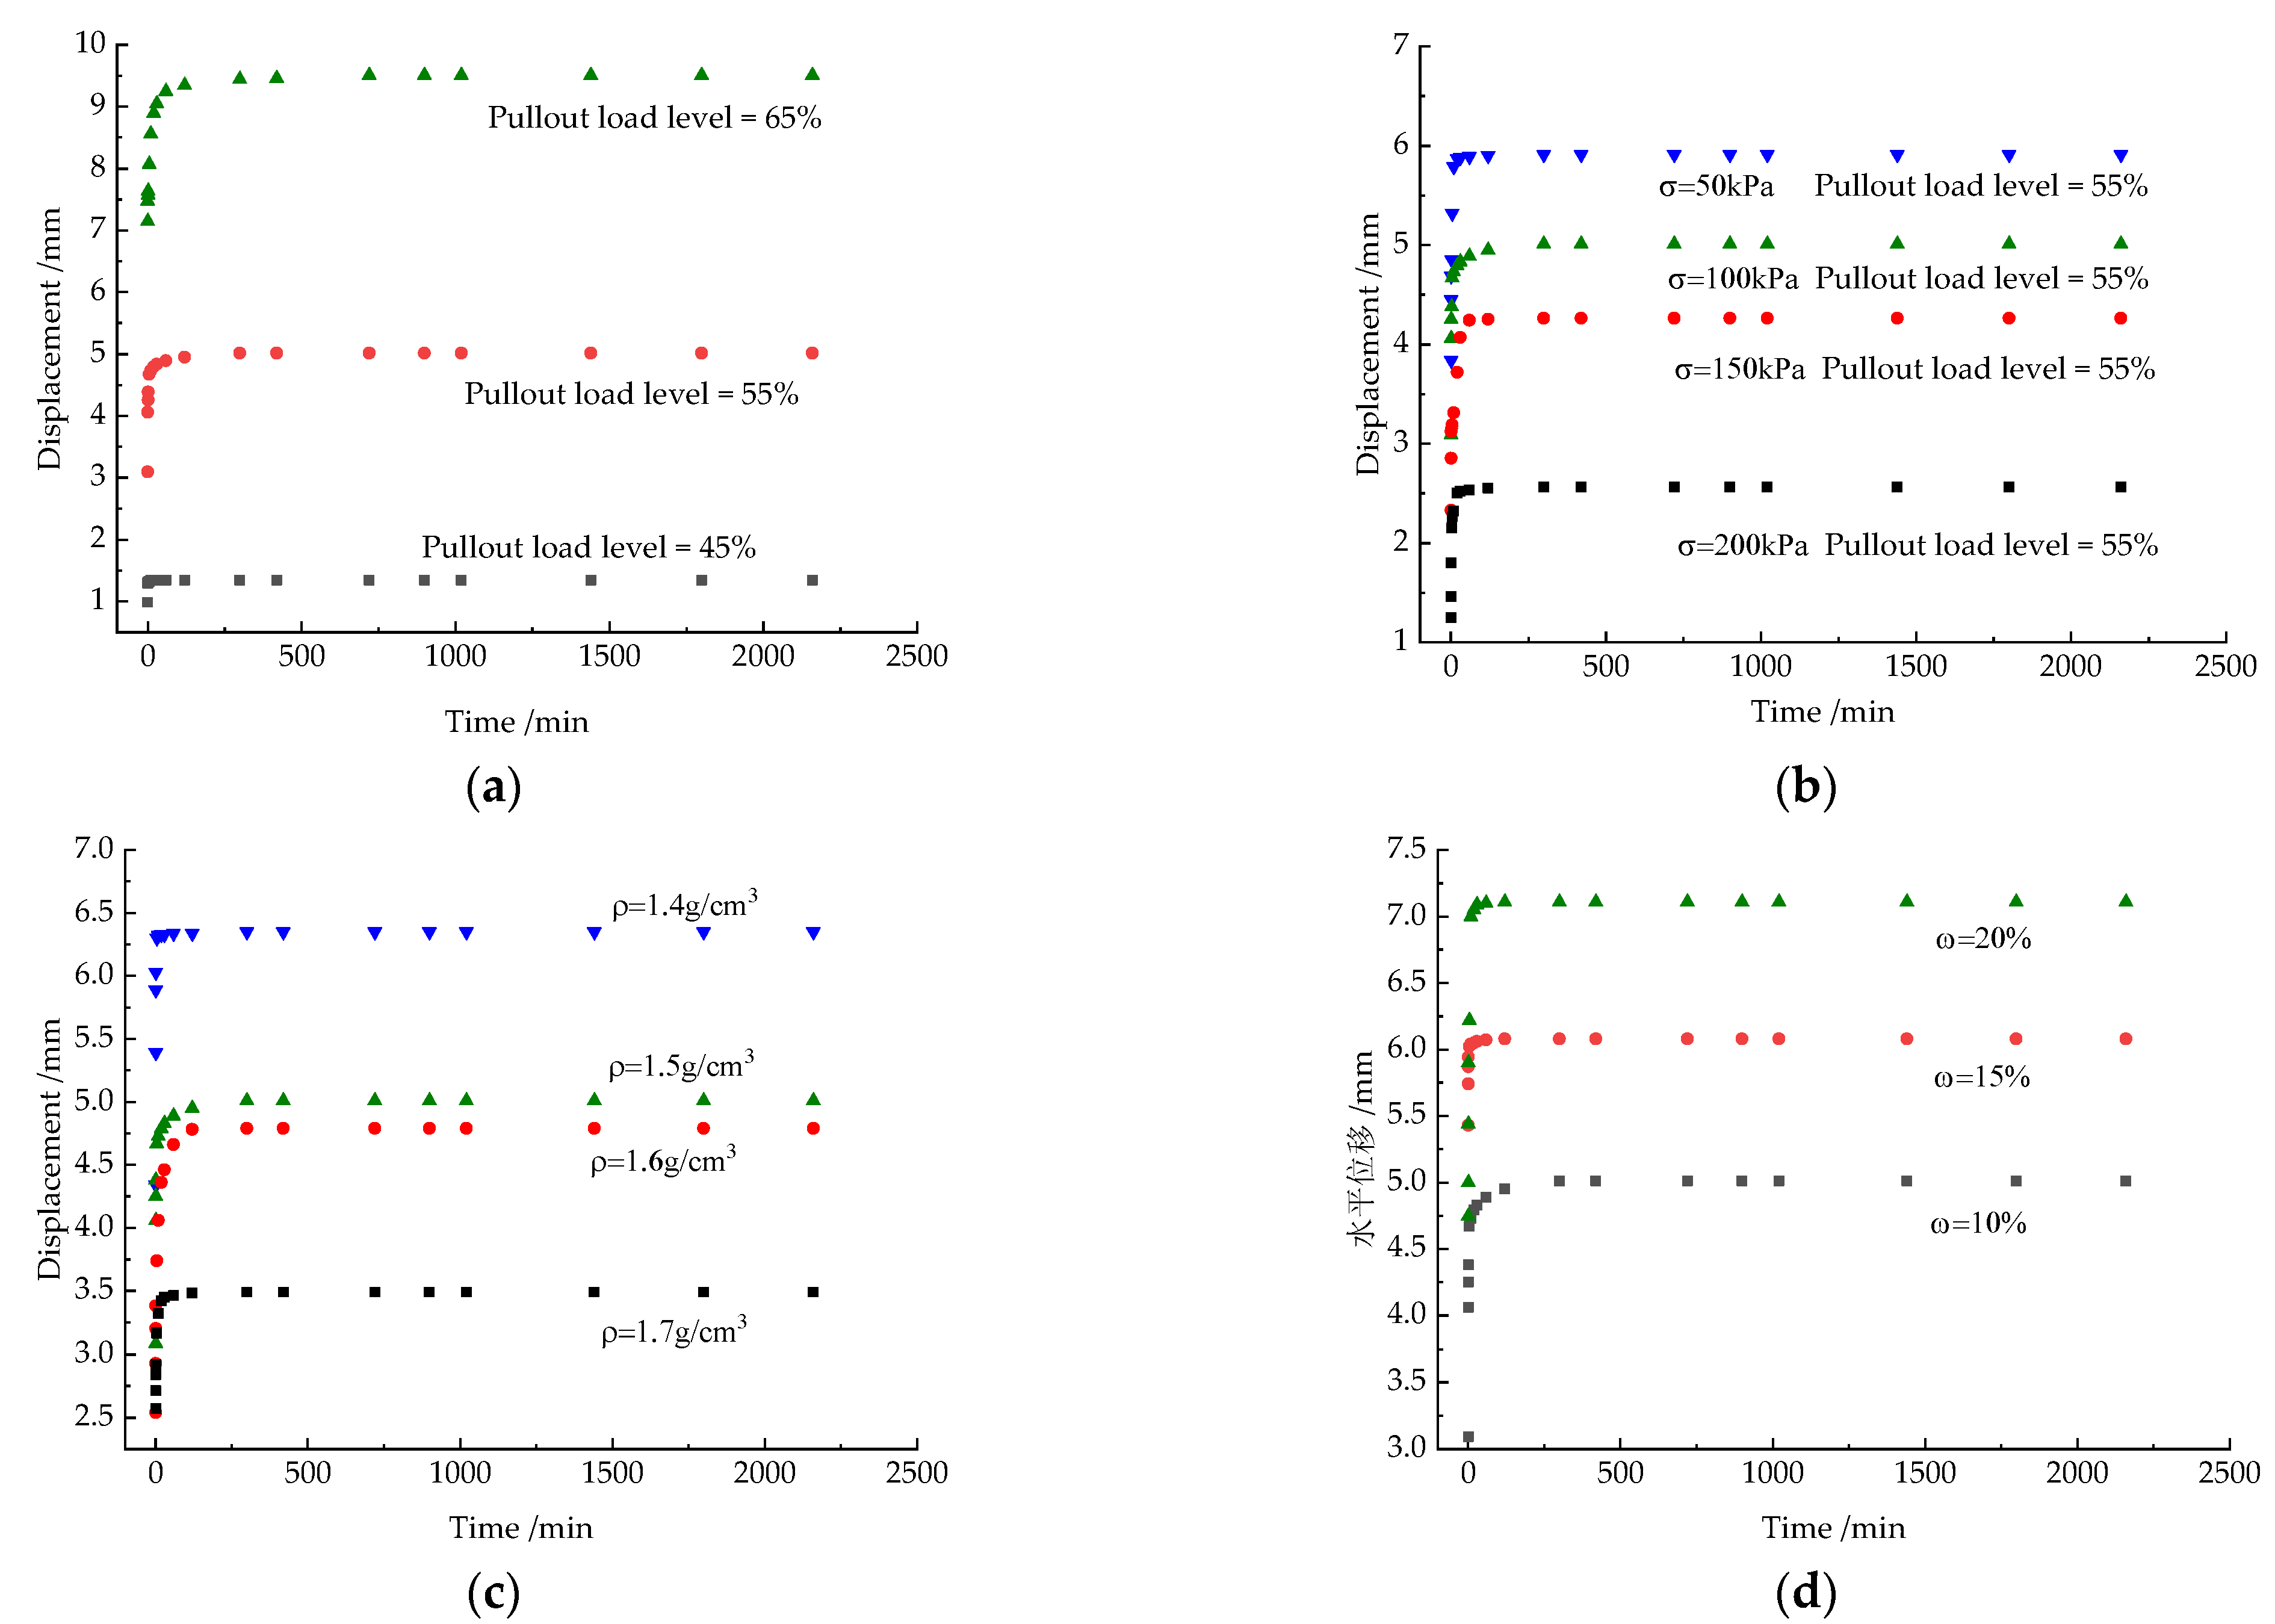
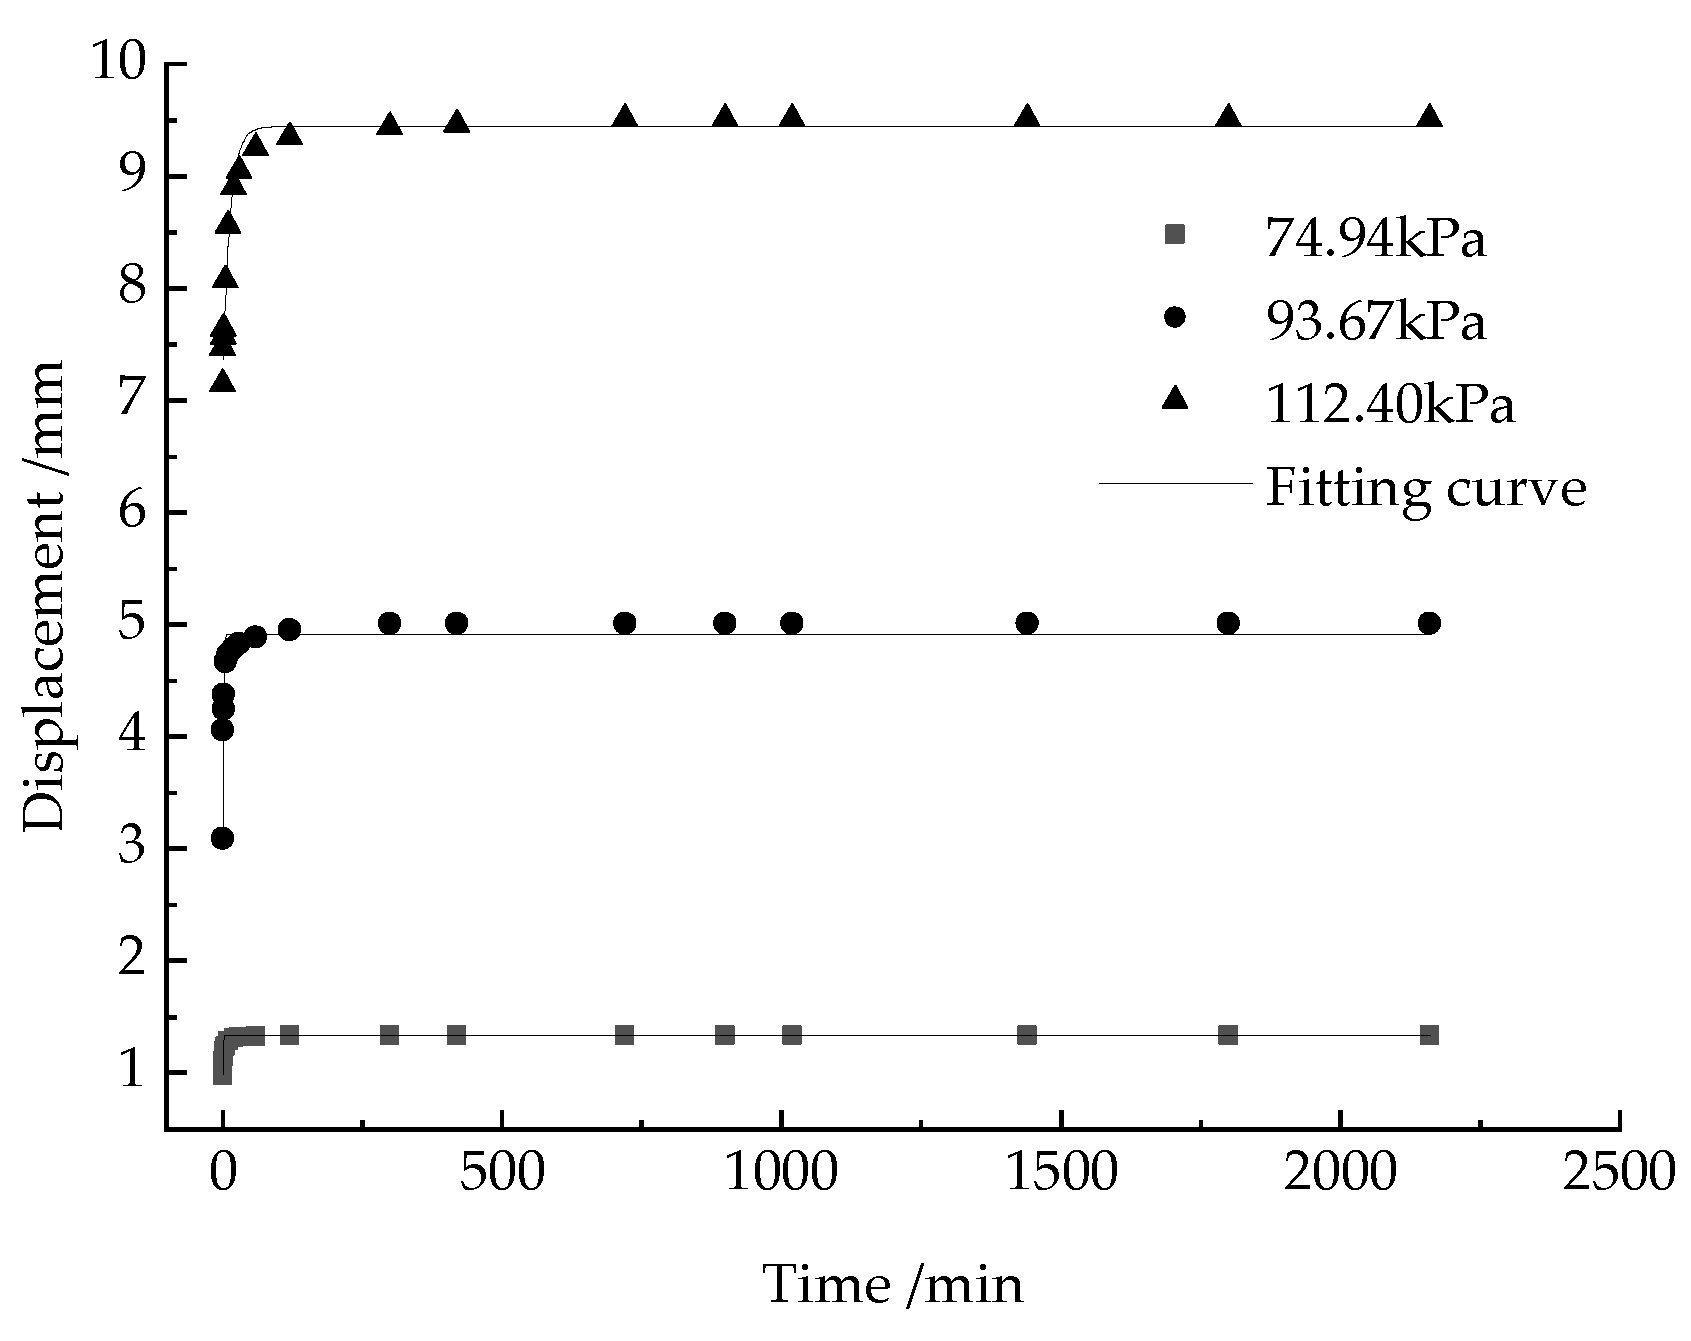
3.2. Creep Behavior of the Interface of Compacted Loess and Geogrid

In order to investigate the influence of normal pressure, dry density, and water content on the time-varying behavior of the interface of compacted loess and geogrid, pullout tests were conducted under four normal pressures, four dry densities, and three water content levels. Three tensile levels were considered in the tests, and the graded loading method was adopted. The Boltzmann superposition principle [41] was used to obtain the separated creep curve of the test results. Figure 7 shows the typical pullout creep displacement curves of the specimens under different conditions.
It can be seen from Figure 7 that during the early stage of the test, pullout displacement grew rapidly, slowed down over time, and became stable when a certain time was reached. This is very similar to the creep deformation behavior of compacted loess, which is not surprising since these two processes are both related to interfacial friction characteristics of compacted loess [30]. Compared to compacted loess, the creep behavior of the interface of soil and geogrid has fast convergence speed since its frictional property is more implicit. With the increase of loading level, the convergence time became longer.
According to the results shown in Figure 7b–d, normal pressure, dry density, and the water content of compacted loess have notable effects on the creep property of the interface of compacted loess and geogrid. When pullout load level and other conditions remain unchanged, the creep displacement of the soil–geogrid interface decreases with the increase of normal pressure, decreases with the increase of dry density, and increases with the increase of water content. These results indicate that in practical engineering, the potential of creep displacement of the soil–geogrid interface can be greatly reduced by increasing the degree of compaction of soil and improving drainage, so as to improve the stability and safety of the filling foundation and filling slope.

4. Discussion

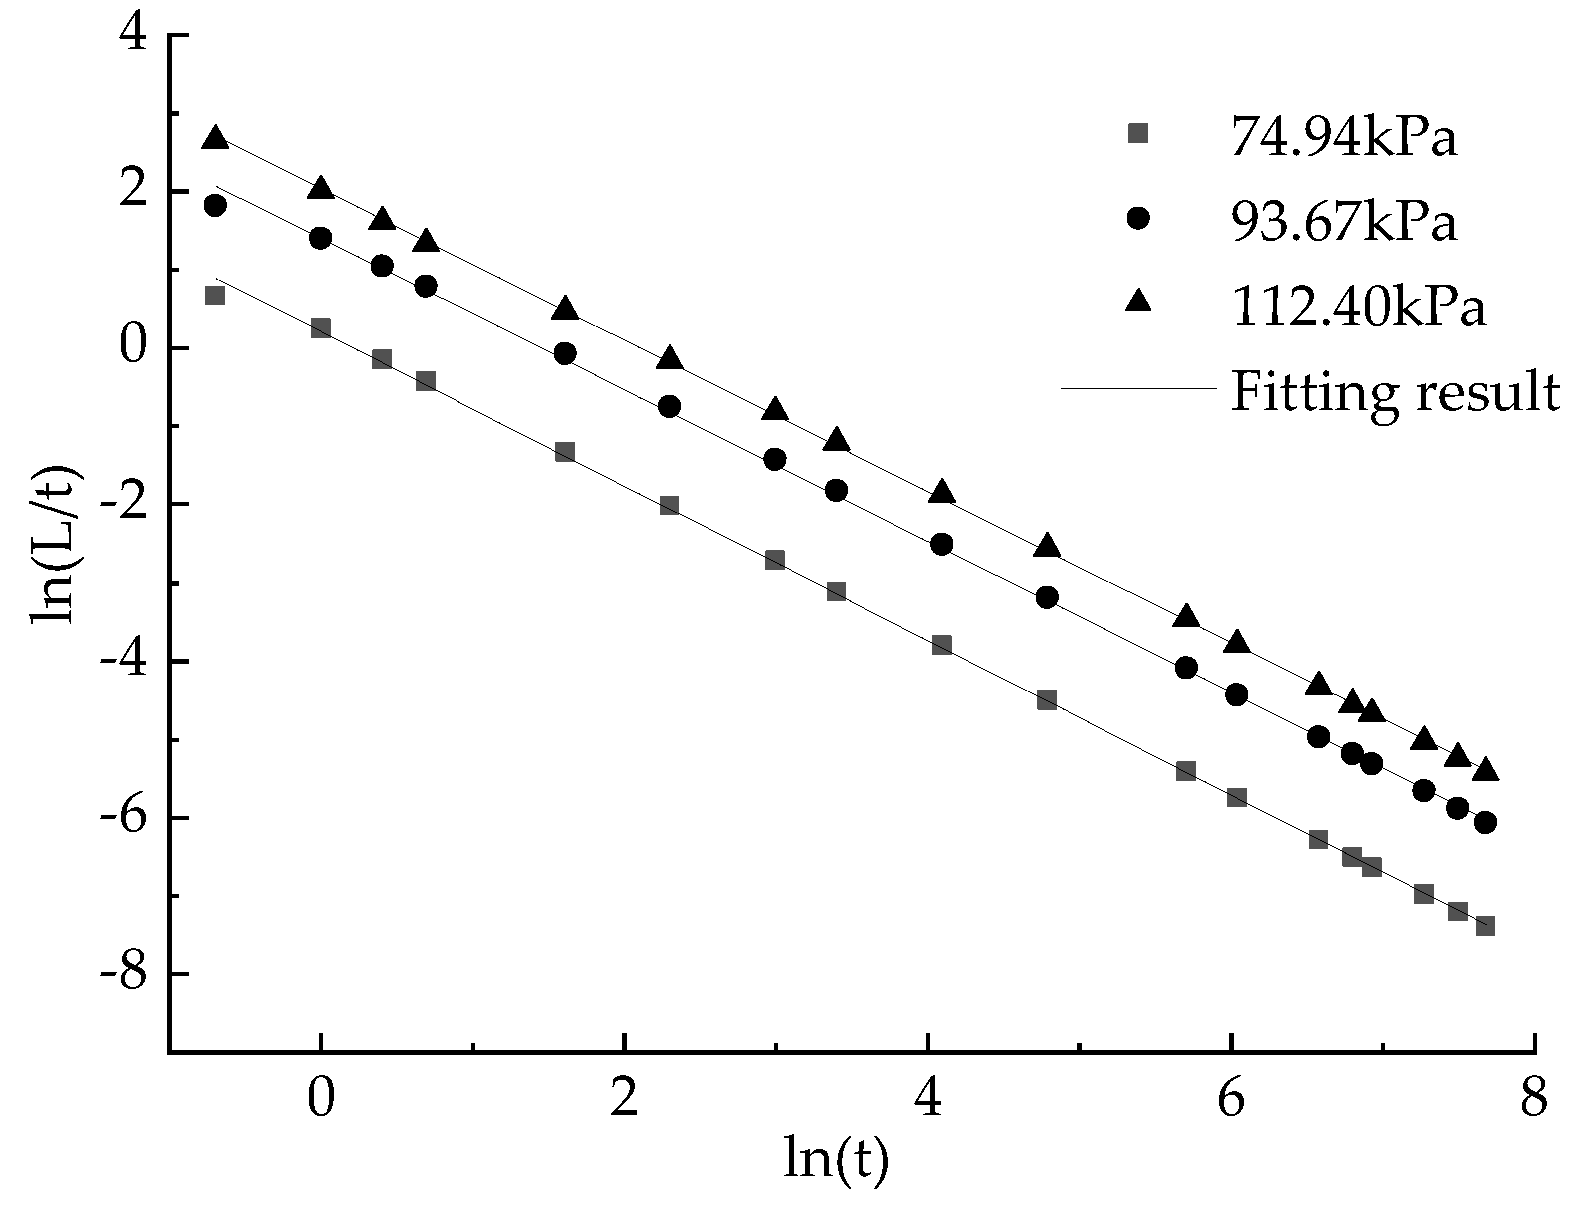
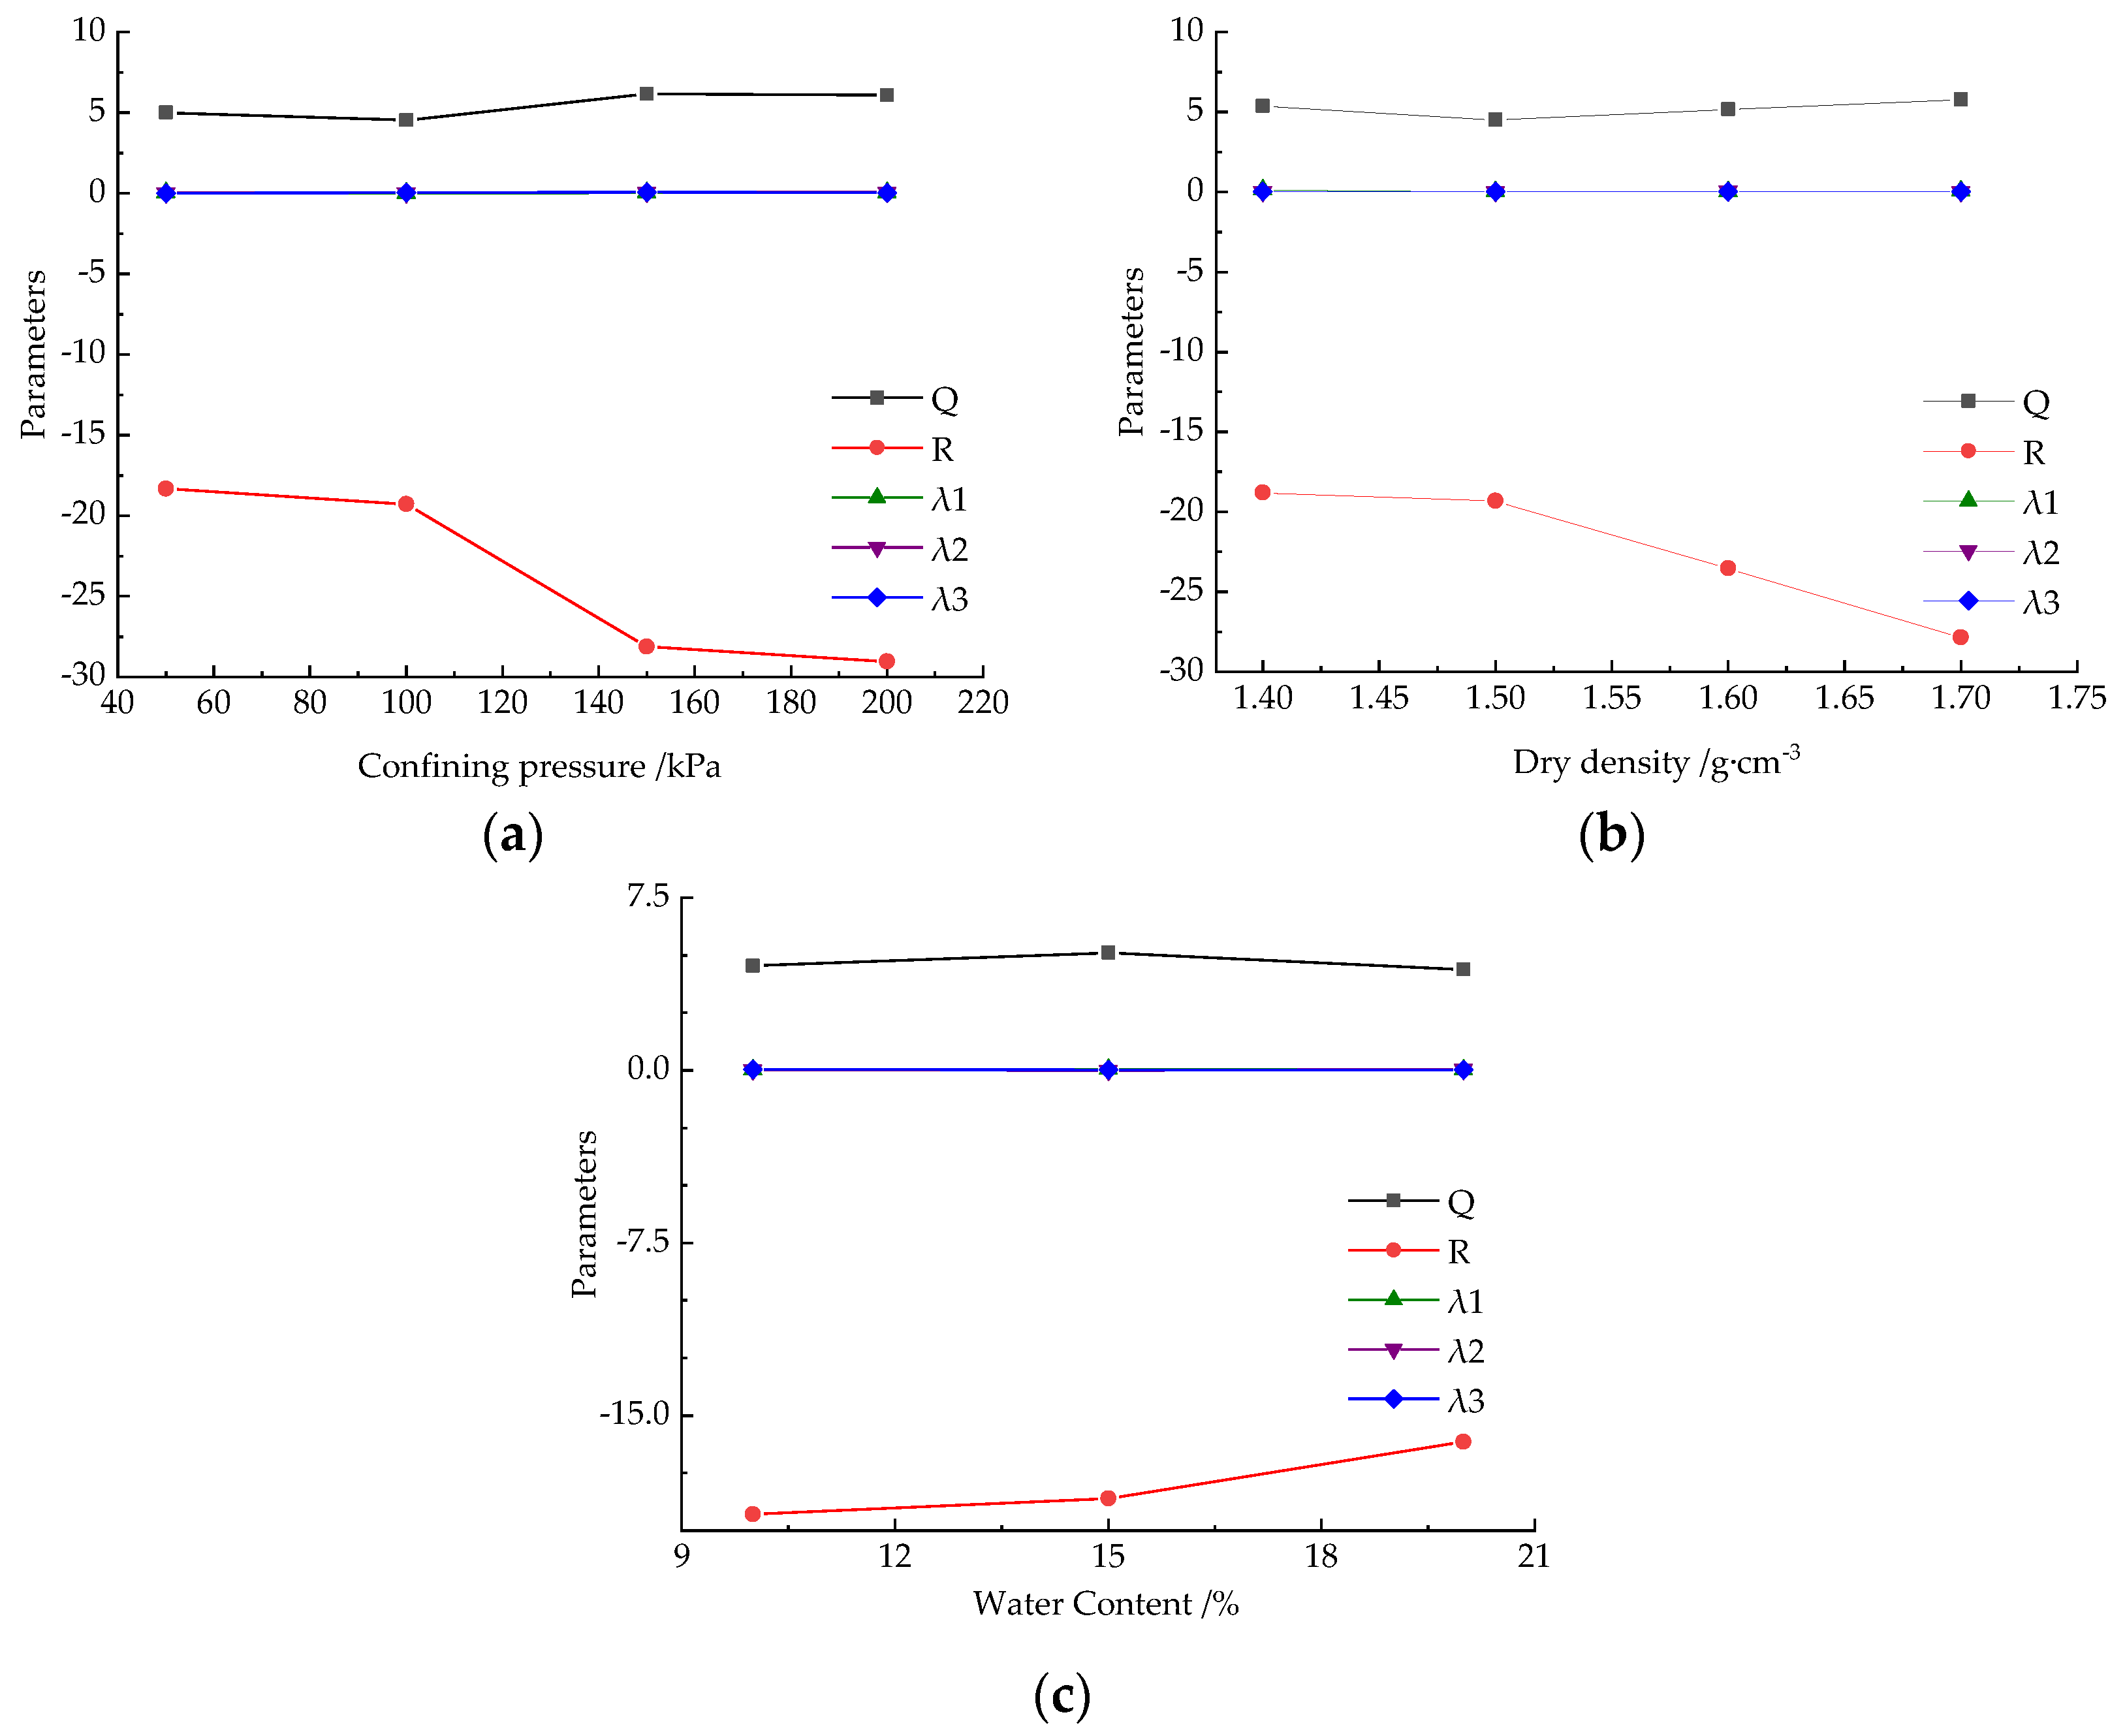
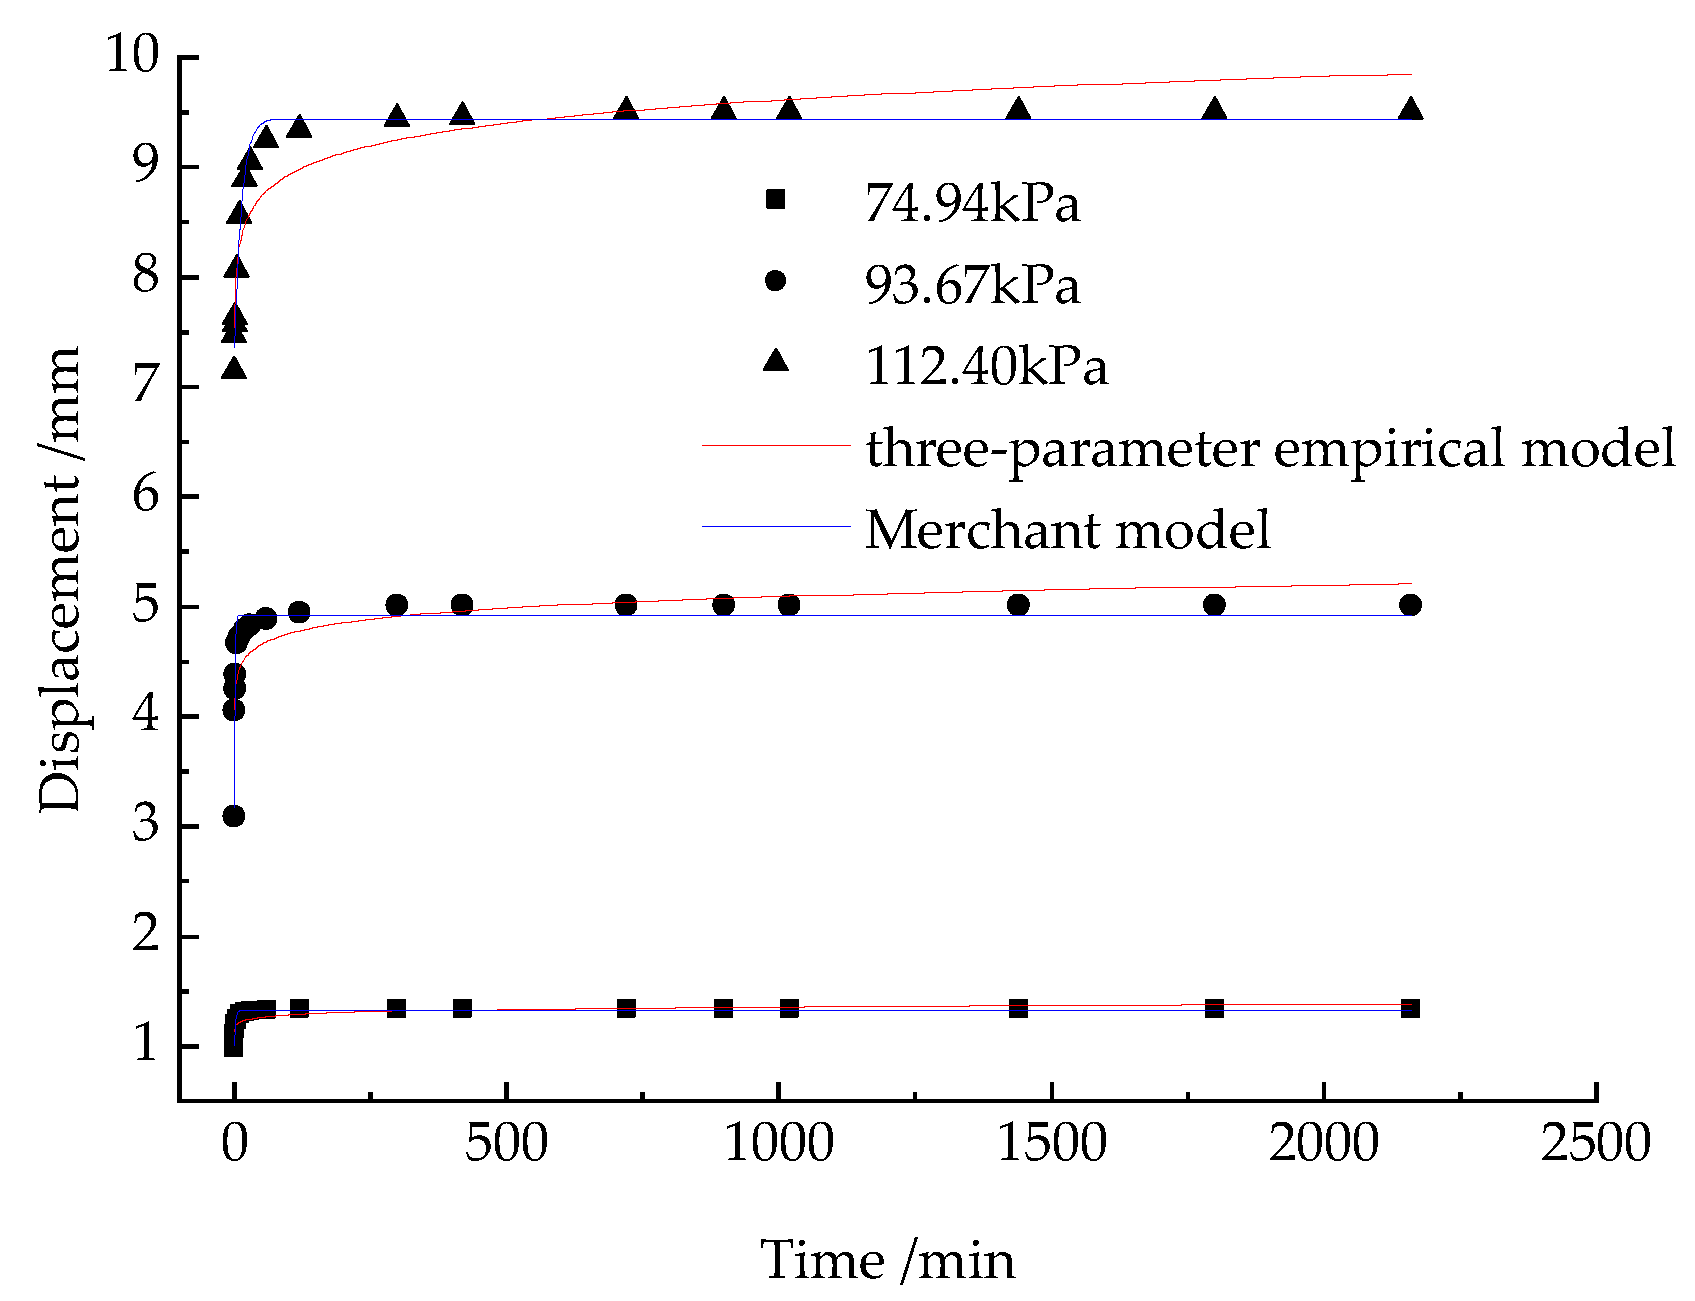
4.1. A Three-Parameter Empirical Model for the Interface Creep Behavior

To predict the creep behavior of the interface of compacted loess and geogrid based on acquired deformation data, a R-Q-λ three-parameter empirical model was introduced. A fitting analysis was conducted on the test results. Based on the creep test data with normal pressure, dry density, and water content at 100 kPa, 1.5 g/cm3, and 10%, respectively, the hyperbolic relationship of ln(L/t)−ln(t) was established. It can be seen from Figure 8 that at any tension level, ln(L/t)−ln(t) shows a good linear relationship, which can be expressed as follows:
ln ( L / t ) = G + ( λ 1 ) ln ( t )
where G is the intercept of ln(L/t)−ln (t) curve, λ − 1 is the absolute value of the curve slope, representing the attenuation rate of ln(L/t) with ln(t).
According to Figure 9, G increases with the increase of ln(τ), showing a good linear relationship, as shown in Equation (4):
G = Q ln ( τ ) + R
Expression of the R-Q-λ empirical model can be obtained by substituting Equation (4) into Equation (3) as:
L = e R τ Q t λ
where Q, R, and λ are all the fitting parameters. The results of the above test parameters are as follows: λ is in the range (0.0137, 0.0334), Q = 4.5312, R = −19.2911. Using this three-parameter model, the fitting parameters for the test results under different influencing factors are calculated through fitting analysis. Influence of the normal pressure, dry density, and water content on the model parameters are shown in Figure 10.
As shown in Figure 10, parameters Q and λ almost remain unchanged under different normal pressure, dry density, and water content. On the other hand, parameter R decreases with the increase of normal pressure and dry density and increases with the increase of water content. This shows that normal pressure, dry density, and water content have a small influence on parameters Q and λ, but parameter R is greatly influenced. Parameter Q reflects the change trend of relative slip displacement with pullout stress per unit time. The values of Q under different influencing factors are basically the same, indicating that the shape of the curve is similar. Parameter R is the logarithm of secant strain rate at unit time and unit shear stress. When the dry density of soil is small, the water content is large, or the applied normal pressure is small, the shear failure of the interface of compacted loess and geogrid is more likely to occur, the value of R is thus larger. Parameter λ reflects the hyperbolic relationship between the shear displacement rate and time. Parameter λ for the test results in this paper have small fluctuation which is ranged from 0 to 0.11.

4.2. Merchant Model for the Interface Creep Behavior

The above empirical model is capable of describing the creep characteristics of the interface of compacted loess and geogrid. However, the model is not universal. The physical meaning of the model parameters is not intuitive and is thus more suitable for application in specific engineering projects. On the other hand, the component model has a clear physical meaning and is thus more widely used in the modeling of creep behavior. In this paper, a Merchant component model, which is composed of Hooke component and Kelvin component in series, was selected to study the creep deformation property of the interface of compacted loess and geogrid. The model equation is:
L ( t ) = τ 0 E 0 + τ 0 E 1 [ 1 e ( E 1 η 1 t ) ]
where L(t) is the creep displacement value of the interface at arbitrary time. τ0 is the pullout load. E0 is the elastic coefficient of the Hooke model. E1 and η1 are the elastic coefficient and viscosity coefficient of the Kelvin model, respectively. Using data analysis software Origin, fitting analysis was carried out for all test data. Fitting results for the conditions of normal pressure at 100 kPa, dry density at 1.5 g/cm3, and water content at 10% is shown in Figure 11. The correlation coefficient of the model fitting is above 0.98, indicating that the element model can better describe the creep property of the interface of compacted loess and geogrid.
Here, the three-parameter empirical model and the merchant model were compared using the fitting results of the condition of P = 100 kPa, ρd = 1.5 g/cm3, and ω = 10%. The comparison results are shown in Figure 12 and Table 4 (the pullout load is kept at 45% of the ultimate strength). It can be seen from the comparison results that, in the early stage of creep deformation, the prediction curve calculated by the Merchant model is closer to the curve of the laboratory test value than that calculated by the three-parameter empirical model. In the late stage of creep, the calculated value of the Merchant model is basically unchanged indicating that the Merchant model has a strong convergence, while the calculated value of the three-parameter empirical model is closer to the actual test value. Its relative error is within 2%. This shows that the three-parameter empirical model can provide better reference for the study of long-term creep displacement of the interface of compacted loess and geogrid in practical engineering.
According to the comparison analysis, it can be concluded that both the three-parameter empirical model and the Merchant model are capable of reflecting the creep behavior of the interface of compacted loess and geogrid. The Merchant model is more accurate in the early stage of the creep deformation, while the three-parameter empirical model is more suitable for predicting the long-term creep deformation of the interface of compacted loess and geogrid.

5. Conclusions

In this study, to investigate the creep behavior of the interface of compacted loess and high-density polyethylene (HDPE) geogrid, a series of laboratory pullout creep tests were carried out. A new stress-controlled pullout testing device was invented by modifying the oedometer. The influence of the normal pressure, dry density, and water content on the creep behavior of the compacted loess–geogrid interface was studied. An empirical creep model and a component creep model were applied to the test results and comparatively studied. According to test results, normal pressure, dry density, and water content affects the creep behavior of the interface of compacted loess and geogrid significantly. Under the same pullout level, creep displacement of the interface increases with the increase of water content and decreases with the increase of dry density and normal pressure. The established three-parameter empirical model and Merchant model can both describe the creep behavior of the interface of compacted loess and geogrid well. The Merchant model is more accurate in the early stage, while the three-parameter empirical model is more suitable for predicting the long-term creep deformation of the interface of compacted loess and geogrid. In practical engineering, the potential of creep deformation of soil–geogrid can be greatly reduced by increasing the degree of compaction of soil and improving drainage, and the stability and safety of filling foundation or filling slope can be improved.

Author Contributions

Y.-L.Y.: Conceptualization, Writing—original draft. C.-M.H.: Methodology, Supervision. J.X.: Data curation, Formal analysis. Y.M.: Funding acquisition, Investigation. F.-F.W.: Data curation; G.W.: Visualization. All authors have read and agreed to the published version of the manuscript.

Funding

This research was financially supported by the National Natural Science Foundation of China (Grant No. 52178302), the Key R & D Projects in Shaanxi Province (No. 2020SF-373), and the Natural Science Basic Research Program of Shaanxi [grant number 2022JQ-375].

Data Availability Statement

The data presented in this study are available on request from the corresponding authors.

Acknowledgments

We are grateful for the generous support provided by National Natural Science Foundation of China, the Key R & D Projects in Shaanxi Province, and the Natural Science Basic Research Program of Shaanxi. We thank the reviewers for their valuable feedback.

Conflicts of Interest

The authors declare no conflict of interest.

References

  1. Koo, H.; Kim, Y. Lifetime Prediction of Geogrids for Reinforcement of Embankments and Slopes. Polym. Test. 2005, 24, 181–188. [Google Scholar] [CrossRef]
  2. Pan, G.; Liu, X.; Yuan, S.; Wang, Y.; Sun, D.; Feng, Y.; Jiang, G. A Field Study on the Arching Behavior of a Geogrid-Reinforced Floating Pile-Supported Embankment. Transp. Geotech. 2022, 37, 100795. [Google Scholar] [CrossRef]
  3. Jyothi, B.D.; Krishna, V.R. Optimal Arrangement of Geogrids in Road Embankment Using Different Fill Materials. Mater. Today Proc. 2021, 46, 8507–8512. [Google Scholar] [CrossRef]
  4. Kim, U.J.; Kim, D.S. Load Sharing Characteristics of Rigid Facing Walls with Geogrid Reinforced Railway Subgrade During and After Construction. Geotext. Geomembr. 2020, 48, 940–949. [Google Scholar] [CrossRef]
  5. Esmaeili, M.; Zakeri, J.A.; Babaei, M. Laboratory and Field Investigation of the Effect of Geogrid-Reinforced Ballast on Railway Track Lateral Resistance. Geotext. Geomembr. 2017, 45, 23–33. [Google Scholar] [CrossRef]
  6. Uchimura, T.; Tateyama, M.; Tanaka, I.; Tatsuoka, F. Performance of a Preloaded-Prestressed Geogrid-Reinforced Soil Pier for a Railway Bridge. Soils Found. 2003, 43, 155–171. [Google Scholar] [CrossRef]
  7. Ke, H.; Ma, P.; Lan, J.; Chen, Y.; He, H. Field Behaviors of a Geogrid Reinforced Msw Slope in a High-Food-Waste-Content Msw Landfill: A Case Study. Geotext. Geomembr. 2021, 49, 430–441. [Google Scholar] [CrossRef]
  8. Alamshahi, S.; Hataf, N. Bearing Capacity of Strip Footings on Sand Slopes Reinforced with Geogrid and Grid-Anchor. Geotext. Geomembr. 2009, 27, 217–226. [Google Scholar] [CrossRef]
  9. Batali, L.; Klompmaker, J.; Tronac, B. Geosynthetic Reinforced Soil Structure—Problems Faced and Lessons Learned. Case Studies from Romania. In Proceedings of the EuroGeo 6, 6th European Geosynthetics Congress, Ljubljana, Slovenia, 25–28 September 2016. [Google Scholar]
  10. Mirmoradi, S.H.; Ehrlich, M. Experimental Evaluation of the Effects of Surcharge Width and Location on Geosynthetic-Reinforced Soil Walls. Int. J. Phys. Model. Geotech. 2019, 19, 27–36. [Google Scholar] [CrossRef]
  11. Liu, Y.; Zhao, Y.; Zhang, D.; Liu, Z. The Long-Term Mechanical Performance of Geogrid-Reinforced Soil Retaining Walls Under Cyclic Footing Loading. Case Stud. Constr. Mater. 2022, 17, e1642. [Google Scholar] [CrossRef]
  12. Wang, H.; Yang, G.; Wang, Z.; Liu, W. Static Structural Behavior of Geogrid Reinforced Soil Retaining Walls with a Deformation Buffer Zone. Geotext. Geomembr. 2020, 48, 374–379. [Google Scholar] [CrossRef]
  13. Useche-Infante, D.; Martinez, G.A.; Arrúa, P.; Eberhardt, M. Experimental Study of Behaviour of Circular Footing on Geogrid-Reinforced Sand. Geomech. Geoengin. Int. J. 2022, 17, 45–63. [Google Scholar] [CrossRef]
  14. Suksiripattanapong, C.; Horpibulsuk, S.; Udomchai, A.; Arulrajah, A.; Tangsutthinon, T. Pullout Resistance Mechanism of Bearing Reinforcement Embedded in Coarse-Grained Soils: Laboratory and Field Investigations. Transp. Geotech. 2020, 22, 100297. [Google Scholar] [CrossRef]
  15. Ferreira, F.B.; Vieira, C.S.; Lopes, M.D.L. Pullout Behavior of Different Geosynthetics—Influence of Soil Density and Moisture Content. Front. Built Environ. 2020, 6, 12. [Google Scholar] [CrossRef]
  16. Brown, S.F.; Kwan, J.; Thom, N.H. Identifying the Key Parameters that Influence Geogrid Reinforcement of Railway Ballast. Geotext. Geomembr. 2007, 25, 326–335. [Google Scholar] [CrossRef]
  17. Moraci, N.; Recalcati, P. Factors Affecting the Pullout Behaviour of Extruded Geogrids Embedded in a Compacted Granular Soil. Geotext. Geomembr. 2006, 24, 220–242. [Google Scholar] [CrossRef]
  18. Baadiga, R.; Saride, S.; Balunaini, U.; Madhira, M.R. Influence of Tensile Strength of Geogrid and Subgrade Modulus on Layer Coefficients of Granular Bases. Transp. Geotech. 2021, 29, 100557. [Google Scholar] [CrossRef]
  19. Yuan, Y.L.; Hu, C.M.; Mei, Y.; Wang, X.Y.; Wang, J. Slope Reliability Analysis Based on Curvilinear Local Averaging of a 2-D Random Field. Comput. Geotech. 2021, 137, 104247. [Google Scholar] [CrossRef]
  20. Mei, Y.; Zhang, X.; Nong, X.; Fu, L. Experimental Study of the Comprehensive Technology of Grouting and Suspension Under an Operating Railway in the Cobble Stratum. Transp. Geotech. 2021, 30, 100612. [Google Scholar] [CrossRef]
  21. Hatami, K.; Mahmood, T.; Ghabchi, R.; Zaman, M. Influence of in-Isolation Properties of Geogrids On their Pullout Performance in a Dense Graded Aggregate. Indian Geotech. J. 2013, 43, 303–320. [Google Scholar] [CrossRef]
  22. Esmaeili, M.; Pourrashnoo, A. Experimental Investigation of Shear Strength Parameters of Ballast Encased with Geogrid. Constr. Build. Mater. 2022, 335, 127491. [Google Scholar] [CrossRef]
  23. Mirzaeifar, H.; Hatami, K.; Abdi, M.R. Pullout Testing and Particle Image Velocimetry (Piv) Analysis of Geogrid Reinforcement Embedded in Granular Drainage Layers. Geotext. Geomembr. 2022, 50, 1083–1109. [Google Scholar] [CrossRef]
  24. Moraci, N.; Cardile, G.; Gioffrè, D.; Mandaglio, M.C.; Calvarano, L.S.; Carbone, L. Soil Geosynthetic Interaction: Design Parameters from Experimental and Theoretical Analysis. Transp. Infrastruct. Geotechnol. 2014, 1, 165–227. [Google Scholar] [CrossRef]
  25. Pant, A.; Ramana, G.V. Prediction of Pullout Interaction Coefficient of Geogrids by Extreme Gradient Boosting Model. Geotext. Geomembr. 2022, 50, 1188–1198. [Google Scholar] [CrossRef]
  26. He, Z.; Mo, H.; Siga, A.; Zou, J. Research on the Parameters of Nonlinear Hyperbolic Model for Clay-Geogrid Interfaces Based On Large Scale Direct Shear Tests. Transp. Geotech. 2019, 18, 39–45. [Google Scholar] [CrossRef]
  27. Sven, S.; Ulrich, T.; Danny, O.; Andrey, P.; Daniil, T. Comparison of Pullout Test Results Carried Out on Steel Grid and Geosynthetic Materials. In Proceedings of the 11th International Conference on Geosynthetics 2018, ICG 2018, Seoul, Republic of Korea, 16–21 September 2018. [Google Scholar]
  28. Baoqin, L.; Xingang, W.; Zhan, H.; Jiading, W.; Jianbing, P.; Tianfeng, G.; Rongsen, Z. Creep Mechanical and Microstructural Insights Into the Failure Mechanism of Loess Landslides Induced by Dry-Wet Cycles in the Heifangtai Platform, China. Eng. Geol. 2022, 300, 106589. [Google Scholar]
  29. Zhu, C.; Zhou, X.; Wang, S.; Sara, A.; Amoroso, S. Foundation Treatment Assessment and Postconstruction Settlement Prediction of a Loess High Fill Embankment: A Case Study. Shock Vib. 2020, 2020, 8864690. [Google Scholar] [CrossRef]
  30. Zhu, C.; Li, N. Ranking of Influence Factors and Control Technologies for the Post-Construction Settlement of Loess High-Filling Embankments. Comput. Geotech. 2020, 118, 103320. [Google Scholar] [CrossRef]
  31. Cong, S.; Nie, Z.; Li, X.; Tang, L.; Ling, X.; Hu, Q.; Li, G. Prediction of Compressive Creep Behaviors of Expansive Soil Exposed to Freeze-Thaw Cycle Using a Disturbed State Concept-Based Model. Cold Reg. Sci. Technol. 2022, 204, 103664. [Google Scholar] [CrossRef]
  32. Wang, Z.; Jacobs, F.; Ziegler, M. Experimental and Dem Investigation of Geogrid–Soil Interaction Under Pullout Loads. Geotext. Geomembr. 2016, 44, 230–246. [Google Scholar] [CrossRef]
  33. Yeo, S.S.; Hsuan, Y.G. Evaluation of Creep Behavior of High Density Polyethylene and Polyethylene-Terephthalate Geogrids. Geotext. Geomembr. 2010, 28, 409–421. [Google Scholar] [CrossRef]
  34. Zou, C.; Wang, Y.; Lin, J.; Chen, Y. Creep Behaviors and Constitutive Model for High Density Polyethylene Geogrid and Its Application to Reinforced Soil Retaining Wall On Soft Soil Foundation. Constr. Build. Mater. 2016, 114, 763–771. [Google Scholar] [CrossRef]
  35. Yanchou, L.; Mortlock, A.J.; Price, D.M.; Readhead, M.L. Thermoluminescence Dating of Coarse-Grain Quartz From the Malan Loess at Zhaitang Section, China. Quat. Res. 1987, 28, 356–363. [Google Scholar] [CrossRef]
  36. GB/T 50123-2019; Ministry of Water Resources of the People’s Republic of China, Standard for Soil Test Methods. Ministry of Water Resources of the People’s Republic of China: Beijing, China, 24 May 2019.
  37. Xu, J.; Zhou, L.; Li, Y.; Ding, J.; Wang, S.; Cheng, W.C. Experimental Study on Uniaxial Compression Behavior of Fissured Loess before and after Vibration. Int. J. Geomech. 2022, 22, 04021277. [Google Scholar] [CrossRef]
  38. Xu, J.; Zhou, L.; Hu, K.; Li, Y.; Zhou, X.; Wang, S. Influence of Wet-Dry Cycles on Uniaxial Compression Behavior of Fissured Loess Disturbed by Vibratory Loads. Ksce J. Civ. Eng. 2022, 26, 2139–2152. [Google Scholar] [CrossRef]
  39. Li, M.; Zhang, C.; Fang, H.; Du, M.; Su, Z.; Wang, F. Effects of Water Content on Shear Properties of Bentonite–Polymer Composite Structure. Eng. Geol. 2021, 287, 106098. [Google Scholar] [CrossRef]
  40. Abdi, M.R.; Mirzaeifar, H. Experimental and Piv Evaluation of Grain Size and Distribution on Soil–Geogrid Interactions in Pullout Test. Soils Found. 2017, 57, 1045–1058. [Google Scholar] [CrossRef]
  41. Yang, Z.; Zhu, H.; Zhang, B.; Dong, Z.; Wu, P. Short-Term Creep Behaviors of Seawater Sea-Sand Coral Aggregate Concrete: An Experimental Study with Rheological Model and Neural Network. Constr. Build. Mater. 2023, 363, 129786. [Google Scholar] [CrossRef]
Figure 1. Modified pullout test device. (a) Overall, (b) Detailed design.
Buildings 13 01353 g001
Figure 2. Grain gradation curve.
Buildings 13 01353 g002
Figure 3. HDPE one-way geogrid.
Buildings 13 01353 g003
Figure 4. Ultimate pullout stress. (a) Dry density, (b) water content, (c) normal pressure.
Buildings 13 01353 g004
Figure 5. L-τ curve of pullout tests and direct shear tests. (a) Pullout test results, (b) direct shear test results.
Buildings 13 01353 g005
Figure 6. P-τ curve.
Buildings 13 01353 g006
Figure 7. Shear displacement and time creep curve of reinforced soil interface. (a) Influence of pullout loading levels, (b) influence of normal pressure, (c) influence of dry density, (d) influence of water content.
Buildings 13 01353 g007
Figure 8. ln(L/t)−ln(t) Curve.
Buildings 13 01353 g008
Figure 9. G-ln(τ) curve.
Buildings 13 01353 g009
Figure 10. Fitting results. (a) Normal pressure (b) dry density, (c) water content.
Buildings 13 01353 g010
Figure 11. Merchant model fitting curve.
Buildings 13 01353 g011
Figure 12. Comparison between model calculation value and test value.
Buildings 13 01353 g012
Table 1. Physical and mechanical properties of soil samples.
Specific GravityLiquid Limit/%Plastic Limit/%Plasticity Index/%Cohesion c/kPaInternal Friction Angle φ/(°)Particle Composition/%
>0.075 mm0.075–0.005 mm<0.005 mm
2.7029.718.411.338.2027.141.0578.4320.52
Table 2. Basic mechanical properties of geogrid.
GeogridUltimate Tensile Strength/(kN/m)Percentage Elongation/%Tensile Strength at 2% Strain/(kN/m)Tensile Strength at 5% Strain/(kN/m)
HDPE9098.3811.533.2560.54
Table 3. Test setup.
GroupSample NoNormal Pressure/kPaDry Density/(g/cm3)Water Content/%Ultimate Pullout Stress/kPa
1S1501.51093.71
S2100173.33
S3150212.28
S4200234.25
2G11001.410138.63
G21.5173.33
G31.6219.65
G41.7267.71
3H11001.510173.33
H215143.45
H320109.92
Table 4. Error analysis of calculated values of two creep models.
Horizontal Tension/kPaTime/minTest Value/mmEmpirical Model Value/mmRelative Error/%Merchant Model Value/mmRelative Error/%
93.6754.674.35586.7284.90144.955
604.894.77432.3664.92180.650
1204.954.78743.2854.92290.547
3005.014.91571.8824.92391.719
9605.015.08931.5834.92411.715
Disclaimer/Publisher’s Note: The statements, opinions and data contained in all publications are solely those of the individual author(s) and contributor(s) and not of MDPI and/or the editor(s). MDPI and/or the editor(s) disclaim responsibility for any injury to people or property resulting from any ideas, methods, instructions or products referred to in the content.

