Article

Construction Safety Risks of Metro Tunnels Constructed by the Mining Method in Wuhan City, China: A Structural Equation Model-Fuzzy Cognitive Map Hybrid Method

1
Sanya Science and Education Innovation Park, Wuhan University of Technology, Sanya 572000, China
2
School of Civil Engineering and Architecture, Wuhan University of Technology, Wuhan 430070, China
*
Authors to whom correspondence should be addressed.
Buildings 2023, 13(5), 1335; https://doi.org/10.3390/buildings13051335
Submission received: 7 April 2023 / Revised: 15 May 2023 / Accepted: 18 May 2023 / Published: 20 May 2023

Abstract

:
A hybrid method based on the structural equation model (SEM) and a fuzzy cognitive map (FCM) was developed to study the influences of the construction safety risks (CSR) of metro tunnels constructed by the mining method on the project risk (PR). An SEM was used to identify and verify the correlations between the CSR and PR. An FCM was developed adopting the verified standardized causality and path coefficient in the SEM. On this basis, predictive reasoning and diagnostic reasoning were performed in the framework of an FCM to simulate the CSR and PR. The feasibility of the developed method was validated based on the construction project of a metro tunnel in Wuhan City, China. The results show that (1) the cause concept node C2 (tunnel excavation) shows the strongest positive correlation with the target concept node CT (PR). According to their risks, the construction stages are ranked in descending order as C2 (tunnel excavation), C1 (advanced support), C6 (auxiliary measures), C4 (structure waterproofing), C3 (primary support), and C5 (secondary lining). (2) The target concept node CT is most sensitive to changes in the cause concept nodes C2 and C1. (3) Close attention should be paid to key risks, such as X9 (over-excavation and under-excavation) and X8 (unreasonable determination of excavation footage and sequence) in stage C2. Originality and significance: (1) A hybrid method that can simulate the dynamic interaction between the CSR and PR is proposed. (2) A new perspective for the dynamic evaluation of a PR is provided. (3) The method can be used as a decision-making tool for controlling the PR.

1. Introduction

At present, the demand for convenient traffic patterns in urban areas continues to grow. The development plan of the modern integrated transportation system in the “Fourteenth Five Year Plan” of China, Central People’s Government of PRC (2021) [1] points out that the operating mileage of urban rail traffic will increase by one thousand kilometers per annum and is expected to reach ten thousand kilometers by 2025. The construction of urban rail traffic in China is developing to form deeper, denser, and larger underground spaces [2]. However, urban rail traffic is characterized by a long construction period, a large investment, complex construction techniques, and many unforeseeable risk factors [3]. In addition, necessary demonstration and a dynamic analysis have not been performed for the potential risk factors [4]. As a result, major accidents occur frequently during construction.Tunnels constructed by the mining method are widely used in urban metro systems, with loose soil utilized in place of surrounding rocks [5]. Compared with the shield method [6], construction of metro tunnels by the mining method involves complex procedures and significant overlapping construction trades. Moreover, the overlapping and dynamic coupling of multiple risks cause frequent major accidents [7]. Therefore, a modelling analysis and dynamic simulation were performed for the construction safety risk (CSR) of metro tunnels constructed by the mining method [8]. This is of importance for the scientific management of risks throughout the construction process.
In recent years, numerous researchers have studied the field of metro tunnels constructed by the mining method [9]. To ensure the environmental safety of constructing metro tunnels by the mining method, Fang et al. (2010) [10] proposed a risk management system aiming to control surface subsidence and protect existing structures. Gui et al. (2020) [11] adopted the limit equilibrium theory to build a mechanical model for rock surrounding the sidewalls, and assessed the safety of the primary support during the construction of metro tunnels by the mining method. Wu et al. (2021) [12] built a multi-scale risk assessment model based on the principal component analysis and grey correlation-TOPSIS method, which was adopted to evaluate the CSR of metro stations. In the meantime, the structural equation model (SEM), an important tool for testing causality and statistical analysis, has found wide application in practical risk management [13]. To explore the risks of undertaking international construction projects, Liu et al. (2016) [14] used an SEM to build 20 network paths for important risks. To assess the safety of a given construction site, Gunduz et al. (2018) [15] proposed an index evaluation tool of safety performance based on an SEM. To study the influencing factors for dangerous behavior among construction workers, Zhang et al. (2020) [16] developed an analytical model based on an SEM. These studies have laid the foundation for the scientific management of CSR of metro tunnels constructed by the mining method. However, most studies are only static in their evaluation and lack a dynamic analysis that conforms to the construction process.
The fuzzy cognitive map (FCM) combines fuzzy logic and the elements of neural networks [17]. It can realize modelling and dynamic analysis of a complex system by virtue of the reasoning mechanism of causality [18]. The FCM has been widely used in practical risk management. Soner et al. (2015) [19] proposed a modelling method of hybrid FCM in a bid to explore the fundamental cause of shipboard fires. To identify the causal structural relation of the project change risk, Khanzadi et al. (2018) [20] developed a reasoning rule model for project change based on a FCM. Wang et al. (2019) [21] combined fuzzy logic and evidence reasoning and introduced an FCM to assess the effectiveness of safety precautions for ship navigation. However, the traditional FCM faces difficulties in acquiring expert knowledge and effectively determining weights of concept nodes [22]. Construction of metro tunnels by the mining method is characterized by high complexity and the concealed nature of underground environments [23]. In addition, accidents may be broad in their scope; hence, those factors influencing the CSR of metro tunnels show a variety of characteristics, including intrinsic correlation and dynamic evolution [24]. Therefore, an FCM was developed based on the advantages of the SEM in hierarchical causality and objective characterization of subjective data [25], thus analyzing the dynamic evolution of CSR of metro tunnels constructed by the mining method. On this basis, the mechanism of the interaction between the CSR and the project risk (PR) was investigated, allowing for improvement of the dynamic interpretability of the evaluation model.
In summary, most existing studies of CSR for metro tunnels constructed by the mining method are based on static analysis, while the use of dynamic risk evaluation matched with construction progress is particularly scarce. It remains necessary to improve the timeliness of risk evaluation when constructing metro tunnels by the mining method, and to reduce difficulties in identifying, predicting, and resolving the risk factors [26]. For this purpose, an SEM–FCM risk evaluation method for the entire construction process of metro tunnels by the mining method was proposed. The research enshrines the following novel aspects: (1) The method leverages the advantages of the SEM in establishing the hierarchical causality and objective characterization of subjective data. Additionally, it combines the characteristics of an FCM in dynamic prediction and reasoning diagnosis. (2) The research integrates the identification of risk factors with a dynamic prediction and reasoning diagnosis in order to better match the risk evaluation results with engineering practices. This improves the risk management efficiency when constructing tunnels by the mining method.
The remainder of the research is organized as follows: Section 2 describes the research variables; Section 3 introduces the SEM, FCM, and model integration characteristics (the SEM–FCM hybrid model is also outlined); Section 4 presents the empirical analysis; Section 5 provides a comparative analysis with the SEM–AHP model and discussion thereof; and Section 6 summarizes the conclusions, innovations, and limitations of the research.

2. Research Variables

The research variables were investigated by means of interviews, policy summaries, and a literature review. Additionally, the research variables for the CSR of metro tunnels constructed by the mining method were extracted (Table 1).
Phase 1: Dividing main construction stages. Based on the work breakdown structure, a whole project was decomposed into unit projects, then divisional projects, then procedures. In this way, the whole construction process of metro tunnels by the mining method was divided into self-contained fine components from top to bottom [27].
Phase 2: Constructing the initial research variables. Documents including Production Safety Law of the People’s Republic of China, Safety Management Specification for Divisional Work & Subdivisional Work with Higher Risk, and The Administrative Regulations on the Work Safety of Construction Projects were reviewed. The risk breakdown structure [28] was applied to construct the initial risk variables of the CSR. As many latent research variables as possible were determined by consulting experts [29].
Phase 3: Extracting connotations of the research variables. Keywords such as “metro tunnels constructed by the mining method*” and “construction safety risk*” were input in the Web of Science (WOS) core collection database and searched in the advanced search mode (* represents a fuzzy search). In this way, the literature on the theme of CSR of metro tunnels constructed by the mining method was summarized. Based on the literature review, the research variables and index connotations were extracted. A total of 26 research variables ( X 1 X 26 ) for risks covering the six stages ( C 1 C 6 ) in the whole construction process by the mining method were extracted.
Table 1. Safety risk evaluation index system of metro tunnels constructed by the mining method.
StagesAbbreviationIndexReferences
Advancing support
C 1
X 1 The design of the advanced support construction operation scheme is unreasonable.Yue et al. (2016) [30], Leung et al. (2017) [31], Song et al. (2021) [32]
X 2 Material selection is not up to standard.Wang et al. (2021) [33]
X 3 The quality of the advanced support is inferior.Zhang et al. (2018) [34], Xu et al. (2017) [35]
X 4 The grouting construction effect is poor.Bai (2020) [36], Liu et al. (2021) [37]
Tunnel excavation
C 2
X 5 Unreasonable selection of excavation methods.Yue et al. (2016) [30], Zhang et al. (2018) [34], Liu et al. (2021) [37]
X 6 The size of the excavation section does not meet the design requirements.Rahimi et al. (2021) [38], Meye et al. (2020) [39], He et al. (2022) [40]
X 7 Improper control of the excavation profile.Rahimi et al. (2021) [38], He et al. (2022) [40]
X 8 Unreasonable determination of the excavation footage and sequence.Zhang et al. (2018) [34], Bai (2020) [36], Zheng et al. (2022) [41]
X 9 Over-excavation and under-excavation.Rahimi et al. (2021) [38], He et al. (2022) [40], Qiu et al. (2020) [42]
Primary support
C 3
X 10 The installation and construction of steel mesh do not meet the specification requirements.Xu et al. (2017) [35], Huang et al. (2021) [43]
X 11 The installation and construction of the steel frame do not meet the specification requirements.Xu et al. (2017) [35], Huang et al. (2021) [43], Huang et al. (2022) [44]
X 12 The construction quality of the mortar bolt is inferior.Yue et al. (2016) [30], Xu et al. (2017) [35], Huang et al. (2022) [44]
X 13 The shotcrete is not up to standard.Xu et al. (2017) [35], Bai (2020) [36], Huang et al. (2022) [44], Gong et al. (2023) [45]
X 14 The backfill grouting behind the initial support is not in place.Wang et al. (2021) [33], Xu et al. (2017) [35], Huang et al. (2022) [44]
Structure waterproof
C 4
X 15 The waterproof concrete construction quality is inferior.Wang et al. (2019) [46], Pelz et al. (2022) [47], Ai et al. (2022) [48]
X 16 The waterproof plate and waterproof coil are not applicable.Wang et al. (2019) [46], Pelz et al. (2022) [47], Ai et al. (2022) [48]
X 17 The deviation of the deformation joint is too large.Meye et al. (2020) [39], Luciani et al. (2019) [49]
X 18 Seal failure of construction joint and wall pipe.Luciani et al. (2019) [49], Fan et al. (2021) [50]
Secondary lining
C 5
X 19 The quality of lining construction is not up to standard.Tian (2015) [51]
X 20 The quality of rebar processing is poor.Wang et al. (2021) [33], Tian (2015) [51], Wang et al. (2022) [52]
X 21 The safety factor of the lining die frame and trolley is not up to standard.Qiu et al. (2020) [42], Tian (2015) [51]
X 22 Inadequate concrete placement and curing conditions.Qiu et al. (2020) [42], Tian (2015) [51], Wang et al. (2022) [52]
Auxiliary measures
C 6
X 23 The water table is not properly controlled.Liu et al. (2021) [37], Wang et al. (2019) [53]
X 24 The organization and management of on-site transportation are not coordinated.Leung et al. (2017) [31], Qiu et al. (2020) [42], Kang et al. (2017) [54]
X 25 The monitoring and measurement scheme is not complete.Bai (2020) [36], Liu et al. (2021) [37], Ghorbani et al. (2012) [55]
X 26 Insufficient construction ventilation.Jalali et al. (2011) [56], Nie et al. (2022) [57]

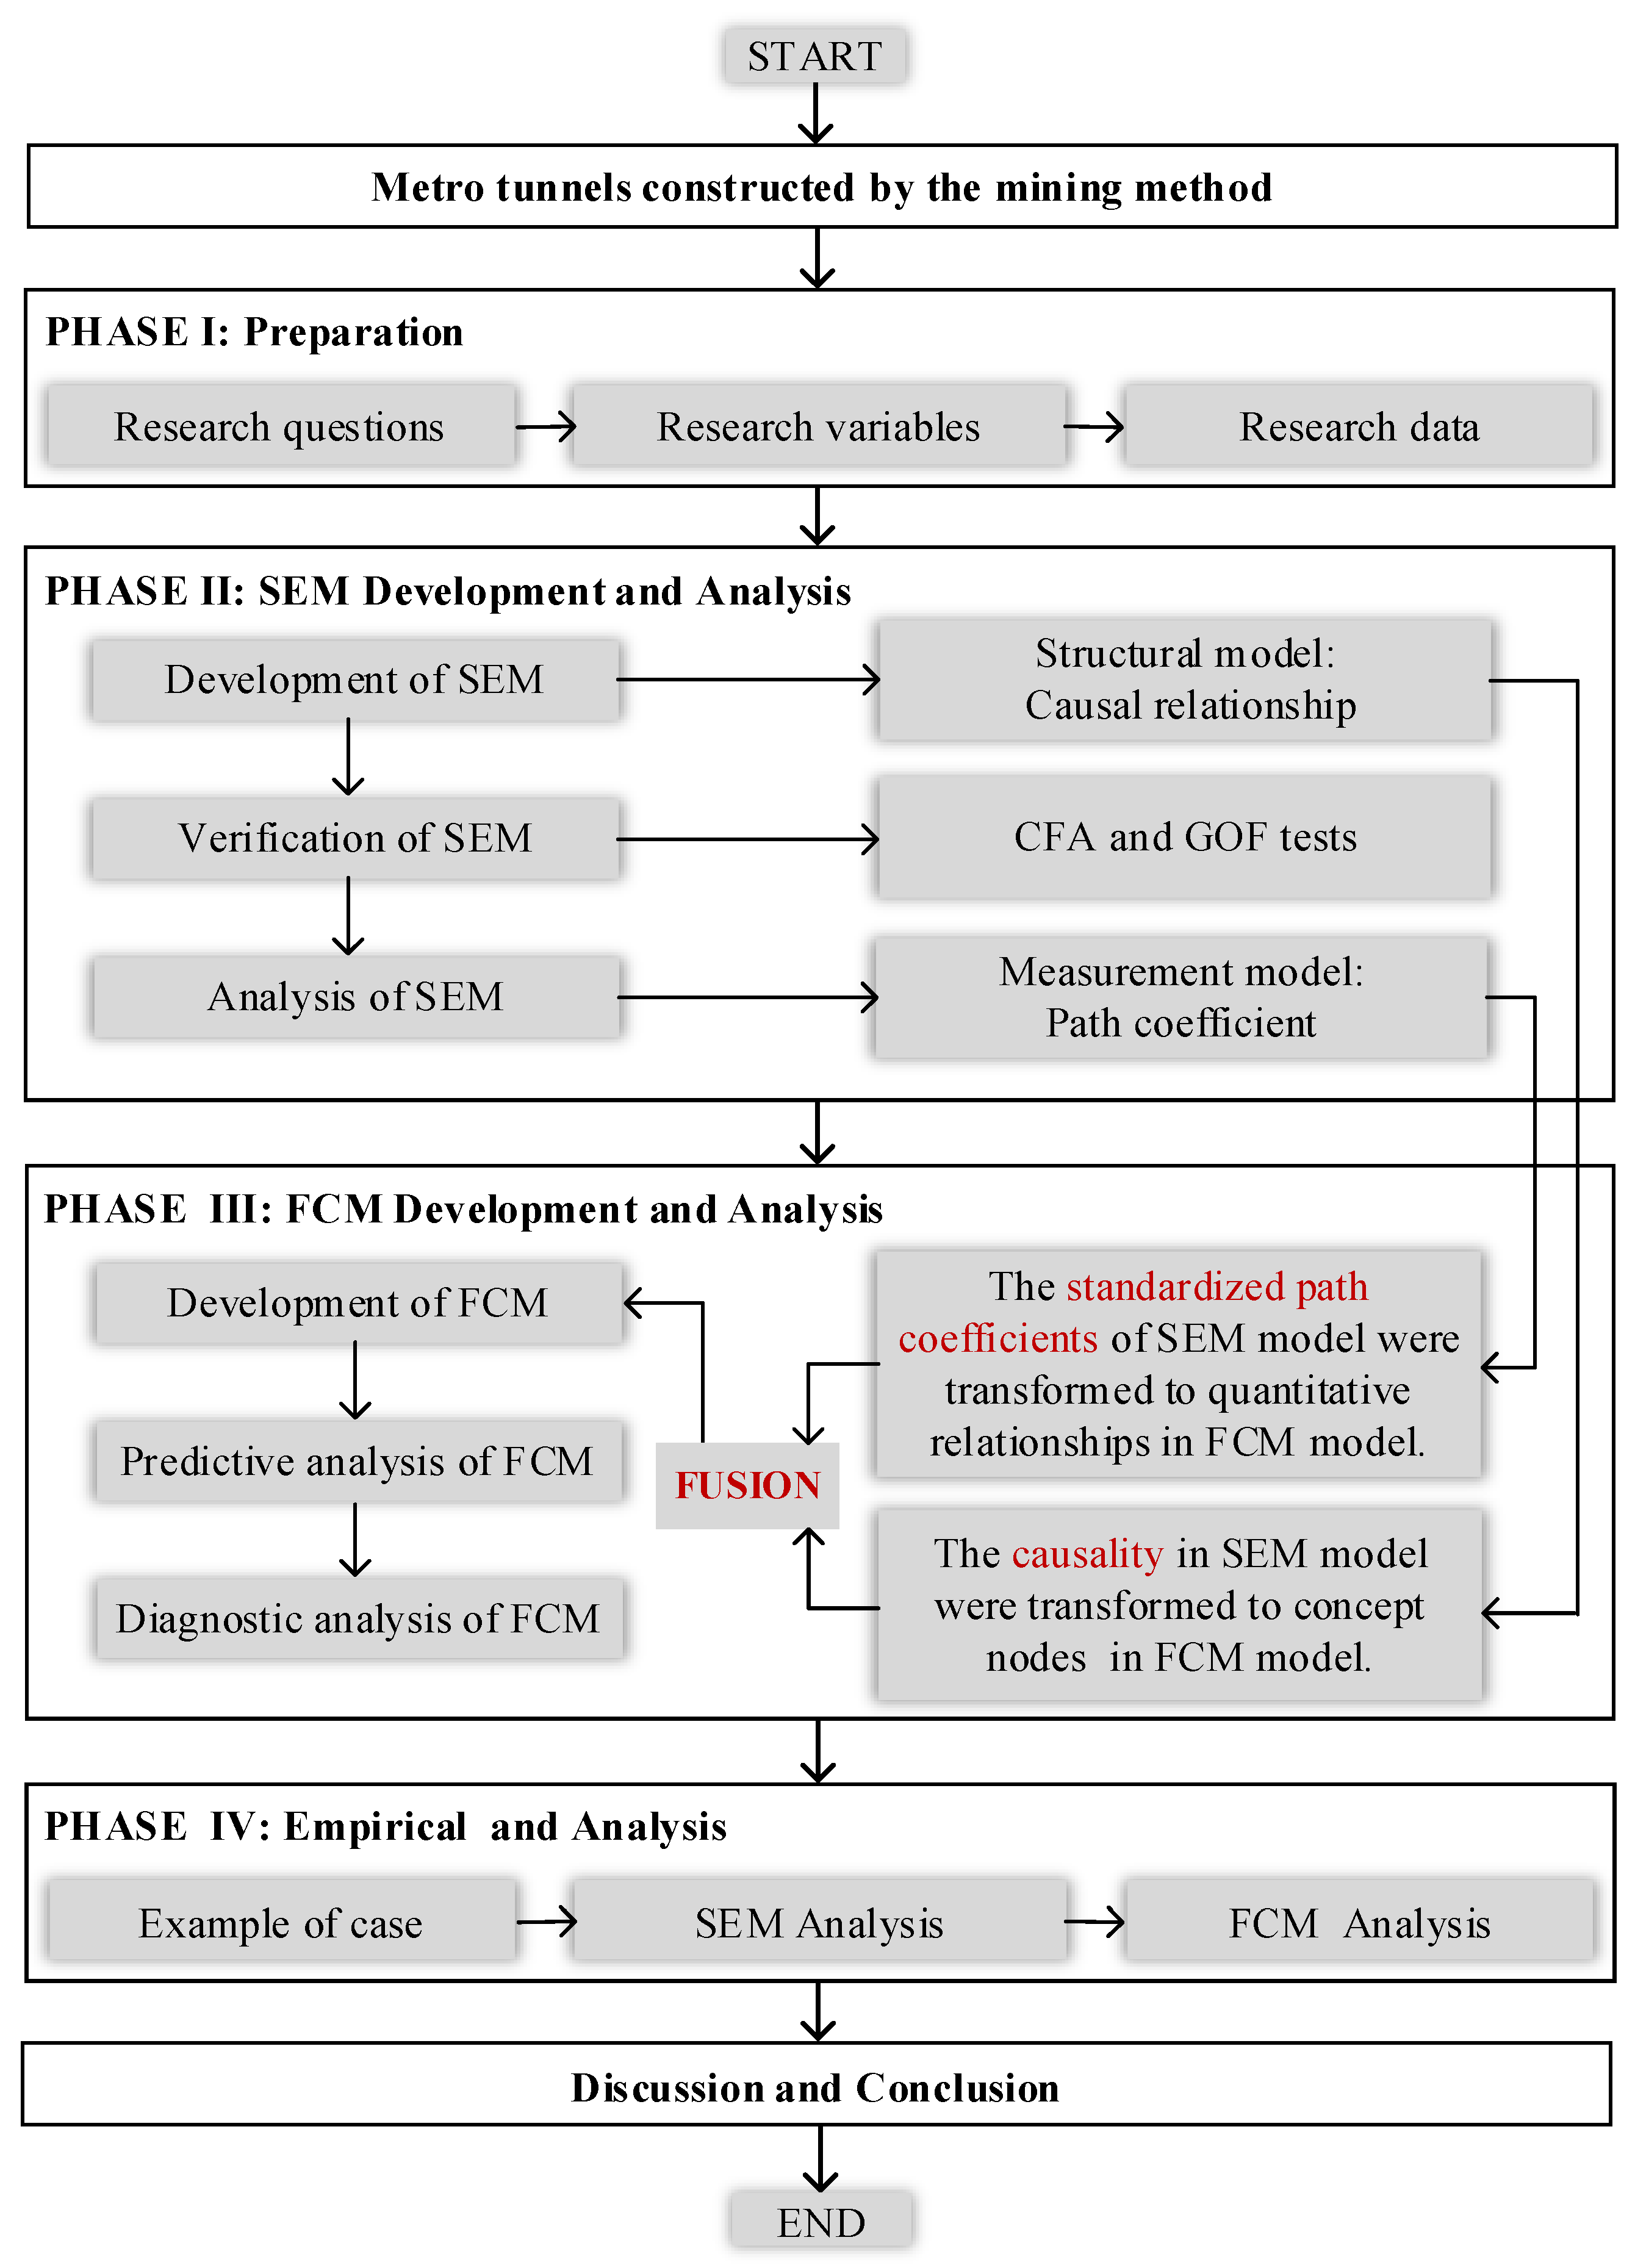
3. Model Development

The SEM can resolve the interaction between the risk factors. It also provides a verified causality and its path coefficient [58]. However, the SEM fails to realize the dynamic analysis of the CSR and PR. An FCM can simulate the evolution trends of CSR and PR through dynamic prediction and diagnostic reasoning, while it is difficult and time-consuming to obtain accurate quantitative relationships between concept nodes. To solve such problems, a hybrid method combining an SEM and an FCM was proposed in this study. An SEM was used to analyze the interaction between the CSR and PR. The verified causality and its path coefficient were obtained and then introduced in the FCM to serve as the quantitative relationships between concept nodes. The dynamic evolutionary relationship between the CSR and PR was then explored.
The steps for using the SEM–FCM hybrid method to evaluate the CSR of metro tunnels constructed by the mining method are shown in Figure 1. The method mainly included model development and model analysis. In the model development stage, an SEM was adopted to develop the measurement model, which was used to quantify the causality and standardized path coefficient between the CSR and PR. In the model analysis stage, an FCM was developed to simulate the dynamic evolutionary relationship between the CSR and PR.

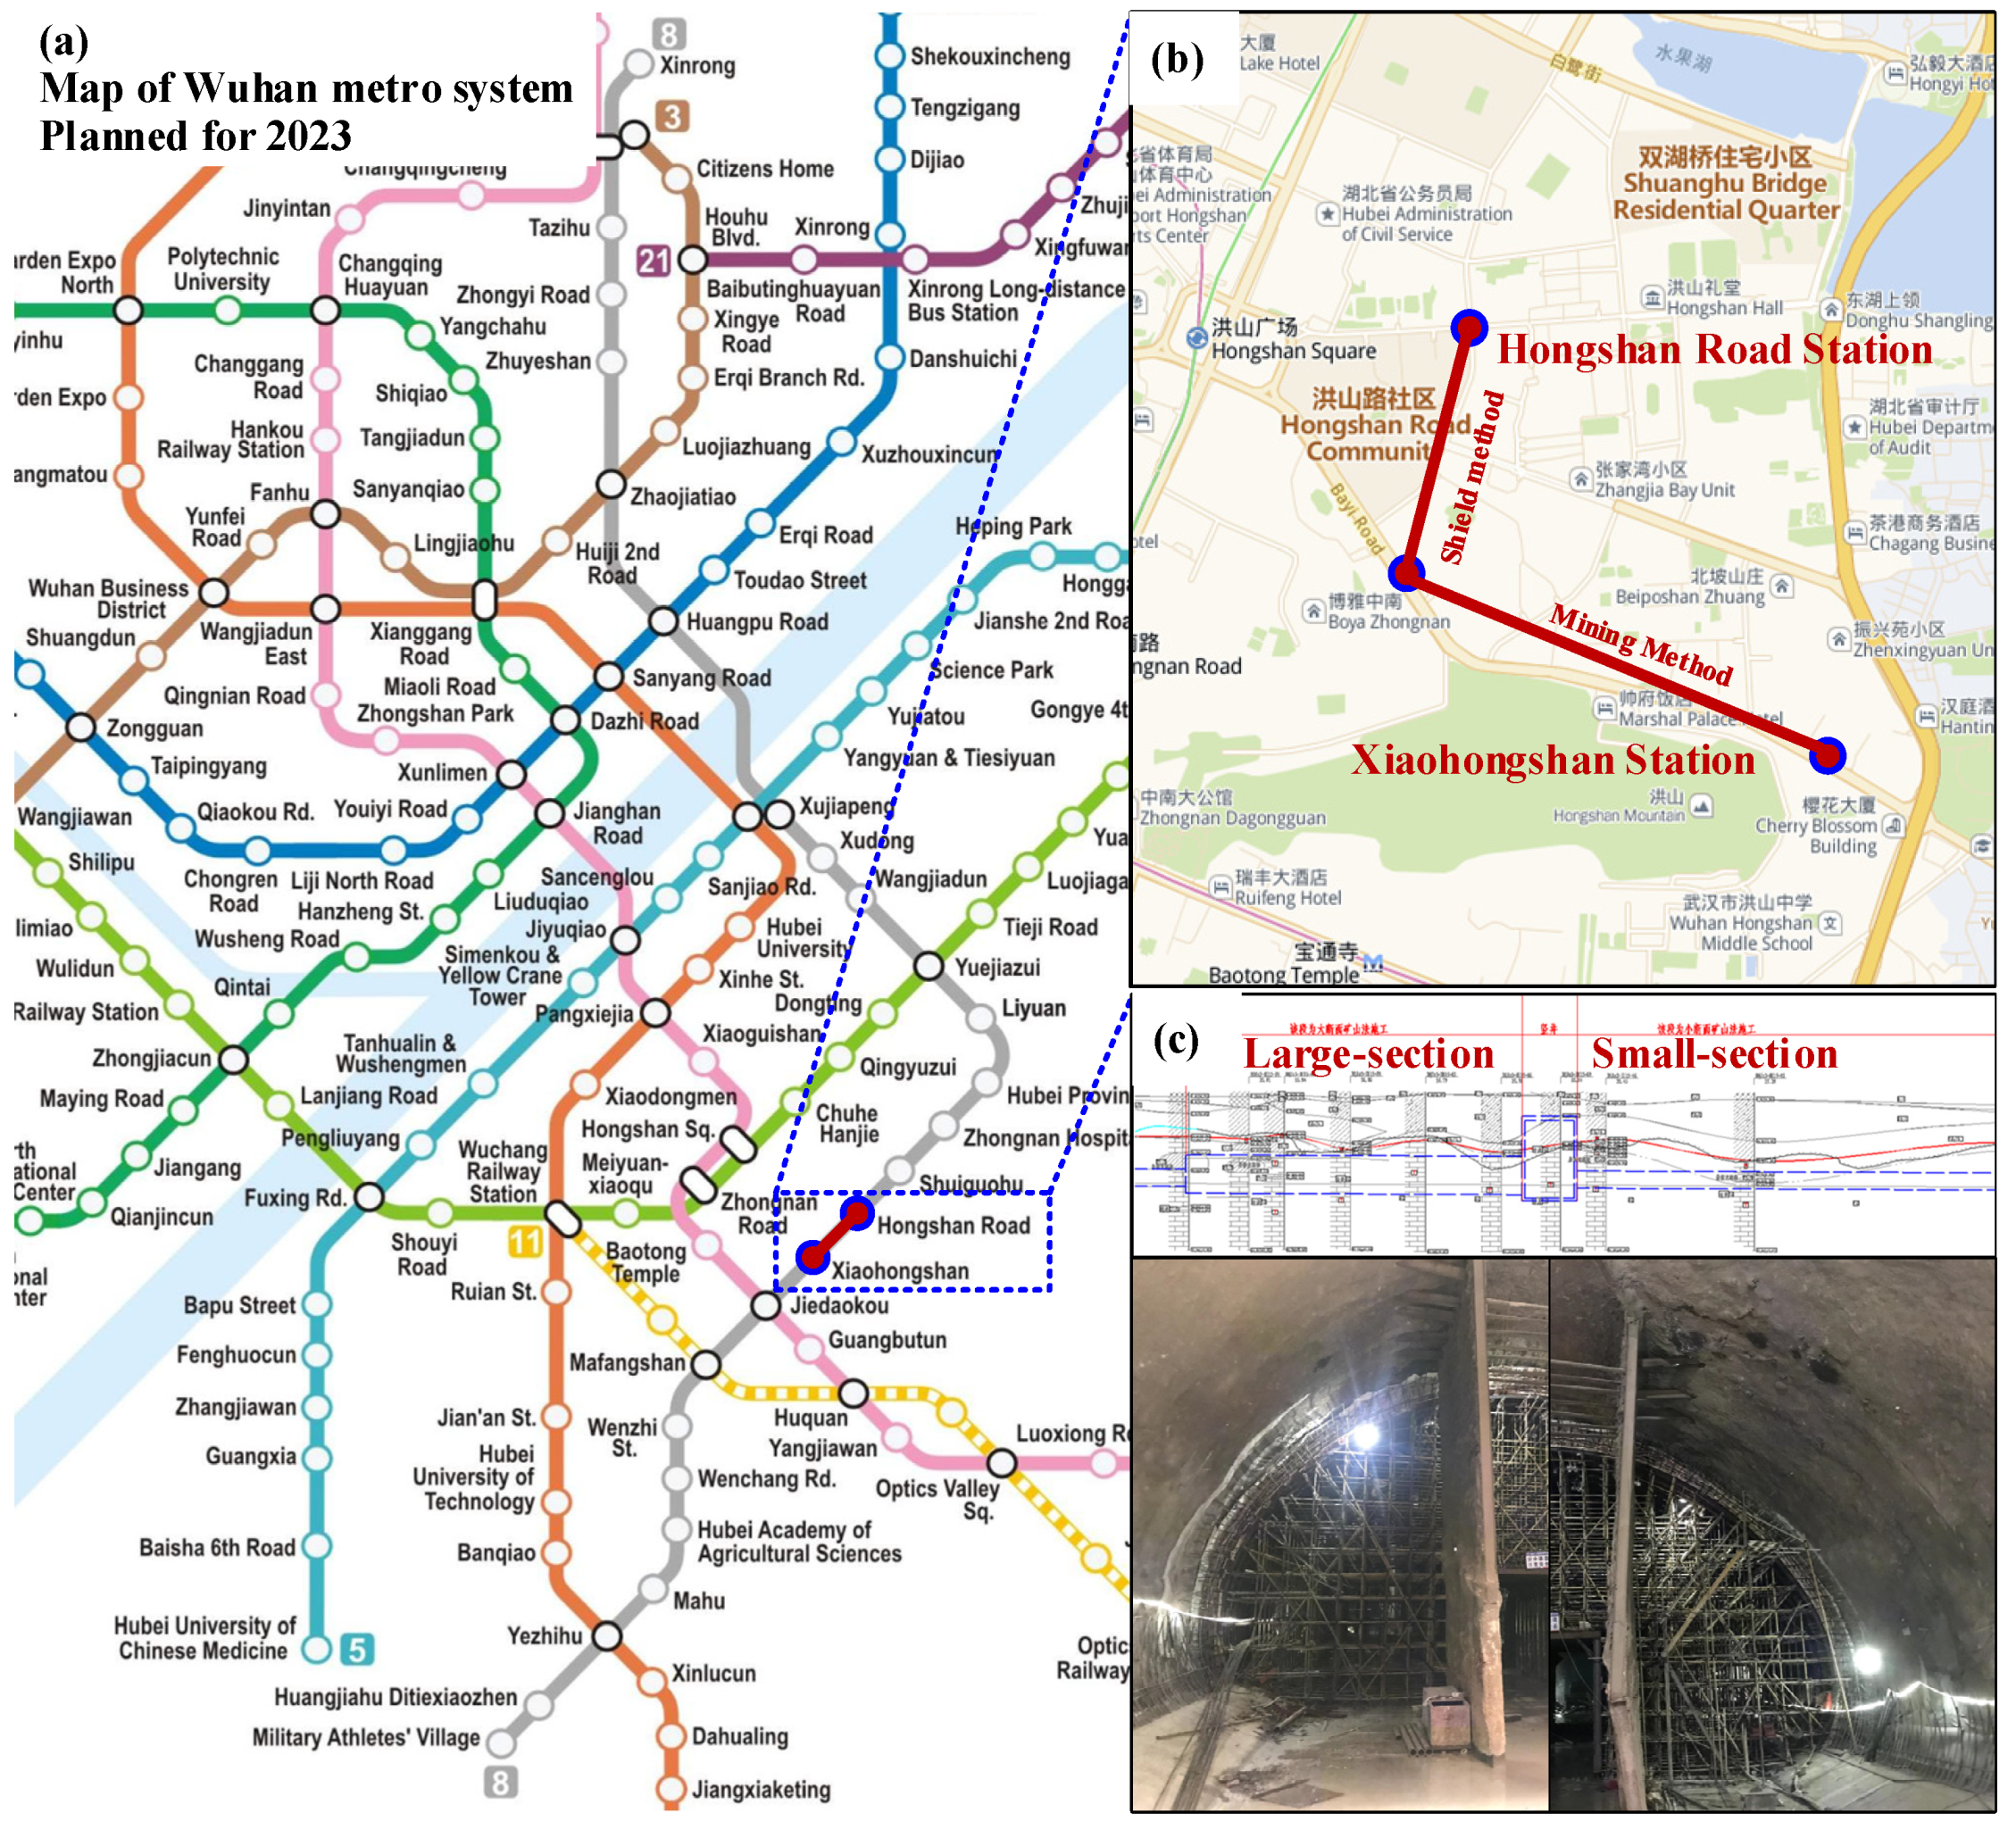
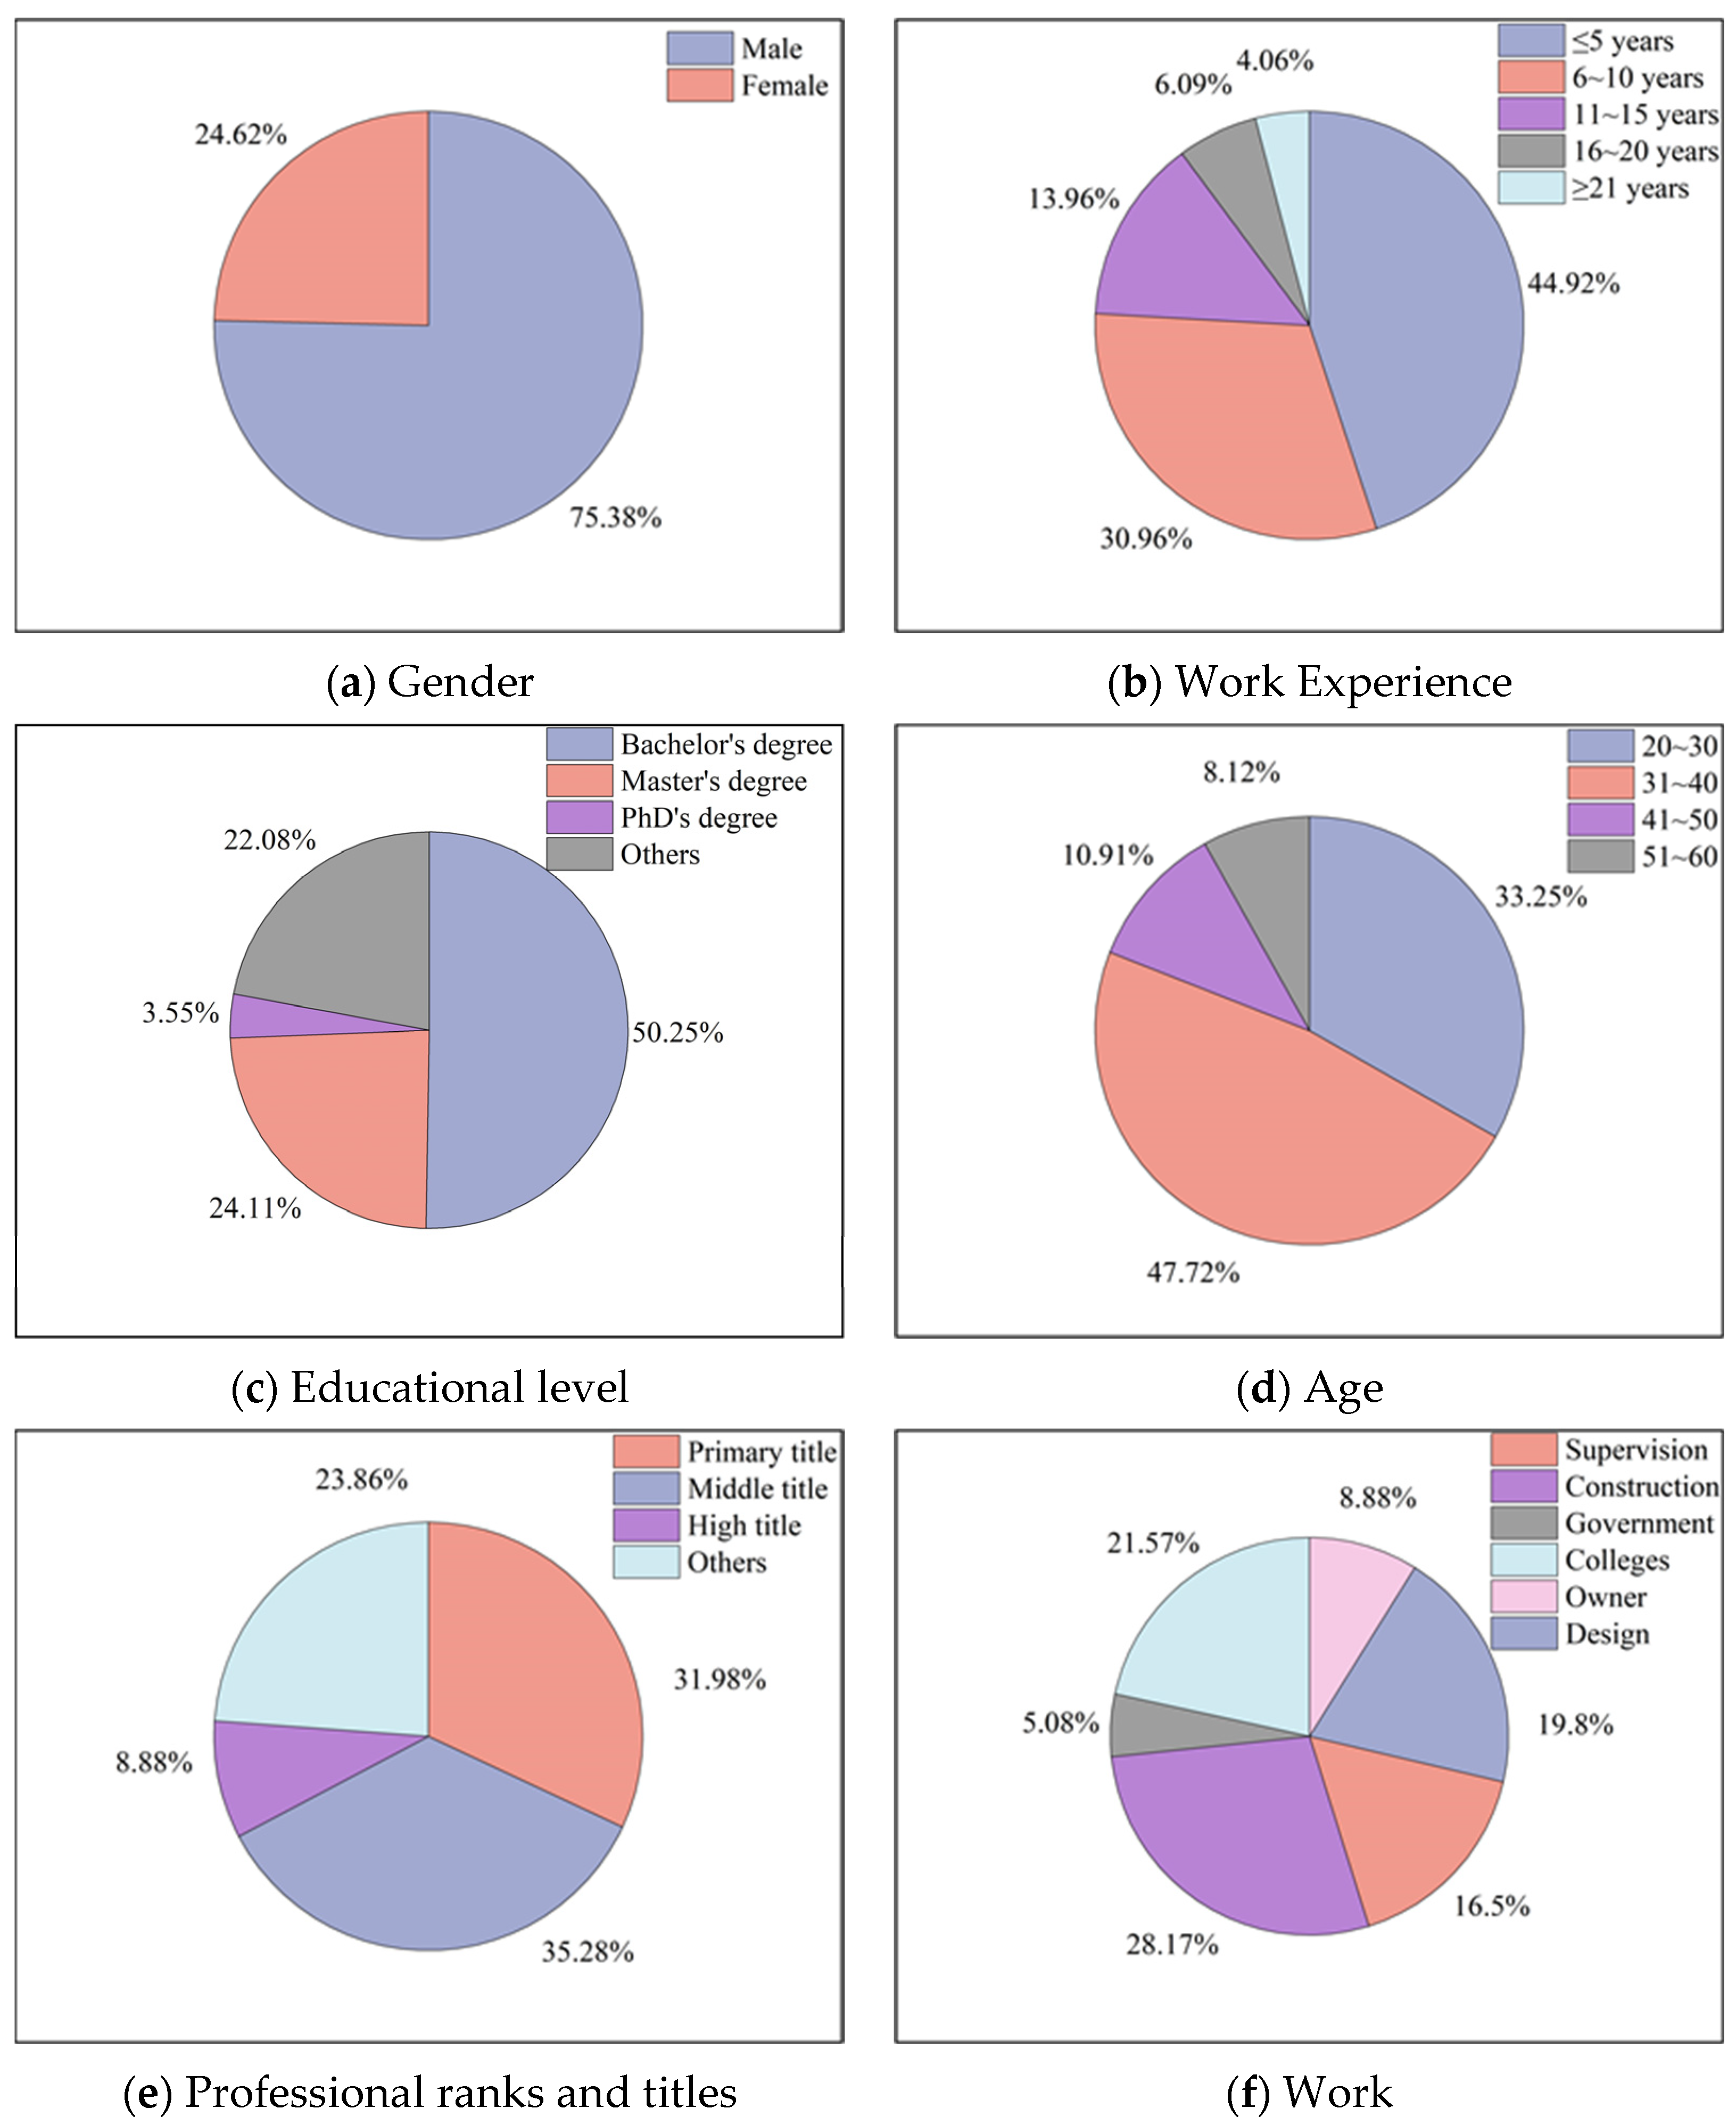
3.1. Step 1: Research Data Acquisition

Research variables X 1 X 26 were set as the items in the questionnaires and the five-point Likert scale was adopted to design the questionnaires (Table 2).

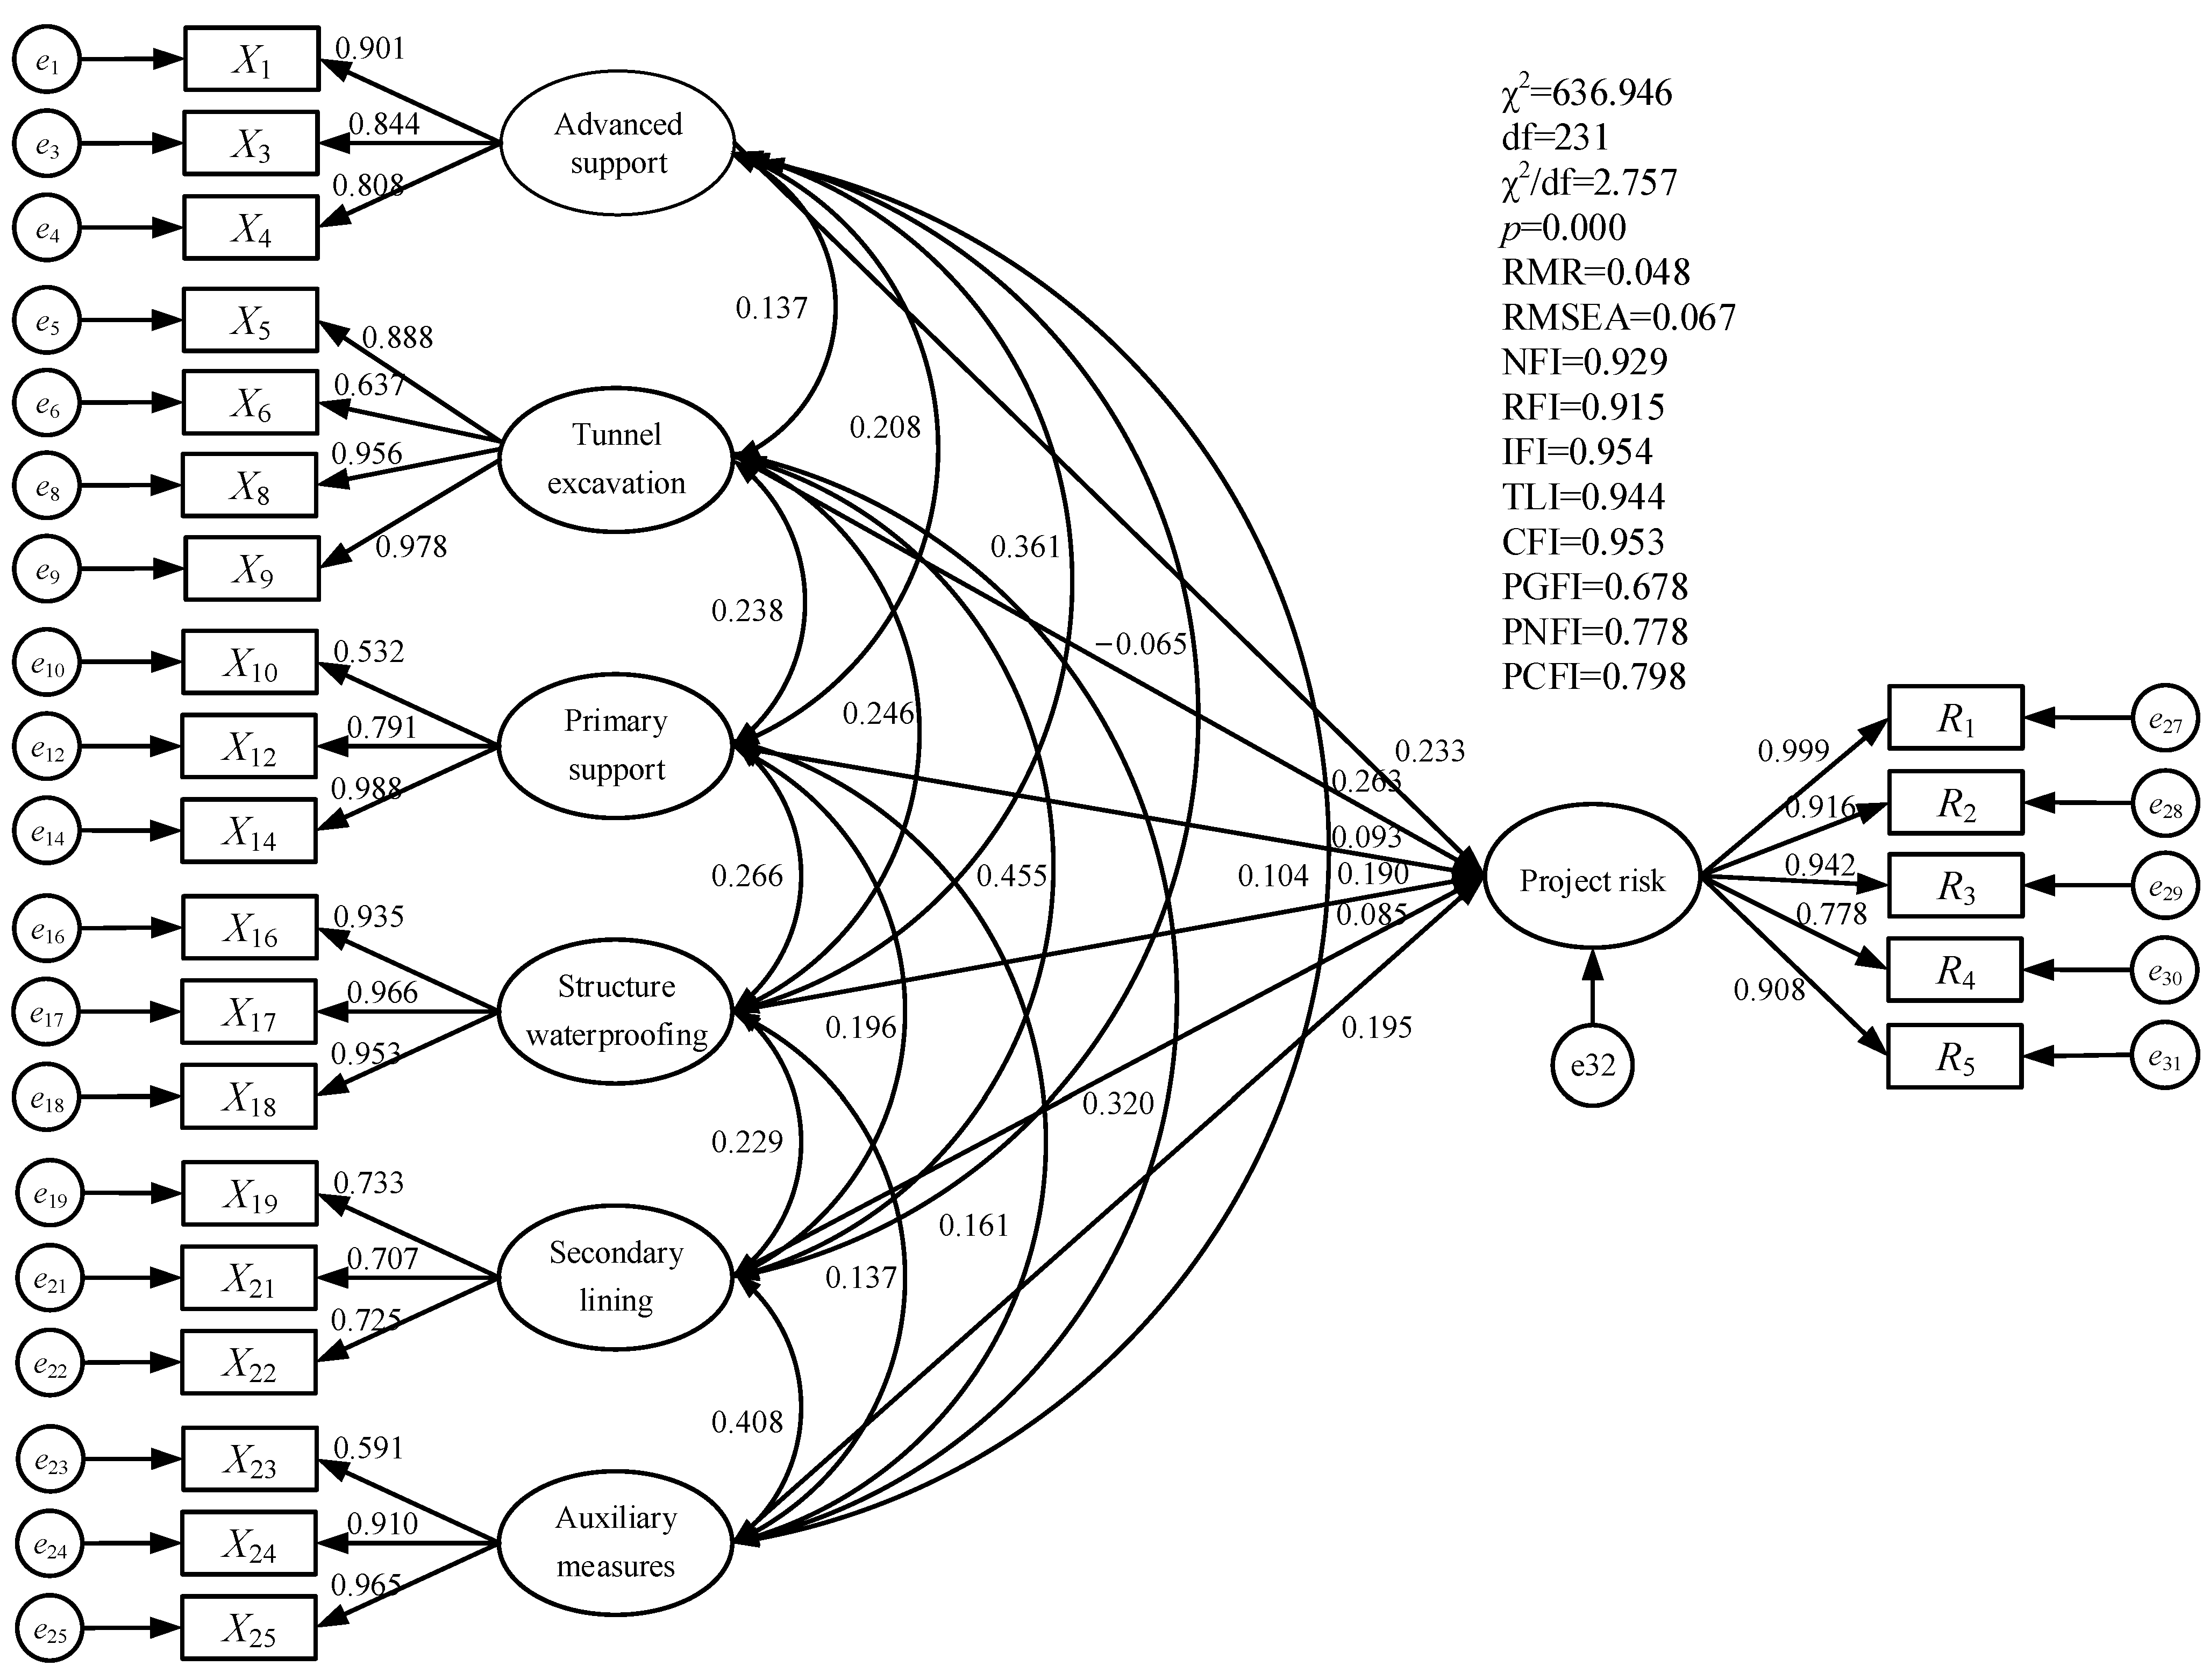
3.2. Step 2: Development of SEM

The SEM is an important tool for testing causality and devloping a statistical analysis of diversified data [59]. It is used to judge the causality between variables according to the covariance matrices of variables and therefore can intuitively reflect path relationships between multiple variables [60]. Considering this, the SEM has been extensively applied to multi-variable statistical studies.
The SEM consists of a measurement model and a structural model [61]. In the measurement model, Equation (1) reflects the relationships between the PR and its five observational indices ( R 1 R 5 ) ; and Equation (2) hows the relationships between the six construction stages ( C 1 C 6 ) and 26 observational indices ( X 1 X 26 ) of the CSR. In the structural model, Equation (3) displays the relationships between the six construction stages ( C 1 C 6 ) and the PR. The measurement model and the structural model together constitute the complex structure and mathematical relationship of the CSR of metro tunnels constructed by the mining method.
Y = λ η + ε
X = λ ξ + δ
η = γ ξ + β η + ς
where η represents the endogenous variable; ξ denotes the exogenous variable; Y signifies the observational variable of the endogenous variable η ; X denotes the observational variable of the exogenous variable ξ ; γ indicates the action of the exogenous variable on the endogenous variable; β is the relationship between the endogenous variables; λ is the factor loading; ζ represents the measurement error of the endogenous variable; ε is the measurement error of variable Y ; and δ denotes the measurement error of variable X .

3.3. Step 3: Verification of SEM

To guarantee the precision and accuracy of the output results of the SEM, the reliability, validity, and fitness need to be tested [62]. Therefore, a reliability analysis was used to measure the degree of reliability of the data, that is, the stability and consistency of the questionnaire results. The validity analysis was adopted to measure the effectiveness and accuracy of the data, that is, how accurately the research content is measured based on the data [63]. The fitness tests were performed to evaluate the fitness between the survey data and the hypothetical model [64].
A confirmatory factor analysis (CFA) was conducted to assess the reliability and validity of the model and to judge whether the hypothetical model plays its role according to the expected structure [65]. Generally, the composite reliability (CR) was utilized to measure the reliability, which needs to be greater than 0.8 (in principle) [66]. The average variance extraction (AVE) was commonly adopted to measure the validity, which needs to be greater than 0.5 (in principle) [67]; these are given by Equations (4) and (5).
C R = ( λ ) 2 ( λ ) 2 + δ
A V E = λ 2 n
where λ represents factor loading and δ denotes the measurement error. They are standardized parameters. n is the number of the measurement indices of a factor.
The CFA tests passed, which means that the survey data are highly consistent with the hypothetical model, and the AMOS software was used to develop the initial SEM. Before analyzing the SEM, a goodness-of-fit (GOF) analysis should be conducted to test the fitness of the initial SEM. The test indices in the GOF analysis include the absolute, relative, and parsimony GOF indices [68]. The test indices and criteria are listed in Table 3.
If the test statistics do not conform to the fitting standard, Hopper et al. (2008) [69] proposed that the model needs to be improved by referring to the modification index (MI) to reach the GOF indices [70]. The output results of the modified SEM are tested again. If the latent variables have significant correlation coefficients, this indicates that the hypothetical model is reasonable. Under the condition, the path coefficient reflects the influence degree of the CSR on the PR, therefore the standardized path coefficient of the SEM is converted to weights in the FCM.

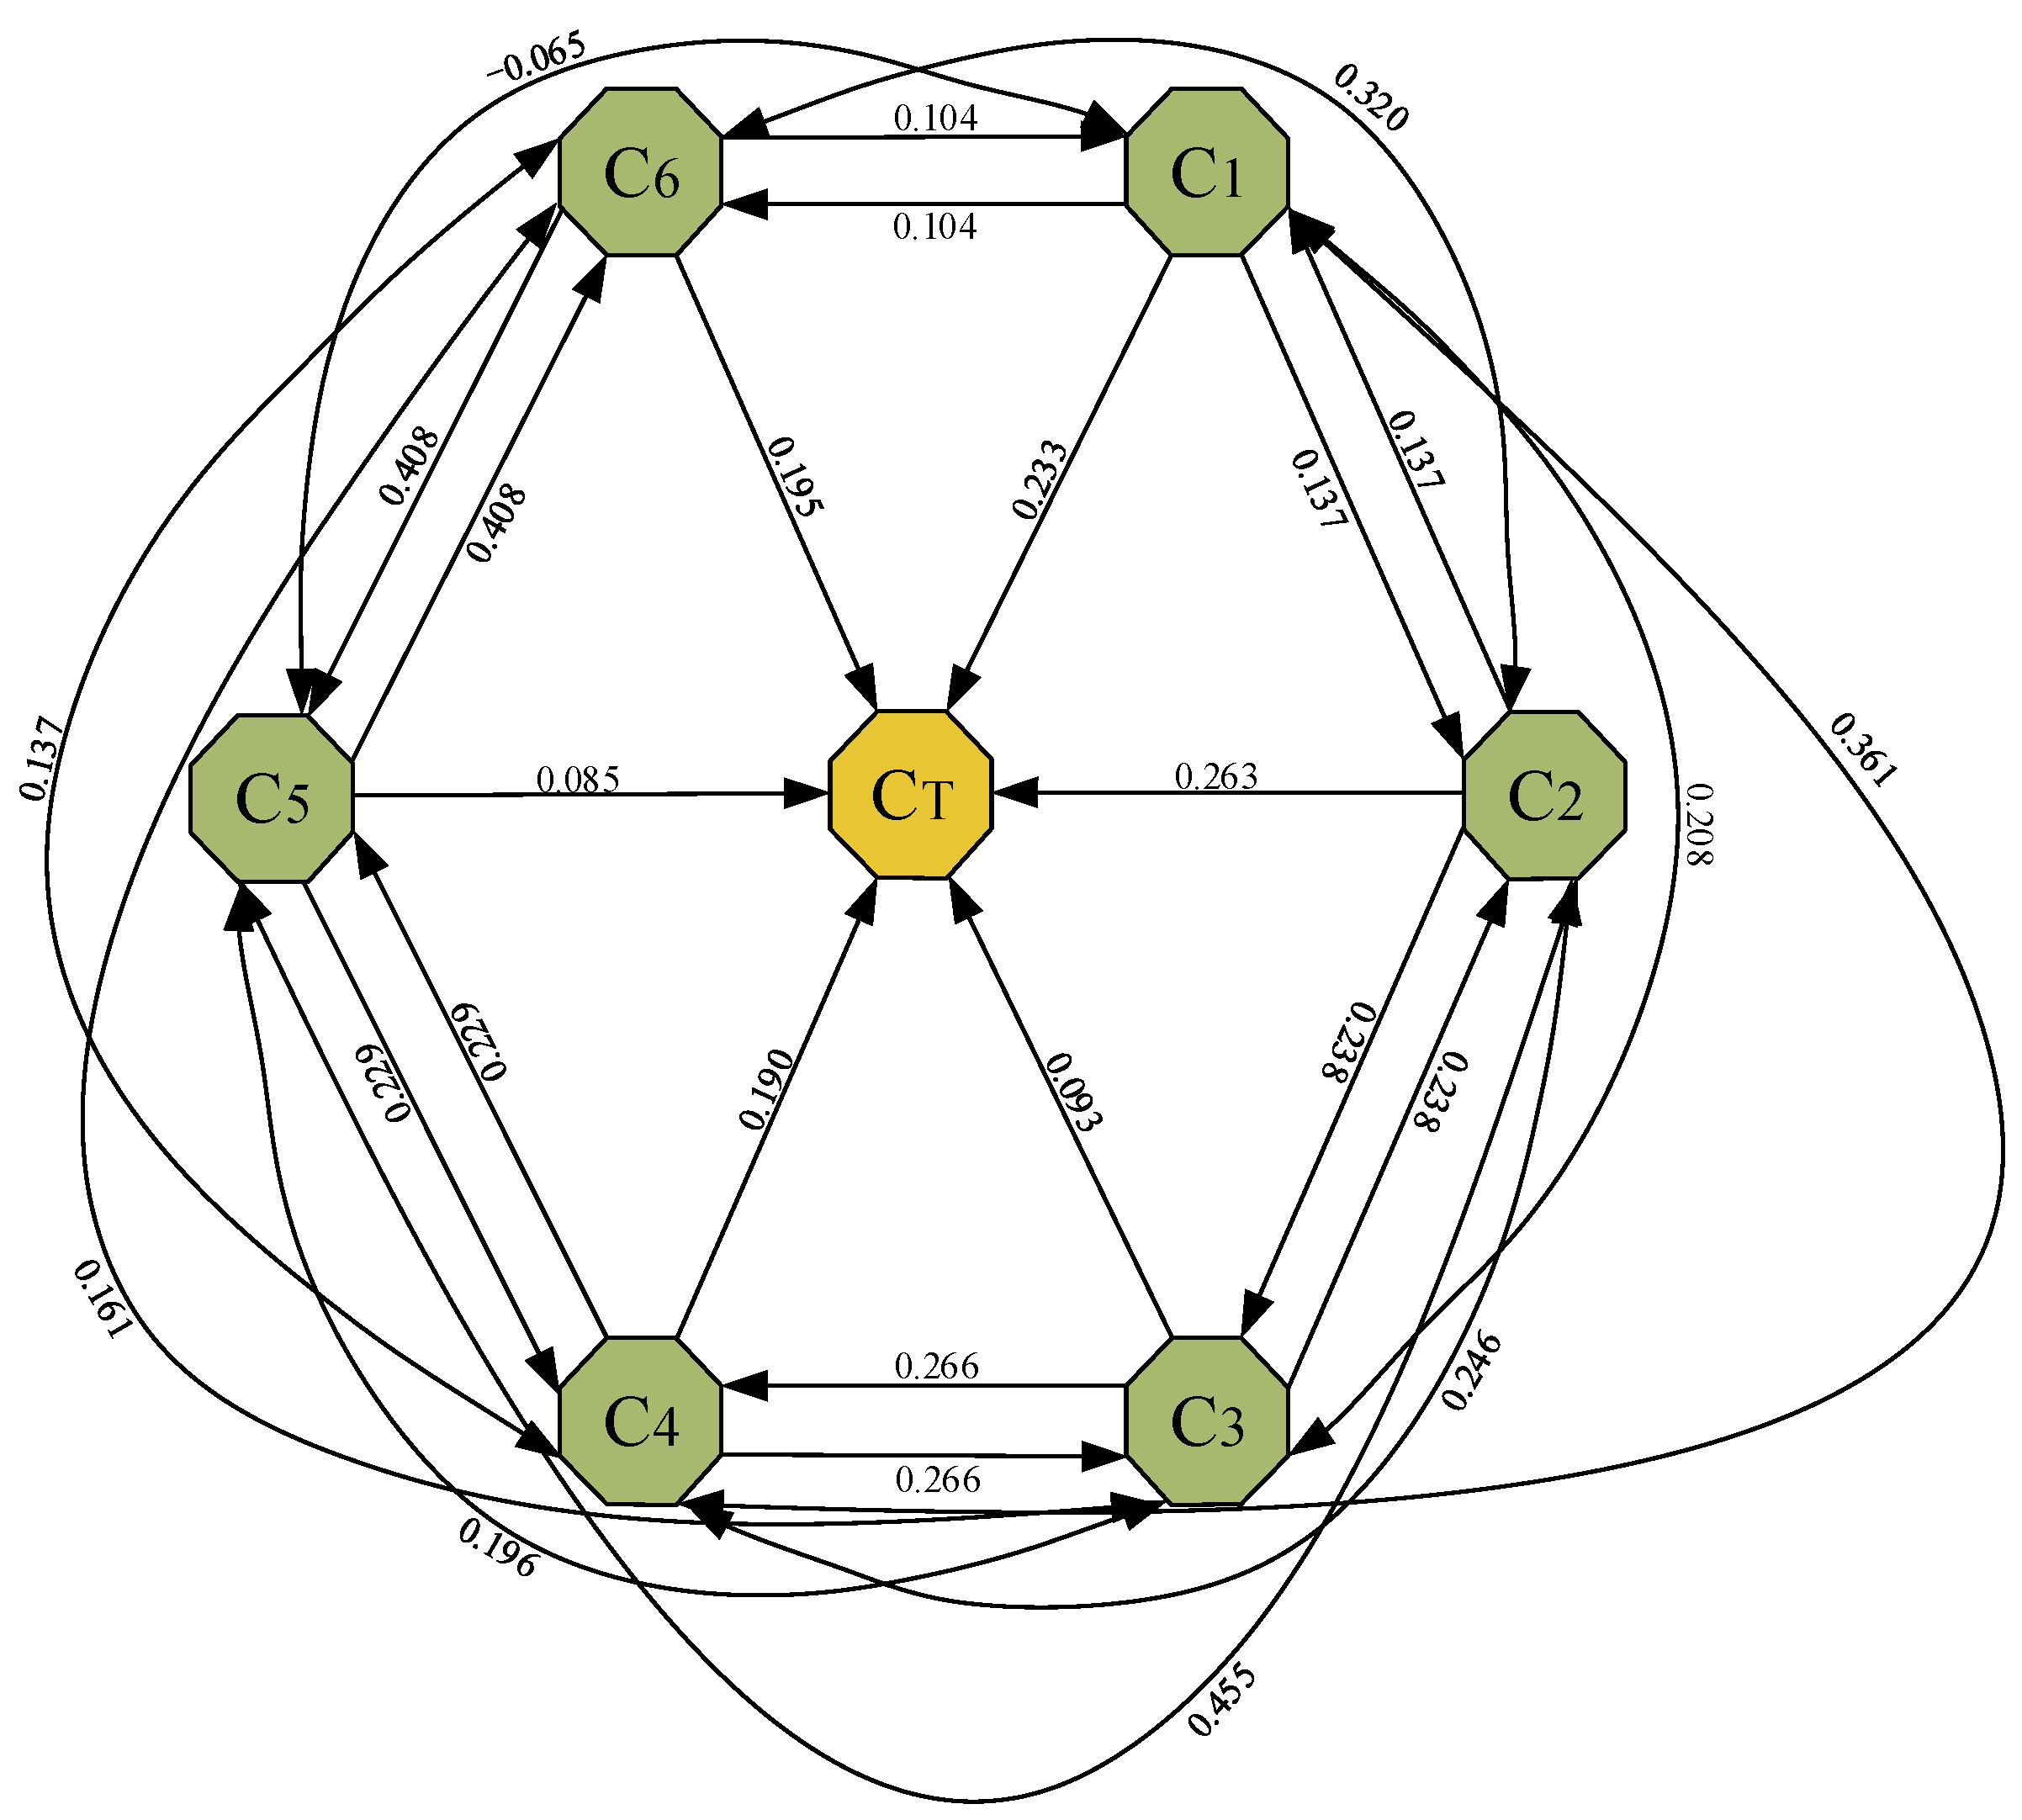
3.4. Step 4: Development of the FCM

Kosko et al. (1986) [71] introduced an FCM to expand the concept of cognitive mapping by combining the tenets of fuzzy logic and elements of various neural networks. An FCM is a set of directed cyclic graphs composed of concept nodes and edges. A concept node ( C i ) represents a concept or variable related to a specific field; an edge ( C i j ) indicates the causality between concept nodes C i C j . The edges are directed, thus mirroring the direction of action of causality [72]. Assuming that there are N concept nodes in the FCM, the weight from a concept node C i to C j   ( 1 i , j N ; i j ) is defined by W i j , which represents the relative influences of the concept node C i on C j . A positive value, zero, or a negative value is assigned to W i j [73].
W i j > 0 : the edge ( C i j ) from C i to C j indicates a positive relationship. An increase in the value of the concept node C i leads to a corresponding increase in the value of the concept node C j . Similarly, a decrease in the value of the concept node C i leads to a decrease in the value of the concept node C j .
W i j < 0 : the edge ( C i j ) from C i to C j indicates a negative relationship. An increase in the value of the concept node C i leads to a corresponding decrease in the value of the concept node C j , and vice versa.
W i j = 0 : this reflects that there is no relationship between C i and C j .
An FCM is used for modelling and simulation of a complex system [74]. It can be used to simulate the evolution of the CSR of metro tunnels constructed by the mining method via dynamic prediction and diagnostic reasoning. Due to the scarcity of experts in the metro construction field, it is difficult to acquire any quantitative relationship between concept nodes [75].
The SEM can resolve the interplay between the CSR and PR [76]. It also provides verified causality and its path coefficient; however, the SEM fails to analyze the CSR and PR dynamically. Hence, the hierarchical causality and standardized path coefficient between the CSR and PR in the SEM are introduced to the FCM. They serve as the quantitative relationship between concept nodes. This is more objective compared with the case of directly importing the questionnaire survey data of the CSR and PR into the FCM. Meanwhile, the FCM verifies the research results of the SEM from different aspects, including model development, predictive analysis, and reasoning diagnosis. Therefore, it is necessary and feasible to develop the SEM–FCM hybrid model based on the SEM by aiming at characteristics of the factors influencing the CSR of metro tunnels constructed by the mining method. These characteristics include intrinsic correlation and staged dynamic evolution. In the SEM–FCM hybrid model, the causality of latent variables in the SEM is used to develop the structure of the FCM; the standardized path coefficient is adopted to construct the weight of the FCM.

3.5. Step 5: Reasoning of FCM

A connection weight matrix W i j is set in the FCM. The matrix is formed by N concept nodes. The state matrix at time t is represented by A i ( t )   ( A i ( t ) = [ A 1 ( t ) , A 2 ( t ) , , A N ( t ) ] ) . The reasoning transformation function shown in Equation (6) is used to dynamically simulate the evolution. In this way, the state vector A i ( t + 1 ) of each concept node at time t + 1 is obtained. In the reasoning process of the FCM, the value of the output concept nodes is stabilized at a steady value [77]. When changes in the value are periodic or in the chaos state, a steady state is reached, and the iterations stop [75].
A i ( t + 1 ) = f ( A i ( t ) + j = 1 , j i n W i j × A j ( t ) )
where t is the iteration step size; A i ( t ) denotes the value of concept node C i at time t ; A j ( t ) represents the value of concept node C j at time t ; A i ( t + 1 ) indicates the value of concept node C i at time ( t + 1 ) ; W i j is the connection weight from concept node C i to C j ; and f ( · ) represents the threshold function.
During the iterative transformation, the threshold function is used to ensure that the values of the concept nodes always remain within the requisite interval [78]. In the FCM, the sigmoid activation function and the hyperbolic tangent function are generally used as the threshold function. When the concept nodes are in the interval of [ 0 , 1 ] , the sigmoid activation function in Equation (7) is adopted; if they are in the interval of [ 1 , 1 ] , the hyperbolic tangent function in Equation (8) is employed.
f ( x ) = 1 1 + e c x ( c > 0 )
f ( x ) = tanh ( x ) = e x e x e x + e x
During reasoning using the FCM, the constant c in Equation (7) affected the convergence rate of the threshold function and its value depends on experience. To ensure randomness of the simulation experiment, Equation (8) was selected as the threshold function of the research. If A i ( t + 1 ) = A i ( t ) appears in the iterative operation, it indicates that the model has reached a steady state and the iterations have stopped.

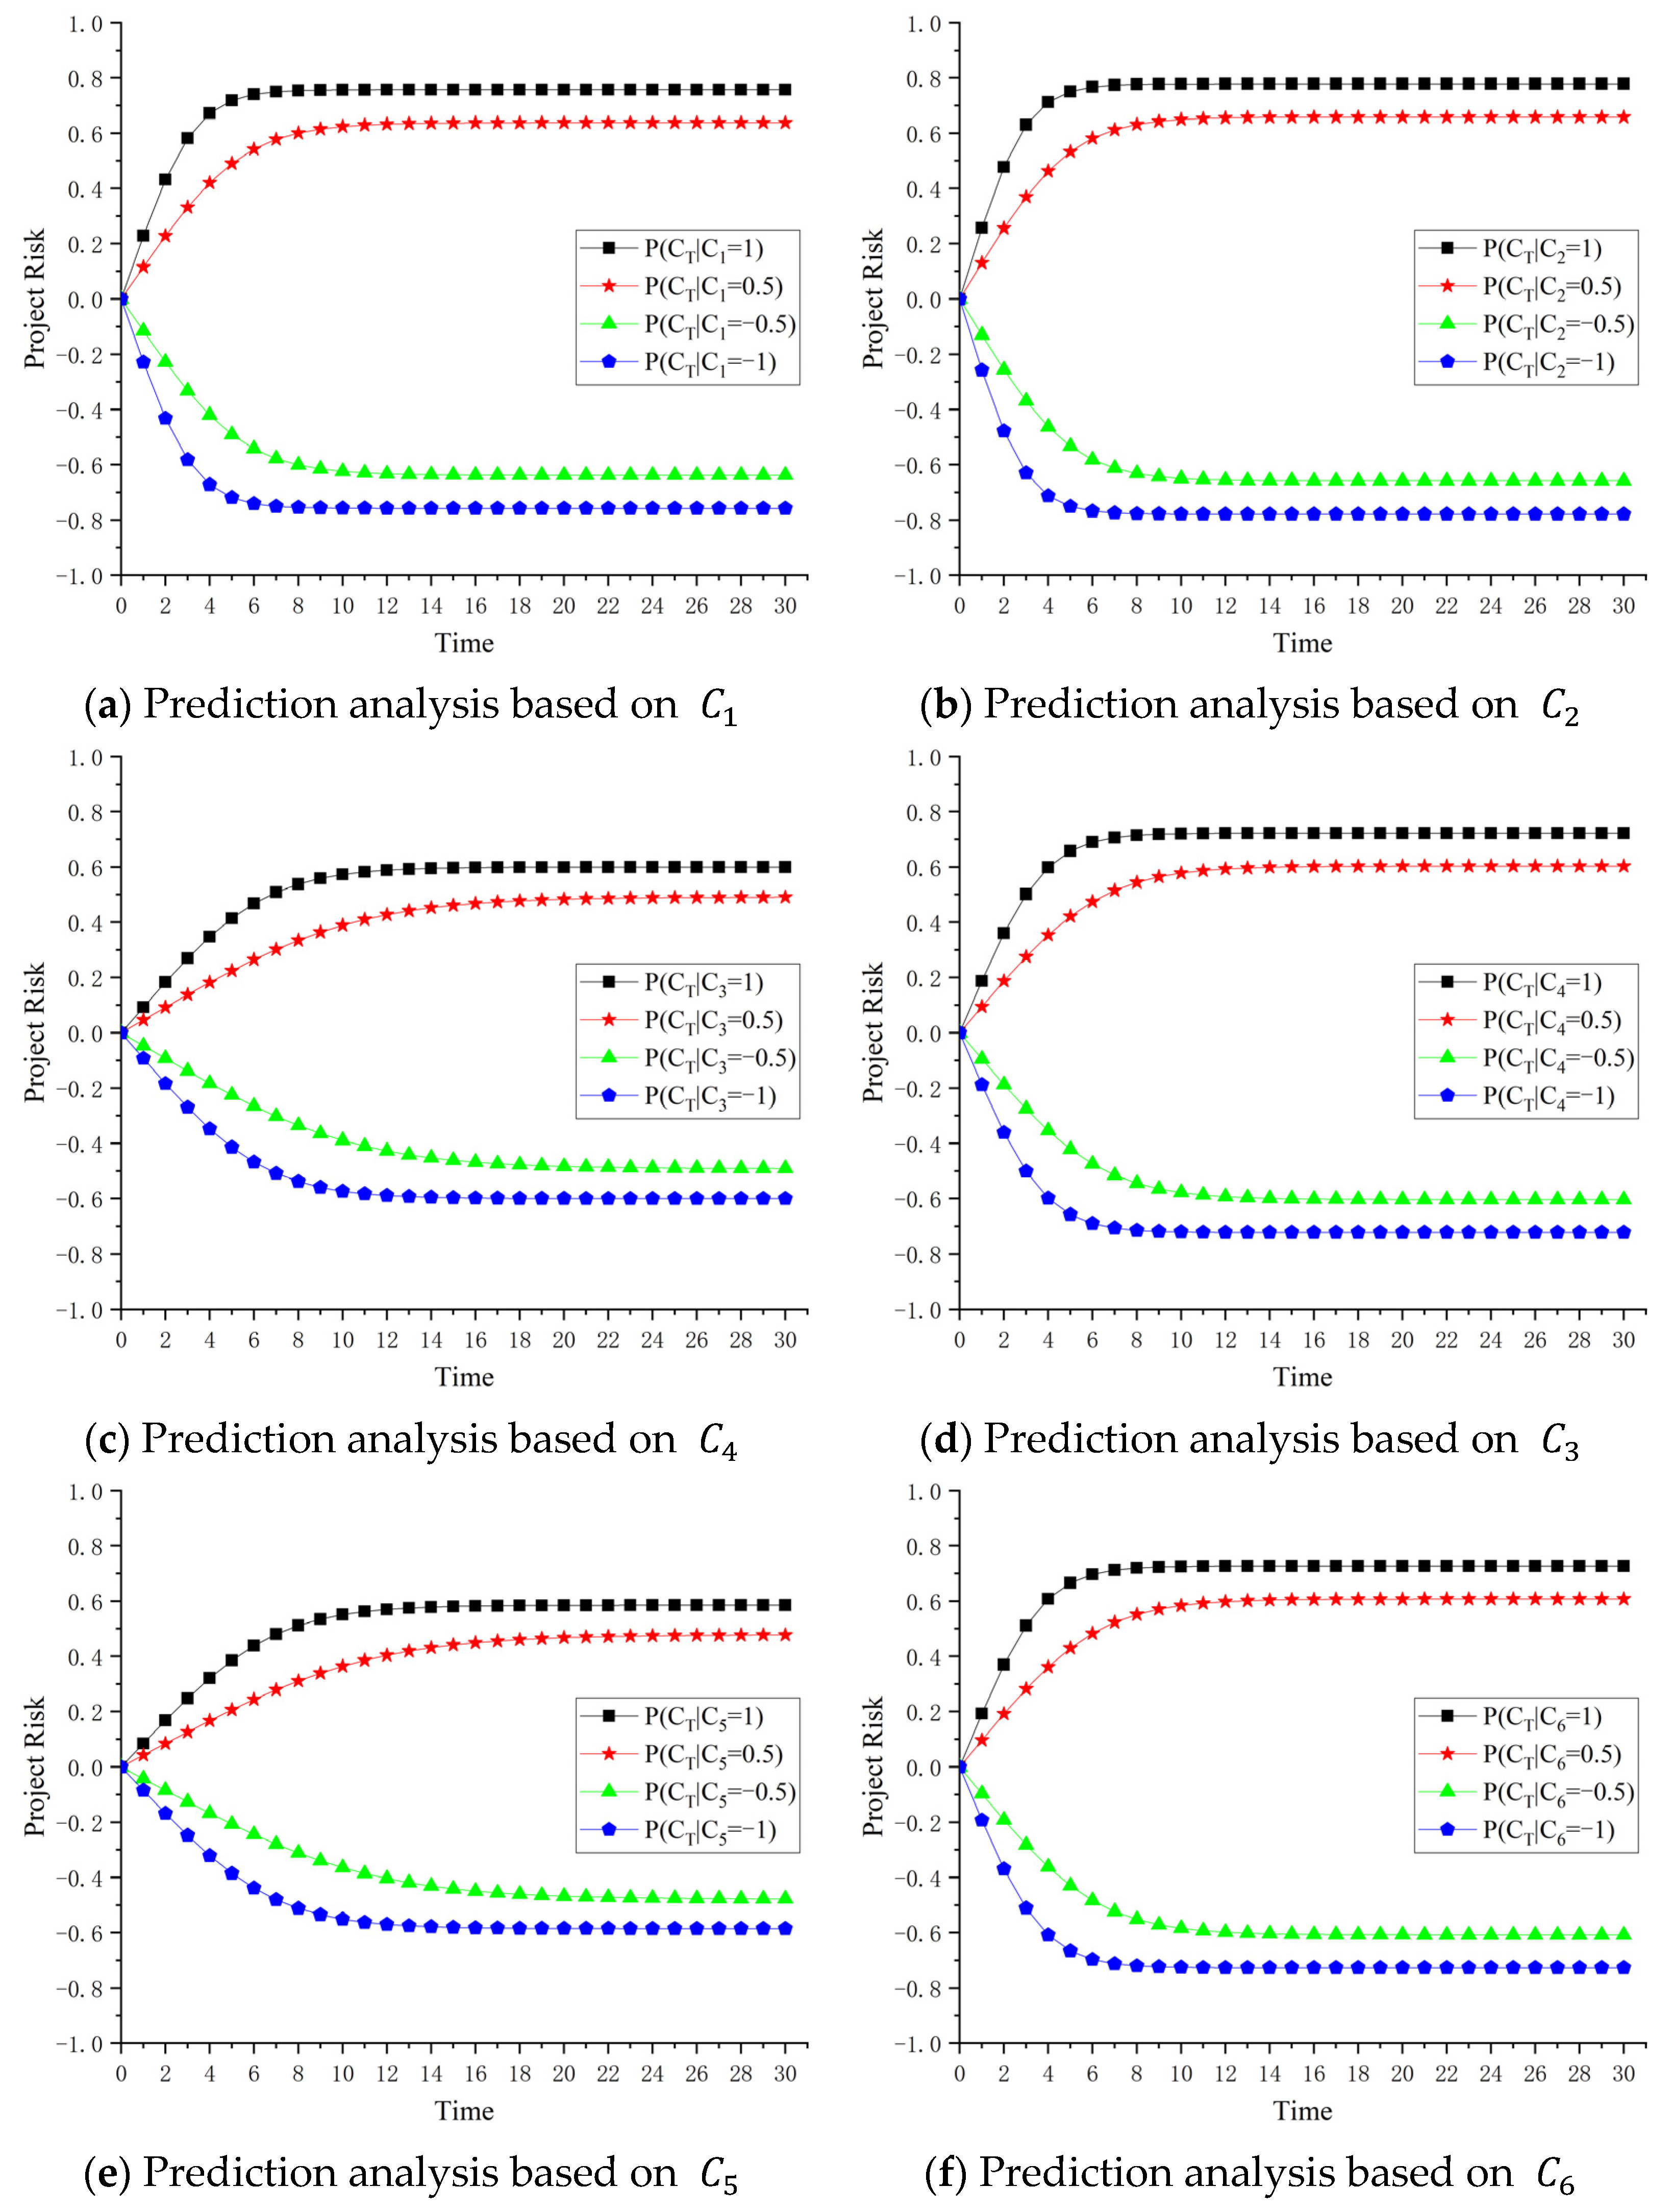
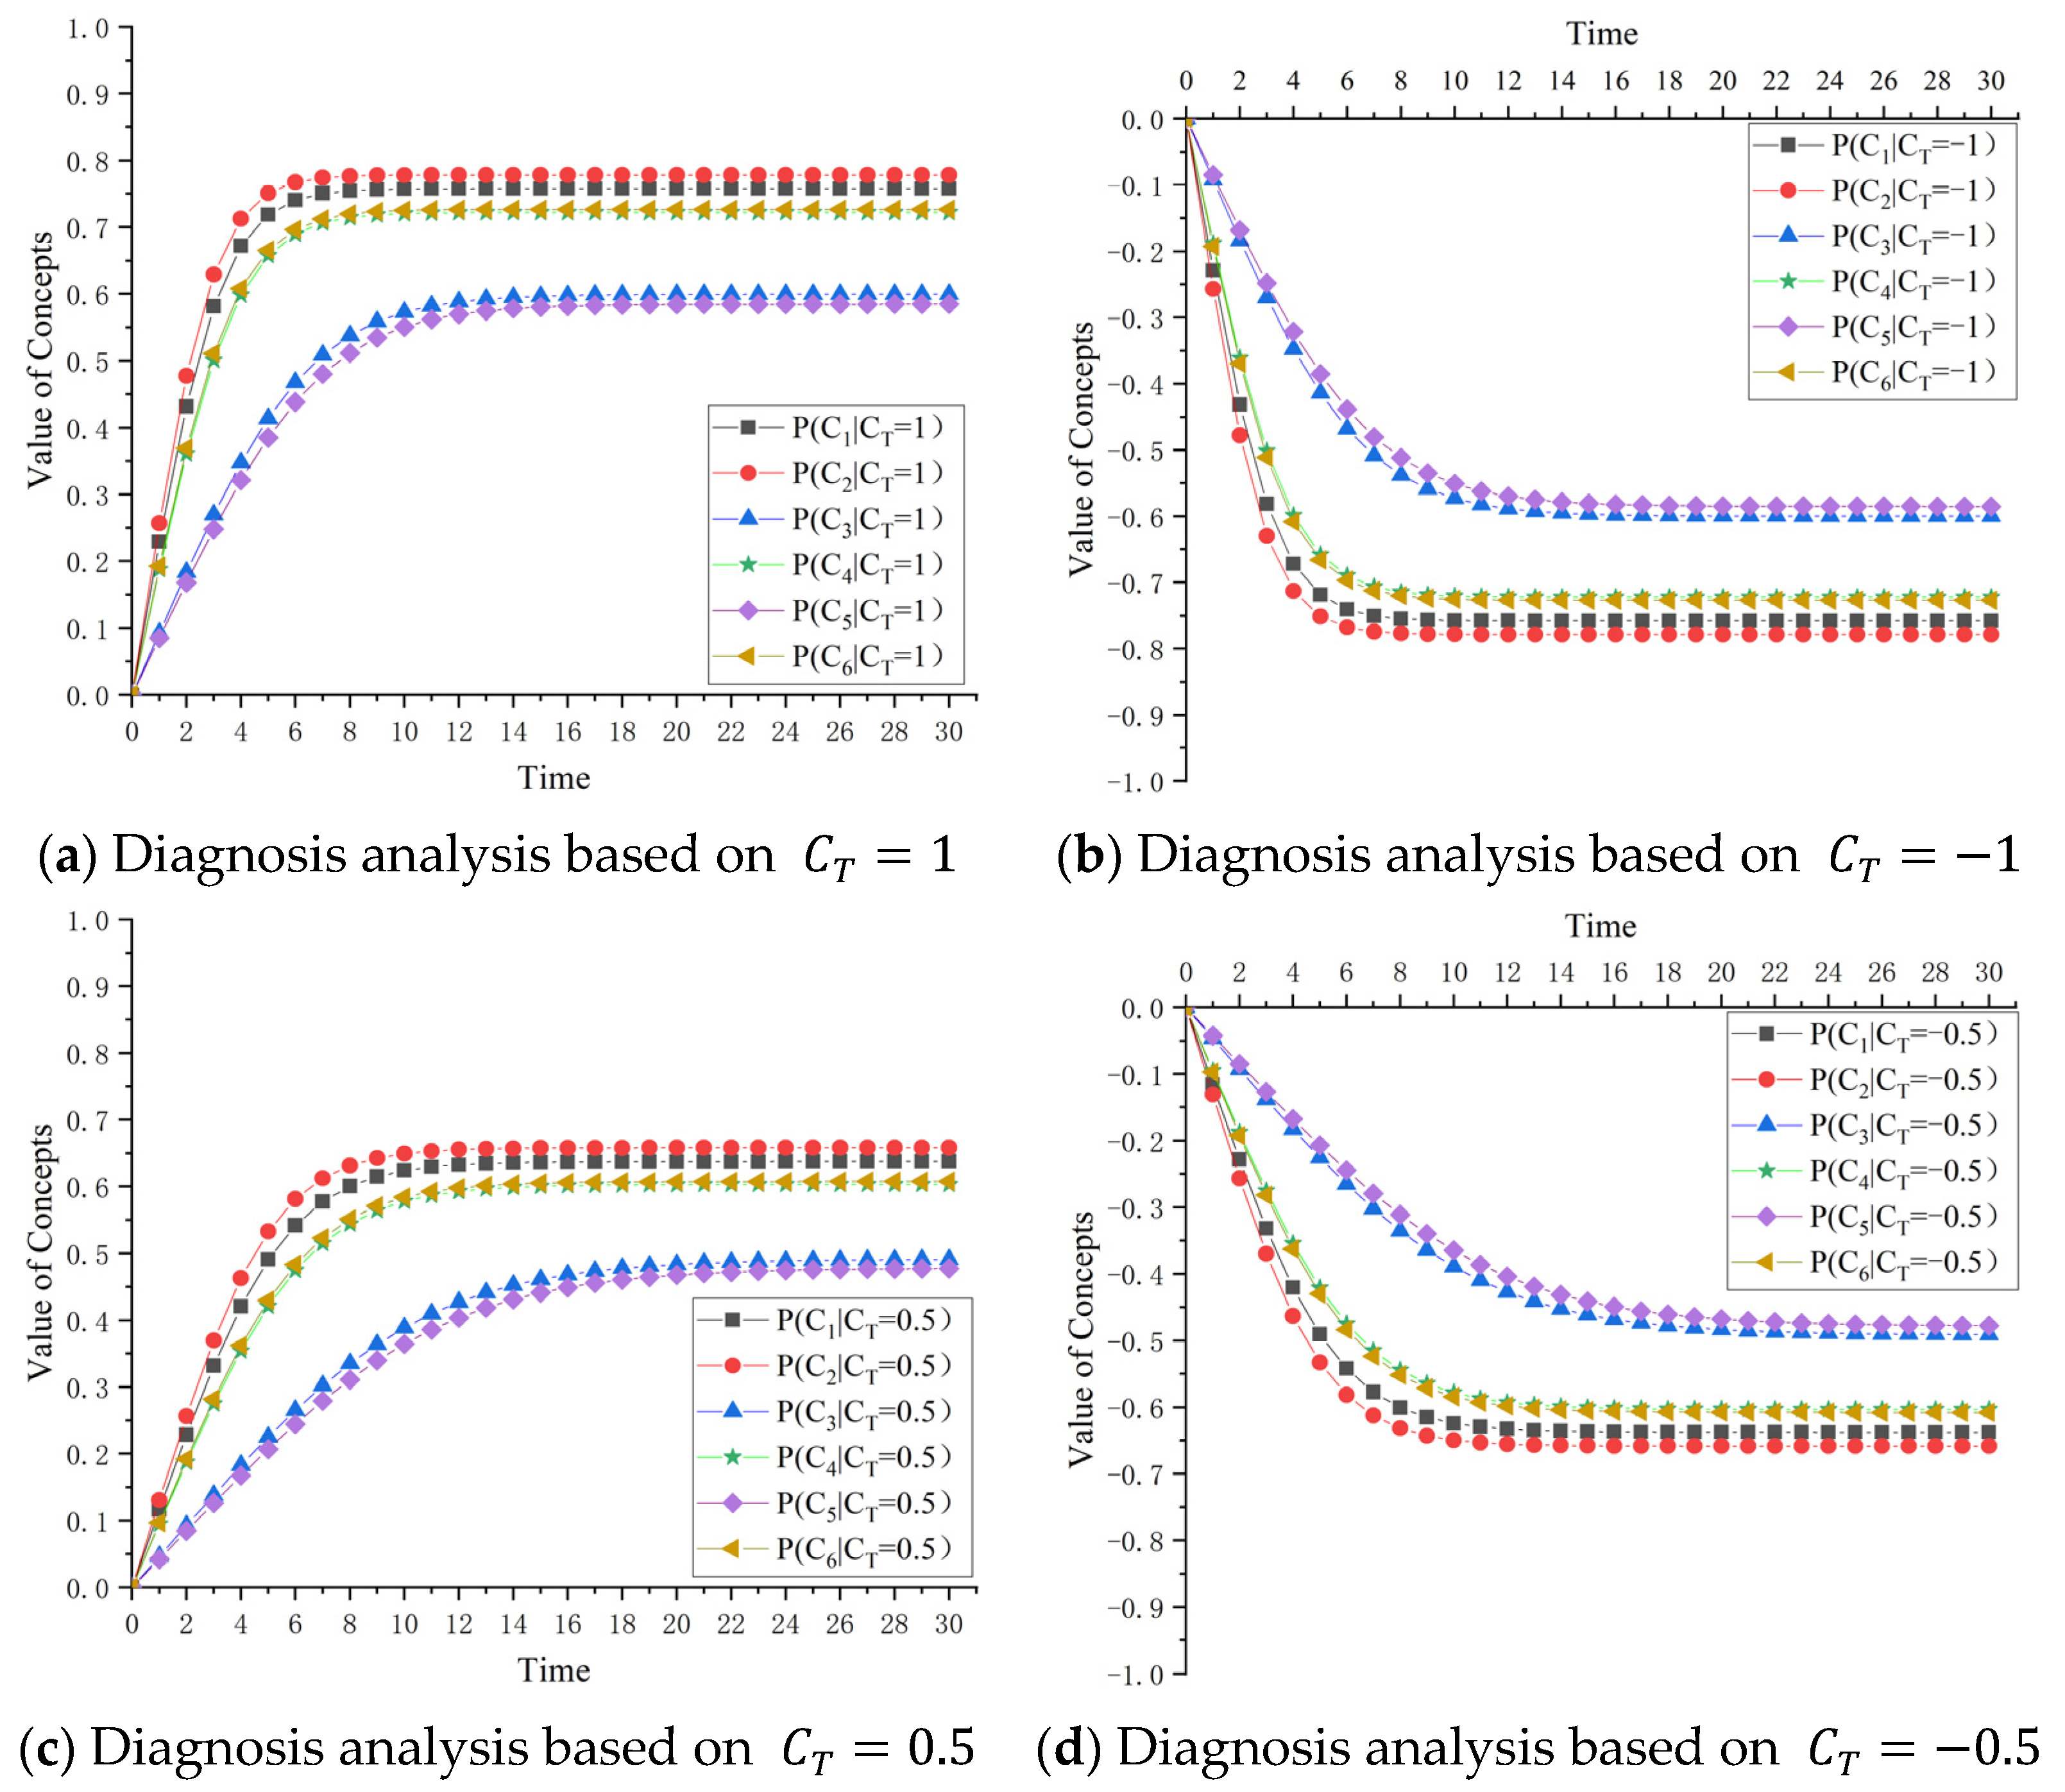
3.6. Step 6: Predictive Analysis and Diagnostic Analysis

FCM reasoning analysis includes predictive reasoning and diagnostic reasoning [75]. Predictive reasoning refers to the reasoning from the cause concept node to the target concept node. That is, it aims to find the key factors of the CSR that are most likely to cause PR through predictive reasoning. The ultimate purpose is to control the risks timeously and reduce losses. Diagnostic reasoning refers to reasoning from the target concept node to the cause concept node: it aims to seek factors of the CSR that induce PR via diagnostic reasoning. The ultimate purpose is to find the fundamental cause, thus realizing the goal of risk warning.
To improve the timeliness of safety evaluations throughout the construction of metro tunnels by the mining method, project managers can integrate the identification of key risk factors with dynamic prediction and reasoning diagnosis. This is realized by virtue of the advantages of an FCM in prediction and diagnostic reasoning. In this way, the dynamic evolution of the key risks is analyzed, which resolves difficulties in identifying, predicting, and disposing of risk in the construction process. As a result, the risk evaluation results can better match the prevailing engineering conditions. This provides a reference for the CSR management of metro tunnels constructed by the mining method.

4. Empirical Analysis Results

To prove the effectiveness and feasibility of the SEM–FCM hybrid model in analyzing risk factors affecting the CSR of a metro tunnel constructed by the mining method, the Phase 2 project of the Metro Line 8 constructed by the mining method in Wuhan was used as an example. The application of the SEM–FCM hybrid model in the metro construction site was demonstrated. As shown in Figure 2a, the Wuhan metro system is an urban rail transport service serving Wuhan. By the end of December 2021, there were 11 metro lines under operation in Wuhan and the total length thereof reached 435 km, passing a total of 282 stations. By 2024, a total of 14 metro lines will be constructed in Wuhan to form a metro network with a total length of 606 km [79].
Wuhan Metro Line 8 has a total length of 39 km. Its construction started on 26 October 2014 and 26 stations are set along the line. The entire metro line is underground. The Phase 2 project of Metro Line 8 (Liyuan station to Yezhihu station), which has been open to traffic since 2 January 2021, is an important passenger traffic line linking up the central region of the Wuchang District. A cross-section of the line was utilized as the research object of interest, namely, Xiaohongshan—Hongshan Road Station (XHS), which is shown in Figure 2b.
XHS is a double-track tunnel with a total length of 1595.595 m. The tunnel sections constructed by the shield method and large-section mining method are 1472.495 m and 106.1 m long, respectively. A single cross-over is set at chainages DK23 + 680.41 to DK23 + 770.251 (right-hand tunnel), where the traffic is busy. Additionally, there are many pipelines and civil air-defense tunnels under these roads, therefore a large-section mining method is used at the cross-over. The tunnel constructed by this mining method is at chainages DK23 + 661.251 to DK23 + 770.251 (right-hand tunnel). The width and height of the cross-section are 19.62 m and 13.43 m, respectively. The overlying soil above the vault is 23.3 m thick. The double side drift method is used for construction by dividing the large section into six parts (Figure 2c).

4.1. Step 1: Verification of SEM

Researchers have not reached a consensus about the number of questionnaire samples required to obtain an adequate sampling. Marsh et al. (1998) [80] and Jones et al. (2013) [81] believed that more samples may bring better results, while Vickers et al. (1993) [82] and Gracia et al. (2020) [59] stated that the sample size should be larger than 200, but not exceed 400. Masters (1974) [83] insisted that the factor analysis results have a high explanatory power if the sample size is five times that of the number of scale problems. To ensure the accuracy of the expert evaluation results, experts with at least two years of management and research experience were selected to participate in the survey. Both an off-line and on-line survey was adopted (within China). A total of 405 questionnaires were returned, and 394 questionnaires were obtained after eliminating those with incorrect selections or omissions; the effective recovery rate was 97.28%. The statistical results arising from the input from the experts are shown in Figure 3.
As shown in Figure 3, males accounted for 75.38% of all the subjects; subjects with fewer than five years of experience accounted for 44.92%; subjects with a bachelor’s degree or above accounted for 50.25%; subjects aged from 30 to 40 years old accounted for 47.72%; subjects with medium-grade professional titles or above accounted for 44.16%; and subjects from construction units accounted for 28.17%. According to the statistical results of the survey samples, the gender, work experience, educational level, age, professional ranks and titles, and work unit of the subjects all conform to the basic information pertaining to the rail transportation sector in China.
An analysis of the normality tests in Table 4 reveals that the absolute value of the skewness of the survey data is less than 3 [84]. The absolute value of the kurtosis of the survey data is lower than 10 [85]. According to Zhao et al. (2018) [76], the results indicate that the data follow the normal distribution and can be used in a subsequent analysis.
To test the reliability and validity of the questionnaire survey samples, a CFA was conducted on the basis that the samples pass the normality tests. The CFA results are shown in Table 5: in reliability tests, the factor loading of each observational variable exceeds 0.5; Cronbach’s α coefficient of the total scale is 0.918, which is greater than 0.8; and the minimum CR is 0.849, which is above 0.7. All these factors indicate high internal consistency of the scale. In validity tests, the KMO value is 0.853, which is larger than 0.5; Barlett’s test value of sphericity is less than 0.001; and the minimum AVE is 0.535, which is greater than 0.5. These indicate that the questionnaire data have high validity and the survey samples can support the development and analysis of the model.
The AMOS software was used to develop the initial SEM. The results show that the degree of freedom of the model is 231; this indicates that the initial SEM can be identified. The GOF of the initial SEM is shown in Table 6, which displays that the χ 2 / d f and RFI statistics are approximate to the evaluation criteria. The other statistics all meet the GOF evaluation criteria. Therefore, the initial SEM should be modified.

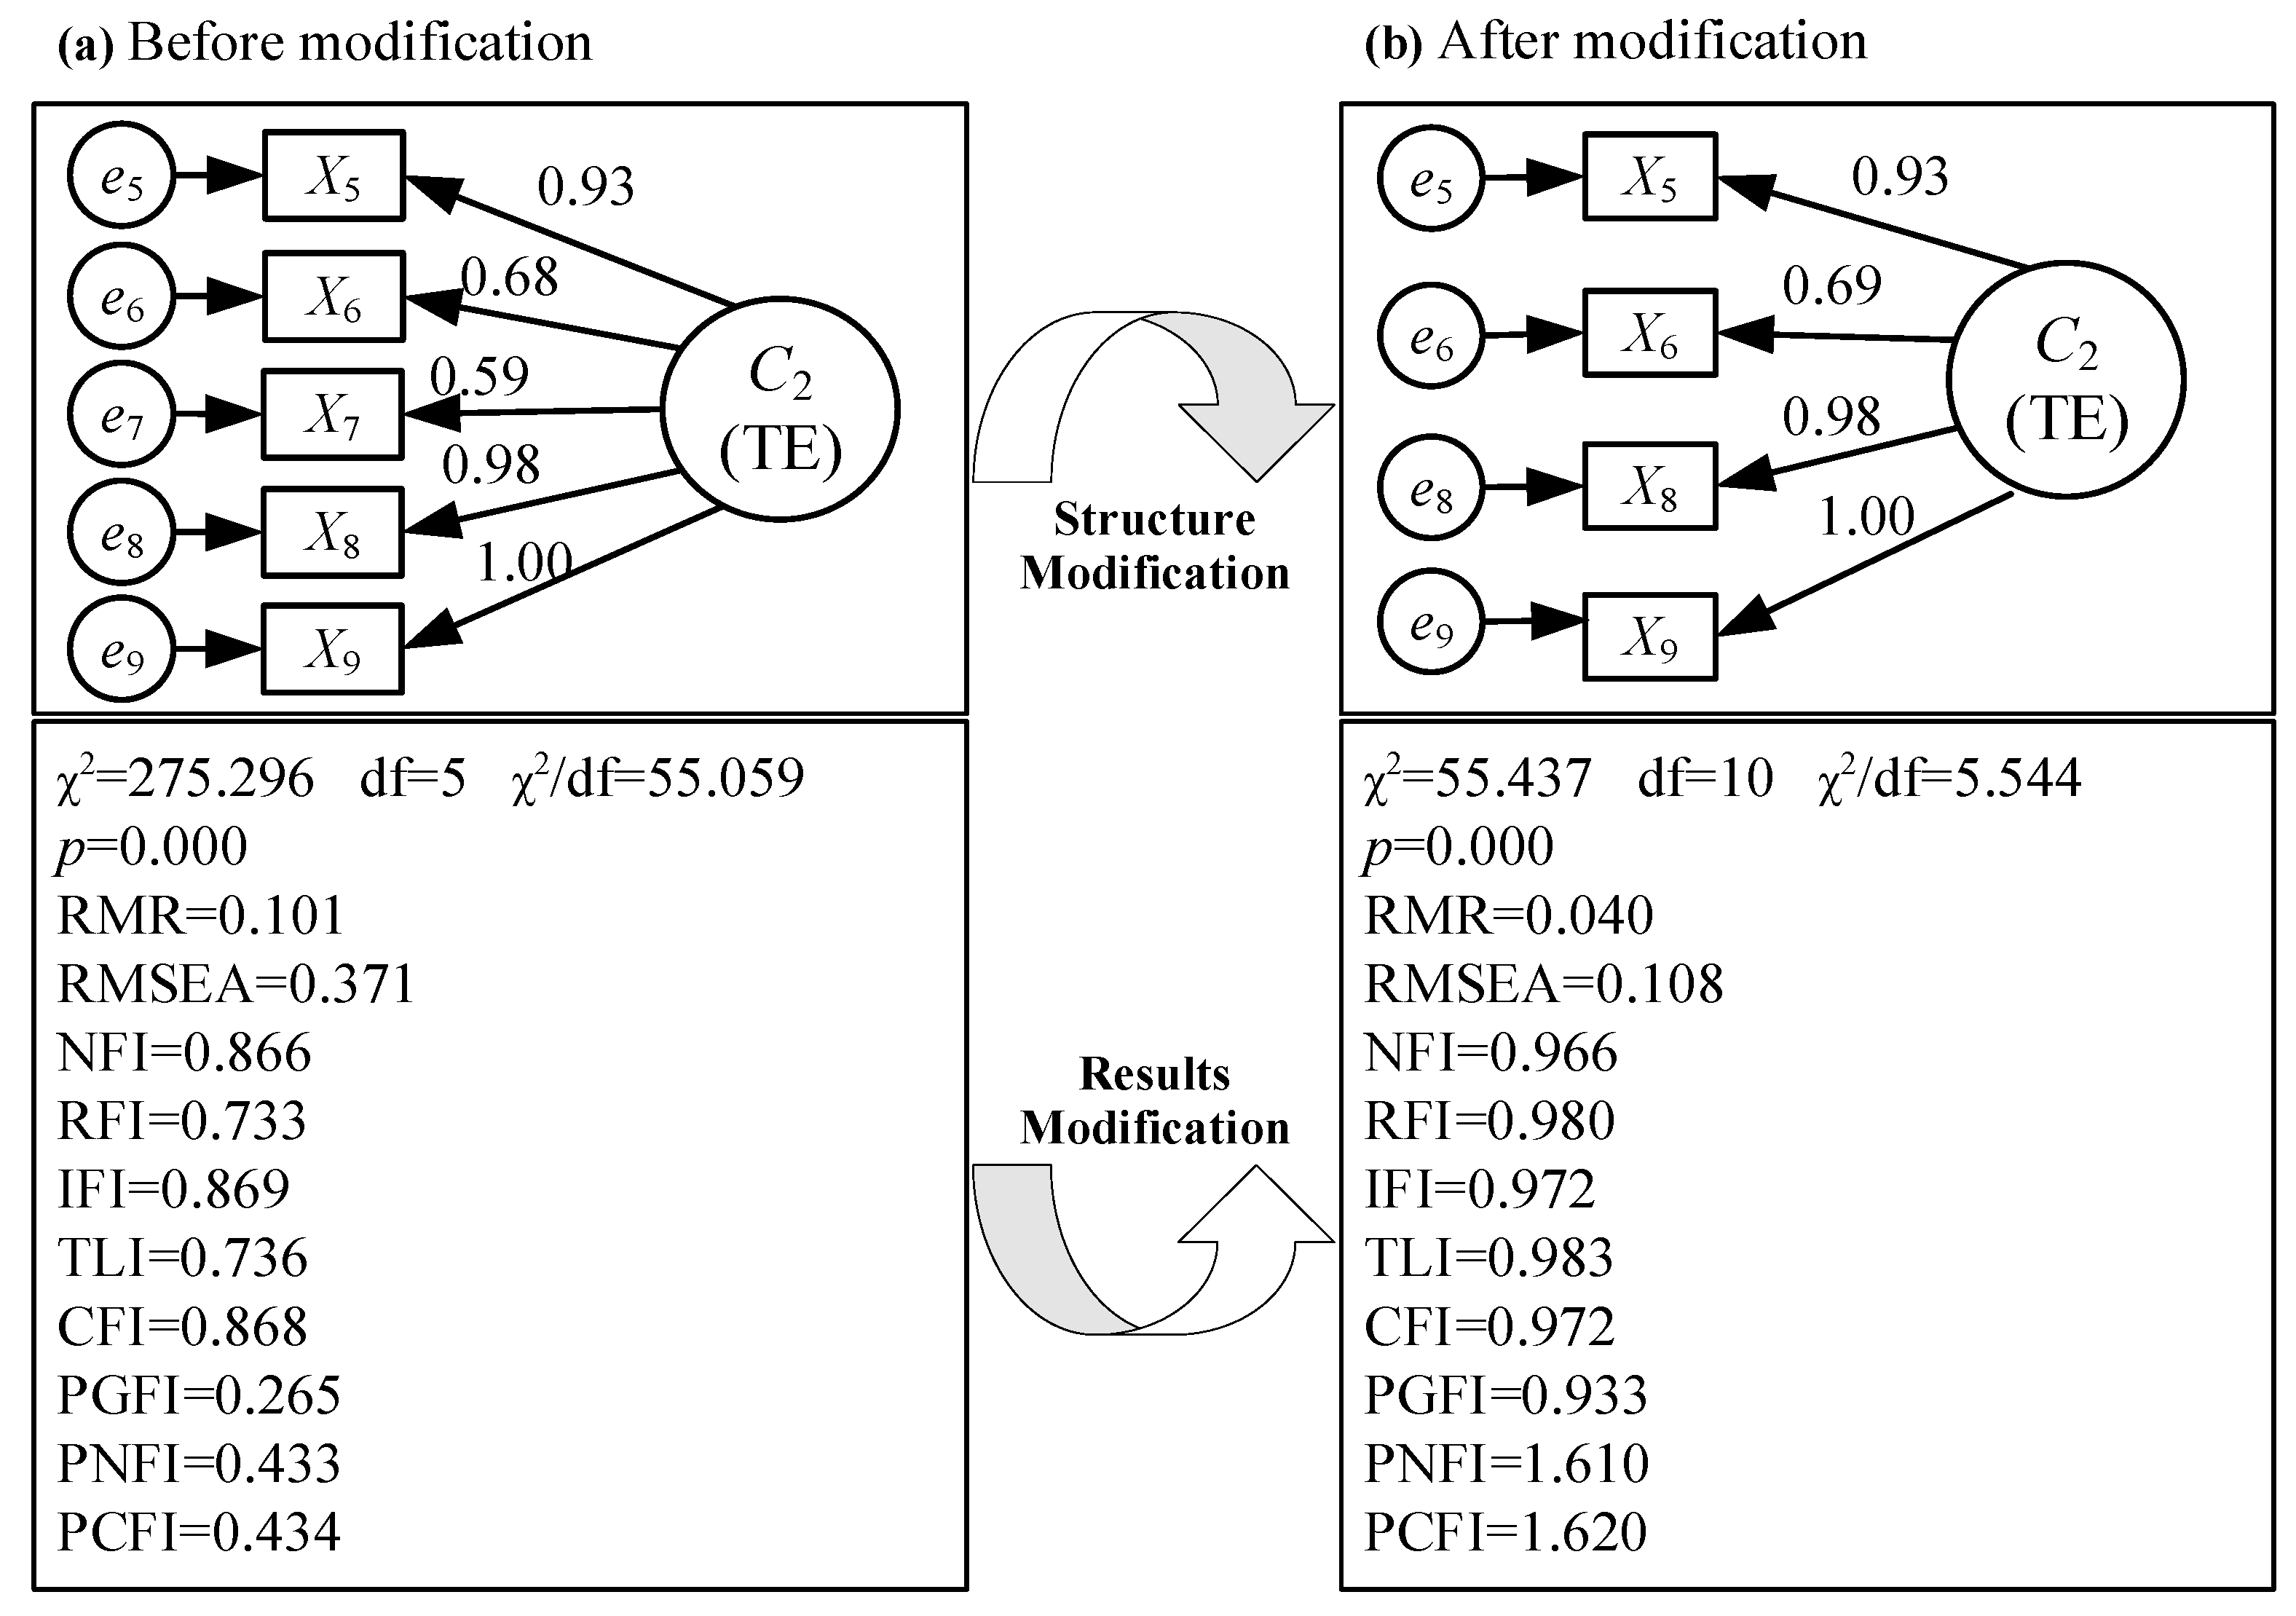
4.2. Step 2: Modification of SEM

To modify the initial SEM, the covariance, variance, and path coefficient were utilized as the modification parameters of the model. Combined with the MI index, the modification was repeated until all the GOF evaluation criteria were met. Taking C 2 (tunnel excavation) as an example, the modification process is shown in Figure 4.
According to an analysis of Figure 4a, only the initial SEM of C 2 passes the significance tests. After modifying the model using the MI value and deleting X 7 , Figure 4b shows that each index meets the verification criteria. χ 2 / d f , RMR, and RMSEA exhibit a decreasing trend, which is better aligned with the evaluation criteria. This indicates that the GOF indices of the C 2 model have been verified. Likewise, modification using the MI is repeated in other stages, and variables X 2 ,   X 11 ,   X 13 ,   X 14 ,   X 20 , and X 26 are deleted successively. The GOF test results of the modified SEM are listed in Table 7. An analysis of Table 7 reveals that the modified SEM always meets the fitting standard, indicative of the good overall fitting effect of the model. In summary, the modified SEM can quantitatively reflect causality between the CRS and PR.

4.3. Step 3: SEM Analysis

The CFA results show that the questionnaire and scale are designed reasonably. In addition, the results also indicate that the survey data have high explanatory power for the risk of the whole construction process of metro tunnels by the mining method. The results of the GOF analysis indicate that the questionnaire survey data are consistent with the hypothetical model. The results also show that the SEM conforms to the prevailing practical situation. The modified SEM was run again and the standardized path coefficient was determined, as shown in Figure 5.
Figure 5 shows that the standardized factor loading is mostly greater than 0.5 (excluding X 6 ,   X 10 , and X 23 ), and the standardized path coefficient is deemed significant. This indicates that the 19 research variables can be used as the quantitative indices for CSR in the six construction stages of metro tunnels constructed by the mining method. The correlation coefficients between the standardized path coefficient and the latent variables are shown in Table 8. According to an analysis of Table 8, the path coefficients of C 1 ,   C 2 ,   C 3 ,   C 4 ,   C 5 , and C 6 are all positive, which indicates that the CSR is positively correlated with the PR. In addition, the latent variables exhibit significant correlation coefficients, and can therefore be used to develop the FCM.

4.4. Step 4: Development of FCM

To study the dynamic evolving relationship between the CSR and the construction stages of metro tunnels constructed by the mining method, the causality and its path coefficient in the SEM were transformed to concept nodes and quantitative relationships in the FCM. Predictive reasoning and diagnostic reasoning were performed in the FCM. To simplify the research, the latent variables of the SEM were employed to develop the FCM. The six construction stages constituted by the CSR in the SEM were transformed into the cause concept nodes of the FCM, which are expressed by C i   ( i = 1 ,   2 ,   3 ,   4 ,   5 ,   6 ) . The PR in the SEM was transformed into the target concept node of the FCM, which is expressed by C T . The standardized path coefficients of the SEM in Table 8 were introduced by conversion into the connection matrix W i j of the FCM. In this way, the FCM based on the SEM was developed, as shown in Figure 6.

4.5. Step 5: Predictive Analysis of FCM

Predictive analysis is reasoning from the cause concept node to the target concept node, which aims to predict possible outcomes in the future according to the current evidence. In the FCM, the cause concept node is expressed by C i   ( i = 1 ,   2 ,   3 ,   4 ,   5 ,   6 ) and the target concept node is represented by C T . Based on the connection matrices between concept nodes C i and C T , the degree of influence of various construction stages on the PR is quantitatively predicted.
The cause concept node C i was valued according to the five-point verbal scale and then simulated. Taking C 2 (tunnel excavation) as an example, its initial value was set to one of five state values: −1 (very unfavorable), −0.5 (unfavorable), 0 (neutral), 0.5 (favorable), and 1 (very favorable). C 2 was set to different initial values (−1, −0.5, 0, 0.5, and 1). Except for C 2 , the initial values of the other cause concept nodes ( C 1 ,   C 2 ,   C 3 ,   C 4 ,   C 5 , and C 6 ) were all 0 and remained unchanged; the initial value of the target concept node was also 0 and remained unchanged. Throughout the simulation, the steady value of the target concept node C T was finally obtained. The predictive reasoning results of the state values of C i   ( i = 1 ,   2 ,   3 ,   4 ,   5 ,   6 ) and the corresponding steady values of C T are listed in Table 9. The predictive analysis of the FCM was run 30 times; iteration trends under different scenarios are illustrated in Figure 7.
Combining the analyses in Table 9 and Figure 7b, when C 2 = 1   ( or 0.5 ) , C T stabilizes at 0.7785   ( or 0.6583 ) after many iterations, as exemplified by the cause concept node C 2 , if C 2 = 1   ( or 0.5 ) , C T stabilizes at 0.7785   ( or 0.6583 ) after many iterations. This indicates that C 2 and C T are positively correlated. Similarly, after repeating the operation above, C 1 ,   C 3 ,   C 4 ,   C 5 , and C 6 are found to have positive correlations with C T . By comparing the steady values and rates of change of C T in different scenarios, Figure 7b–f shows the strongest correlation between C 2 and C T . According to the intensity of the correlations with C T , C 2 ,   C 1 ,   C 6   C 4 ,   C 3 , and C 5 are listed thus (in descending order). This indicates that controlling the key risks in construction stages, such as tunnel excavation ( C 2 ) and advanced support ( C T ) , is critical for ensuring construction safety.

4.6. Step 6: Diagnostic Analysis of FCM

Diagnostic analysis is reasoning from the target concept node to the cause concept node, which aims to explore the most possible causes leading to the occurrence of the known outcomes. In the FCM, the target concept node is expressed by C T and the cause concept node is expressed by C i   ( i = 1 ,   2 ,   3 ,   4 ,   5 ,   6 ) . Based on the connection matrices between concept nodes C i and C T , the construction stages that most likely cause changes in the PR are quantitatively diagnosed. In a diagnostic analysis of the FCM, it is necessary to reverse the arc of the nodes in the SEM while keeping the weight constant.
The target concept node C T was valued according to the five-point verbal scale and then simulated. The initial value of C T was set to one of five state values, namely, −1 (very unfavorable), −0.5 (unfavorable), 0 (neutral), 0.5 (favorable), and 1 (very favorable). C T was set to different initial values (−1, −0.5, 0, 0.5, and 1). Except for C T , the initial values of the cause concept nodes ( C 1 ,   C 2 ,   C 3 ,   C 4 ,   C 5 , and C 6 ) are all 0 (neutral) and remain unchanged. Throughout the simulation, the steady values of the cause concept node C i   ( i = 1 ,   2 ,   3 ,   4 ,   5 ,   6 ) were finally obtained. The diagnostic reasoning results are listed in Table 10. The diagnostic analysis of the FCM was run 30 times. The iteration trends under different scenarios are shown in Figure 8.
Combining the analyses of Table 10 and Figure 8a, C i   ( i = 1 ,   2 ,   3 ,   4 ,   5 ,   6 ) stabilizes at −0.7576 (0.7576), −0.7785 (0.7785), −0.5997 (0.5997), −0.7222 (0.7222), −0.5849 (0.5849), and −0.7267 (0.7267) after many iterations, as exemplified by the target concept node C T = 1   ( or + 1 ) . This suggests that C i is positively correlated with C T . Meanwhile, a comparison of the curve slopes of P ( C i | C T = 1 )   ( i = 1 ,   2 ,   3 ,   4 ,   5 ,   6 ) reveals that P ( C 2 | C T = 1 ) > P ( C 1 | C T = 1 ) > P ( C 6 | C T = 1 ) > P ( C 4 | C T = 1 ) > P ( C 3 | C T = 1 ) > P ( C 5 | C T = 1 ) . The diagnostic reasoning results are consistent with those arising from the predictive analysis. Figure 8b–d shows that similar results are obtained when comparing the curves of P ( C i | C T = 1 )   ( i = 1 ,   2 ,   3 ,   4 ,   5 ,   6 ) under the conditions of C T = 0.5 , + 0.5 , + 1 . The most possible cause for the changes in the target concept node C T is tunnel excavation ( C 2 ) , followed successively by advanced support ( C 1 ) , auxiliary measures ( C 6 ) , structure waterproofing ( C 4 ) , primary support ( C 3 ) , and secondary lining ( C 5 ) . This indicates the need to pay more attention to controlling the key risks in different construction stages, including tunnel excavation ( C 2 ) and advanced support ( C 1 ) .

5. Discussion

The proposed SEM–FCM hybrid model takes advantages of the SEM in building hierarchical causality and objective characterization of subjective data. It also combines with characteristics of the FCM in dynamic prediction and reasoning diagnosis. Therefore, it can integrate the identification of risk factors with the dynamic prediction and reasoning diagnosis, which leads to better conformity between risk evaluation and practical conditions in live projects. This provides a new perspective for the CSR management of metro tunnels constructed by the mining method.
Compared with existing research, the FCM in this study was developed using the SEM, which overcomes the drawback of a traditional FCM, with its over-dependence on the subjective ideas of experts. At the same time, it can also achieve a dynamic evolution analysis of the CSR of metro tunnels constructed by the mining method. An empirical analysis has proven that the proposed method is reliable, although it needs to be compared with other methods theoretically. Based on the SEM, the standardized path coefficient in Figure 5 is quantified using the analytic hierarchy process (AHP) [86]. The results are shown in Table 11: according to the risks, various stages are ranked in a descending order as C 2 > C 1 > C 6 > C 4 > C 3 > C 5 . The analytical results from the SEM–AHP hybrid method match the prediction and diagnostic analysis results arising from the use of the SEM–FCM hybrid model [87]. The analysis from the SEM–AHP hybrid method aligns with the conditions at the construction site, according to daily management reports. Similarly, the results from the SEM–FCM hybrid model also match the site’s conditions. We acknowledge the importance of validating theoretical methods with experimental or field data. In our future work, we plan to test the SEM with such data. We will then compare these results with those from the SEM–FCM and SEM–AHP methods. This will help us refine the effectiveness of our proposed methods.
Based on the combined analysis of the SEM–FCM and SEM–AHP models, we offer the following suggestions for CSR management in metro tunnel construction using the mining method:
(1) The use of macroscopic–microscopic and dynamic–static combined risk management is suggested. Construction stages should be ranked according to risks based on the quantification results of weight I using the SEM–AHP method [88]; the key stages with risks to be controlled need to be identified by combining data with the prediction and diagnostic analysis results of the SEM–FCM hybrid model. Based on the quantification results of weight II [86], the risks in each construction stage should be ranked, and control measures for the staged key risks should be implemented. The overall risks should be ranked based on the quantification results of weight III [87], facilitating identification of the key risks from the macroscopic perspective.
(2) Control of the staged key risks should be emphasized in each construction stage [89]. The risk control throughout the entire construction process of metro tunnels by the mining method should be enhanced. In addition, close attention should be paid to the key stages including tunnel excavation. The safety responsibility system needs to be implemented to eradicate safety and quality hazards. For example, research shows that the risk of the occurrence of over-excavation and under-excavation is the highest in the tunnel excavation stage. Therefore, specific construction plans need to be formulated in the construction organization plan and construction preparation stages. In addition, early-warning measures and refined risk management should be implemented.
(3) Throughout the construction process, risk management should be enhanced by combining multiple measures [90]. It is also necessary to implement health monitoring throughout the construction process; this should be dominated by intelligent methods. It is suggested to strengthen the perception of monitoring information and real-time data, and build the systematic Internet of Things for early-warning of CSR. Additionally, a third-party safety inspection system should be established at the construction site to ensure that reformation of daily illegal and dangerous operations takes place. In doing so, it is expected that safe construction practices will be implemented throughout the process.

6. Conclusions

The empirical analysis results are summarized as follows:
(1) In combining the discussion results from the joint analysis of the SEM–FCM model and the SEM–AHP model, we can see that the results reveal that, according to the weights and ranks of the risk factors in the construction process, the key risks in stage C 2 (tunnel excavation) should be the focus of the engineer’s attention. These include X 9 (over-excavation and under-excavation), X 8 (unreasonable determination of excavation footage and sequence), and X 5 (unreasonable selection of excavation methods).
(2) The risk predictive analysis of the FCM shows that the cause concept node C 2 (tunnel excavation) has the strongest positive correlation with the target concept node C T (PR). According to their risks, various stages are ranked (in descending order) as follows: C 2 (tunnel excavation), C 1 (advanced support), C 6 (auxiliary measures), C 4 (structure waterproofing), C 3 (primary support), and C 5 (secondary lining). The SEM and FCM show the most consistent CSR evaluation results. This indicates that controlling the key risks in construction stages, such as tunnel excavation and advanced support, is critical for ensuring safe construction.
(3) The risk diagnostic analysis of the FCM implies that the target concept node C T (PR) is most sensitive to changes in the risks of the cause concept node C 2 (tunnel excavation). Therefore, it is the tunnel excavation stage that is most likely to induce CSR in metro tunnels constructed using the mining method. The diagnostic analysis results of CSR using the FCM are highly consistent with the practical situation, which verifies the effectiveness of the model.

Author Contributions

Conceptualization, Q.W.; Methodology, Z.X., K.Z. and P.G.; Software, Z.X., K.Z. and P.G.; Validation, Z.X., K.Z. and P.G.; Formal analysis, Z.X., K.Z. and P.G.; Data curation, Z.X. and P.G.; Writing—original draft, Z.X., K.Z. and P.G.; Writing—review & editing, Z.X., K.Z. and P.G.; Supervision, Q.W.; Project administration, Q.W.; Funding acquisition, Q.W. All authors have read and agreed to the published version of the manuscript.

Funding

This research was funded by Hainan Province Major Science and Technology Plan Project, grant number ZDKJ2021021024, Major Science and Technology Project of Sanya Yazhou Bay Science and Technology City Management Bureau, grant number SKJC-KJ-2019KY02, The PhD Scientific Research and Innovation Foundation of Sanya Yazhou Bay Science and Technology City, grant number HSPHDSRF-2022-03-001, The PhD Scientific Research and Innovation Foundation of Sanya Yazhou Bay Science and Technology City, grant number HSPHDSRF-2023-03-001.

Conflicts of Interest

The authors declare no conflict of interest.

Nomenclature

Parameters
C1Advancing support
C2Tunnel excavation
C3Primary support
C4Structure waterproof
C5Secondary lining
C6Auxiliary measures
CSRConstruction safety risk
PRProject risk
Variables
η Endogenous variable
ξ Exogenous variable
Y Observational variable of endogenous variable
X Observational variable of exogenous variable
γ Action of exogenous variable on endogenous variable
β The relationship among endogenous variables
λ Factor loading
ζ Measurement error of endogenous variable
ε Measurement error of variable Y
δ Measurement error of variable X
Acronyms
CRComposite reliability
AVEAverage variance extraction
RMRRoot mean square residua
RMSEARoot mean square error of approximation
GFIGoodness of fit index
AGFIAdjusted goodness of fit index
IFIIncremental fit index
CFIComparative fit index
NFINormal fit index
TLITucker–Lewis index
PGFIParsimony good fit index
PNFIParsimony norm fit index
CMIN/DFDiscrepancy divided by degree of freedom

References

  1. Central People’s Government of Prc. The Fourteenth Five-Year Plan for National Economic and Social Development of the People’s Republic of China and the Outline of the Long-Term Goals for 2035 [Z]. 2021. Available online: http://www.gov.cn/xinwen/2021-03/13/content_5592681.htm (accessed on 5 April 2023).
  2. Ding, L.; Xu, J. A review of metro construction in China: Organization, market, cost, safety and schedule. Front. Eng. Manag. 2017, 4, 4–19. [Google Scholar] [CrossRef]
  3. Suo, Q.; Wang, L.; Yao, T.; Wang, Z. Promoting Metro Operation Safety by Exploring Metro Operation Accident Network. J. Syst. Sci. Inf. 2021, 9, 455–468. [Google Scholar] [CrossRef]
  4. Shi, X.; Liu, Y.; Zhang, D.; Li, R.; Qiao, Y.; Opoku, A.; Cui, C. Influencing Factors of Human Errors in Metro Construction Based on Structural Equation Modeling (SEM). Buildings 2022, 12, 1498. [Google Scholar] [CrossRef]
  5. Liu, B.; Li, T.; Chang, W.; Han, Y.; Fu, C.; Yu, Z. Mechanical response of horseshoe-shaped tunnel lining to undercrossing construction of a new subway station. Tunn. Undergr. Space Technol. 2022, 128, 104652. [Google Scholar] [CrossRef]
  6. Kim, D.; Pham, K.; Oh, J.-Y.; Lee, S.-J.; Choi, H. Classification of surface settlement levels induced by TBM driving in urban areas using random forest with data-driven feature selection. Autom. Constr. 2022, 135, 104109. [Google Scholar] [CrossRef]
  7. Dai, C.-Q.; Zhao, Z.-H. Fuzzy comprehensive evaluation model for construction risk analysis in urban subway. Int. J. Model. Simul. Sci. Comput. 2015, 6, 17–34. [Google Scholar] [CrossRef]
  8. Mehryar, S.; Surminski, S. Investigating flood resilience perceptions and supporting collective decision-making through fuzzy cognitive mapping. Sci. Total. Environ. 2022, 837, 155854. [Google Scholar] [CrossRef]
  9. Wang, Q.; Zhu, K.; Wang, J.; Guo, P.; Shen, W. Bibliometric analysis of engineering project risk management literature. Chin. J. Saf. Sci. 2021, 31, 15–23. [Google Scholar] [CrossRef]
  10. Fang, Q.; Zhang, D.; Hou, Y.; Li, B.; Sun, F. Safety risk control technology of urban subway with shallow tunnel construction method. J. Beijing Jiaotong Univ. 2010, 34, 16–21. [Google Scholar]
  11. Gui, D.; Tong, J.; Wang, M.; Deng, K.; Zhao, S. Safety evaluation of support structure of the tunnel excavated by mining method with arching and backfilling. Mod. Tunn. Technol. 2020, 57, 110–116. [Google Scholar] [CrossRef]
  12. Wu, B.; Cai, Q.; Liu, C.; Hunag, W.; Xie, Y. Multi-scale evaluation model and application of safety risk in urban subway station construction. J. Saf. Environ. 2023, 23, 633–641. [Google Scholar] [CrossRef]
  13. Saedi, A.; Majid, A.A.; Isa, Z. Relationships between safety climate and safety participation in the petroleum industry: A structural equation modeling approach. Saf. Sci. 2019, 121, 240–248. [Google Scholar] [CrossRef]
  14. Liu, J.; Zhao, X.; Yan, P. Risk Paths in International Construction Projects: Case Study from Chinese Contractors. J. Constr. Eng. Manag. 2016, 142, 016002. [Google Scholar] [CrossRef]
  15. Gunduz, M.; Birgonul, M.T.; Ozdemir, M. Development of a safety performance index assessment tool by using a fuzzy structural equation model for construction sites. Autom. Constr. 2018, 85, 124–134. [Google Scholar] [CrossRef]
  16. Zhang, J.; Xiang, P.; Zhang, R.; Chen, D.; Ren, Y. Mediating Effect of Risk Propensity between Personality Traits and Unsafe Behavioral Intention of Construction Workers. J. Constr. Eng. Manag. 2020, 146, 04020023. [Google Scholar] [CrossRef]
  17. Fonseca, J.P.; Ferreira, F.A.; Pereira, L.F.; Govindan, K.; Meidutė-Kavaliauskienė, I. Analyzing determinants of environmental conduct in small and medium-sized enterprises: A sociotechnical approach. J. Clean. Prod. 2020, 256, 120380. [Google Scholar] [CrossRef]
  18. Morone, P.; Yilan, G.; Imbert, E. Using fuzzy cognitive maps to identify better policy strategies to valorize organic waste flows: An Italian case study. J. Clean. Prod. 2021, 319, 128722. [Google Scholar] [CrossRef]
  19. Soner, O.; Asan, U.; Celik, M. Use of HFACS–FCM in fire prevention modelling on board ships. Saf. Sci. 2015, 77, 25–41. [Google Scholar] [CrossRef]
  20. Khanzadi, M.; Nasirzadeh, F.; Dashti, M.S. Fuzzy Cognitive Map Approach to Analyze Causes of Change Orders in Construction Projects. J. Constr. Eng. Manag. 2018, 144, 04017111. [Google Scholar] [CrossRef]
  21. Wang, L.; Liu, Q.; Dong, S.; Soares, C.G. Effectiveness assessment of ship navigation safety countermeasures using fuzzy cognitive maps. Saf. Sci. 2019, 117, 352–364. [Google Scholar] [CrossRef]
  22. Amirkhani, A.; Nasiriyan-Rad, H.; Papageorgiou, E.I. A Novel Fuzzy Inference Approach: Neuro-fuzzy Cognitive Map. Int. J. Fuzzy Syst. 2019, 22, 859–872. [Google Scholar] [CrossRef]
  23. Ding, L.; Zhang, L.; Wu, X.; Skibniewski, M.J.; Qunzhou, Y. Safety management in tunnel construction: Case study of Wuhan metro construction in China. Saf. Sci. 2014, 62, 8–15. [Google Scholar] [CrossRef]
  24. Zhai, Q.; Gu, W.; Jin, Z. Safety risk assessment for a subway connecting passage constructed by freezing method. Mod. Tunn. Technol. 2021, 58, 57–66. [Google Scholar] [CrossRef]
  25. Kang, J.; Zhang, J.; Gao, J. Improving performance evaluation of health, safety and environment management system by combining fuzzy cognitive maps and relative degree analysis. Saf. Sci. 2016, 87, 92–100. [Google Scholar] [CrossRef]
  26. Keshtiban, P.M.; Onari, M.A.; Shokri, K.; Rezaee, M.J. Enhancing risk assessment of manufacturing production process integrating failure modes and sequential fuzzy cognitive map. Qual. Eng. 2022, 34, 191–204. [Google Scholar] [CrossRef]
  27. Toutounchian, S.; Abbaspour, M.; Dana, T.; Abedi, Z. Design of a safety cost estimation parametric model in oil and gas engineering, procurement and construction contracts. Saf. Sci. 2018, 106, 35–46. [Google Scholar] [CrossRef]
  28. Hillson, D. Using a Risk Breakdown Structure in project management. J. Facil. Manag. 2003, 2, 85–97. [Google Scholar] [CrossRef]
  29. Hamzaoui, F.; Taillandier, F.; Mehdizadeh, R.; Breysse, D.; Allal, A. Evolutive Risk Breakdown Structure for managing construction project risks: Application to a railway project in Algeria. Eur. J. Environ. Civ. Eng. 2014, 19, 238–262. [Google Scholar] [CrossRef]
  30. Yue, J.; Leng, W.; An, Y.; Liu, Y.; Luo, H. Mechanical behavior and construction measures of transfixing safely to underwater tunnels with small clear spacing by shallow mining method. J. Nat. Disasters 2016, 25, 142–151. [Google Scholar] [CrossRef]
  31. Leung, T.; Chen, J. Application of new Austrian tunnelling method to a large span trinocular cross section tunnel. Chin. J. Rock Mech. Eng. 2017, 36, 2755–2766. [Google Scholar] [CrossRef]
  32. Song, Z.; Su, W.; Tian, X.; Zhang, Y.; Zhou, G. Risk Analysis of Tunnel Construction Scheme Change based on Field Monitoring and Numerical Analysis. Adv. Civ. Eng. 2021, 2021, 1–15. [Google Scholar] [CrossRef]
  33. Wang, C.; Zhu, F.; Luo, X.; Zhang, C.; Tian, J.; Li, H.; Guo, Y. Study on construction risk assessment of tunnel reconstruction and expansion works. Mod. Tunn. Technol. 2021, 58, 63–70. [Google Scholar] [CrossRef]
  34. Zhang, X.; Wang, M.; Zhou, B.; Wang, X. Influence of factors on collapse risk of loess tunnel: A multi-index assessment model. J. Eng. Des. Technol. 2018, 16, 734–749. [Google Scholar] [CrossRef]
  35. Xu, Y.; Yu, S.; Zhang, Y. Detection and recognition of support structure diseases of metro tunnel constructed by mining method based on forward modeling. Tunn. Constr. 2017, 37, 179–184. [Google Scholar] [CrossRef]
  36. Bai, P. Settlement control techniques of the super-shallow buried large-span mined tunnel underneath an existing tunnel. Mod. Tunn. Technol. 2020, 57, 175–181. [Google Scholar] [CrossRef]
  37. Liu, B.; Ye, W.; Zhu, C.; Chen, R.; Huang, S.; Ni, X. Analysis on Treatment Effect of Mine Tunnel Construction Spring in Karst Area. Math. Probl. Eng. 2021, 2021, 5585054. [Google Scholar] [CrossRef]
  38. Rahimi, B.; Sharifzadeh, M.; Feng, X.-T. A comprehensive underground excavation design (CUED) methodology for geotechnical engineering design of deep underground mining and tunneling. Int. J. Rock Mech. Min. Sci. 2021, 143, 104684. [Google Scholar] [CrossRef]
  39. Meye, S.M.; Shen, Z. Numerical Simulation of the Influence of Tunnel Construction by Mining Method on the Seepage Field in Weathered Granite Stratum. Engineering 2020, 12, 424–456. [Google Scholar] [CrossRef]
  40. He, M.; Sui, Q.; Li, M.; Wang, Z.; Tao, Z. Compensation excavation method control for large deformation disaster of mountain soft rock tunnel. Int. J. Min. Sci. Technol. 2022, 32, 951–963. [Google Scholar] [CrossRef]
  41. Zheng, G.; Wang, R.; Lei, H.; Zhang, T.; Li, H. A novel sequential excavation method for constructing large-cross-section tunnels in soft ground: Practice and theory. Tunn. Undergr. Space Technol. 2022, 128, 104626. [Google Scholar] [CrossRef]
  42. Qiu, D.; Qu, C.; Xue, Y.; Zhou, B.; Li, X.; Ma, X.; Cui, J. A Comprehensive Assessment Method for Safety Risk of Gas Tunnel Construction Based on Fuzzy Bayesian Network. Pol. J. Environ. Stud. 2020, 29, 4269–4289. [Google Scholar] [CrossRef]
  43. Huang, F.; Gao, X. Study on the structural stability of mined tunnels with double-layer initial supporting arch cover in soil-rock composite strata based on the arch section constructed by SD method. Mod. Tunn. Technol. 2021, 58, 37–45. [Google Scholar] [CrossRef]
  44. Huang, M.; Song, Y.; Zhang, X.; Sun, T. Experimental study and engineering application of the spatial reticulated grid bolt-shotcrete support structure for excavation tunnels. Appl. Sci. 2022, 12, 8506. [Google Scholar] [CrossRef]
  45. Gong, C.; Kang, L.; Liu, L.; Lei, M.; Ding, W.; Yang, Z. A novel prediction model of packing density for single and hybrid steel fiber-aggregate mixtures. Powder Technol. 2023, 418, 118295. [Google Scholar] [CrossRef]
  46. Wang, X.; Li, S.; Xu, Z.; Hu, J.; Pan, D.; Xue, Y. Risk assessment of water inrush in karst tunnels excavation based on normal cloud model. Bull. Eng. Geol. Environ. 2018, 78, 3783–3798. [Google Scholar] [CrossRef]
  47. Pelz, U.; Karlovek, J. Spray-applied waterproofing membranes in tunnelling: Application and research directions in Australia. Tunn. Undergr. Space Technol. 2022, 122, 104364. [Google Scholar] [CrossRef]
  48. Ai, Q.; Yuan, Y.; Jiang, X.; Wang, H.; Han, C.; Huang, X.; Wang, K. Pathological diagnosis of the seepage of a mountain tunnel. Tunn. Undergr. Space Technol. 2022, 128, 104657. [Google Scholar] [CrossRef]
  49. Luciani, A.; Peila, D. Tunnel Waterproofing: Available Technologies and Evaluation Through Risk Analysis. Int. J. Civ. Eng. 2018, 17, 45–59. [Google Scholar] [CrossRef]
  50. Fan, H.; Zhu, Z.; Song, Y.; Zhang, S.; Zhu, Y.; Gao, X.; Hu, Z.; Guo, J.; Han, Z. Water pressure evolution and structural failure characteristics of tunnel lining under hydrodynamic pressure. Eng. Fail. Anal. 2021, 130, 105747. [Google Scholar] [CrossRef]
  51. Tian, H. Technology for secondary lining of large-span flat-roof straight-wall tunnels. Tunn. Constr. 2015, 35, 268–273. [Google Scholar] [CrossRef]
  52. Wang, S.; Wang, Y.; Lin, Z.; Song, Z.; Wang, X.; Peng, X. Analysis of the influence of the thickness insufficiency in secondary lining on the mechanical properties of Double-layer lining of shield tunnel. Eng. Fail. Anal. 2022, 141, 106663. [Google Scholar] [CrossRef]
  53. Wang, Y.; Olgun, C.G.; Wang, L.; Meng, B. Risk Assessment of Water Inrush in Karst Tunnels Based on the Ideal Point Method. Pol. J. Environ. Stud. 2018, 28, 901–911. [Google Scholar] [CrossRef]
  54. Kang, X.-B.; Luo, S.; Li, Q.-S.; Xu, M.; Li, Q. Developing a risk assessment system for gas tunnel disasters in China. J. Mt. Sci. 2017, 14, 1751–1762. [Google Scholar] [CrossRef]
  55. Ghorbani, M.; Sharifzadeh, M.; Yasrobi, S.; Daiyan, M. Geotechnical, structural and geodetic measurements for conventional tunnelling hazards in urban areas—The case of Niayesh road tunnel project. Tunn. Undergr. Space Technol. 2012, 31, 1–8. [Google Scholar] [CrossRef]
  56. Jalali, S.; Forouhandeh, S. Reliability estimation of auxiliary ventilation systems in long tunnels during construction. Saf. Sci. 2011, 49, 664–669. [Google Scholar] [CrossRef]
  57. Guo, L.; Nie, W.; Liu, Q.; Hua, Y.; Xue, Q.; Sun, N. Study on the coupling pollution law of dust and gas and determination of the optimal purification position of air duct during tunnel excavation. Powder Technol. 2022, 411, 117843. [Google Scholar] [CrossRef]
  58. Newaz, M.T.; Davis, P.; Jefferies, M.; Pillay, M. The psychological contract: A missing link between safety climate and safety behaviour on construction sites. Saf. Sci. 2018, 112, 9–17. [Google Scholar] [CrossRef]
  59. Gracia, F.J.; Tomás, I.; Martínez-Córcoles, M.; Peiró, J.M. Empowering leadership, mindful organizing and safety performance in a nuclear power plant: A multilevel structural equation model. Saf. Sci. 2019, 123, 104542. [Google Scholar] [CrossRef]
  60. Zhao, Y.; Zhang, M.; Liu, T.; Mebarki, A. Impact of safety attitude, safety knowledge and safety leadership on chemical industry workers’ risk perception based on Structural Equation Modelling and System Dynamics. J. Loss Prev. Process. Ind. 2021, 72, 104542. [Google Scholar] [CrossRef]
  61. Hussain, S.; FangWei, Z.; Ali, Z. Examining Influence of Construction Projects’ Quality Factors on Client Satisfaction Using Partial Least Squares Structural Equation Modeling. J. Constr. Eng. Manag. 2019, 145, 5019006. [Google Scholar] [CrossRef]
  62. Paraschi, E.P.; Georgopoulos, A.; Papanikou, M. Safety and security implications of crisis-driven austerity HRM practices in commercial aviation: A structural equation modelling approach. Saf. Sci. 2021, 147, 105570. [Google Scholar] [CrossRef]
  63. Mohandes, S.R.; Kineber, A.F.; Abdelkhalek, S.; Kaddoura, K.; Elsayed, M.; Hosseini, M.R.; Zayed, T. Evaluation of the critical factors causing sewer overflows through modeling of structural equations and system dynamics. J. Clean. Prod. 2022, 375, 134035. [Google Scholar] [CrossRef]
  64. Hayes, A.F.; Montoya, A.K.; Rockwood, N.J. The Analysis of Mechanisms and Their Contingencies: Process versus Structural Equation Modeling. Australas. Mark. J. 2017, 25, 76–81. [Google Scholar] [CrossRef]
  65. Hair, J.F.; Howard, M.C.; Nitzl, C. Assessing measurement model quality in PLS-SEM using confirmatory composite analysis. J. Bus. Res. 2019, 109, 101–110. [Google Scholar] [CrossRef]
  66. Gefen, D.; Straub, D.; Boudreau, M.-C. Structural equation modeling and regression: Guidelines for research practice. Commun. Assoc. Inf. Syst. 2000, 4, 1–70. [Google Scholar] [CrossRef]
  67. Bagozzi, R.P.; Yi, Y. On the evaluation of structural equation models. J. Acad. Mark. Sci. 1988, 16, 74–94. [Google Scholar] [CrossRef]
  68. Henseler, J.; Hubona, G.; Ray, P.A. Using PLS path modeling in new technology research: Updated guidelines. Ind. Manag. Data Syst. 2016, 116, 2–20. [Google Scholar] [CrossRef]
  69. Hopper, D.; Coughlan, J.; Mullen, M.R. Structural equation modeling: Guidelines for determining model fit. Electron. J. Bus. Res. Methods 2008, 6, 53–60. [Google Scholar] [CrossRef]
  70. Miles, J.; Shevlin, M. A time and a place for incremental fit indices. Pers. Individ. Differ. 2007, 42, 869–874. [Google Scholar] [CrossRef]
  71. Kosko, B. Fuzzy cognitive maps. Int. J. Man-Mach. Stud. 1986, 24, 65–75. [Google Scholar] [CrossRef]
  72. Chen, H.; Zhang, L.; Wu, X. Performance risk assessment in public–private partnership projects based on adaptive fuzzy cognitive map. Appl. Soft Comput. 2020, 93, 106413. [Google Scholar] [CrossRef]
  73. Osoba, O.A.; Kosko, B. Fuzzy cognitive maps of public support for insurgency and terrorism. J. Def. Model. Simul. Appl. Methodol. Technol. 2017, 14, 17–32. [Google Scholar] [CrossRef]
  74. Luo, L.; Wu, X.; Hong, J.; Wu, G. Fuzzy Cognitive Map-Enabled Approach for Investigating the Relationship between Influencing Factors and Prefabricated Building Cost Considering Dynamic Interactions. J. Constr. Eng. Manag. 2022, 148, 04022081. [Google Scholar] [CrossRef]
  75. Zhang, L.; Chettupuzha, A.A.; Chen, H.; Wu, X.; AbouRizk, S.M. Fuzzy cognitive maps enabled root cause analysis in complex projects. Appl. Soft Comput. 2017, 57, 235–249. [Google Scholar] [CrossRef]
  76. Zhao, X.; Pan, W.; Chen, L. Disentangling the relationships between business model innovation for low or zero carbon buildings and its influencing factors using structural equation modelling. J. Clean. Prod. 2018, 178, 154–165. [Google Scholar] [CrossRef]
  77. Skład, A. Assessing the impact of processes on the Occupational Safety and Health Management System’s effectiveness using the fuzzy cognitive maps approach. Saf. Sci. 2019, 117, 71–80. [Google Scholar] [CrossRef]
  78. Stylios, C.; Groumpos, P. Modeling Complex Systems Using Fuzzy Cognitive Maps. IEEE Trans. Syst. Man Cybern. Part A Syst. Hum. 2004, 34, 155–162. [Google Scholar] [CrossRef]
  79. Wuhan Metro Group. Group Profile [Z]. 2022. Available online: https://www.wuhanrt.com/public_forward.aspx??url=about.aspx?dtag=menu_index_1 (accessed on 5 April 2023).
  80. Marsh, H.; Hau, K.-T.; Balla, J.R.; Grayson, D. Is More Ever Too Much? The Number of Indicators per Factor in Confirmatory Factor Analysis. Multivar. Behav. Res. 1998, 33, 181–220. [Google Scholar] [CrossRef]
  81. Jones, W.P.; Loe, S.A. Optimal number of questionnaire response categories: More may not be better. SAGE Open 2013, 3, 2158244013489691. [Google Scholar] [CrossRef]
  82. Vickers, Z.M.; Christensen, C.M.; Fahrenholtz, S.K.; Gengler, I.M. Effect of questionnaire design and the number of samples tasted on hedonic ratings. J. Sens. Stud. 1993, 8, 189–200. [Google Scholar] [CrossRef]
  83. Masters, E.R. The relationship between number of response categories and reliability of likert-type questionnaires1. J. Educ. Meas. 1974, 11, 49–53. [Google Scholar] [CrossRef]
  84. Srivastava, M. A measure of skewness and kurtosis and a graphical method for assessing multivariate normality. Stat. Probab. Lett. 1984, 2, 263–267. [Google Scholar] [CrossRef]
  85. Liang, J.; Tang, M.-L.; Zhao, X. Testing high-dimensional normality based on classical skewness and Kurtosis with a possible small sample size. Commun. Stat. Theory Methods 2018, 48, 5719–5732. [Google Scholar] [CrossRef]
  86. Guo, X.; Kapucu, N. Assessing social vulnerability to earthquake disaster using rough analytic hierarchy process method: A case study of Hanzhong City, China. Saf. Sci. 2020, 125, 104625. [Google Scholar] [CrossRef]
  87. Han, Y.; Zhou, R.; Geng, Z.; Bai, J.; Ma, B.; Fan, J. A novel data envelopment analysis cross-model integrating interpretative structural model and analytic hierarchy process for energy efficiency evaluation and optimization modeling: Application to ethylene industries. J. Clean. Prod. 2019, 246, 118965. [Google Scholar] [CrossRef]
  88. Koulinas, G.; Marhavilas, P.; Demesouka, O.; Vavatsikos, A.; Koulouriotis, D. Risk analysis and assessment in the worksites using the fuzzy-analytical hierarchy process and a quantitative technique—A case study for the Greek construction sector. Saf. Sci. 2018, 112, 96–104. [Google Scholar] [CrossRef]
  89. Bieder, C. Safety science: A situated science: An exploration through the lens of safety management systems. Saf. Sci. 2020, 135, 105063. [Google Scholar] [CrossRef]
  90. Xu, N.; Chang, H.; Xiao, B.; Zhang, B.; Li, J.; Gu, T. Relation Extraction of Domain Knowledge Entities for Safety Risk Management in Metro Construction Projects. Buildings 2022, 12, 1633. [Google Scholar] [CrossRef]
Figure 1. FCM structure based on SEM.
Buildings 13 01335 g001
Figure 2. Metro lines in Wuhan metro system: (a) map of Wuhan metro system in 2021; (b) the location of XHS in Metro Line 8; (c) the tunnel under construction by the mining method in XHS.
Buildings 13 01335 g002
Figure 3. Statistical results of experts.
Buildings 13 01335 g003
Figure 4. Measurement results of safety risk model.
Buildings 13 01335 g004
Figure 5. SEM of safety risk in metro tunnel constructed by the mining method.
Buildings 13 01335 g005
Figure 6. The FCM model based on SEM model.
Buildings 13 01335 g006
Figure 7. Prediction analysis based on cause concept node.
Buildings 13 01335 g007
Figure 8. Diagnosis analysis based on the target concept node.
Buildings 13 01335 g008
Table 2. Questionnaire survey standard.
CategoryScoreLevelCriteria
CSR1Not ImportantThis index is not important for the safety of the mine tunnelling method of tunnel construction.
2Less ImportantThis index is less important for the safety of the mine tunnelling method of tunnel construction.
3NeutralThis index has neutral importance with regard to the safety of the mine tunnelling method of tunnel construction.
4More ImportantThis index is more important for the safety of the mine tunnelling method of tunnel construction.
5ImportantThis index is important for the safety of the mine tunnelling method of tunnel construction.
PR1Extremely DissatisfiedProject participants are extremely dissatisfied with the project risk control.
2DissatisfiedProject participants are dissatisfied with the project risk control.
3NeutralProject participants have a neutral attitude about the project risk control.
4SatisfiedProject participants are satisfied with the project risk control.
5Very satisfiedProject participants are extremely satisfied with the project risk control.
Table 3. The goodness-of-fit criteria for SEM.
Tests StatisticMeaningFitness Test Standard
Absolute Fit IndicesRMRRoot mean square residua<0.05
RMSEARoot mean square error of approximation<0.05
GFIGoodness of fit index>0.9
AGFIAdjusted goodness of fit index>0.9
Relative Fit IndexIFIIncremental fit index>0.9
CFIComparative fit index>0.9
NFINormal fit index>0.9
TLITucker–Lewis index>0.9
Parsimony Fit IndexPGFIParsimony good fit index>0.9
PNFIParsimony norm fit index>0.9
CMIN/DFDiscrepancy divided by degree of freedom<3
Table 4. Descriptive outline of the measures.
MeasuresMean StatisticSD StatisticSkewnessKurtosis
StatisticSDStatisticSD
X 1 3.34011.01694−0.1660.1230.0340.245
X 2 3.41121.02313−0.1740.123−0.0780.245
X 3 3.38831.03573−0.1690.123−0.0860.245
X 4 3.44421.01800−0.1170.123−0.2200.245
X 5 3.15231.047060.0660.123−0.4920.245
X 6 2.40101.041920.5910.123−0.2940.245
X 7 2.73350.926040.1090.123−0.0590.245
X 8 3.10661.020810.0160.123−0.1700.245
X 9 3.11931.025620.0010.123−0.1940.245
X 10 3.29191.03800−0.0720.123−0.1950.245
X 11 2.34771.037910.7340.1230.2090.245
X 12 3.22840.99802−0.1310.123−0.2130.245
X 13 3.72341.08523−0.6810.123−0.1670.245
X 14 3.29951.07322−0.2590.123−0.2740.245
X 15 2.98731.010050.3380.123−0.2540.245
X 16 3.00761.068850.2990.123−0.4570.245
X 17 2.97971.016200.3620.123−0.2680.245
X 18 2.92391.069730.1520.123−0.3190.245
X 19 3.05331.127810.0120.123−0.5330.245
X 20 2.96951.111630.0940.123−0.5500.245
X 21 3.50511.13524−0.4010.123−0.8310.245
X 22 2.29191.067010.7990.1230.0590.245
X 23 1.96450.977490.6630.123−0.3750.245
X 24 3.52281.04150−0.5640.123−0.2780.245
X 25 3.30201.06178−0.1140.123−0.4670.245
X 26 2.10151.008790.8270.1230.1910.245
R 1 2.97461.204050.0930.123−0.7680.245
R 2 3.00001.130200.2550.123−0.5940.245
R 3 2.97721.153370.1450.123−0.6030.245
R 4 2.73861.202280.2760.123−0.6290.245
R 5 2.90611.125150.2180.123−0.5010.245
Table 5. CFA results of the questionnaire survey samples.
VariablesItemRotated Component MatrixR2AVECR
C 1
(Advanced support)
X 1 0.8790.7730.7380.918
X 2 0.8580.736
X 3 0.8620.743
X 4 0.8370.701
C 2
(Tunnel excavation)
X 5 0.8850.7830.7000.921
X 6 0.790.624
X 7 0.7850.616
X 8 0.8490.721
X 9 0.8690.755
C 3
(Primary support)
X 10 0.7750.6010.5350.849
X 11 0.5080.258
X 12 0.7620.581
X 13 0.7290.531
X 14 0.8400.706
C 4
(Structure waterproofing)
X 15 0.9450.8930.8680.963
X 16 0.9240.854
X 17 0.9250.856
X 18 0.9320.869
C 5
(Secondary lining)
X 19 0.9110.8300.6240.866
X 20 0.8950.801
X 21 0.5780.334
X 22 0.7280.530
C 6
(Auxiliary measures)
X 23 0.7550.5700.6120.862
X 24 0.8550.731
X 25 0.8480.719
X 26 0.6550.429
P R
(Project risk)
R 1 0.8850.7830.7190.927
R 2 0.8420.709
R 3 0.8590.738
R 4 0.7880.621
R 5 0.8620.743
Note(s): Cronbach α = 0.918; KMO = 0.853, P = 0.000.
Table 6. Results of the GOF analysis for the initial model.
Types of Fit IndicesIndicatorsFit CriteriaBefore ModificationTest Results
Absolute fit indicesRoot mean square residual (RMR)≤0.080.051YES
Root mean square error of approximation (RMSEA)≤0.080.074YES
Goodness-of-fit index (GFI)≥0.800.844YES
Adjusted goodness-of-fit index (AGFI)≥0.800.807YES
Relative fit indicesNormal fit index (NFI)≥0.800.909YES
Relative fit index (RFI)≥0.900.895NO
Incremental fit index (IFI)≥0.900.936YES
Tucker–Lewis index (TLI)≥0.900.926YES
Comparative fit index (CFI)≥0.900.935YES
Parsimony fit indicesParsimonious goodness-fit-index (PGFI)≥0.500.684YES
Parsimonious normed fit index (PNFI)≥0.500.791YES
Parsimonious comparative-fit-index (PCFI)≥0.500.814YES
Chi-square/degree of freedom (χ2/df)≤33.151NO
Table 7. Results of the GOF analysis for modification SEM.
TypesIndicatorsFit CriteriaBefore After Results
Absolute fit indicesRoot mean square residual (RMR)≤0.080.0510.048YES
Root mean square error of approximation (RMSEA)≤0.080.0740.067YES
Goodness-of-fit index (GFI)≥0.800.8440.881YES
Adjusted goodness-of-fit index (AGFI)≥0.800.8070.845YES
Relative fit indicesNormal fit index (NFI)≥0.800.9090.929YES
Relative fit index (RFI)≥0.900.8950.917YES
Incremental fit index (IFI)≥0.900.9360.954YES
Tucker—Lewis index (TLI)≥0.900.9260.944YES
Comparative fit index (CFI)≥0.900.9350.953YES
Parsimony fit indicesParsimonious goodness-fit-index (PGFI)≥0.500.6840.678YES
Parsimonious normed fit index (PNFI)≥0.500.7910.778YES
Parsimonious comparative-fit-index(PCFI)≥0.500.8140.798YES
Chi-square/degree of freedom (χ2/df)≤33.1512.757YES
Table 8. Analysis of path effects among constructs in SEM.
Causal PathStandard Coefficient (R)t Valuep
Project risk Primary support0.0932.1640.03
Project risk Tunnel excavation0.2635.476***
Project risk Secondary lining0.0851.4380.15
Project risk Auxiliary measures0.1954.199***
Project risk Structure waterproofing0.1904.119***
Project risk Advanced support0.2334.852***
Primary support Secondary lining0.1963.2740.001
Primary support Auxiliary measures0.1612.9520.003
Primary support Structure waterproofing0.2664.949***
Tunnel excavation Secondary lining0.4556.893***
Tunnel excavation Auxiliary measures0.3205.805***
Tunnel excavation Structure waterproofing0.2464.588***
Secondary lining Auxiliary measures0.4086.307***
Tunnel excavation Advanced support0.1372.5120.012
Primary support Advanced support0.2083.738***
Structure waterproofing Advanced support0.3616.136***
Secondary lining Advanced support−0.065−1.0540.292
Auxiliary measures Advanced support0.1041.8680.062
Primary support Tunnel excavation0.2384.405***
Secondary lining Structure waterproofing0.2293.743***
Auxiliary measures Structure waterproofing0.1372.5820.01
Note(s): *** p < 0.001.
Table 9. Change statistics of predictive reasoning process.
P ( C T | C i = 1 ) P ( C T | C i = 0.5 ) P ( C T | C i = 0.5 ) P ( C T | C i = 1 )
C 1 −0.7576 −0.6376 0.6376 0.7576
C 2 −0.7785 −0.6583 0.6583 0.7785
C 3 −0.5997 −0.4909 0.4909 0.5997
C 4 −0.7222 −0.6033 0.6033 0.7222
C 5 −0.5849 −0.4776 0.4776 0.5849
C 6 −0.7267 −0.6076 0.6076 0.7267
Table 10. Change statistics of diagnostic reasoning process.
C 1 C 2 C 3 C 4 C 5 C 6
P ( C i | C T = 1 ) −0.7576 −0.7785 −0.5997 −0.7222 −0.5849 −0.7267
P ( C i | C T = 0.5 ) −0.6376 −0.6583 −0.4909 −0.6033 −0.4776 −0.6076
P ( C i | C T = 0.5 ) 0.6376 0.6583 0.4909 0.6033 0.4776 0.6076
P ( C i | C T = 1 ) 0.7576 0.7785 0.5997 0.7222 0.5849 0.7267
Table 11. Quantitative results and their weight ranking.
Latent VariablesStandardized Path CoefficientWeight IRank
I
Observational VariablesStandardized Path CoefficientWeight
II
Rank
II
Weight
III
Rank
III
C 1
(Advanced support)
0.2330.2202 X 1 0.9010.19610.0714
X 3 0.8440.18320.0665
X 4 0.8080.17630.0638
C 2
(Tunnel excavation)
0.2630.2481 X 5 0.8880.22730.0823
X 6 0.6370.16340.05912
X 8 0.9560.24420.0882
X 9 0.9780.25010.0901
C 3
(Primary support)
0.0930.0885 X 10 0.5320.04330.01619
X 12 0.7910.06420.02315
X 14 0.9880.08010.02914
C 4
(Structure waterproofing)
0.190.1794 X 16 0.9350.17230.06210
X 17 0.9660.17810.0646
X 18 0.9530.17620.0639
C 5
(Secondary lining)
0.0850.0806 X 19 0.7330.05810.02116
X 21 0.7070.05630.02018
X 22 0.7250.05820.02117
C 6
(Auxiliary measures)
0.1950.1843 X 23 0.5910.10830.03913
X 24 0.9100.16620.06011
X 26 0.9650.17610.0637
Disclaimer/Publisher’s Note: The statements, opinions and data contained in all publications are solely those of the individual author(s) and contributor(s) and not of MDPI and/or the editor(s). MDPI and/or the editor(s) disclaim responsibility for any injury to people or property resulting from any ideas, methods, instructions or products referred to in the content.

