
Performance of Silica Fume on Preventing Strength Retrogression in Hardened Cement Paste and Mortar at Elevated Temperatures
1
Department of Civil Engineering, Pan African University Institute for Basic Sciences, Technology and Innovation, Nairobi P.O. Box 62000-00200, Kenya
2
School of Civil and Resource Engineering, The Technical University of Kenya, Nairobi P.O. Box 52428-00200, Kenya
3
Department of Civil and Construction Engineering, Jomo Kenyatta University of Agriculture and Technology (JKUAT), Nairobi P.O. Box 62000-00200, Kenya
*
Authors to whom correspondence should be addressed.
Buildings 2023, 13(5), 1301; https://doi.org/10.3390/buildings13051301
Submission received: 6 March 2023
/
Revised: 4 April 2023
/
Accepted: 20 April 2023
/
Published: 16 May 2023
(This article belongs to the Special Issue Green, Resilient, and Sustainable Composite Structures: Development, Design, and Construction)
Abstract
:This study examines the effect of silica fume (SF) as a partial replacement for cement to prevent strength retrogression in hardened cement paste (HCP) and mortar at elevated temperatures. An experimental procedure was conducted on 320 specimens, replacing 0, 10, 20, and 30% of the cement by weight with SF. The residual compressive strength of the specimens was evaluated at room temperature (25 °C) and at 100, 200, 300, and 400 °C for 7, 28, and 56 days. The results indicate that the addition of SF to the cement paste and mortar improves the compressive strength both at 25 °C and at temperatures up to 400 °C. That is attributed to the formation of C-S-H phases, such as tobermorite and xonotlite. Additionally, the optimal residual compressive strength was achieved by adding 30% of SF. Therefore, XRD, SEM, and EDS techniques were employed to evaluate the microstructure of HCP specimens with 30% of SF. The results show that adding SF leads to a denser microstructure and lower porosity, resulting in more durable cement paste and mortar at ambient and elevated temperatures. In conclusion, using SF as a partial replacement for cement can be an effective way of developing sustainable fire-resistant construction materials.
Keywords:
strength retrogression; compressive strength; hardened cement paste; elevated temperature; SF; SEM; XRD; EDS1. Introduction
Concrete is commonly used as a primary structural material in construction due to its numerous benefits over other materials like compressive strength, durability, ease of fabrication, and non-combustibility [1]. Emerging from the concrete building specifications, concrete structures should be able to meet the requirements for safety, structural performance, and durability, in addition to fire resistance standards [2]. Fire is considered a serious potential risk in most structures and buildings [3]. Concrete exposed to fire undergoes a series of chemical and physical changes, including disintegration of hydration products and aggregates, evaporation of water, increased porosity, and microstructure coarsening, all of which significantly reduce the mechanical properties of concrete [4,5]. Therefore, a deeper understanding of the main ingredients of concrete, such as cement, and its behavior when exposed to high temperatures is required [6].
One of the main components of concrete is ordinary Portland cement. It is assumed that almost 50% of the strength of cement paste comes from the cohesive force, specifically those in the C-S-H gel sheet area [7]. C-S-H is not a singular compound but a group of compounds that have different compositions and structures. The forms that C-S-H can take in hardened cement paste depend on various factors, including curing conditions. There are several common forms of C-S-H found in hardened cement paste, including tobermorite, which has a layered crystal structure and is often found in low-temperature cured cement paste. Jennite also has a layered crystal structure and is located in high-calcium cement paste cured at high temperatures [8]. Xonotlite is another form of C-S-H that is fibrous in form and typically found in cement paste cured at elevated temperatures and pressures [9]. Finally, Strätlingite is a crystalline form of C-A-H (calcium-aluminate-hydrate) that can develop in cement paste with high levels of alumina and sulfate [10].
At high temperatures, some physical and chemical changes appear in the HCP matrix that significantly impact its mechanical properties, leading to a phenomenon commonly called strength retrogression [11,12]. The chemical mechanism causing the strength retrogression in hardened cement paste at elevated temperatures starts with the progressive evaporation of water in the material. Free water is the first to evaporate, followed by capillary water and then chemically bound water. The process of extracting chemically bonded water from cement hydrates is the last to start [13]. Free water, adsorbed water, and one part of bond water evaporate between 30 and 105 °C. It is considered that at 120 °C, free and absorbed water is wholly eliminated [14]. Between 80 and 110 °C, total decomposition of gypsum and ettringite occurs, whereas one part of the water from carbo-aluminate hydrate is also observed [15,16,17]. The first signals of dehydration of the C-S-H gel show before or at 180 °C. Up to a temperature of 300 °C, dehydration is relatively rapid. When the temperature reaches 300 °C, the most strongly bonded water, which is involved in forming hydrates, begins to evaporate [18]. Between 300 and 400 °C, micro-cracks appear due to differential thermal deformations. Dehydration of Ca(OH)2 crystals begins at 400 °C, with complete decomposition at 600 °C. The second stage of hydrate decomposition is observed from 700 °C, with a slower rate and decomposition of the C-S-H gel into calcium silicate α-C2S, β-C2S, and water [19]. The cement paste continuously loses water as the temperature rises and is fully dehydrated by about 850 °C, which significantly increases porosity and permeability. Regardless of the type of Portland cement and the w/c ratio, the thermal degradation of the cement paste remains consistent. Some of the Portland cement can melt at temperatures above 1200 °C, and between 1300 and 1400 °C, it melts completely [20].
The cement strength retrogression phenomenon observed in hardened cement matrices is generally defined as a phenomenon that reduces compressive strength while increasing cement matrix permeability. It is principally due to the coarsening of the pore structure and the metamorphism of the C-S-H phase, which transforms into a high crystalline phase that is generally very weak and porous [16]. Strength retrogression is a significant problem in the construction industry. This phenomenon, which affects the cement matrix at high temperatures over time, can lead to costly repairs or a total replacement of structural elements made with it.
For many years, adding extra silica to cement has been a common practice in the oil and gas industry to counteract and control cement strength retrogression [21]. In addition, many researchers have added some pozzolanic materials in cement slurry formulations to prevent cement strength retrogression. Through these studies, it has been demonstrated that heating cement paste with a low CaO/SiO2 ratio will produce several stable crystalline phases known as tobermorite (C5S6H5), xonotlite (C6S6H), and truscottite (C7S12H3) capable of preserving the compressive strength and permeability of cement [22].
Recently in the concrete industry, improving concrete’s fire resistance by adding a source of silica from pozzolanic materials has become a field of interest for many researchers [23]. According to their studies, replacing cement with pozzolanic materials is one of the most efficient ways to improve the fire resistance of concrete [24]. The pozzolanic reactions, which involve the chemical reaction of silicon dioxide (SiO2) from the pozzolanic materials with the Ca(OH)2 of cement, resulting in the formation of additional calcium silicate hydrates (C-S-H) gel, help to reduce the permeability and improve the strength and durability of cement paste, mortar, and concrete [25]. Silica fume (SF), fly ash (FA), ground granulated blast-furnace slag (GGBS), and metakaolin (MK) are the most common pozzolanic materials used [26,27,28,29].
The study [18] investigated the fire performance of OPC-FA pastes. They tested OPC-FA pastes containing 30% FA by weight at various temperatures up to 650 °C. The relative residual compressive strength found was 88% at 450 °C and 73% at 600 °C. This research showed that OPC-FA pastes performed better at elevated temperatures than OPC pastes. Further, the study in [27] reviews the effect of supplementary cementitious materials on the residual mechanical properties of concrete after exposure to high temperatures. The main focus of this study was on the impact of additional cementing materials, such as SF, FA, and GGBFS), as well as different types of aggregates, on the mechanical properties of concrete. The study suggests that the mechanical characteristics of concrete can deteriorate significantly due to high-temperature changes. However, incorporating FA, SF, and GGBFS in concrete enhanced its resistance to high temperatures. However, high concentrations of these materials can have adverse effects on the properties of concrete. Therefore, careful consideration is necessary when choosing the appropriate type and amount of supplementary cementing materials and aggregates to use in concrete, especially when it is expected to be exposed to elevated temperatures.
Among the pozzolanic materials, SF is widely used in concrete due to its distinctive characteristics, such as small particle size, high surface area, and high silicon dioxide content. The incorporation of SF into cement mortars and concrete has been found to reduce porosity and enhance their mechanical performance. The size of silica fume particles is approximately 100–150 times smaller than that of Portland cement, which allows them to fill the open voids in mortar or concrete, resulting in reduced permeability of the final product [30,31,32].
The study [33] explored the effect of temperature on the physical and mechanical properties of concrete containing silica fume. In their study, OPC was partially substituted with different amounts of silica fume. All samples were kept in a moist environment for 28 days, then subjected to various heat treatments ranging from 100 to 600 °C for three hours. The study found that replacing 10% of OPC with silica fume resulted in a 64.6% increase in compressive strength. The researchers attributed this result to the formation of other tobermorite gel (C-S-H phase) resulting from the reaction between silica fume and Ca(OH)2.
Silica fume is commonly used to produce high-strength cement paste, mortar, and concrete. Despite the extensive studies on the benefits of SF in improving the mechanical performance of concrete, investigators should have emphasized the details regarding the reason for the increase in strength properties in cement paste with silica fume, particularly in the temperature range of 100 to 400 °C. This research aimed to investigate the effect of SF in preventing strength retrogression in hardened cement paste and mortar at elevated temperatures up to 400 °C. The study presents novel experimental findings concerning silica fume as a preventive measure against strength retrogression in hardened cement paste and mortar at elevated temperatures. It includes new data on the mechanical properties of the materials both before and after high-temperature exposure, as well as an examination of the microstructural changes caused by the incorporation of silica fume. Furthermore, the paper recommends the optimal amount of silica fume to be mixed in cementitious blends. This paper’s potential innovations could significantly impact the construction industry, particularly in terms of designing stable, high-performance structures that can withstand high temperatures.
2. Materials and Methods
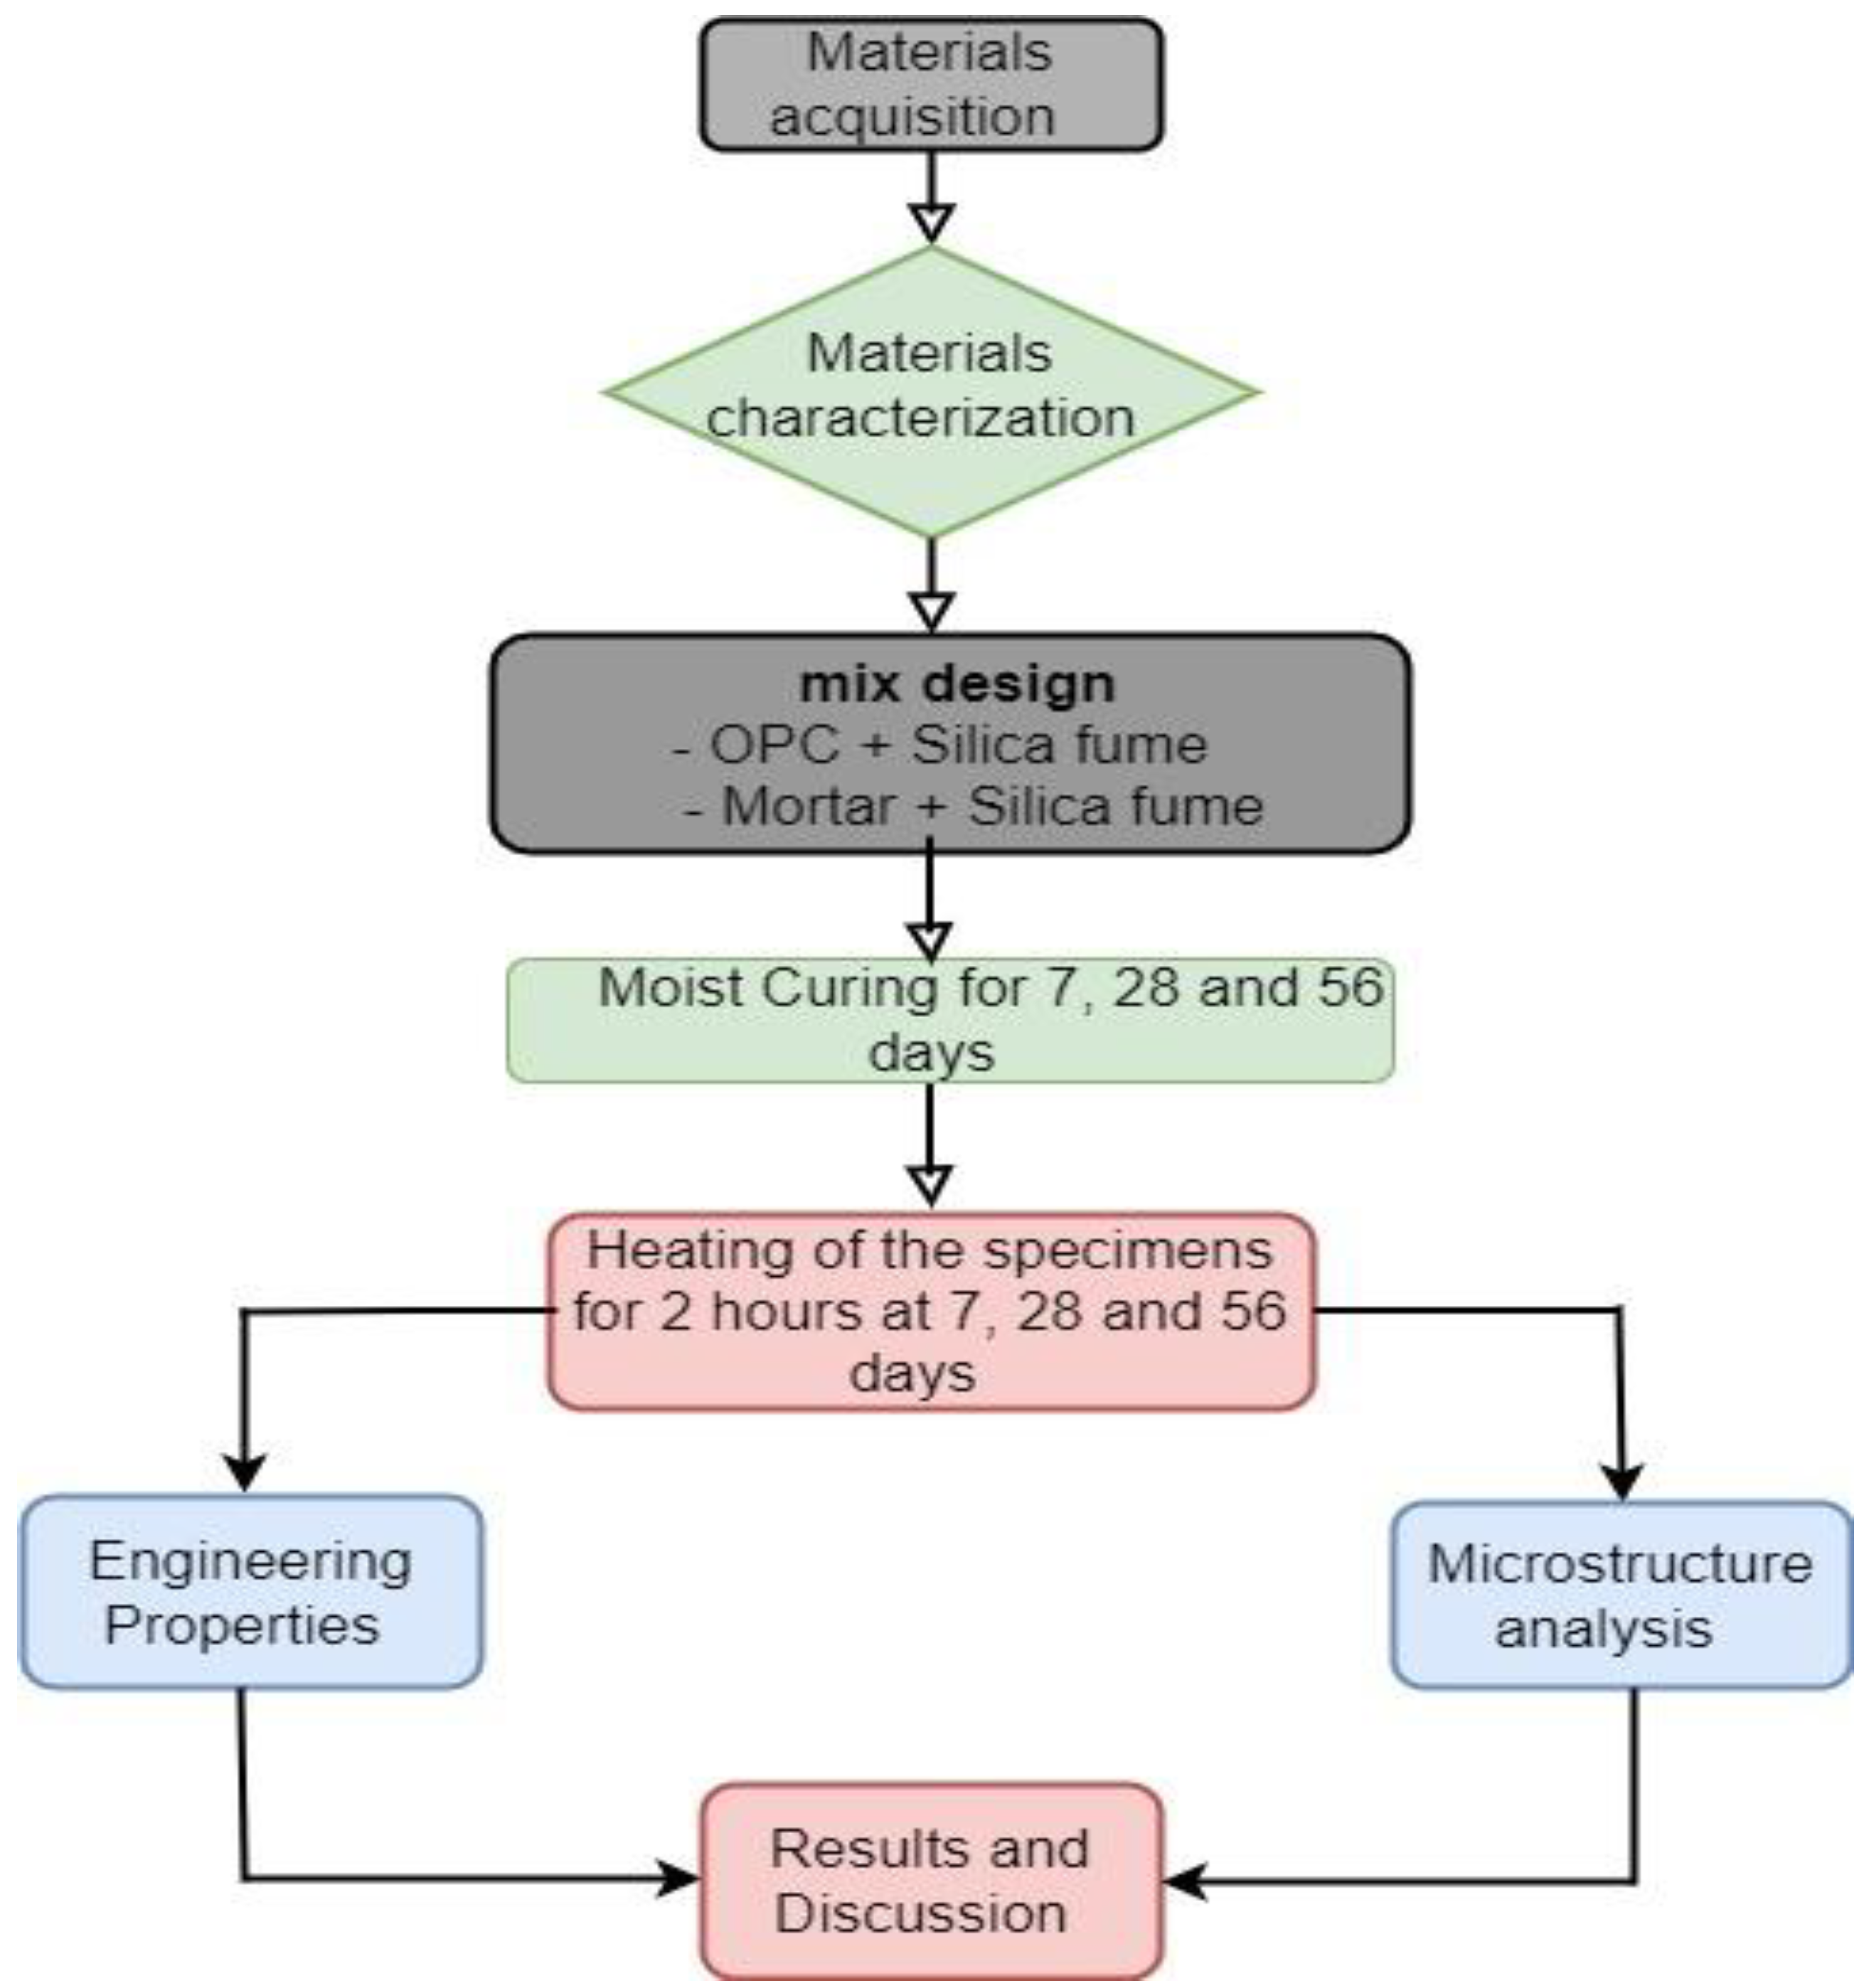
Figure 1 is the flowchart of the study presented in this paper.
2.1. Materials and Acquisition
The materials used in this study are fine aggregates, silica fume, potable water, and ordinary Portland cement type I 42.5 N. The OPC was obtained from a local producer and kept at the Jomo Kenyatta University lab at a temperature range of 23 to 27 °C. Silica fume was obtained from Silica Kenya Limited in Nairobi and prepared following ASTM C1240 [34]. The fine aggregates (river sand) used in this study were collected locally from Meru, a town in eastern Kenya. The sand was sieved using a 5.0 mm test sieve and air-dried to a saturated surface dry state following the ASTM C778 standard specification for sand [35] to eliminate larger particles.
2.2. Mixing and Casting Procedure
The silica fume content was 0% (control), 10, 20, and 30% of the weight of cement for all mixtures, both paste and mortar. The cement pastes and mortars were mixed in a hopper mixer. The mortar mix consisted of 1 part of cement and 2.75 parts of sand, as specified in ASTM C109 [36]. For the cement paste with silica fume, the consistency test was done using a Vicat apparatus, according to ASTM C143 [37], to determine the amount of water needed for each mix. For mortar with silica fume, the flow test was done to ASTM C780 [38] standard, and the flow was fixed at 110 ± 5. No superplasticizers were used in this research. Table 1 presents the mixes used for cement paste and mortar.
The procedure for mixing was done according to ASTM C305 [39]. After which, the mixes were cast in 50 × 50 × 50 mm3 molds for mortar and 40 × 40 × 160 mm3 molds for cement paste. They were then compacted using vibration from an external source and kept in the molds covered with plastic for at least 24 h to stop moisture loss.
2.3. Curing and Heating Procedures
Specimens were moist cured for 7, 28, and 56 days at a temperature of 25 °C. Three hundred and twenty cubes were cast. After curing, the samples were removed and dried in the open air for 2 h. For each level of replacement, three specimens were heated in an electrical furnace for two hours. Temperature levels included 100, 200, 300, and 400 °C. After heating, the specimens were naturally and slowly cooled in the laboratory at ambient conditions (25 ± 2 °C) for 24 h [40].
2.4. Testing Procedure
2.4.1. Compressive Strength
The compressive strengths of silica fume cement paste and mortar samples were tested at 7, 28, and 56 days at 25, 100, 200, 300, and 400 °C. The tests were performed as described in BS EN 196-3 [41]. The testing was conducted using a universal compression testing machine with a capacity of 150 kN.
2.4.2. XRD and SEM Tests
XRD and SEM tests were conducted on samples of hardened cement pastes for both the control and that with 30 silica fume after 28 days of water curing at 25 and at 400 . For the XRD test, the hardened cement paste samples were ground into powder, conserved in plastic bags, and sent to Nigeria at the National Research Institute for Chemical Technology (NARICT) for analysis. For the SEM, small specimens of 3 × 3 × 3 cm3 were sent to South Africa at the Nanotechnology Innovation Centre of the University of Johannesburg for the test.
3. Results and Discussion
3.1. Material Characterization
3.1.1. Physical and chemical properties of OPC and SF
Table 2 shows the chemical compositions of OPC and silica fume determined via the X-ray Fluorescent (XRF) technique.
According to Table 2, the total percentage of silica (SiO2), iron oxide (Fe2O3), and alumina (Al2O3) in silica fume was 98.664, which agrees with the ASTM C618 minimum requirement of 70% for good pozzolanic material [42]. It shows that the silica fume used in this study can form extra cementitious compounds (calcium silicate hydrates) by reacting with the free lime present in OPC in the presence of water, thereby increasing the strength of the paste and mortar [43]. The loss of ignition (LOI) observed was 4.30 for the silica fume and 6.3 for the OPC. The LOI of SF was below the 12% specified maximum per ASTM C618 (2010) for pozzolanic materials.
Table 3 summarizes the physical properties of OPC and silica fume used in this study.
The OPC used has a specific gravity of 3.14 which is between the range requirements of 3.1–3.16 kg/m3 per ASTM C188-95 [44]. If exposed to various conditions and humidity, cement may contain a lot of moisture due to its pores, which may raise the specific gravity of the materials, increase the water–cement ratio and reduce the strength of the cement paste [47]. The specific gravity of cement is an important parameter when studying the strength retrogression of HCP at high temperatures. It gives information about the chemical composition and density of the material. Cement with high specific gravity will have better strength than cement with low specific gravity. That is due to the fact that cement with high specific gravity has a high amount of heavy compounds like alumina and silica, which can react with the free lime in cement to form cementitious compounds and can increase the strength and durability of the material.
The specific gravity of the silica fume was 2.2 kg/m3. That is lower than the specific gravity of cement mentioned above. That implies a greater volume of silica would be required to replace the same amount of cement, causing issues of water demand. This has a serious impact on the mix design and the strength of the material. An increase in water demand can cause weakness in the materials, reducing their compressive strength and durability.
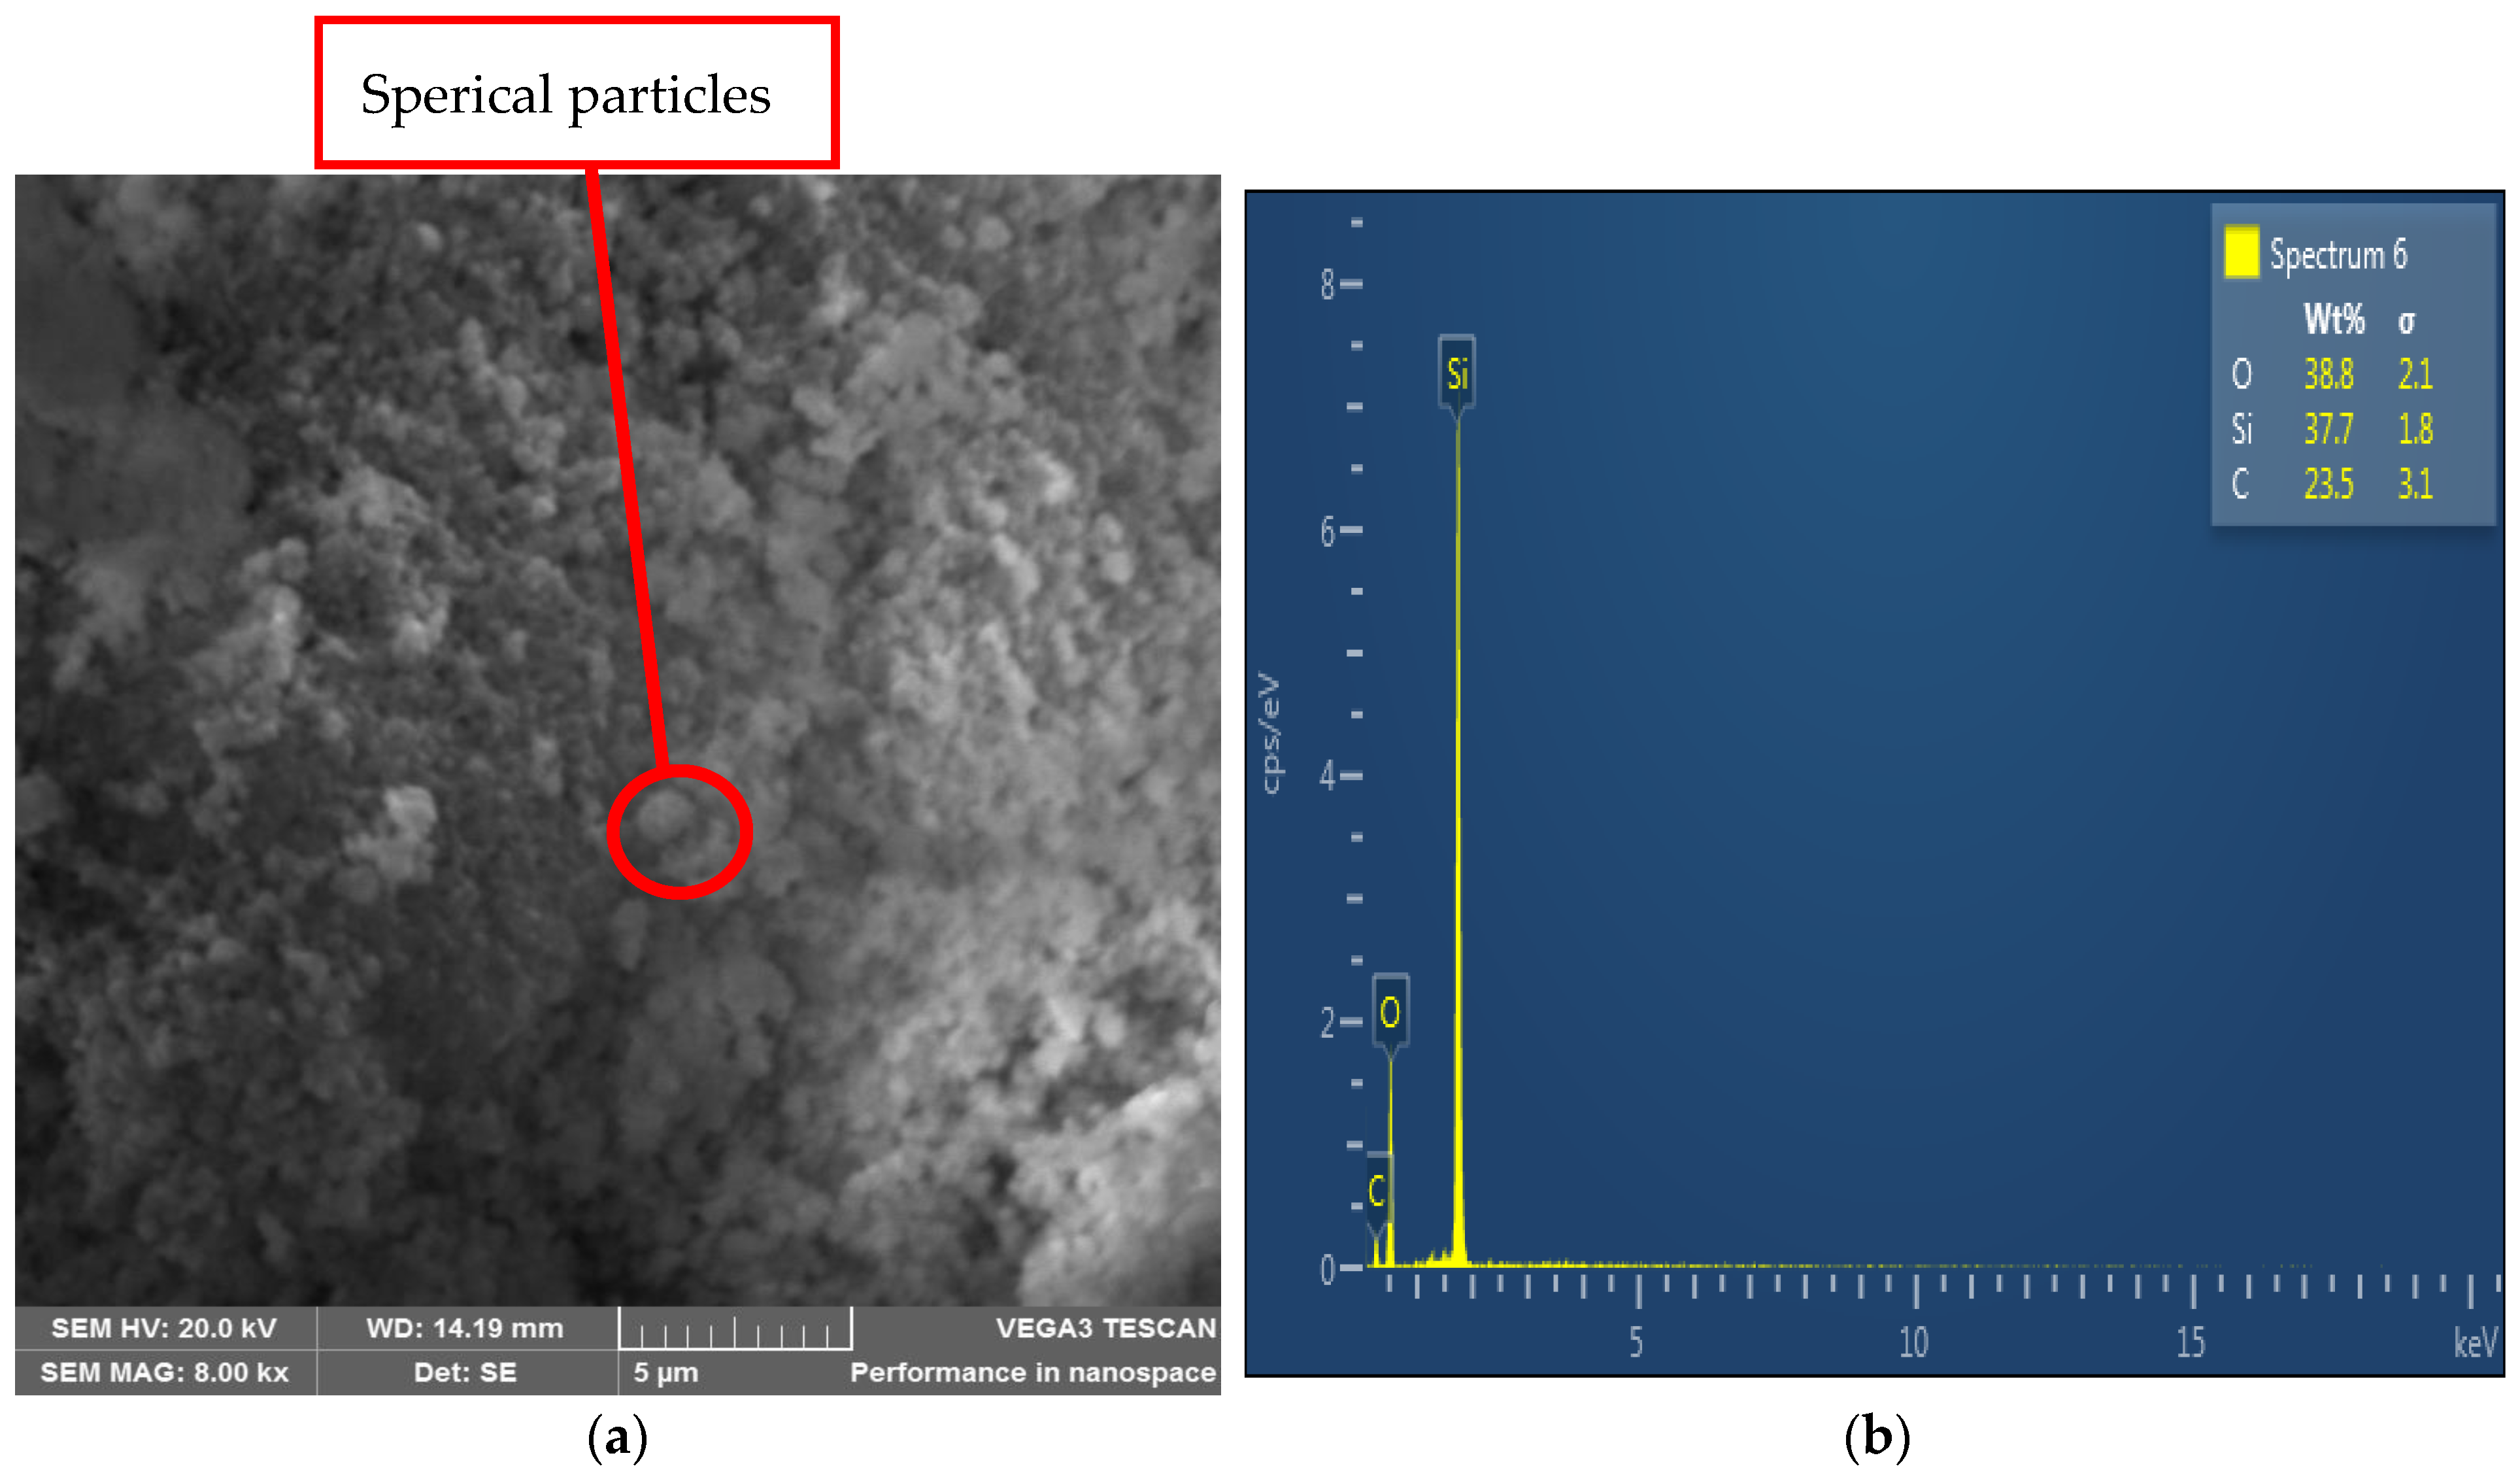
Figure 2a presents the images of silica fume taken by a scanning electron microscope (SEM) at the University of Johannesburg. The SEM machine had an accelerating voltage and magnification of 20 kV and 6 kX, respectively. Figure 2b presents the energy-dispersive X-ray spectroscopy (EDS) of silica fume.
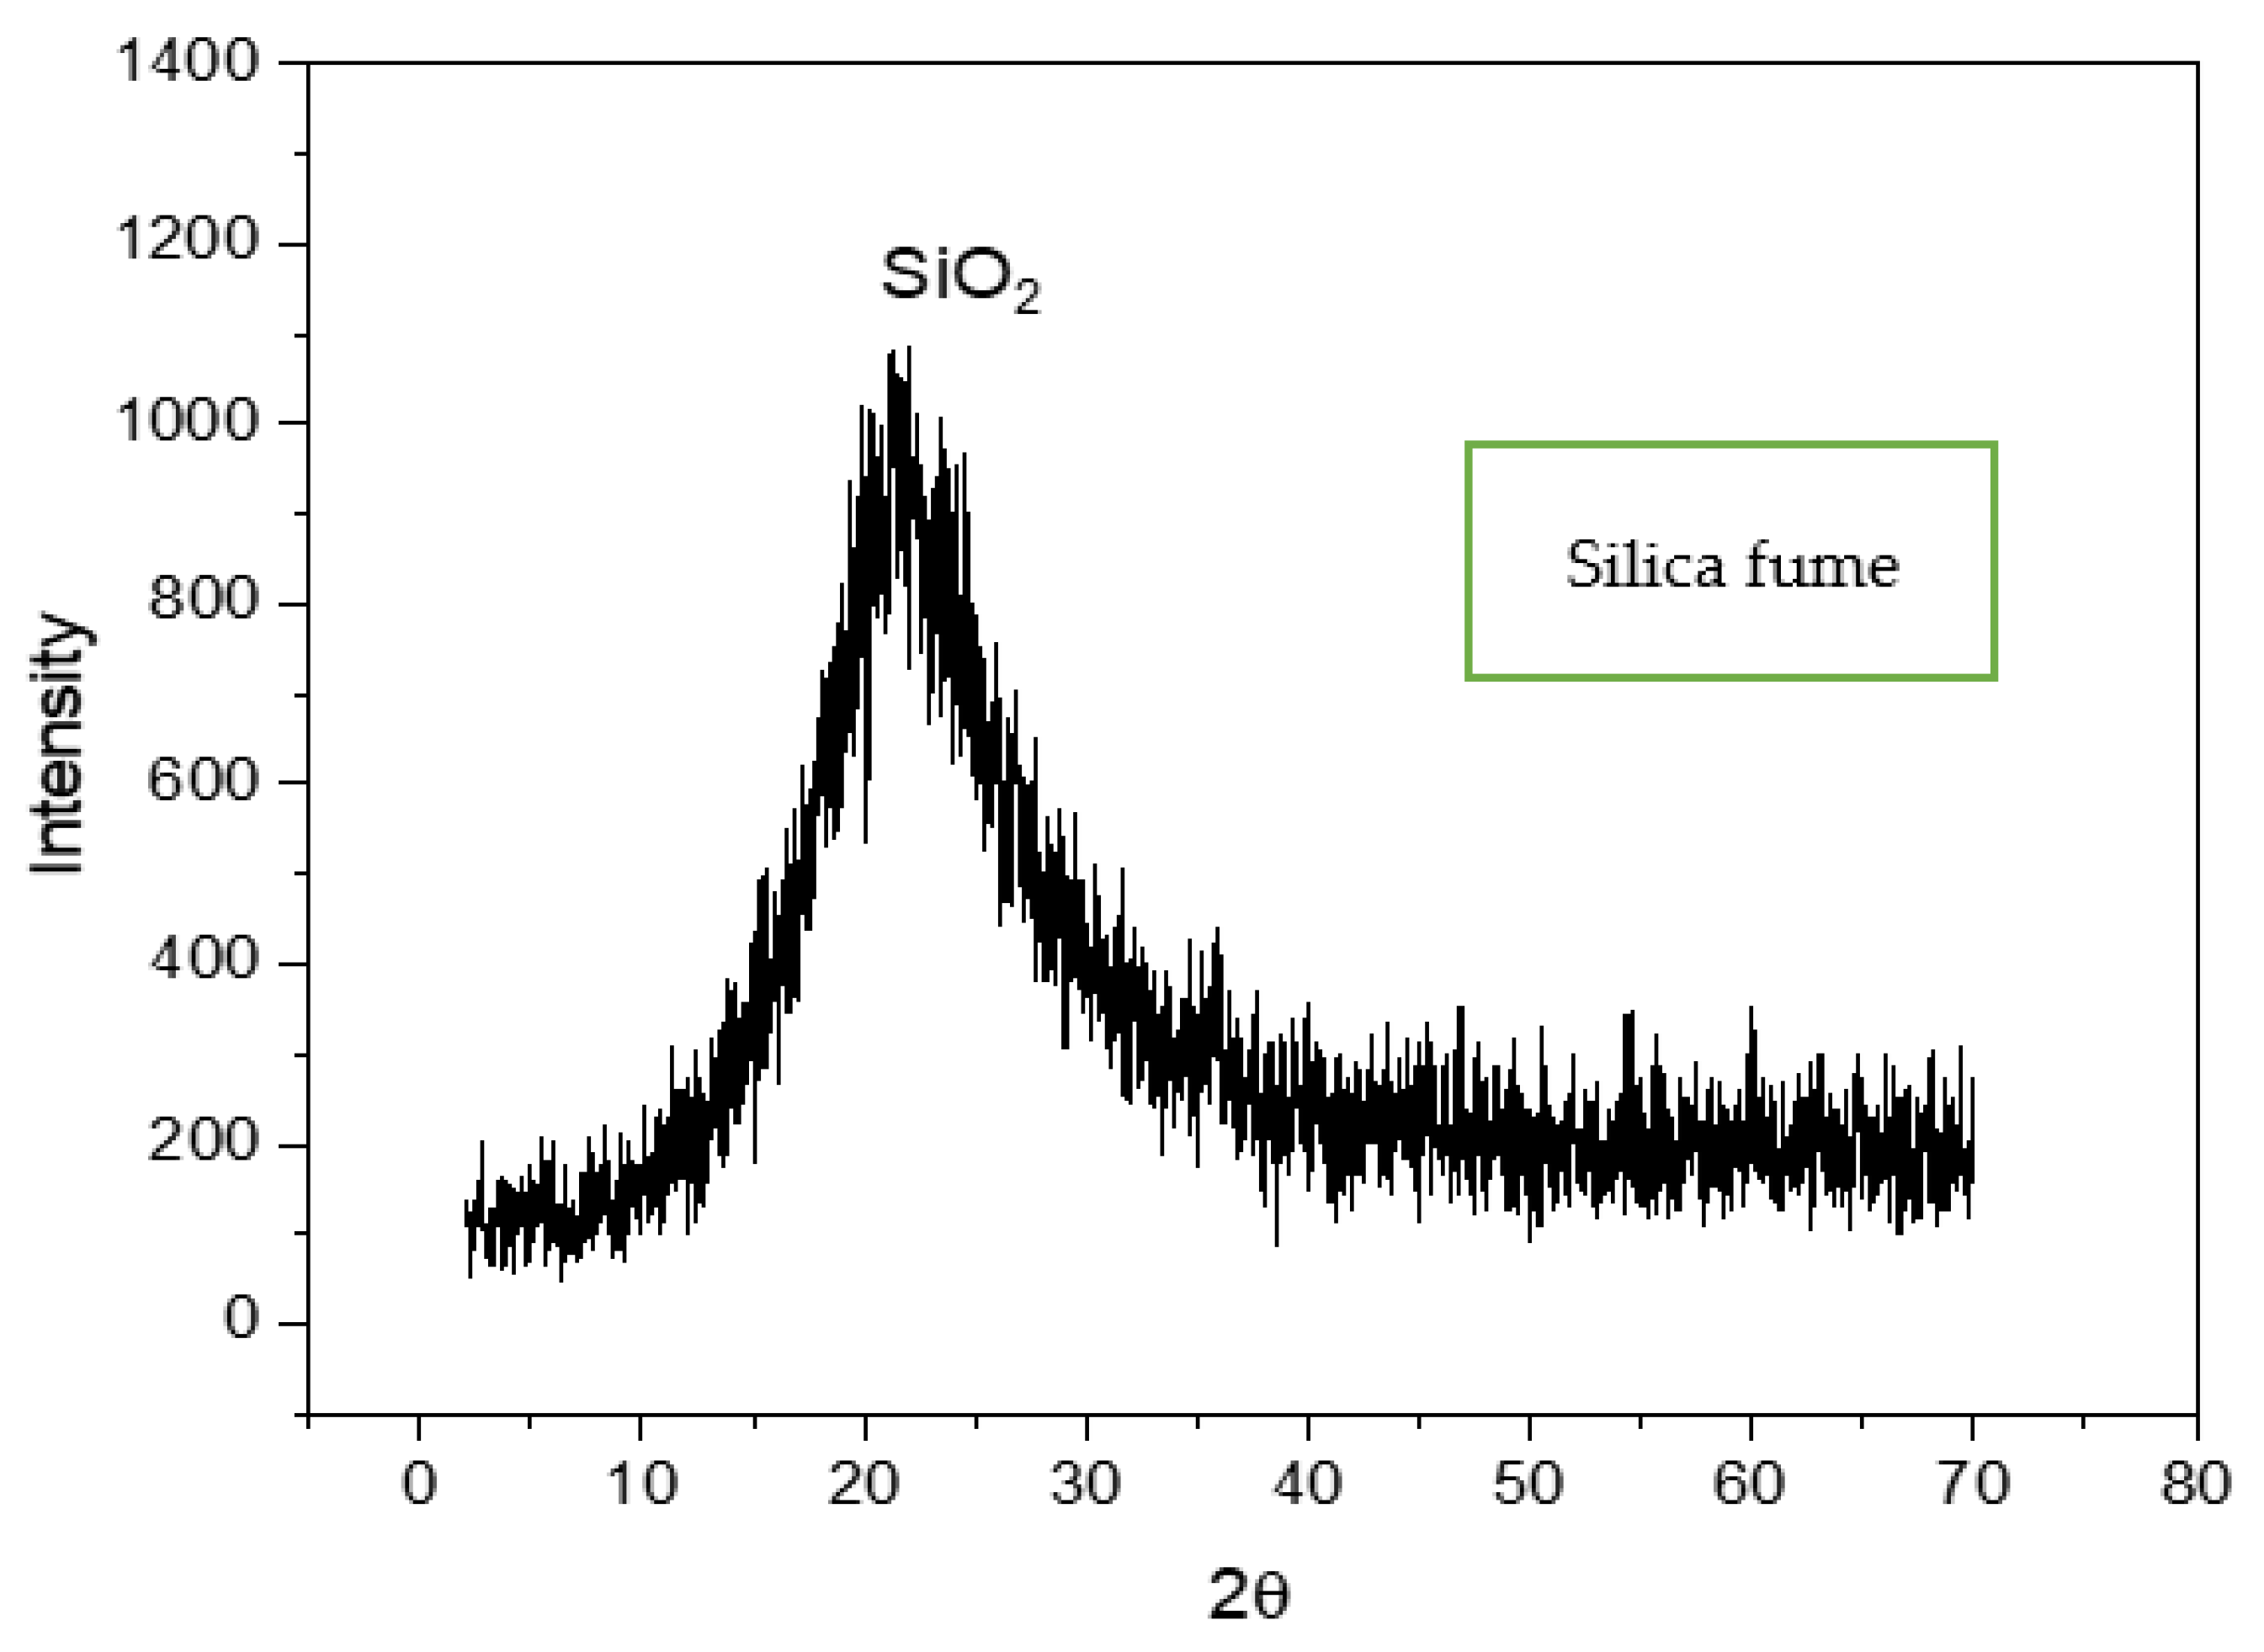
On the SEM micrograph, some particles of silica fume look extremely fine, and others look perfectly spherical. These particles can play the role of good filling materials when used in cement. Further, due to its fine particle and high reactivity, silica fume can be used as a pozzolanic material, improving the strength properties of hardened cement paste and mortar. The EDS graph shows the presence of three elements: silicon (Si), oxygen (O), and carbon (C). Since silicon dioxide (SiO2) is the main component of silica fume, the presence of silicon and oxygen in these results was expected. That was confirmed by the unique phase SiO2 presents in the XRD of silica fume shown in Figure 3. However, the presence of carbon was not initially expected and can be considered an impurity that resulted from contamination of the material by carbon-contaminated materials like coal or petroleum during production or from contamination during preparation and analysis of the material. The calcium hydroxide created during cement hydration can react with the carbon present in the silica fume to form calcium carbonate (CaCO3). By consuming the calcium hydroxide necessary to develop the strength of cement paste, the amount of carbon present in silica fume could reduce its ability to prevent strength retrogression in cement paste and mortar at high temperatures.
The XRD of silica fume is shown in Figure 3.
XRD was primarily done to verify the mineralogical properties of the silica fume used. The result shows a high amount of silicon dioxide with the chemical formula (SiO2), which was highly expected based on the findings of the material’s chemical composition and EDS. Ref. [48] confirmed the shape and mineralogical composition contained in this result. The silica fume pattern in Figure 3 is considered amorphous.
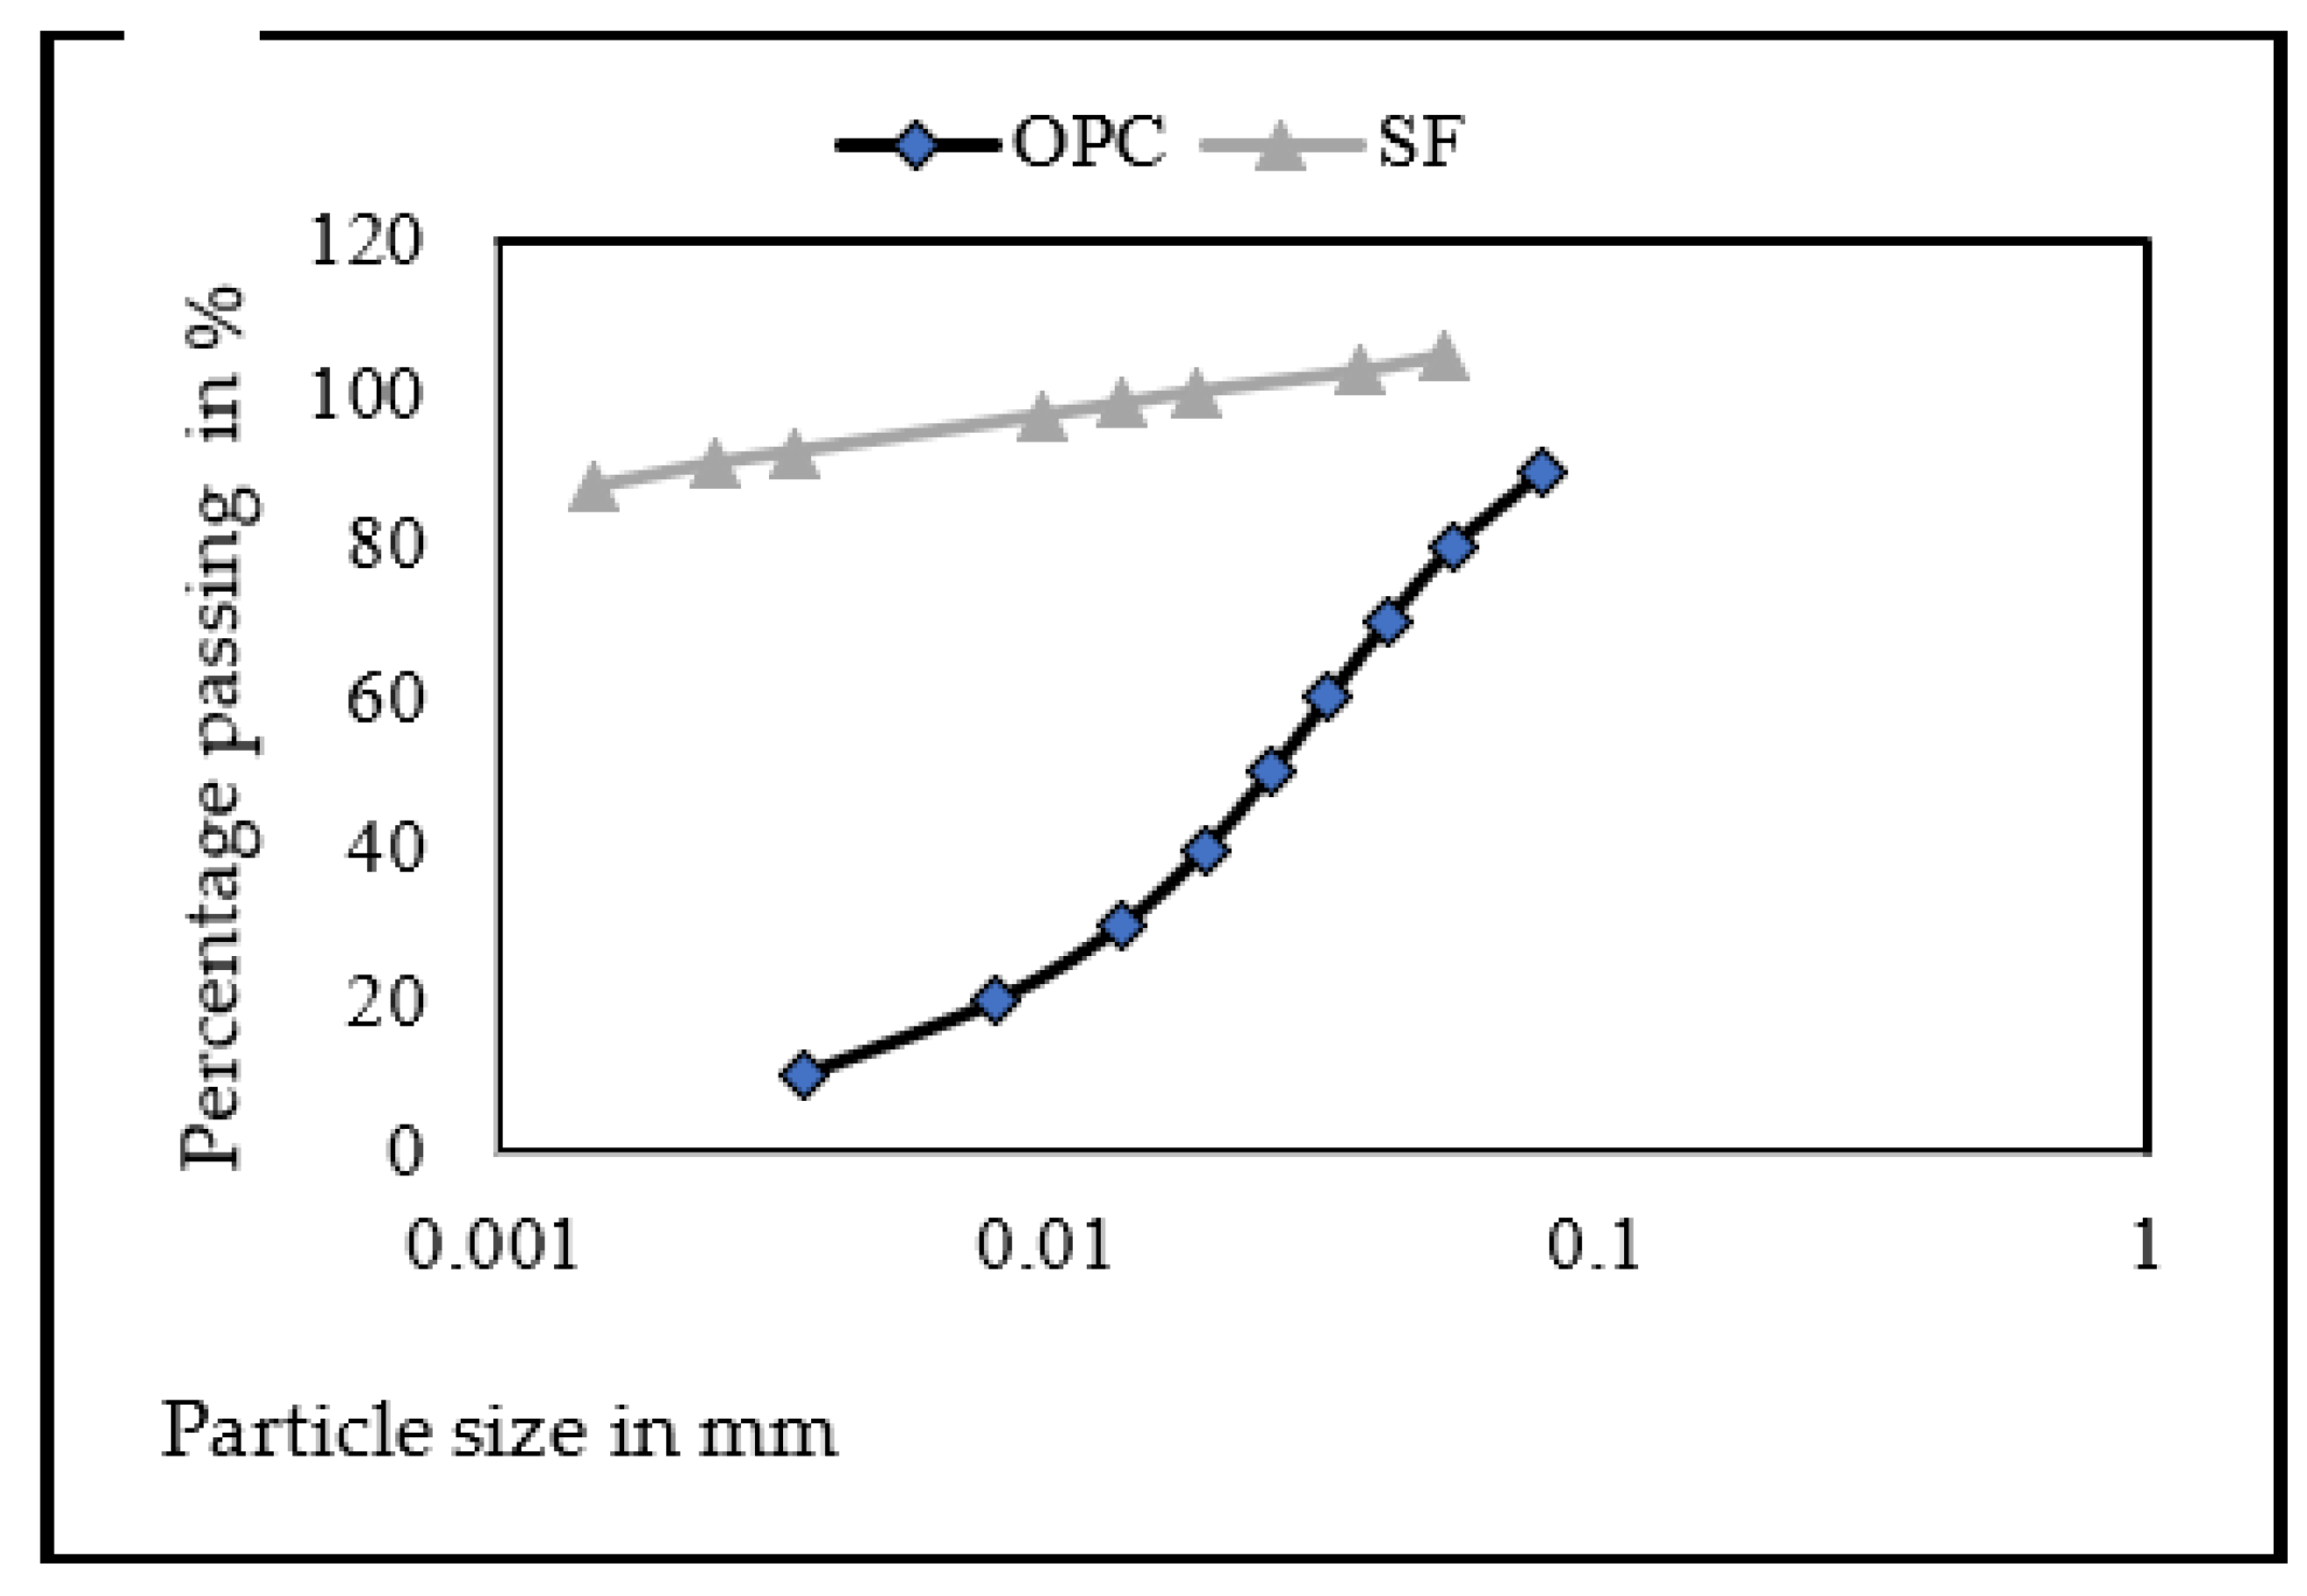
Figure 4 shows the summarized results of the particle size distribution of OPC and SF used in this study.
Figure 4 shows that about 60% of the particles of silica fume were between 0.001 mm and 0.01 mm, while less than 40% were below 0.01 mm. The silica fume used in this research was finer than ordinary Portland cement, which has less than 30% fines below 0.01 mm. Due to its finer particles, silica fume has a greater surface area and is, therefore, more reactive with cement and water. This can help to enhance the strength development of HCP and mortar. Moreover, finer silica fume particles can fill the gap in cement, producing a denser and more compact cement paste and mortar matrix that could increase strength at normal and elevated temperatures and prevent strength retrogression.
3.1.2. Physical Properties of Fine Aggregates
The bulk and loose densities of the fine aggregates were found to be 1572.13 kg/m3 and 1403.26 kg/m3, respectively. The average density of 1487.70 kg/m3 meets the required range of 1450–2082 kg/, and the specific gravity value was determined to be 2.56, all of which conformed to ASTM C128-07 [49]. The water absorption and moisture content values were determined to be 2.81 and 2 respectively, indicating that the proportion of water in the fine aggregates was sufficient and ready for use [50]. Finally, in accordance with the ASTM C117-04 criteria of not exceeding 5%, the silt percentage of 4.3% for fine aggregates was acceptable [51]. Table 4 shows the results of the physical properties of fine aggregates used in this study.
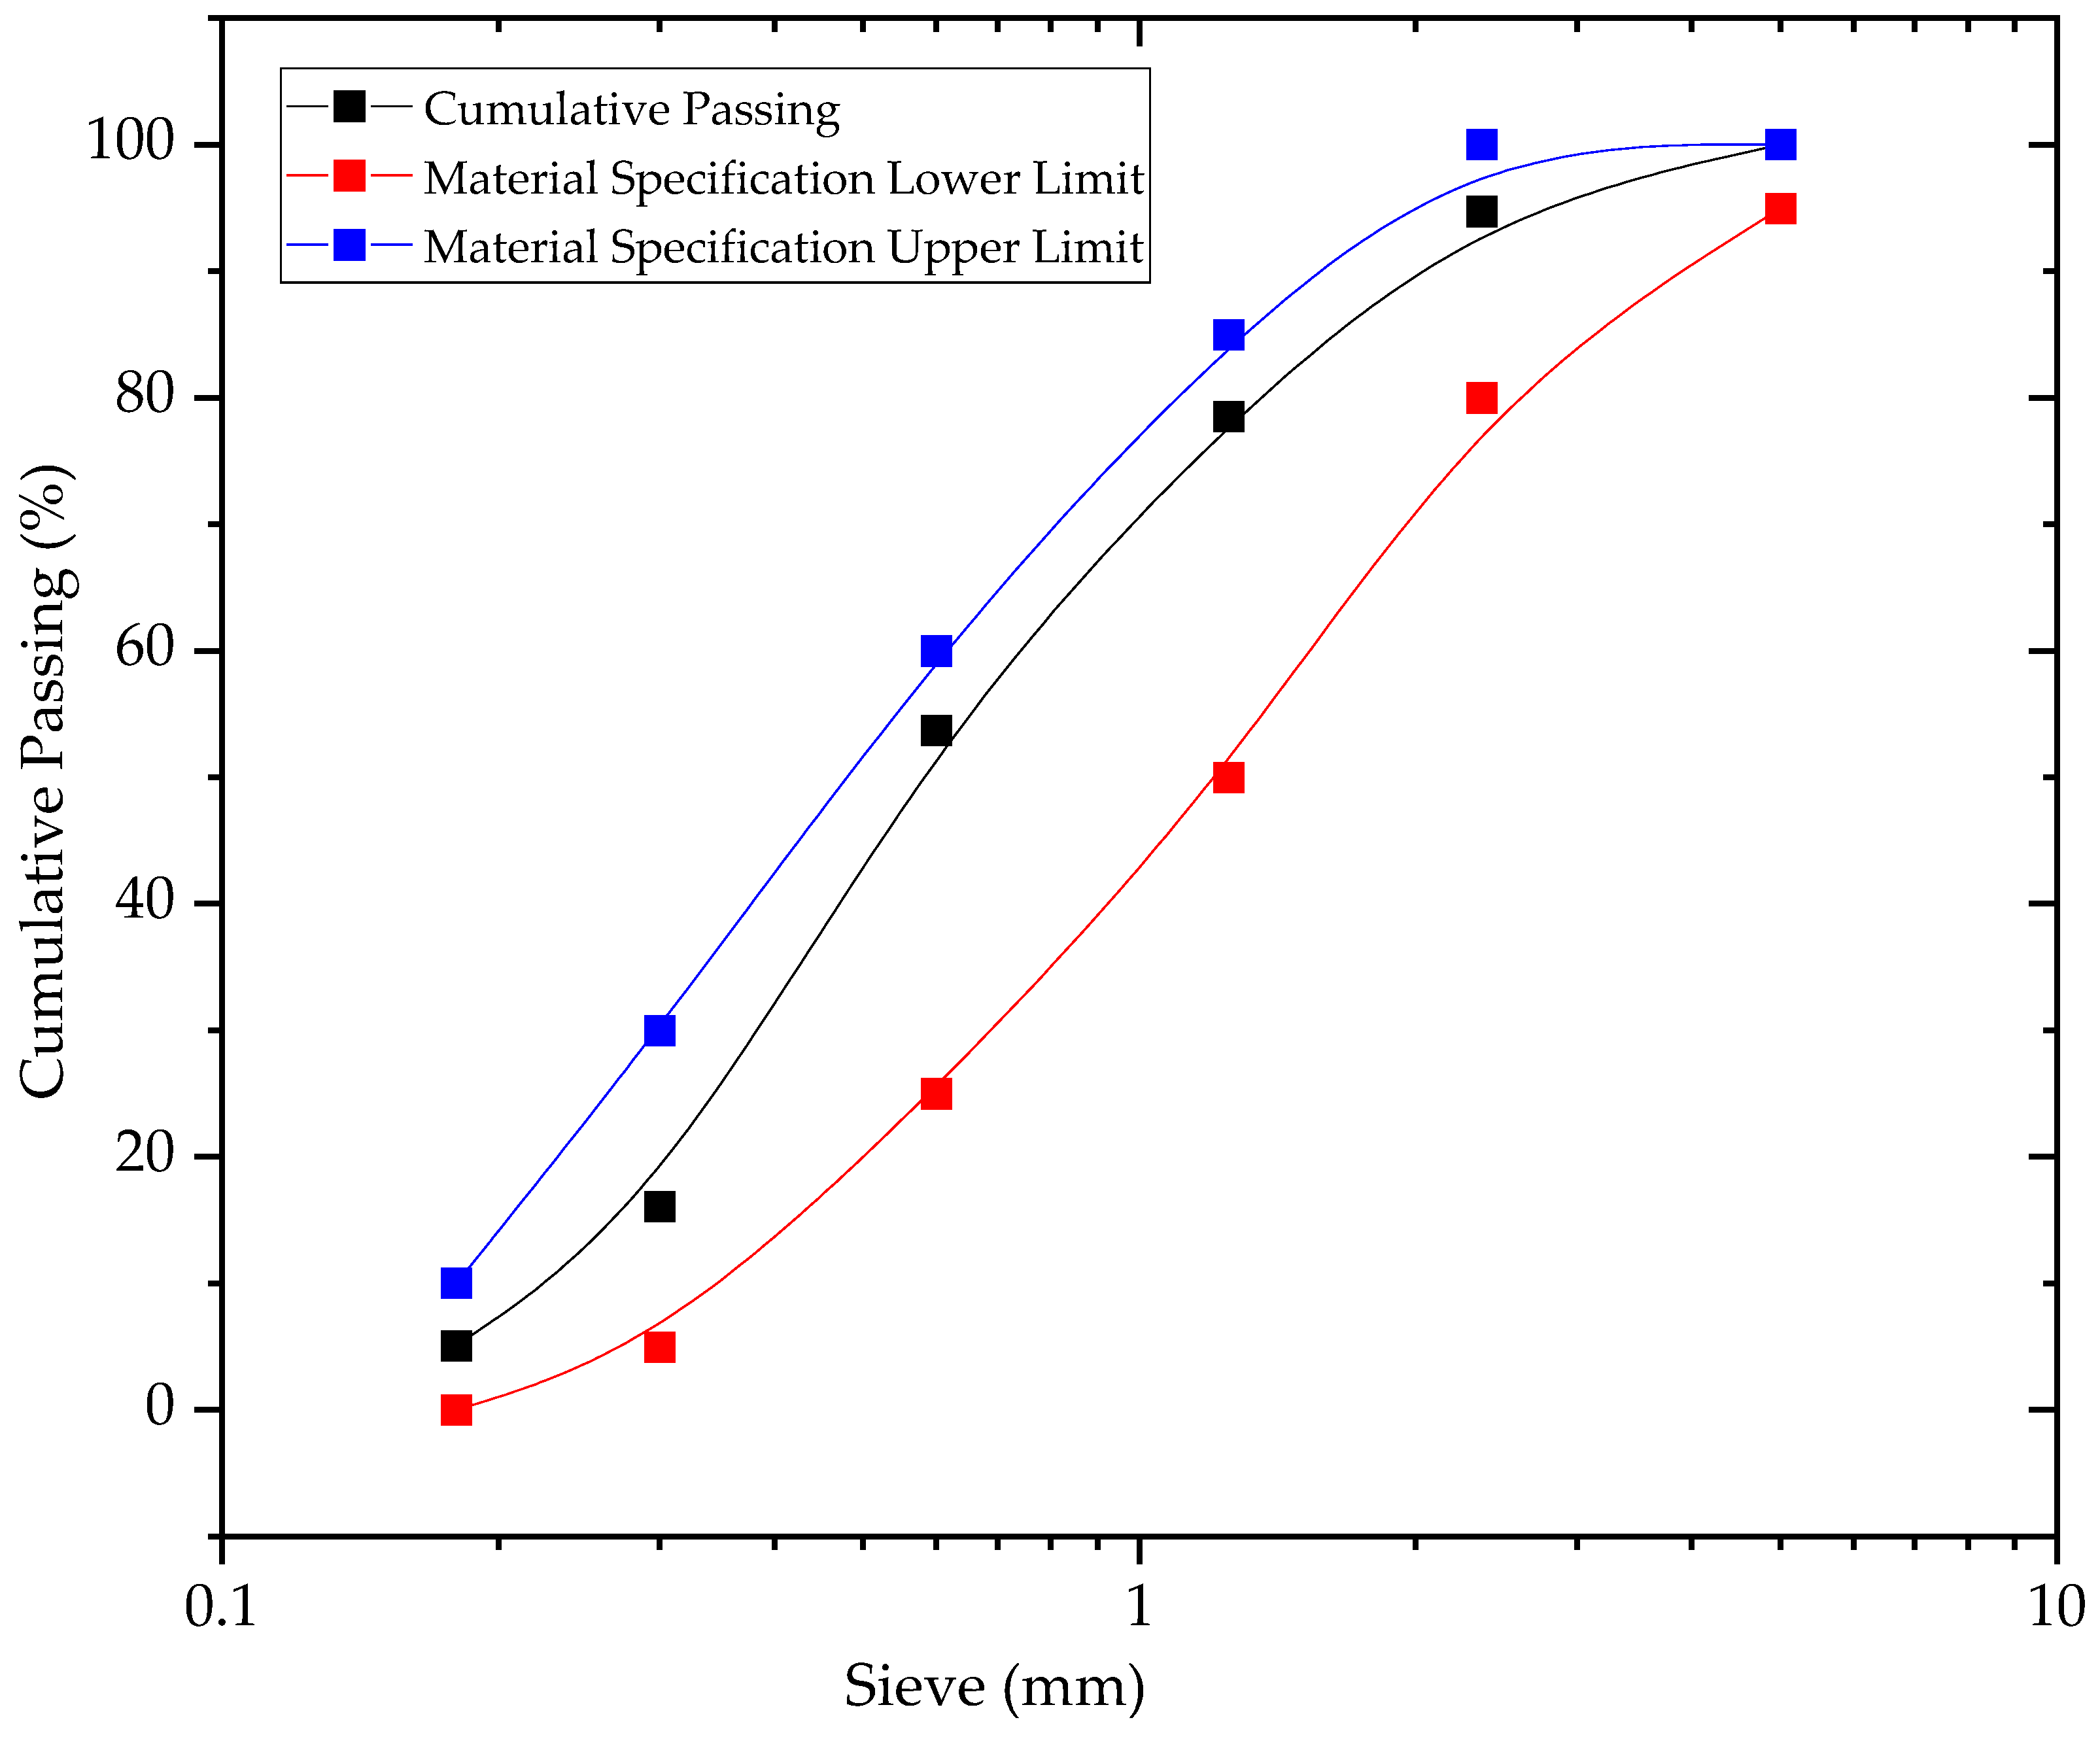
Figure 5 presents the results of the particle size distribution of the fine aggregates used in this study.
The particle size of the aggregates ranged between 0.18 and 5 mm. The graph indicates that the fine aggregates’ curve is within the upper and lower limit envelopes specified in ASTM C33 for graded aggregate. Further, ASTM C33 requires that the fineness modulus be kept between the ranges of 2.3 and 3.1 [53], to which the fineness modulus of the sand in this study, 2.52, conforms. The fineness modulus of sand is a quantitative measure of the sand’s particle size distribution used in a mix. It is an important factor that must be considered to optimize the performance of mortar at high temperatures. In most cases, a smaller fineness modulus indicates a more uniform and fine-grained particle size distribution. This can help to create a more densely packed and less porous mortar mix, which can improve the strength and durability of mortar [54].
3.2. Properties of Fresh Cement Paste and Mortar
3.2.1. Water Demand
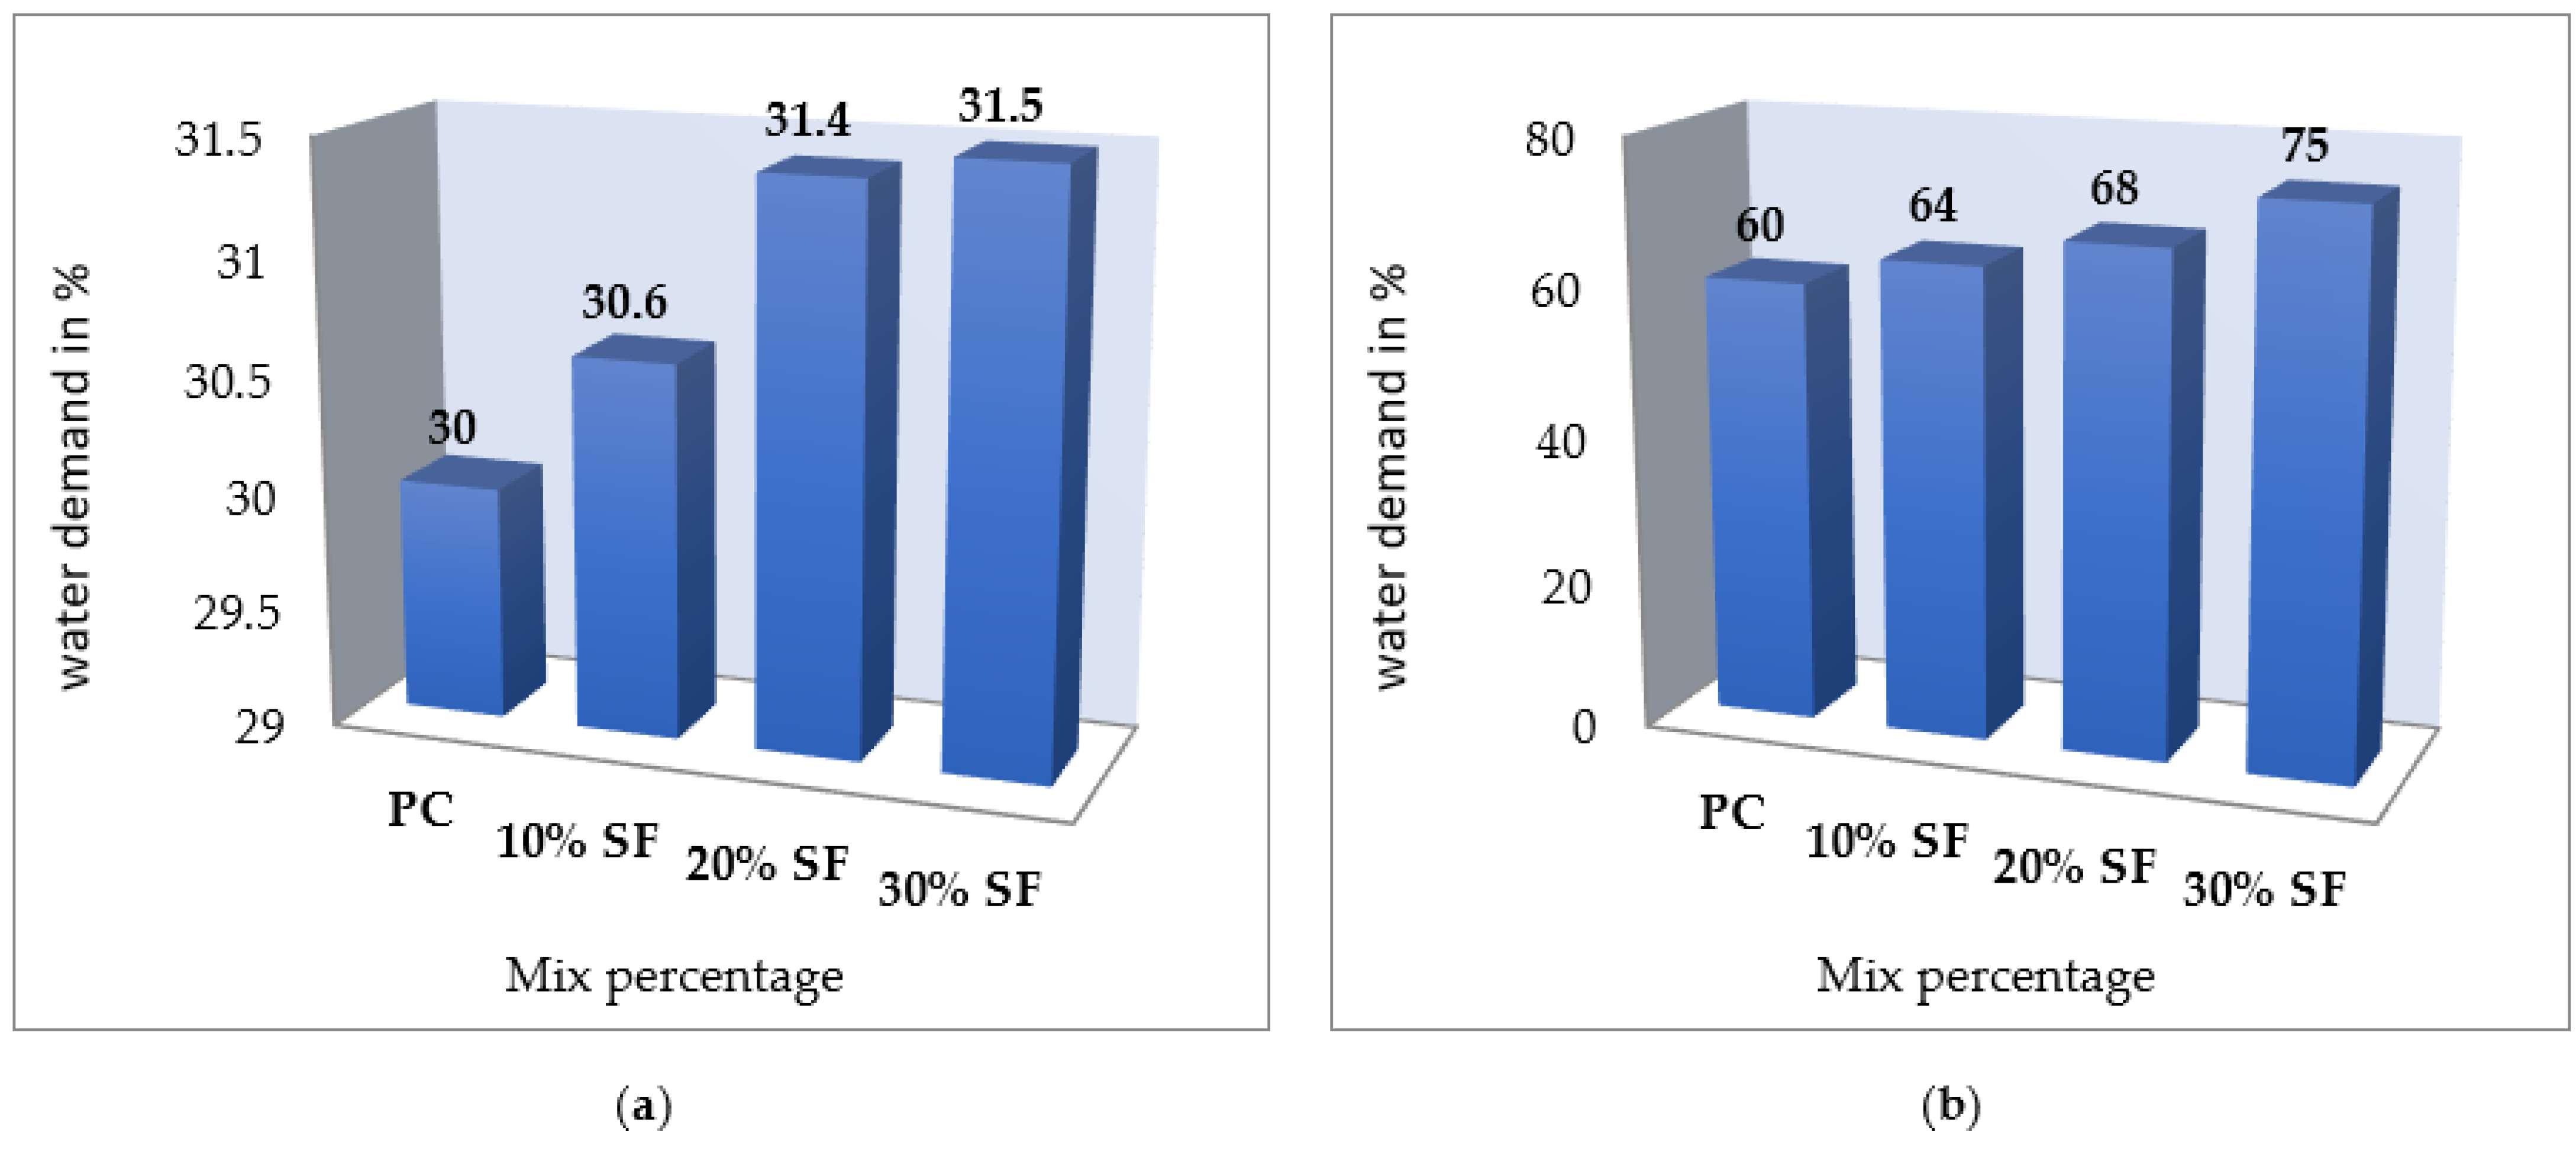
Figure 6 shows the water demand of cement paste and mortar with silica fume.
As the percentage of silica fume increased, the water demand also increased (Figure 6a,b). This was due to its high surface area and particle size distribution, which needed more water to wet the silica fume particle and complete the hydration (see Section 3.1.2). This result of the consistency of cement with silica fume is confirmed in [55], which asserts that the consistency of cement increased with the increase in silica fume content. In total, 40% more water was required for cement pastes containing 20–30% of silica fume. By carefully adjusting the water binding ratio, the workability of cement paste and mortar can be optimized without compromising the strength or durability of the final product. Furthermore, it also helps minimize excess water in the mixture. This can result in HCP and mortar that are more compact and show less strength retrogression when subjected to elevated heat.
3.2.2. Properties of Hardened Cement and Mortar
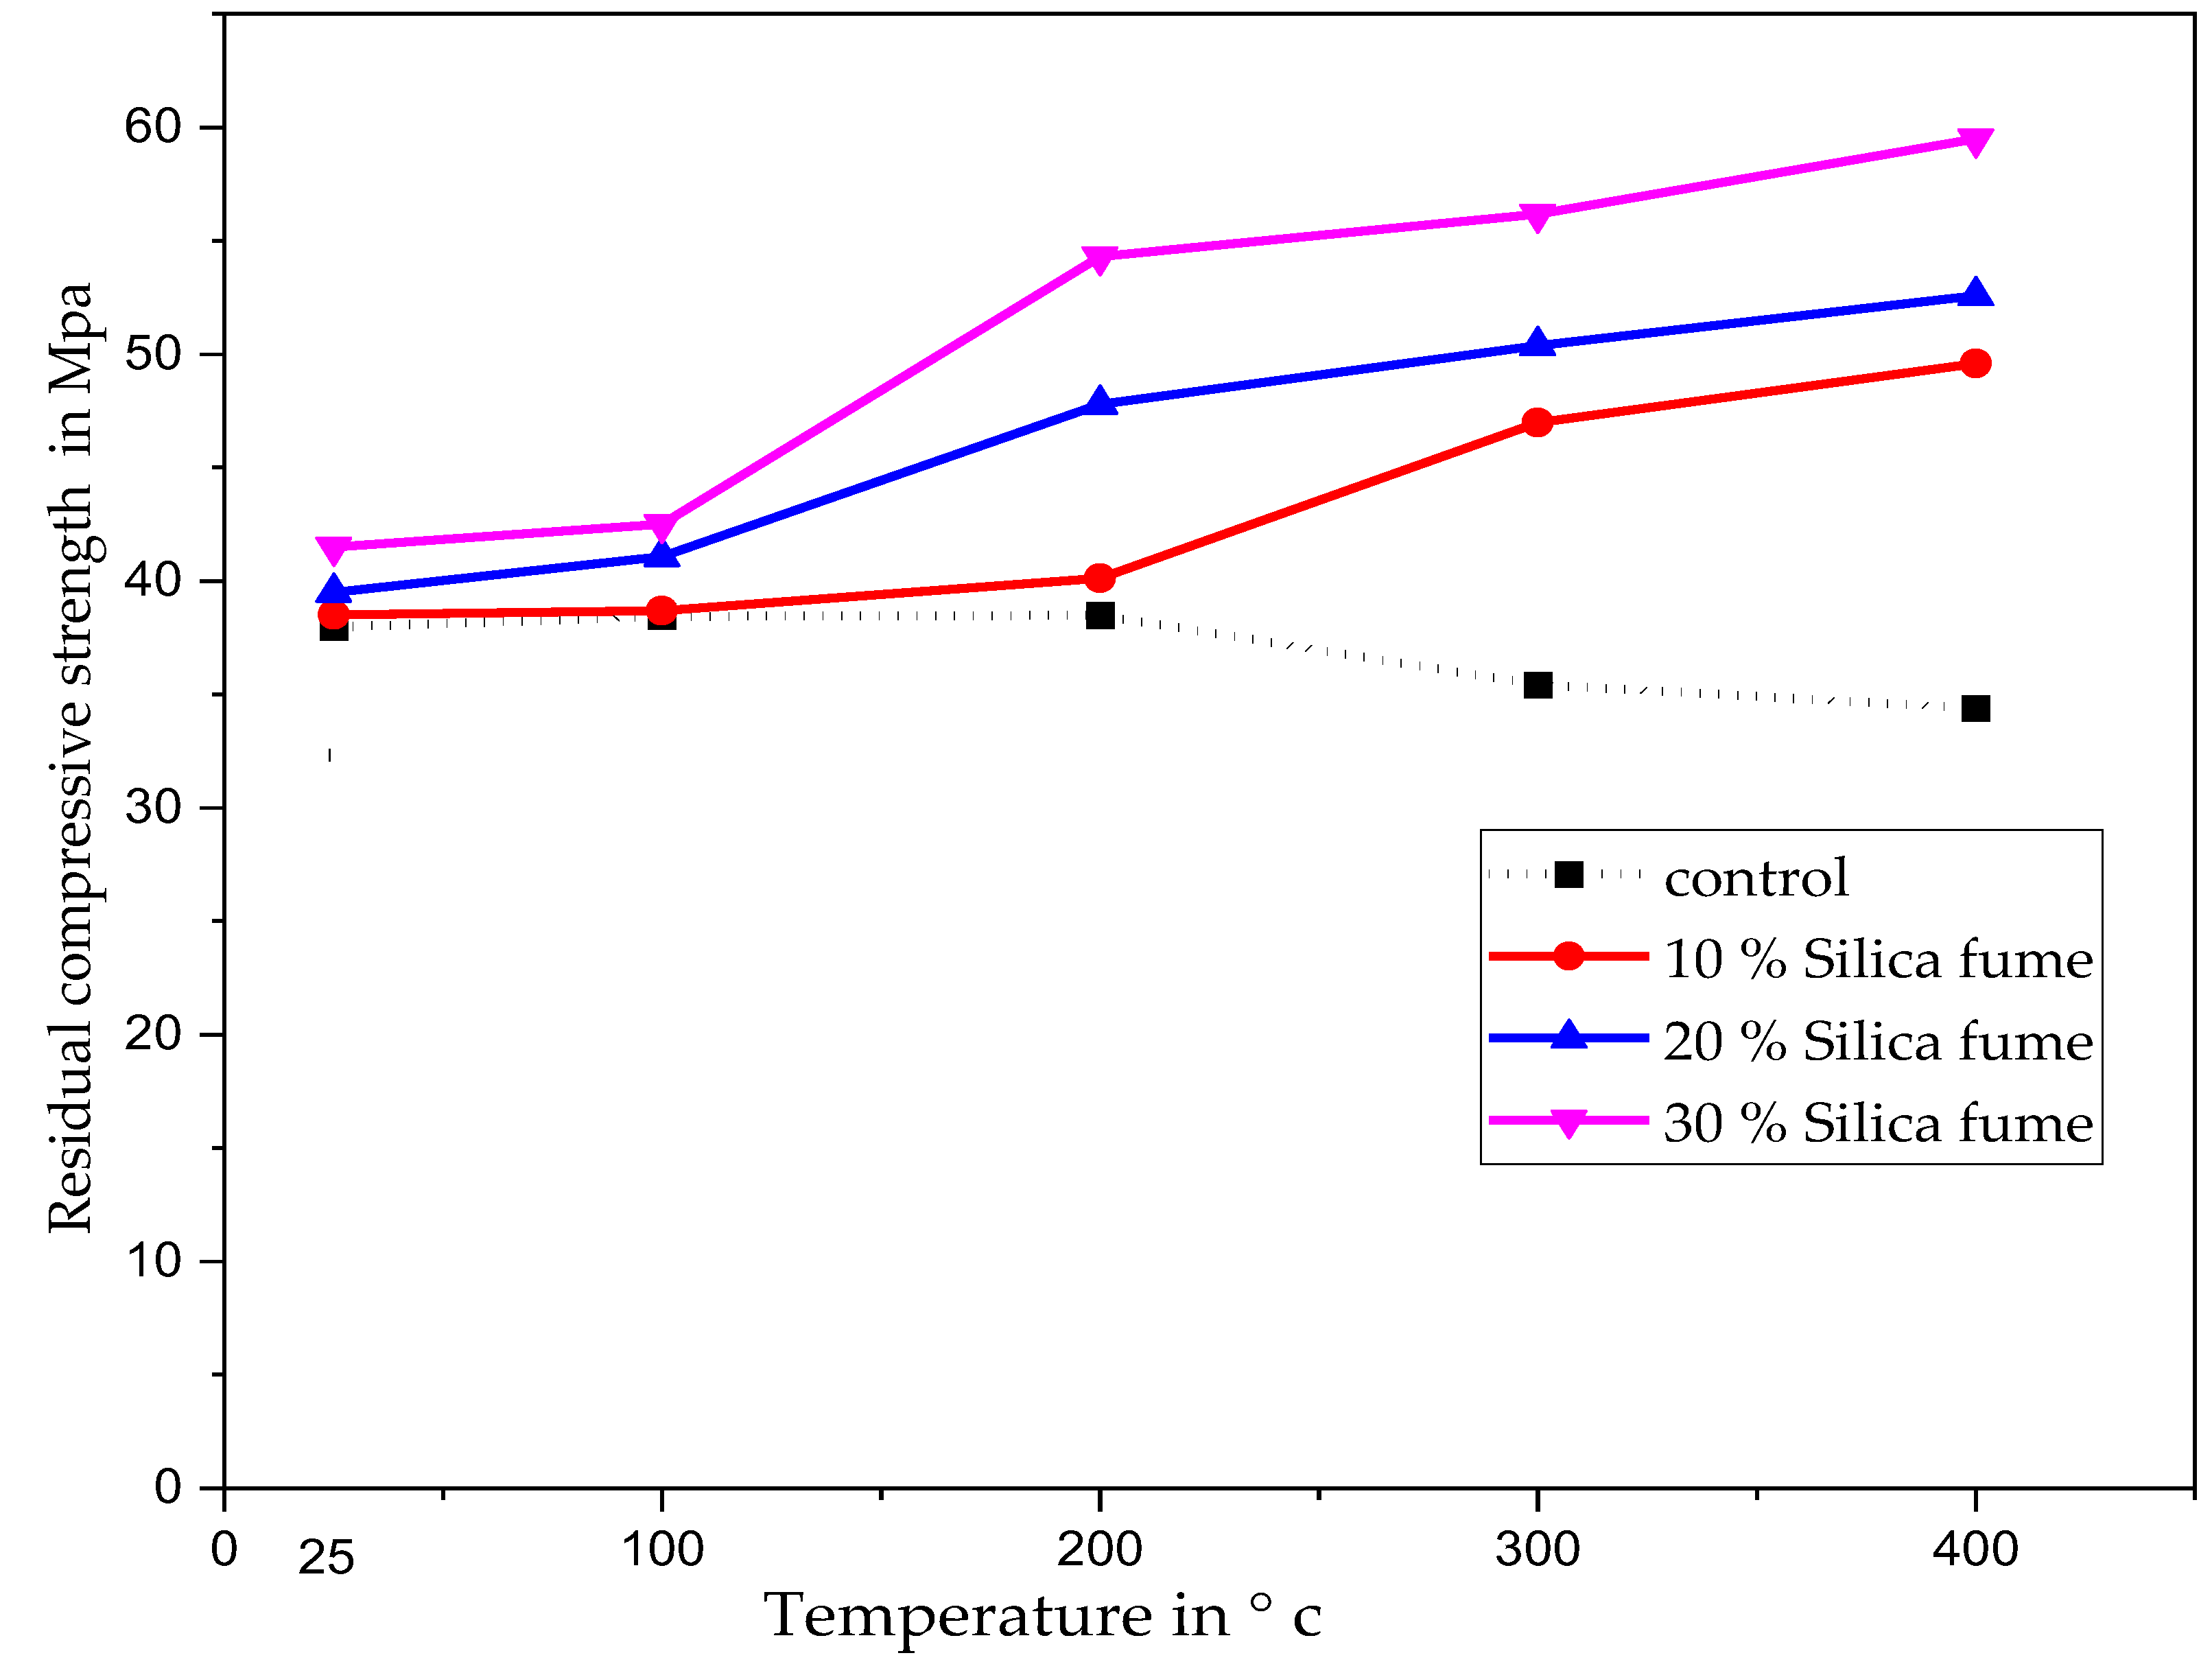
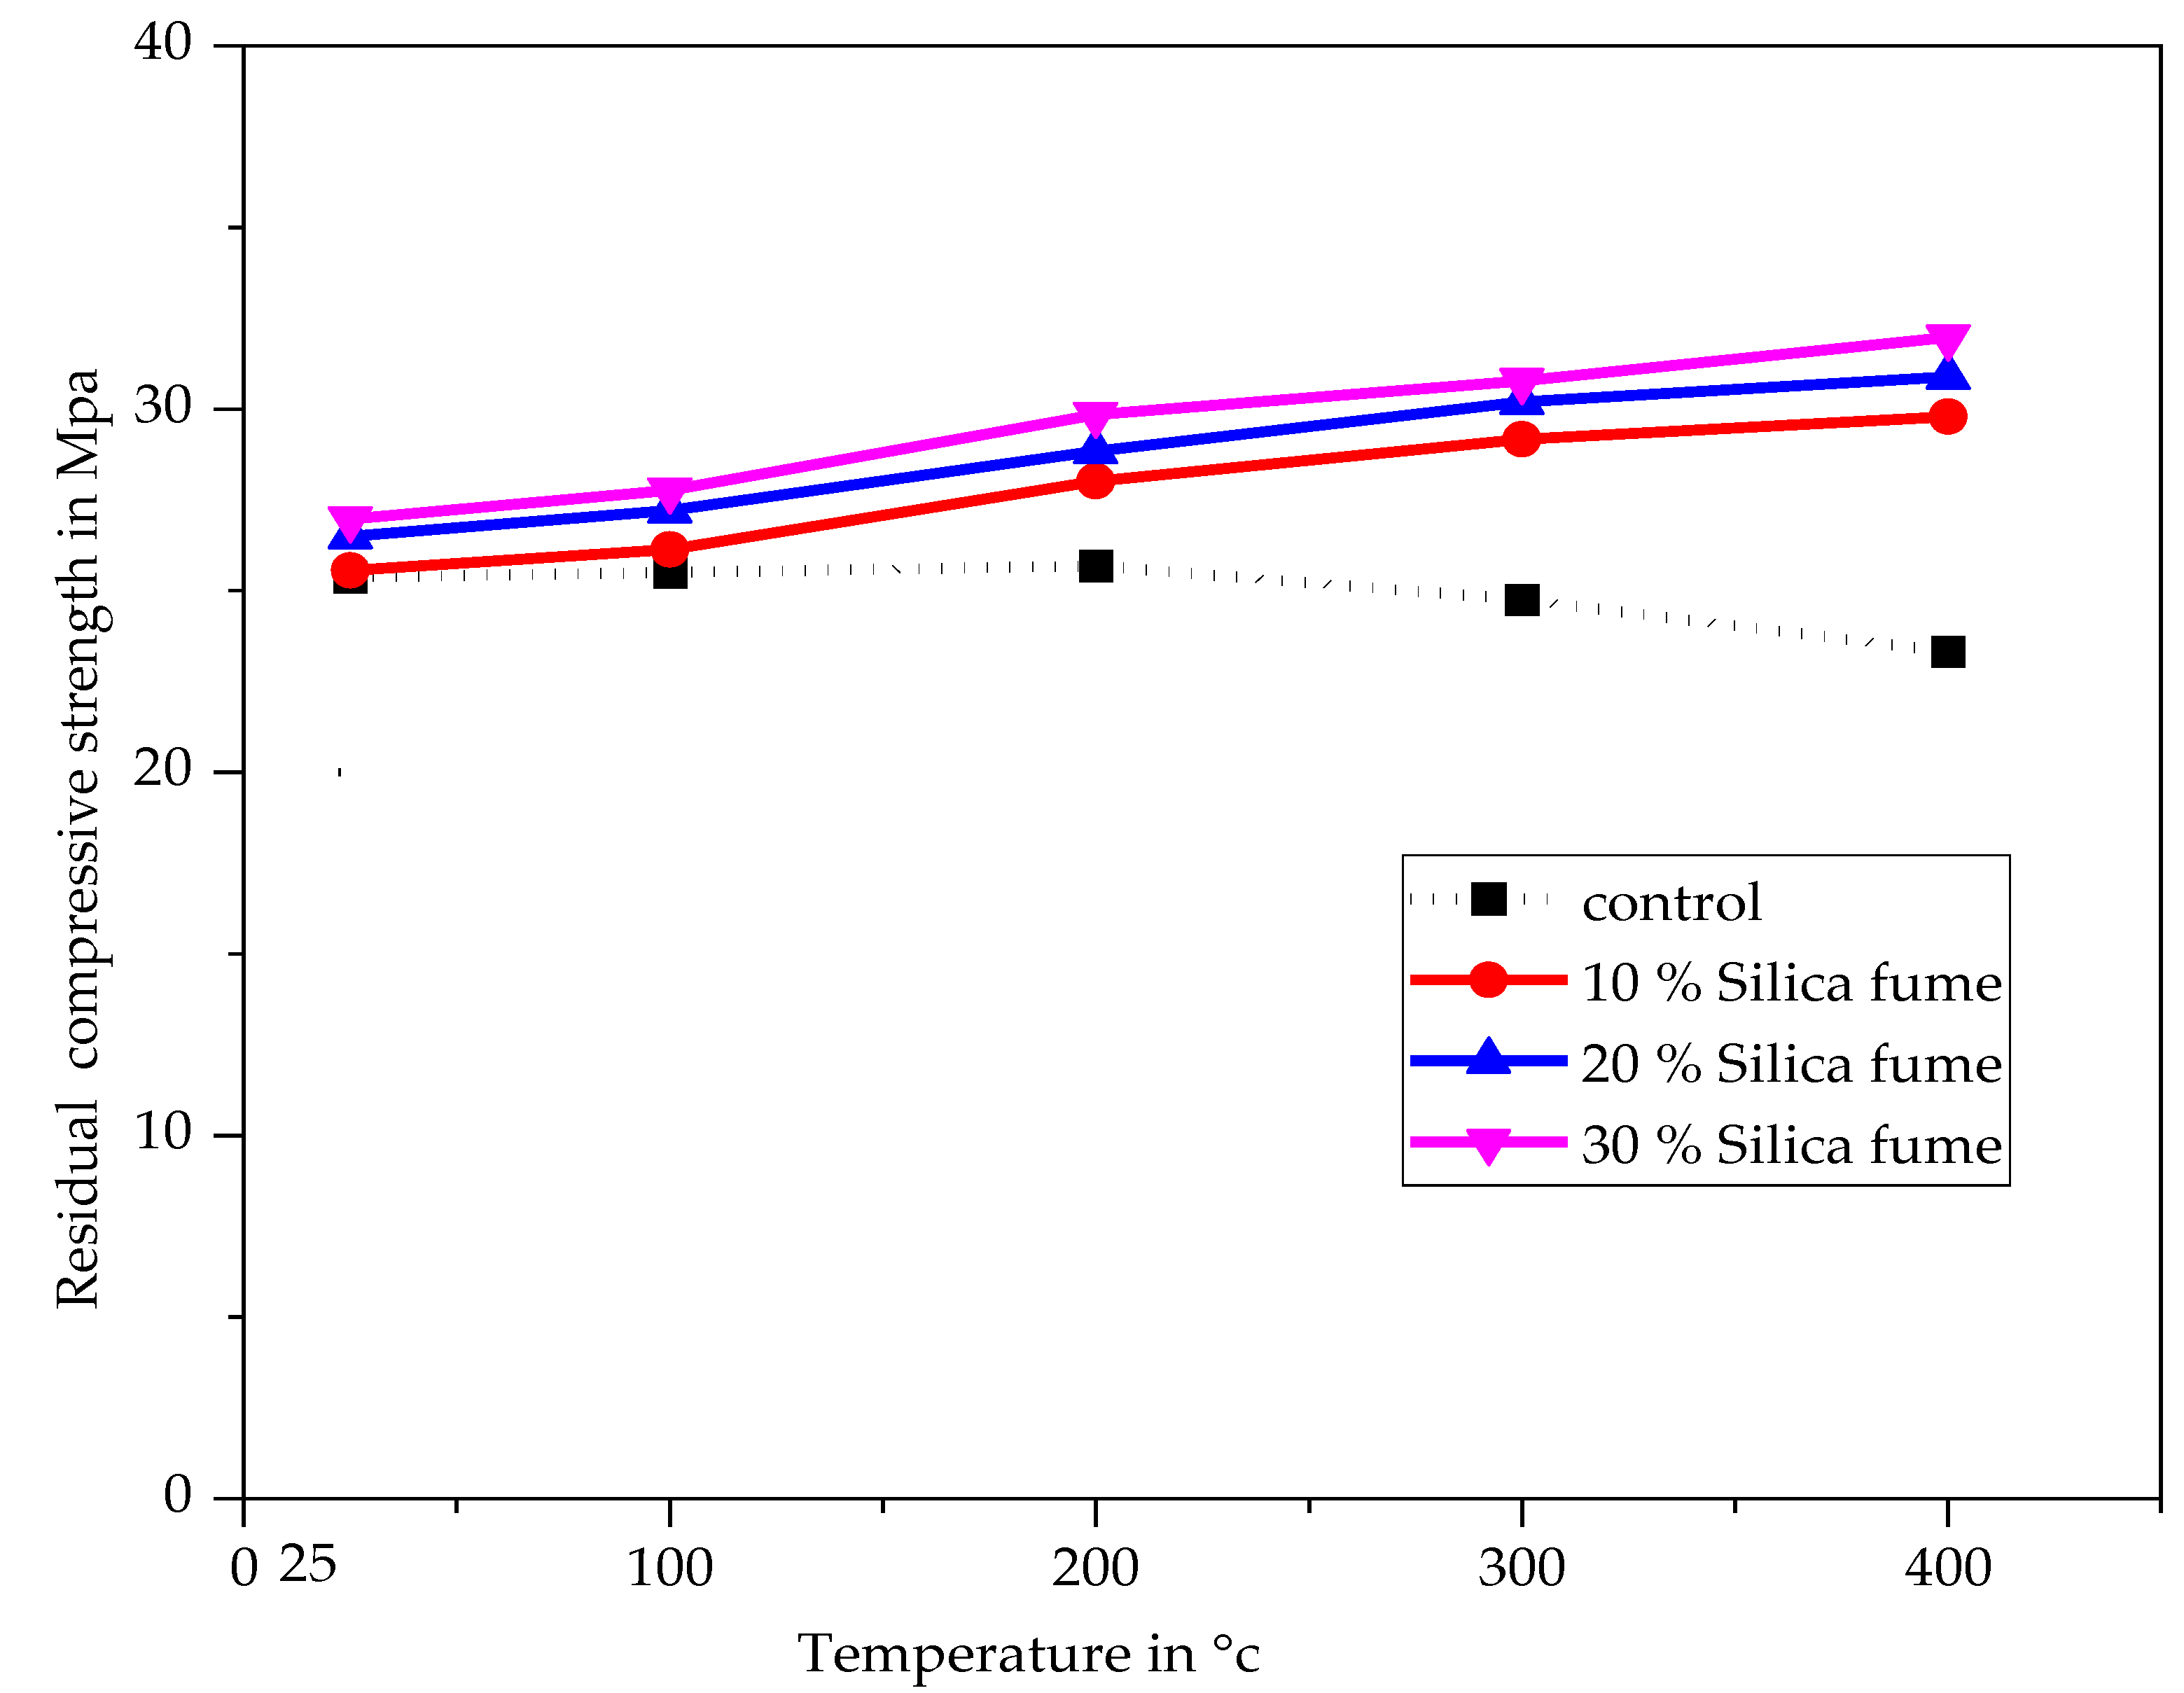
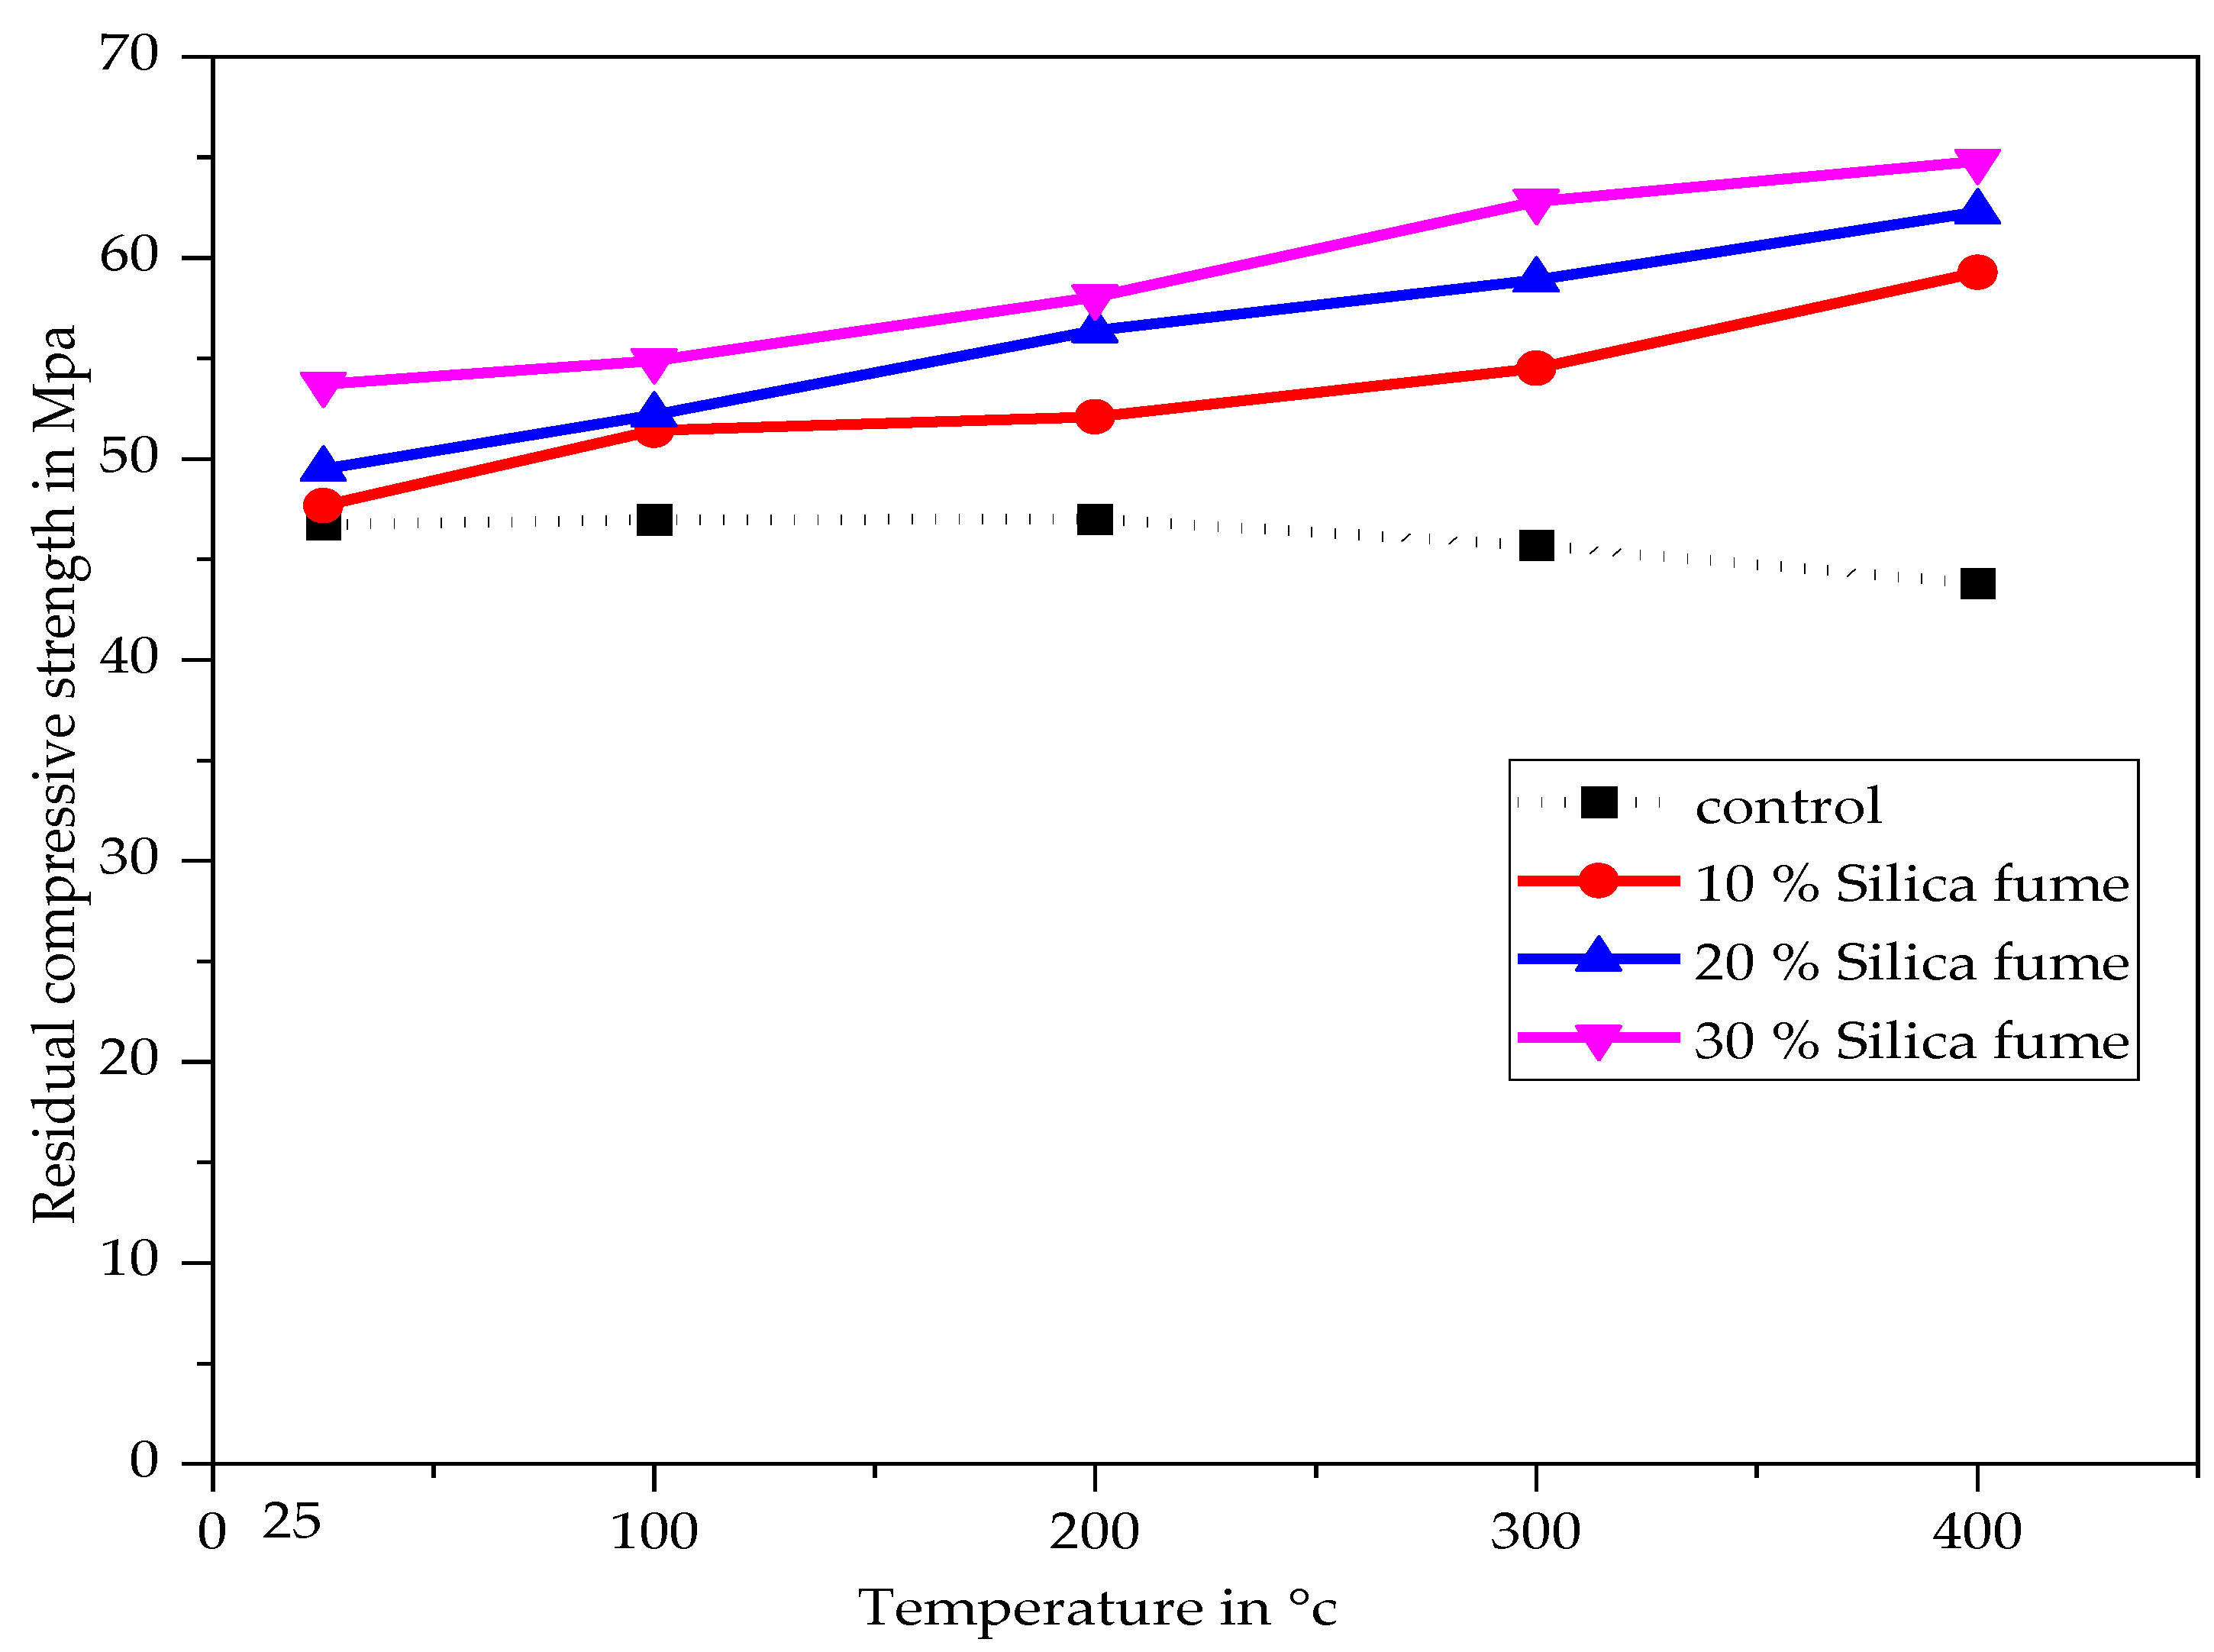
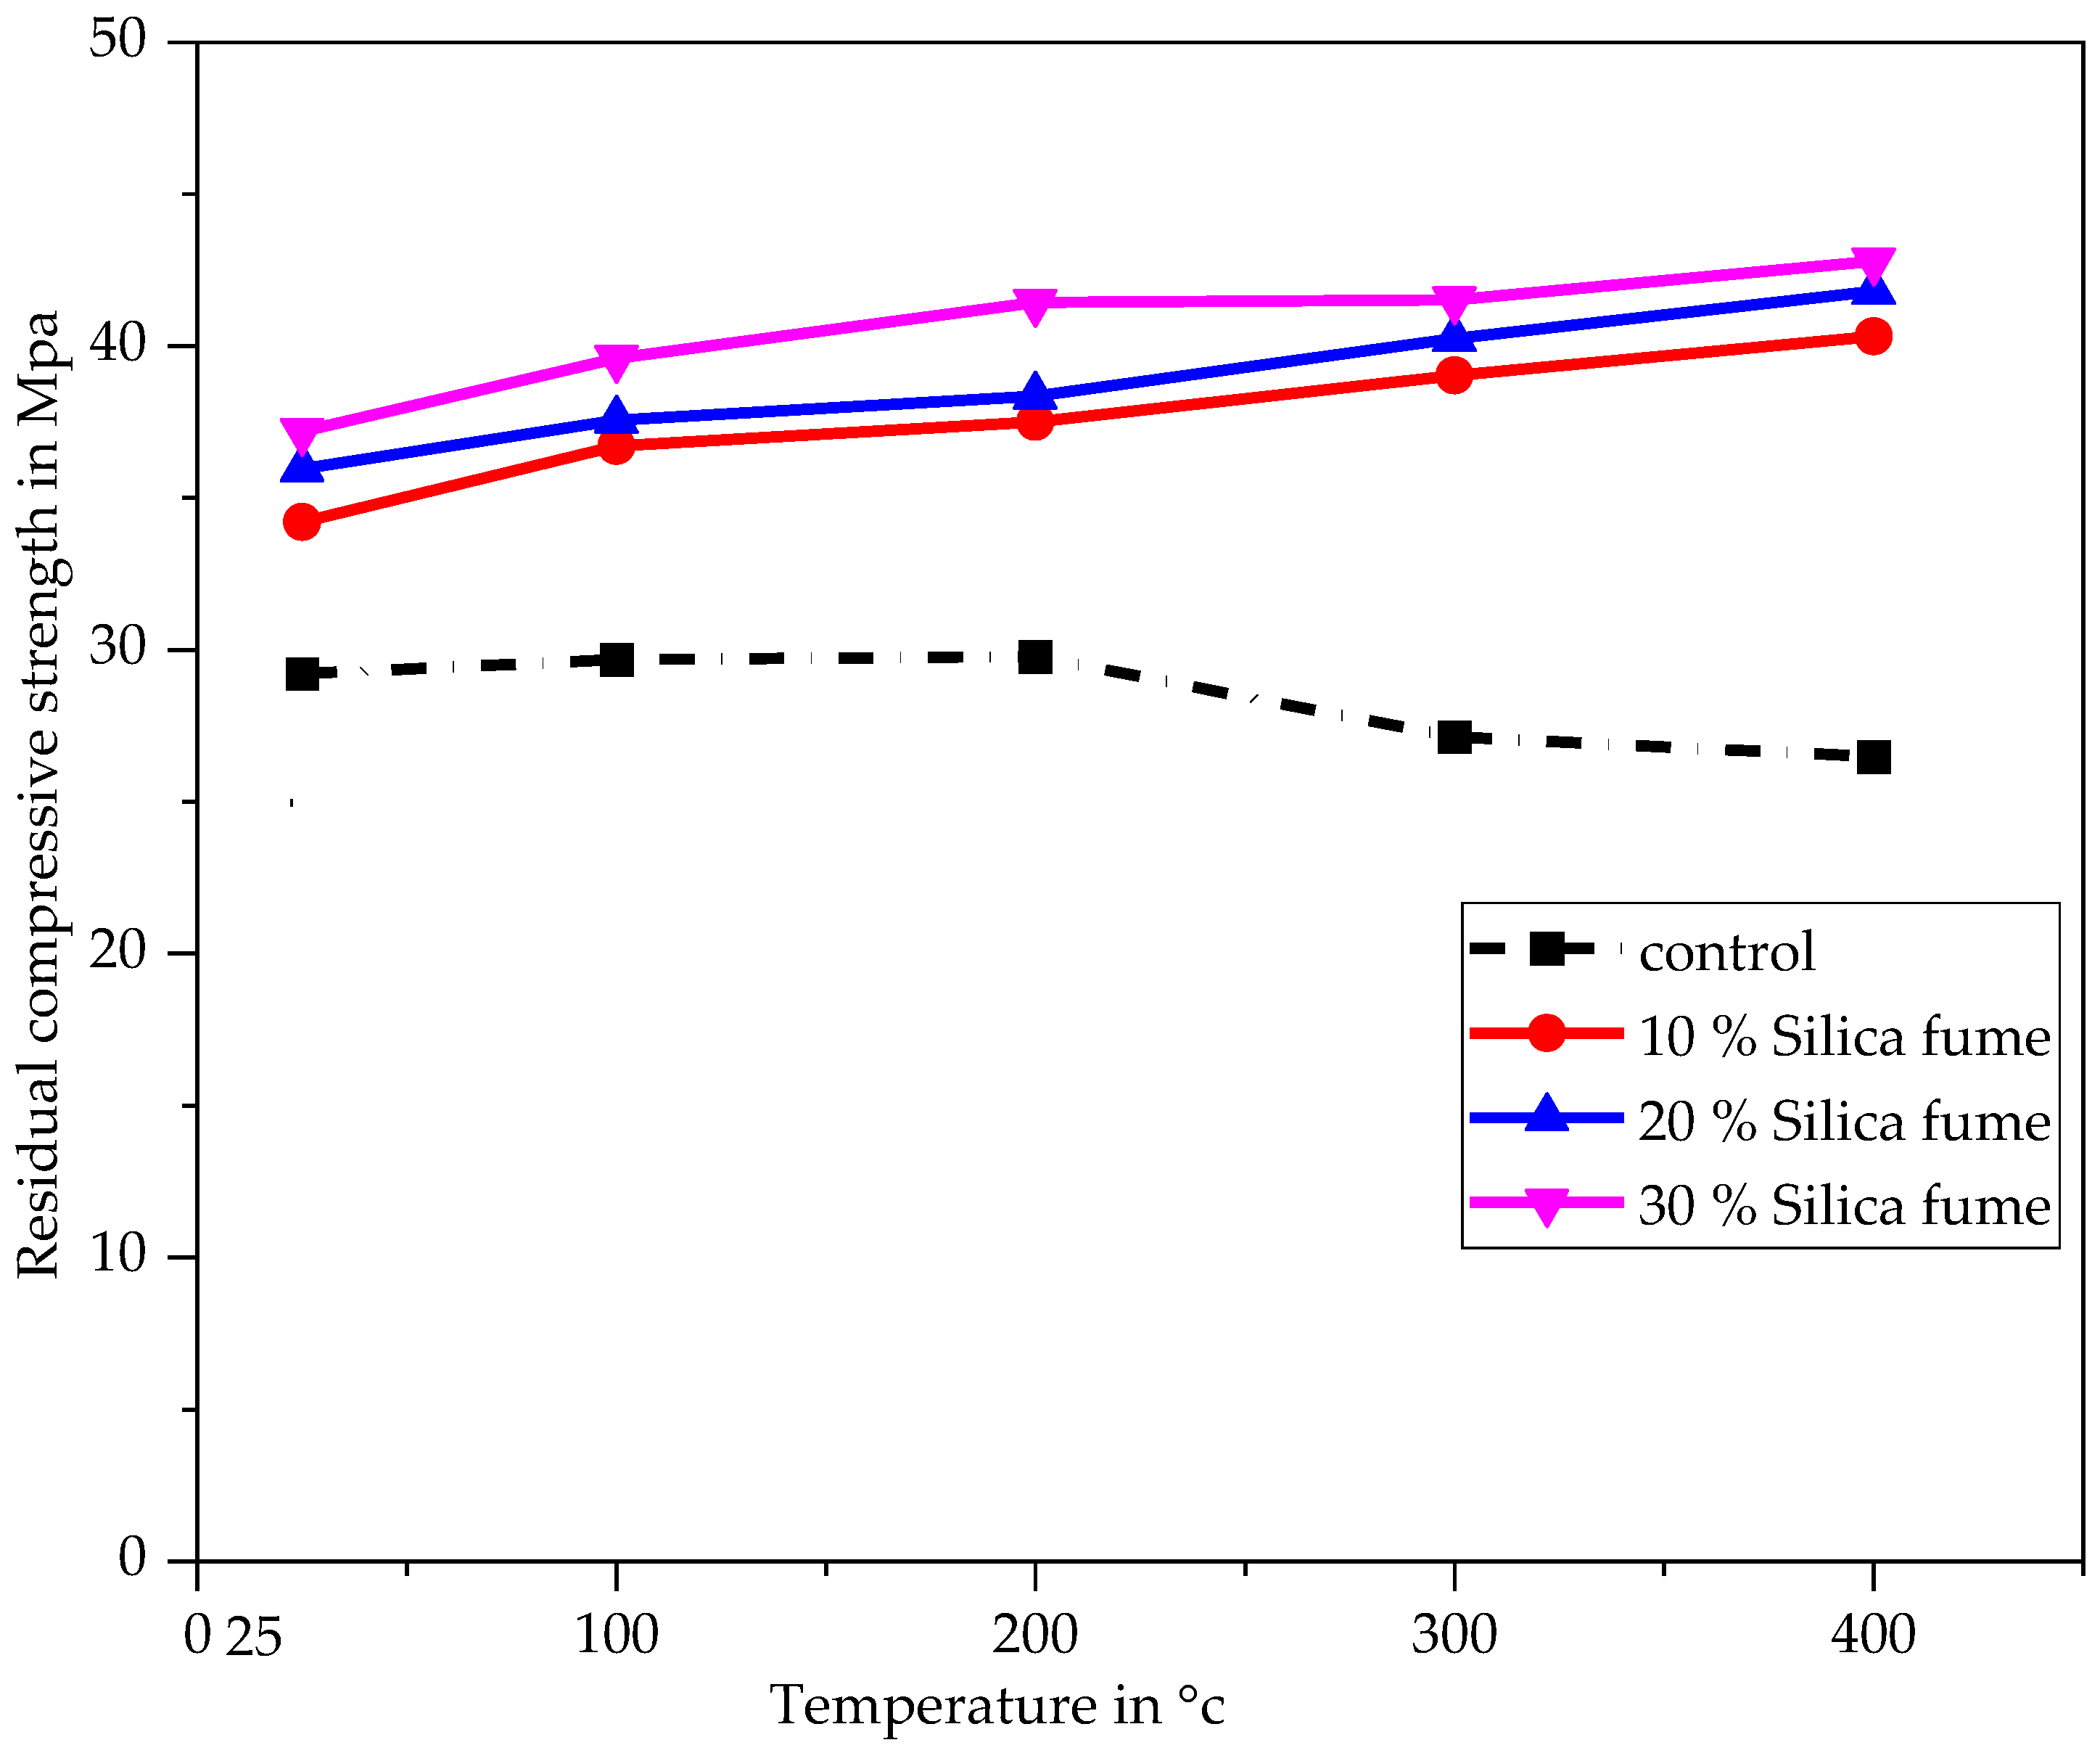
Figure 7 illustrates the development of compressive strength of the control cement paste and cement paste with silica fume curing at 7 days and exposed to temperatures of 25, 100, 200, 300 and, 400 for 2 h. Figure 8 shows the development of the strengths of control mortar, mortar with silica fume curing at 7 days, and mortar exposed to temperatures of 25, 100, 200, 300, and 400 for 2 h.
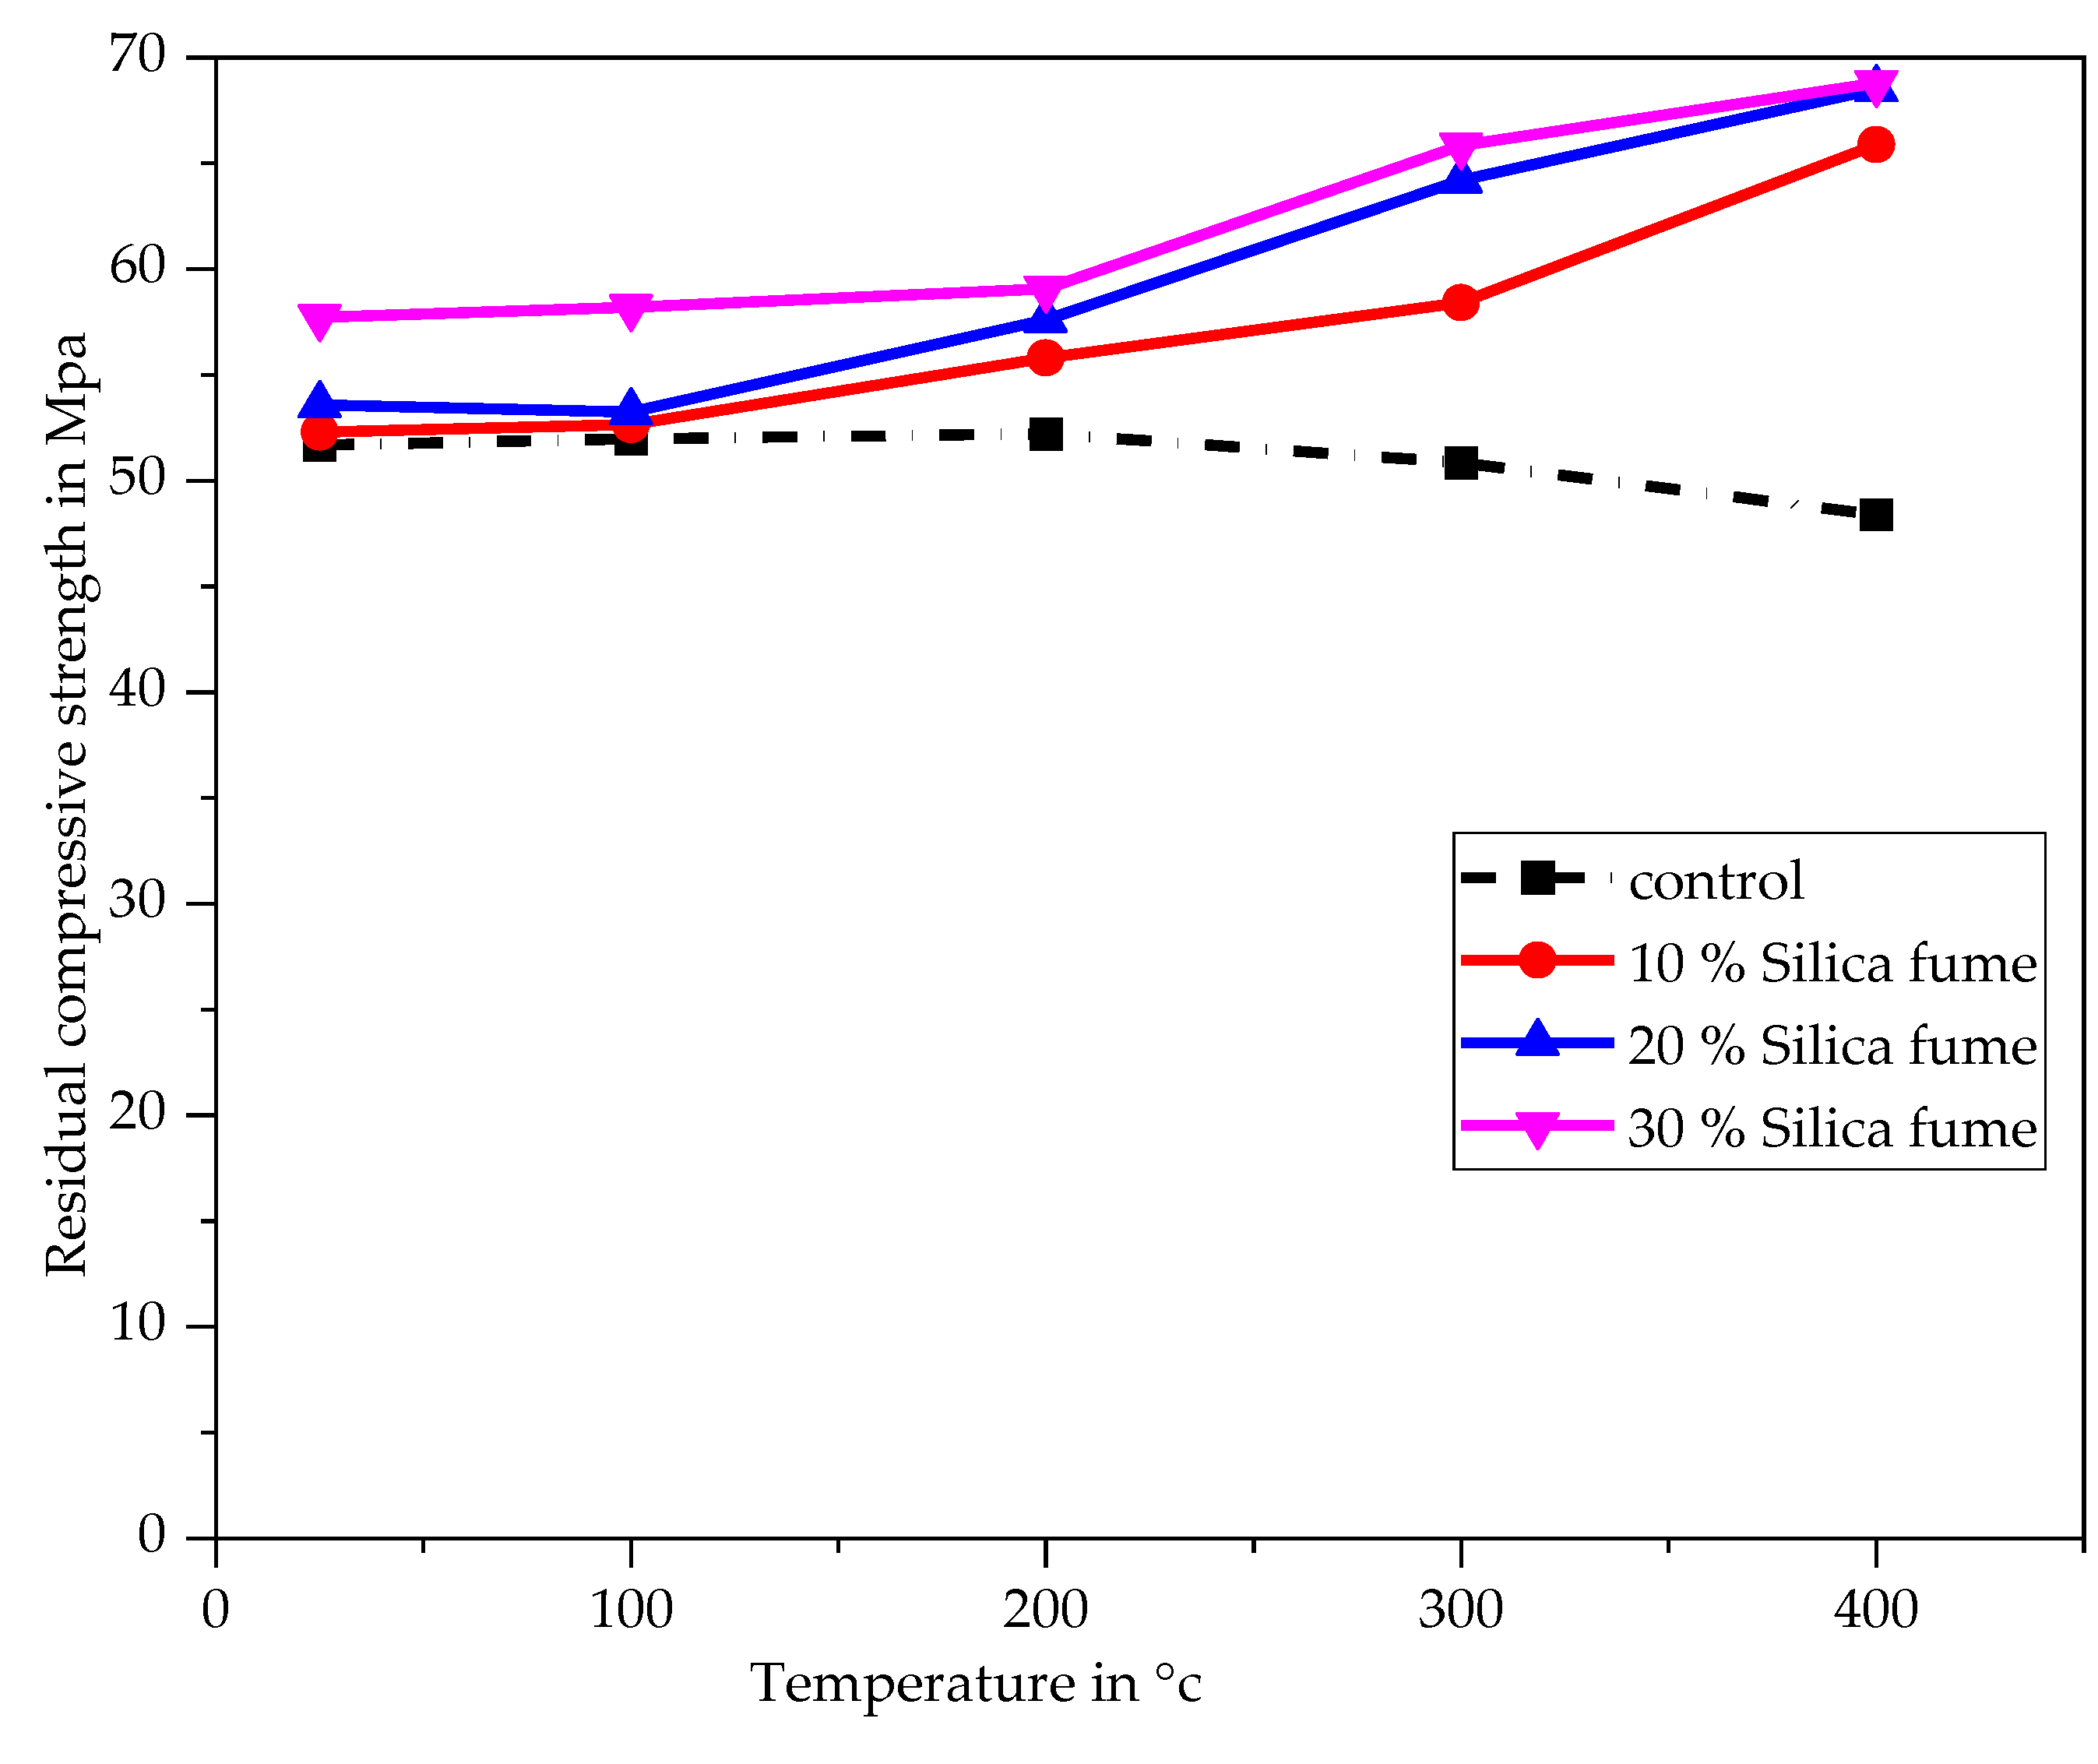
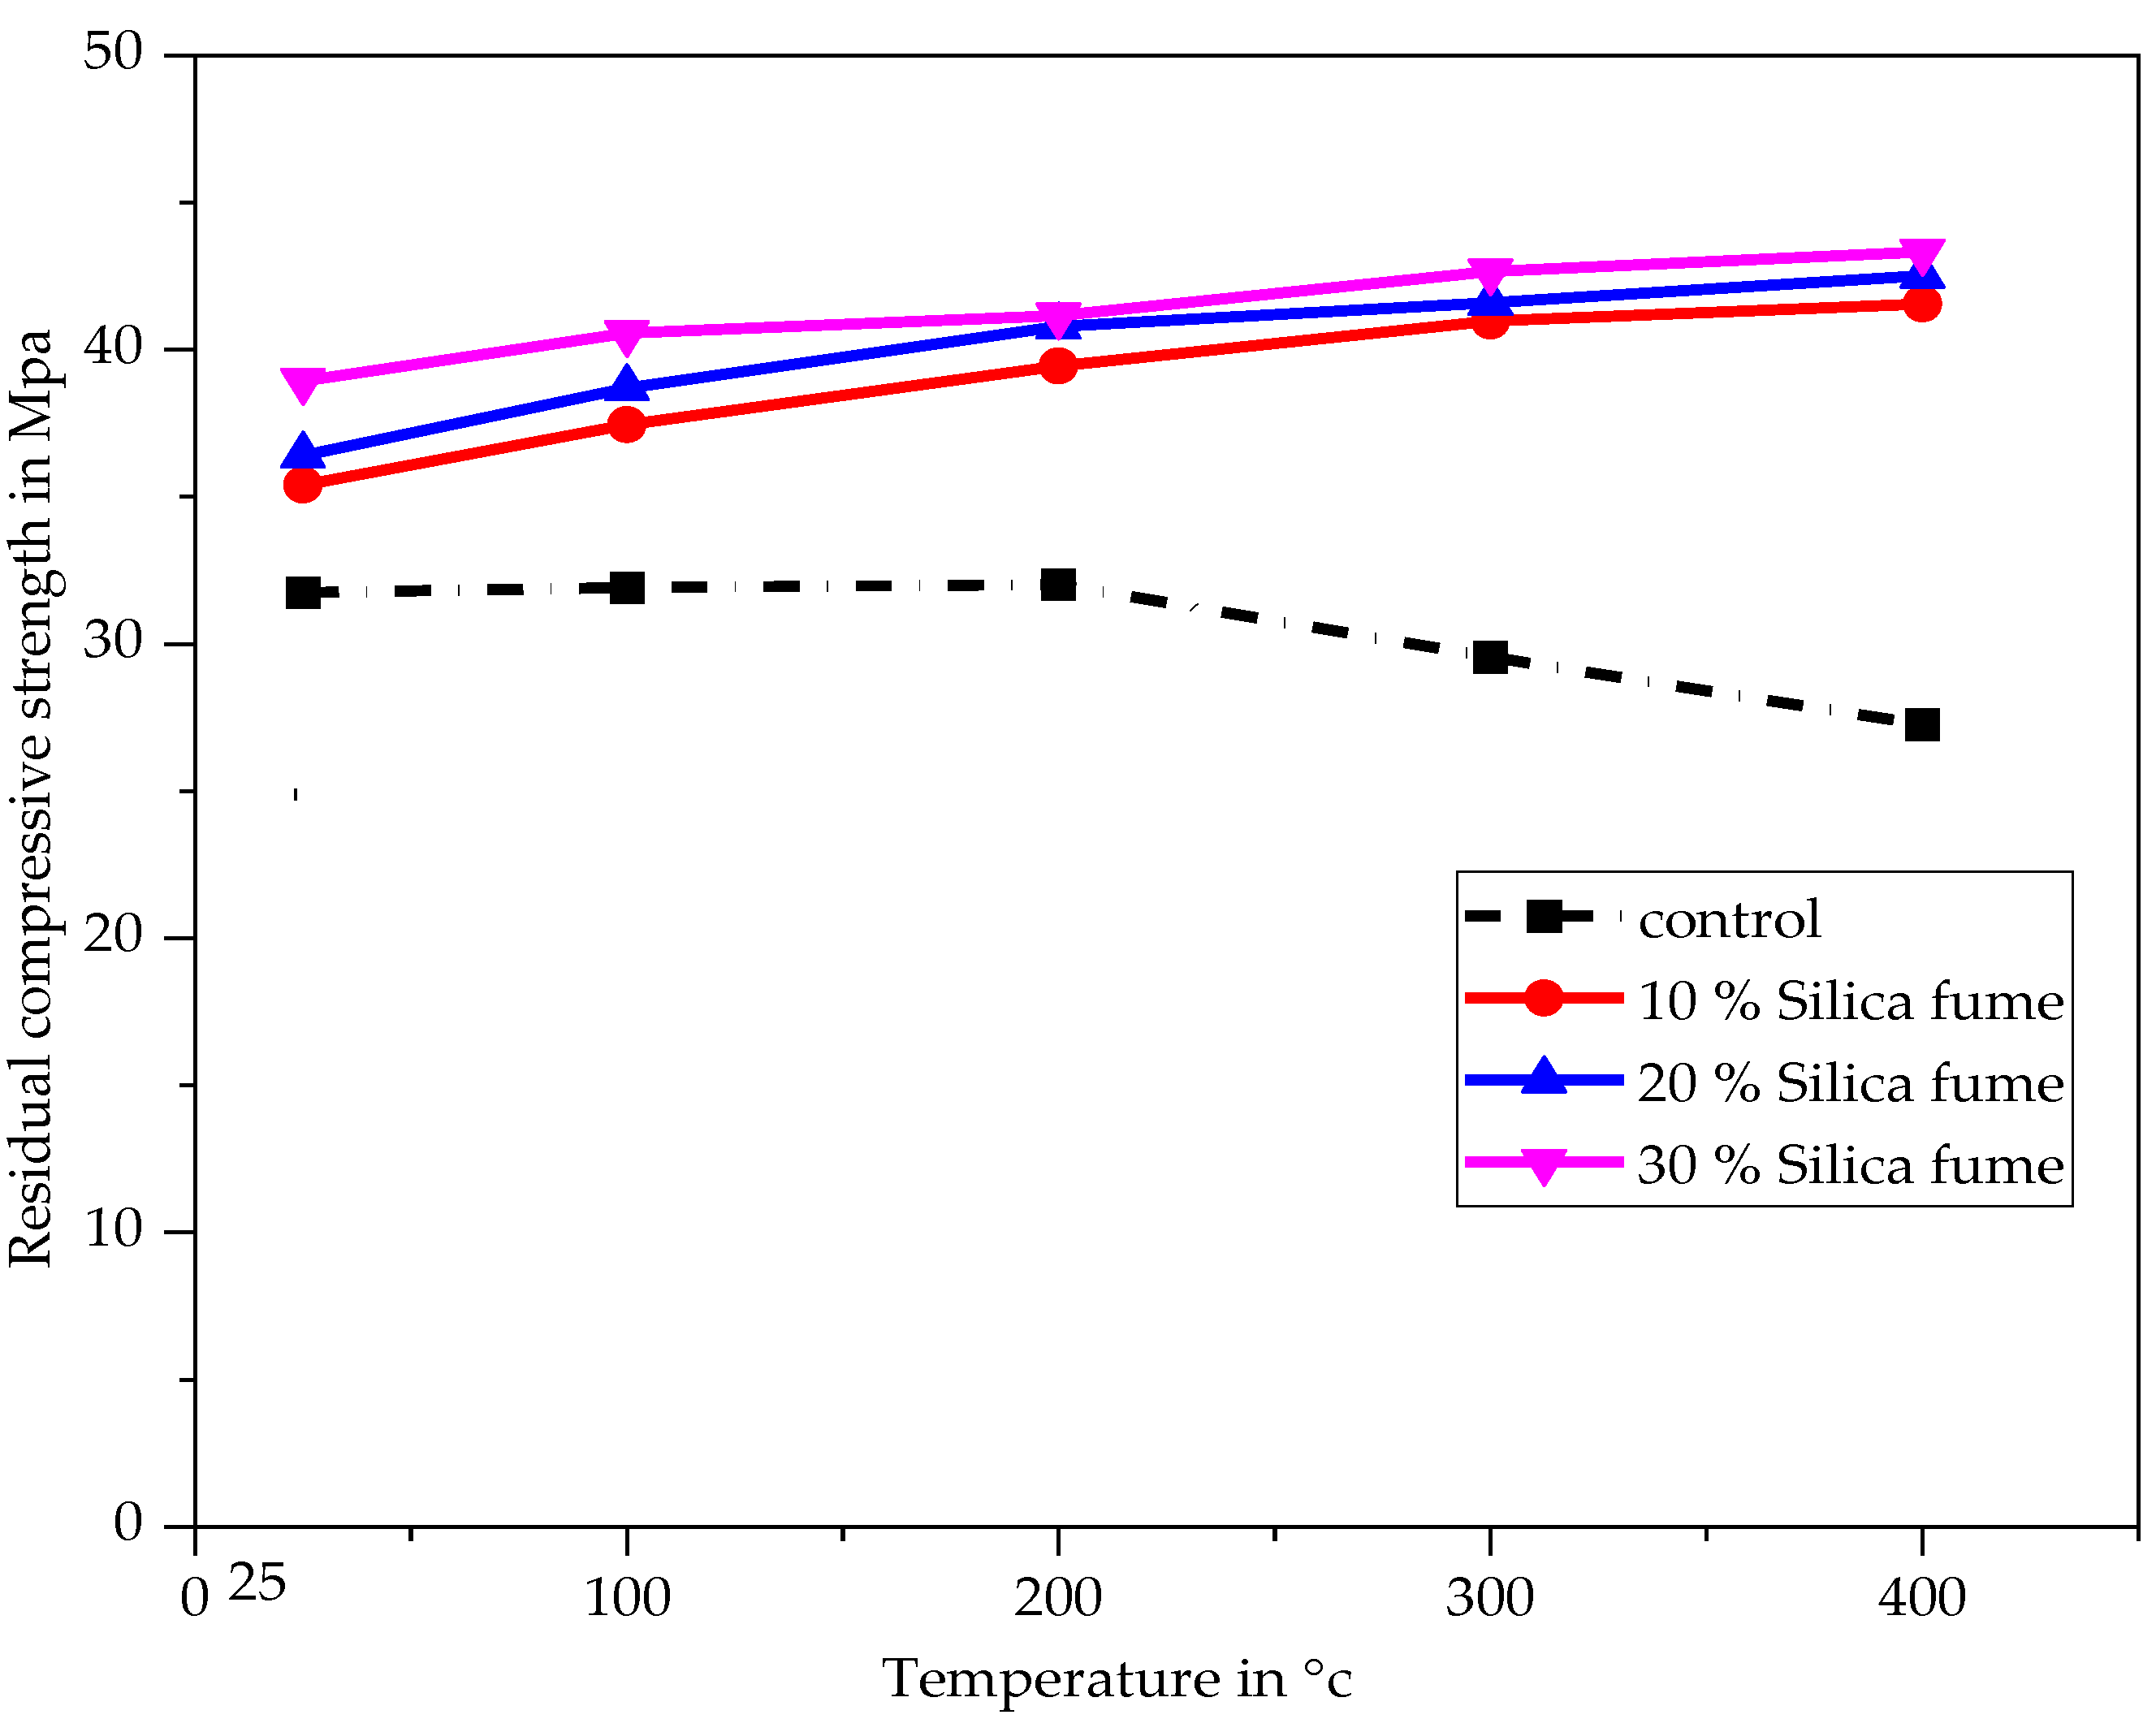
Figure 9 illustrates the development of the compressive strength of control cement paste and cement paste with silica fume curing 28 days and exposed to temperatures of 25, 100, 200, 300, and 400 for 2 h. Figure 10 shows the development of strength of the control mortar, and mortar with silica fume curing at 28 days and exposed to temperatures of 25, 100, 200, 300, and 400 for 2 h.
Figure 11 illustrates the development of compressive strength of control cement paste and cement paste with silica fume curing at 56 days and exposed to temperatures of 25, 100, 200, 300, and 400 for 2 h. Figure 12 shows the development of the strengths of control mortar and mortar with silica fume curing at 56 days and exposed to temperatures of 25, 100, 200, 300, and 400 for 2 h.
At 25 , the different mixes of silica fume-cement paste and silica fume-mortar showed higher strength than the control cement paste and control mortar mix at 7, 28, and 56 days (Figure 7, Figure 8, Figure 9, Figure 10, Figure 11 and Figure 12). This is due to the pozzolanic reaction of silica fume with free lime to produce extra C-S-H phases leading to higher compressive strengths. Furthermore, the compressive strengths of silica fume-cement paste and silica fume-mortar for the mix proportions increased with curing age (Figure 7, Figure 8, Figure 9, Figure 10, Figure 11 and Figure 12).
A 30% replacement of cement by silica fume gave better results in both cement paste and mortar. Ref. [55] found that the optimum silica fume content for achieving higher strength of mortars ranges between 15 and 22%. That is in discordance with the results obtained in this study. The results of this study have shown that 30% silica fume has no adverse effect on the strength of mortar and gives higher strength compared to the other percentages. The difference in results may be due to the different water/binder ratios used for each study and also to the mixed design adopted. The strength gain of the silica fume-cement paste with respect to the control mix was in the order of 9% gain for 30% replacement levels at 7 days, 15% gain for 30% replacement levels at 28 days, and 12% gain for 30% replacement levels at 56 days.
The compressive strength of the control cement paste and the control mortar slightly increased with temperatures up to 200 and decreased with temperatures up to 400 . The increase in compressive strength up to 200 °C could be attributed to additional hydration of unhydrated cement grains as a result of the steam effect under the conditions of the so-called internal autoclaving effect [43]. Ref. [56] also reported a slight increase in the compressive strength of cement paste and mortar at temperatures up to 200 °C. The decrease in strength after 200 is due to the evaporation of the most strongly bonded water, which is involved in the formation of hydrates and the preparation of Portlandite decomposition [11]. The loss of strength at 400 in the control cement paste was approximately 11, whereas the strength loss in the control mortar was 9.2, which is close to the 9 found by [56].
As the temperature increased up to 400 , the strength of the silica fume-cement paste and silica fume-mortar increased accordingly. Moreover, the 30 replacement of cement with silica fume gave better results in cement paste and mortar. Ref. [43] also found that the residual compressive strength of combined silica fume and metakaoline in hardened cement paste increased up to 400 and then decreased up to 800 . They suggested that the increase in strength was caused by higher volumes of C-S-H in silica fume-cement pastes and a decrease in Ca(OH)2 content when compared to the control cement paste. The study further suggested that the crystalline products formed depended principally on the metakaoline/calcium hydroxide ratio and reaction temperature.
At 400 the strength gain of silica fume-cement paste with respect to the control mix was in increasing order of 29, 33, and 43 for 10, 20, and 30% replacement levels at 7 days; 28, 26, and 21 for 10, 20, and 30% replacement levels at 28 days; and 26, 28, and 19 for 10, 20, and 30% replacement levels at 56 days. Improvements in compressive strength at an elevated temperature at different curing ages can be justified by the additional tobermorite and xonotlite gels found in the hardened silica fume-cement paste at 400 which was formed due to the faster reaction of silica fume with Ca(OH)2 at elevated temperatures. These tobermorite and xonotlite gels are usually qualified as crystalline and stable phases responsible for preventing the loss of strength in the cement matrix [57,58].
3.3. Microstructure of Hardened Cement and Mortar Control and of Hardened Cement and Mortar Control
3.3.1. XRD Analysis
Hardened control Cement paste at 25 and 400
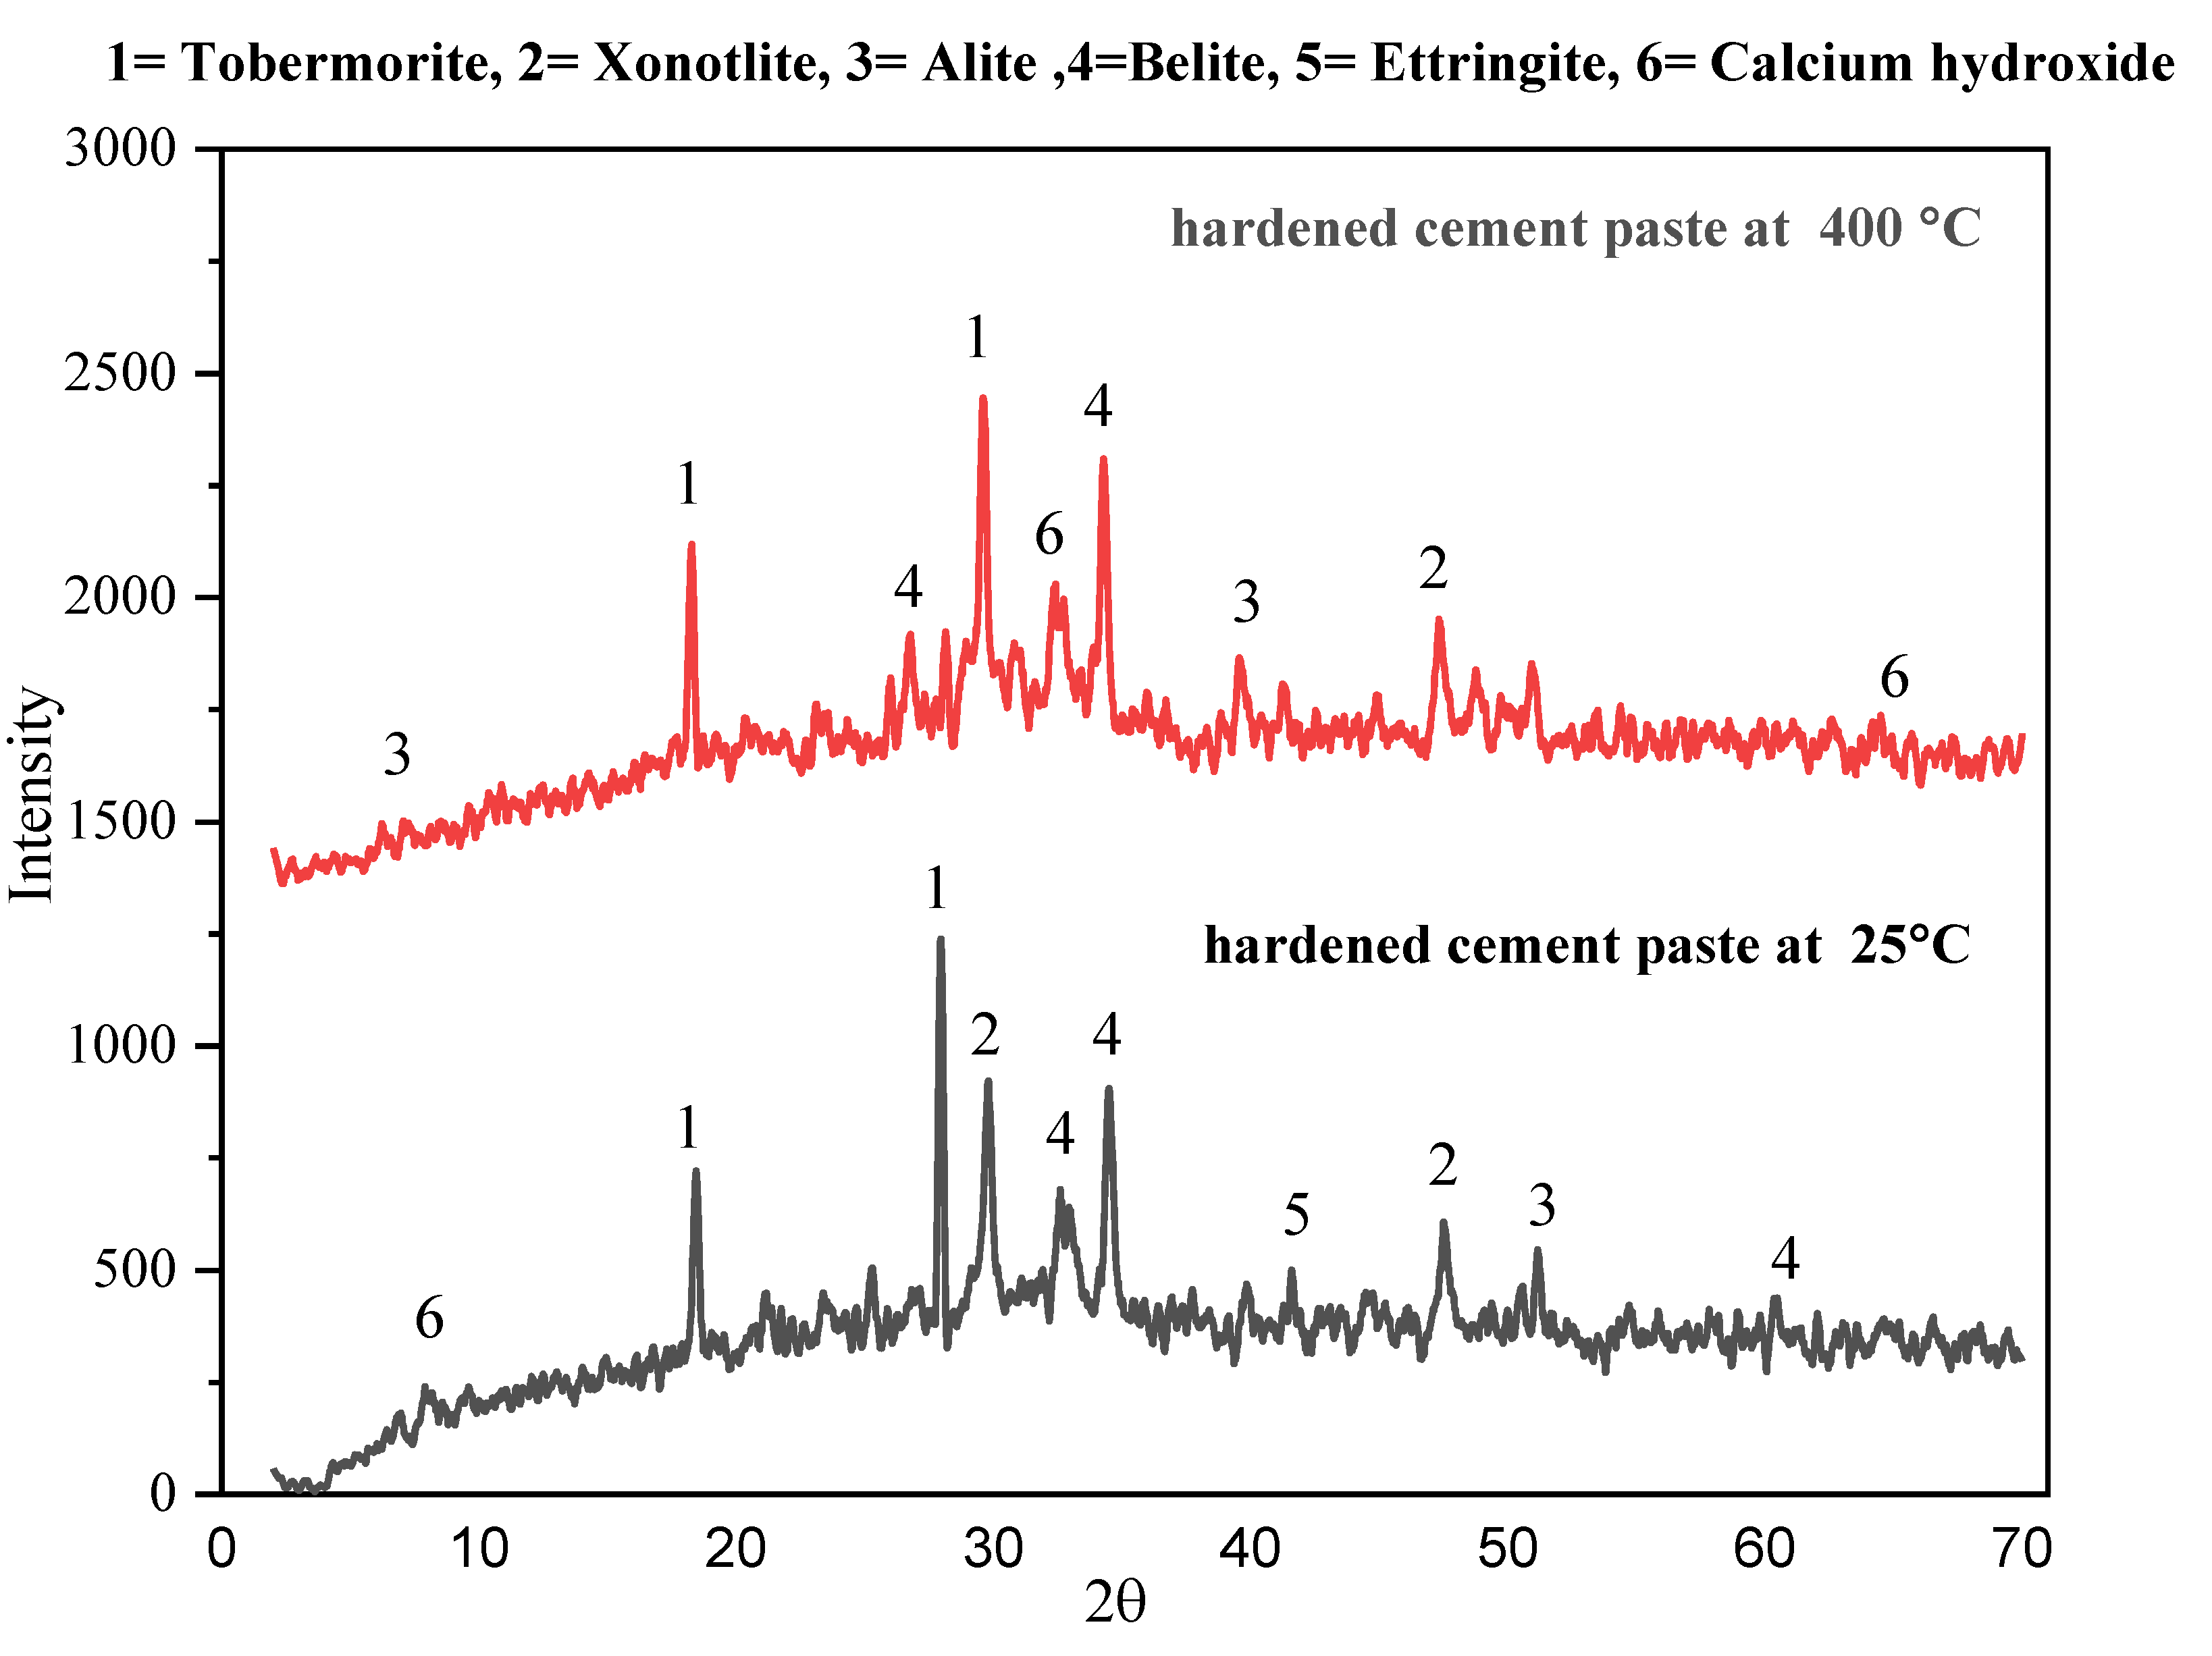
Figure 13 illustrates the XRD patterns of cement paste at 25 and fired at 400 .
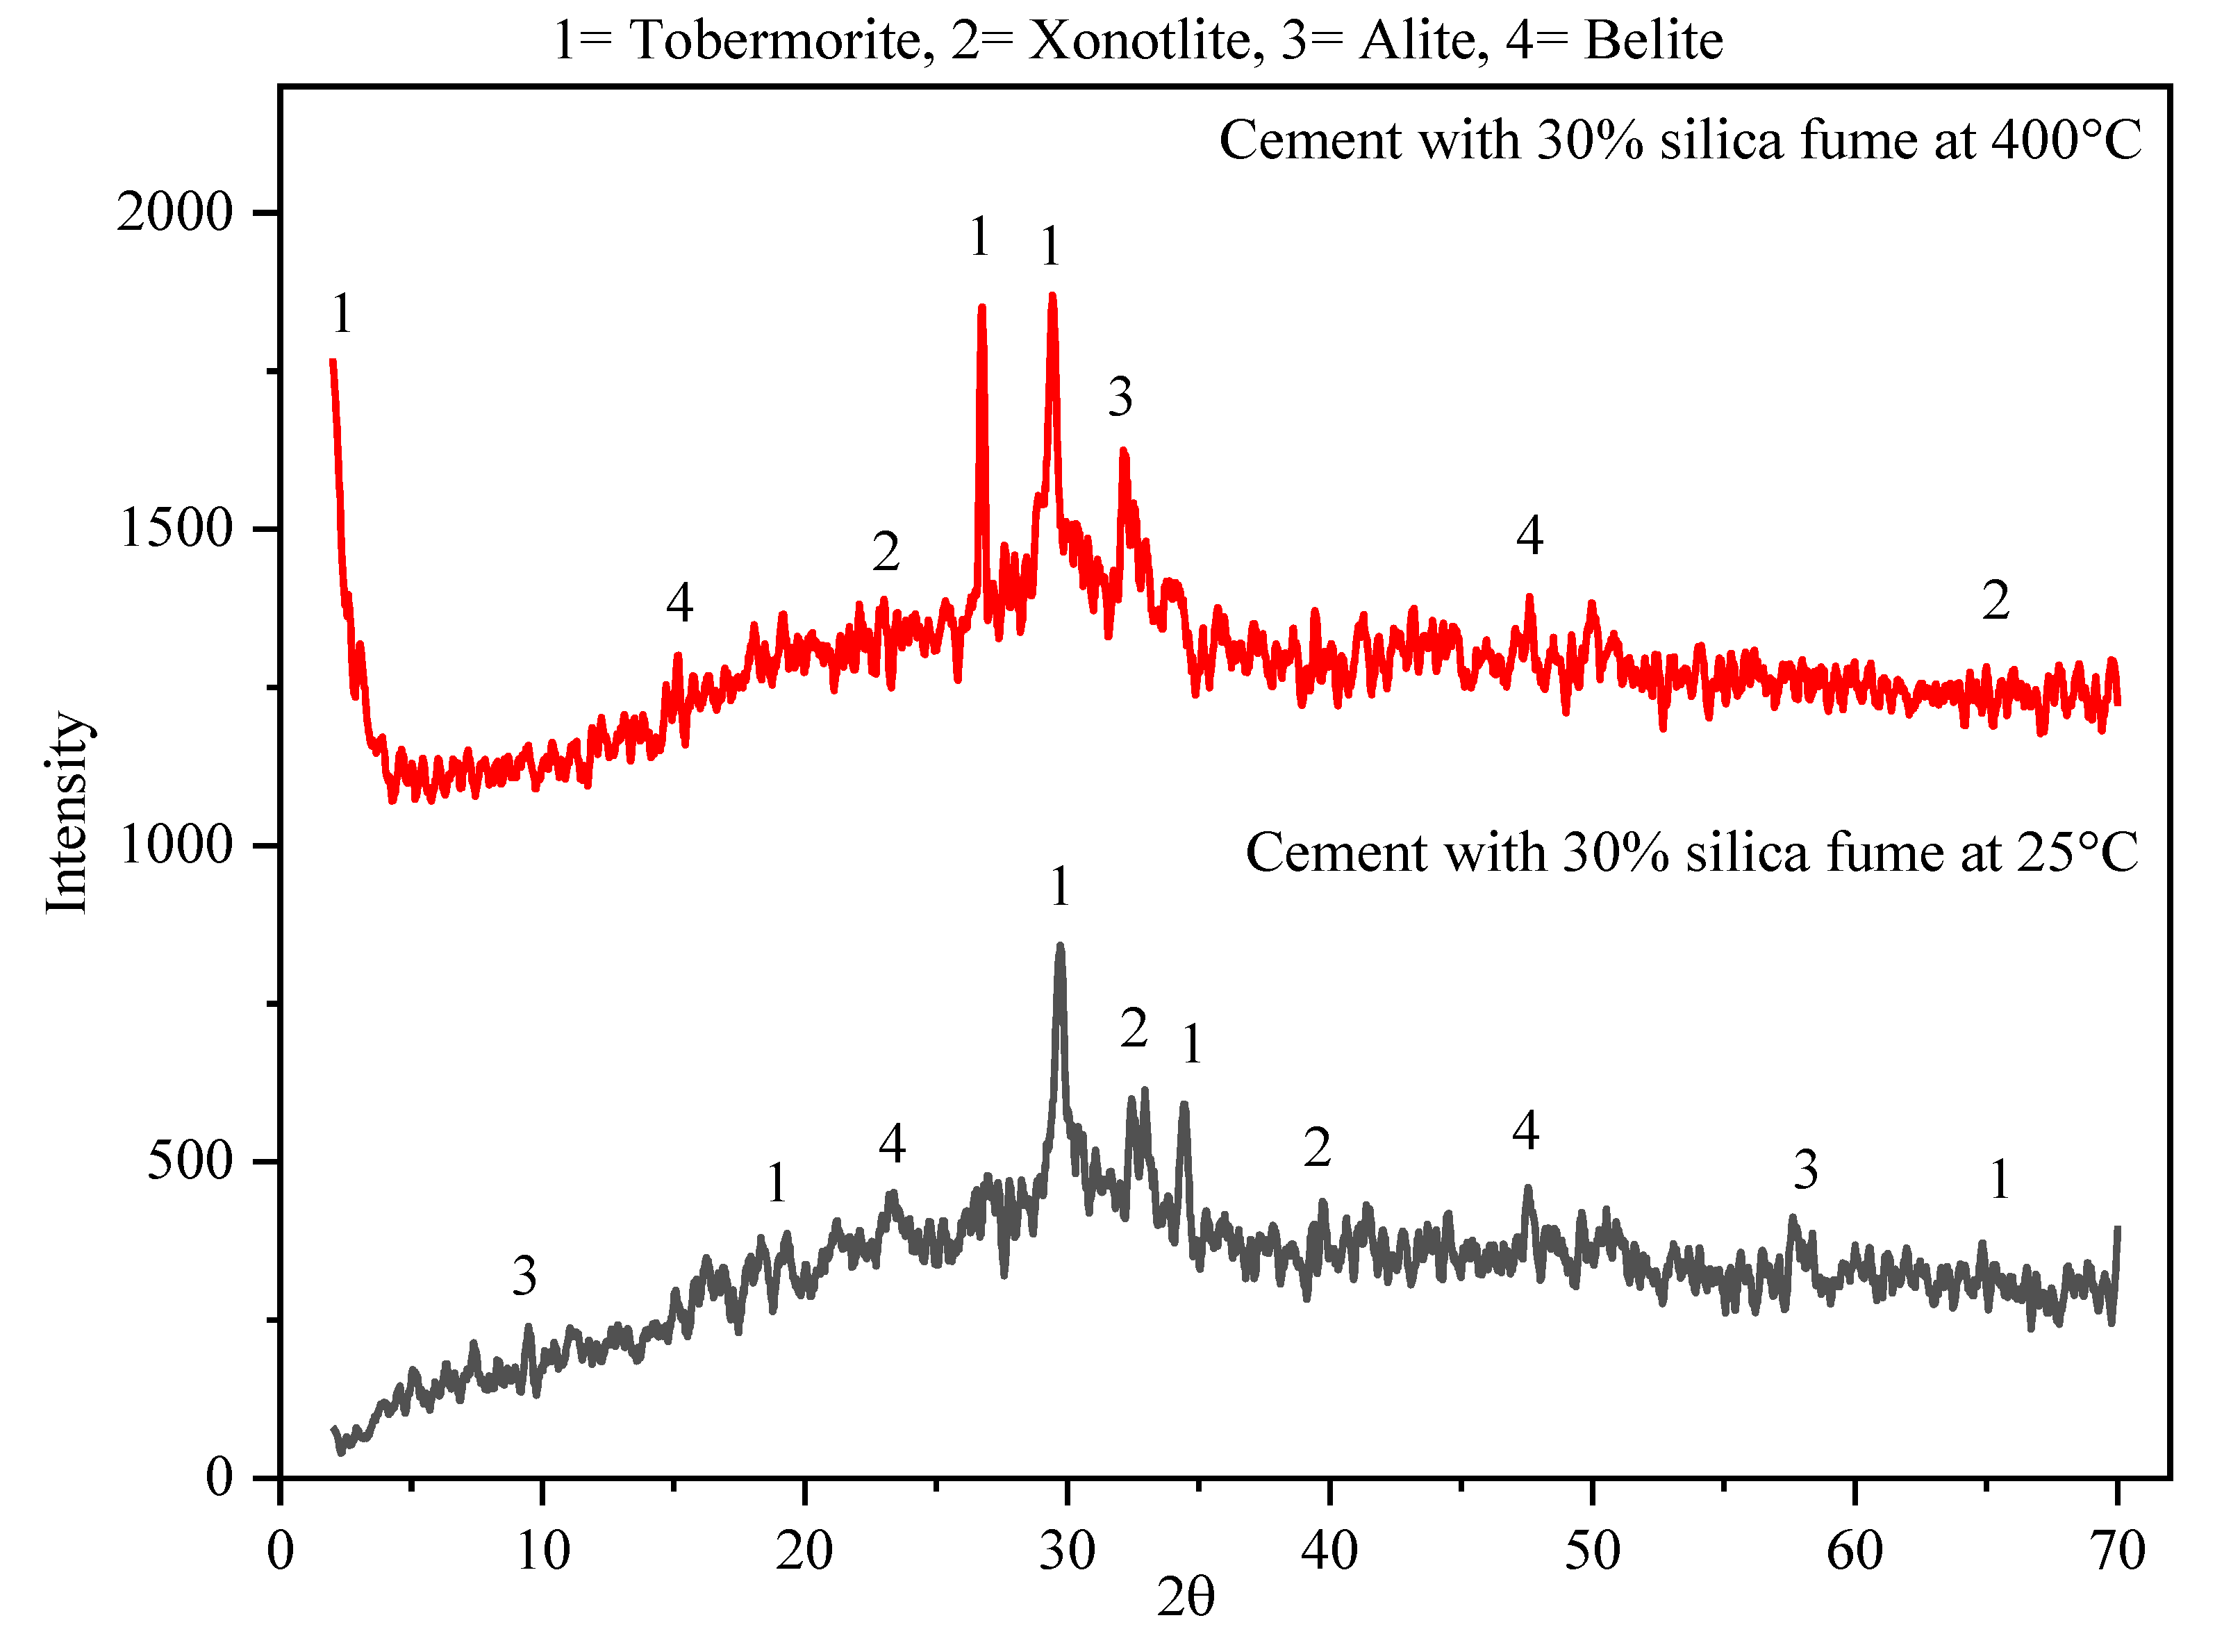
Figure 14 illustrates the XRD Patterns of cement paste with 30% silica fume at 25 and 400 .
The crystalline phases that were detected in the unfired cement paste (Figure 13) are dicalcium silicate (belite), tricalcium silicate (alite), ettringite, calcium hydroxide (Portlandite) arising from the hydration process, and calcium silicate hydrate (C-S-H) present in different polymorphs such as tobermorite and xonotlite. The estimated quantities by weight of these crystalline phases were analyzed by the software Match 3, and the results gave 2.7 of Portlandite, 9of ettringite, 21of alite, 24.9of belite, and a total of 42.4of C-S-H. Based on the previous studies [33,35], the XRD pattern of hardened cement paste shows the presence of several crystalline phases such as: (i) calcium silicate hydrate (C-S-H), the main binder with quantity varies between 40 and 70; (ii) calcium hydroxide formed during the curing of cement with quantity varying between 5 and 20; (iii) calcium aluminate form during the curing of cement with quantity varying between 5 and 15; (iv) quartz, alite, and belite whose quantities vary due to the curing condition.
At 400 , the XRD patterns (Figure 13) show some changes in the phase compositions of cement paste. The crystalline phase quantities detected are 25.5 of belite, 22.1 of alite, 16.1 of calcium oxide and aluminate oxide, and 36.2 of tobermorite (C-S-H). Based on the crystalline phase quantity, the presence of calcium and aluminum oxide was noticed. That may be due to the fact that at 400 , the first decomposition of Portlandite occurs and can increase to a certain rate if the temperature increases [59]. Further, a decrease in the amount of C-S-H was noticed. The percentage loss is estimated at 15. That is one of the reasons for the loss of strength at 400 °C.
The dominant crystalline phases that were detected in the XRD pattern of unfired cement paste with 30 silica fume at 25 (Figure 14) where 34.6 of belite, 10.8 of alite, and a total 54.8 C-S-H (31 of tobermorite and 23.8 of xonotlite). The amount of C-S-H in cement paste with 30 silica fume was higher than the amount of C-S-H in hardened cement paste. The percentage increase was 29.25. The increase in the amount of C-S-H is due to the fact that Portlandite reacts with the SiO2 present in the silica fume to produce additional C-S-H. That explains the fact that at 28 days, the compressive strength of cement with silica fume was higher than the compressive strength of the hardened control cement paste.
The crystalline phases that were detected in the XRD pattern of cement paste with 30 silica fume at 400 (Figure 14) were 21.2 of belite, 20.8 of alite, and a total of 57.9 C-S-H (31 of tobermorite and 23.8 of xonotlite). The amount of C-S-H in cement paste with 30 silica fume was higher than the amount of C-S-H in hardened cement paste. The percentage increase was 59.94 at 400 . The presence of tobermorite and xonotlite phases in hardened OPC that has been thermally treated at 400 °C can be attributed to the cement’s reaction between calcium silicates and calcium hydroxide. Heat causes the reaction between these two components to occur more quickly during the thermal treatment process, resulting in the formation of the tobermorite and xonotlite phases. These two phases have a significant impact on increasing the mechanical and durability properties of hardened cement. That confirms why the strength of OPC with silica fume was higher than the strength of the hardened control cement paste thermally treated at 400 ℃. Table 5 and Table 6 show the phase composition by percentage weight presented in hardened control cement paste and cement paste with 30 of silica fume at 25 and 400 ℃.
3.3.2. SEM and EDS Analysis
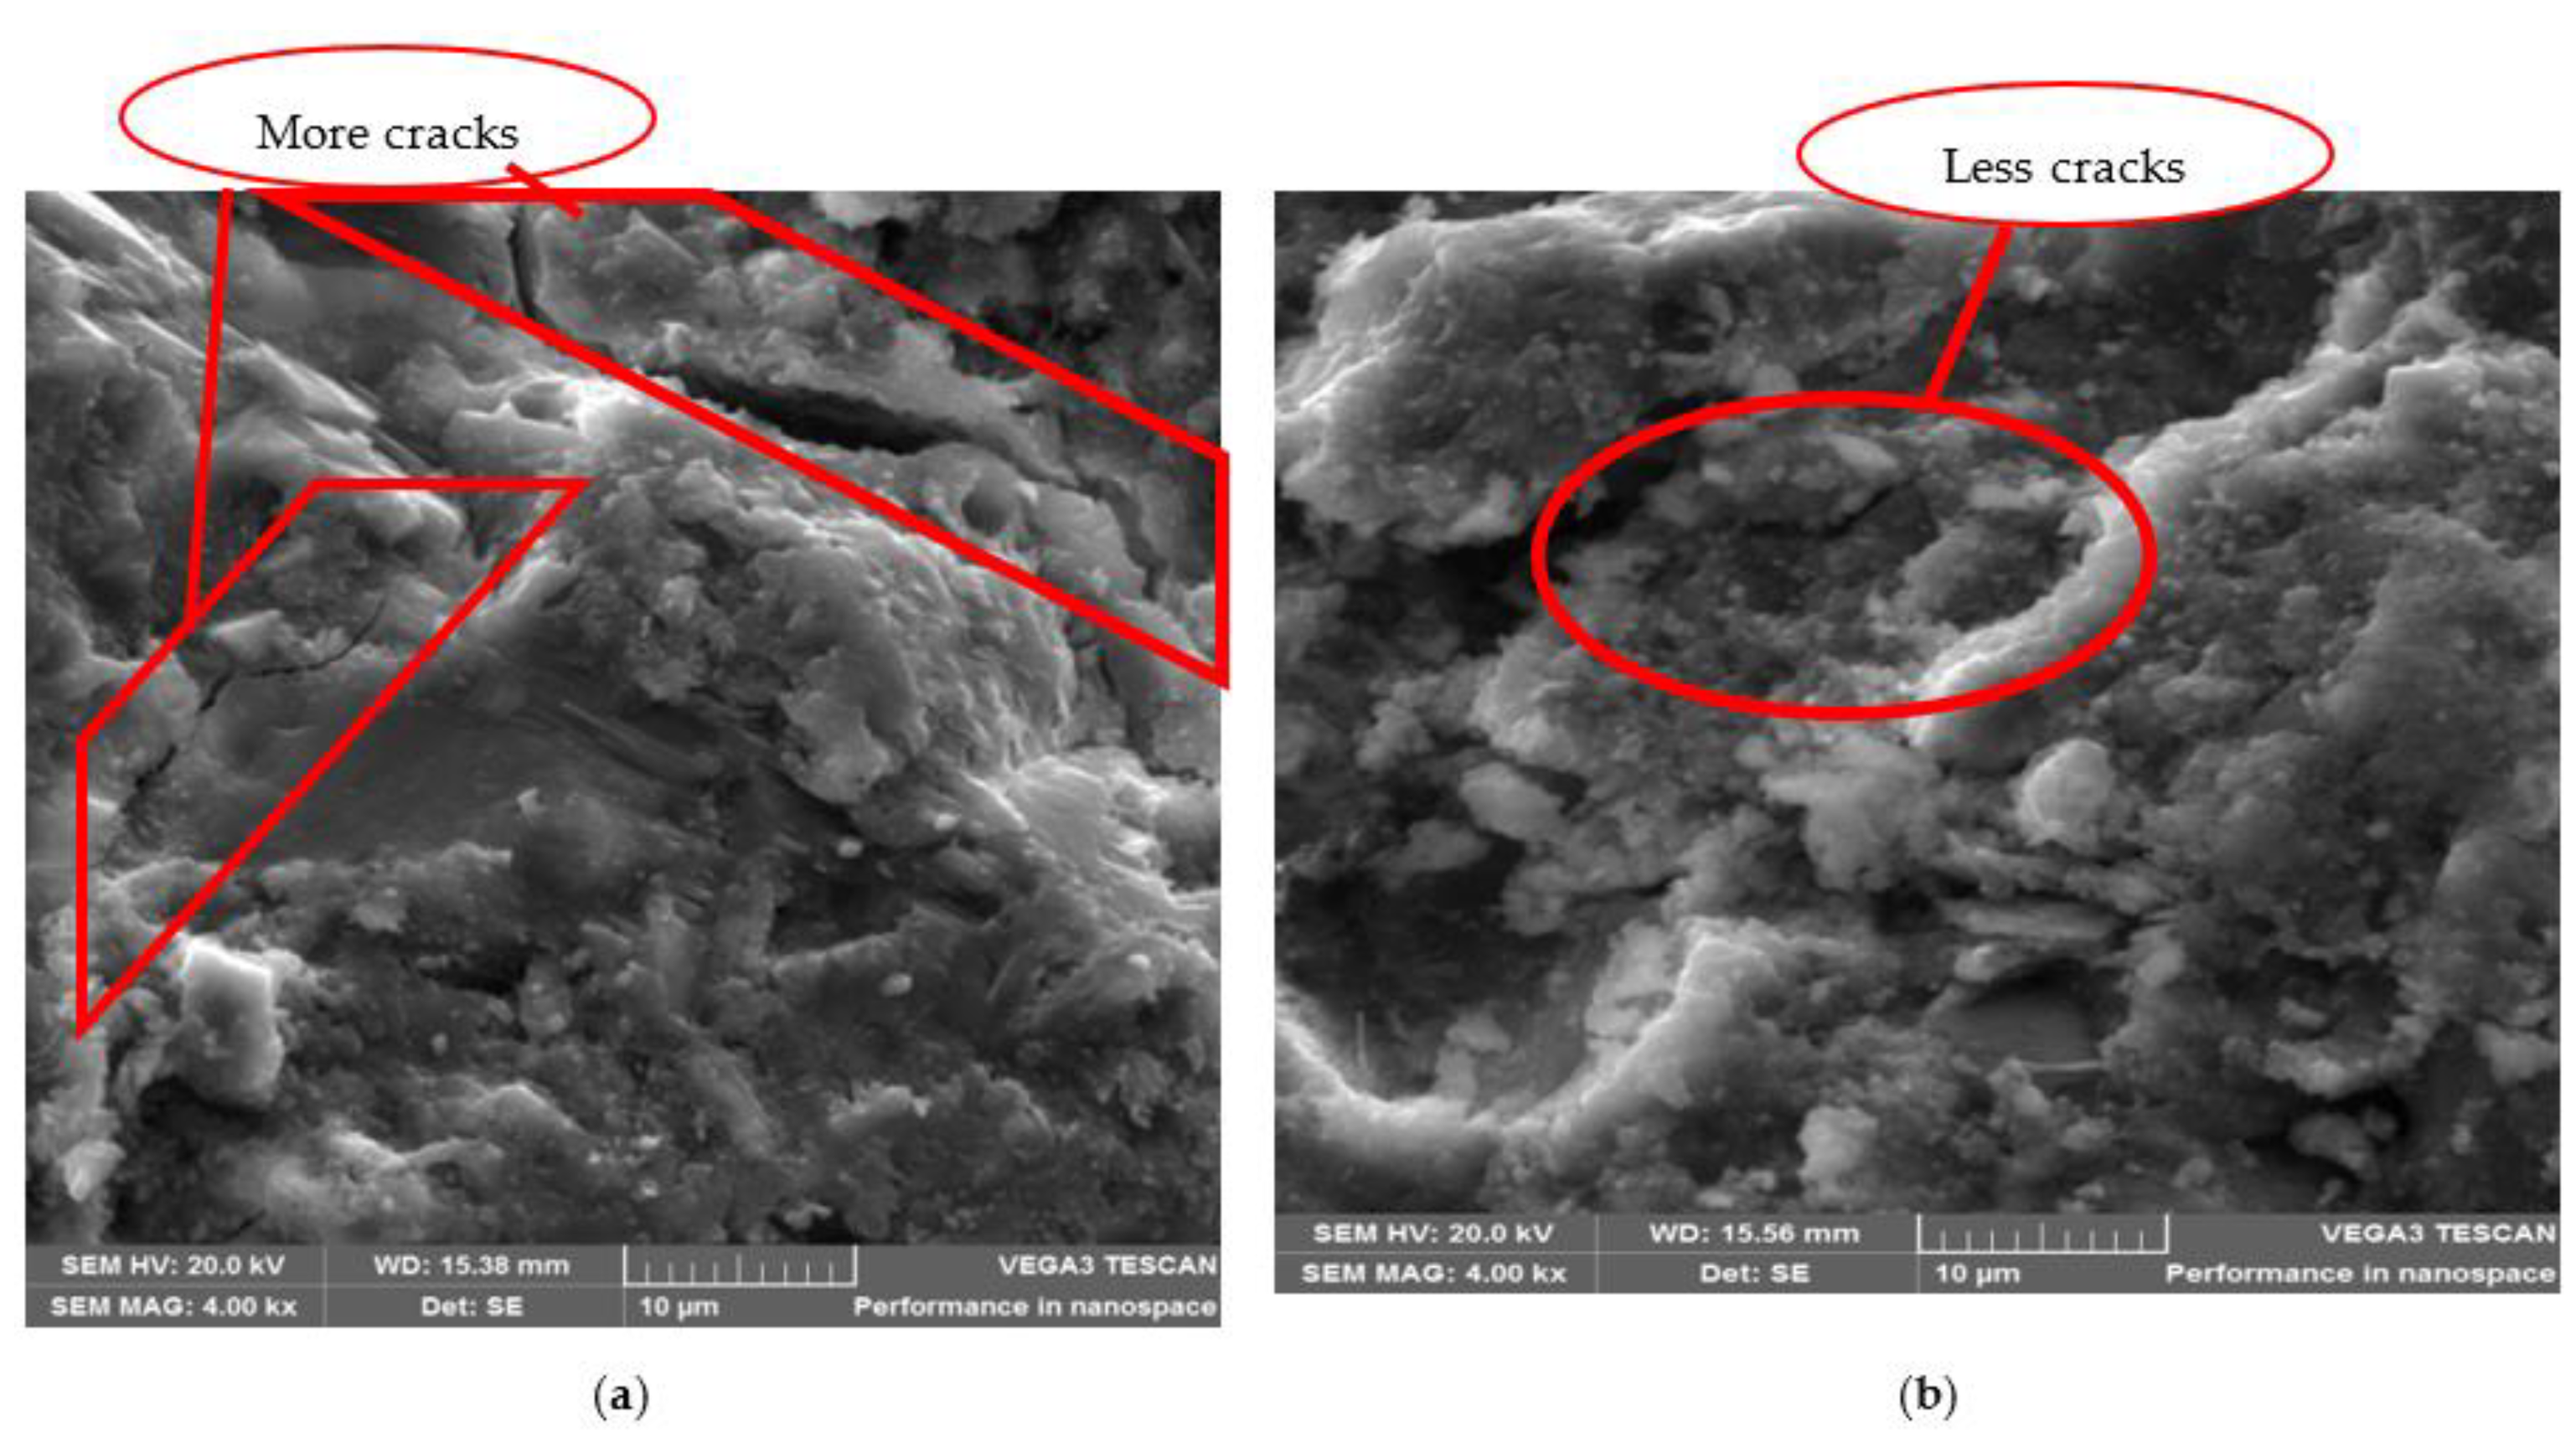
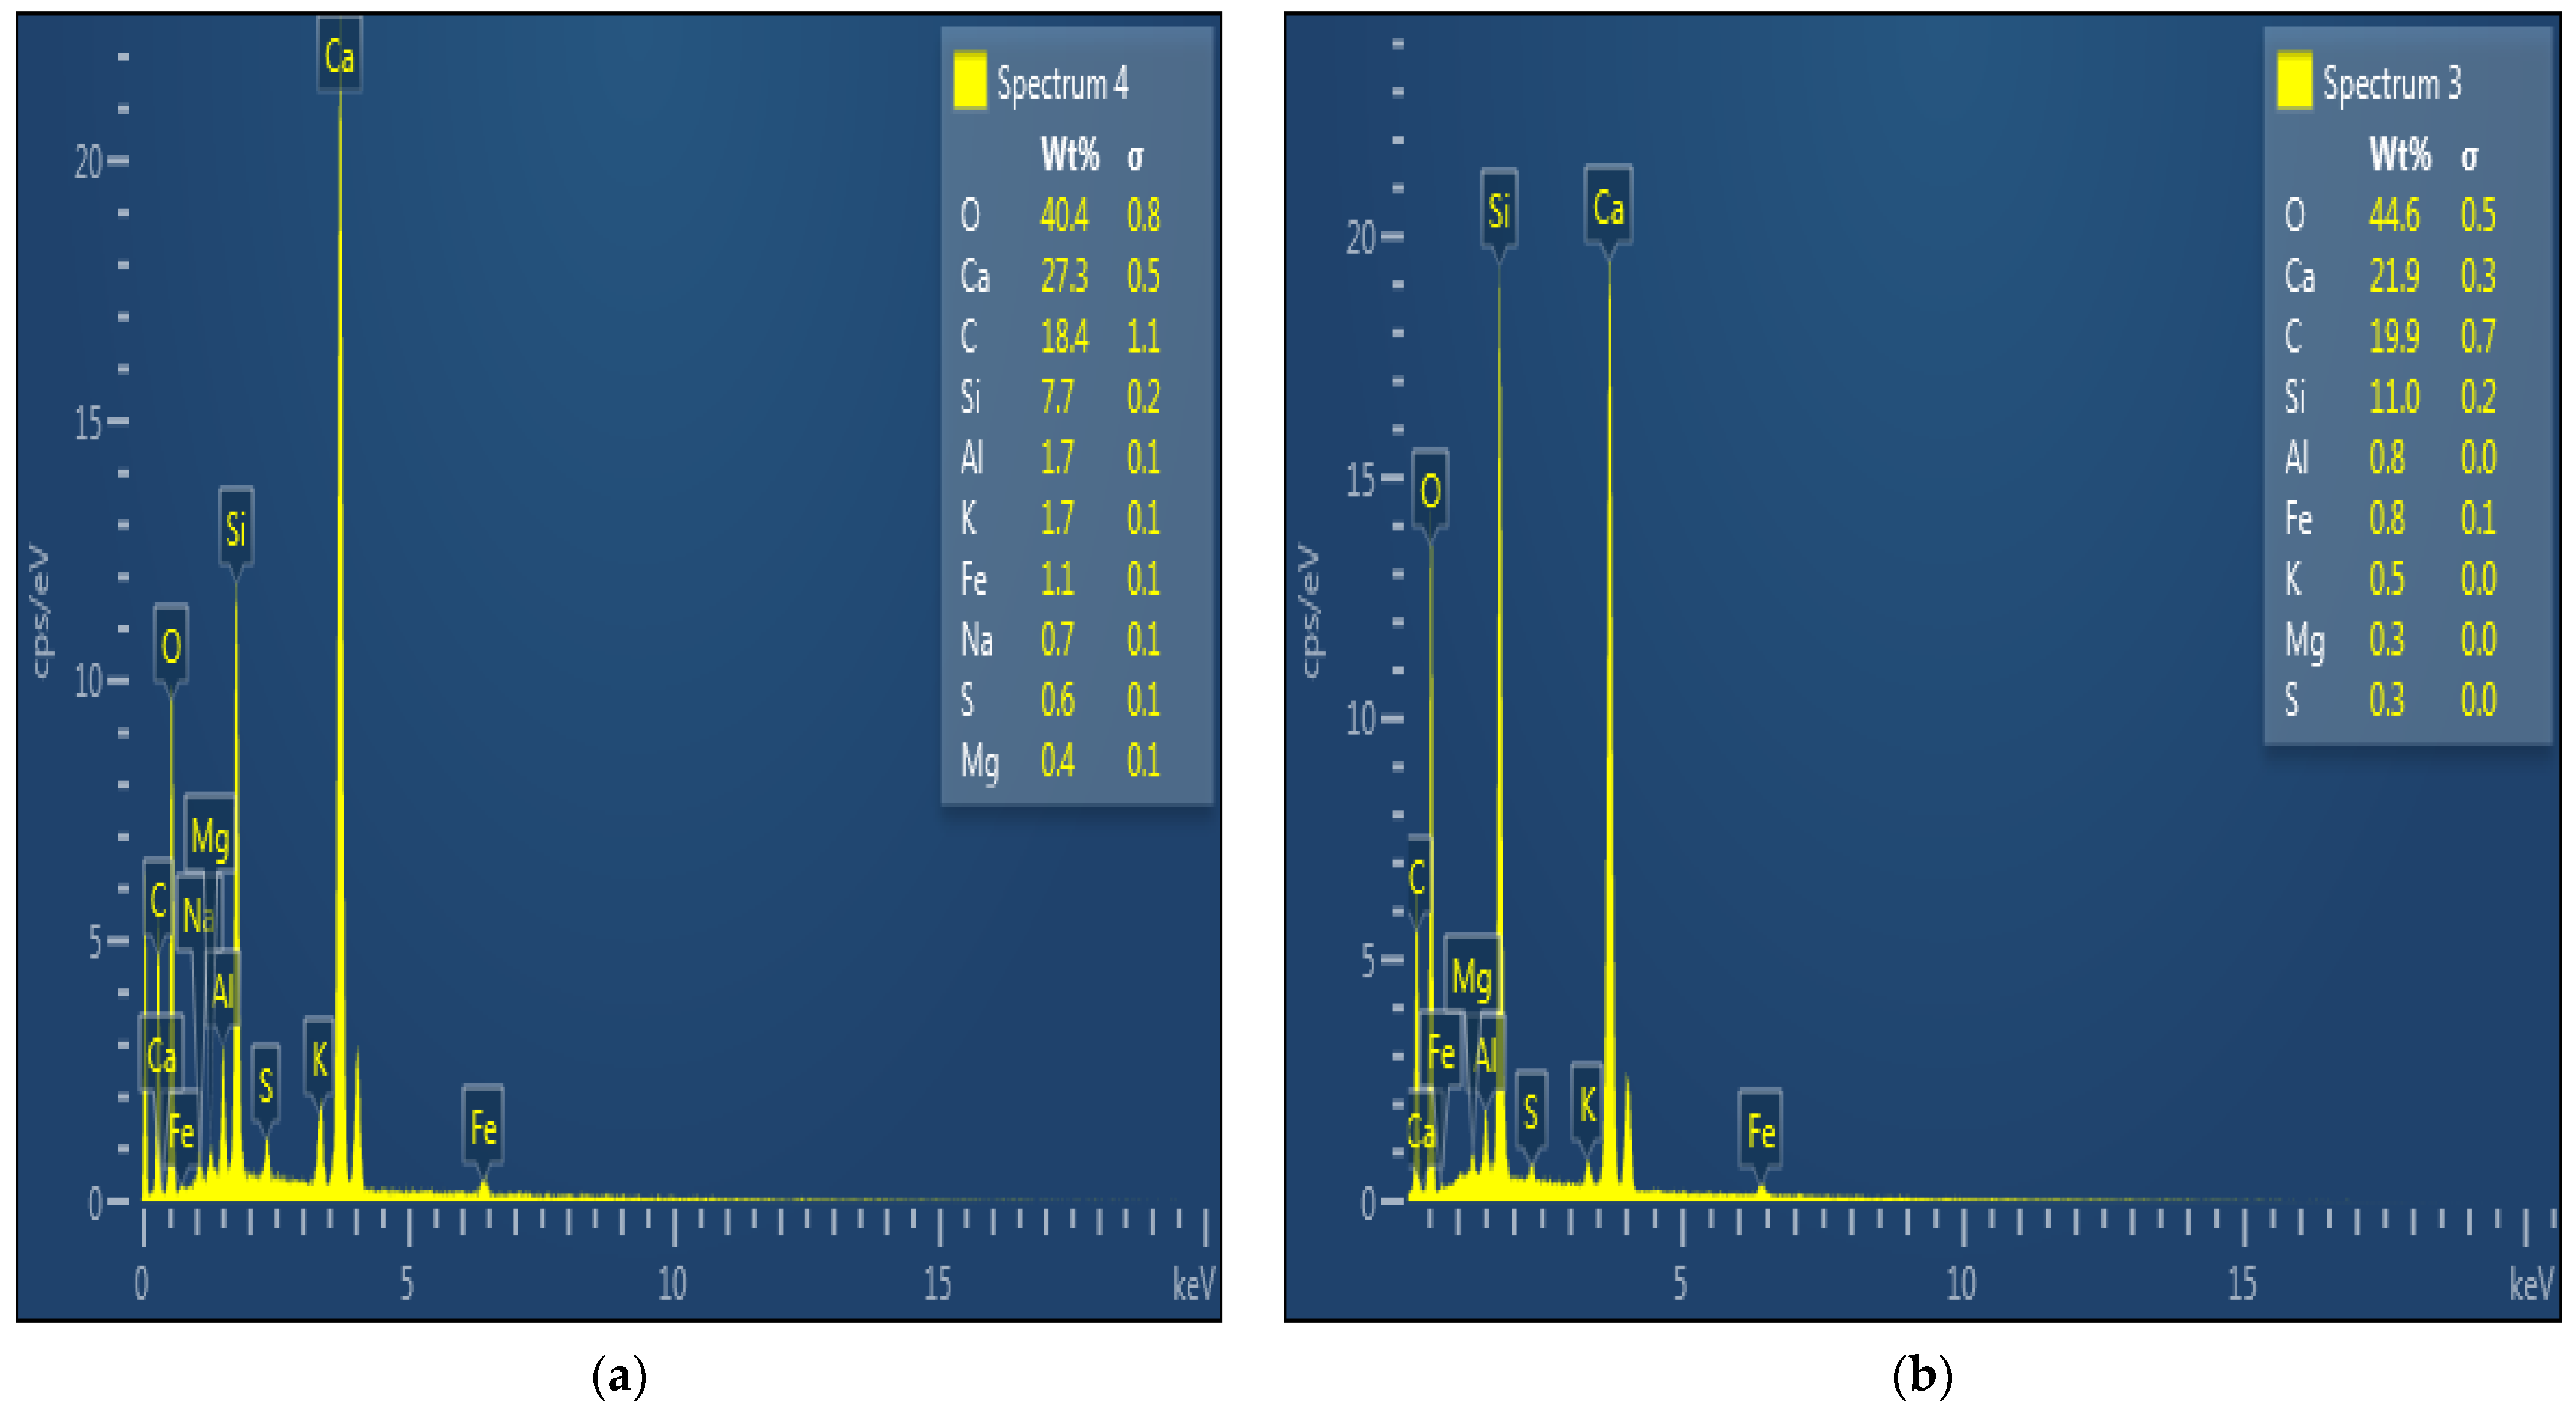
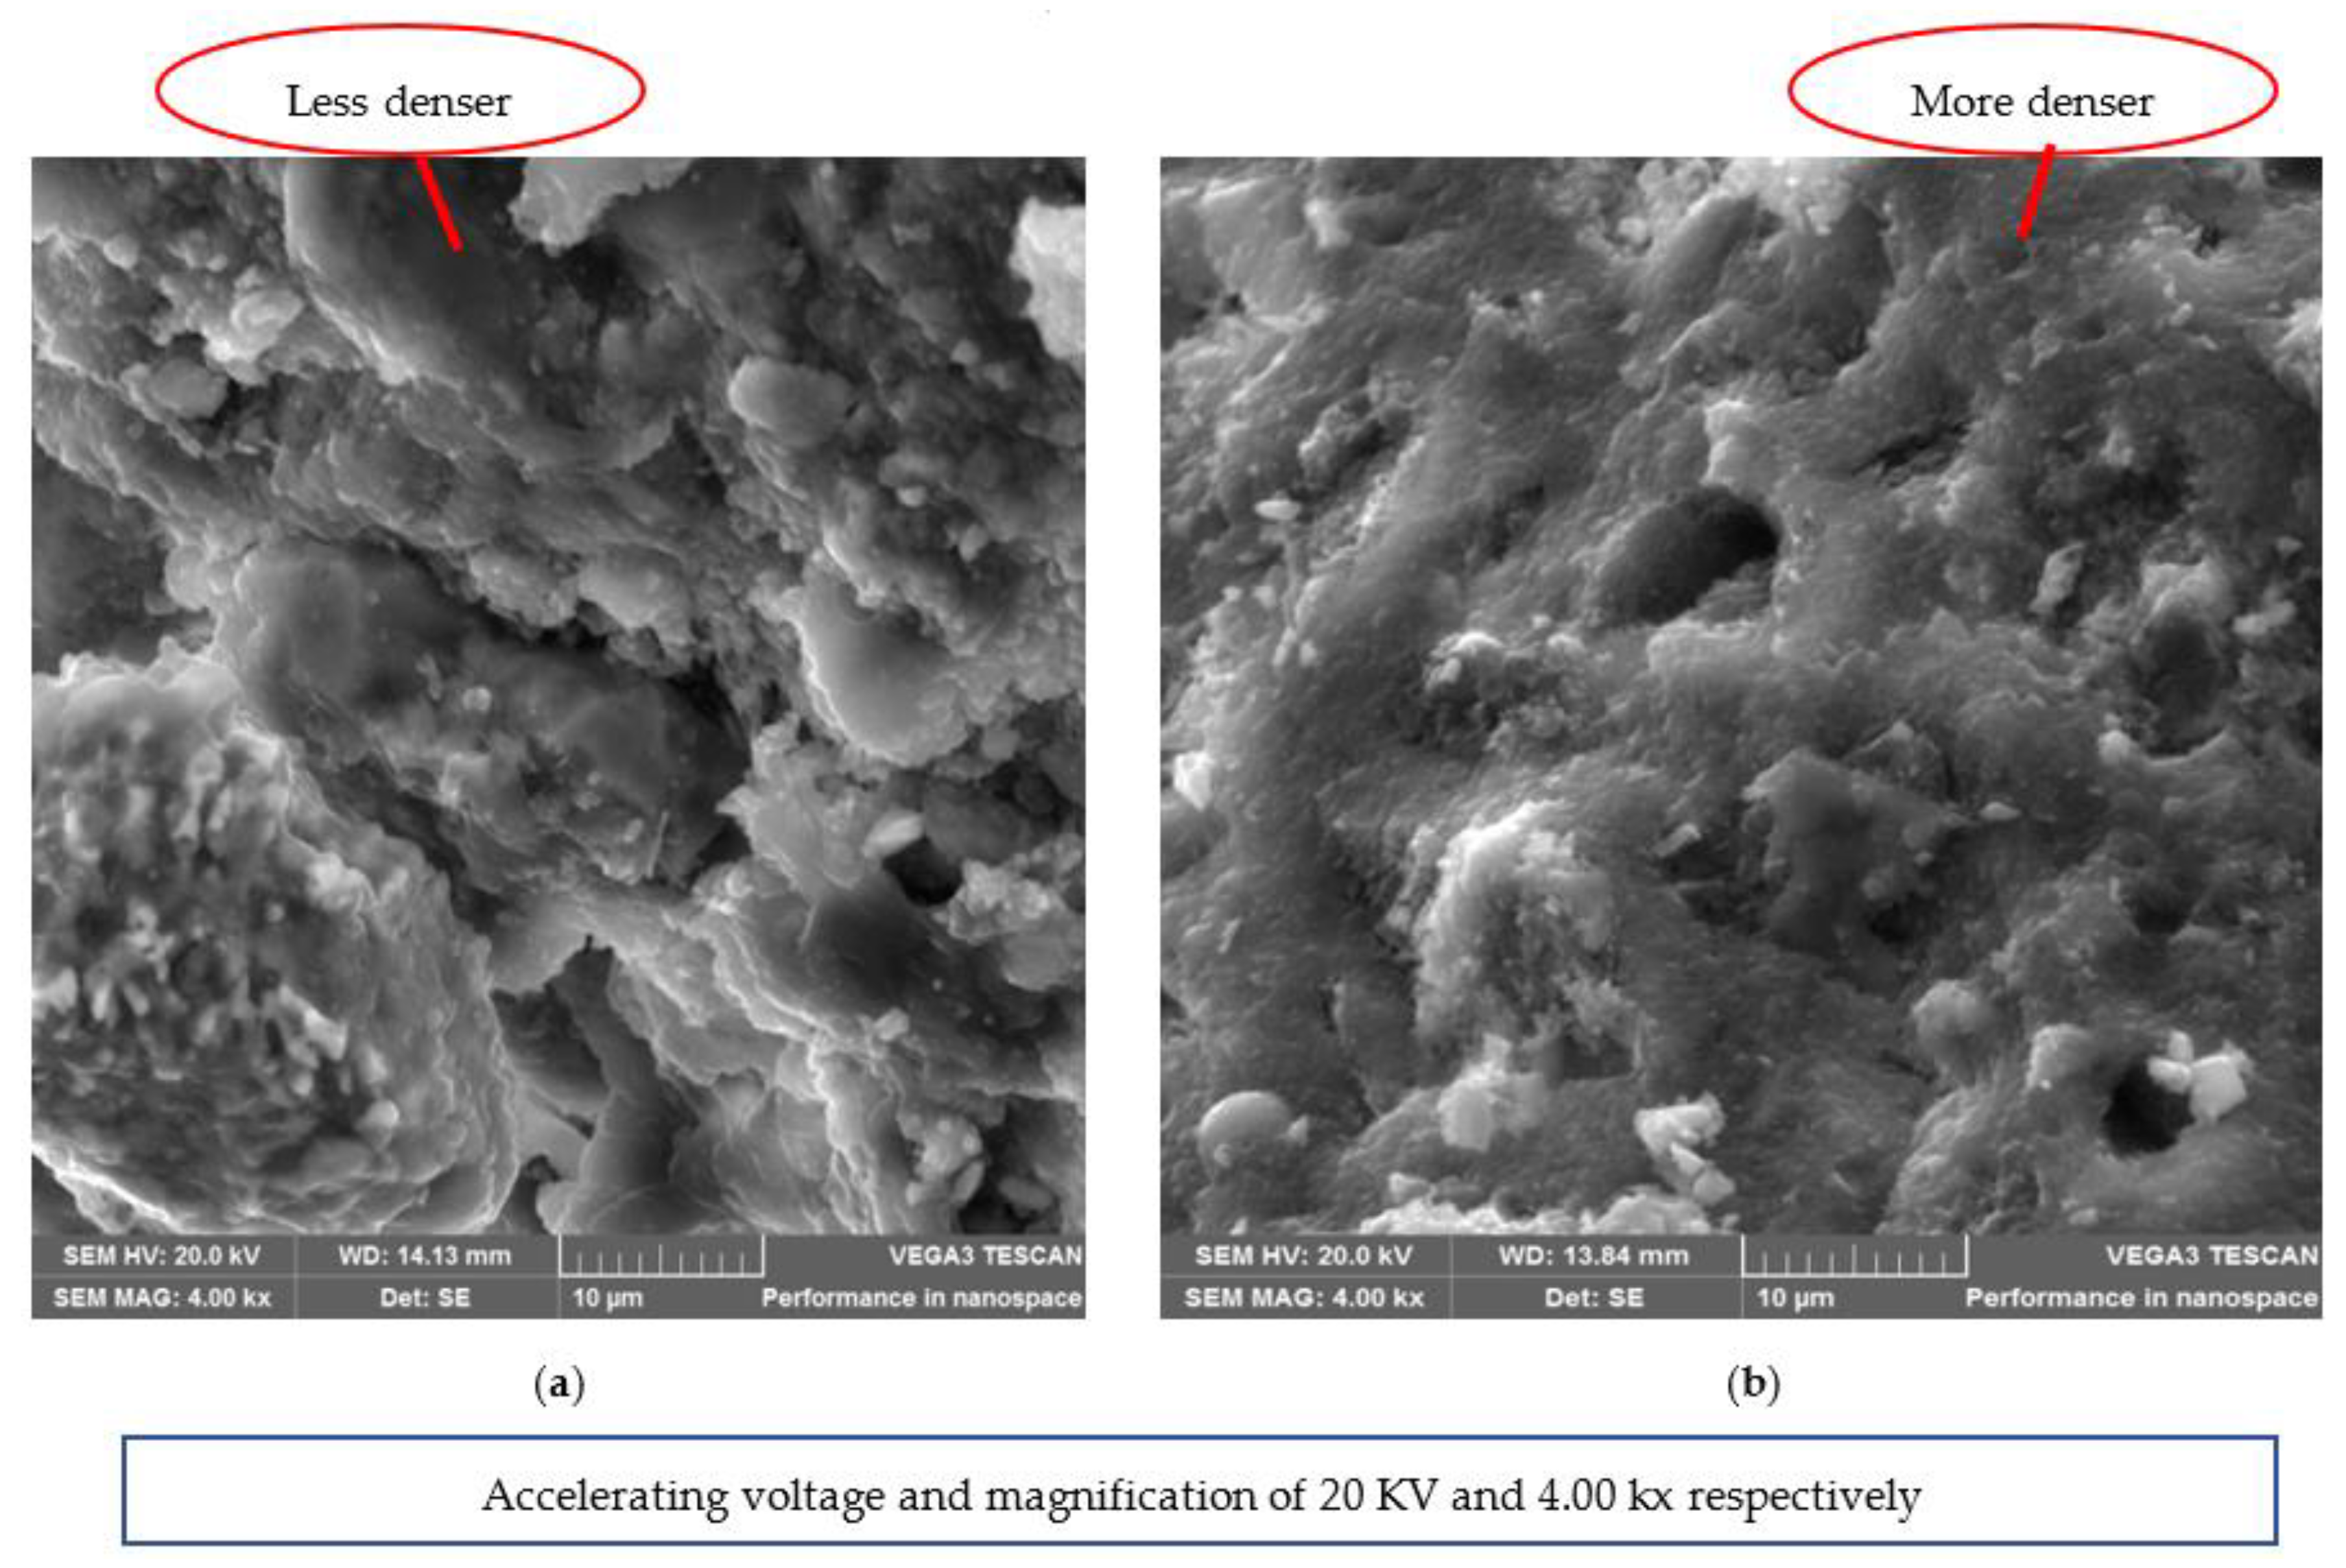
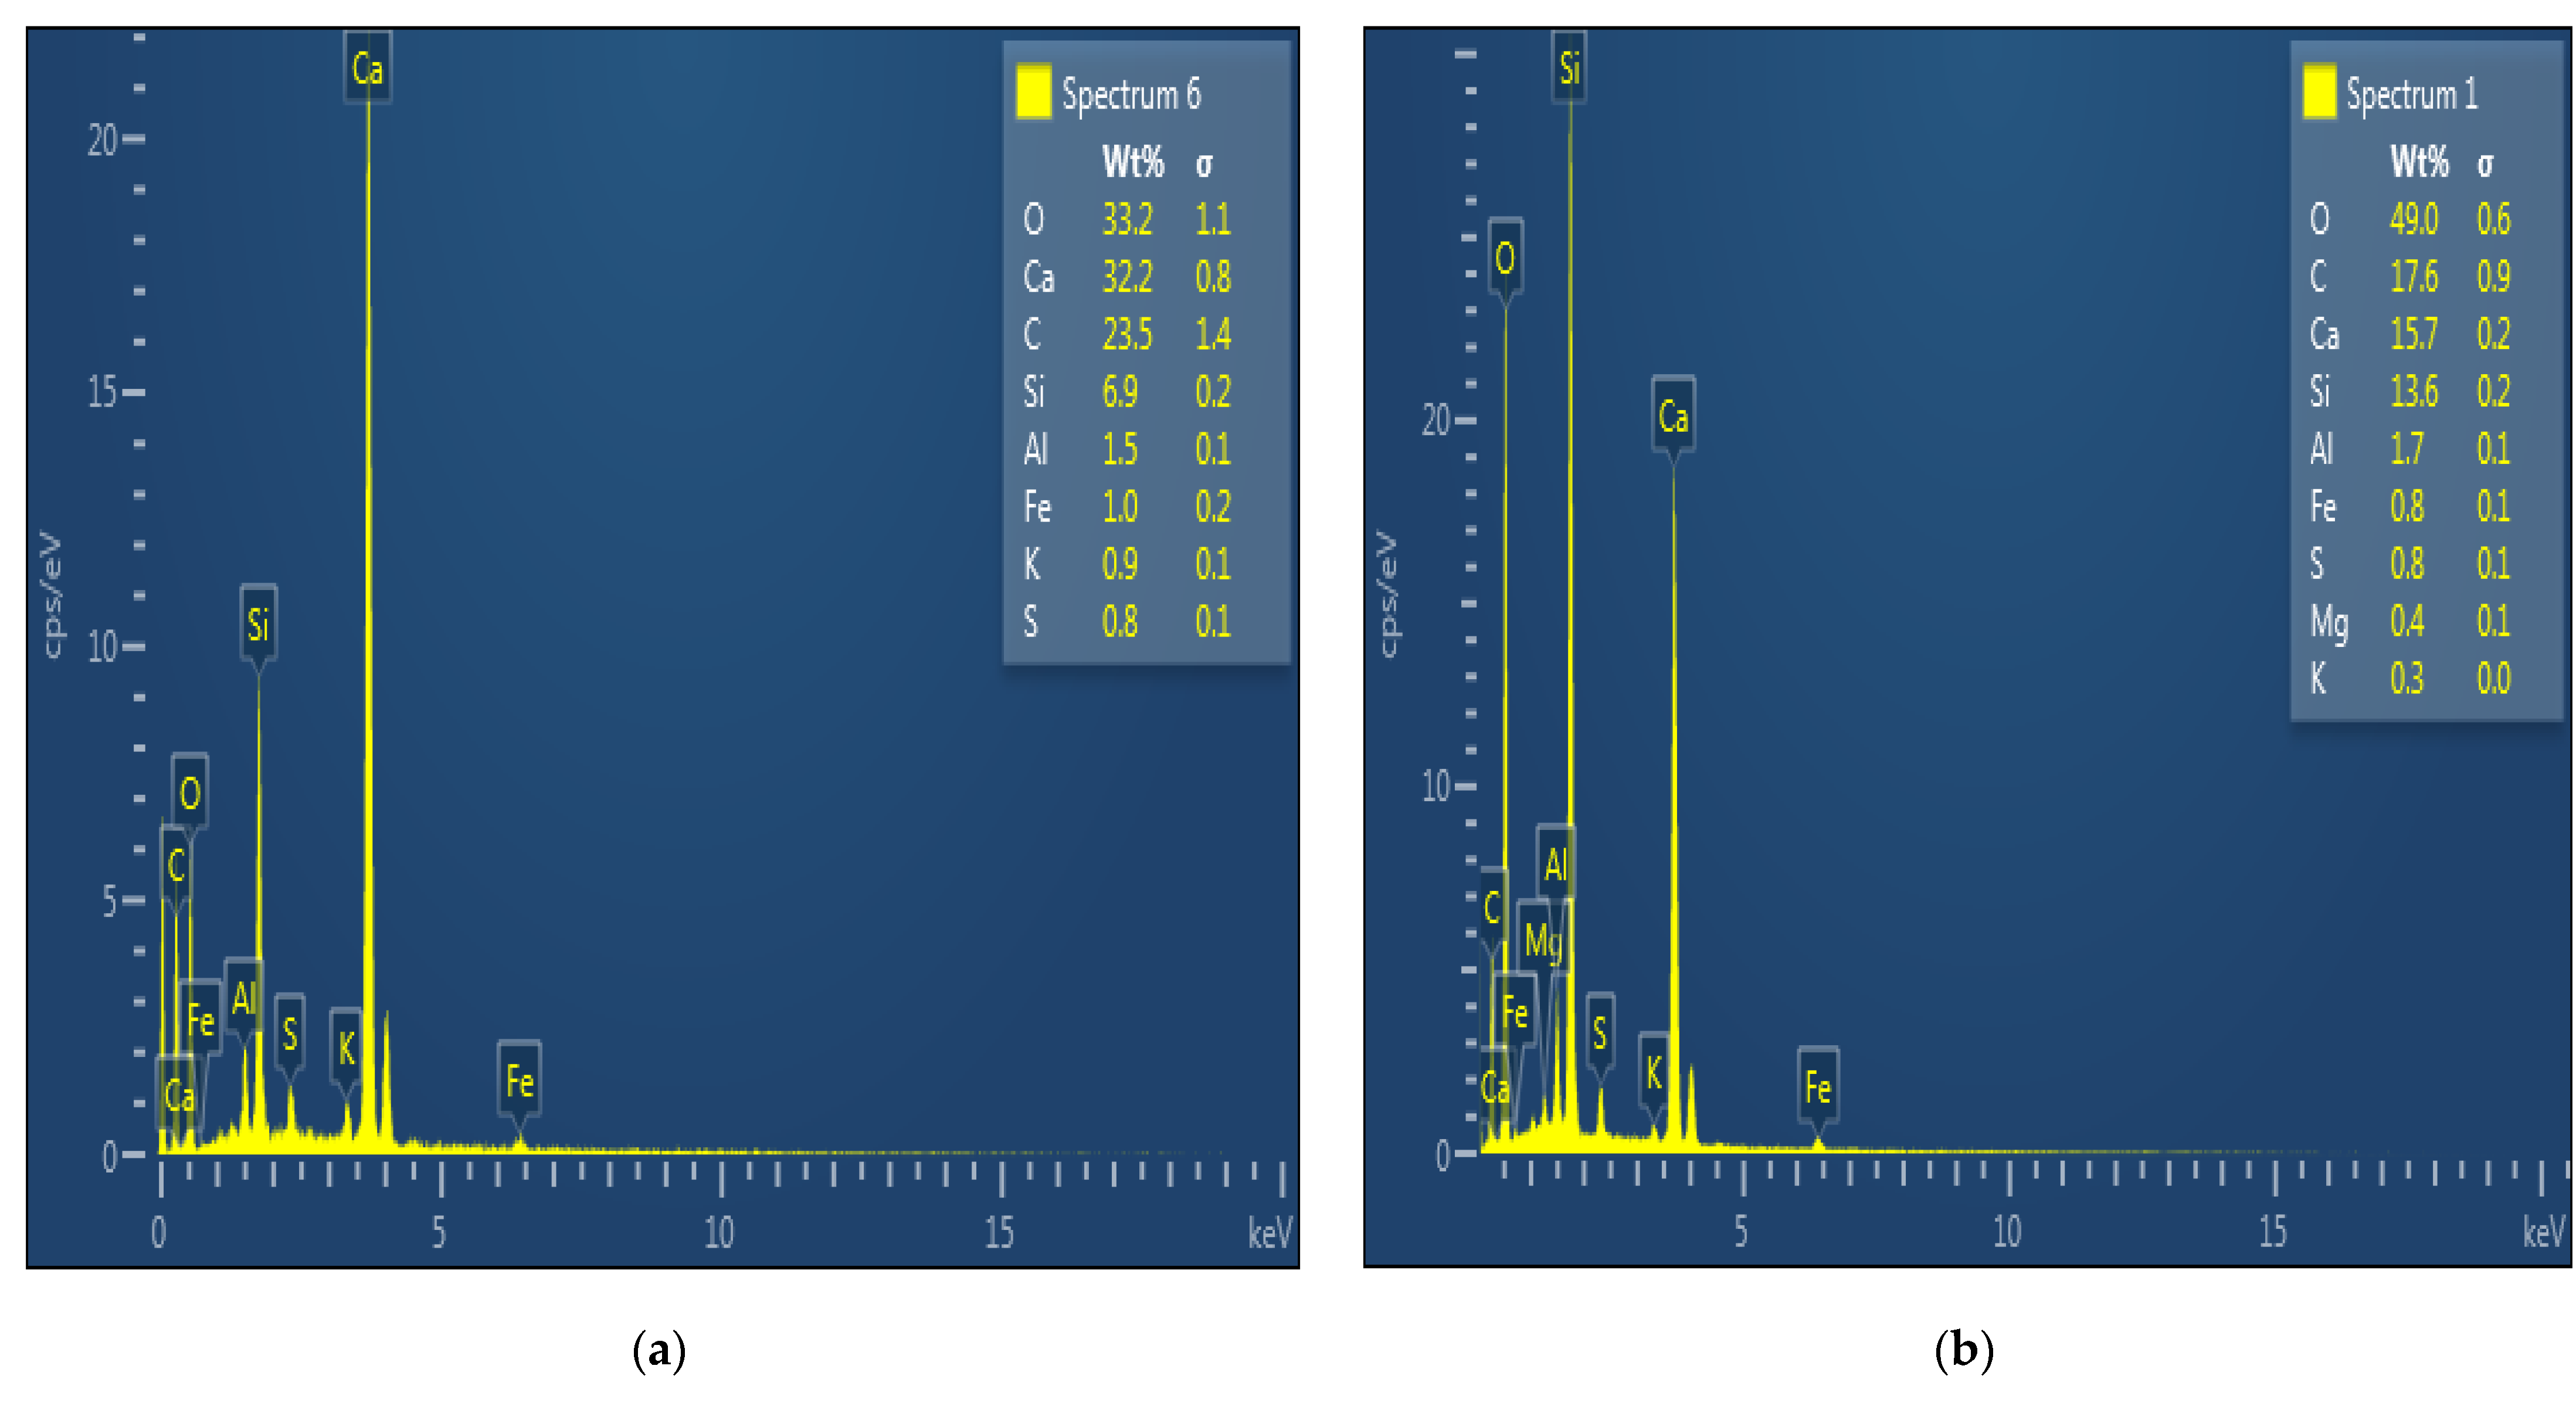
Figure 15 and Figure 16 show the SEM micrograph and the EDS of hardened control cement paste and hardened cement paste with 30 silica fume at ambient temperature (25 ), respectively. Figure 17 and Figure 18 show the SEM micrograph and the EDS of hardened control cement paste and hardened cement paste with 30 silica fume thermally treated at 400 for 2 h in a furnace at a rate of 10 /min, respectively.
The microcracks inside the hardened cement paste at ambient temperature (25 are very few (Figure 15a) compared with the microcracks inside the hardened cement paste at 400 °C (Figure 17a). Figure 17a clearly shows that pore structure intensified at 400 °C. Two mechanisms can explain the intensification of pore structures when the HCP is subjected to temperatures up to 400 °C. The physical mechanism is the thermal expansion of trapped water and gases in cement pores. As the temperature rises, the water and gases present in the pores of HCP expand, causing extra pressure and stress on the cement’s surfaces. In addition to this physical mechanism, the chemical process that contributes to the intensification of pore structures at 400 is the decomposition of calcium hydroxide into calcium oxide and aluminate oxide. The release of water and gases by these two chemicals contributes to the enlargement of pores.
The micrograph of cement plus 30 silica fume (Figure 15b) at ambient temperature (25 ) is denser and presents smaller voids than the micrograph of hardened control cement paste (Figure 15a), which presents some voids and small cracks that can negatively affect the compressive strength. This can be explained by the fact that silica fume is finer in particle size than cement, so the use of silica fume as a partial replacement for cement will fill the voids in the hardened cement paste and mortar and increase their strength [60]. Further, the increased amount of C-S-H (increase in the amount of tobermorite and xonotlite) occasioned by the extra reactions between the silica and calcium hydroxide in the matrix can be the second explanation for this. The particles of tobermorite and xonotlite gels form with the presence of silica fume are typically much finer than those of the C-S-H phase that forms without the addition of silica fume, resulting in a denser and more tightly packed microstructure.
The micrograph of hardened cement paste with 30 silica fume at 400 (Figure 16b) also looks much denser in the microstructure form compared with the micrograph of the control cement paste (Figure 16a). This is due to the presence of a huge quantity of stable crystalline phases, such as tobermorite and xonotlite, which appear in the cement formulation at elevated temperatures compared to the one at ambient temperature. The extra tobermorite and xonotlite gel are calcium silicate hydrate (C-S-H) phases that form through the reaction between calcium hydroxide (CH) and silica fume in the presence of heat.
4. Conclusions
In this study, the effect of silica fume on preventing strength retrogression in ordinary Portland cement and mortar at temperatures up to 400 was investigated. The residual compressive strength, SEM, XRD, and EDS tests were done. According to the experimental results, the following conclusions can be drawn:
- Control cement paste and control mortar residual compressive strengths increase slightly with temperatures up to 200 °C, then decrease with temperatures up to 400 °C. At 400 °C, the strength loss was 11% for the control cement paste and 9.2% for the mortar control.
- Hardened cement and mortar made with 30% silica fume possess the highest compressive strength values at 25, 100, 200, 300, and 400 ℃.
- The inclusion of silica fume has a very positive effect on the strength of hardened cement paste and mortar at 25 ℃ and at different temperatures up to 400 ℃. That is due to the reaction between the calcium hydroxide from the cement hydration and the SiO2 from the silica fume leading to the formation of extra calcium silicate hydrates, which are responsible for the strength development of the materials.
- At 25 ℃, the estimated amount of C-S-H was 42.4% for cement control and 54.8% for cement with 30% silica fume. The resulting percentage increase was found to be 29.25.
- At 400 ℃, the estimated amount of C-S-H was 36.2% for cement control and 57.9% for cement with 30% silica fume. The resulting percentage increase was found to be 59.94.
- Silica fume cement pastes at 25 and 400 ℃ have a denser microstructure compared to the microstructure of control cement paste.
- The silica fume can be considered a sustainable material to prevent strength retrogression at elevated temperatures.
5. Recommendation
To advance the existing knowledge of the benefits of using silica fume in cementitious materials, further research can be conducted on concrete with silica fume at elevated temperatures, pore structural, and fractal analysis of the influence of fly ash and silica fume on the mechanical property and abrasion resistance of concrete.
Author Contributions
Conceptualization, N.D.N.M.; methodology, N.D.N.M.; software, J.M., Z.A.G.; validation, N.D.N.M., J.M., and Z.A.G.; formal analysis, N.D.N.M.; writing—original draft preparation, J.M. and Z.A.G.; writing—review and editing, J.M. and Z.A.G.; supervision. All authors have read and agreed to the published version of the manuscript.
Funding
The authors received no remuneration for the research, authorship, or publication of this article.
Data Availability Statement
The data presented in this study are available from the corresponding authors upon request.
Acknowledgments
We want to thank the Pan African University Institute for Basic Sciences, Technology and Innovation and the African Union for supporting this research and giving us the tools needed to carry out this study.
Conflicts of Interest
The authors declare no conflict of interest.
References
- Burrow, R.C.; Griswold, G.D.; Oland, C.B. Properties of Concrete at Elevated Temperatures. Desalination 1979, 2014, 429–432. [Google Scholar]
- Georgali, B.; Tsakiridis, P.E. Microstructure of fire-damaged concrete. A case study. Cem. Concr. Compos. 2005, 27, 255–259. [Google Scholar] [CrossRef]
- Chan, S.Y.N.; Peng, G.-F.; Chan, J.K.W. Comparison between high strength concrete and normal strength concrete subjected to high temperature. Mater. Struct. 1996, 29, 616–619. [Google Scholar] [CrossRef]
- Arioz, O. Effects of elevated temperatures on properties of concrete. Fire Saf. J. 2007, 42, 516–522. [Google Scholar] [CrossRef]
- Ma, Q.; Guo, R.; Zhao, Z.; Lin, Z.; He, K. Mechanical properties of concrete at high temperature—A review. Constr. Build. Mater. 2015, 93, 371–383. [Google Scholar] [CrossRef]
- Concrete, E.; Asbl, P.F. Sustainability, Copyright: European Concrete Platform ASBL, February 2009 Foreword Sustainability Lies at the Heart of Construction and Design. A Sustainable Approach of Construction Brings Lasting Environmental, Social and Economic Benefits to a Construction Project. Available online: https://mpaprecast.org/Publications/Sustainable-Benefits-of-Concrete-Structures.aspx (accessed on 19 April 2023).
- Tantawy, M.A. Effect of High Temperatures on the Microstructure of Cement Paste. J. Mater. Sci. Chem. Eng. 2017, 5, 33. [Google Scholar] [CrossRef]
- Beaudoin, J.; Odler, I. Hydration, Setting and Hardening of Portland Cement, 5th ed.; Elsevier Ltd.: Amsterdam, The Netherlands, 2019. [Google Scholar] [CrossRef]
- Vidal, A.V.; Araujo, R.G.; Freitas, J.C. Sustainable cement slurry using rice husk ash for high temperature oil well. J. Clean. Prod. 2018, 204, 292–297. [Google Scholar] [CrossRef]
- Scrivener, K.L.; Capmas, A. Calcium Aluminate Cements. In Lea’s Chemistry of Cement and Concrete; Journal of the American Chemical Society: Washington, DC, USA, 2003; pp. 713–782. [Google Scholar] [CrossRef]
- Peng, G.-F.; Huang, Z.-S. Change in microstructure of hardened cement paste subjected to elevated temperatures. Constr. Build. Mater. 2008, 22, 593–599. [Google Scholar] [CrossRef]
- Jia, Z.; Chen, C.; Shi, J.; Zhang, Y.; Sun, Z.; Zhang, P. The microstructural change of C-S-H at elevated temperature in Portland cement/GGBFS blended system. Cem. Concr. Res. 2019, 123, 105773. [Google Scholar] [CrossRef]
- Phan, L.T. Effects of elevated temperature exposure on heating characteristics, spalling, and residual properties of high performance concrete. Mater. Struct. 2005, 34, 83–91. [Google Scholar] [CrossRef]
- Alarcon-Ruiz, L.; Platret, G.; Massieu, E.; Ehrlacher, A. The use of thermal analysis in assessing the effect of temperature on a cement paste. Cem. Concr. Res. 2005, 35, 609–613. [Google Scholar] [CrossRef]
- Khoury, G.A. Compressive strength of concrete at high temperatures: A reassessment. Mag. Concr. Res. 1992, 44, 291–309. [Google Scholar] [CrossRef]
- Zemri, C.; Bouiadjra, M.B. Comparison between physical–mechanical properties of mortar made with Portland cement (CEMI) and slag cement (CEMIII) subjected to elevated temperature. Case Stud. Constr. Mater. 2020, 12, e00339. [Google Scholar] [CrossRef]
- Lublóy, É.; Kopecskó, K.; Balázs, G.L.; Restás, Á.; Szilágyi, I.M. Impoved fire resistance by using Portland-pozzolana of Portland fly-ash cements. J. Therm. Anal. Calorim. 2017, 129, 925–936. [Google Scholar] [CrossRef]
- Sarshar, R.; Khoury, G.A. Material and environmental factors influencing the compressive strength of unsealed cement paste and concrete at high temperatures. Mag. Concr. Res. 1993, 45, 51–61. [Google Scholar] [CrossRef]
- Mindess, S. Resistance of Concrete to Destructive Agencies, 5th ed.; Elsevier Ltd.: Amsterdam, The Netherlands, 2019. [Google Scholar] [CrossRef]
- Grattan-Bellew, P.E. Microstructural investigation Portland cement concretes. Constr. Build. Mater. 1996, 10, 3–16. [Google Scholar] [CrossRef]
- Zhu, J. Prevent Cement Strength Retrogression under Ultra High Temperature. In Proceedings of the Abu Dhabi International Petroleum Exhibition & Conference, Abu Dhabi, UAE, 11–14 November 2019; pp. 11–14. [Google Scholar] [CrossRef]
- Mahmoud, A.A.; Elkatatny, S. The Effect of Silica Content on the Changes in the Mechanical Properties of Class G cement at High Temperature from Slurry to Set. In Proceedings of the 53rd U.S. Rock Mechanics/Geomechanics Symposium, New York NY, USA, 23–26 June 2019. [Google Scholar]
- Li, Q.H.; Yao, Y.; Sun, B.; Li, Z.J. Mechanism of effect of elevated temperature on compressive strength of cement mortar, Jianzhu Cailiao Xuebao. J. Build. Mater. 2008, 11, 699–703. [Google Scholar]
- Ibrahim, R.K.; Hamid, R.; Taha, M. Fire resistance of high-volume fly ash mortars with nanosilica addition. Constr. Build. Mater. 2012, 36, 779–786. [Google Scholar] [CrossRef]
- Ghazy, M. Performance of Blended Cement Mortars Incorporating Nano- Performance of Blended Cement Mortars Incorporating Nano-Metakaolin Particles at Elevated Temperatures. In Proceedings of the International Conference on Advances in Structural and Geotechnical Engineering, Hurghada, Egypt, 6–9 April 2015. [Google Scholar]
- Snellings, R.; Mertens, G.; Elsen, J. Supplementary Cementitious Materials. Rev. Miner. Geochem. 2012, 74, 211–278. [Google Scholar] [CrossRef]
- Ramzi, S.; Hajiloo, H. The Effects of Supplementary Cementitious Materials (SCMs) on the Residual Mechanical Properties of Concrete after Exposure to High Temperatures—Review. Buildings 2022, 13, 103. [Google Scholar] [CrossRef]
- De Belie, N.; Soutsos, M.; Gruyaert, E. Properties of Fresh and Hardened Concrete Containing Supplementary Cementitious Materials; State-of-the-Art Report of the RILEM Technical Committee 238-SCM, Working Group 4; Springer: New York, NY, USA, 2018. [Google Scholar] [CrossRef]
- Ahmad, J.; Abid, S.R.; Arbili, M.M.; Majdi, A.; Hakamy, A.; Deifalla, A.F. A Review on Sustainable Concrete with the Partially Substitutions of Silica Fume as a Cementitious Material. Sustainability 2022, 14, 12075. [Google Scholar] [CrossRef]
- Pachideh, G.; Gholhaki, M.; Moshtagh, A. On the post-heat performance of cement mortar containing silica fume or Granulated Blast- Furnace Slag. J. Build. Eng. 2019, 24, 100757. [Google Scholar] [CrossRef]
- Medina, N.F.; Barluenga, G.; Hernández-Olivares, F. Combined effect of Polypropylene fibers and Silica Fume to improve the durability of concrete with natural Pozzolans blended cement. Constr. Build. Mater. 2015, 96, 556–566. [Google Scholar] [CrossRef]
- Çakır, Ö.; Sofyanlı, Ö.Ö. Influence of silica fume on mechanical and physical properties of recycled aggregate concrete. HBRC J. 2014, 11, 157–166. [Google Scholar] [CrossRef]
- Saad, M.; Abo-El-Enein, S.; Hanna, G.; Kotkata, M. Effect of temperature on physical and mechanical properties of concrete containing silica fume. Cem. Concr. Res. 1996, 26, 669–675. [Google Scholar] [CrossRef]
- ASTM C1240; C1240—14 Standard Specification for Silica Fume Used in Cementitious Mixtures. Annual Book of ASTM Standards: West Conshohocken, PA, USA, 2012; pp. 1–7.
- ASTM C778-13; Standard Specification for Sand. ASTM Standards: West Conshohocken, PA, USA, 2013; pp. 1–3.
- ASTM C109/109M-16a; Standard Test Method for Compressive Strength of Hydraulic Cement Mortars (Using 2-in. or Cube Specimens). Annual Book of ASTM Standards: West Conshohocken, PA, USA, 2016; pp. 1–10.
- ASTM C143/C143M; Standard Test Method for Slump of Hydraulic-Cement Concrete. ASTM Standards: West Conshohocken, PA, USA, 2015; pp. 1–4.
- ASTM C780; Standard Test Method for Preconstruction and Construction Evaluation of Mortars for Plain and Reinforced Unit Masonry. Annual Book of ASTM Standards: West Conshohocken, PA, USA, 2012; pp. 1–18.
- ASTM C305; Standard Practice for Mechanical Mixing of Hydraulic Cement Pastes and Mortars of Plastic Consistency. ASTMStandard: West Conshohocken, PA, USA, 2020; pp. 1–3.
- Hlavička, É.L.-V. Bond after fire. Constr. Build. Mater. 2017, 132, 210–218. [Google Scholar] [CrossRef]
- BS EN 196-3; Methods of testing cement. Determination of setting times and soundness (+A1:2008). British Standard Institute (BSI): London, UK, 2005.
- ASTM C618; Standard Specification for Coal Fly Ash and Raw or Calcined Natural Pozzolan for Use. Annual Book of ASTM Standards: West Conshohocken, PA, USA, 2010; pp. 3–6.
- Morsy, M.S.; Shebl, S.S. Effect of silica fume and metakaoline pozzolana on the performance of blended cement pastes against fire. Ceramics-Silikáty 2007, 51, 40–44. [Google Scholar]
- ASTM C188-95; Standard Test Method for Density of Hydraulic Cement. ASTM International: West Conshohocken, PA, USA, 2003; Volume 95, pp. 1–2.
- ASTMC191-08; Standard Test Methods for Time of Setting of Hydraulic Cement by Vicat Needle. ASTM International: West Conshohocken, PA, USA, 2009; pp. 1–8.
- ASTM C1585-13; Standard Test Method for Measurement of Rate of Absorption of Water by Hydraulic Cement Concretes. ASTM International: West Conshohocken, PA, USA, 2013; pp. 1–6.
- Index @ www.civilalliedgyan.com. n.d. Available online: https://www.civilalliedgyan.com/ (accessed on 19 April 2023).
- Abdalla, T.A.; Koteng, D.O.; Shitote, S.M.; Matallah, M. Mechanical and durability properties of concrete incorporating silica fume and a high volume of sugarcane bagasse ash. Results Eng. 2022, 16, 100666. [Google Scholar] [CrossRef]
- ASTM C128-07; Standard Test Method for Density, Relative Density (Specific Gravity), and Absorption of Fine Aggregate. Annual Book of ASTM Standards: West Conshohocken, PA, USA, 2017; pp. 1–5.
- ASTM C566-19; Standard Test Method for Total Evaporable Moisture Content of Aggregate by Drying. ASTM International: West Conshohocken, PA, USA, 2009; Volume 97, pp. 1–3.
- ASTM C117; Standard Test Method for Materials Finer Than 75-µm (No. 200) Sieve in Mineral Aggregates by Washing. ASTM International: West Conshohocken, PA, USA, 2017; pp. 1–3.
- C29/C29M-09; Standard Test Method for Bulk Density (“ Unit Weight ”) and Voids in Aggregate. ASTM International: West Conshohocken, PA, USA, 2009; pp. 1–5.
- ASTM C33/C33M—18; Concrete Aggregates. ASTM International: West Conshohocken, PA, USA, 2010; pp. 1–11.
- Index @ www.vaultconcretetoilets.com. n.d. Available online: https://www.vaultconcretetoilets.com/ (accessed on 19 April 2023).
- Rao, G. Investigations on the performance of silica fume-incorporated cement pastes and mortars. Cem. Concr. Res. 2003, 33, 1765–1770. [Google Scholar] [CrossRef]
- Nadeem, A.; Memon, S.A.; Lo, T.Y. Mechanical performance, durability, qualitative and quantitative analysis of microstructure of fly ash and Metakaolin mortar at elevated temperatures. Constr. Build. Mater. 2013, 38, 338–347. [Google Scholar] [CrossRef]
- Bye, G.; Livesey, P.; Struble, L. Portland Cement, 3rd ed.; ICE Publishing: London, UK, 2011. [Google Scholar] [CrossRef]
- Taylor, H.F.W. Cement Chemistry, 2nd ed.; Academic Press: Cambridge, MA, USA, 1997; Volume 20, p. 335. [Google Scholar]
- Xiao, J.; Li, Z.; Xie, Q.; Shen, L. Effect of strain rate on compressive behaviour of high-strength concrete after exposure to elevated temperatures. Fire Saf. J. 2016, 83, 25–37. [Google Scholar] [CrossRef]
- Siddique, R. Utilization of silica fume in concrete: Review of hardened properties. Resour. Conserv. Recycl. 2011, 55, 923–932. [Google Scholar] [CrossRef]
Figure 1.
Flow chart of research methodology.

Figure 2.
(a) SEM micrograph of silica fume; (b) EDS graph of silica fume.

Figure 3.
XRD pattern of silica fume.

Figure 4.
Particle size distribution of OPC and silica fume using.

Figure 5.
Particle size distribution of fine aggregates.

Figure 6.
(a) Water demand of cement paste with silica fume; (b) Water demand of mortar with silica fume.
Figure 6.
(a) Water demand of cement paste with silica fume; (b) Water demand of mortar with silica fume.

Figure 7.
Residual compressive strength of hardened cement paste with silica fume at 7 days.

Figure 8.
Residual compressive strength of mortar with silica fume at 7 days.

Figure 9.
Residual compressive strength of hardened cement paste with silica fume at 28 days.

Figure 10.
Residual compressive strength of mortar with silica fume at 28 days.

Figure 11.
Residual compressive strength of hardened cement paste with silica fume at 56 days.

Figure 12.
Residual compressive strength of mortar with silica fume at 56 days.

Figure 13.
XRD Patterns of hardened control cement paste at 25 and 400

Figure 14.
XRD patterns of cement paste with 30.

Figure 15.
(a) SEM micrograph of hardened cement control at 25 ℃; (b) SEM micrograph of hardened cement paste with 30% silica fume at 25 ℃.
Figure 15.
(a) SEM micrograph of hardened cement control at 25 ℃; (b) SEM micrograph of hardened cement paste with 30% silica fume at 25 ℃.

Figure 16.
(a) EDS graph of hardened control cement paste at 25 ℃; (b) EDS graph of hardened cement paste with 30% silica fume at 25 ℃.
Figure 16.
(a) EDS graph of hardened control cement paste at 25 ℃; (b) EDS graph of hardened cement paste with 30% silica fume at 25 ℃.

Figure 17.
(a) SEM micrograph of hardened control cement paste thermally treated at 400 ℃; (b) SEM micrograph of hardened cement paste with 30% silica fume thermally treated at 400 ℃.
Figure 17.
(a) SEM micrograph of hardened control cement paste thermally treated at 400 ℃; (b) SEM micrograph of hardened cement paste with 30% silica fume thermally treated at 400 ℃.

Figure 18.
(a) EDS graph of hardened control cement paste at 25 ℃; (b) SEM graph of hardened cement paste with 30% silica fume at 25 ℃.
Figure 18.
(a) EDS graph of hardened control cement paste at 25 ℃; (b) SEM graph of hardened cement paste with 30% silica fume at 25 ℃.


Table 1.
Mix proportion of cement paste and mortar with silica fume.
| Material | Cement with Silica Fume | Material | Mortar with Silica Fume | |||||
|---|---|---|---|---|---|---|---|---|
| Cement (kg) | Silica Fume (kg) | Water (kg) | Cement (kg) | Silica Fume (kg) | Sand (kg) | Water (kg) | ||
| Control | 1600 | 0 | 480 | Control | 550 | 0 | 1513 | 330 |
| 10 SF | 1440 | 160 | 489 | 10 SF | 495 | 55 | 1513 | 496 |
| 20 SF | 1280 | 320 | 502 | 20 SF | 440 | 110 | 1513 | 502 |
| 30 SF | 1120 | 480 | 504 | 30 SF | 385 | 165 | 1513 | 504 |
Table 2.
Chemical composition of OPC and silica fume.
| Compounds | OPC | Silica Fume |
|---|---|---|
| 26.666 | 98.089 | |
| 6.037 | 0.420 | |
| 2.296 | 0.155 | |
| CaO | 60.306 | 0.616 |
| MgO | 0.00 | 0.00 |
| S | 2.806 | 0.283 |
| O | 0.807 | 0.238 |
| Others | 1.082 | 0.199 |
| LOI | 4.48 | 4.30 |
Table 3.
Physical properties of OPC and silica fume.
| Property | OPC | Silica Fume | Standard |
|---|---|---|---|
| Specific gravity | 3.14 | 2.2 | ASTM C188-95 [44] |
| Normal consistency (%) | 34 | / | ASTM C187-04 [39] |
| Initial setting time (min) | 156 | / | ASTM C191-08 [45] |
| Final setting time (min) | 224 | / | ASTM C191-08 [45] |
| Moisture (%) | / | 0.5 | ASTM-C 1585 [46] |
Table 4.
Physical properties of fine aggregates.
| Property | Results | Standard |
|---|---|---|
| Specific gravity | 2.56 | ASTM C128-07 [49] |
| Loose density (kg/m3) | 1403 | ASTM C29-09 [52] |
| Bulk density (kg/m3) | 1512 | ASTM C29-09 [52] |
| Water absorption (%) | 2.81 | ASTM C128-07 [49] |
| Moisture content (%) | 3.4 | ASTM C566 [50] |
| Fineness modulus | 2.52 | ASTM C33 [53] |
| Silt content (%) | 5.3 | ASTM C117-04 [51] |
Table 5.
Composition of phases presented in hardened control cement paste and cement paste with 30of silica fume at 25 ℃ by percentage weight.
Table 5.
Composition of phases presented in hardened control cement paste and cement paste with 30of silica fume at 25 ℃ by percentage weight.
| Phase | Chemical Formula | Cement Paste (%) at 25 ℃ | Cement Paste with Silica Fume (%) at 25 ℃ |
|---|---|---|---|
| Belite | 24.9 | 34.6 | |
| Alite | 21.0 | 10.8 | |
| Portlandite | 2.7 | / | |
| Tobermorite | 31.4 | 31 | |
| Xonotlite | 11 | 23.8 | |
| Ettringite | 9.0 | / |
Table 6.
Composition of phases present in hardened control cement paste and hardened cement paste with 30 of silica fume thermally treated at 400 ℃ (weight%).
Table 6.
Composition of phases present in hardened control cement paste and hardened cement paste with 30 of silica fume thermally treated at 400 ℃ (weight%).
| Phase | Chemical Formula | Cement Paste Control (%) at 400 ℃ | Cement Paste with Silica Fume (%) at 400 ℃ |
|---|---|---|---|
| Belite | 25.5 | 21.2 | |
| Alite | 22.1 | 20.8 | |
| Calcium oxide | 16.1 | / | |
| Tobermorite | 36.2 | 39.6 | |
| Xonotlite | / | 18.3 |
Disclaimer/Publisher’s Note: The statements, opinions and data contained in all publications are solely those of the individual author(s) and contributor(s) and not of MDPI and/or the editor(s). MDPI and/or the editor(s) disclaim responsibility for any injury to people or property resulting from any ideas, methods, instructions or products referred to in the content. |
© 2023 by the authors. Licensee MDPI, Basel, Switzerland. This article is an open access article distributed under the terms and conditions of the Creative Commons Attribution (CC BY) license (https://creativecommons.org/licenses/by/4.0/).
Share and Cite
MDPI and ACS Style
Nkanpa Moffo, N.D.; Mwero, J.; Gariy, Z.A. Performance of Silica Fume on Preventing Strength Retrogression in Hardened Cement Paste and Mortar at Elevated Temperatures. Buildings 2023, 13, 1301. https://doi.org/10.3390/buildings13051301
AMA Style
Nkanpa Moffo ND, Mwero J, Gariy ZA. Performance of Silica Fume on Preventing Strength Retrogression in Hardened Cement Paste and Mortar at Elevated Temperatures. Buildings. 2023; 13(5):1301. https://doi.org/10.3390/buildings13051301
Chicago/Turabian StyleNkanpa Moffo, Ngaelle Dorivice, John Mwero, and Zachary A. Gariy. 2023. "Performance of Silica Fume on Preventing Strength Retrogression in Hardened Cement Paste and Mortar at Elevated Temperatures" Buildings 13, no. 5: 1301. https://doi.org/10.3390/buildings13051301
Note that from the first issue of 2016, this journal uses article numbers instead of page numbers. See further details here.