
Crack Detection in Bearing Plate of Prestressed Anchorage Using Electromechanical Impedance Technique: A Numerical Investigation
 , , ,
, , ,  ,
,  and
and
Abstract
:1. Introduction
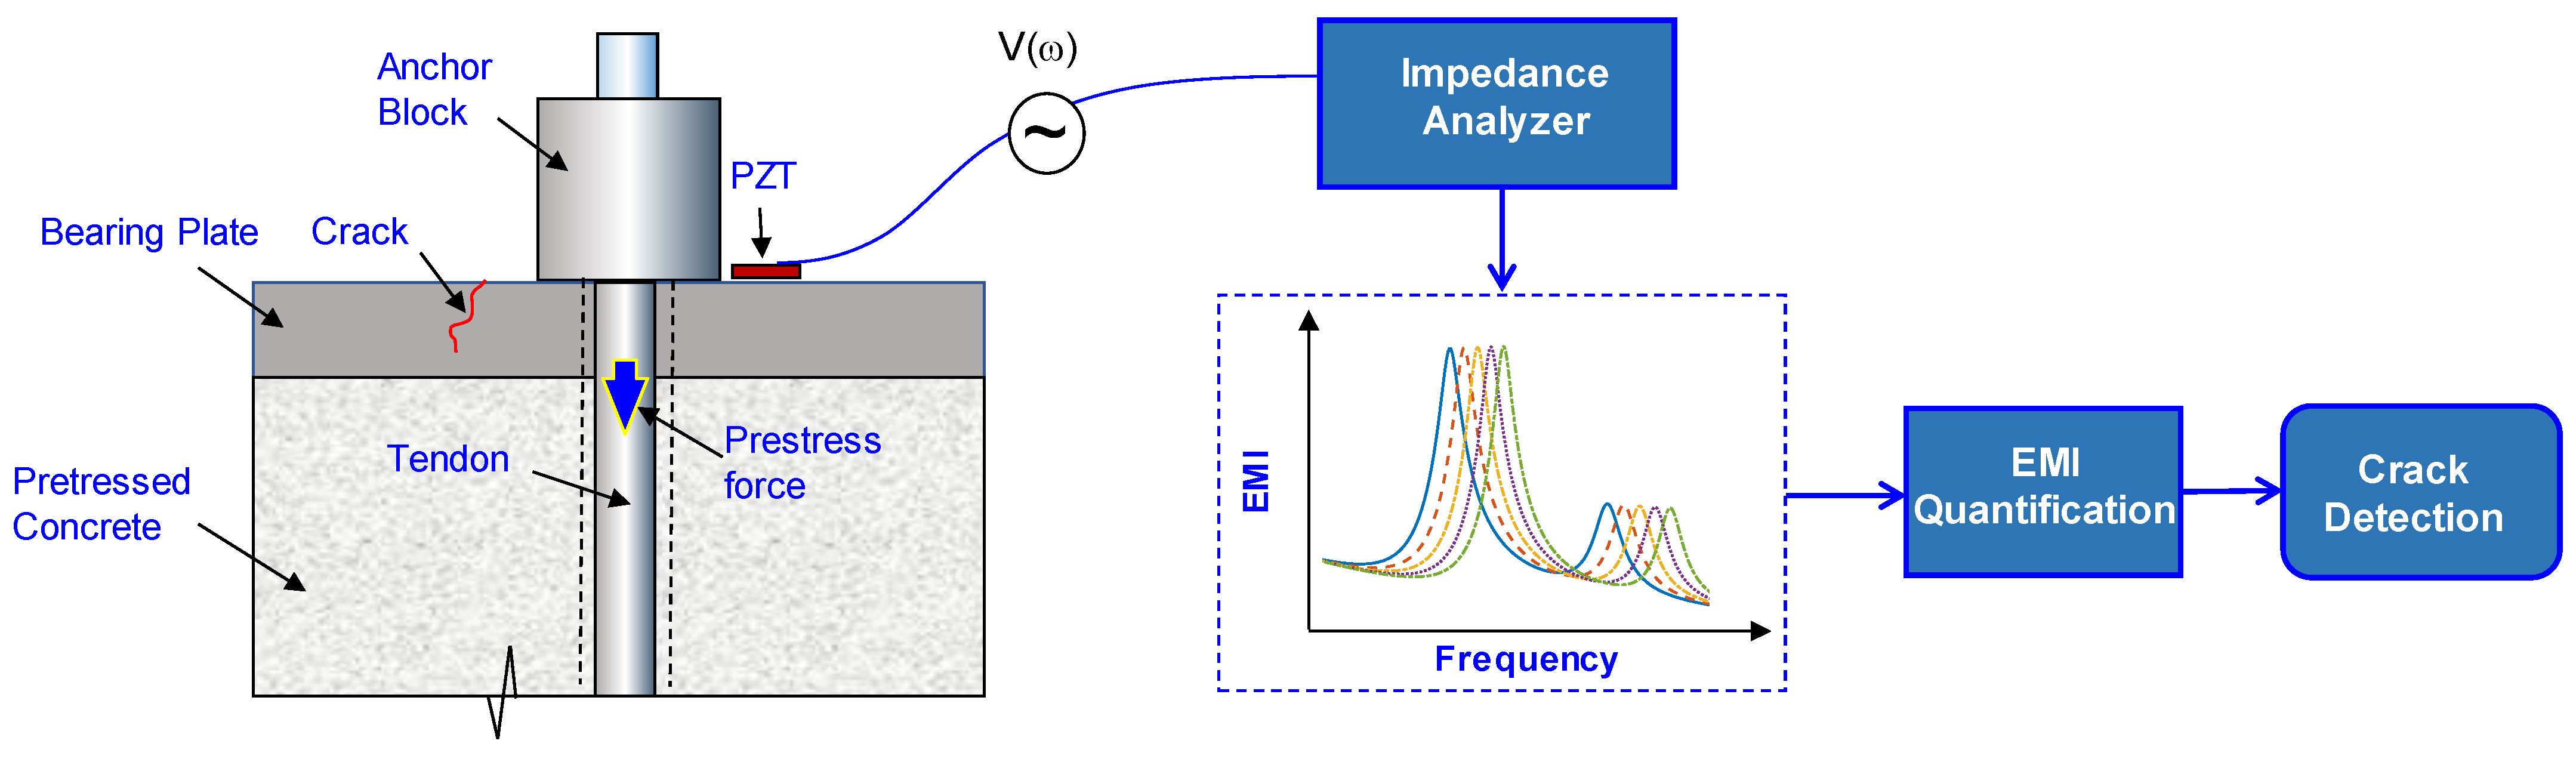
2. EMI Technique
2.1. Overview
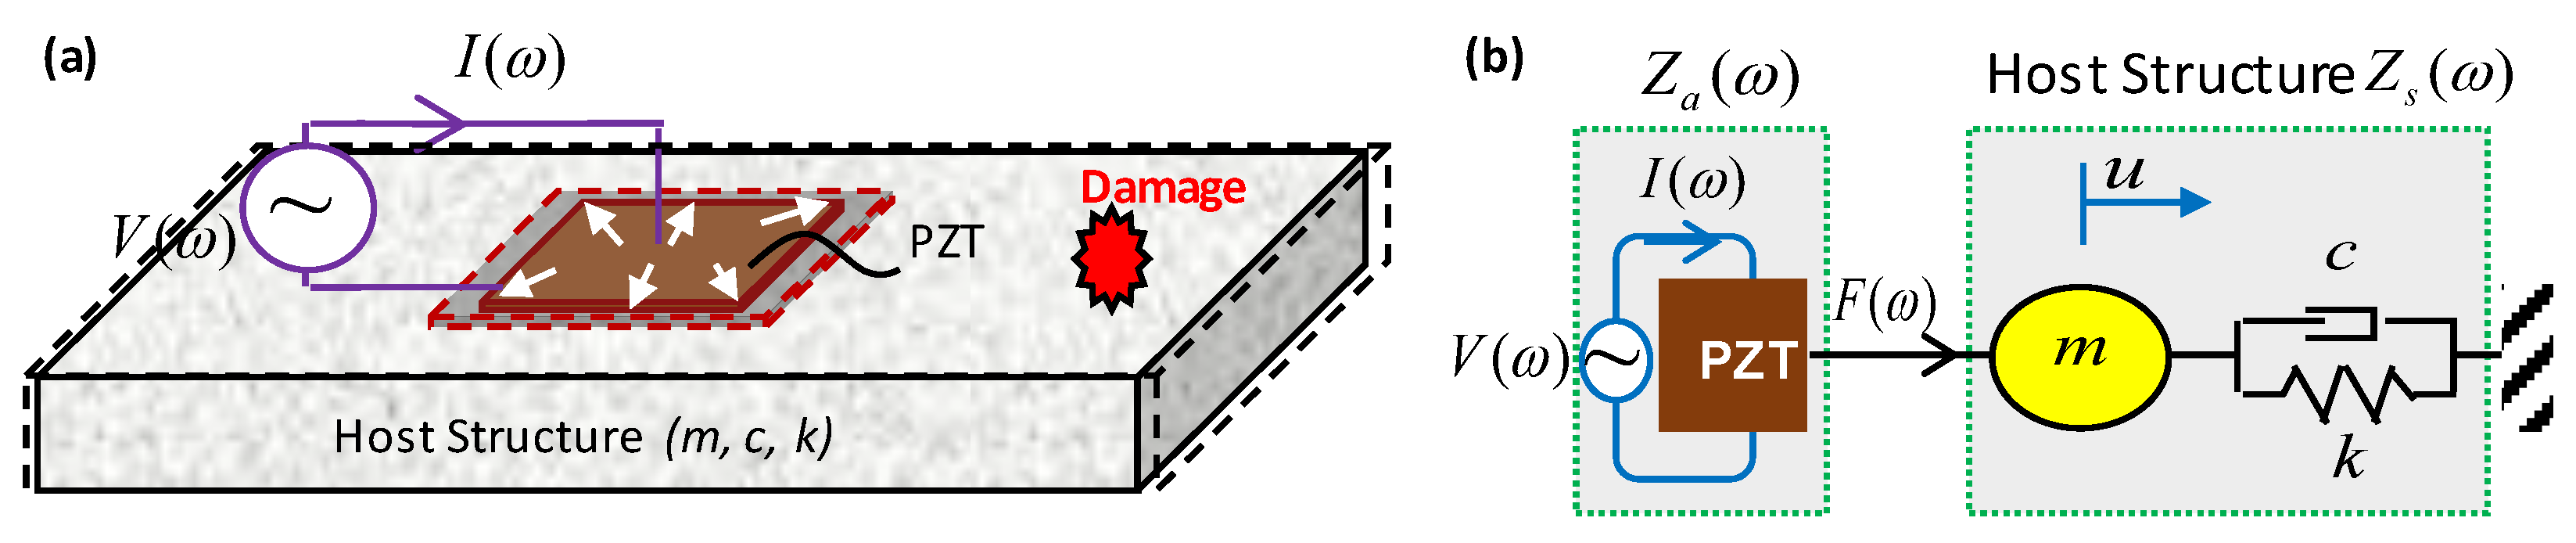
2.2. Theory of EMI Response
2.3. Damage Evaluation Approach
3. Numerical Simulation
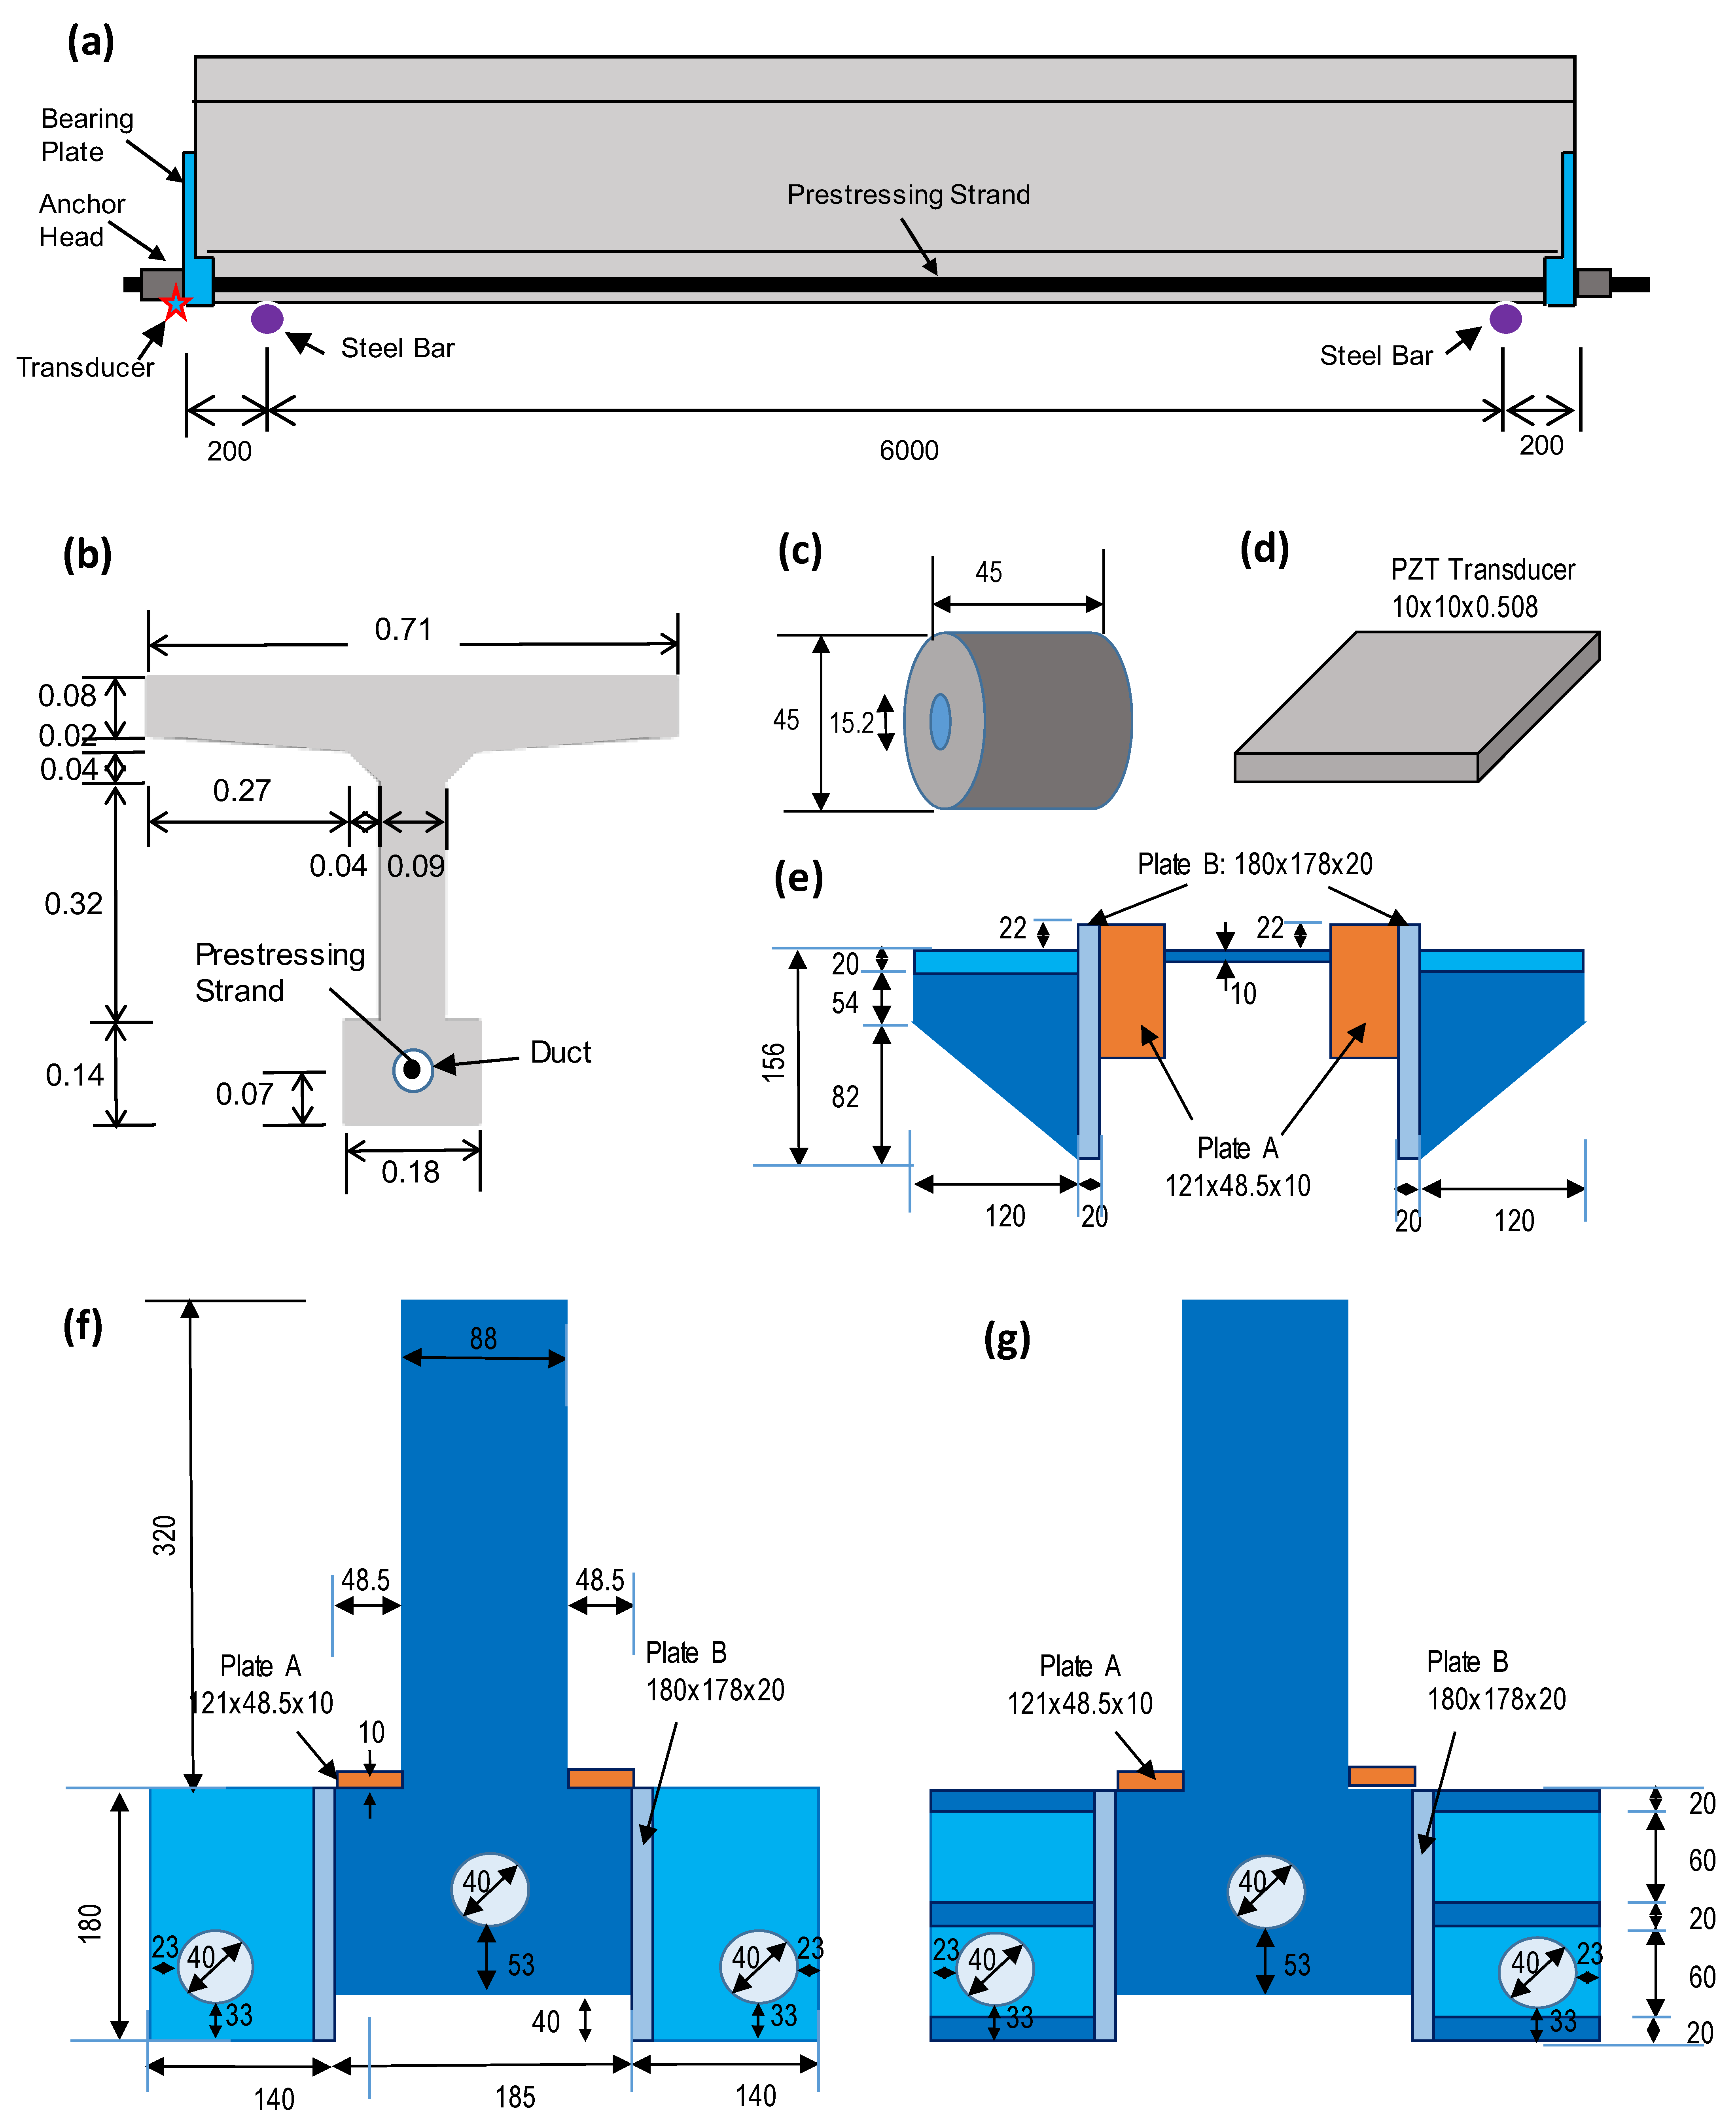
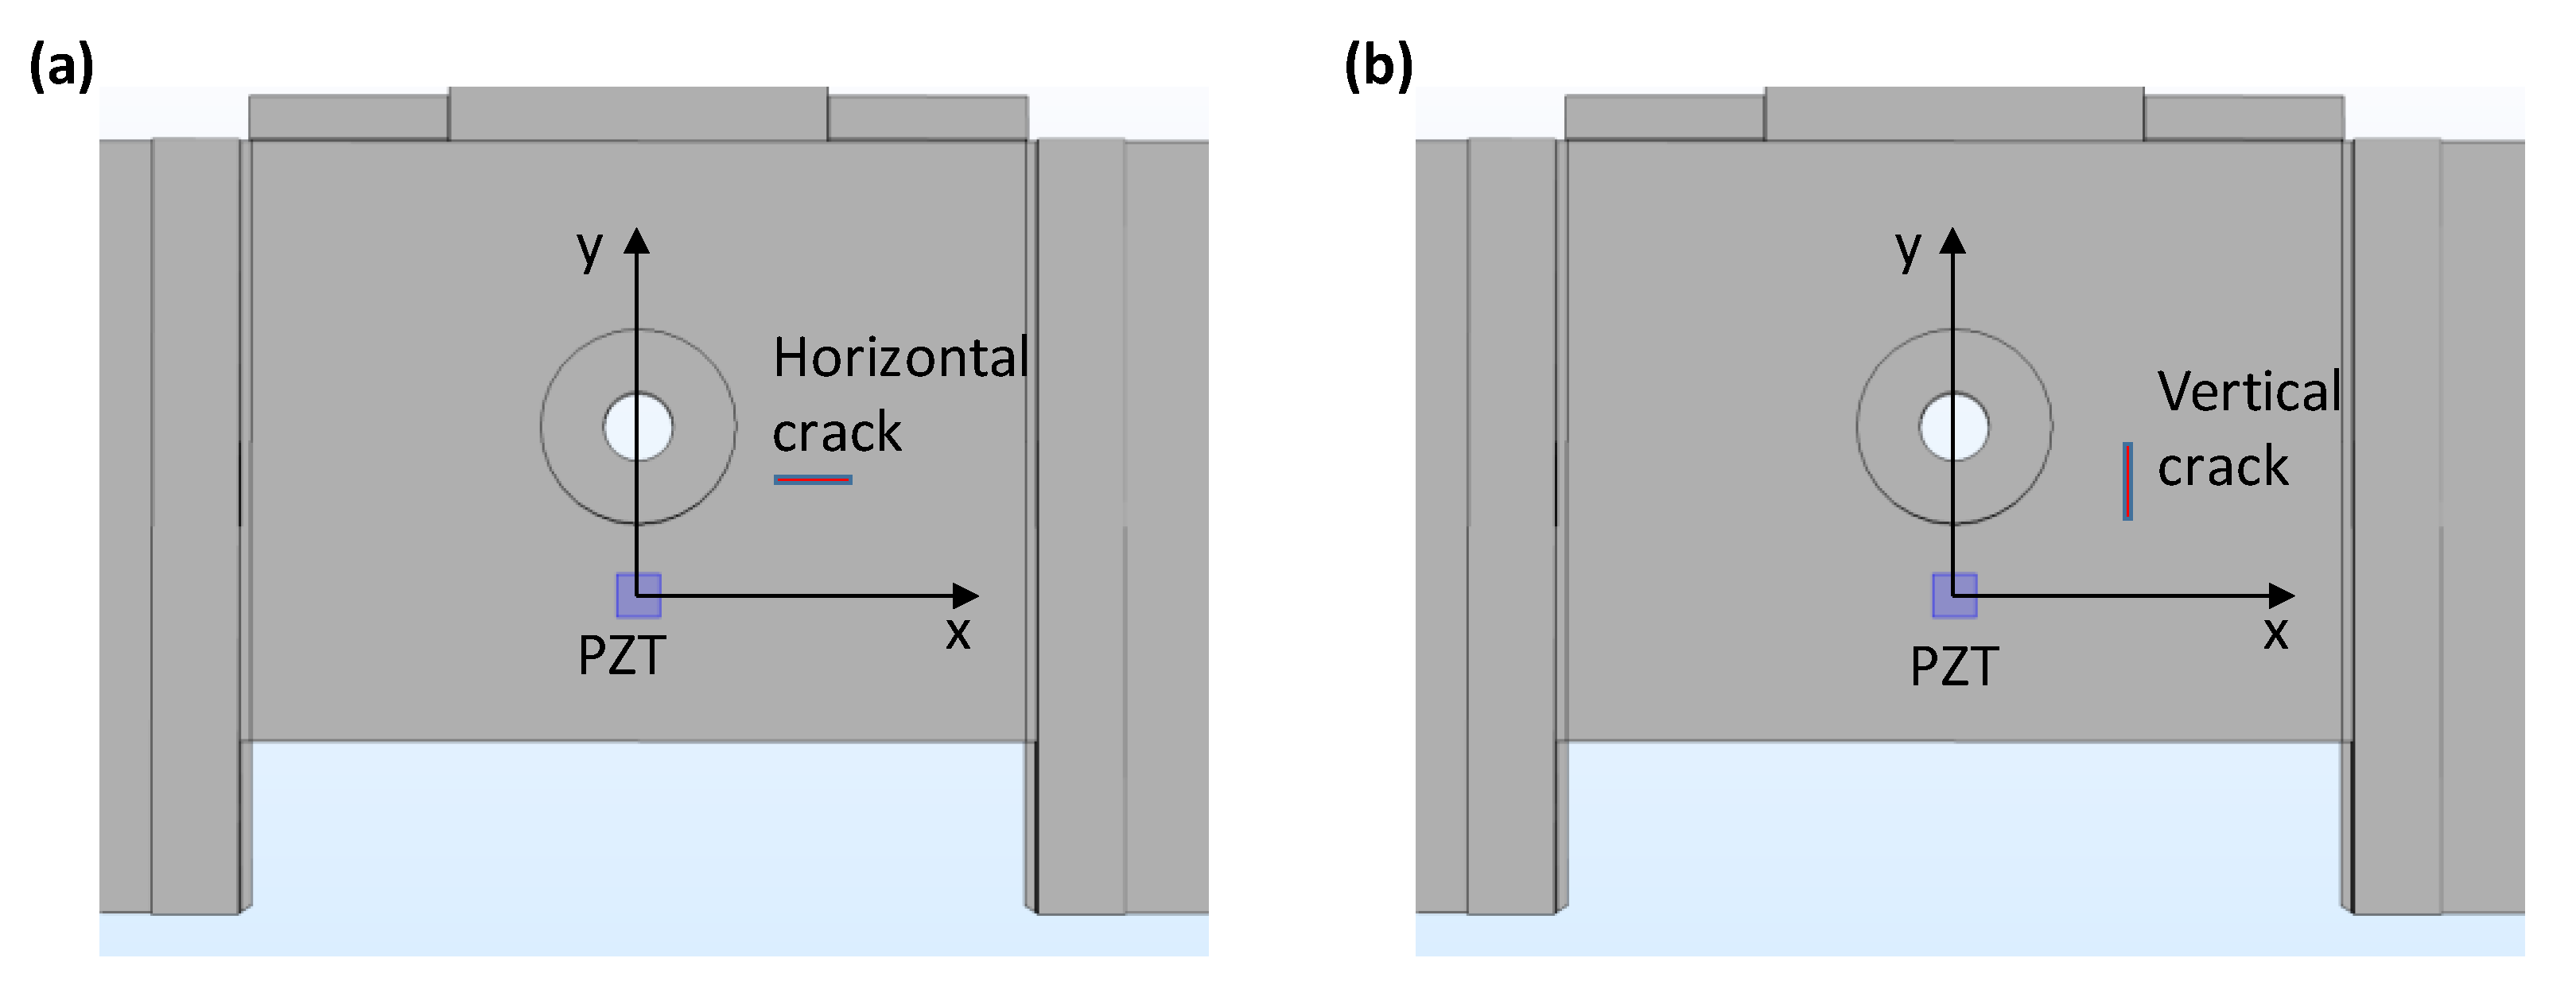
3.1. Description of Target Structure
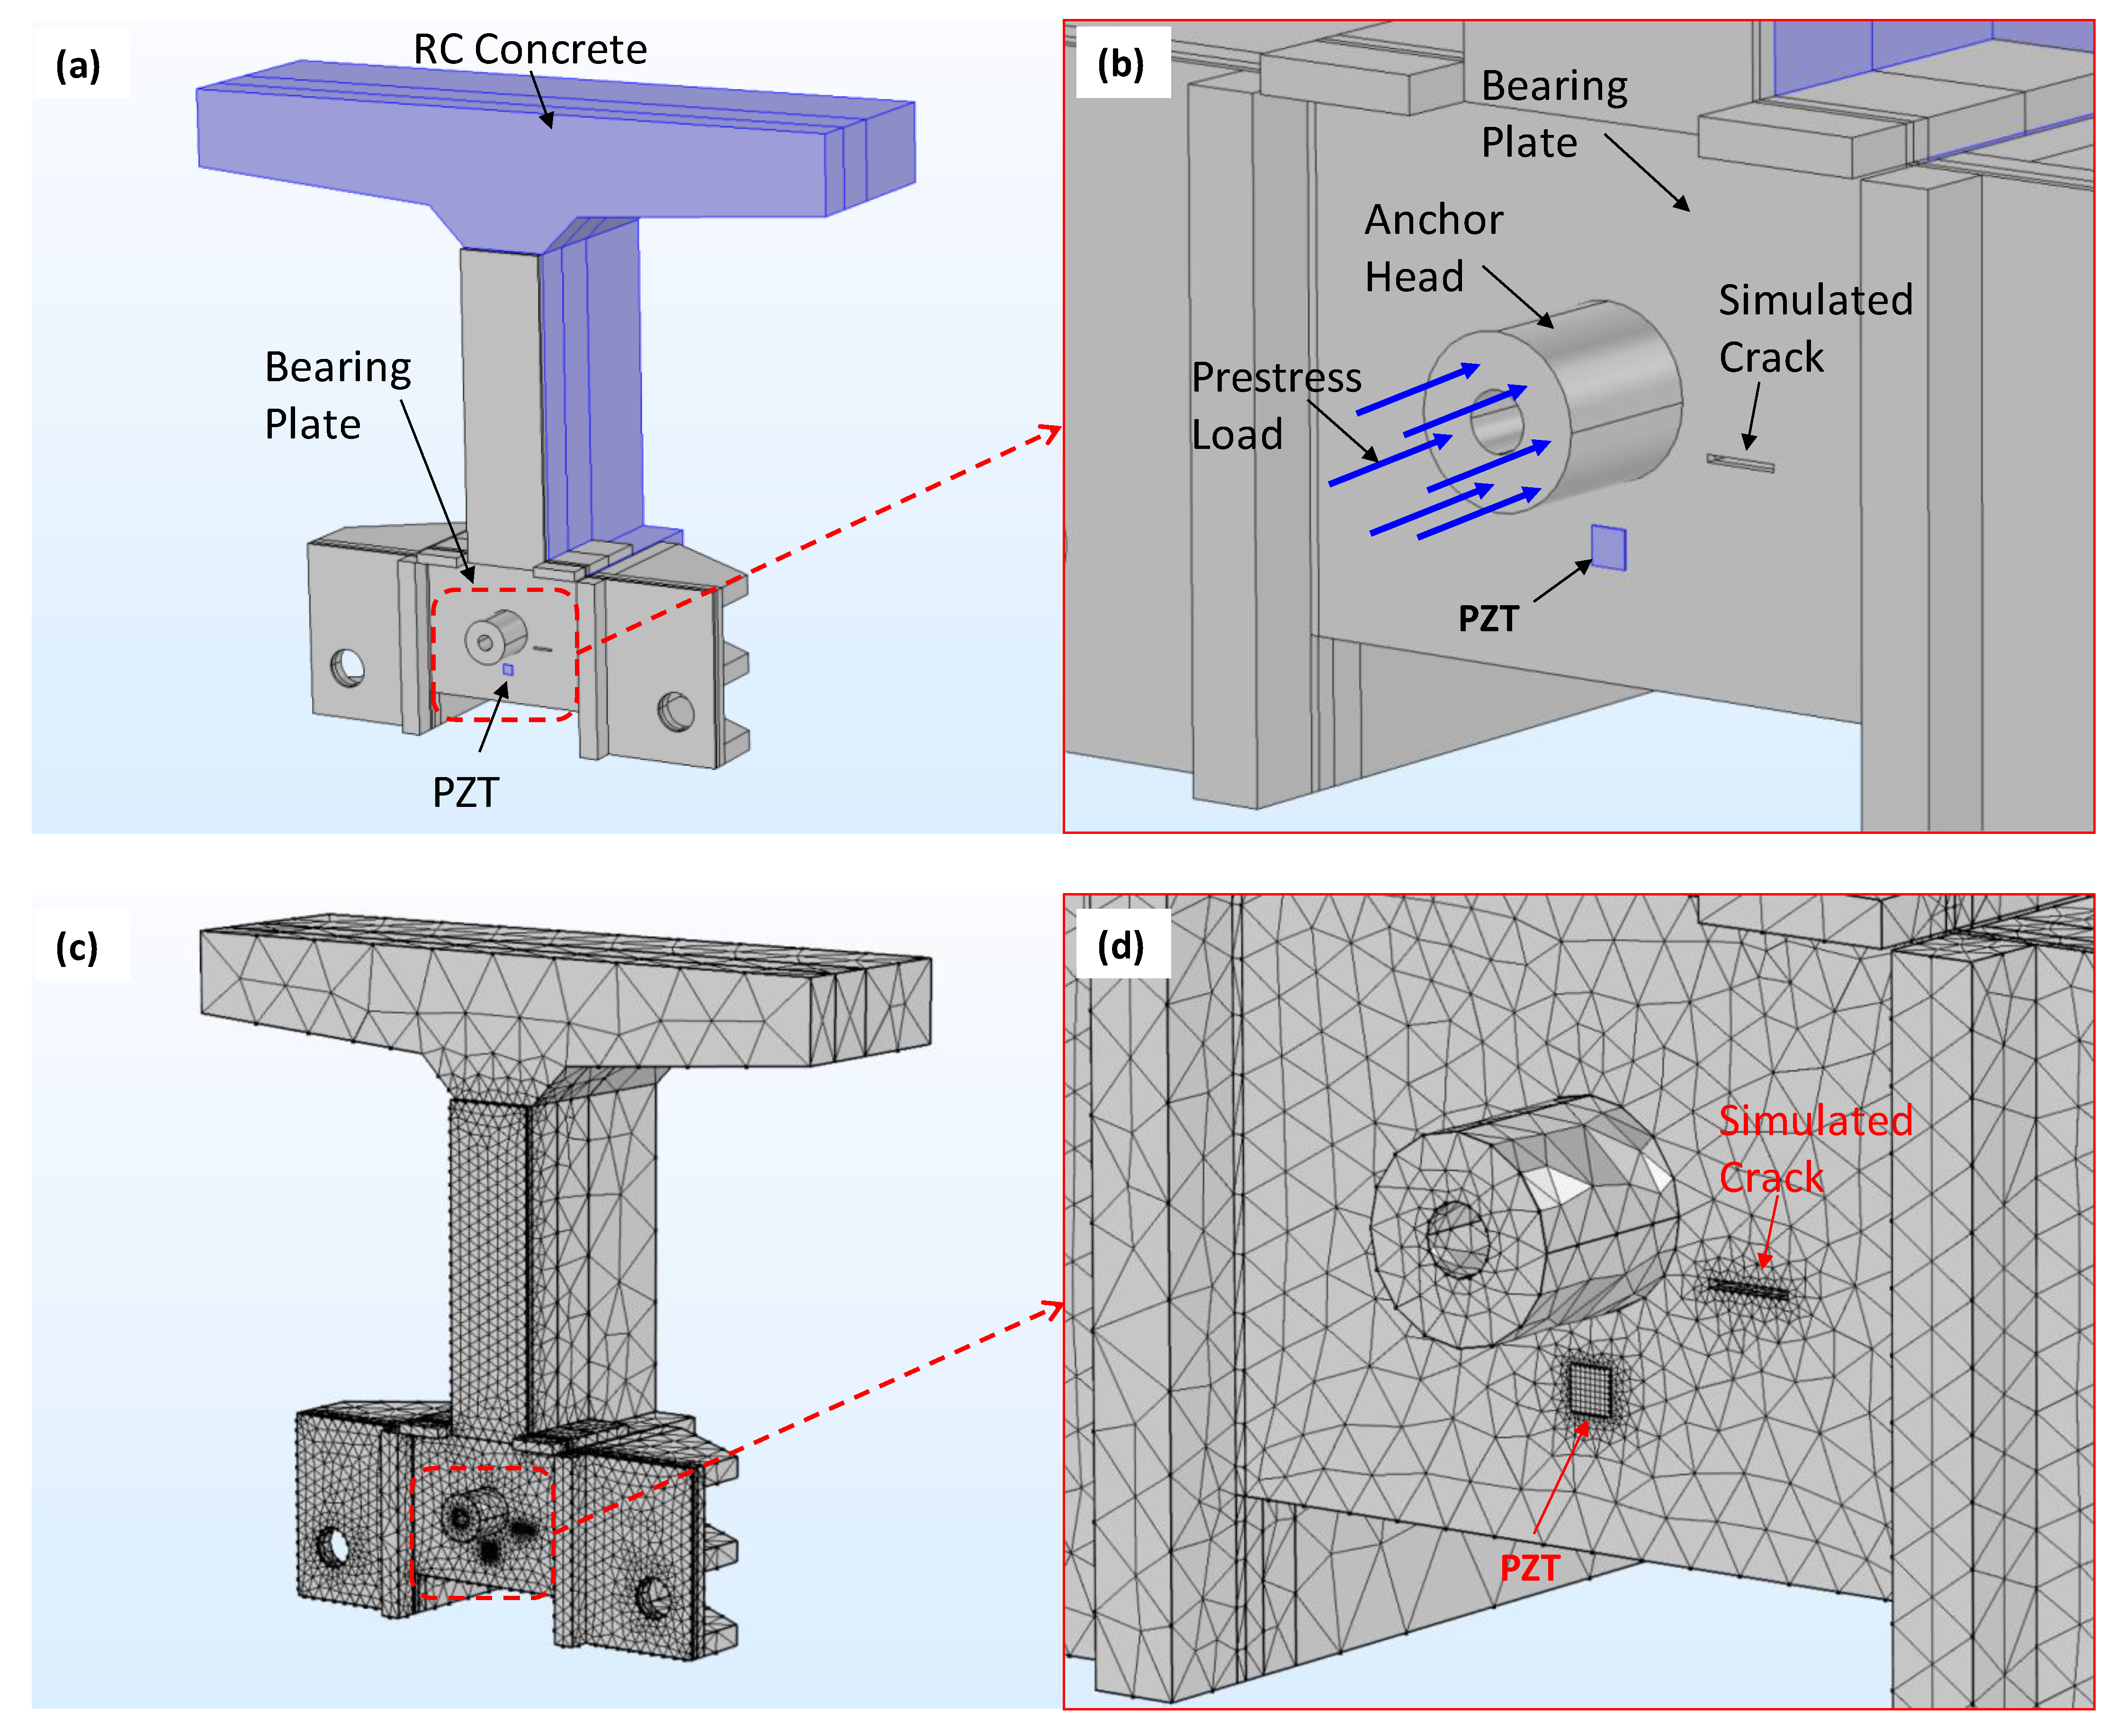
3.2. Finite Element Modeling
3.2.1. Structural and Material Modeling
3.2.2. Compatibility and Boundary Conditions
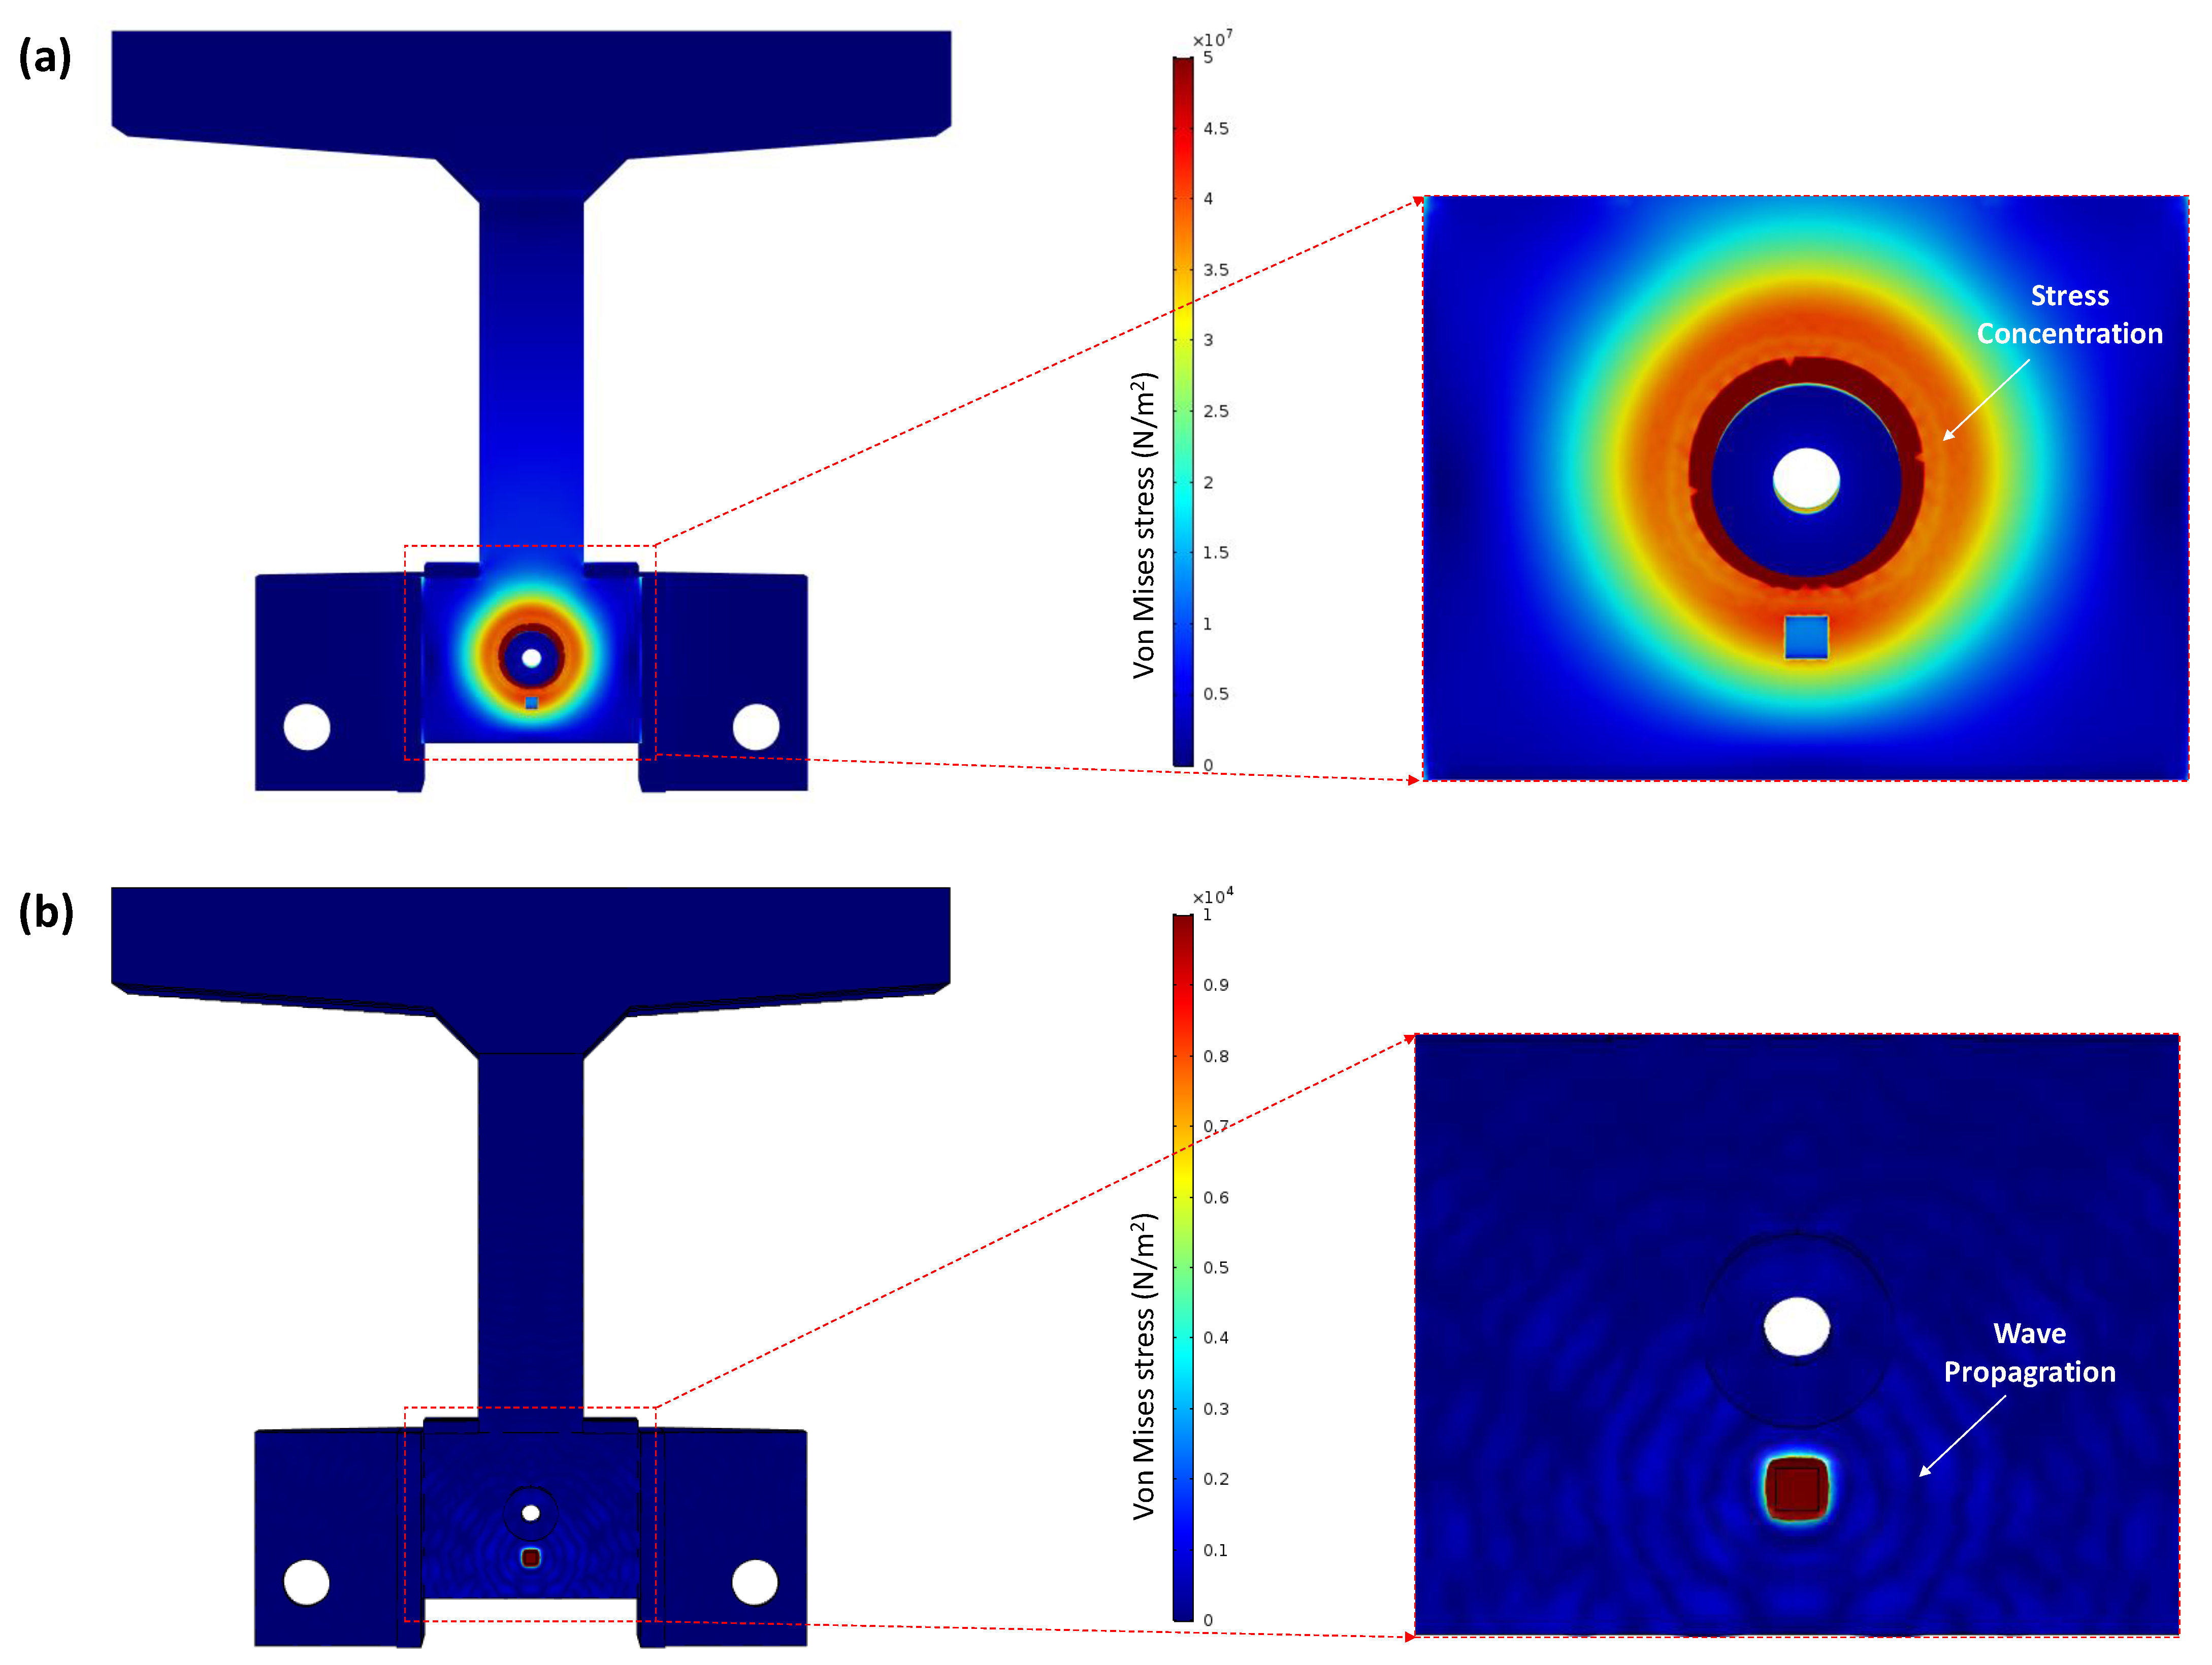
3.2.3. Linear Stress Analysis under Prestress Load and Piezoelectric Deformation
3.3. Simulation of EMI Response under Fatigue Crack
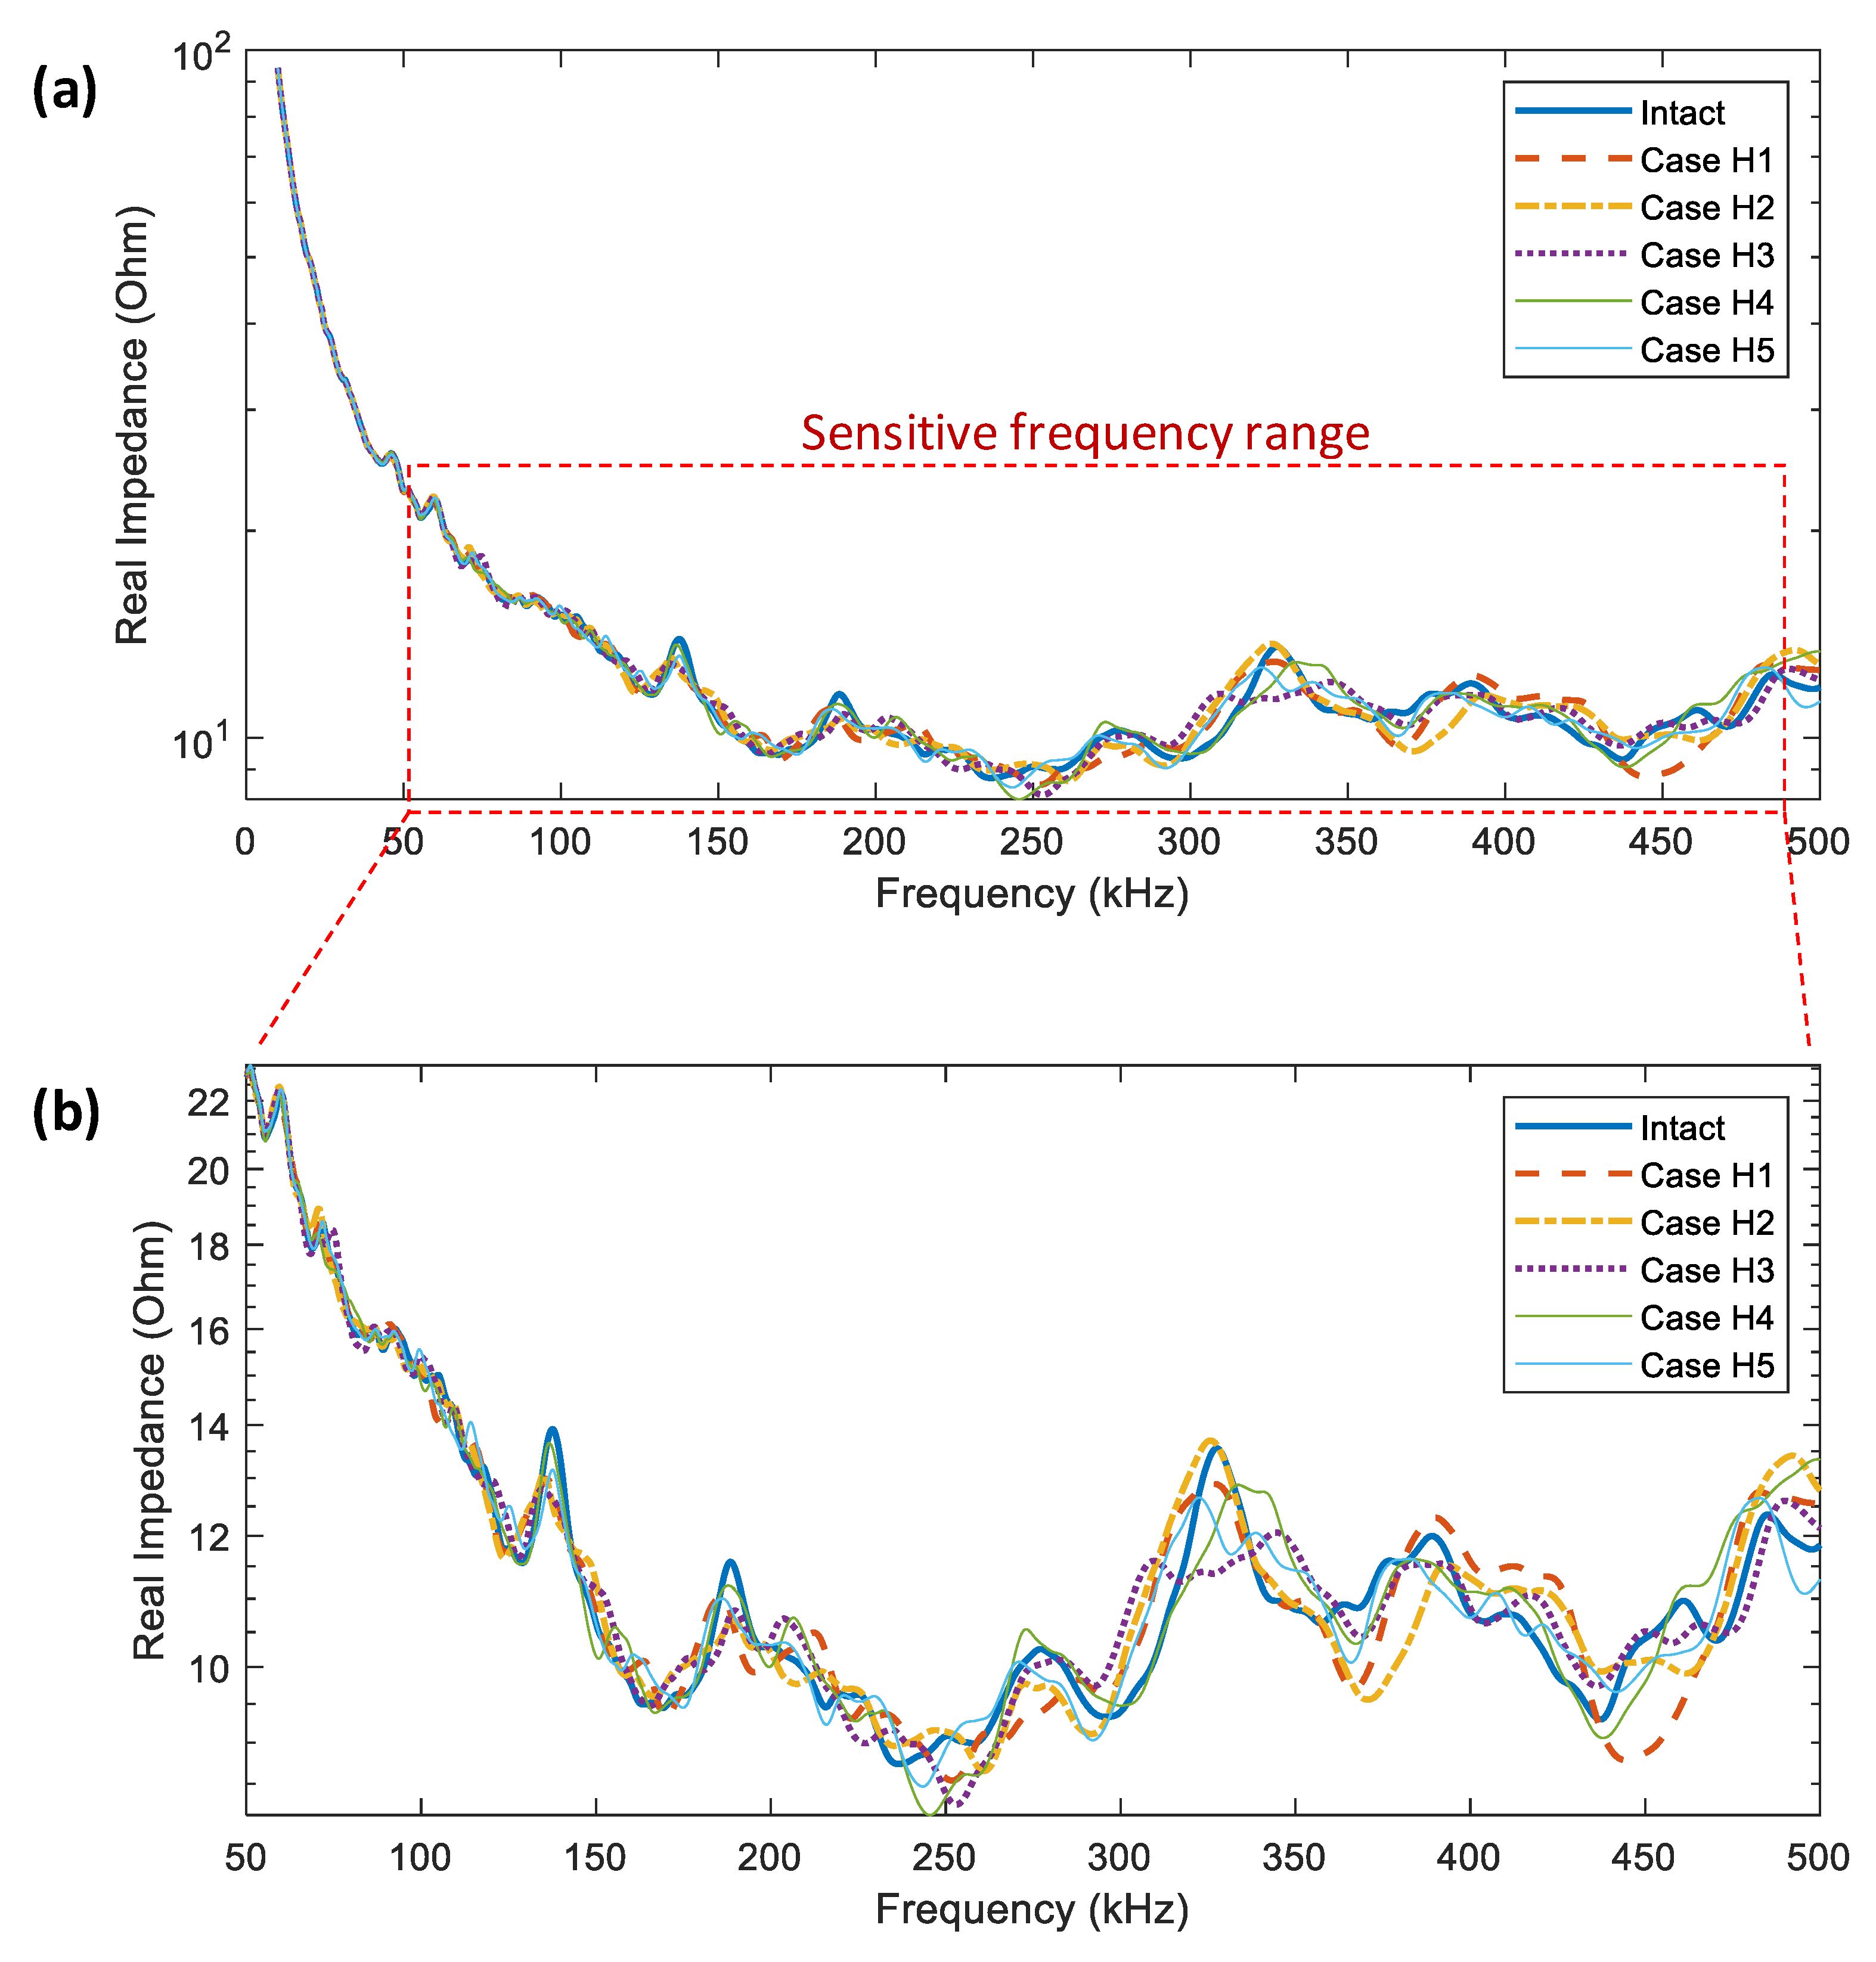
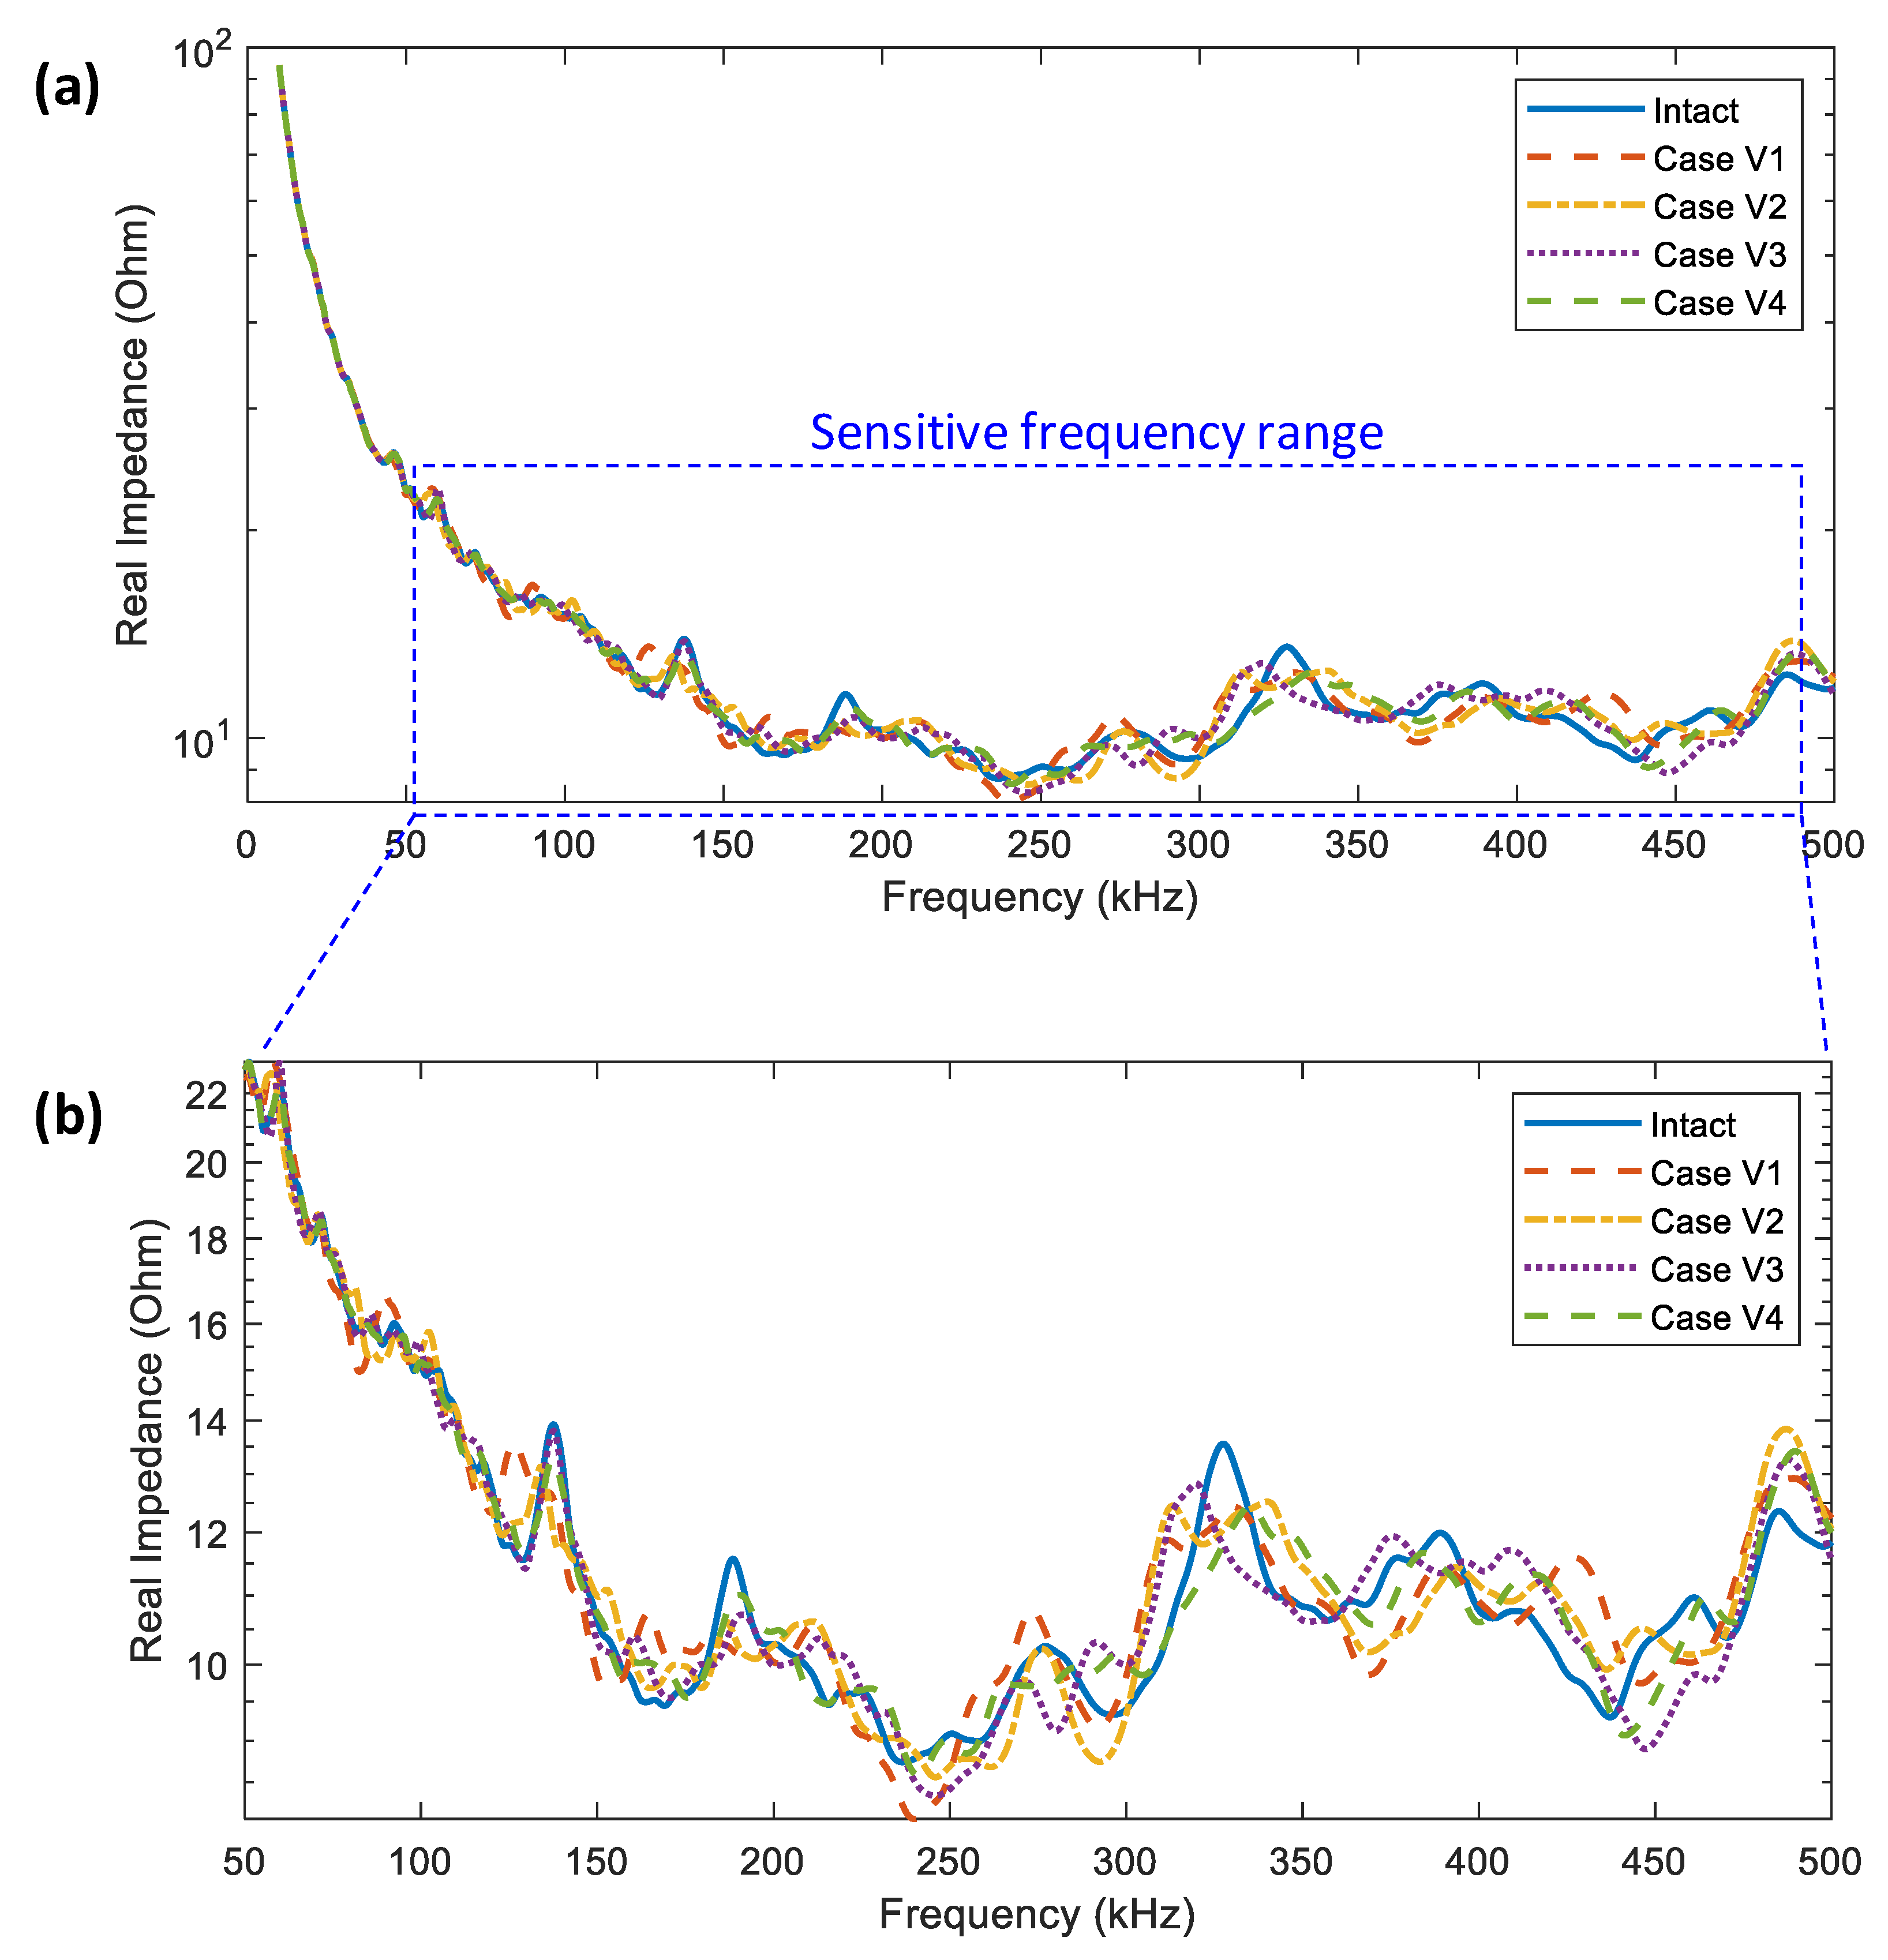
3.4. EMI Quantification and Crack Assessment
4. Summary and Conclusions
- (1)
- The EMI response above 50 kHz showed high sensitivity to cracks in the bearing plate.
- (2)
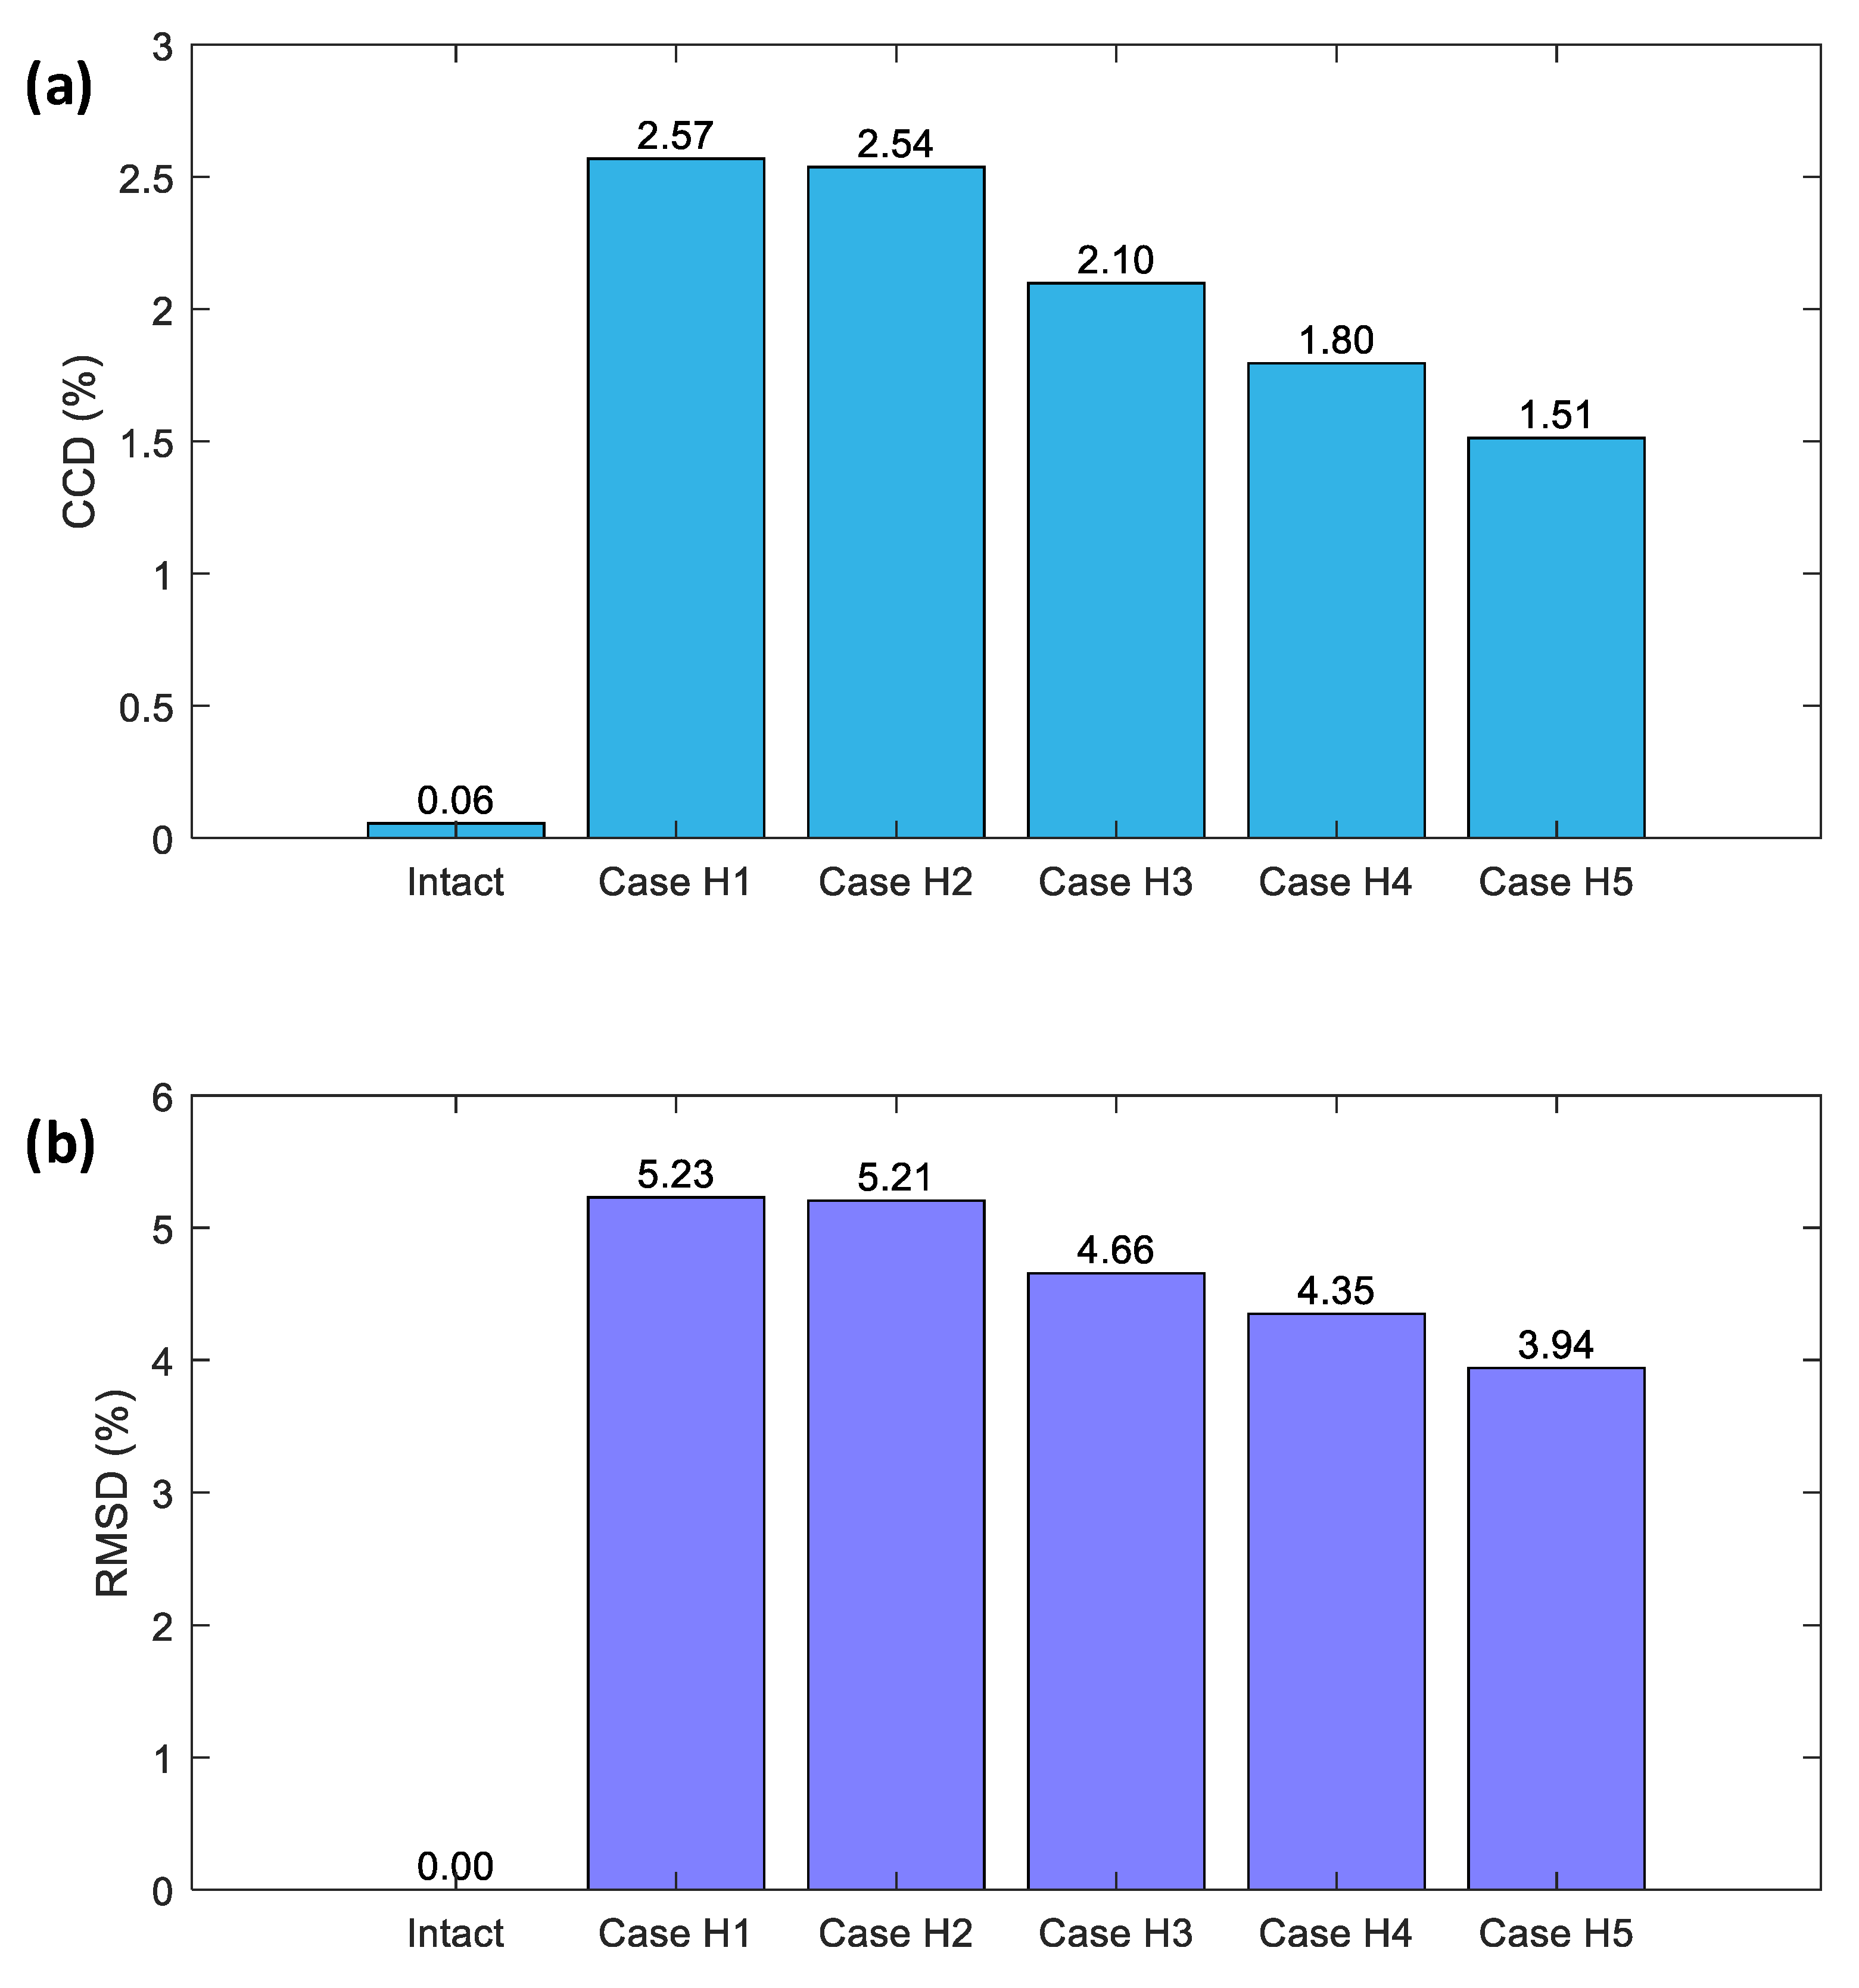
- The bearing plate’s vertical and horizontal cracks were successfully detected using the RMSD and CCD metrics.
- (3)
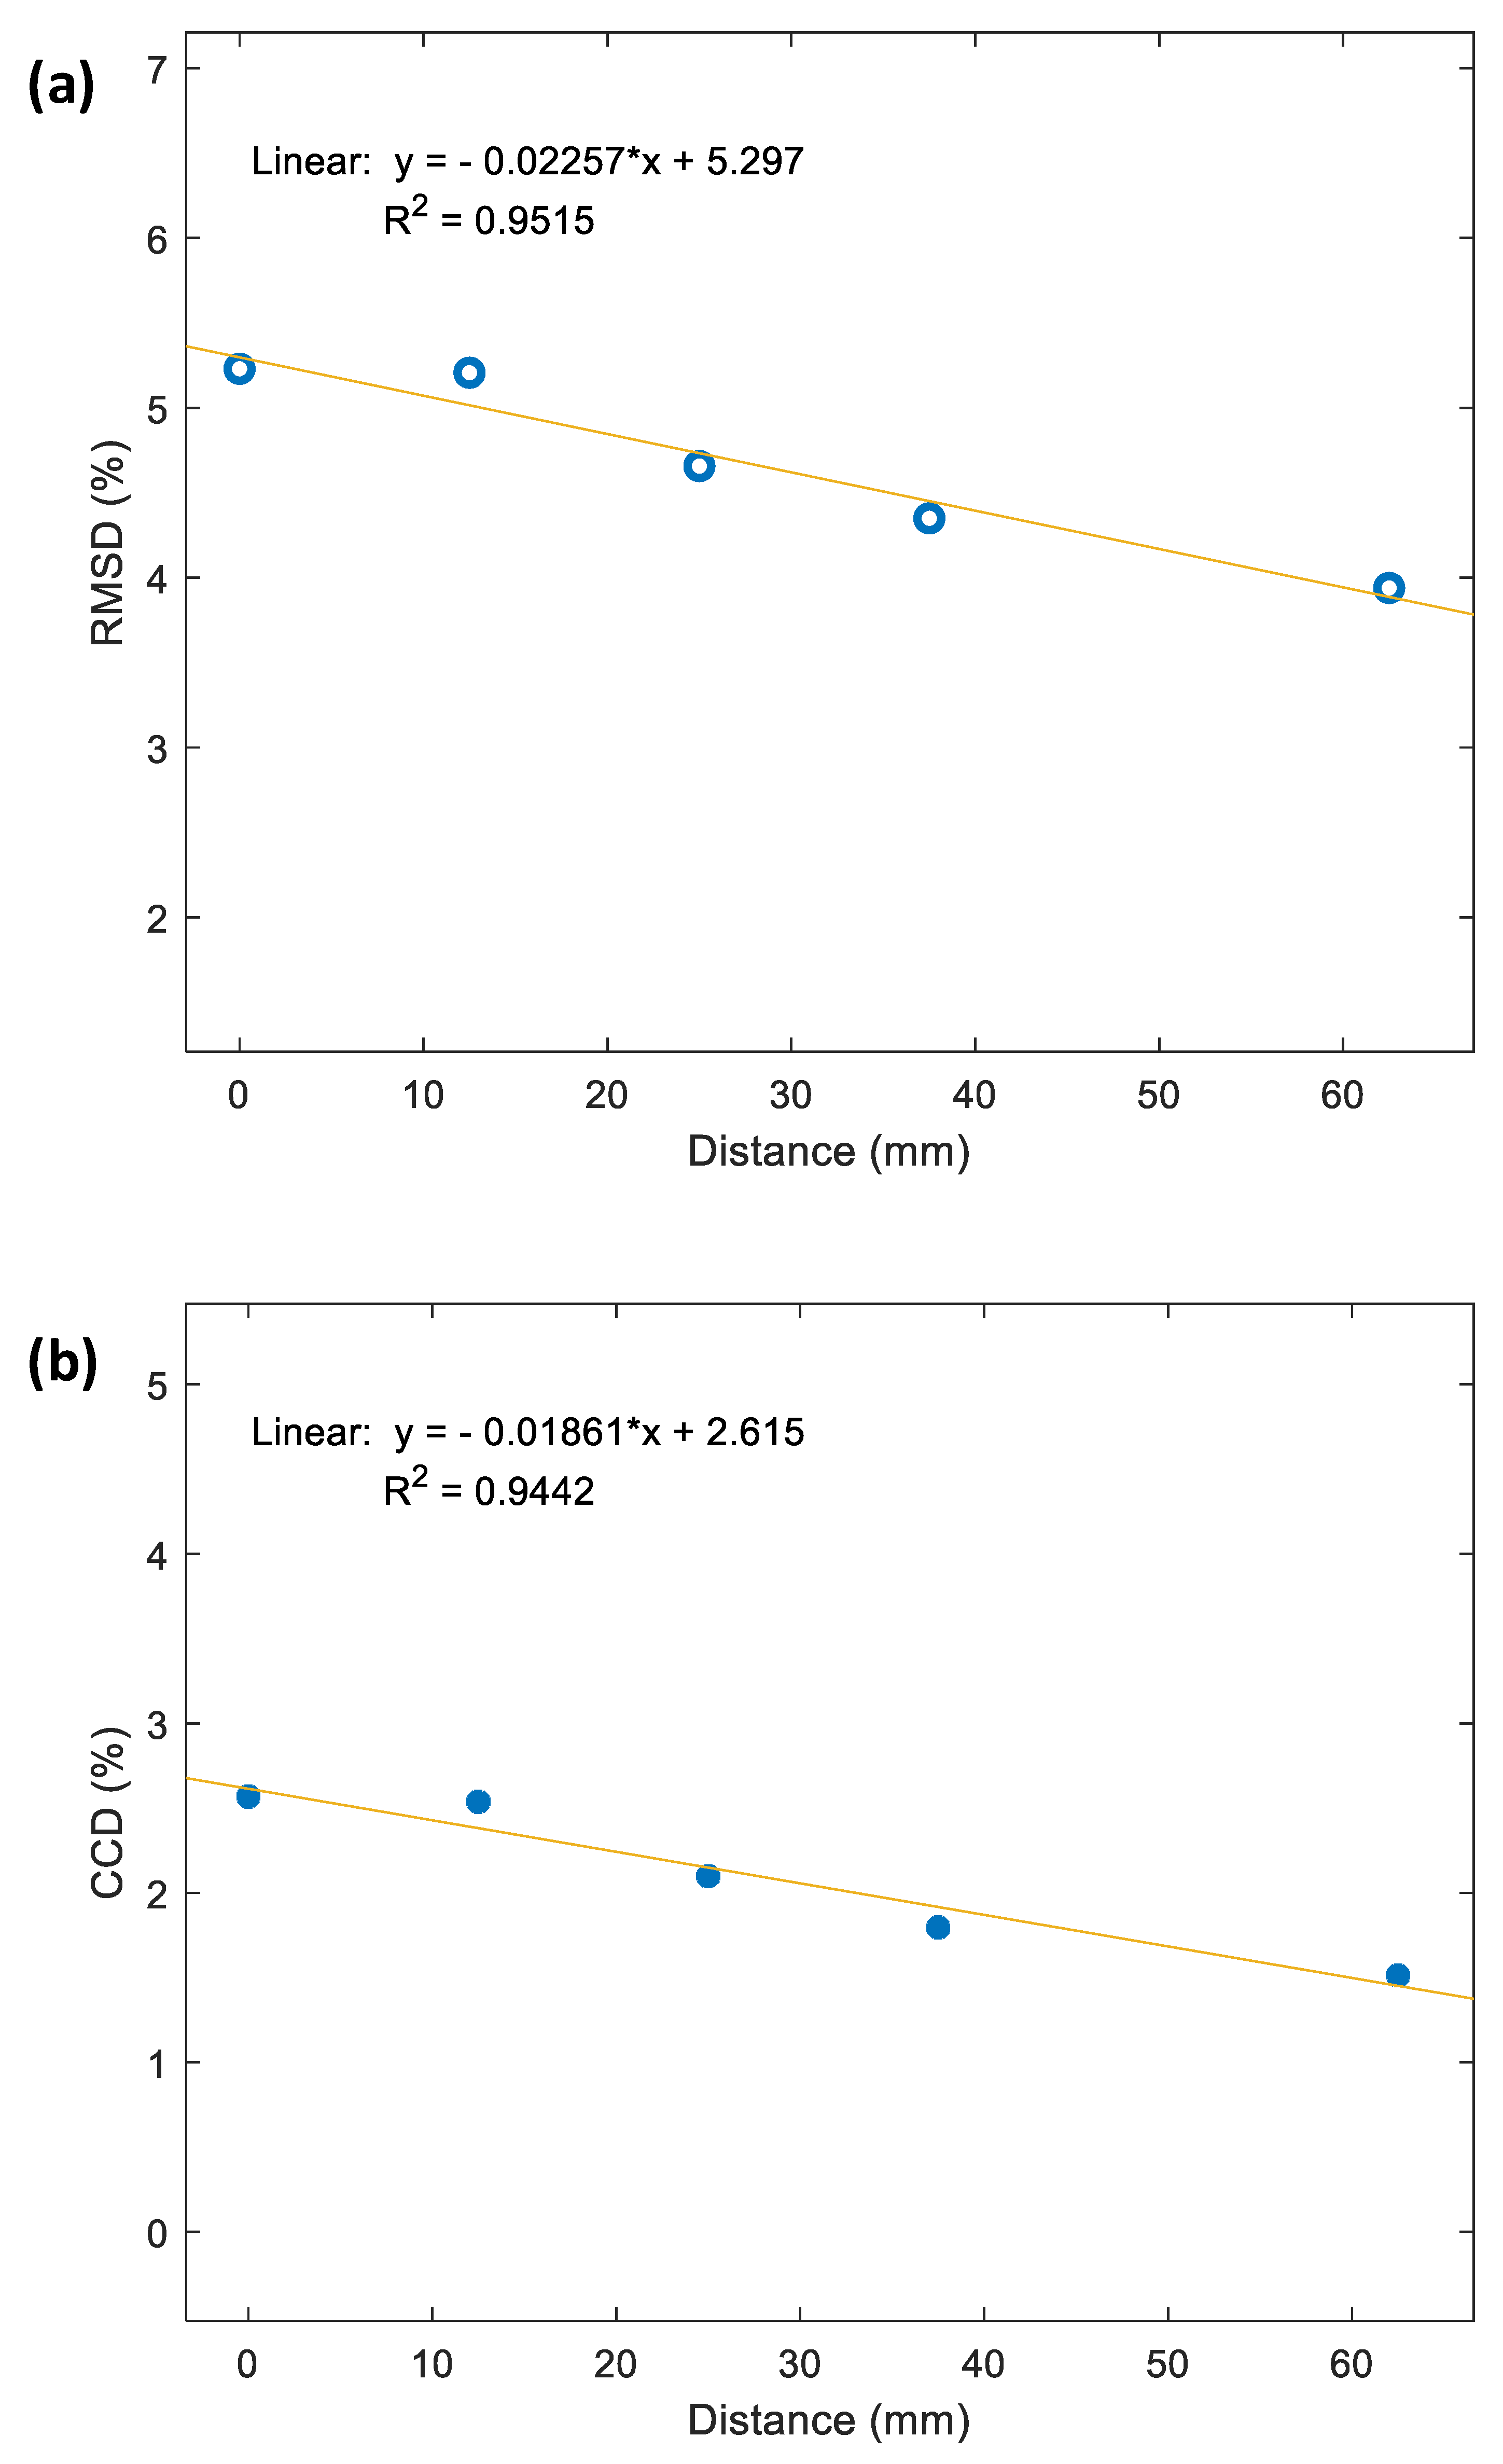
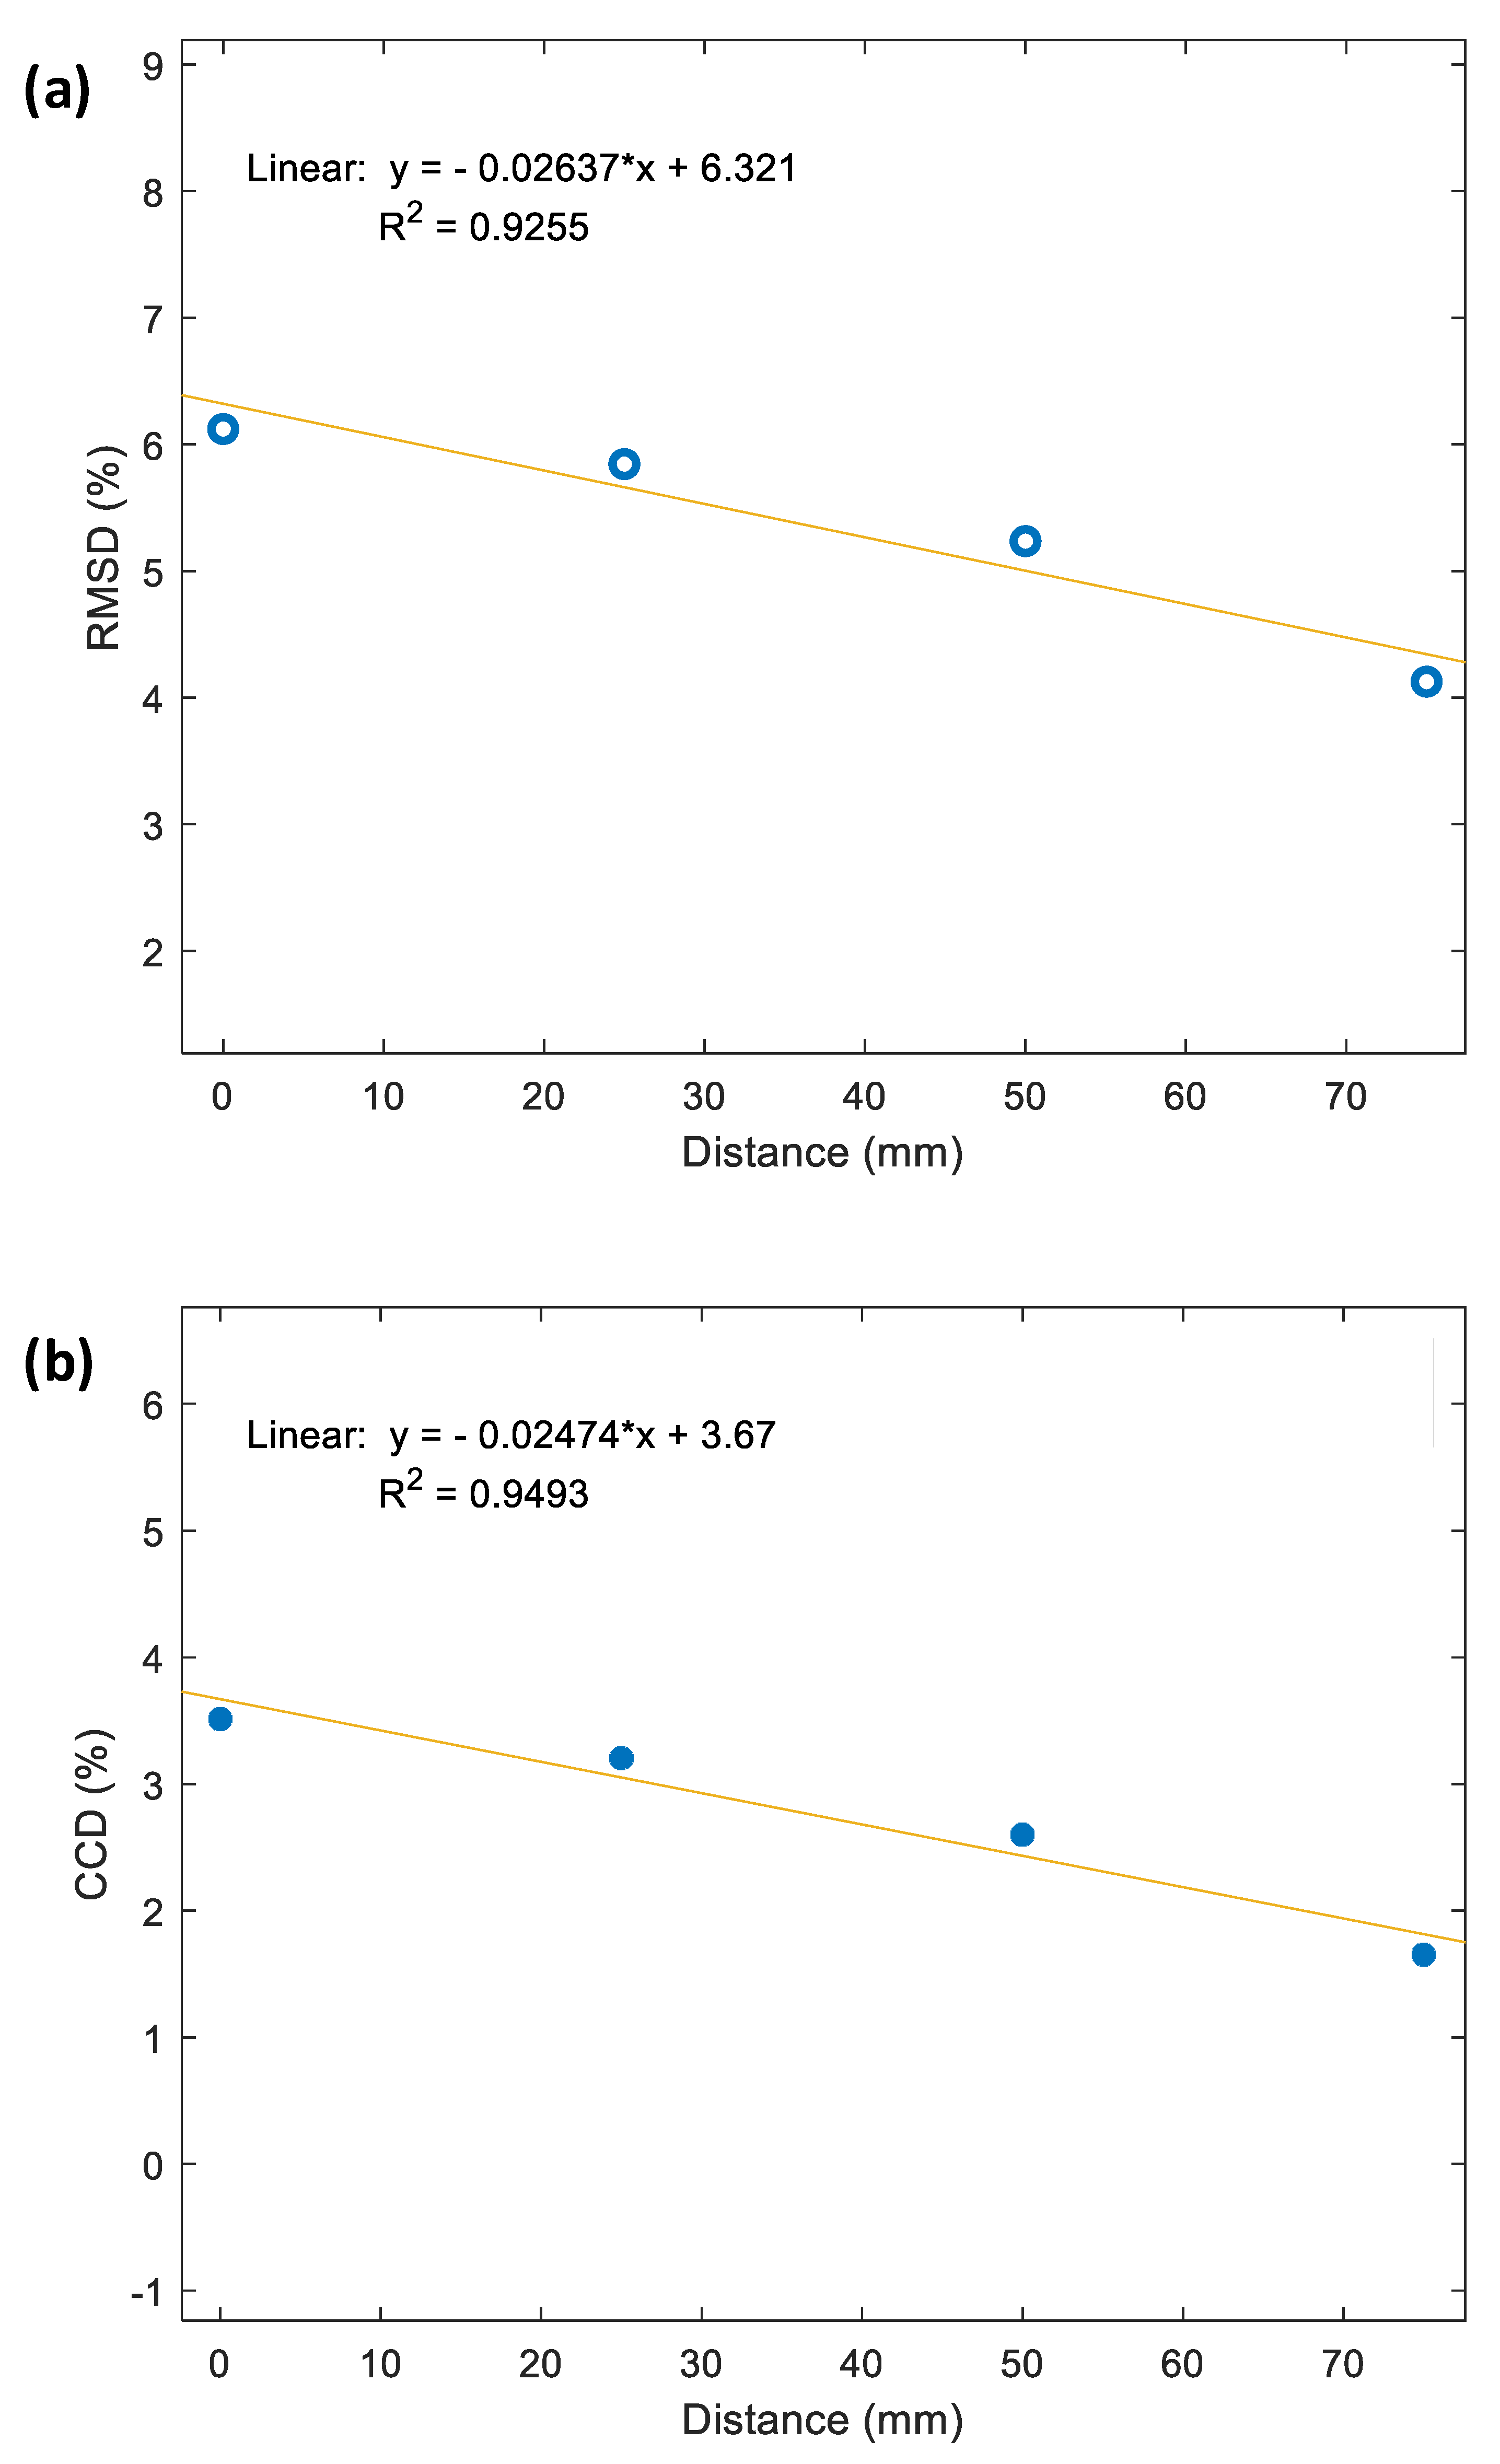
- The relationship between the damage metrics and the sensing distance was linear: the magnitude of damage metrics linearly decreased with the sensing distance.
Author Contributions
Funding
Data Availability Statement
Acknowledgments
Conflicts of Interest
References
- Song, G.; Gu, H.; Mo, Y.-L. Smart aggregates: Multi-functional sensors for concrete structures—A tutorial and a review. Smart Mater. Struct. 2008, 17, 033001. [Google Scholar] [CrossRef]
- Na, W.S.; Baek, J. A Review of the Piezoelectric Electromechanical Impedance Based Structural Health Monitoring Technique for Engineering Structures. Sensors 2018, 18, 1307. [Google Scholar] [CrossRef] [PubMed] [Green Version]
- Huynh, T.-C.; Dang, N.-L.; Kim, J.-T. Advances and challenges in impedance-based structural health monitoring. Struct. Monit. Maint. 2017, 4, 301–329. [Google Scholar] [CrossRef]
- Lopes, V.; Park, G.; Cudney, H.H.; Inman, D.J. Impedance-Based Structural Health Monitoring with Artificial Neural Networks. J. Intell. Mater. Syst. Struct. 2016, 11, 206–214. [Google Scholar] [CrossRef]
- Min, J.; Park, S.; Yun, C.-B. Impedance-based structural health monitoring using neural networks for autonomous frequency range selection. Smart Mater. Struct. 2010, 19, 125011. [Google Scholar] [CrossRef]
- Min, J.; Park, S.; Yun, C.-B.; Lee, C.-G.; Lee, C. Impedance-based structural health monitoring incorporating neural network technique for identification of damage type and severity. Eng. Struct. 2012, 39, 210–220. [Google Scholar] [CrossRef]
- Park, G.; Sohn, H.; Farrar, C.R.; Inman, D.J. Overview of piezoelectric impedance-based health monitoring and path forward. Shock. Vib. Dig. 2003, 35, 451–464. [Google Scholar] [CrossRef] [Green Version]
- Park, G.; Cudney, H.H.; Inman, D.J. Feasibility of using impedance-based damage assessment for pipeline structures. Earthq. Eng. Struct. Dyn. 2001, 30, 1463–1474. [Google Scholar] [CrossRef]
- Le, T.-C.; Luu, T.-H.-T.; Nguyen, H.-P.; Nguyen, T.-H.; Ho, D.-D.; Huynh, T.-C. Piezoelectric Impedance-Based Structural Health Monitoring of Wind Turbine Structures: Current Status and Future Perspectives. Energies 2022, 15, 5459. [Google Scholar] [CrossRef]
- Burgoyne, C.; Scantlebury, R. Lessons learned from the bridge collapse in Palau. Proc. Inst. Civ. Eng.-Civ. Eng. 2008, 161, 28–34. [Google Scholar] [CrossRef] [Green Version]
- Nguyen, K.-D.; Kim, J.-T.; Park, Y.-H. Multiscale structural health monitoring of cable-anchorage system using piezoelectric PZT sensors. Int. J. Distrib. Sens. Netw. 2013, 9, 254785. [Google Scholar] [CrossRef] [Green Version]
- Min, J.; Yun, C.-B.; Hong, J.-W. An electromechanical impedance-based method for tensile force estimation and damage diagnosis of post-tensioning systems. Smart Struct. Syst. 2016, 17, 107–122. [Google Scholar] [CrossRef]
- Huynh, T.-C.; Lee, K.-S.; Kim, J.-T. Local dynamic characteristics of PZT impedance interface on tendon anchorage under prestress force variation. Smart Struct. Syst. 2015, 15, 375–393. [Google Scholar] [CrossRef]
- Kim, J.-T.; Park, J.-H.; Hong, D.-S.; Park, W.-S. Hybrid health monitoring of prestressed concrete girder bridges by sequential vibration-impedance approaches. Eng. Struct. 2010, 32, 115–128. [Google Scholar] [CrossRef]
- Nguyen, K.-D.; Kim, J.-T. Smart PZT-interface for wireless impedance-based prestress-loss monitoring in tendon-anchorage connection. Smart Struct. Syst. 2012, 9, 489–504. [Google Scholar] [CrossRef]
- Nguyen, T.-H.; Phan, T.T.V.; Le, T.-C.; Ho, D.-D.; Huynh, T.-C. Numerical Simulation of Single-Point Mount PZT-Interface for Admittance-Based Anchor Force Monitoring. Buildings 2021, 11, 550. [Google Scholar] [CrossRef]
- Nguyen, T.-T.; Hoang, N.-D.; Nguyen, T.-H.; Huynh, T.-C. Analytical impedance model for piezoelectric-based smart Strand and its feasibility for prestress force prediction. Struct. Control Health Monit. 2022, 29, e3061. [Google Scholar] [CrossRef]
- Nguyen, T.-T.; Tuong Vy Phan, T.; Ho, D.-D.; Man Singh Pradhan, A.; Huynh, T.-C. Deep learning-based autonomous damage-sensitive feature extraction for impedance-based prestress monitoring. Eng. Struct. 2022, 259, 114172. [Google Scholar] [CrossRef]
- Dang, N.-L.; Huynh, T.-C.; Pham, Q.-Q.; Lee, S.-Y.; Kim, J.-T. Damage-sensitive impedance sensor placement on multi-strand anchorage based on local stress variation analysis. Struct. Control Health Monit. 2020, 27, e2547. [Google Scholar] [CrossRef]
- Pham, Q.-Q.; Dang, N.-L.; Ta, Q.-B.; Kim, J.-T. Optimal Localization of Smart Aggregate Sensor for Concrete Damage Monitoring in PSC Anchorage Zone. Sensors 2021, 21, 6337. [Google Scholar] [CrossRef]
- Pham, Q.-Q.; Ta, Q.-B.; Kim, J.-T. Capsule-Like Smart Aggregate with Pre-Determined Frequency Range for Impedance-Based Stress Monitoring. Sensors 2023, 23, 434. [Google Scholar] [CrossRef] [PubMed]
- Shi, Z.; Sun, Z.; Yang, S.; Zhou, K. Fatigue Performance of Butt-Welded Tensile Plate Cable-Girder Anchorages of Long-Span Cable-Stayed Steel Box Girder Railway Bridges. J. Bridge Eng. 2021, 26, 04020108. [Google Scholar] [CrossRef]
- Wei, X.; Qiang, S. Fatigue performance of anchorage zone for long-span single pylon cable-stayed bridge. J. Southwest Jiaotong Univ. 2011, 46, 940–945. [Google Scholar] [CrossRef]
- Tenreiro, A.F.G.; Lopes, A.M.; da Silva, L.F.; Amorim, J.D. Effect of mechanical properties and geometric dimensions on electromechanical impedance signatures for adhesive joint integrity monitoring. Mech. Adv. Mater. Struct. 2022, 1–16. [Google Scholar] [CrossRef]
- Nguyen, T.-T.; Ho, D.-D.; Huynh, T.-C. Electromechanical impedance-based prestress force prediction method using resonant frequency shifts and finite element modelling. Dev. Built Environ. 2022, 12, 100089. [Google Scholar] [CrossRef]
- Ai, D.; Du, L.; Li, H.; Zhu, H. Corrosion damage identification for reinforced concrete beam using embedded piezoelectric transducer: Numerical simulation. Measurement 2022, 192, 110925. [Google Scholar] [CrossRef]
- Sikdar, S.; Singh, S.K.; Malinowski, P.; Ostachowicz, W. Electromechanical impedance based debond localisation in a composite sandwich structure. J. Intell. Mater. Syst. Struct. 2022, 33, 1487–1496. [Google Scholar] [CrossRef]
- Moharana, S.; Sevugaperumal Arun, V. Piezo impedance-based monitoring of loosening of bolts: Experimental and numerical study. J. Intell. Mater. Syst. Struct. 2022, 33, 1056–1071. [Google Scholar] [CrossRef]
- Liang, C.; Sun, F.P.; Rogers, C.A. Coupled Electro-Mechanical Analysis of Adaptive Material Systems—Determination of the Actuator Power Consumption and System Energy Transfer. J. Intell. Mater. Syst. Struct. 1994, 5, 12–20. [Google Scholar] [CrossRef]
- Park, S.; Yun, C.B.; Inman, D.J. Structural health monitoring using electro-mechanical impedance sensors. Fatigue Fract. Eng. Mater. Struct. 2008, 31, 714–724. [Google Scholar] [CrossRef]
- Xu, Y.; Liu, G. A modified electro-mechanical impedance model of piezoelectric actuator-sensors for debonding detection of composite patches. J. Intell. Mater. Syst. Struct. 2002, 13, 389–396. [Google Scholar] [CrossRef]
- Ritdumrongkul, S.; Abe, M.; Fujino, Y.; Miyashita, T. Quantitative health monitoring of bolted joints using a piezoceramic actuator–sensor. Smart Mater. Struct. 2004, 13, 20. [Google Scholar] [CrossRef]
- Yan, W.; Chen, W.Q.; Cai, J.B.; Lim, C.W. Quantitative structural damage detection using high-frequency piezoelectric signaturesvia the reverberation matrix method. Int. J. Numer. Methods Eng. 2007, 71, 505–528. [Google Scholar] [CrossRef]
- Giurgiutiu, V.; Zagrai, A.; Bao, J.J. Piezoelectric wafer embedded active sensors for aging aircraft structural health monitoring. Struct. Health Monit. 2002, 1, 41–61. [Google Scholar] [CrossRef]
- Park, G.; Inman, D.J. Structural health monitoring using piezoelectric impedance measurements. Philos. Trans. A Math. Phys. Eng. Sci. 2007, 365, 373–392. [Google Scholar] [CrossRef] [PubMed]
- Wandowski, T.; Malinowski, P.; Radzienski, M.; Opoka, S.; Ostachowicz, W. Methods for Assessment of Composite Aerospace Structures. In Smart Structures and Materials: Selected Papers from the 7th ECCOMAS Thematic Conference on Smart Structures and Materials; Araujo, A.L., Mota Soares, C.A., Eds.; Springer International Publishing: Cham, Switzerland, 2017. [Google Scholar] [CrossRef]
- Baptista, F.G.; Budoya, D.E.; Almeida, V.A.D.d.; Ulson, J.A.C. An Experimental Study on the Effect of Temperature on Piezoelectric Sensors for Impedance-Based Structural Health Monitoring. Sensors 2014, 14, 1208–1227. [Google Scholar] [CrossRef] [PubMed]
- Uddin, M.N.; Islam, M.S.; Sampe, J.; Ali, S.H.M.; Bhuyan, M.S. Design and simulation of piezoelectric cantilever beam based on mechanical vibration for energy harvesting application. In Proceedings of the 2016 International Conference on Innovations in Science, Engineering and Technology (ICISET), Chittagong, Bangladesh, 28–29 October 2016; pp. 1–4. [Google Scholar] [CrossRef]
- Mansoor, M.B.; Köble, S.; Wong, T.W.; Woias, P.; Goldschmidtböing, F. Design, Characterization and Sensitivity Analysis of a Piezoelectric Ceramic/Metal Composite Transducer. Micromachines 2017, 8, 271. [Google Scholar] [CrossRef]
- Dang, N.-L.; Huynh, T.-C.; Kim, J.-T. Local strand-breakage detection in multi-strand anchorage system using an impedance-based stress monitoring method—Feasibility study. Sensors 2019, 19, 1054. [Google Scholar] [CrossRef] [PubMed] [Green Version]
- Huynh, T.-C.; Lee, S.-Y.; Dang, N.-L.; Kim, J.-T. Sensing region characteristics of smart piezoelectric interface for damage monitoring in plate-like structures. Sensors 2019, 19, 1377. [Google Scholar] [CrossRef] [Green Version]
- Huynh, T.-C.; Park, Y.-H.; Park, J.-H.; Kim, J.-T. Feasibility Verification of Mountable PZT-Interface for Impedance Monitoring in Tendon-Anchorage. Shock. Vib. 2015, 2015, 11. [Google Scholar] [CrossRef] [Green Version]
- Kim, J.-T.; Nguyen, K.-D.; Park, J.-H. Wireless impedance sensor node and interface washer for damage monitoring in structural connections. Adv. Struct. Eng. 2012, 15, 871–885. [Google Scholar] [CrossRef]
- Overly, T.G.S.; Park, G.; Farinholt, K.M.; Farrar, C.R. Development of an extremely compact impedance-based wireless sensing device. Smart Mater. Struct. 2008, 17, 065011. [Google Scholar] [CrossRef]
- Park, S.; Shin, H.-H.; Yun, C.-B. Wireless impedance sensor nodes for functions of structural damage identification and sensor self-diagnosis. Smart Mater. Struct. 2009, 18, 055001. [Google Scholar] [CrossRef]
- Park, J.-H.; Kim, J.-T.; Hong, D.-S.; Mascarenas, D.; Lynch, J.P. Autonomous smart sensor nodes for global and local damage detection of prestressed concrete bridges based on accelerations and impedance measurements. Smart Struct. Syst. 2010, 6, 711–730. [Google Scholar] [CrossRef]


| Parameters | Symbols | Steel Anchor Head and Steel Bearing Plate | RC Beam | Unit |
|---|---|---|---|---|
| Modulus | E | 200 | 24.55 | GPa |
| Poisson’s ratio | ν | 0.3 | 0.38 | |
| Mass density | ρ | 7850 | 2400 | kg/m3 |
| Damping ratio | ξ | 0.01 | 0.04 |
| Properties | Symbols | Value | Unit |
|---|---|---|---|
| Compliance matrix | 16.4 18.8 47.5 44.3 −5.74 −7.22 −7.22 | ×10−12 (m2/N) | |
| Coupling matrix | −171 −171 374 584 584 | ×10−12 (C/N) | |
| Relative permittivity | 1730 1730 1730 | ||
| Mass density | ρ | 7750 | (kg/m3) |
| Dielectric loss factor | δ | 0.02 | |
| Damping loss factor | η | 0.02 |
Disclaimer/Publisher’s Note: The statements, opinions and data contained in all publications are solely those of the individual author(s) and contributor(s) and not of MDPI and/or the editor(s). MDPI and/or the editor(s) disclaim responsibility for any injury to people or property resulting from any ideas, methods, instructions or products referred to in the content. |
© 2023 by the authors. Licensee MDPI, Basel, Switzerland. This article is an open access article distributed under the terms and conditions of the Creative Commons Attribution (CC BY) license (https://creativecommons.org/licenses/by/4.0/).
Share and Cite
Le, B.-T.; Nguyen, T.-T.; Truong, T.-D.-N.; Nguyen, C.-T.; Phan, T.T.V.; Ho, D.-D.; Huynh, T.-C. Crack Detection in Bearing Plate of Prestressed Anchorage Using Electromechanical Impedance Technique: A Numerical Investigation. Buildings 2023, 13, 1008. https://doi.org/10.3390/buildings13041008
Le B-T, Nguyen T-T, Truong T-D-N, Nguyen C-T, Phan TTV, Ho D-D, Huynh T-C. Crack Detection in Bearing Plate of Prestressed Anchorage Using Electromechanical Impedance Technique: A Numerical Investigation. Buildings. 2023; 13(4):1008. https://doi.org/10.3390/buildings13041008
Chicago/Turabian StyleLe, Ba-Tung, Thanh-Truong Nguyen, Tran-De-Nhat Truong, Chi-Thien Nguyen, Thi Tuong Vy Phan, Duc-Duy Ho, and Thanh-Canh Huynh. 2023. "Crack Detection in Bearing Plate of Prestressed Anchorage Using Electromechanical Impedance Technique: A Numerical Investigation" Buildings 13, no. 4: 1008. https://doi.org/10.3390/buildings13041008