


Experimental Study on Long-Term Performance of Concrete T-Beam
Research Institute of Highway, Ministry of Transport, Beijing 100088, China
*
Author to whom correspondence should be addressed.
Buildings 2023, 13(4), 1005; https://doi.org/10.3390/buildings13041005
Submission received: 2 March 2023
/
Revised: 6 April 2023
/
Accepted: 9 April 2023
/
Published: 11 April 2023
(This article belongs to the Special Issue Intelligent Multi-Criteria Decision-Making Methodologies in Building and Construction Management)
Abstract
:In recent years, long-span concrete bridges that have been built frequently expose the problems of excessive deflection and concrete cracking, which even lead to bridge collapse in serious cases. The reason is that, in addition to the insufficient estimation of creep and long-term deflection in current regulations, the rapid growth of traffic volume and the tight use of early-age concrete in construction schedules also have a great impact on long-term deflection. However, at present, the calculation methods of long-term performance are mostly based on the results of material performance tests. However, there are relatively few studies that take bridge components as research objects and consider the influence of load and age factors. The long-term performance of concrete beams is examined and the calculation methods of long-term performance are given by considering various loading levels and ages. Specimens are fabricated using a 1:4 scale model of a standard T-beam with a length of 20 m to conduct the experiment. Based on the long-term observation of the test beam, the variation laws of the mid-span deflection of the concrete T-beam and the concrete strain in the compression zone with time are obtained under the aforementioned conditions. Following a comparative analysis of experimental results with computational results based on existing studies and relevant national and international codes, this study proposes and discusses a set of formulas for the assessment of shrinkage and creep. The obtained creep coefficient test results fall between the values of the Chinese specification and those of AASHTO, where ASSTO is the lower limit and the Chinese specification is the upper limit. The long-term deflection is as follows: 40% of the one-year value at one month, 66% of the one-year value at three months, and 80% of the one-year value at six months. However, the long-term deflection coefficient of beams with an early loading age is larger than the current standard, and the deflection coefficient of T-beams with three-day loading age reaches 6.0. We compare and discuss the test results with the calculation results and related codes obtained in different studies conducted at home and abroad. Based on our present findings, we propose formulas for shrinkage and creep evaluations.
1. Introduction
Shrinkage and creep are crucial properties of structural concrete elements which result in internal force redistribution, prestressing relaxation, and additional deflection of concrete structures when subjected to sustained loads over time. The aforementioned factors have the potential to impact structural serviceability and, in some cases, jeopardize structural safety [1,2,3]. A typical example of structural failure due to these factors is the Koror Babeldaob Bridge, built in 1977 in the Republic of Palau. As the longest prestressed concrete box girder bridge in the world at that time, it has a 241 m long main span of a continuous rigid frame. After construction, the deflection at the mid-span point kept increasing and reached 1.61 m in 18 years. Three months after being strengthened, the bridge collapsed in 1996 [4]. Meanwhile, in the United States, a 195 m continuous rigid frame completed in 1978 had a cumulative mid-span deflection of 635 mm in twelve years. Similarly, many concrete bridges with long spans, such as the Shibanpo Changjiang River Bridge in China, also suffered excessive long-term deflections [5]. The long-term deformation and deflection of reinforced concrete and prestressed concrete bridges are affected by a range of complex factors. However, among these factors, shrinkage and creep of concrete materials are regarded as primary causative agents.
Extensive research efforts have been devoted to investigating the phenomena of shrinkage and creep, yielding substantial progress in this field over time. In this regard, the shrinkage and creep model has been established based on extensive test results [6,7,8]. In 1970, the European Concrete Commission and the International Association for Prestressing (CEB-FIP) proposed an empirical formula for estimating creep which takes into account the correction factors based on concrete mix ratio, ambient humidity, loading age, component size, and load holding time [9]. This empirical formula was then implemented in China’s design code of highway prestressed concrete bridges [10]. Meanwhile, research suggests that the GL2000 model proposed by Gardner of ACI and the BP series model proposed by Bazant can describe the law of shrinkage and creep more accurately [11,12].
A series of models have also been proposed by some other researchers [13,14,15,16]. However, the accuracy of the prediction of these models is questionable. In some cases, a considerable disparity between observed deformation and theoretical calculations in a structural analysis has been noted. Consequently, there exists a degree of uncertainty regarding the safety of such structures [17].
Due to the tight construction periods or the influence of climatic conditions on construction, early-strength concrete has been increasingly used. However, a lower loading age is associated with a larger deformation caused by the creep of concrete structures. Insufficient research has been conducted on the creep of early-age concrete based on tests of concrete components [18].
As mentioned above, at present many bridges appear to have too large deflection, and after the application of external prestressing and other reinforcement, the deflection is still not effectively prevented. At present, some researchers have proposed that excessive live-load traffic volume may lead to an increase in long-term deformation, but there are few experimental studies on this aspect. Furthermore, according to China’s norms, the long-term load combination considers 40% of the vehicle load [19]. Although no overload currently exists due to the distribution of the large traffic flow over a number of highways, these short-term loads exert long-term action on bridges.
On the other hand, the investigation of shrinkage and creep behavior in bridge structures has received relatively limited attention in previous research, with a particular paucity of relevant experimental studies even though concrete bridges constitute a significant proportion of infrastructure in many countries, including China. Therefore, a comprehensive understanding of their long-term load-bearing behavior is crucial for ensuring their continued safety during their service life. The current study involves long-term performance testing of reinforced concrete T-beams. The impacts of concrete shrinkage and creep on the long-term load-bearing behavior of bridges are systematically evaluated and addressed in these tests, with relevant measures and countermeasures recommended. Therefore, in this study, the actual reinforced concrete T-beam is used as the prototype, and the laboratory test is designed to study the long-term deformation and deflection of concrete. The effects of different load levels and loading ages are considered in the experiment. Seven T-beams were made in this experiment, and were observed under continuous load for nearly 400 days. The strain, deflection, and shrinkage of reinforced concrete beams were recorded, the characteristics of long-term deformation and strain were studied, and the shrinkage and creep models and experimental results were compared with those provided by the current Chinese code and AASHTO code. Based on the experimental results, the calculation method for shrinkage and creep, and long-term deflection coefficients of reinforced concrete beams were given, this study not only considers the influence of early-age concrete, but also considers the current situation of large traffic volume, which can provide a basis for evaluating and explaining the excessive long-term deflection of current long-span bridges.
2. Experimental Program
2.1. Specimen Design
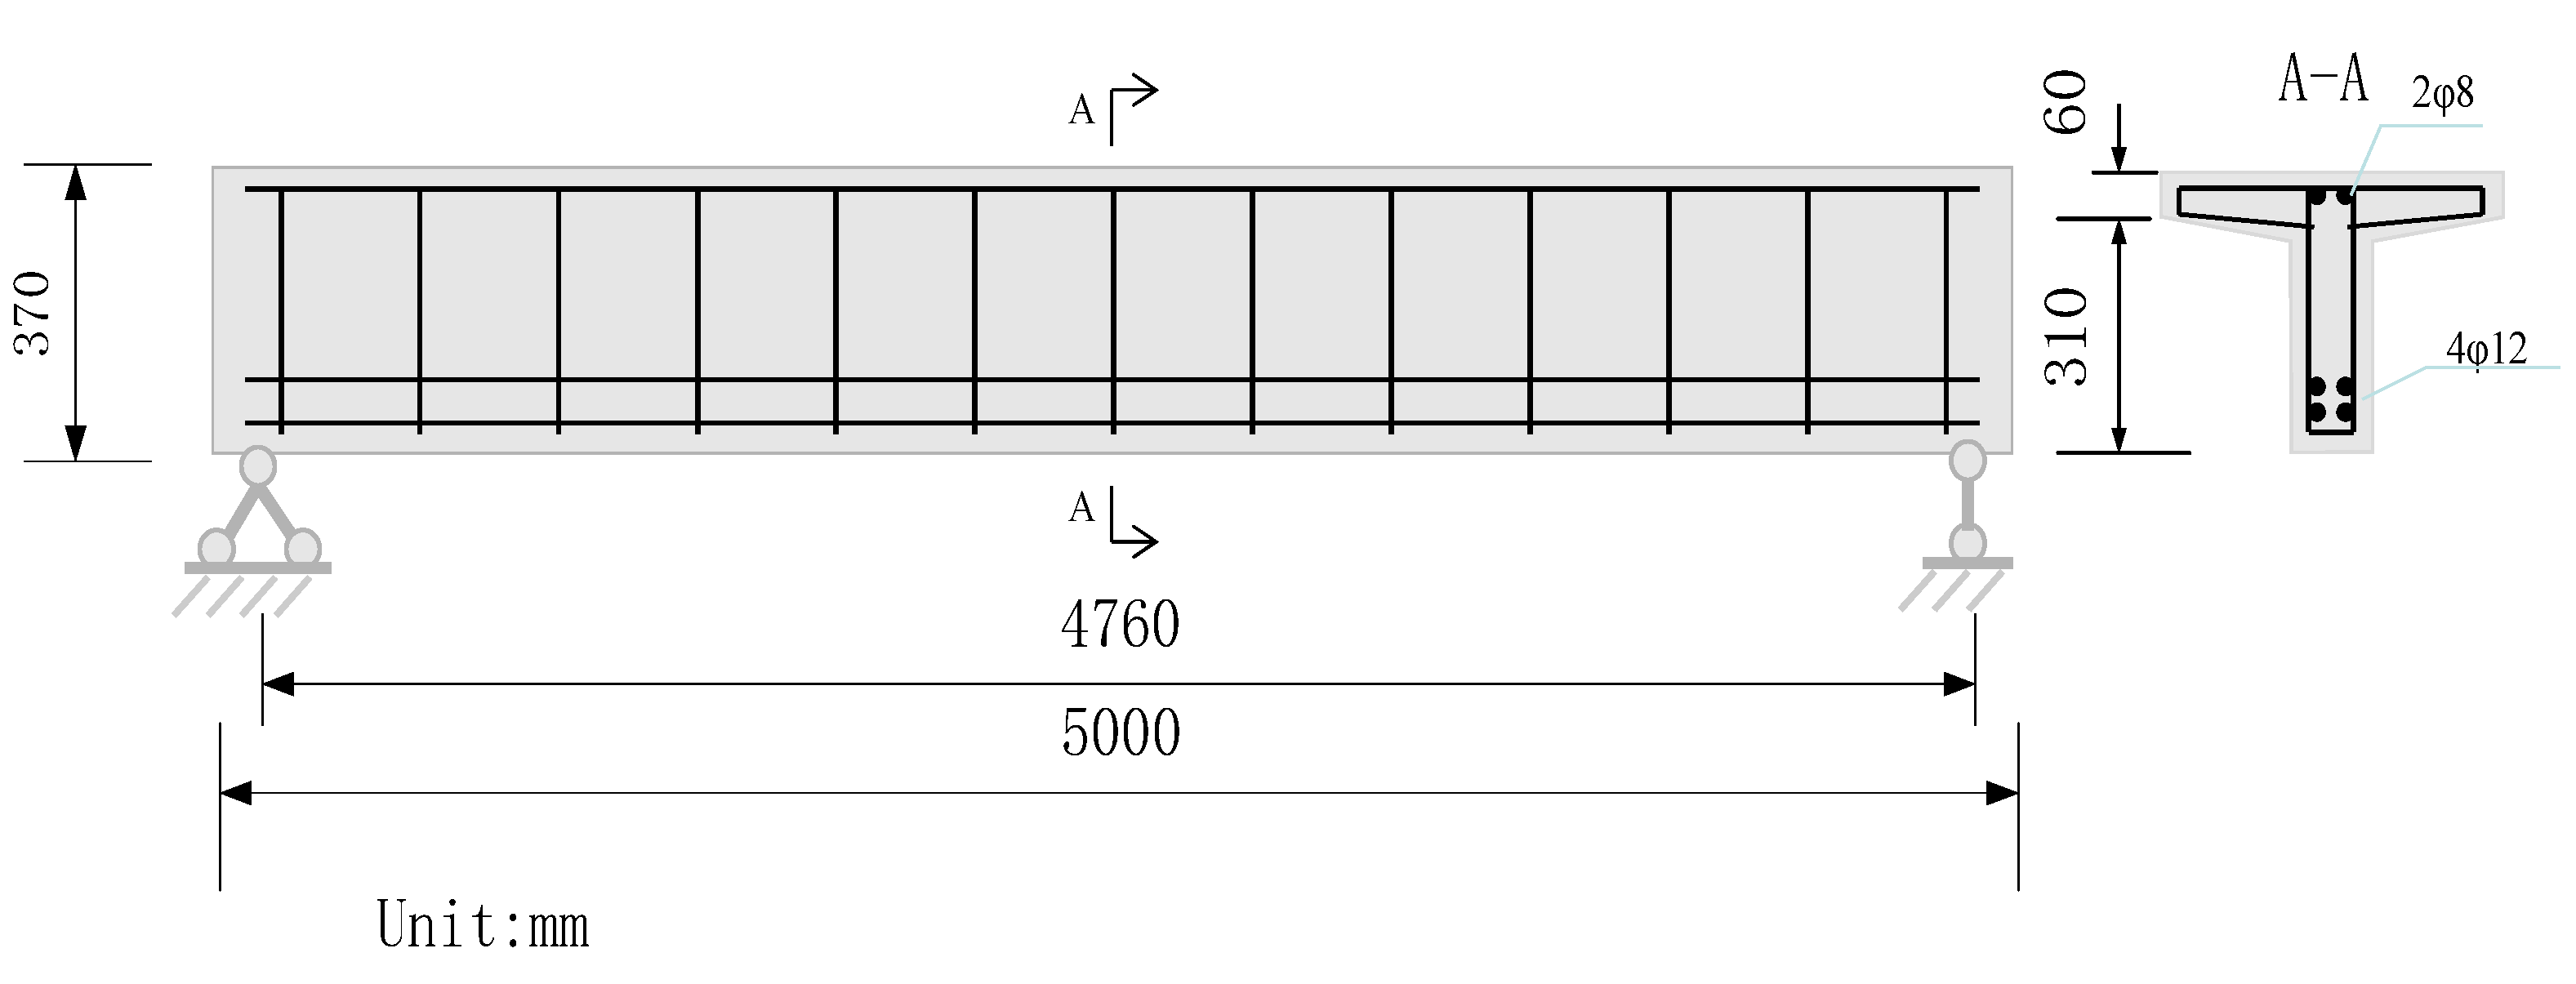
The model specimens are designed on a 1:4 scale, with a typical T-beam 20 m long as the prototype. The beam-like model spans 5 m, and the beam height, web thickness, and flange plate width are 0.37 m, 0.12 m, and 0.25 m, respectively. The tension and compression zones of the concrete T-beam specimens are reinforced with four φ12 and two φ8 reinforcing bars, respectively. Further information on the beam model, such as its size and reinforcement arrangement, is illustrated in Figure 1.
2.2. Materials
The T-beam specimens are constructed using C30 concrete and are reinforced with 8 mm-diameter R235 steel bar stirrups and 12 mm-diameter HRB335 steel bar longitudinal reinforcements. The concrete mix includes Portland cement (42.5), mid-coarse sand, 5–25 mm gravel of good gradation, and a high-range water-reducing admixture. The concrete mixing ratio of cement:water:sand:gravel:fly ash is 1:0.52:2.56:3.53:0.18. The mechanical properties of these steel bars are presented in Table 1.
2.3. Main Parameters of Specimens
The specimens are divided into three groups, with seven beams in total. To account for the impacts of loading age and stress level, the first and second experimental groups consist of three T-beam specimens, while the third group comprises a single beam specimen for shrinkage testing. The loading age is varied across three levels, specifically 3, 7, and 14 days. Further, three standard specimens of size 150 mm × 150 mm × 3000 mm are prepared to compare with the SHC3 specimen. In addition to the dead load (i.e., weight), the live load of the bridge for loading is taken into account as per the Chinese bridge design code [19]. Two levels of loading, i.e., 40% and 70% of the design live load, are considered for loading the first and second groups of specimens. The main loading factors of the specimens are presented in Table 2.
2.4. Test Procedure
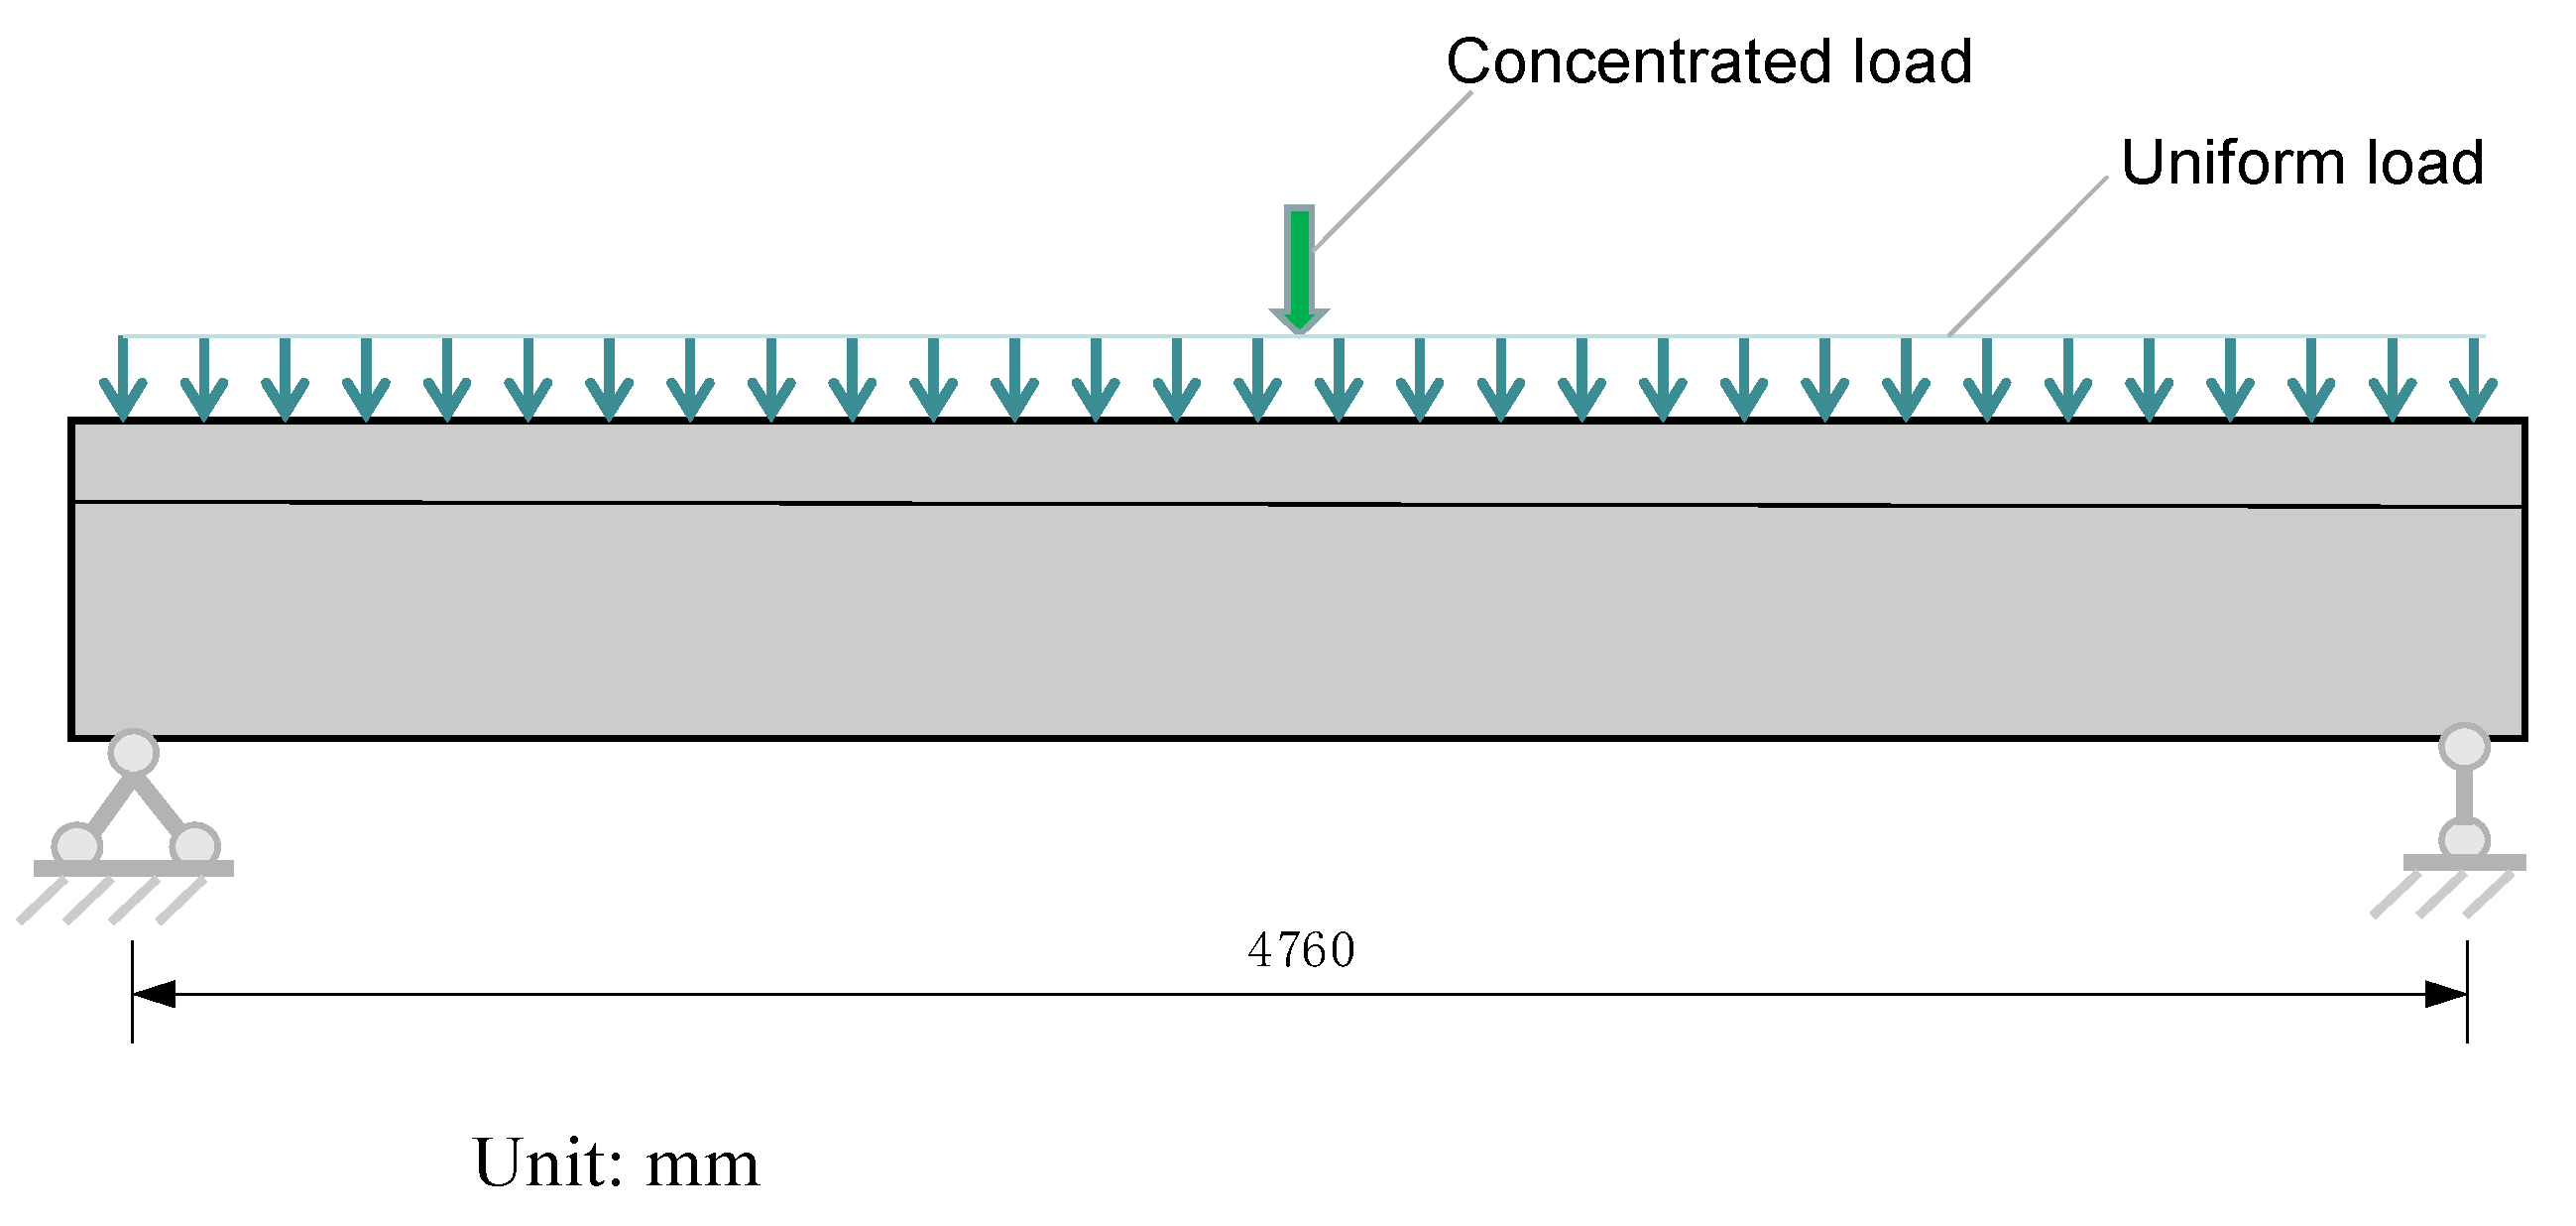
The load is converted as per the highway level in the Chinese bridge design code. The exerted load is composed of a uniform load and a concentrated load, where the uniform load after scaling is obtained as 2.625 kN/m, and the concentrated load is evaluated as 7.7 (4.4) kN for the load level of 40% (70%). Iron blocks are utilized in the test loading, and the concentrated load is composed of iron blocks piled up, and the loads are evenly distributed along the T-beam. Meanwhile, the boundary conditions of the understudied beams are simply supported. The schematic representation of the uniform and concentrated load applied on the reinforced concrete T-beam is illustrated in Figure 2.
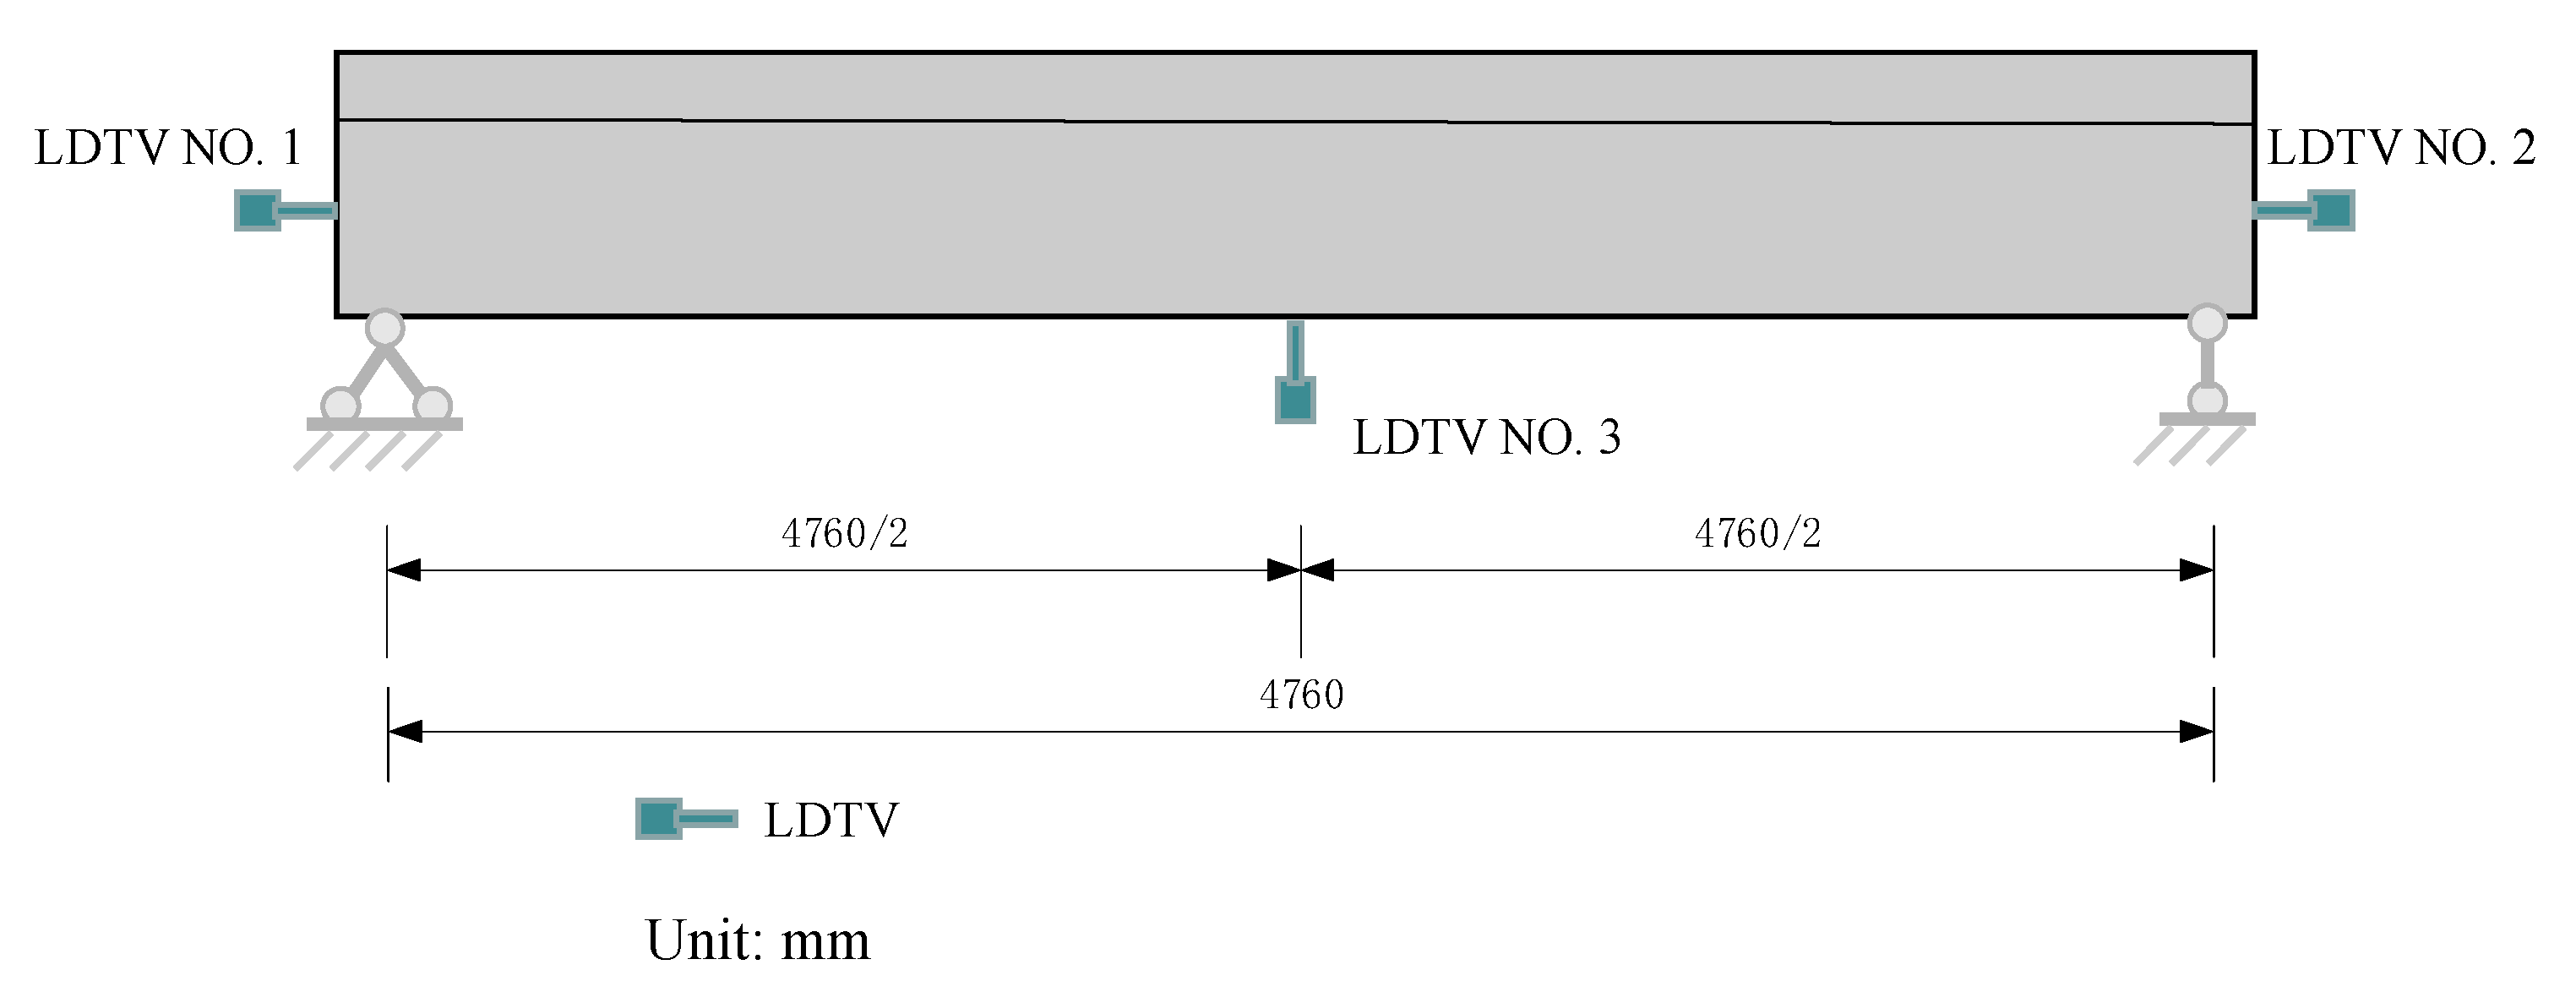
Different parameters are measured and recorded throughout the testing process, including the deflection of the reinforced concrete T-beam, steel bar strain, and temperature and humidity levels both in the laboratory environment and within the specimens. Displacement measurements are taken at the middle of the span for vertical displacement and at both ends for longitudinal displacement. The strain measurement points are arranged on the steel bars in the middle span of the T-beam. The arrangement of the displacement and strain measuring points is presented in Figure 3. The data acquisition instrument is used to collect the measured displacements and strains.
After installing the T-beam and sensors, initial data are recorded before commencing the long-term observation testing phase. Data collection is performed at an increment of 1 h every day. The duration of testing is about 400 days.
3. Results
3.1. Temperature and Humidity Observation Results
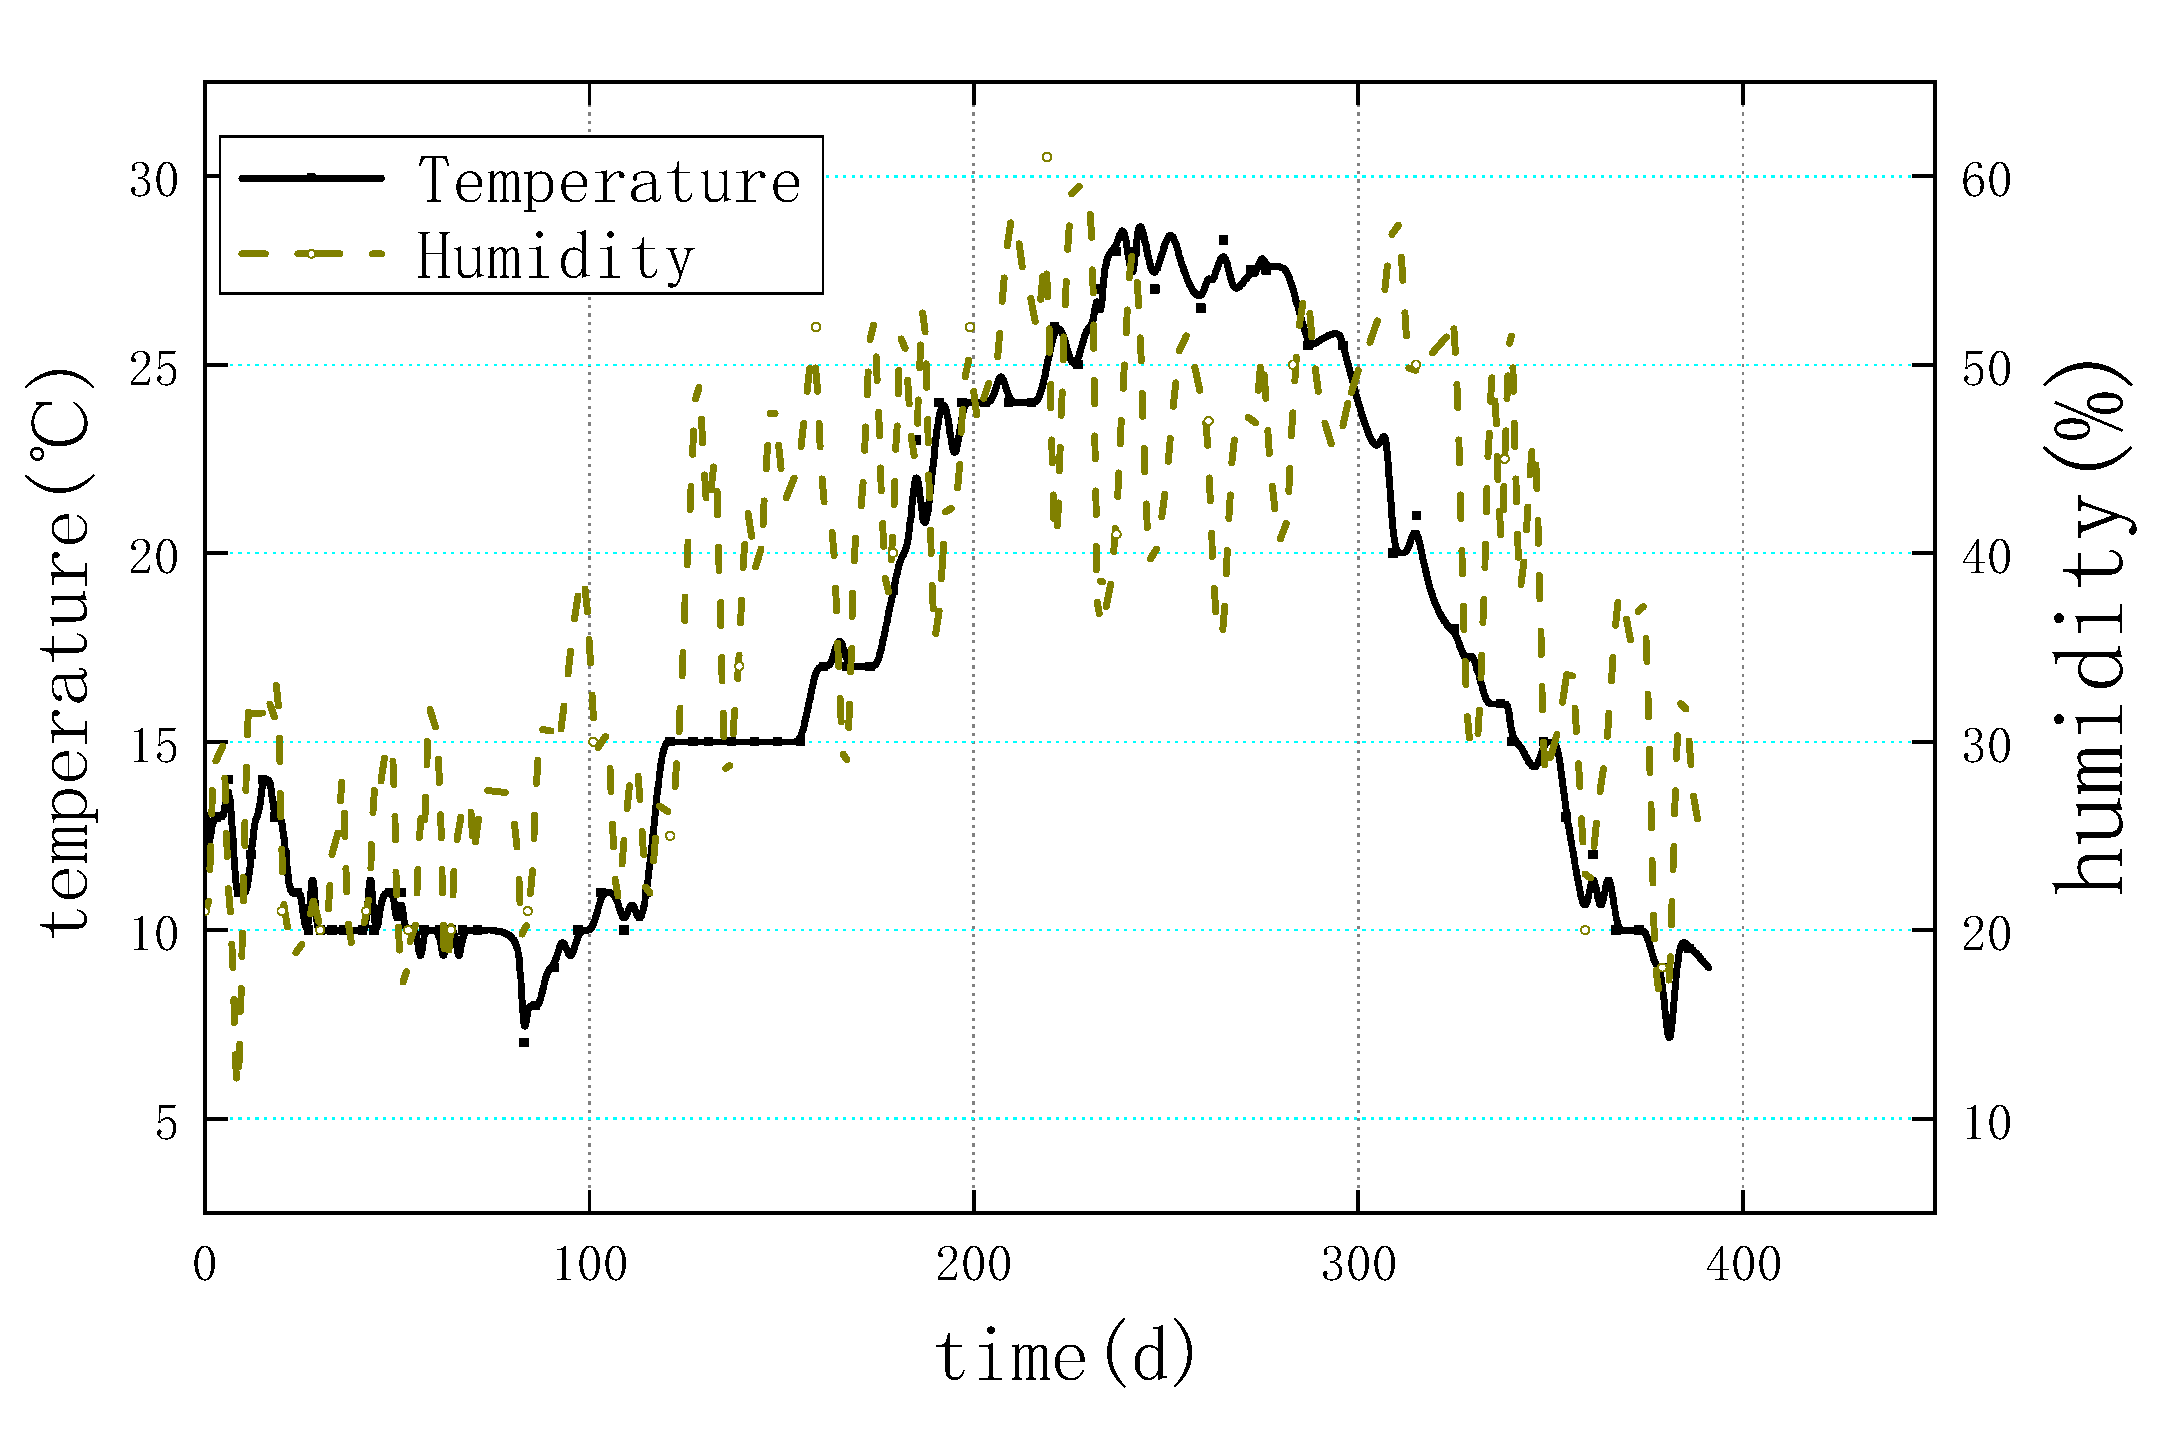
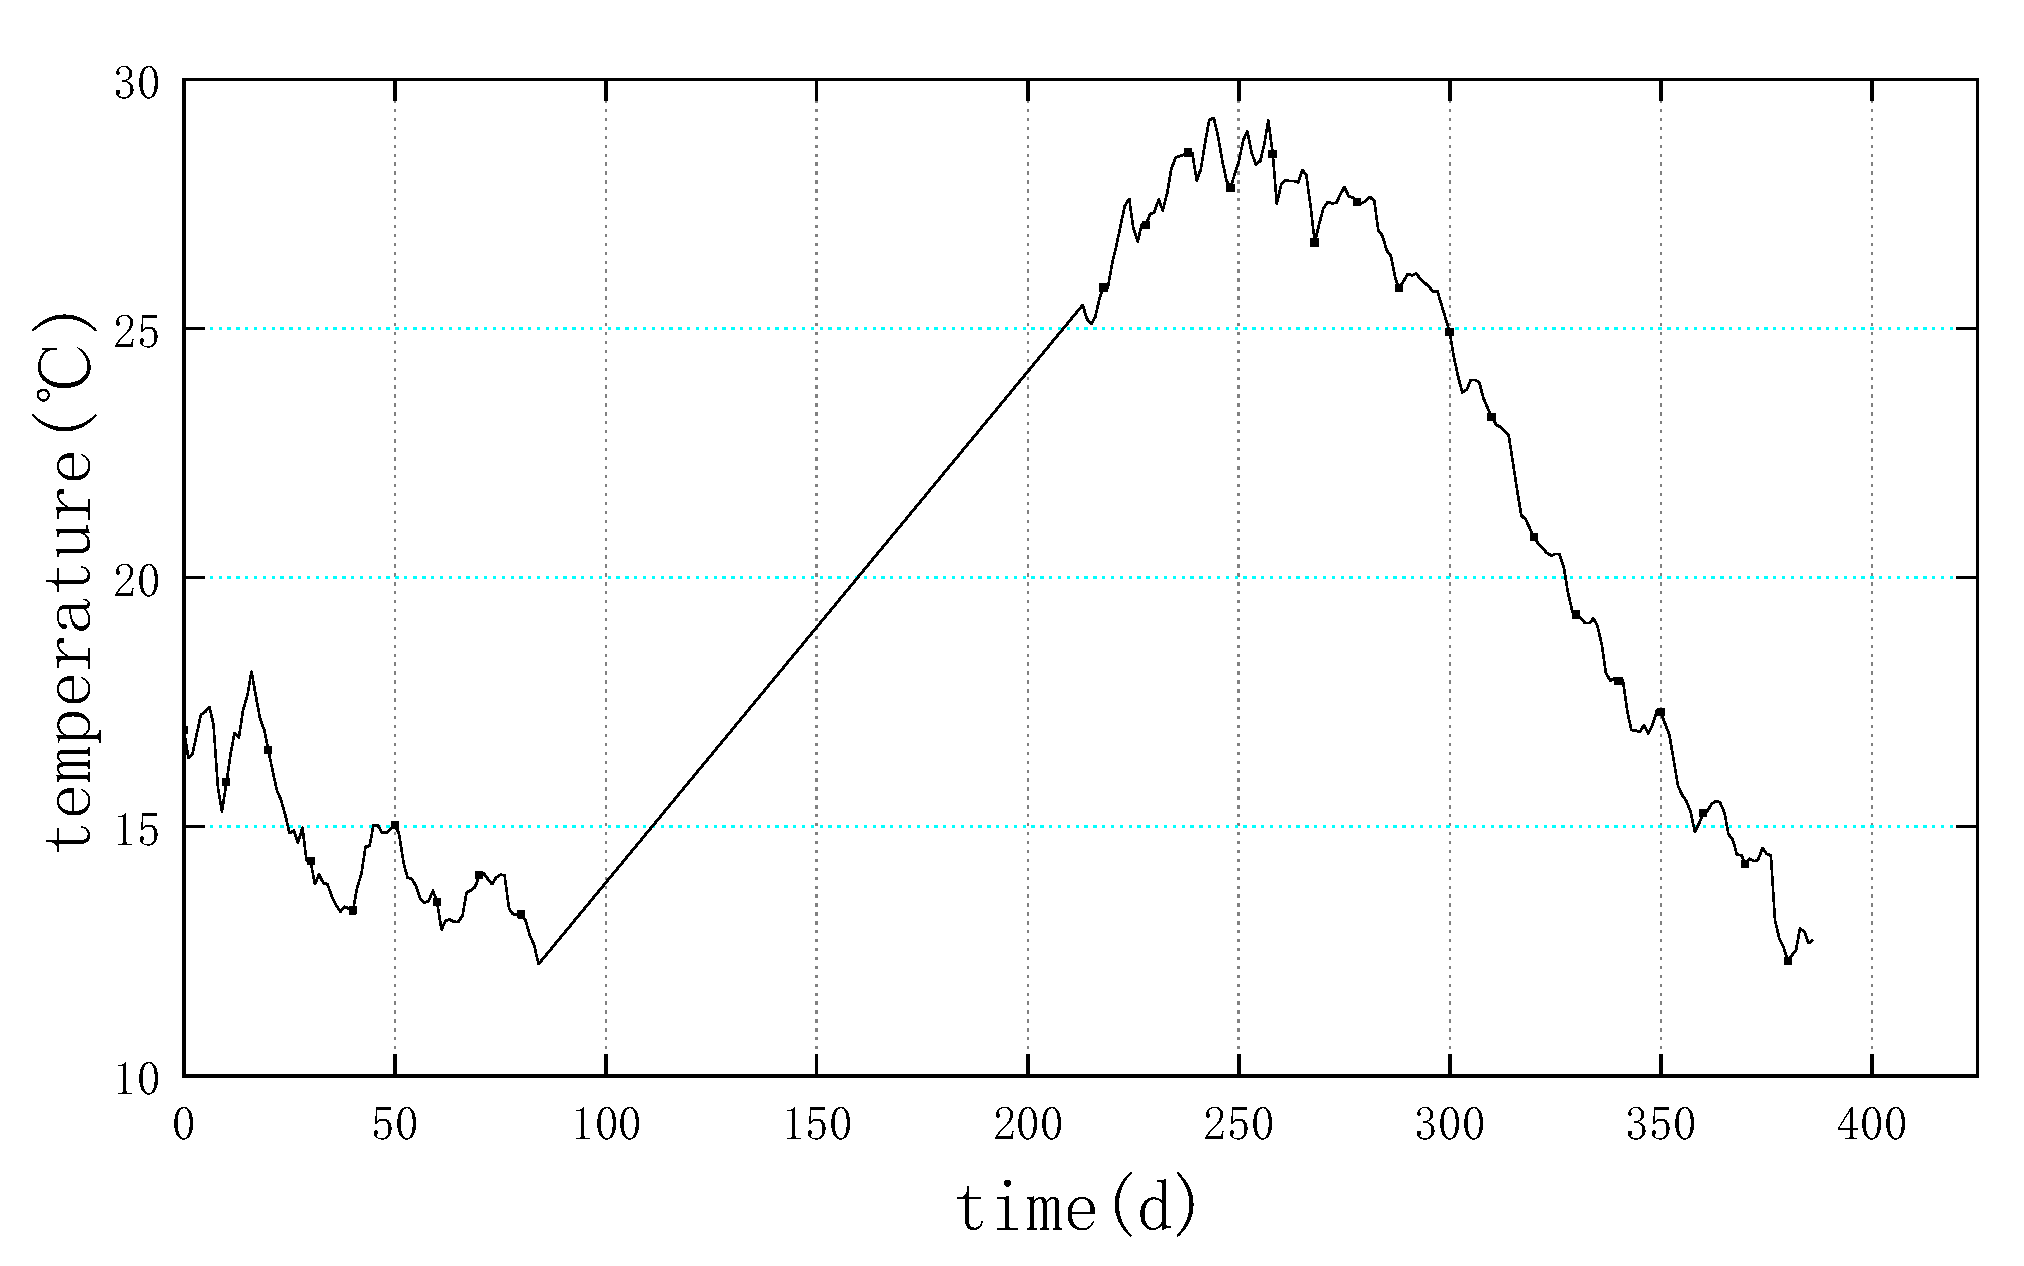
Humidity and temperature are the crucial environmental factors affecting the creep of concrete. Figure 4 demonstrates the temperature and humidity of the atmosphere in the laboratory room, and Figure 5 displays the temperature inside the specimen during the experiment. The obtained results show that the overall trends of temperature and humidity changes are similar to their seasonal variations; however, the plotted results are remarkably affected by the local environment. During the experiment, the average room temperature and humidity are 16 °C and 36%, respectively. The interior temperature of the T-beam follows a similar trend to that of the room temperature. The highest internal temperature of the RC T-beam specimen is around 18 °C, which is approximately 2 °C higher than the usual ambient temperature.
3.2. Shrinkage Test Results
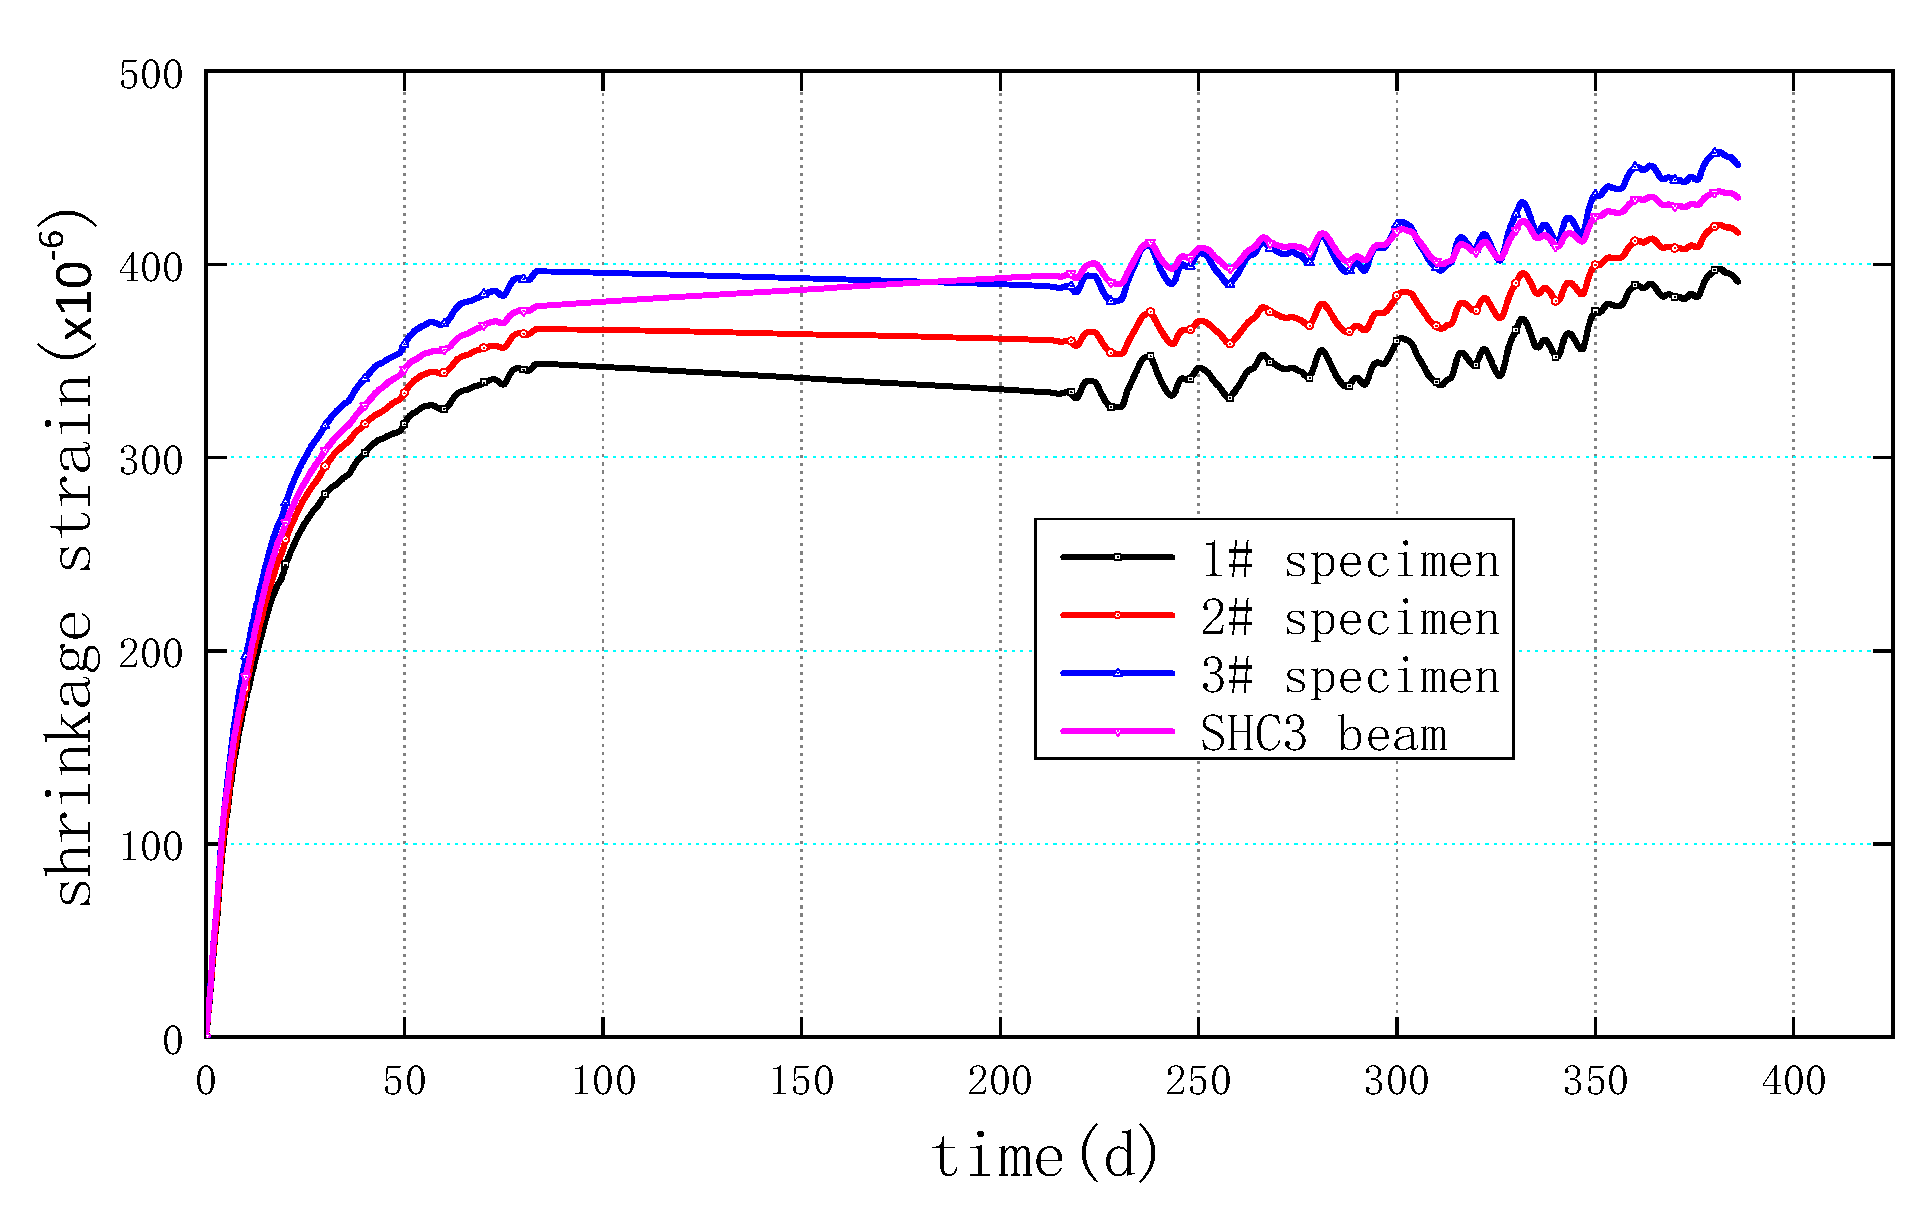
Figure 6 illustrates the shrinkage strain diagram of the T-beam (SHC3 specimen) and the standard specimens. The results obtained from the study demonstrate a sharp increase in shrinkage strain in all tested specimens during the initial 30 days, followed by a gradual variation after 80–100 days. The development of shrinkage strain can thus be divided into three distinct stages: the first stage, which endures for about 30 days, is characterized by rapid strain development. The second stage, spanning from 30 to 100 days, shows a transition phase of shrinkage strain change. The third stage, lasting over 100 days, presents a slower rate of strain development compared to the second stage.
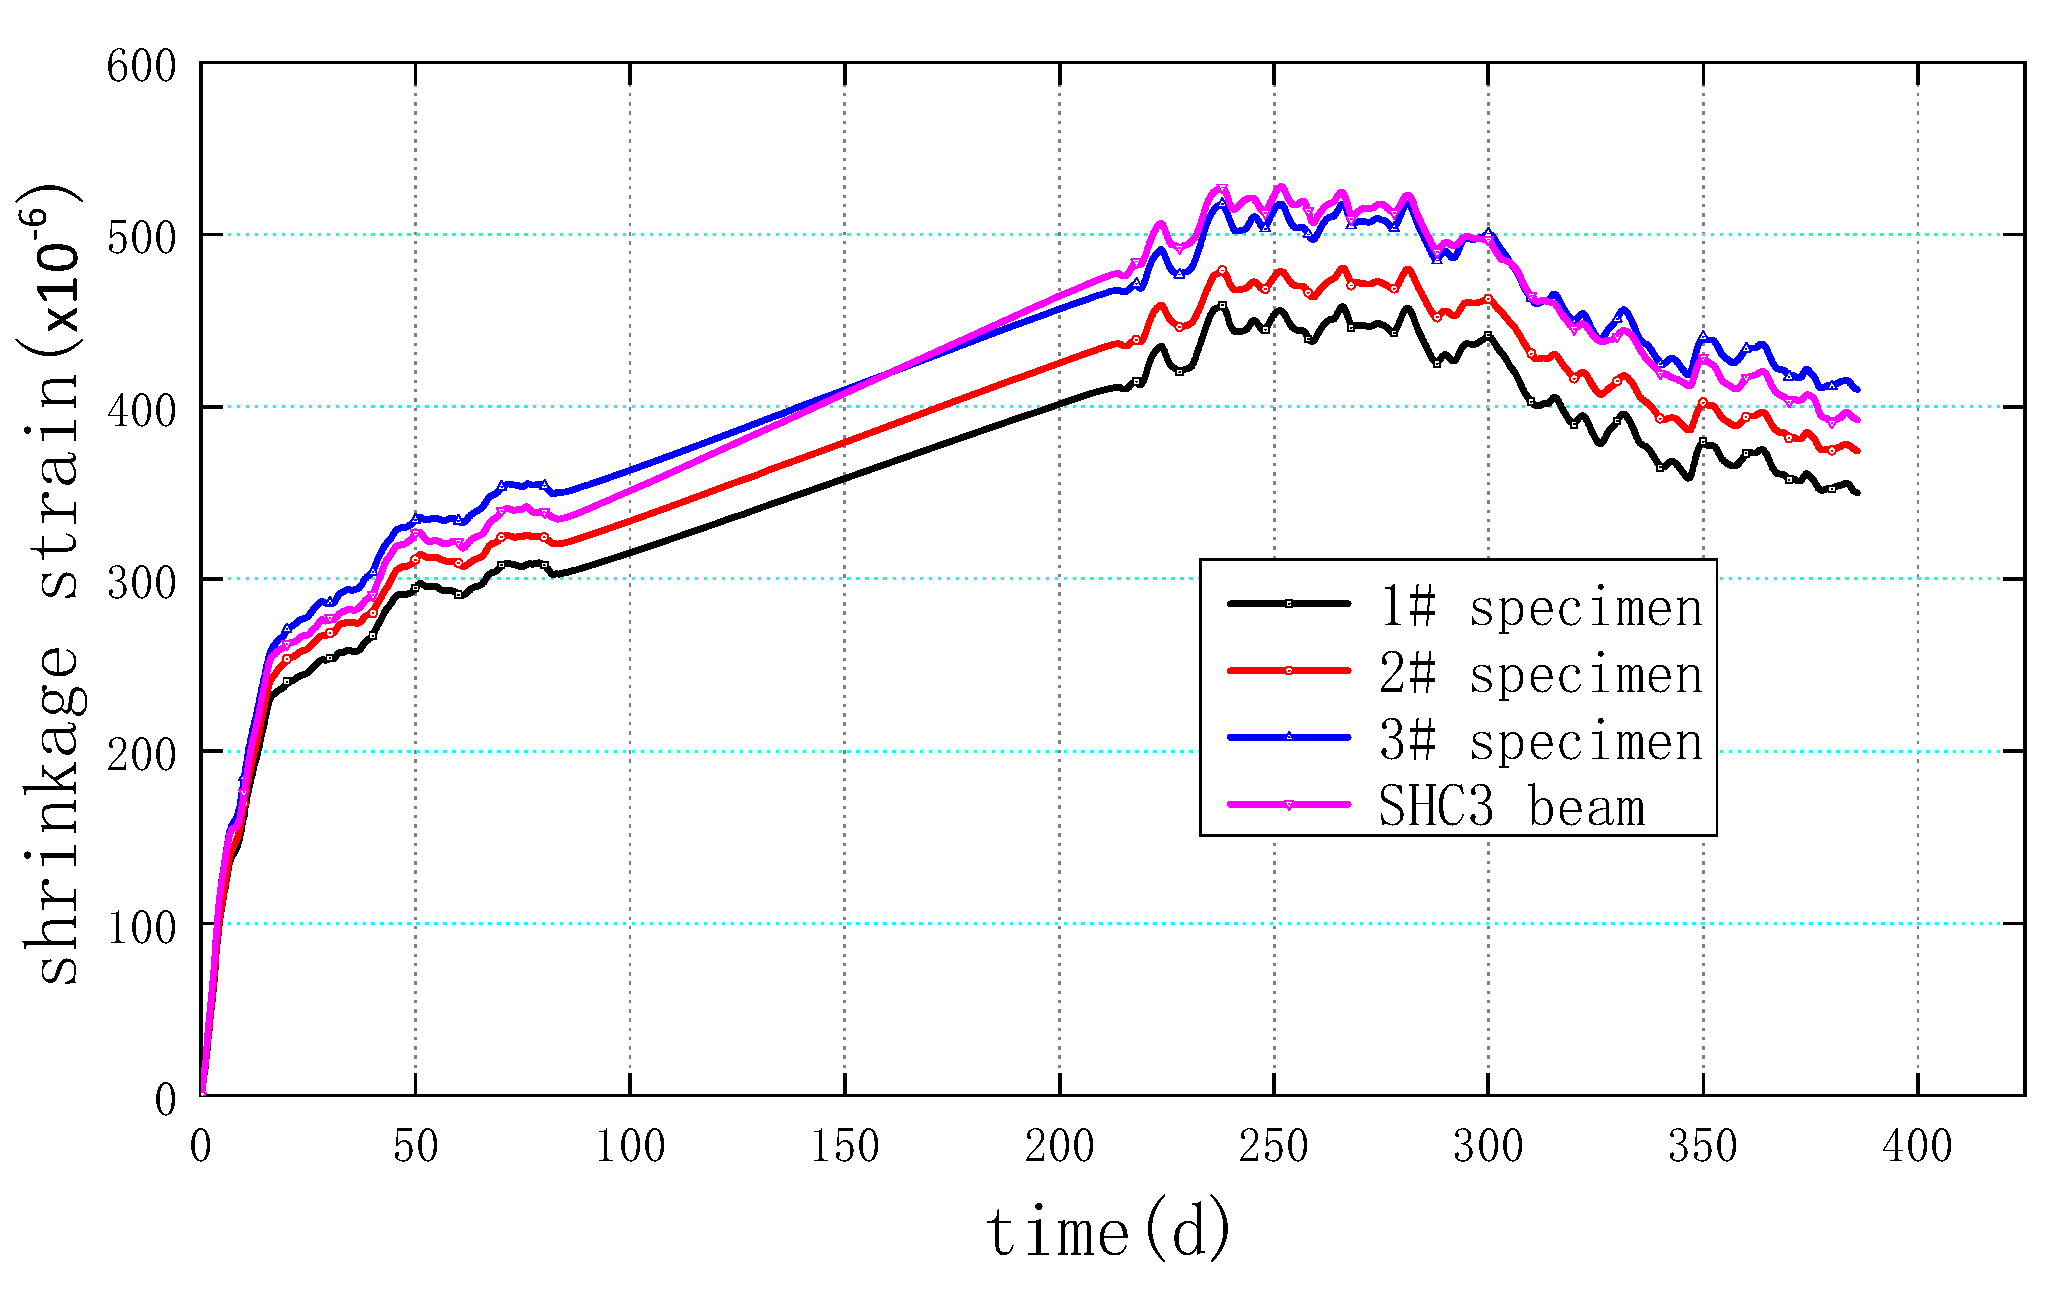
In addition, Figure 7 shows the shrinkage strain diagram after removing the influence of temperature. The demonstrated results reveal that the shrinkage strains of the subjected specimens sharply vary from the beginning to 30 days, and then there exists a slow variation till 250 days. It should be noted that the curve in Figure 7 illustrates a downward trend after 250 days, which is inconsistent with the actual situation. The main reason is that the strain change is very small at this phase, but the recorded temperature error is large. Therefore, the shrinkage after deducting the temperature causes a calculation error. The shrinkage strains of the standard and T-beam specimens in 30 days, 60 days, and the maximum values are presented in Table 3. The plotted results indicate that the predicted shrinkage strains are similar for the standard specimens and T-beam (SHC3). Meanwhile, the maximum value of the average shrinkage strain of standard specimens and T-beam is observed to be 498 × . The obtained value closely approximates that predicted by the Chinese code (JTG D62-2004) for humidity levels between 40% and 70%, but the Chinese code considers the shrinkage value of the 1000-day load time; that is, the test value is extrapolated beyond the specification value.
3.3. Creep Strain
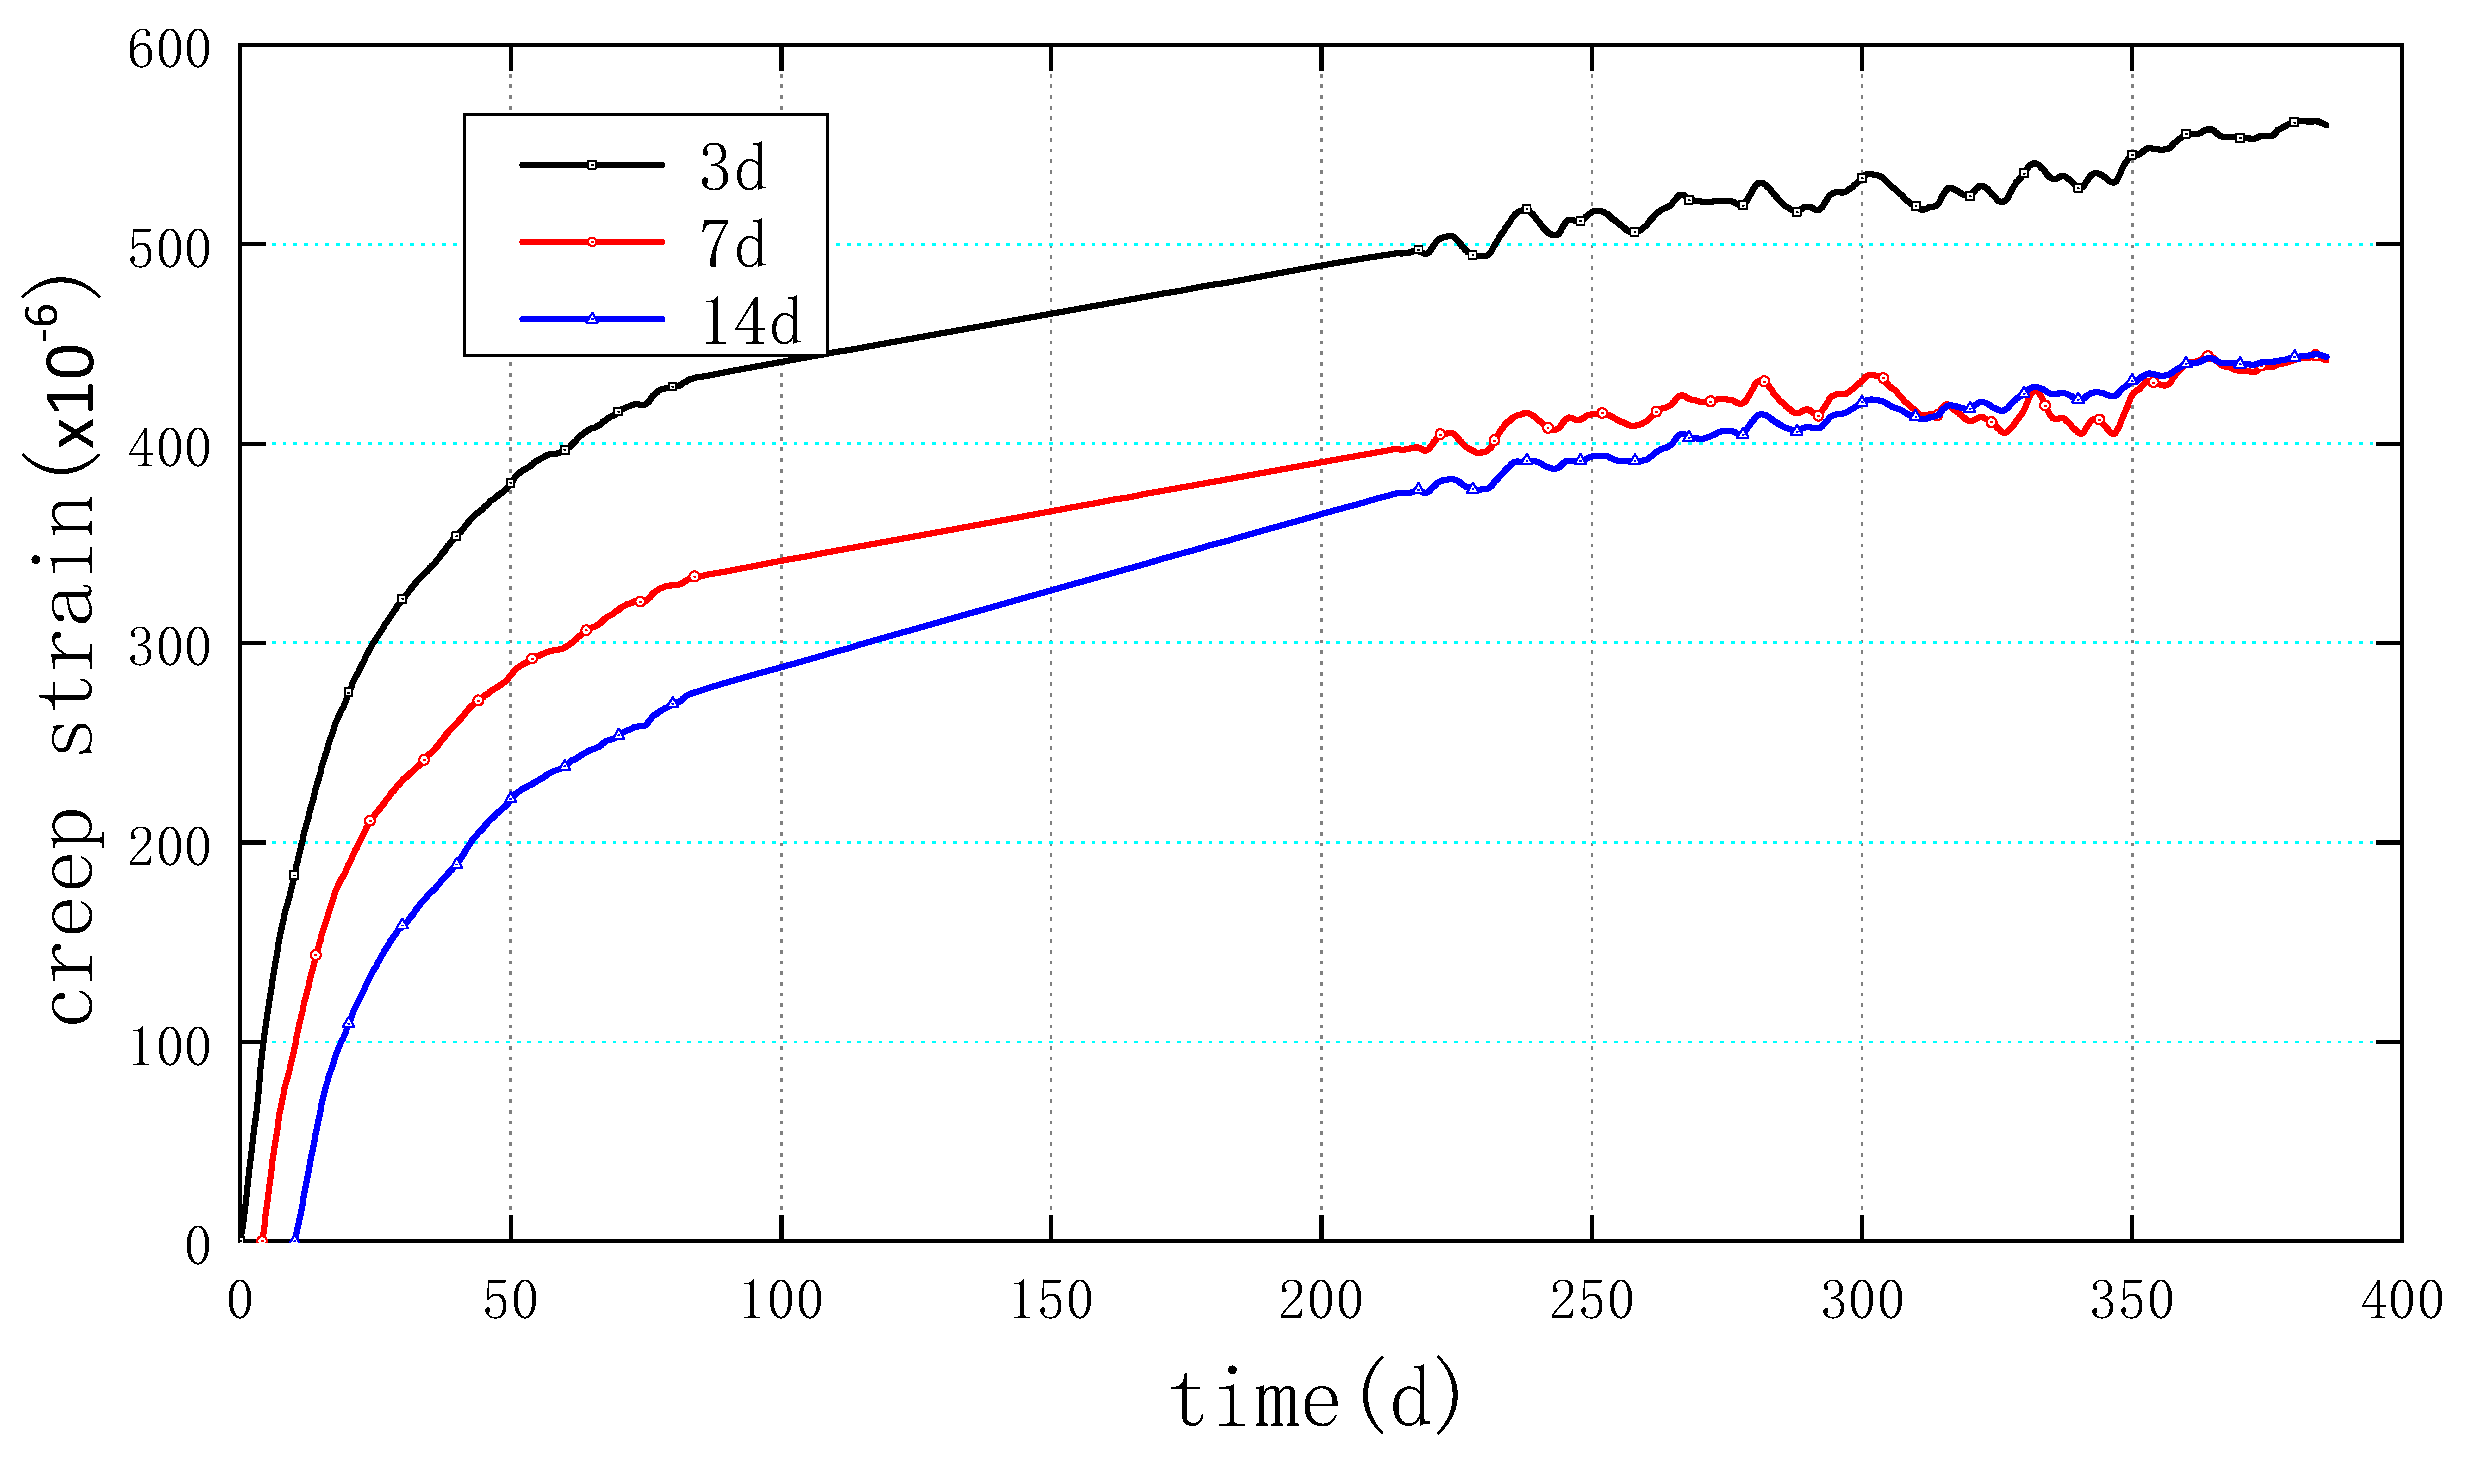
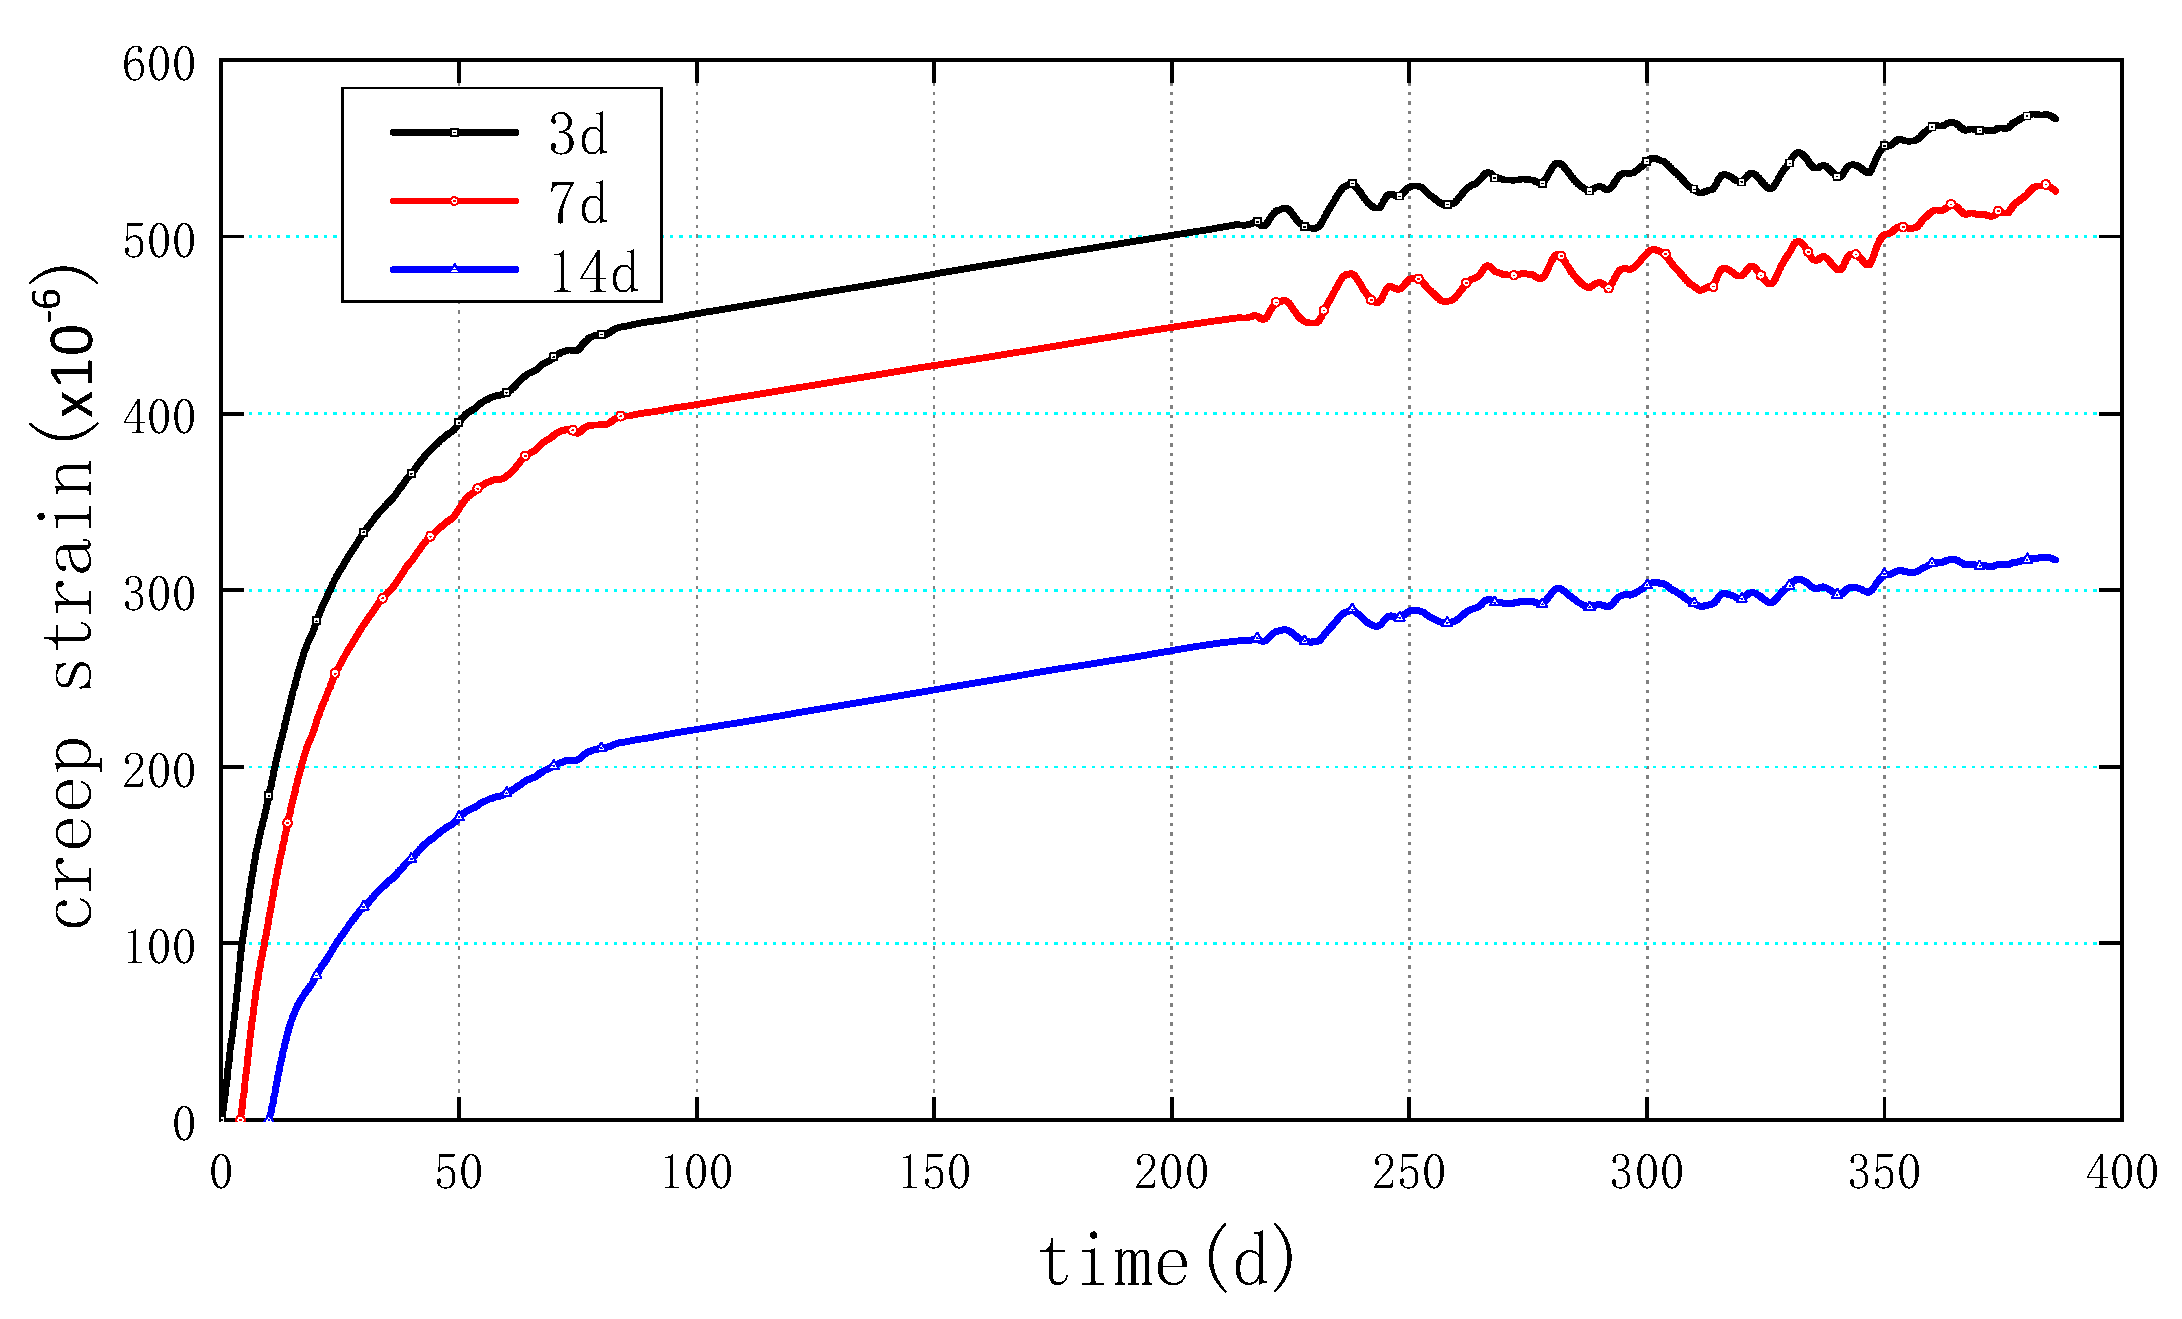
Figure 8 and Figure 9 present the Time−history plots of the creep strain. The curves from top to bottom represent the plots associated with specimens of loading ages 3 days, 7 days, and 14 days, respectively. The demonstrated results show that the creep curves exhibit a rapid increase in the initial 30 days of loading and gradually become stable after 100 days. Additionally, the results show that creep strain is greater at a loading age of 3 days than at 7 days, and greater at 7 days than at 14 days. This indicates that creep strain diminishes with the increasing loading age of the specimens.
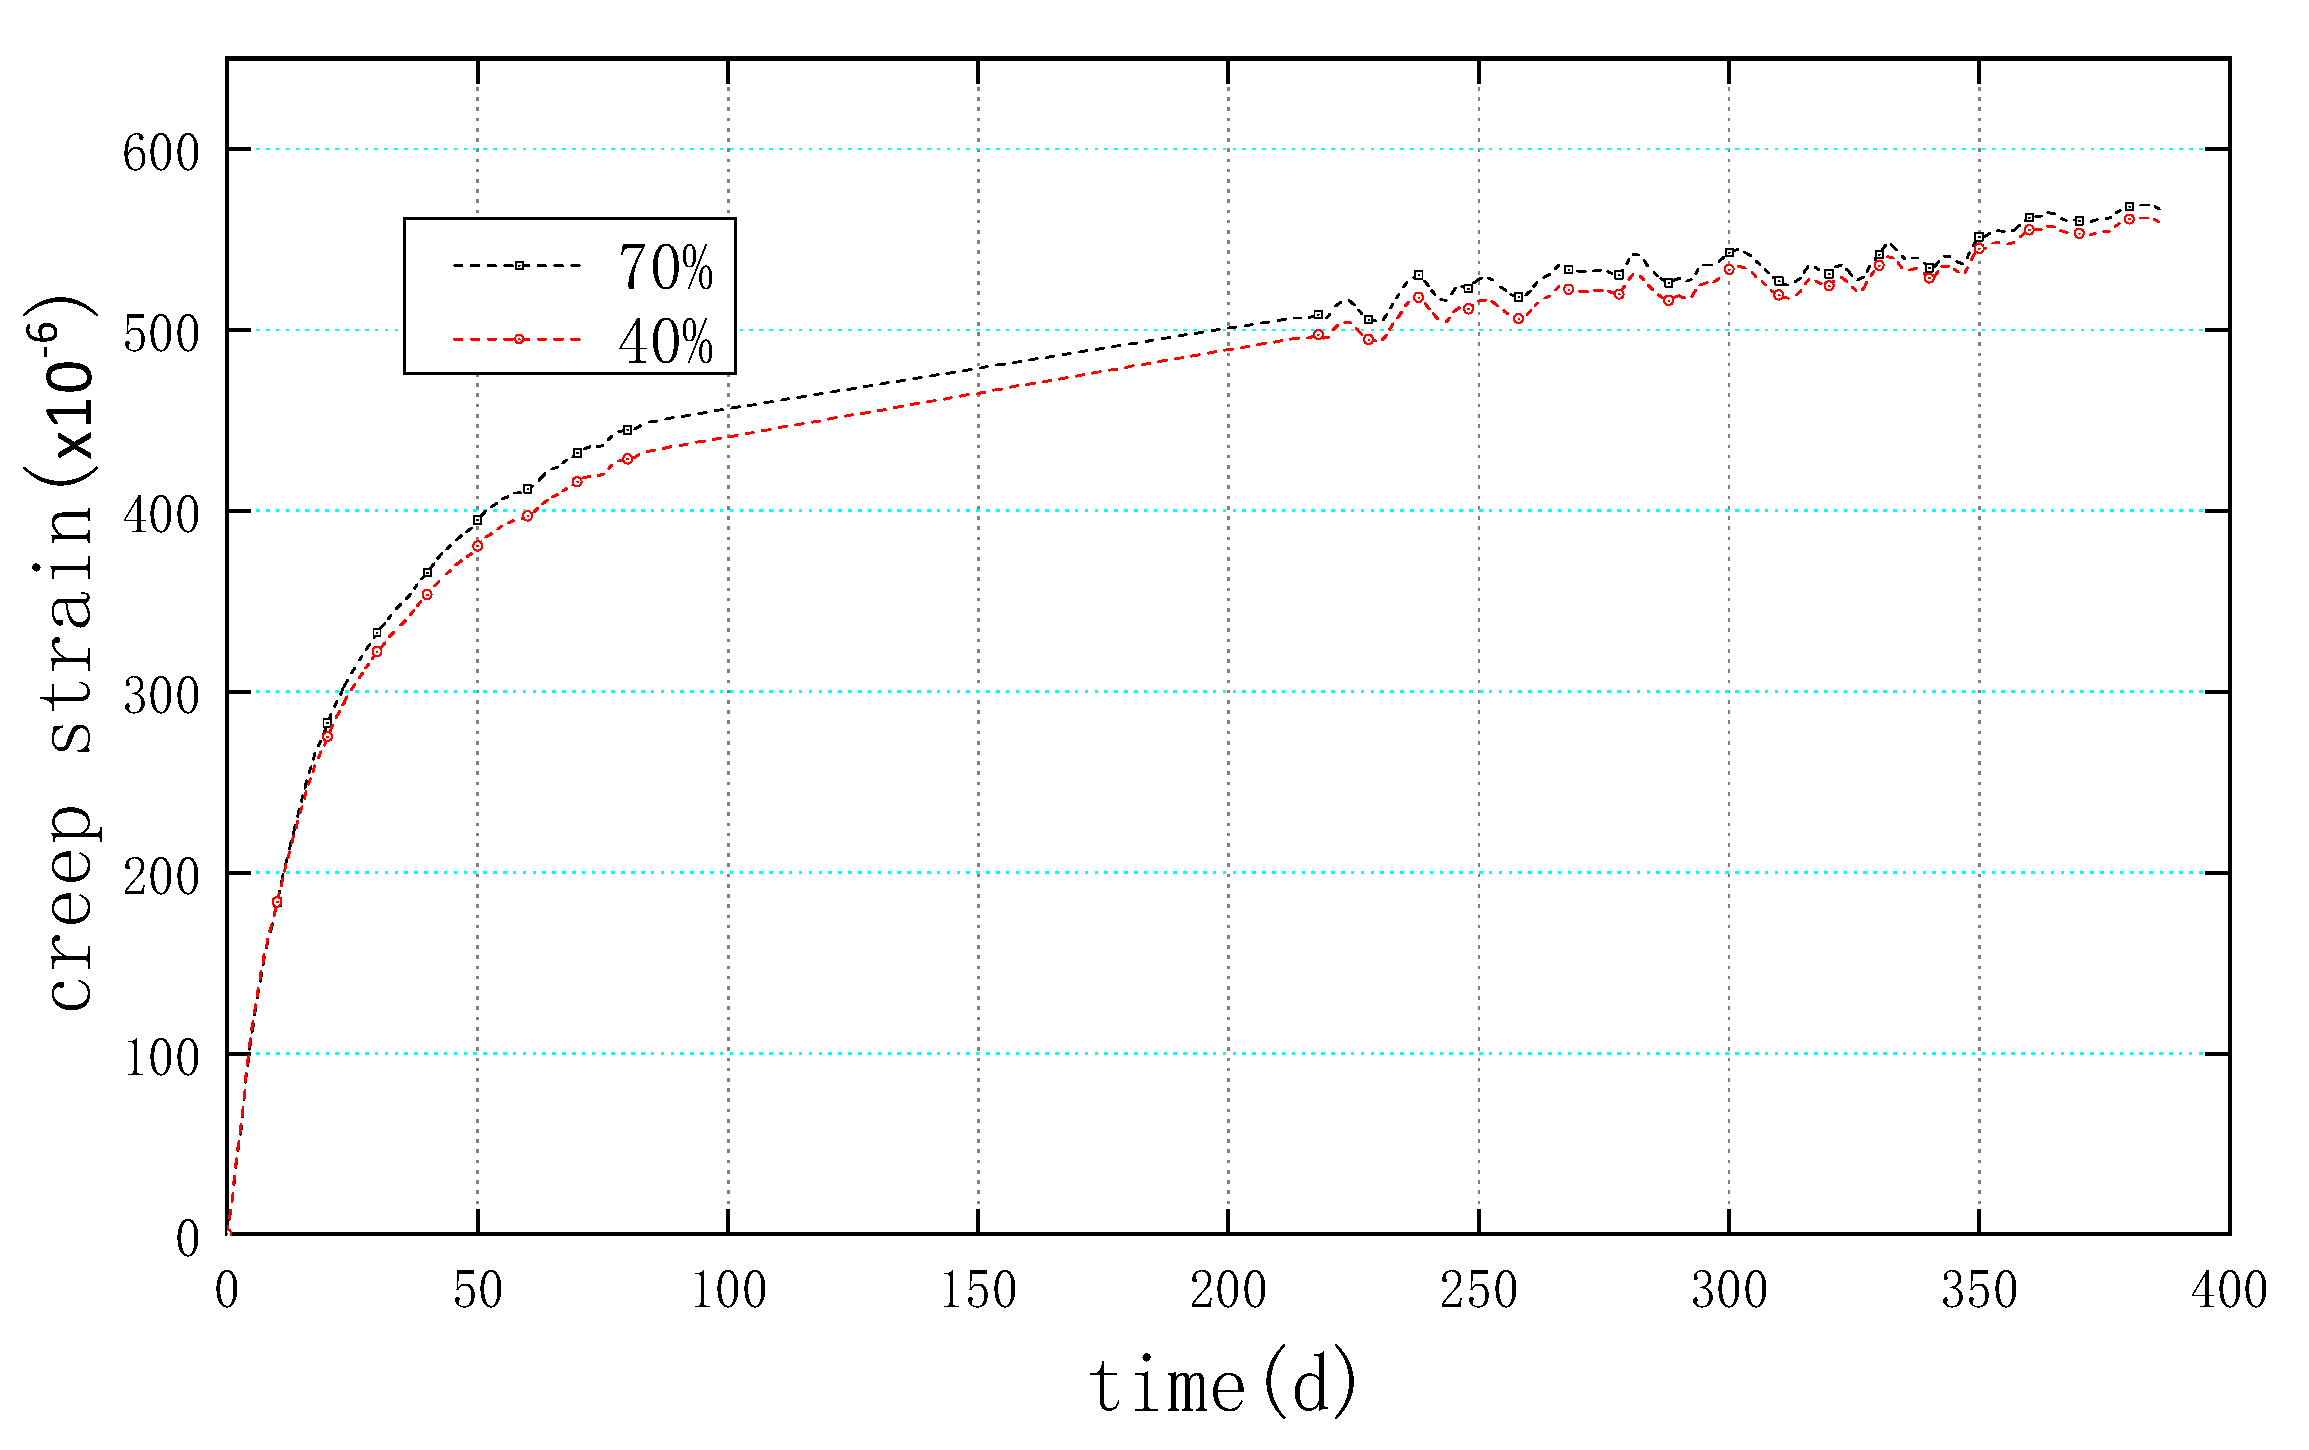
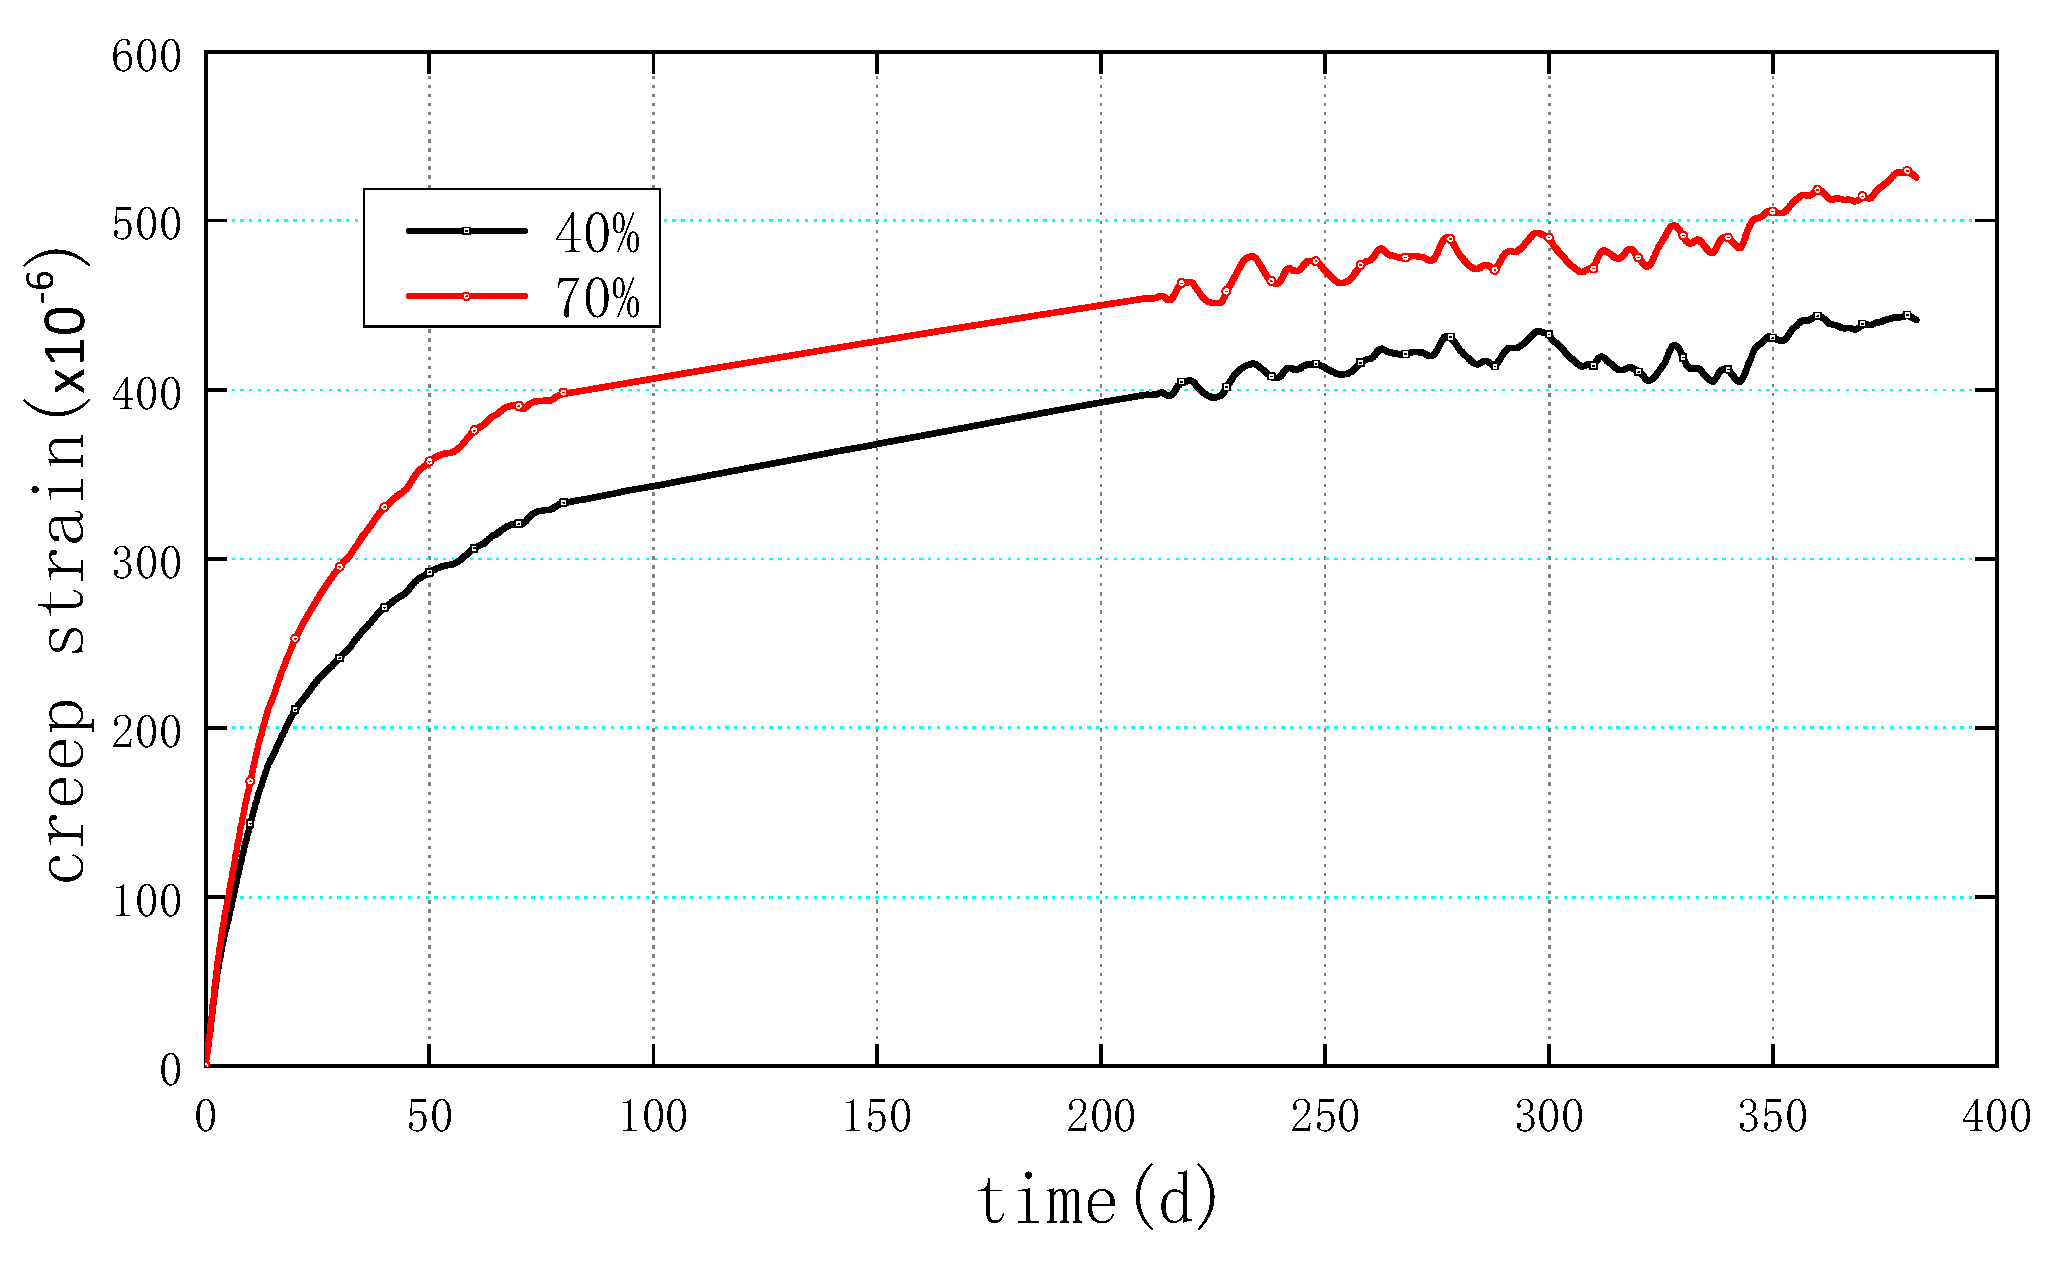
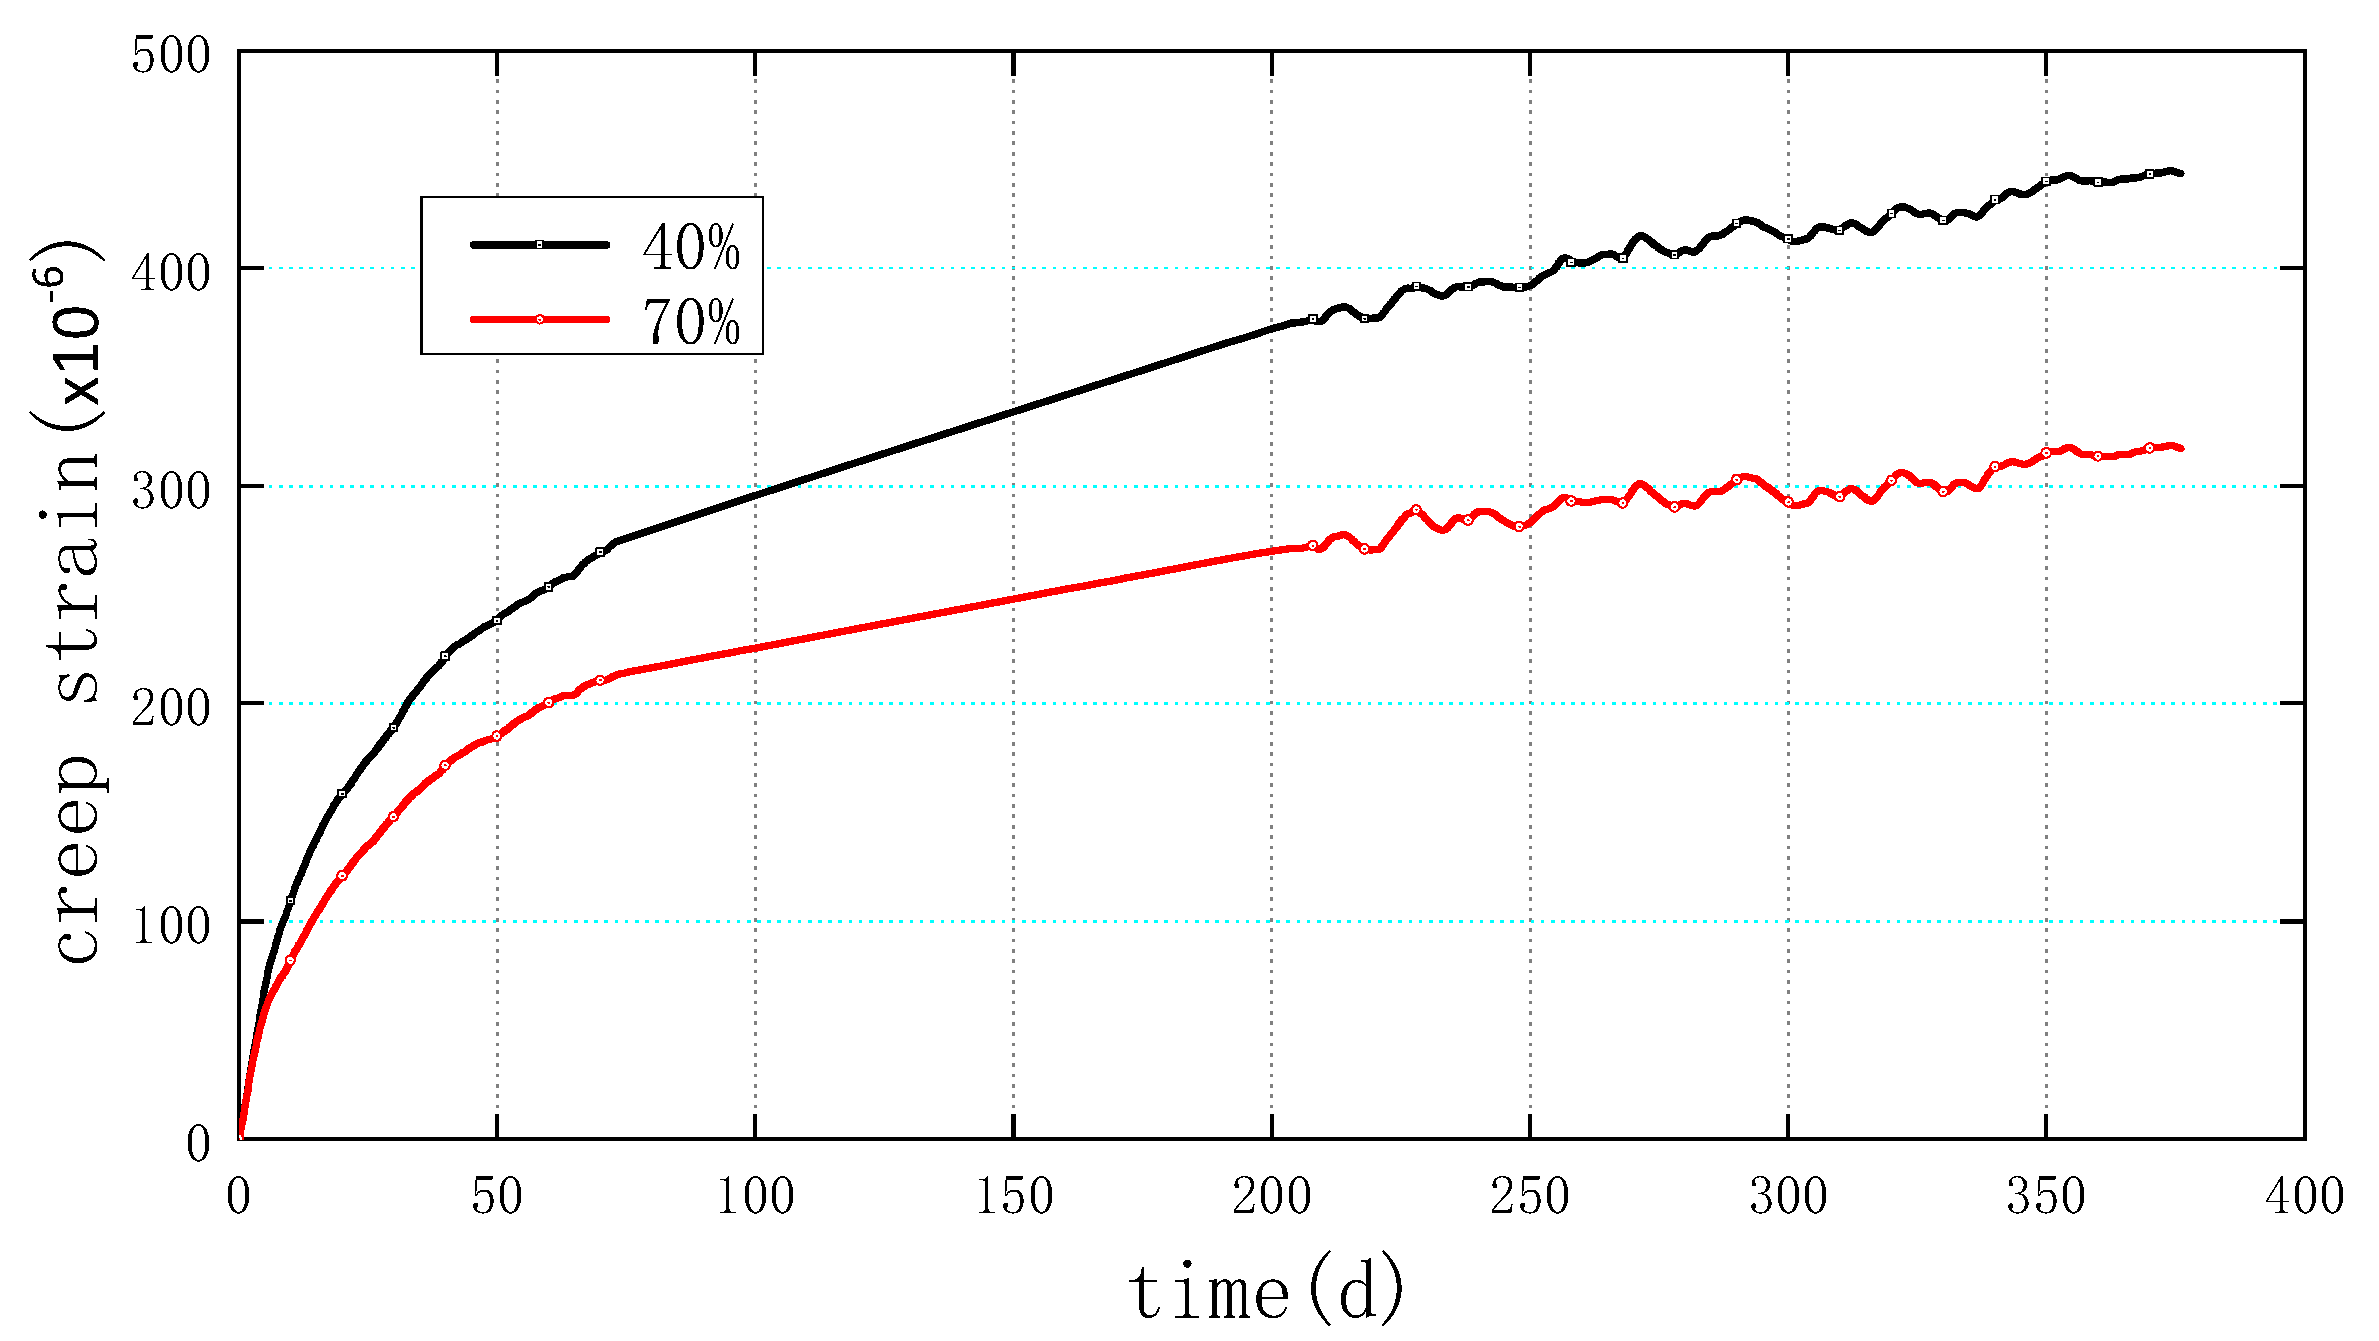
Figure 10, Figure 11 and Figure 12 illustrate the creep strain of the RC T-beam specimens with three levels of the loading age, namely, 3 days, 7 days, and 14 days, respectively. The plotted graphs from top to bottom represent 40% and 70% of load levels, respectively. According to the demonstrated results, at the same loading time, the creep strain at the load level of 70% design load is greater than that at the load level of 40% design load. The impact of load on creep strain diminishes with a decrease in the loading age. Additionally, when the loading age is small, the effect of load level on creep strain is negligible. The obtained results emphasize that the horizontal creep strain curves for the two loads are nearly identical at the initial stage of loading time, and their discrepancy gradually increases with loading time. Furthermore, a smaller loading age results in a longer delay in the separation time of the two curves for a given level of discrepancy.
It should also be noted that since this section focuses on the analysis of creep influencing factors, the influence of temperature and shrinkage is not deducted. The effects of shrinkage and temperature will be avoided when computing the change in creep strain with loading time by removing the strain of the shrinkage T-beam.
3.4. Deflections
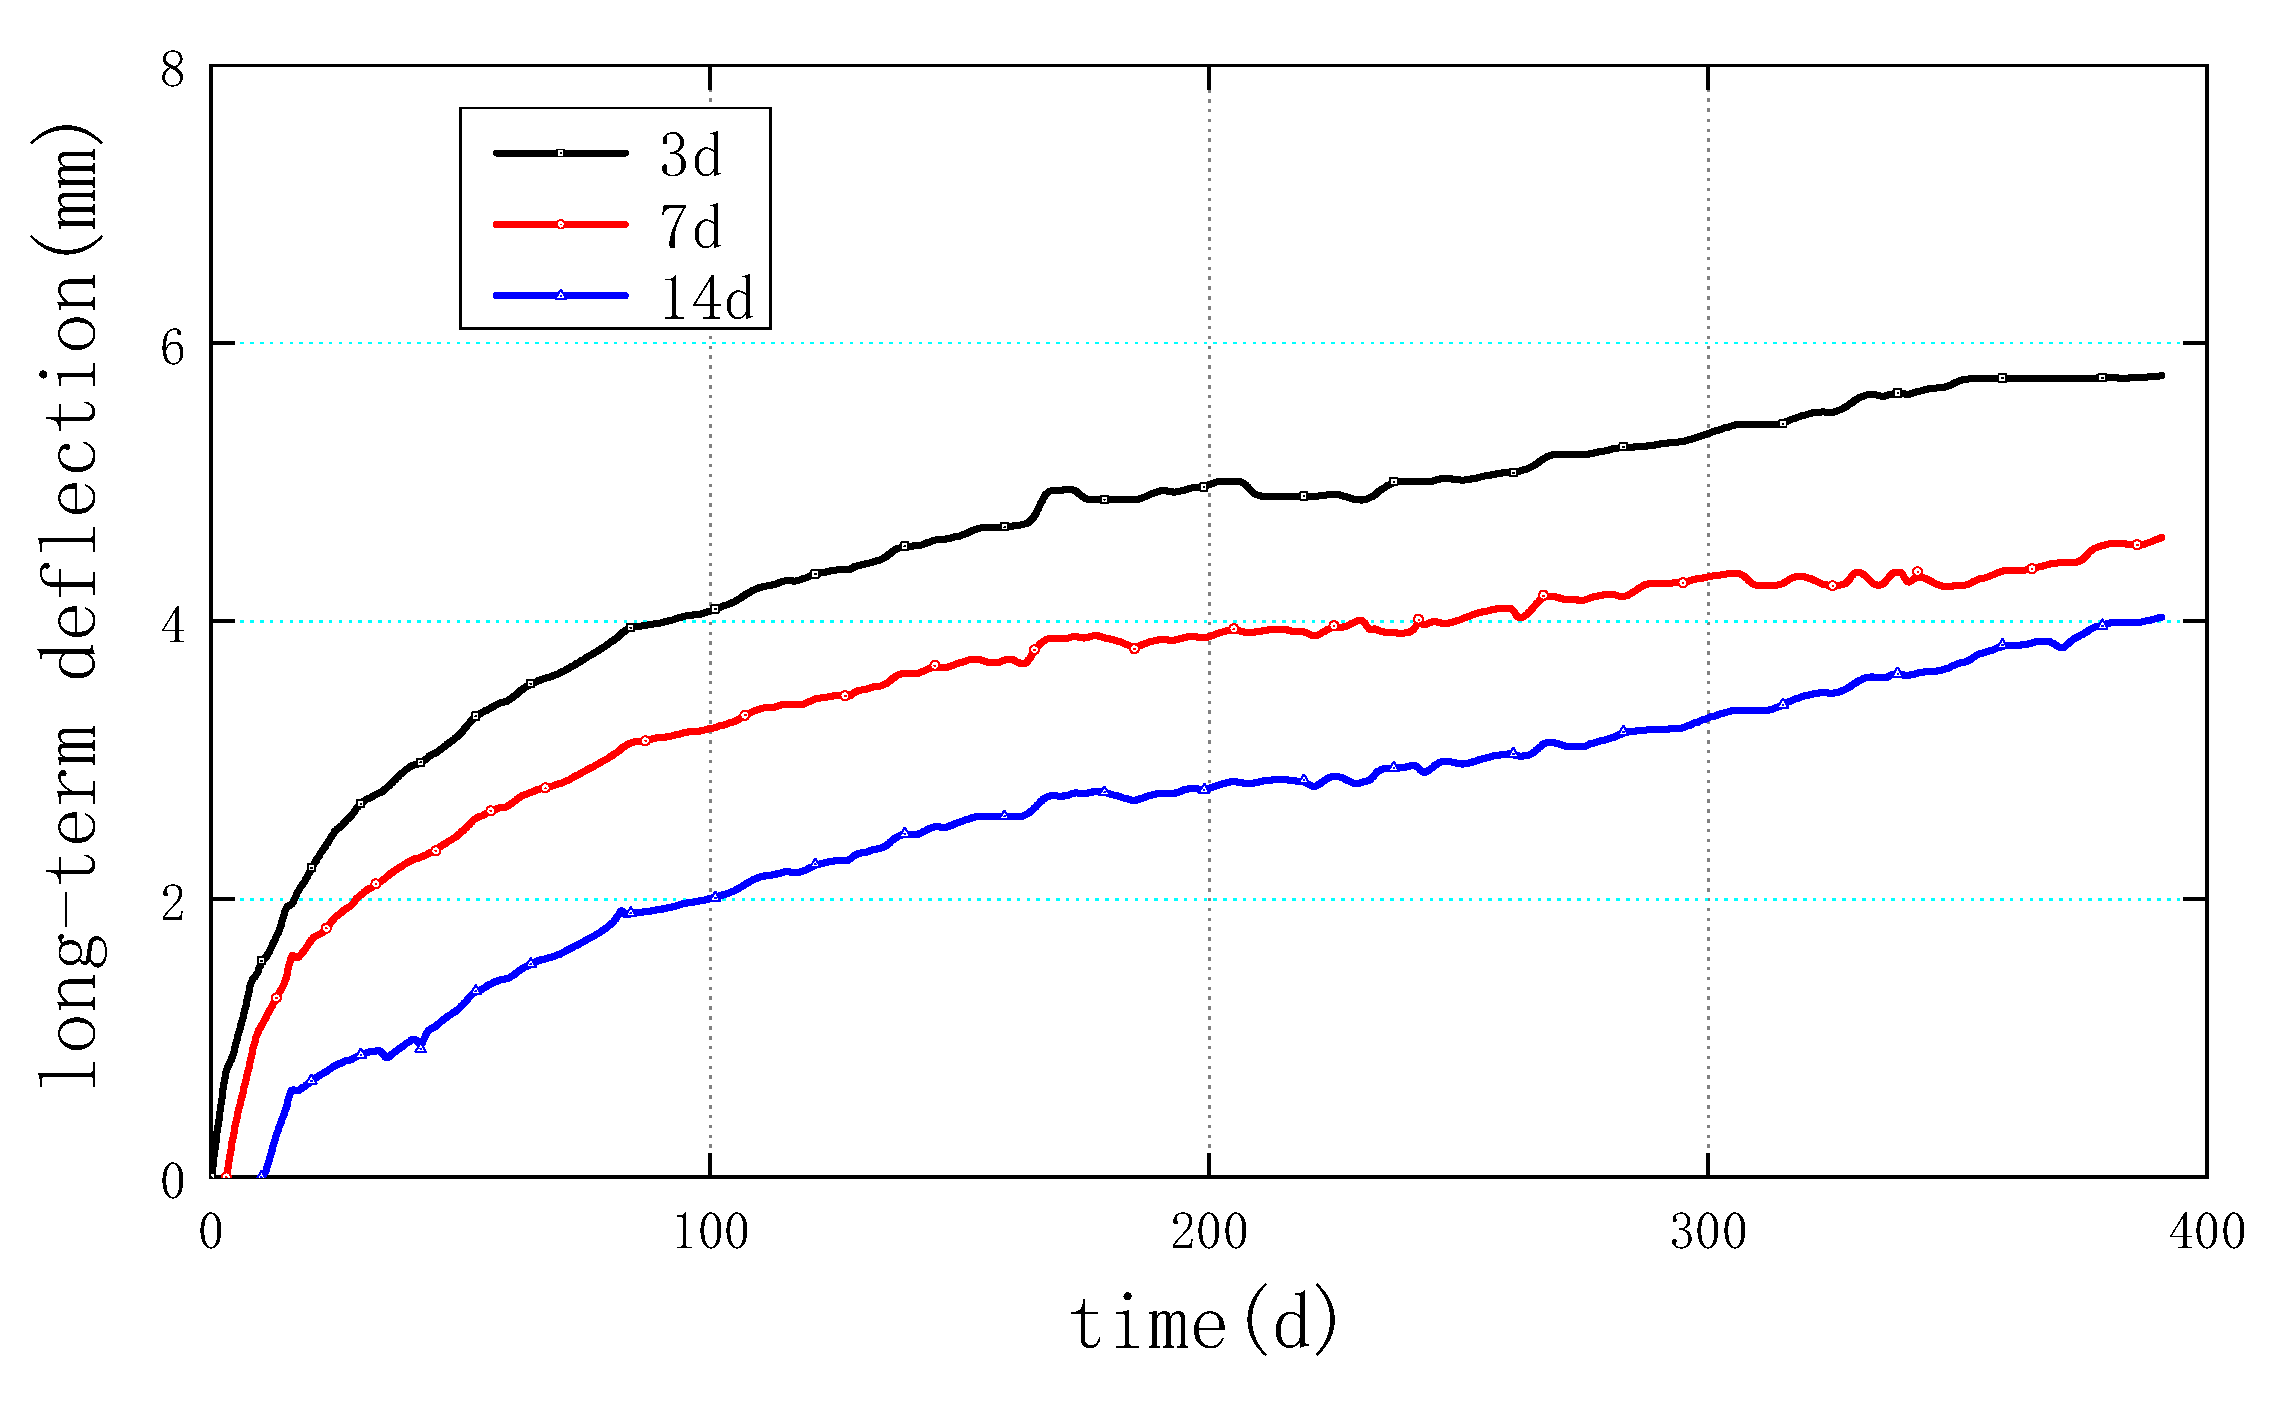
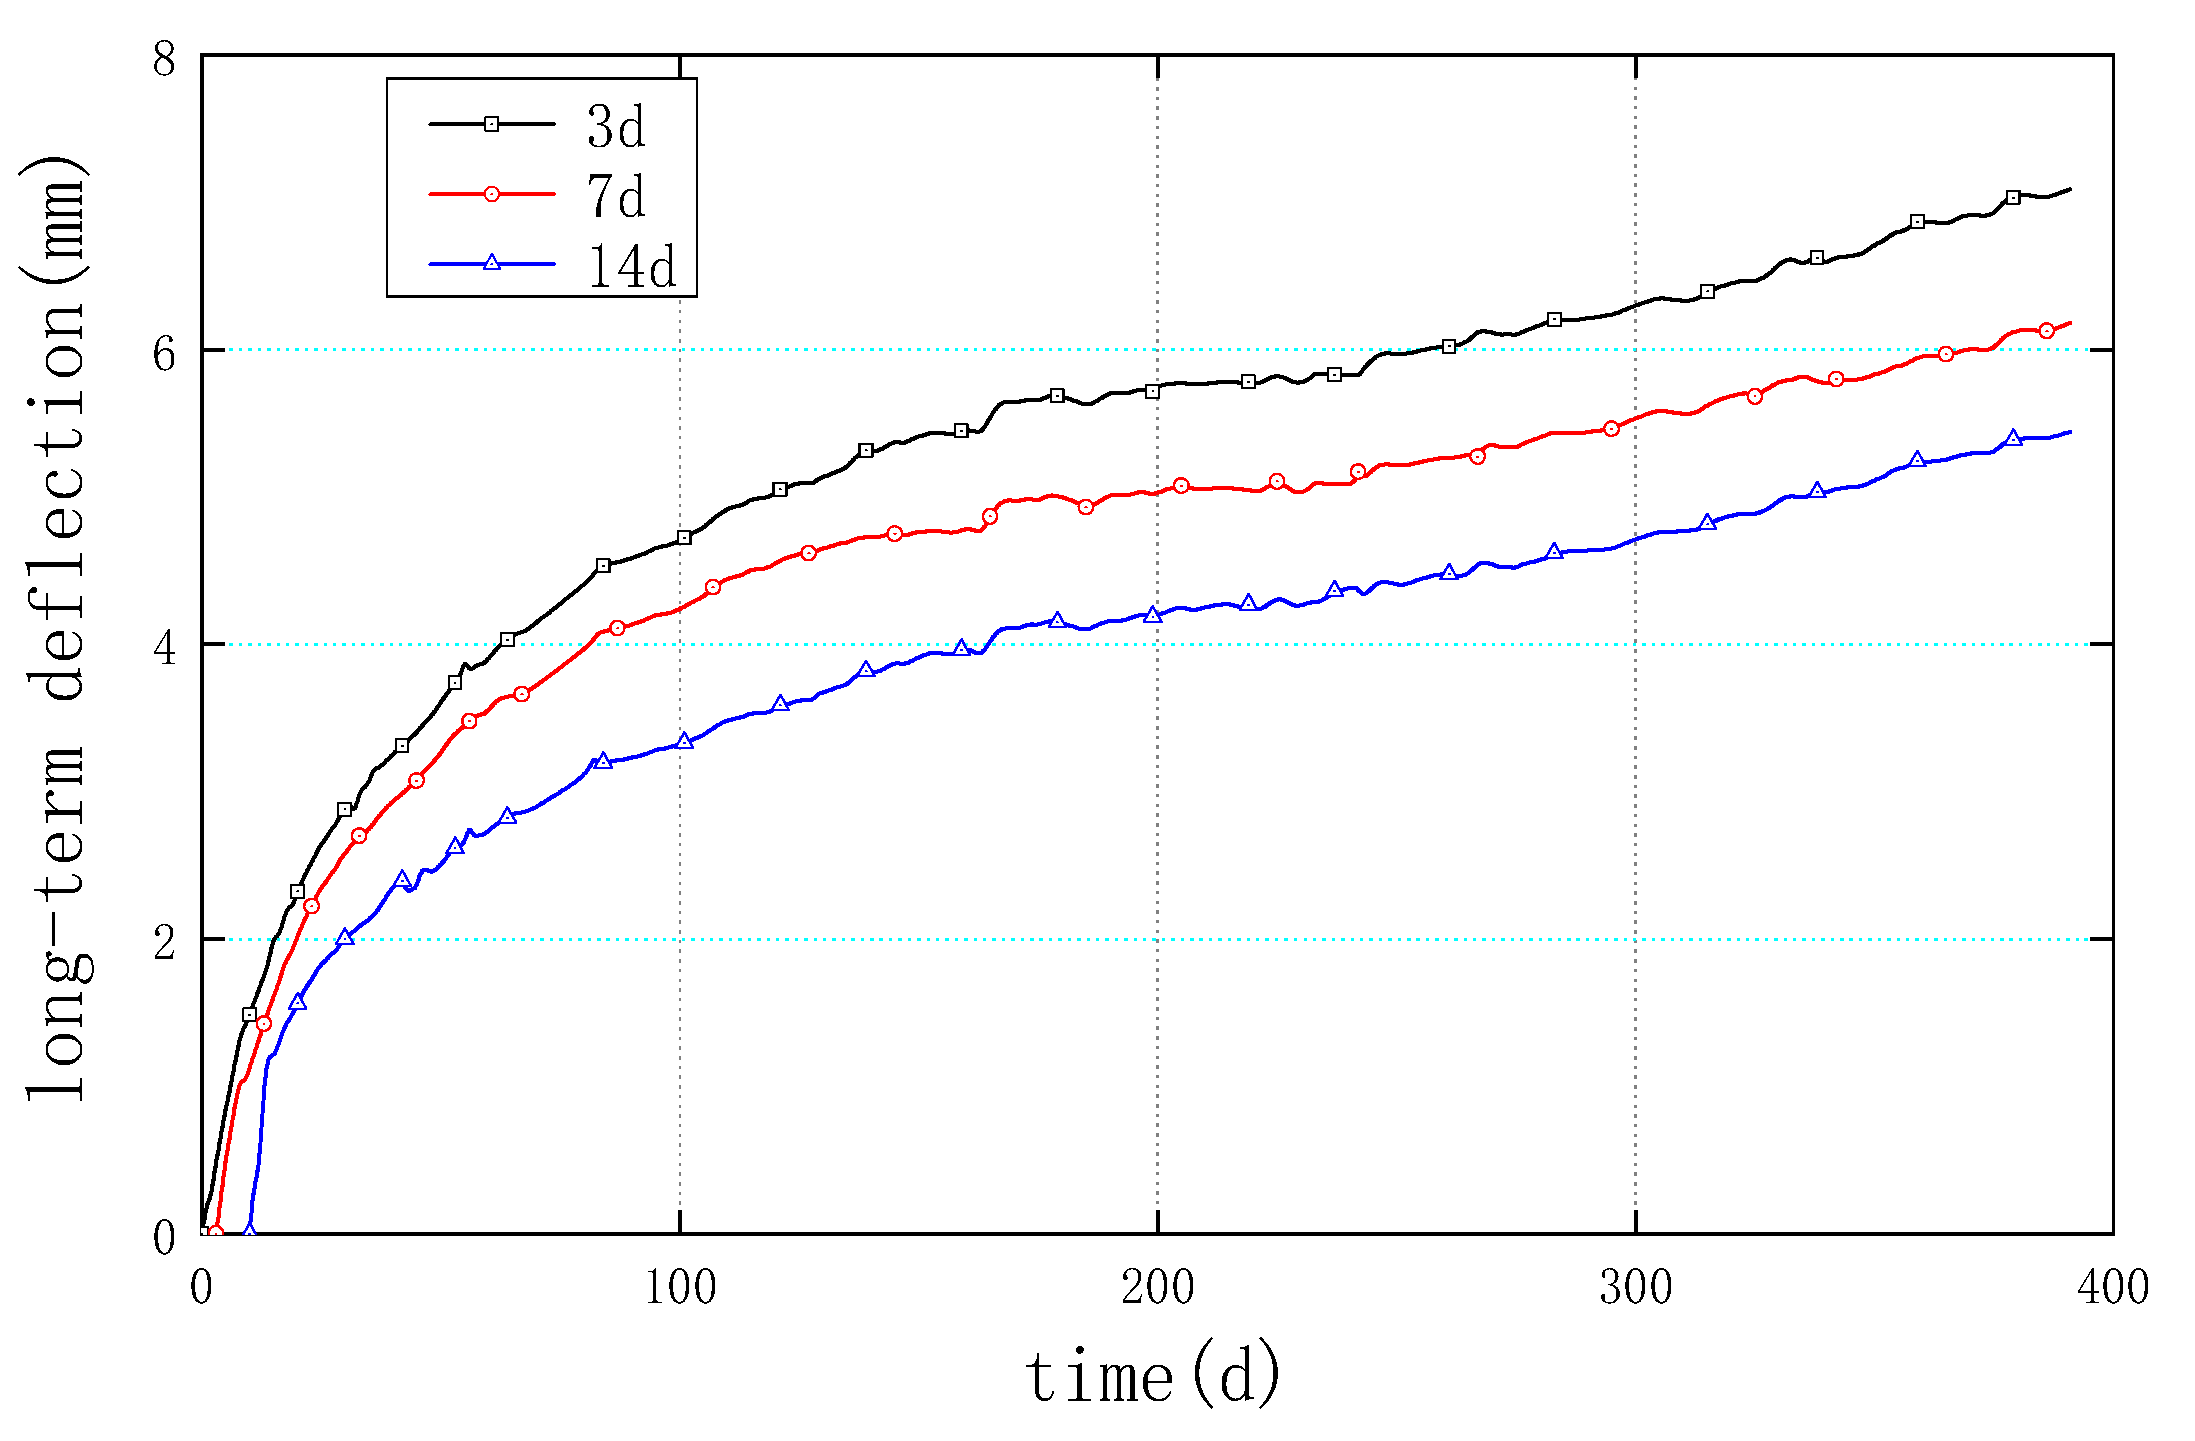
Figure 13 and Figure 14 demonstrate the evolution of long-term deflections for load levels of 40% and 70%, respectively. The results indicate that the deflections of concrete T-beams increase gradually with the extension of time and decrease with the increase in the loading age. The deflection curve associated with the loading age of three days is generally higher than that associated with the loading age of seven days; meanwhile, the deflection curve corresponding to the loading age of seven days is above that of the loading age of 14 days. This indicates that the long-term deflection of concrete T-beams lessens with the increase in the loading age.
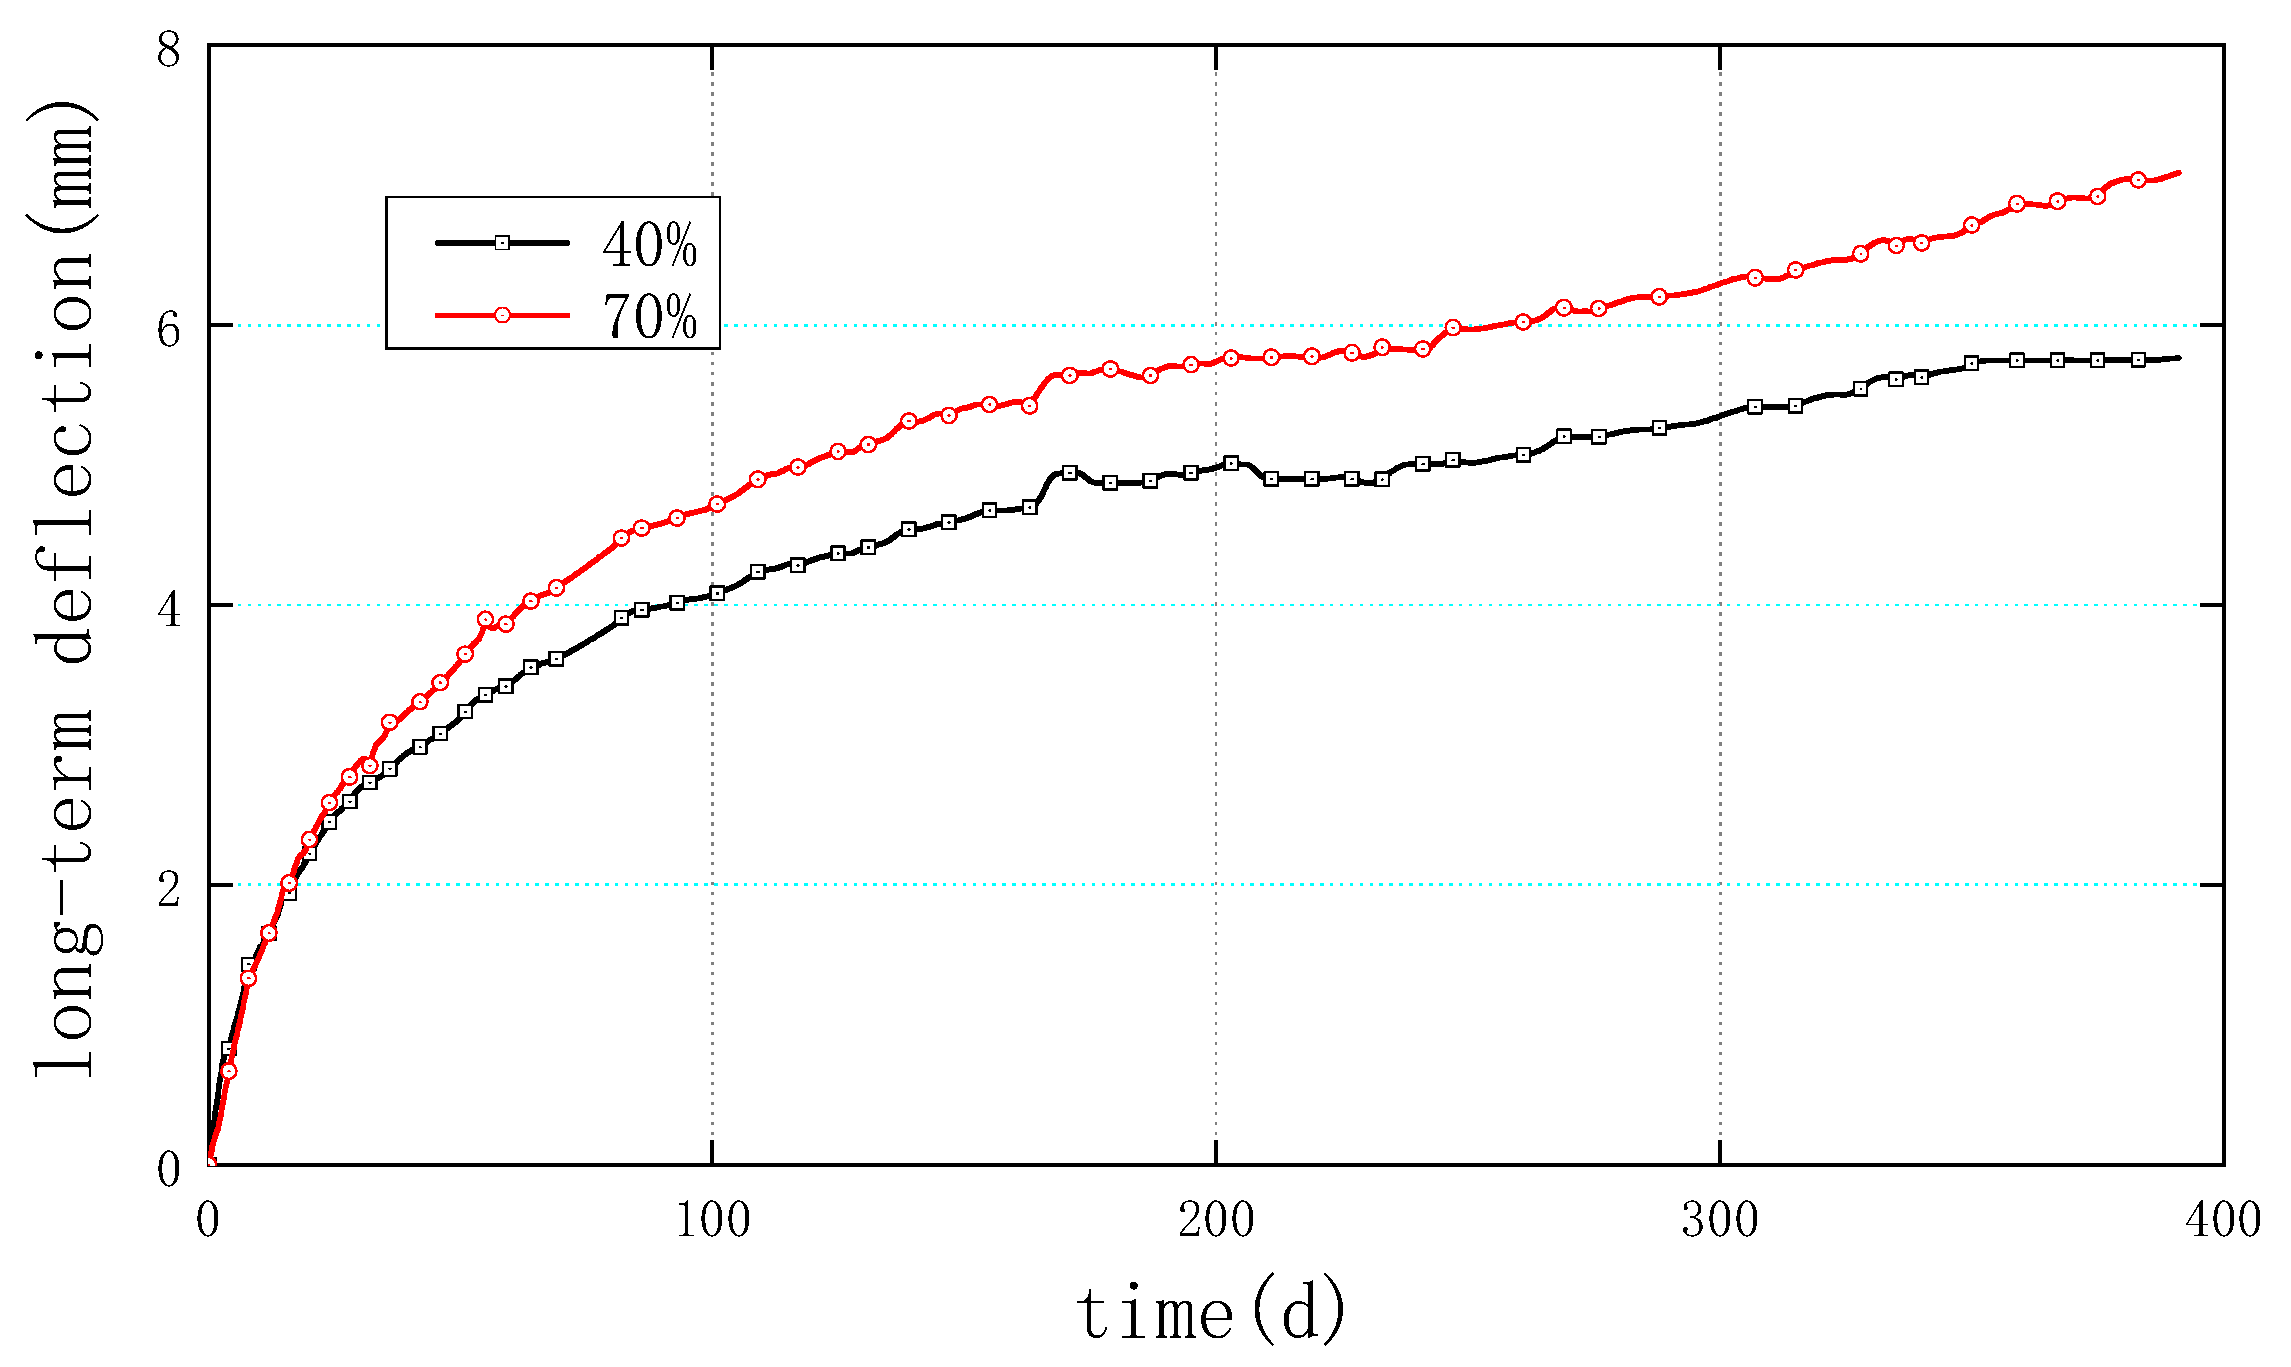
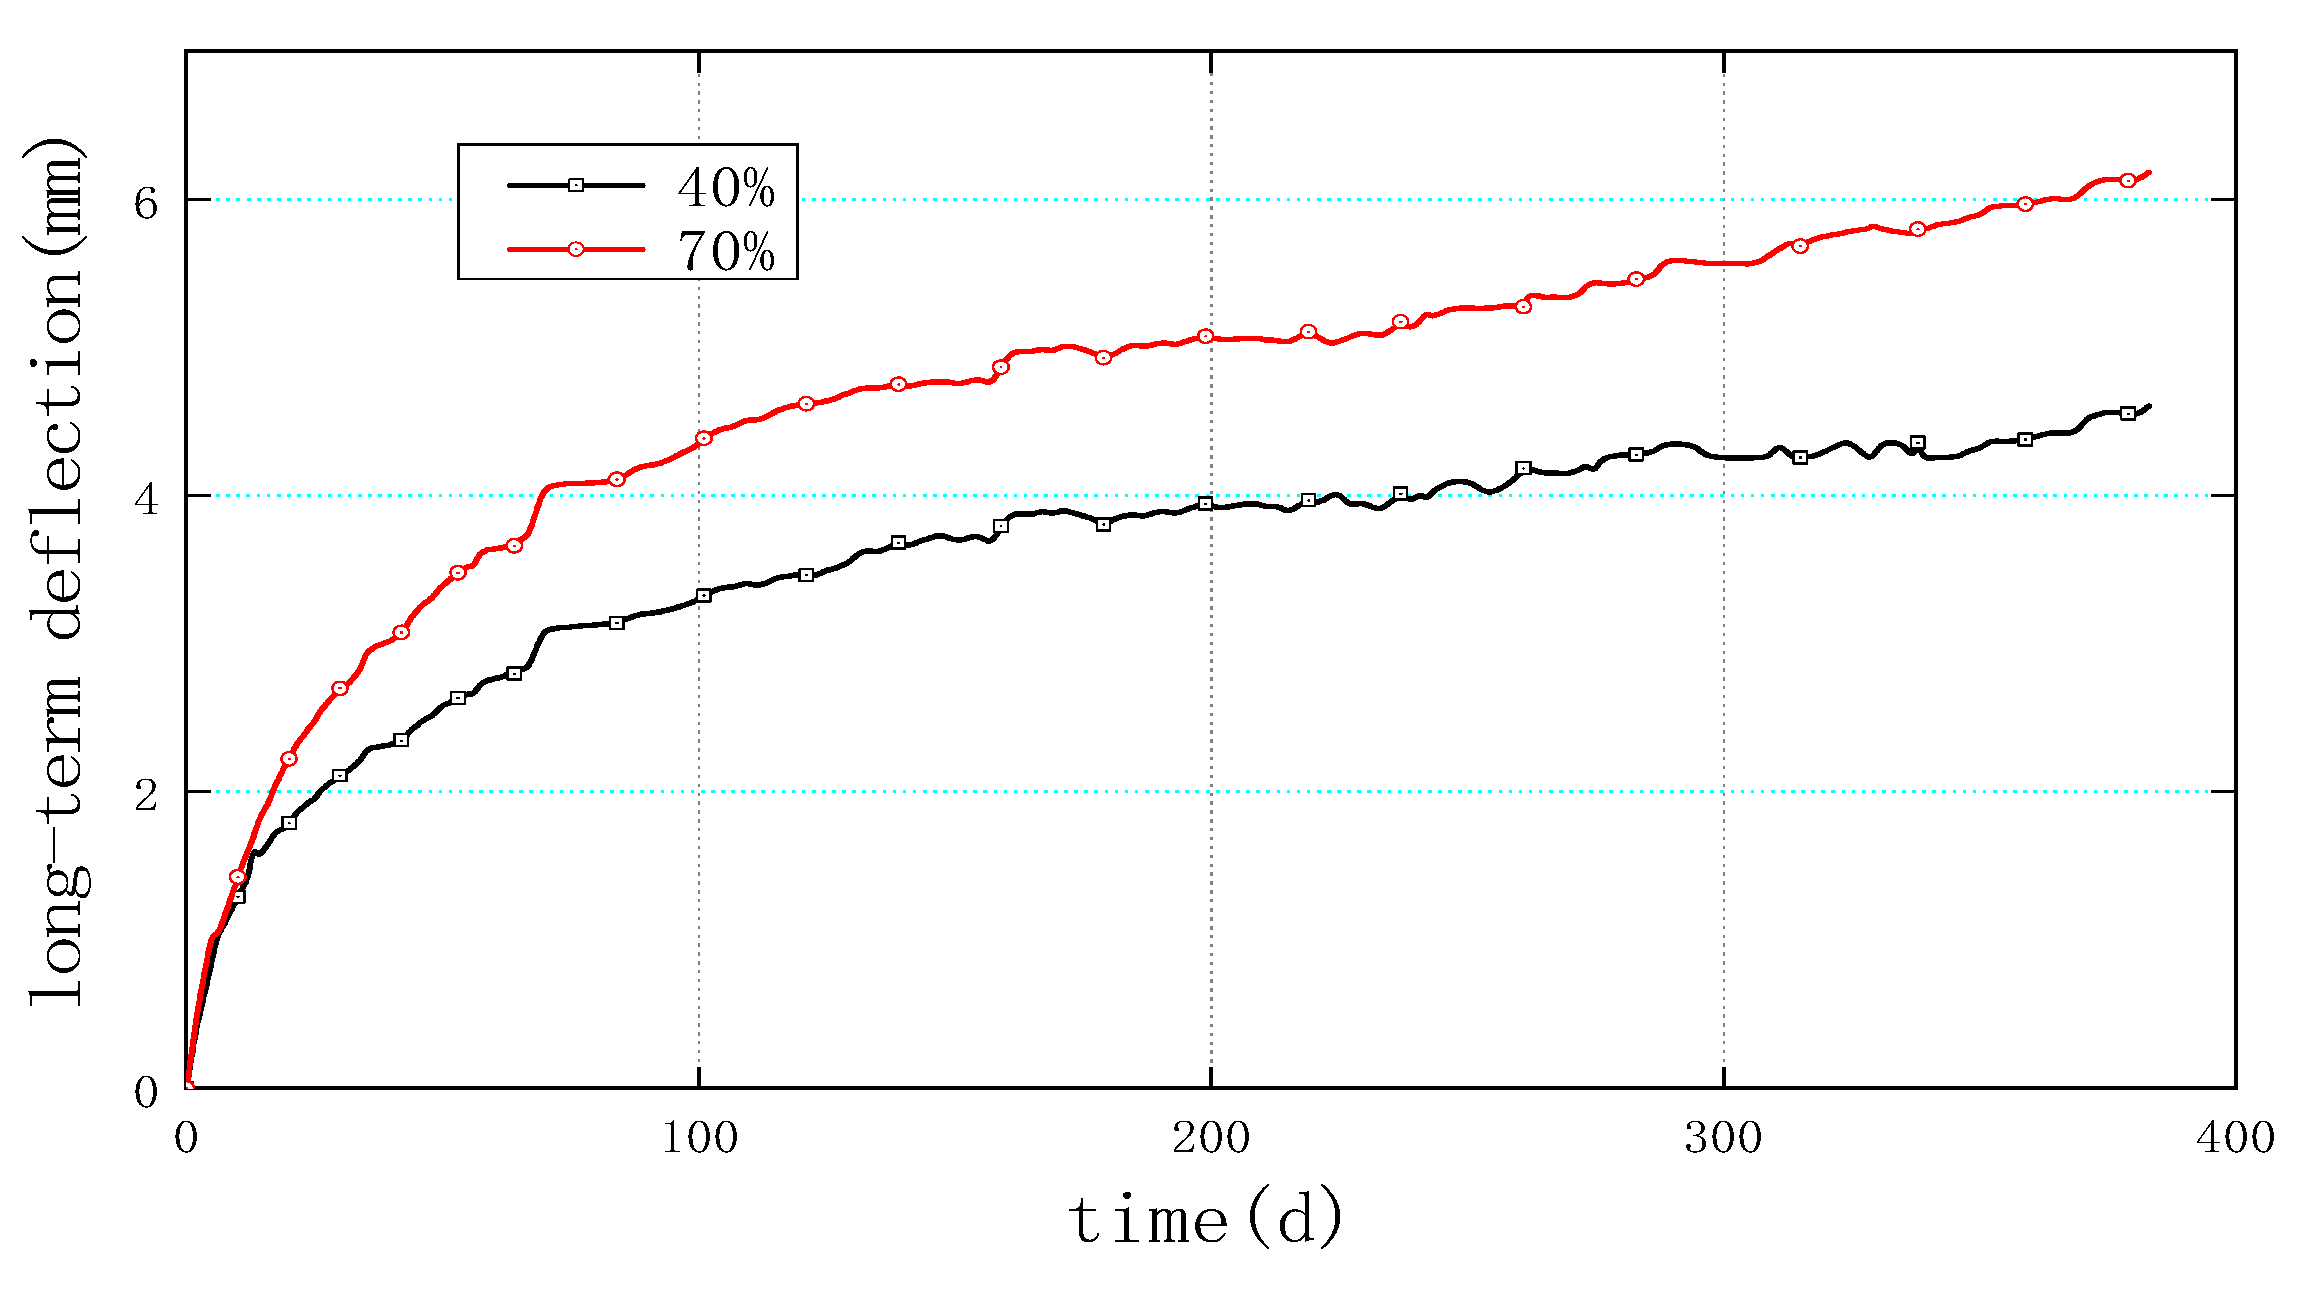
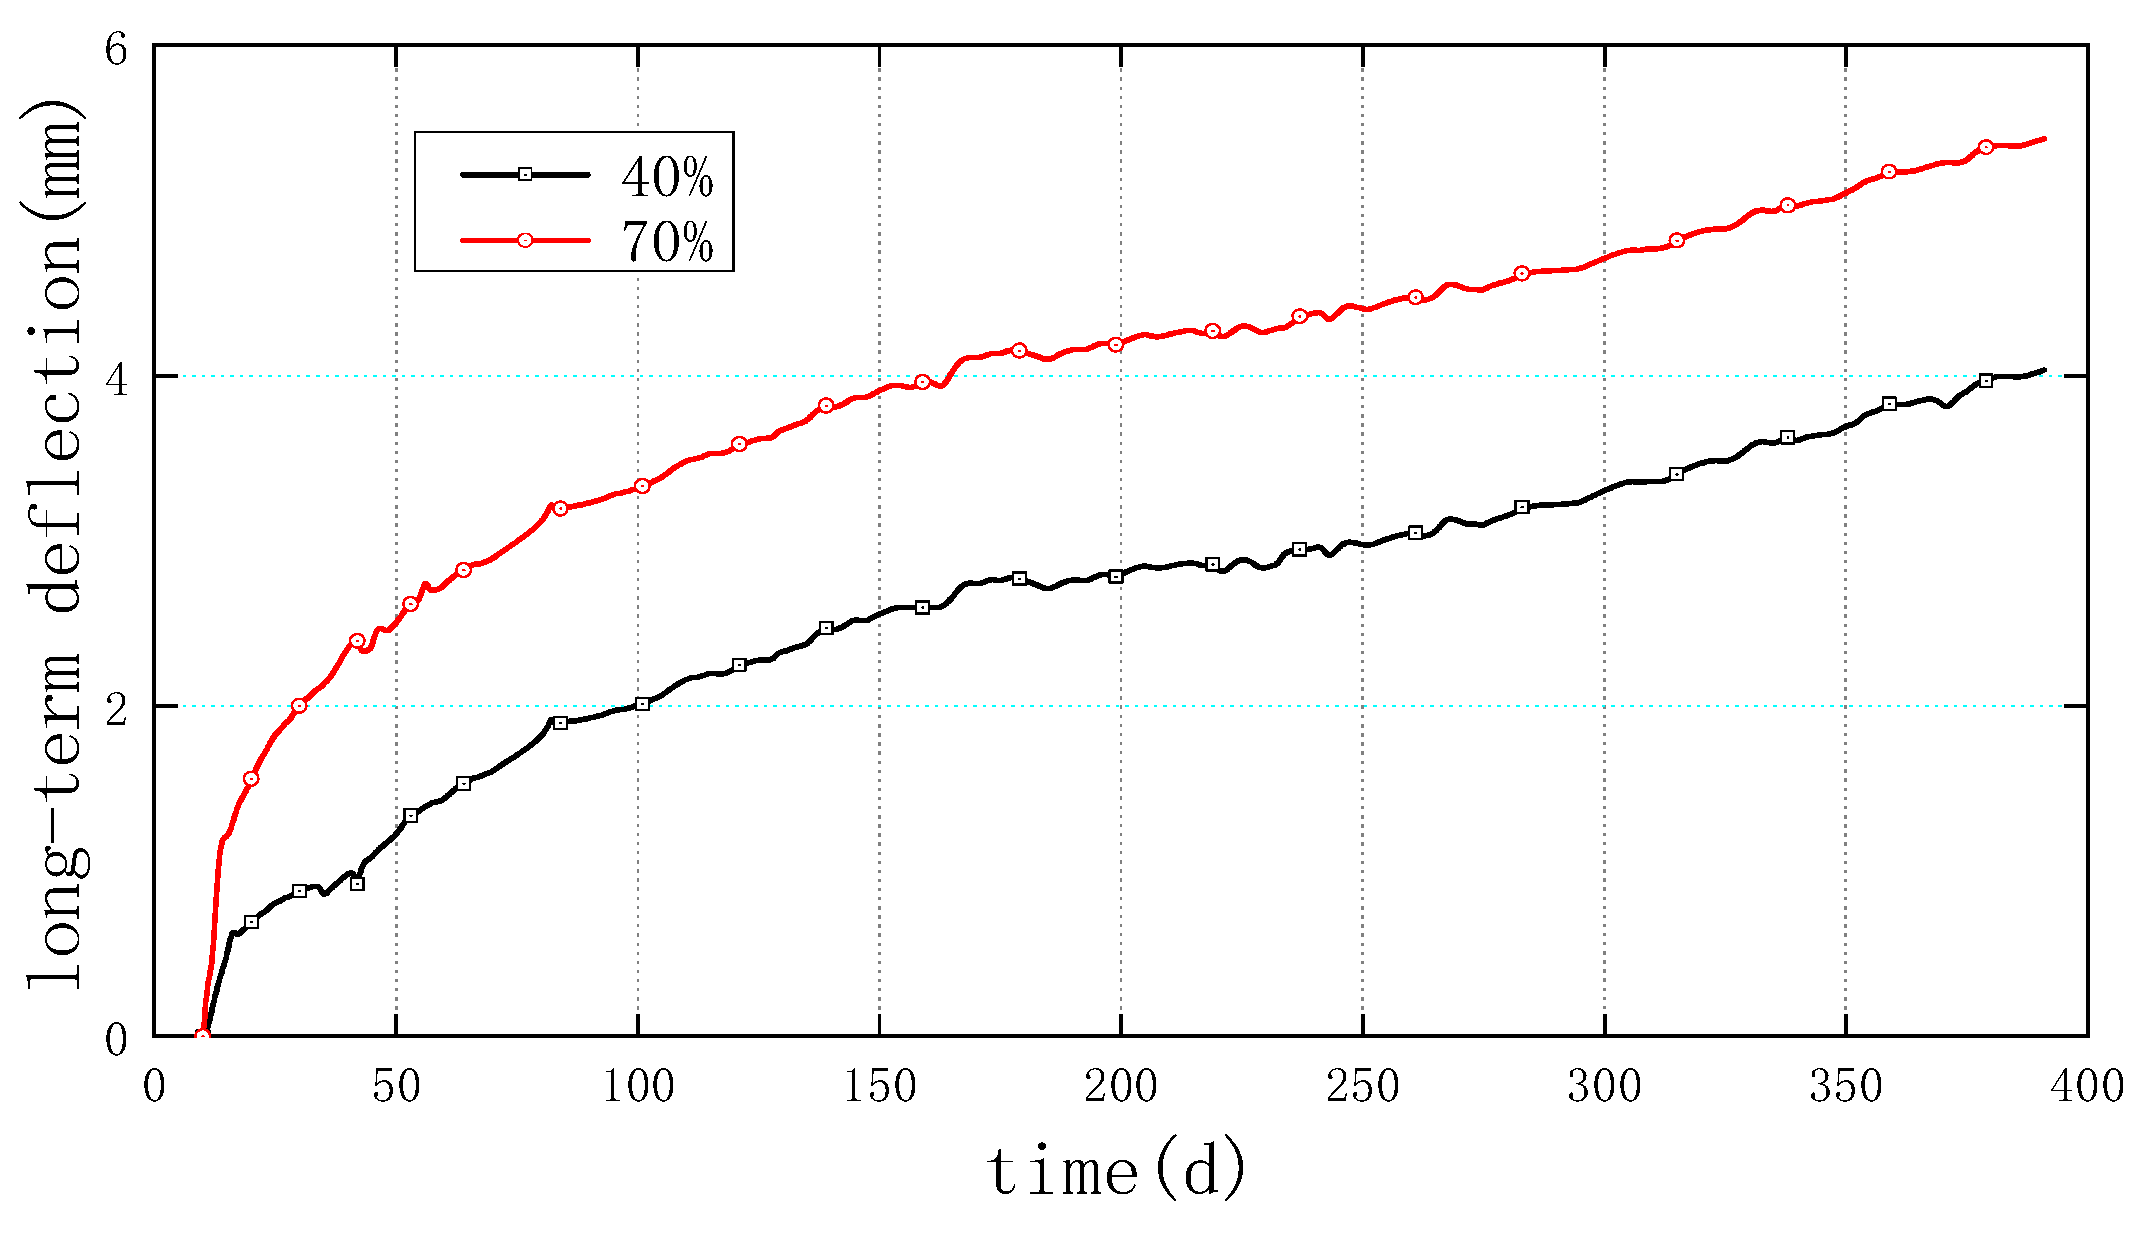
Figure 15, Figure 16 and Figure 17 illustrate the Time−history plots of the long-term deflections of RC T-beam specimens for 3-day, 7-day, and 14-day loading ages, respectively. The top and bottom curves in order are associated with the 40% and 70% loading levels. This shows that the greater the loading level, the greater the deflection. In addition, the two curves in the figure are adjacent to each other at the beginning of the loading time and gradually separate with the increase in the loading time. Hence, with the increase in the loading age, the load level has a greater impact on the long-term deflection.
4. Results Analysis
4.1. Shrinkage Strain
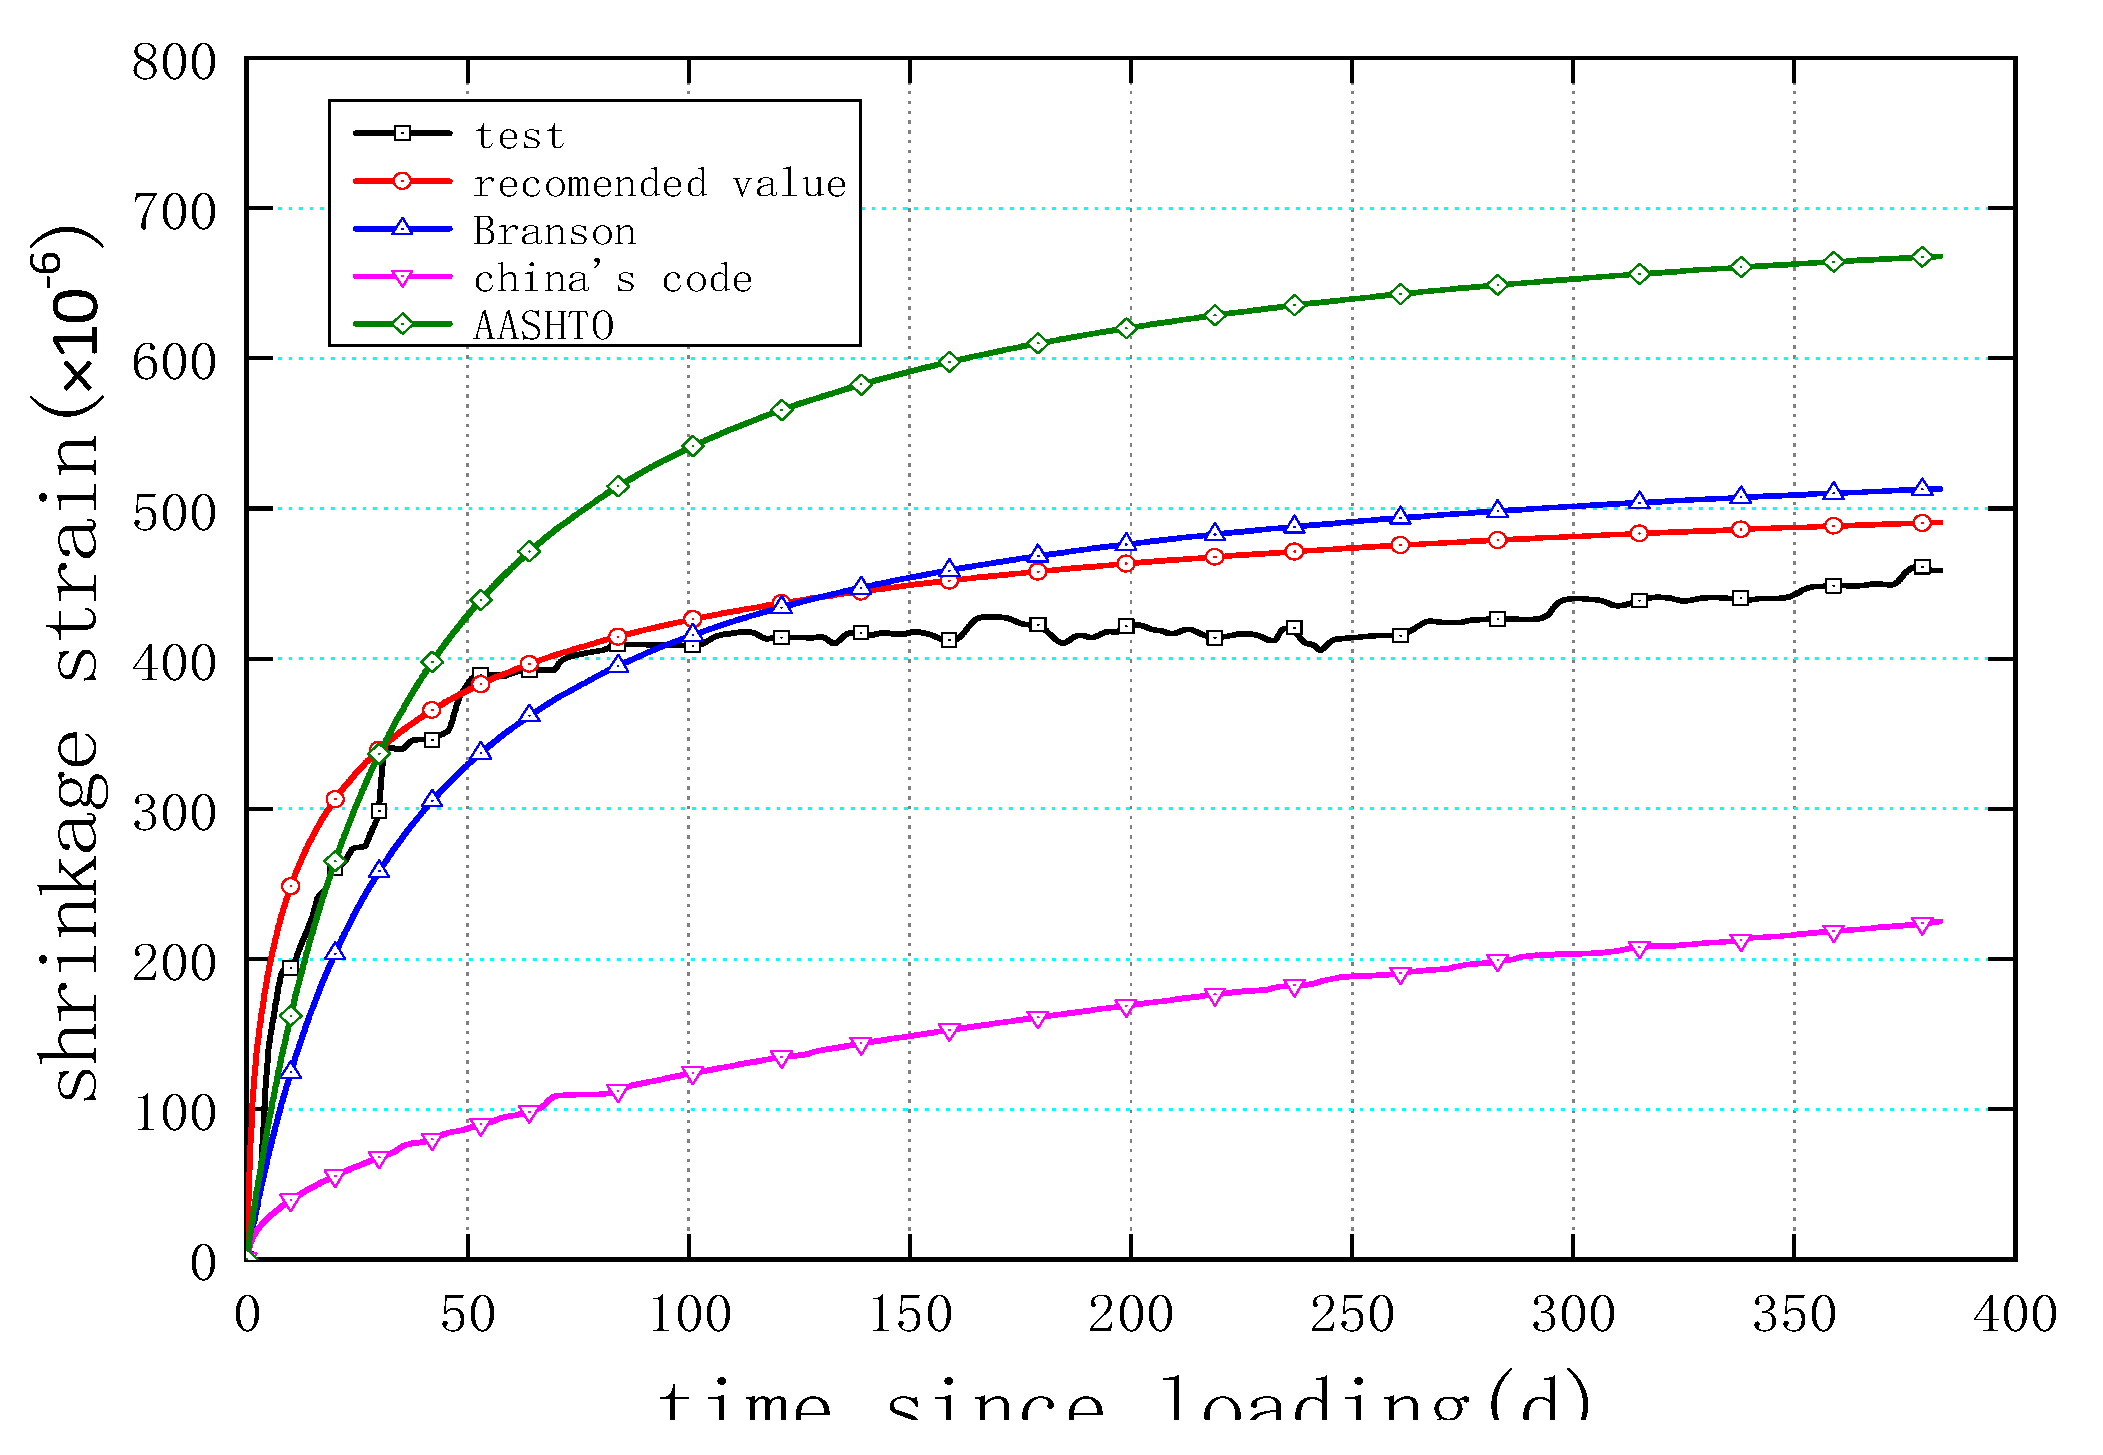
Figure 18 compares the experiment, computed as per Chinese code [20], AASHTO [21], and Branson [22] and the recommended values of shrinkage strain for the RC beam bridge over time. The results manifest that the computed values provided by Branson and AASHTO are in good agreement with the experimental value at an early stage of approximately 30 days of load duration. However, after 30 days, AASHTO’s curve exhibits a faster rate of change than all other curves. Before 100 days, Branson’s curve is marginally lower than the experimental curve, whereas it is slightly higher beyond 100 days. Generally, Branson’s curve closely approximates the experimental curve.
The shrinkage strain curve obtained based on the Chinese code is the lowest. As mentioned above, the shrinkage test result is similar to the Chinese code result. However, the specification result is the ultimate value, whereas the test result is the value of 400-day loading time, and the specification ultimate value considers the 1000-day loading time. In fact, the test value is greater than the predicted value of the Chinese code, which may approximate the value obtained in an experiment conducted indoors, where the humidity is relatively low. The average humidity in this test is 36%, whereas the humidity considered by the Chinese code is 55%, which is beyond the scope considered by the Chinese code.
Furthermore, the values given by the AASHTO specification and Branson are too small at the early time, which may be conservative in predicting the shrinkage strain during the construction phase of the structure. However, the value given by AASHTO after 30 days is too large, which may overestimate the shrinkage strain value. Given this, and in conjunction with the test findings, the suggested value of the shrinkage strain is also provided, as shown in Figure 18 by a curve with empty circle markers. The proposed curve can compensate for the possibility of underestimating strain deformation at the onset of contraction and avoid overestimating later. The formula for the recommended curve can be stated as:
where denotes the ultimate contraction strain value, which is commonly set as , indicates a factor depending on the environmental humidity, and is a parameter that relies on the ratio of the cross-sectional area of the member to the length of the outer contour.
4.2. Creep Strain
Table 4 presents the experimental and computed results of the instantaneous strain of RC T-beams and their corresponding creep coefficients at 30, 60, 90, and 360 days.
The findings illustrated in Table 4 demonstrate that when using one year as a benchmark for evaluating creep at varying loading durations, the creep strain after one month is approximately 30% of the value obtained after one year. Similarly, the creep strain after three months is approximately 55% of that recorded after one year.
At a low load age, the load level creep exerts an insignificant influence. However, when the load level is large, the influence of the loading age on creep is more significant. For example, little differences between the results of 40% and 70% loading levels were observed in 360-day-old specimens. At a 7-day loading age and a 360-day loading time, the creep ratios of the loading levels of 40% and 70% were 1.16 times higher. When the loading age was 14 days and the loading time was 360 days, the creep ratios of the loading levels of 40% and 70% were 1.45.
At a small load level, the influence of the loading age on creep is insignificant; at a large load level, however, the influence of the loading age on creep is more significant. In our study, at a load level of 70% and a loading time of 360 days, the creep ratio of 3-, 7-, and 14-day loading ages was 1:1.69:1.80.
The creep value at the loading age of 14 days and the load level of 70% were equal to previously reported ones [23]. However, the loading age implemented in this earlier study was 28 days, although the test loading level was 40% of the strength, and thus the loading age had a greater influence on the creep.
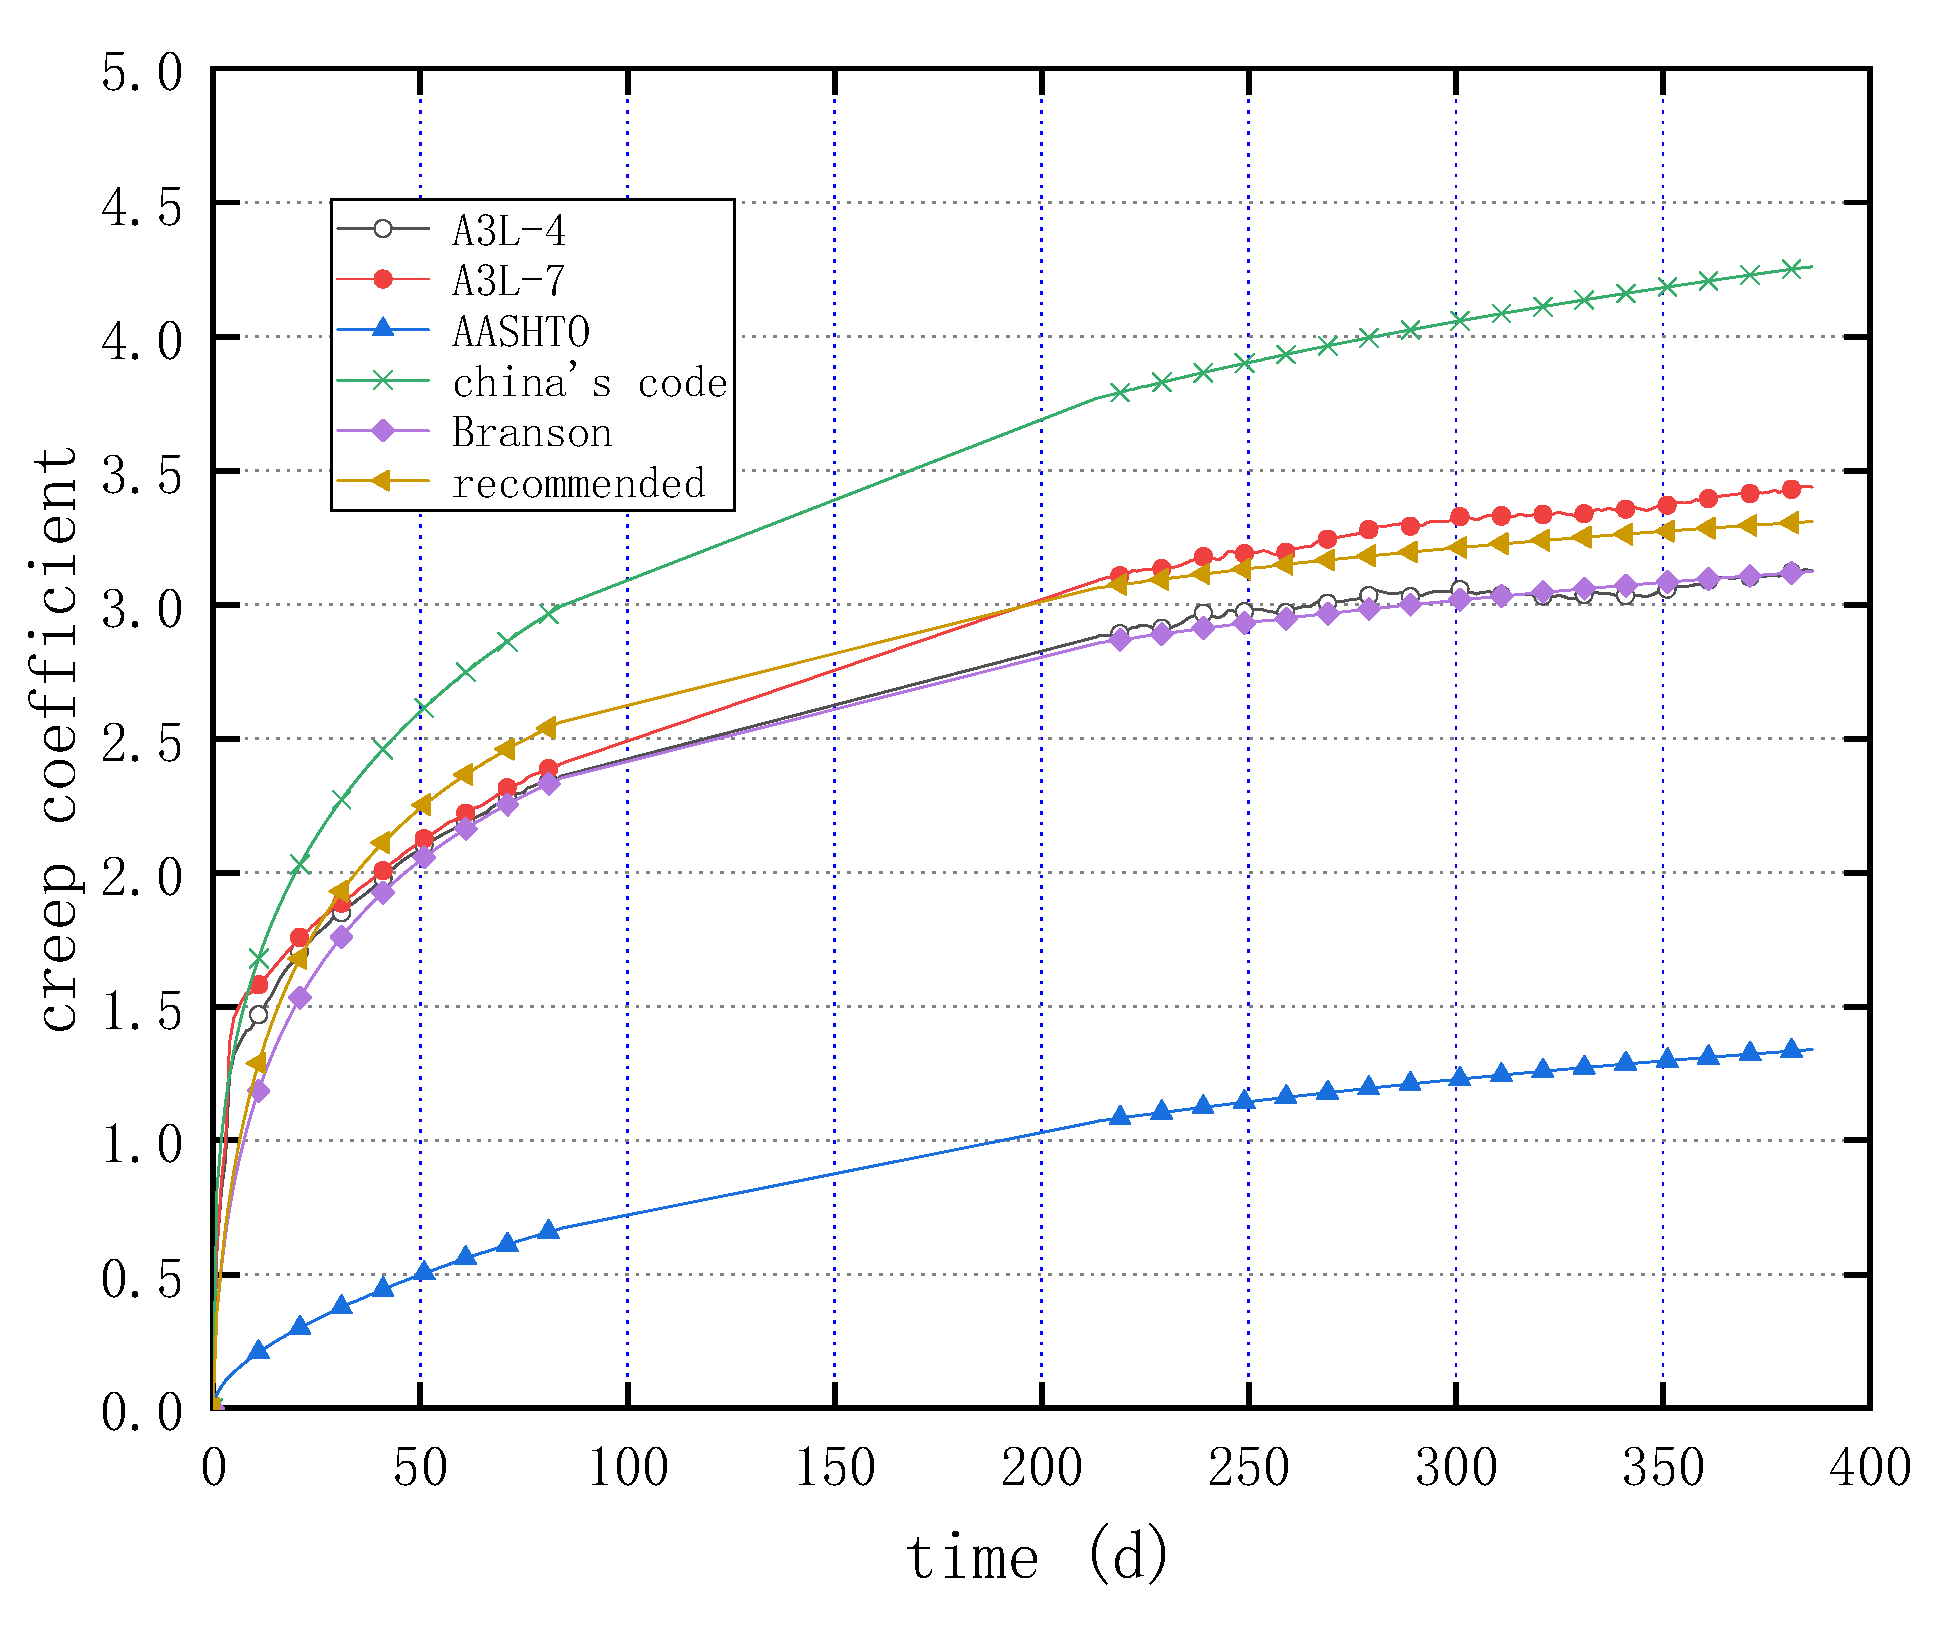
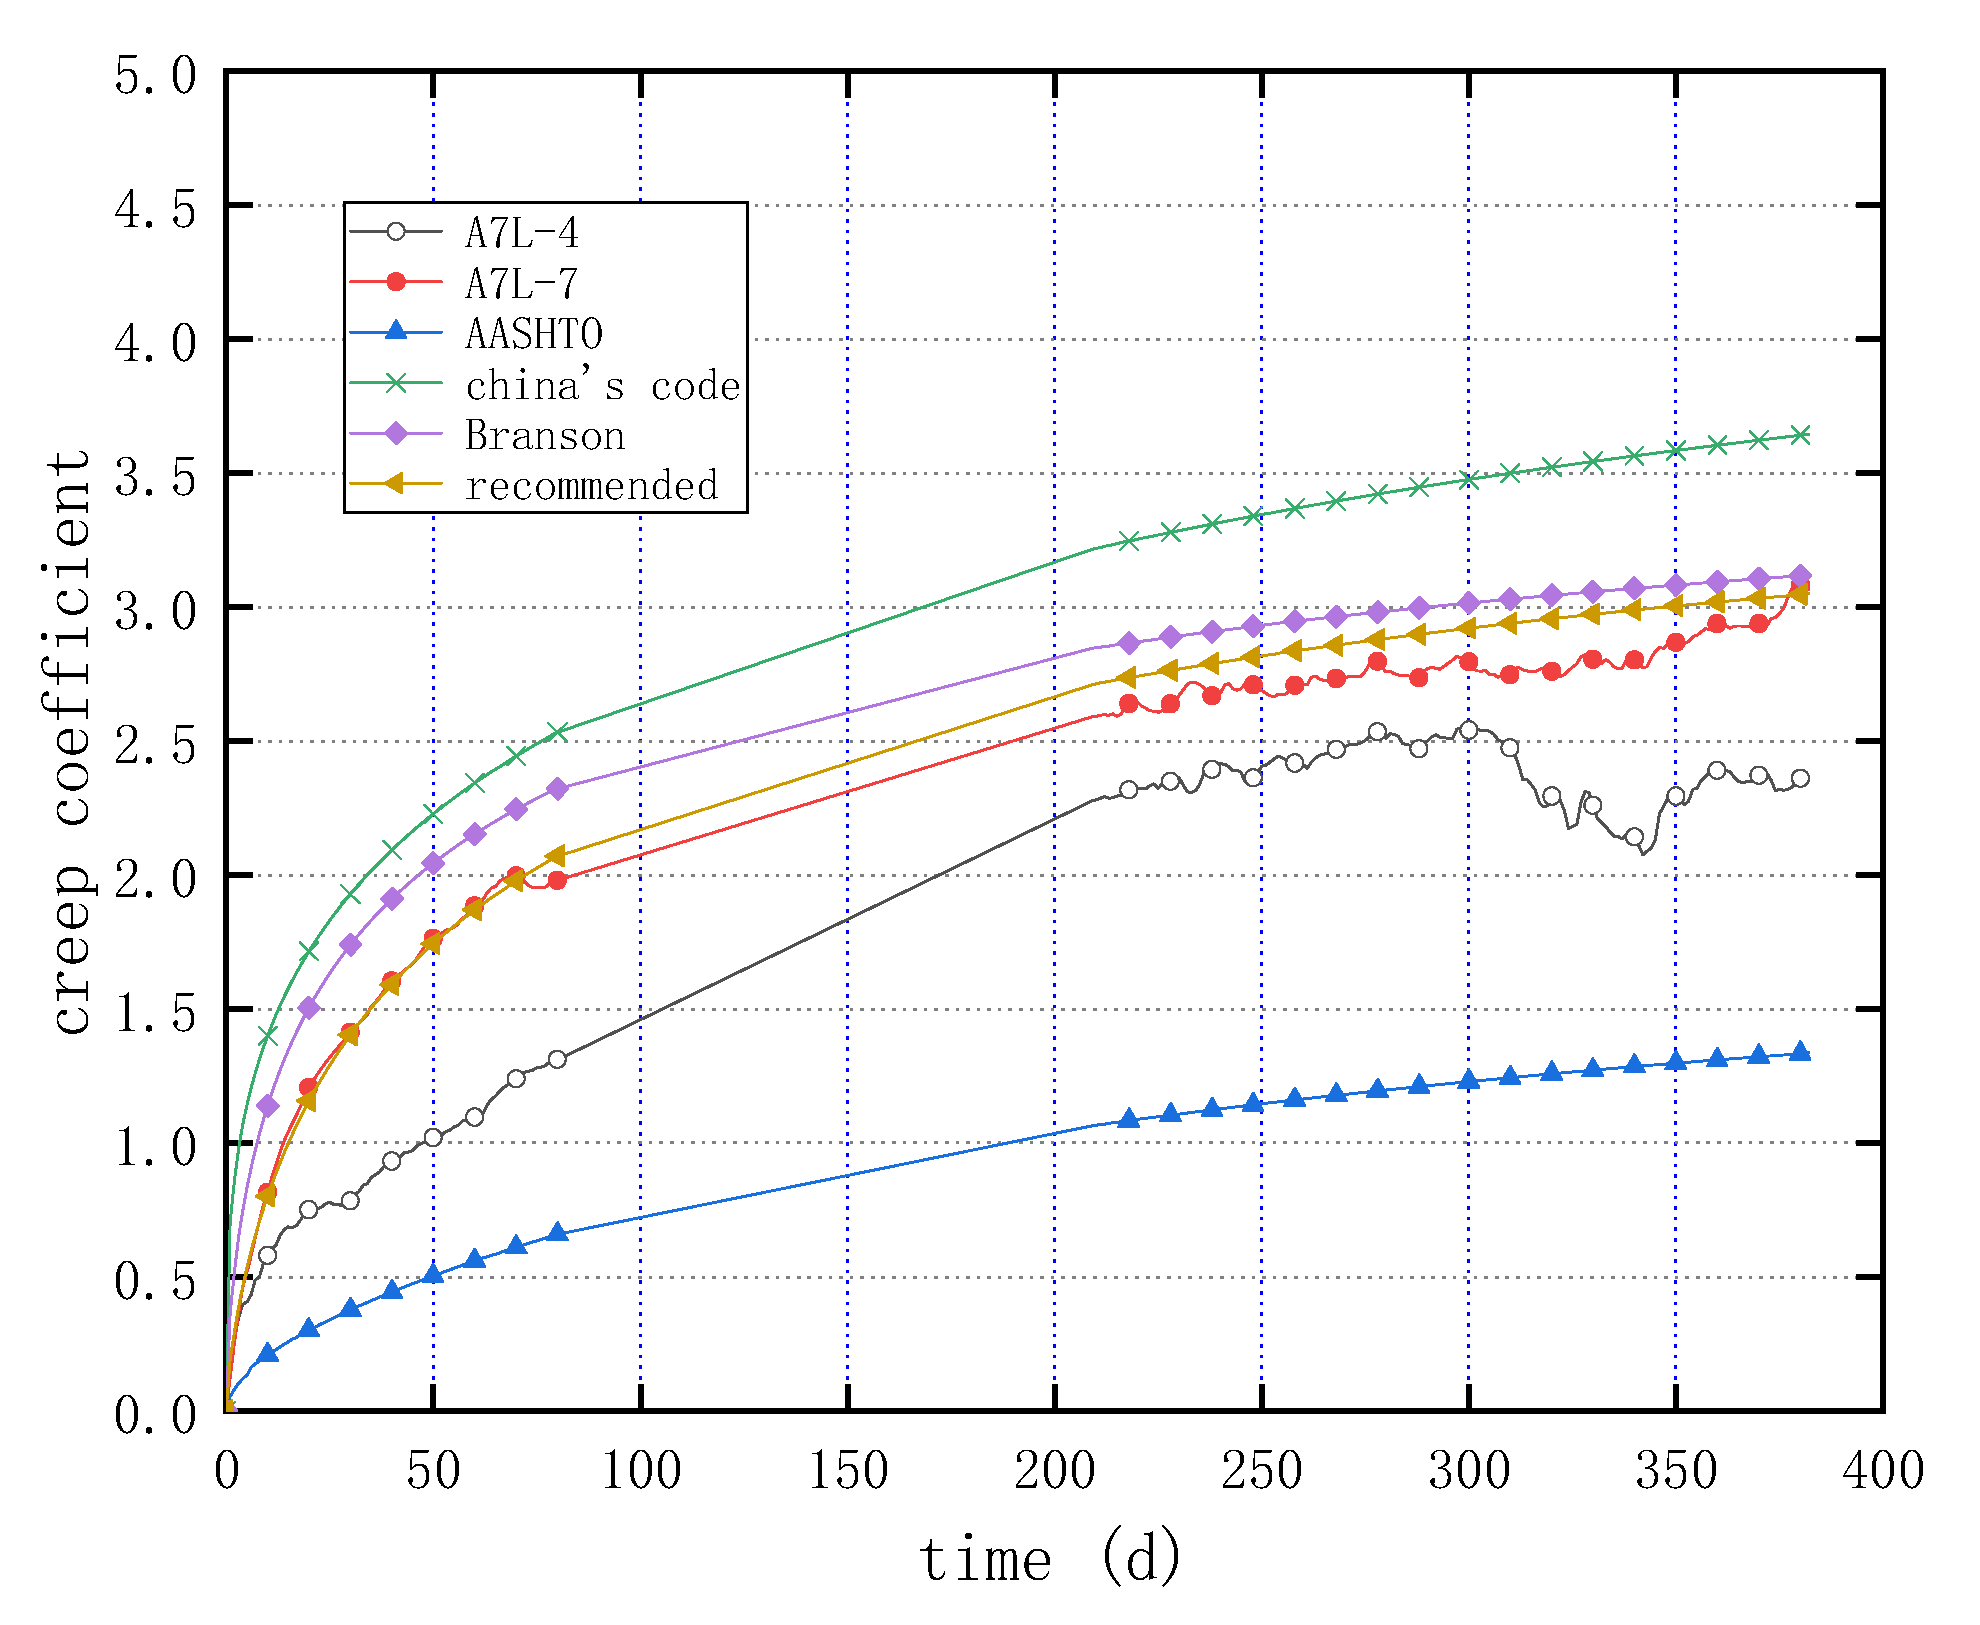
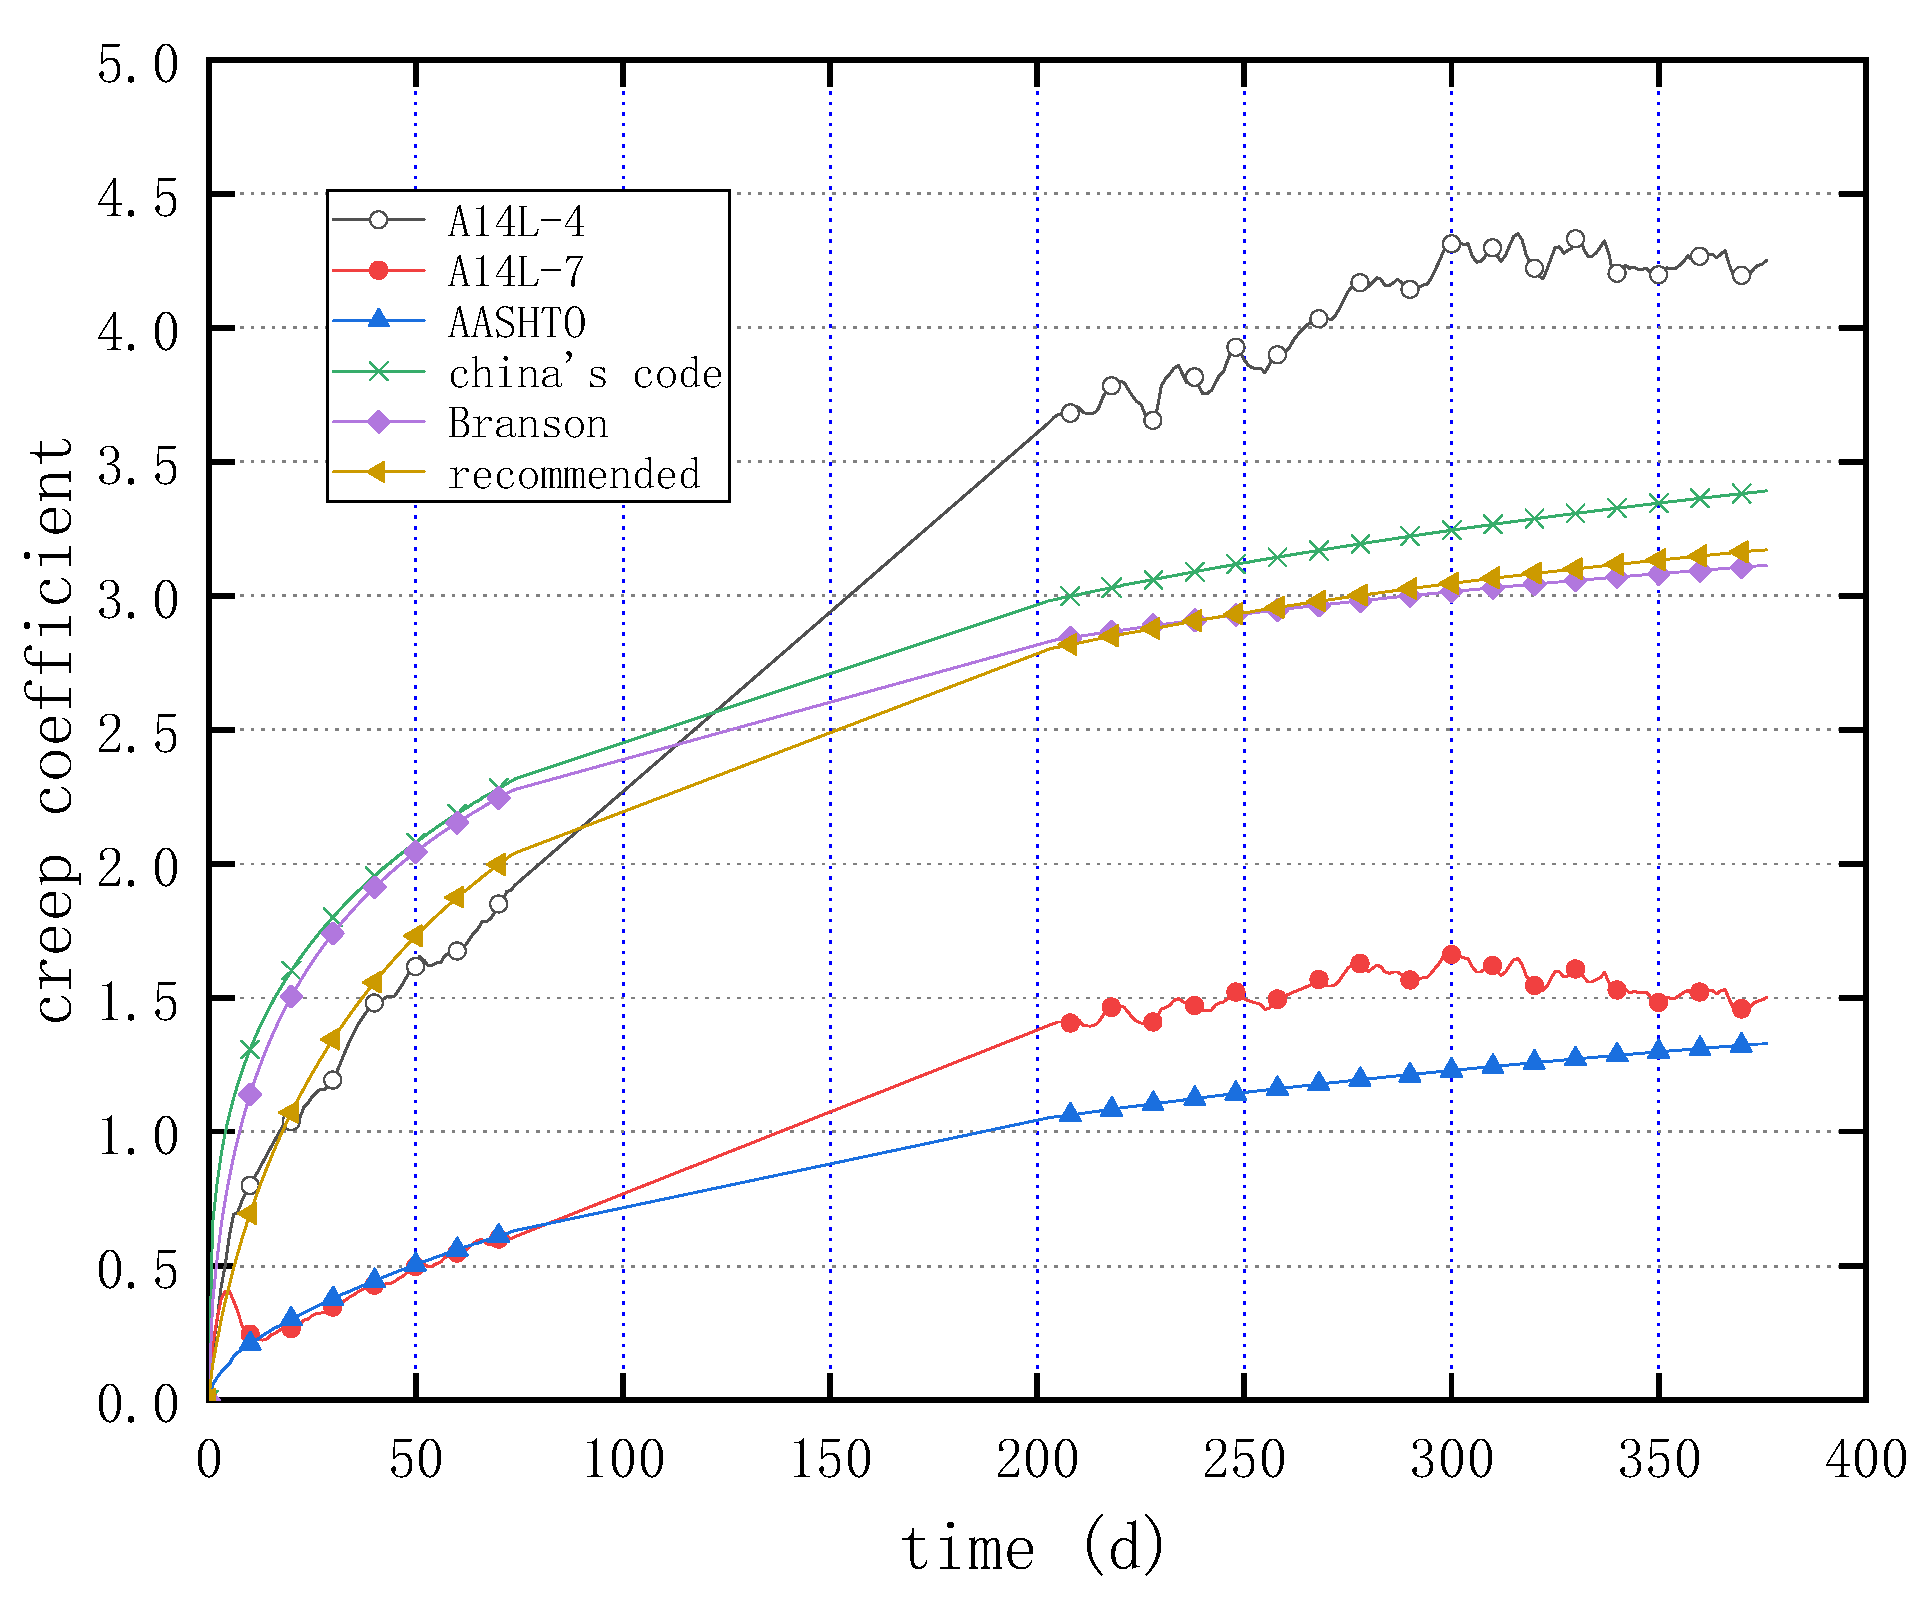
Figure 19, Figure 20 and Figure 21 demonstrate the variation of the creep coefficient change with time for 3-day, 7-day, and 14-day loading ages based on the experiment, as well as those computed according to Chinese code, AASHTO, and Branson’s formula. The results indicate that the creep values computed by the Chinese code are relatively high at loading ages of 3 and 7 days, whereas those provided by AASHTO are comparatively low. In contrast, Branson’s prediction model closely approximates the measured values of the specimen. At a loading age of 14 days, both the Chinese code and Branson’s model closely approximate the prediction model, while AASHTO’s prediction model is closest to the specimen with a loading level of 70%. Notably, AASHTO’s prediction model does not account for the effect of loading age.
Based on Branson’s formula, the suggested value of the creep coefficient can be evaluated in the following form:
where denotes the nominal creep coefficient, whose value is commonly set as 4, is a factor that relies on the environmental humidity, and represents a parameter that depends on the ratio of the cross-sectional area of the member to the length of the outer contour. The values of α and d in the above formula for concrete structures for different loading ages are given in Table 5.
4.3. Long-Term Deflection
Table 6 manifests the instantaneous deflection of the test beam at the beginning of loading and the ratio of long-term deflection to instantaneous deflection under various loading periods.
The investigation demonstrates that when utilizing the deflection after one year as the benchmark for long-term deflection, the deflection magnitudes associated with the first month, three months, and six months represent approximately 40%, 66%, and 80% of the deflection value recorded after one year, respectively. These findings align with the prevailing consensus among researchers in the field.
The effect of the loading level on long-term deflection is as follows: little difference between the results of the loading levels of 40% and 70% was observed in three-year-old specimens. When the loading age was seven days and the loading time was one year, the loading level of 40% was 1.16 times that of 70%. When the loading age was 14 days and the loading time was one year, the loading level of 40% was 1.45 times higher than that of 70%.
Based on calculations spanning five years and longer, AASHTO specifies a deflection coefficient for concrete flexural members with a reinforcement rate of 0.2%. In accordance with this guideline, the coefficient for loading periods exceeding five years is determined to be 1.8. However, this value is less than the measured values obtained for most specimens in this experiment. Given that the ambient humidity of the test specimen may be lower than that of the outdoor environment, the long-term deflection value may increase. Additionally, the long-term deflection coefficients given by the Chinese code are smaller than the experiment values. According to the results obtained from this test, it is suggested that the long-term growth coefficient of deflection is considered to be 3.0 for normal conditions, but for the early age concrete structure, this value is considered to be within the range of 5.0–6.0.
The long-term deflection and creep coefficient of concrete obtained by [24] are also larger than predicted by the current code ACI209, and the test was carried out under higher humidity.
As mentioned above, the rapid development of the economy, the continuous increase in traffic volume, and the use of early-age concrete are all big problems with respect to catching up with the construction schedule in China and even the world. However, the current regulations do not fully consider these problems, leading to the increase in late deflection of long-span bridges, affecting the safe operation of bridges. Secondly, at present, many long-term concrete performance research results are based on the material level, while there are relatively few studies based on the actual bridge component level. In this paper, a 20 m T-beam in China is taken as an object to carry out a long-term performance observation test. The results obtained can better reflect the actual working state of the structure. Due to the limitation of the number of specimens, only two load levels are considered in this paper. Therefore, the influence of load level is not considered by variables in the calculation formulas of shrinkage and creep obtained. The formulas given are mainly applicable to structures with high stress levels.
5. Conclusions
This paper presents an experimental analysis of the long-term behavior of the T beam with consideration given to age and level of loading. The findings reveal that the experimental shrinkage coefficient is less than the value predicted by AASHTO, yet higher than JTG D62-2004. Conversely, the creep coefficient shows an opposite trend, with the experimental value exceeding AASHTO’s prediction but less than that of JTG D62-2004. Both AASHTO and JTG D62-2004 underestimate the long-term deflection. In contrast, Branson’s model closely aligns with the experimental results across all parameters. Further, the recommended prediction modes are given for assessing shrinkage and creep. The main obtained results are summarized as follows:
- (1)
- Since the shrinkage values given by the AAHTO specification and by Branson deviated greatly from the measured results at the initial stage and 30 days later, the formula of the shrinkage strain was provided based on the test results to avoid underestimating or overestimating the long-term structural deformation, which can guide the structural deformation prediction at the construction and operation stages.
- (2)
- At low loading level values, the loading age exerted a substantial effect on the deflection of RC T-beams. The Chinese code [20] directly gives the long-term deflection growth coefficient without considering the effect of age. For prestressed concrete flexural members, when the deformation during the construction period needs to be calculated, the creep coefficient can be calculated considering the age, and then the long-term deflection can be calculated. However, the calculation formula of long-term deflection given by AASHTO does not consider the influence of loading age on long-term deflection.
- (3)
- The effect of the loading level on the creep was small in the initial stage of loading. As the loading time increased, the aforementioned effect of the loading level gradually became larger. The duration was longer in specimens with smaller loading ages. When the loading age was low, the influence of the load level on the long-term deflection was not significant, but it gradually increased with the rise in the loading age. At a loading age of 14 days and a loading time of 360 days, the long-term deflection of the specimen with a 70% design load was 1.5 times that of the specimen with a 40% design load. Therefore, the influence of long-term deflection on the concrete bridge with heavy traffic and weighty vehicles cannot be ignored. This may also be the reason for the collapse of many long-span concrete bridges.
- (4)
- The obtained results showed that the long-term deflection of the RC T-beam increased as the loading age magnified. This indicated that the influence of the loading age on the creep of the concrete T-beams was more pronounced for higher loading age levels. The test results revealed that for RC flexural members, the value of the long-term deflection growth coefficient specified by the current Chinese code was too low. For concrete C40 and below, the long-term deflection coefficient given by the Chinese code was 1.60. According to the AASHTO code, the long-term deflection growth coefficient of the concrete structure with a reinforcement ratio of 0.5% and a loading time of five years was exactly the same as that given by the Chinese code. The results of this paper showed that the mean value of the long-term deflection of specimens under various conditions was 2.12 at a loading time of 60 days.
- (5)
- Based on the analysis and comparison between the test results and relevant specifications, the proposed shrinkage and creep formulas as well as the long-term deflection coefficients were given. In view of the close proximity between the test results and Branson’s values, the formulas given were similar to Branson’s shrinking and creep formulas. Appropriate modifications were made to the formulas based on the present test results.
- (6)
- Finally, it should be pointed out that although this test was conducted under laboratory conditions, real-time observations of the temperature and humidity inside the concrete were performed during the test. However, significant changes occurred in the ambient temperature in the laboratory site; thus, the influence of temperature and humidity on the long-term performance of concrete has not been accurately controlled. This is also a common problem in this type of trial and is expected to be solved in the future.
Author Contributions
Conceptualization, J.Z.; Validation, S.C.; Formal analysis, P.F.; Writing—original draft, P.F.; Writing—review & editing, J.Z. All authors have read and agreed to the published version of the manuscript.
Funding
This research received no external funding.
Data Availability Statement
Not applicable.
Conflicts of Interest
The authors declare no conflict of interest.
References
- Sagara, A.; Pane, I. A Study on Effects of Creep and Shrinkage in High Strength Concrete Bridges. Procedia Eng. 2015, 125, 1087–1093. [Google Scholar] [CrossRef] [Green Version]
- Glodowski, R.J.; Hoff, G.E. Stress Relaxation of Steel Tendons Used in Prestressed Concrete under Conditions of Changing Applied Stress; ASTM special technical publications; ASTM International: West Conshohocken, PA, USA, 1979; pp. 42–58. [Google Scholar]
- Tsang, N.; England, G.L. Stress Distribution of Prestressed Concrete Structures as Influenced by Time and Temperature. Aci Spec. Publ. 2007, 246, 1–20. [Google Scholar]
- Bažant, Z.P.; Yu, Q.; Li, G.-H. Excessive Long-Time Deflections of Prestressed Box Girders. I: Record-Span Bridge in Palau and Other Paradigms. J. Struct. Eng. ASCE 2012, 138, 676–686. [Google Scholar] [CrossRef] [Green Version]
- Dong, M.Z.; Liu, A.S. Technical Measures for Control of Excessive Deflection of Girders of Long Span Continuous Rigid-Frame Bridges. Bridge Constr. 2015, 45, 71–76. [Google Scholar]
- Bažant, Z.P. Prediction of concrete creep and shrinkage: Past, present and future. Nucl. Eng. Des. 2001, 203, 27–38. [Google Scholar] [CrossRef]
- Ross, A.D. Creep and shrinkage in plain, reinforced, and prestressed concrete. A general method of calculation. J. Ice 1943, 21, 38–57. [Google Scholar]
- Acker, P.; Ulm, F.-J. Creep and shrinkage of concrete: Physical origins and practical measurements. Nucl. Eng. Des. 2001, 203, 143–158. [Google Scholar] [CrossRef]
- Deng, Z.C.; Xu, H.B.; Li, H.; Tong, B.; Zhao, S.-C. Creep law of high-performance concrete. J. Beijing Univ. Technol. 2013, 39, 897–901. [Google Scholar]
- ACI Cotnmlttee 209; Prediction of Creep, Shrinkage and Temperature Effects in Concrete Structures (ACI209-82). American Concrete Institute: Farmington Hills, MI, USA, 1990.
- ACI 435; Control of Deflection in Concrete Structures. American Concrete Institute: Farmington Hills, MI, USA, 1995.
- Bažant, Z.P. Prediction of Concrete Creep Effects Using Age-Adjusted Effective Modulus Method. ACI J. 1972, 69, 212–217. [Google Scholar]
- Scheiner, S.; Hellmich, C. Continuum Microviscoelasticity Model for Aging Basic Creep of Early-Age Concrete. J. Eng. Mech. ASCE 2009, 135, 307–323. [Google Scholar] [CrossRef]
- Liu, J.; Shi, C.; Farzadnia, N.; Ma, X. Effects of pretreated fine lightweight aggregate on shrinkage and pore structure of ultra-high strength concrete. Constr. Build. Mater. 2019, 204, 276–287. [Google Scholar] [CrossRef]
- Aili, A.; Vandamme, M.; Torrenti, J.-M.; Masson, B. A viscoelastic poromechanical model for shrinkage and creep of concrete. Cem. Concr. Res. 2020, 129, 105970. [Google Scholar] [CrossRef]
- Yang, I.H. Uncertainty and updating of long-term prediction of prestress forces in PSC box girder bridges. Comput. Struct. 2005, 83, 2137–2149. [Google Scholar] [CrossRef]
- Křístek, V.; Vráblík, L.; Bazant, Z.P.; Li, G.H.; Yu, Q. Misprediction of long-time deflections of prestressed box girders: Causes, remedies and tendon layout effect. In Proceedings of the 8th International Conference on Creep, Shrinkage and Durability Mechanics of Concrete and Concrete Structures, Ise-Shima, Japan, 30 September–2 October 2008. [Google Scholar]
- Nehdi, M.; Soliman, A.M. Early-age properties of concrete: Overview of fundamental concepts and state-of-the-art research. Proc. Inst. Civ. Eng. Constr. Mater. 2011, 164, 57–77. [Google Scholar] [CrossRef]
- JTG D60-2015; General Specification for Design of Highway Bridges and Culverts. People’s Communications Publishing House: Beijing, China, 2015.
- JTG D62-2004; Code for Design of Reinforced Concrete and Prestressed Concrete Bridges and Culverts for Highways. People’s Communications Publishing House: Beijing, China, 2004.
- AASHTO LRFD Bridge Design Specifications, 6th ed.; American Association of State Highway and Transportation Officials: Washington, DC, USA, 2012.
- Brason, D.E. Compression Steel Effect on Long-term Deflections. ACI J. 1971, 9, 555–559. [Google Scholar]
- Kim, S.-G.; Park, Y.-S.; Lee, Y.-H. Comparison of Concrete Creep in Compression, Tension, and Bending under Drying Condition. Materials 2019, 12, 3357. [Google Scholar] [CrossRef] [PubMed] [Green Version]
- Li, P.; He, S. Effects of Variable Humidity on the Creep Behavior of Concrete and the Long-Term Deflection of RC Beams. Adv. Civ. Eng. 2018, 2018, 8301971. [Google Scholar] [CrossRef] [Green Version]
Figure 1.
Dimensions and reinforcement arrangement of the concrete T-beam.

Figure 2.
Loading diagram of the specimens.

Figure 3.
Layout of the displacement measuring points.

Figure 4.
Time-history plots of the temperature and humidity of the atmosphere of the laboratory room.
Figure 4.
Time-history plots of the temperature and humidity of the atmosphere of the laboratory room.

Figure 5.
Time-history plots of the temperature inside the T-beam specimen.

Figure 6.
Time-history plots of the shrinkage strain of various T-beam specimens (including temperature and humidity effects).
Figure 6.
Time-history plots of the shrinkage strain of various T-beam specimens (including temperature and humidity effects).

Figure 7.
Time-history plots of the shrinkage strain of various specimens (excluding the temperature effect).
Figure 7.
Time-history plots of the shrinkage strain of various specimens (excluding the temperature effect).

Figure 8.
Time-history plots of the creep strain for three loading ages and the load level of 40%.

Figure 9.
Time-history plots of the creep strain for three loading ages and the load level of 70%.

Figure 10.
Evolution of reinforcement strain in the compression zone of the RC T-beam for two loading levels (loading age of 3 days).
Figure 10.
Evolution of reinforcement strain in the compression zone of the RC T-beam for two loading levels (loading age of 3 days).

Figure 11.
Evolution of reinforcement strain in the compression zone of the RC T-beam for two loading levels (loading age of 7 days).
Figure 11.
Evolution of reinforcement strain in the compression zone of the RC T-beam for two loading levels (loading age of 7 days).

Figure 12.
Evolution of reinforcement strain in the compression zone of the RC T-beam for two loading levels (loading age of 14 days).
Figure 12.
Evolution of reinforcement strain in the compression zone of the RC T-beam for two loading levels (loading age of 14 days).

Figure 13.
Evolution of the long-term deflection of concrete T-beam specimens at various loading ages (40% loading level).
Figure 13.
Evolution of the long-term deflection of concrete T-beam specimens at various loading ages (40% loading level).

Figure 14.
Evolution of the long-term deflection of concrete T-beam specimens at various loading ages (70% loading level).
Figure 14.
Evolution of the long-term deflection of concrete T-beam specimens at various loading ages (70% loading level).

Figure 15.
Evolution of the long-term deflection of concrete T-beam specimens for two load levels (loading age of 3 days).
Figure 15.
Evolution of the long-term deflection of concrete T-beam specimens for two load levels (loading age of 3 days).

Figure 16.
Evolution of the long-term deflection of concrete T-beam specimens for two load levels (loading age of 7 days).
Figure 16.
Evolution of the long-term deflection of concrete T-beam specimens for two load levels (loading age of 7 days).

Figure 17.
Evolution of the long-term deflection of concrete T-beam specimens for two load levels (loading age of 14 days).
Figure 17.
Evolution of the long-term deflection of concrete T-beam specimens for two load levels (loading age of 14 days).

Figure 18.
Shrinkage strain curves since loading based on AASHTO, Branson, Chinese code, the recommended, and tested value.
Figure 18.
Shrinkage strain curves since loading based on AASHTO, Branson, Chinese code, the recommended, and tested value.

Figure 19.
Evolution of creep coefficients of specimens via various approaches (loading age of 3 days).
Figure 19.
Evolution of creep coefficients of specimens via various approaches (loading age of 3 days).

Figure 20.
Evolution of creep coefficients of specimens via various approaches (loading age of 7 days).
Figure 20.
Evolution of creep coefficients of specimens via various approaches (loading age of 7 days).

Figure 21.
Evolution of creep coefficients of specimens via various approaches (loading age of 14 days).
Figure 21.
Evolution of creep coefficients of specimens via various approaches (loading age of 14 days).


Table 1.
The mechanical properties of variously used reinforcements.
| Steel Types | Strength (Mpa) | Modulus of Elasticity (MPa) |
|---|---|---|
| R235 | 235 | |
| HRB335 | 335 |
Table 2.
The main loading parameters of the T-beam specimens.
| NO | Specimen ID | Loading Age (d) | Load Level |
|---|---|---|---|
| 1 | A3L-4 | 3 | 0.4 |
| A7L-4 | 7 | ||
| A14L-4 | 14 | ||
| 2 | A3L-7 | 3 | 0.7 |
| A7L-7 | 7 | ||
| A14L-7 | 14 | ||
| 3 | SHC3 | Beam for shrinkage test | |
| 4 | 150 mm × 150 mm × 3000 mm |
Table 3.
Shrinkage strains at different times.
| Test Time (d) | Shrinkage Strain | ||||
|---|---|---|---|---|---|
| Specimen 1 | Specimen 2 | Specimen 3 | T-Beam SHC3 | Average Value | |
| 30 | 254 | 268 | 286 | 278 | 272 |
| 60 | 291 | 309 | 334 | 321 | 314 |
| Max | 460 | 482 | 520 | 529 | 498 |
Table 4.
Creep strains of various specimens based on the test and the proposed formula at different times.
Table 4.
Creep strains of various specimens based on the test and the proposed formula at different times.
| Specimens | Calculated Immediate Strain (εμ) | Measured Immediate Strain (εμ) | 30 d | 60 d | 90 d | 360 d | |
|---|---|---|---|---|---|---|---|
| A3L-4 | 62 | 41 | 68 | 0.4 | 0.8 | 1.0 | 1.9 |
| A7L-4 | 62 | 23 | 50 | 0.8 | 1.1 | 1.4 | 2.3 |
| A14L-4 | 62 | 21 | 48 | 1.2 | 1.6 | 2.2 | 4.2 |
| A3L-7 | 84 | 53 | 80 | 0.3 | 0.5 | 0.7 | 1.5 |
| A7L-7 | 84 | 39 | 66 | 1.4 | 1.9 | 2.1 | 2.9 |
| A14L-7 | 84 | 26 | 53 | 0.3 | 0.5 | 0.7 | 1.5 |
Table 5.
The values of α and d for various loading ages.
| Loading Age | d | |
|---|---|---|
| 3d | 0.65 | 10 |
| 7d | 0.70 | 20 |
| 14d | 0.80 | 30 |
Table 6.
Comparison between the theoretical deflection and measured deflections after long-term deformation.
Table 6.
Comparison between the theoretical deflection and measured deflections after long-term deformation.
| Specimens | Calculated Immediate Deflection (mm) | Measured Immediate Deflection (mm) | 30 d | 60 d | 90 d | 180 d | 360 d |
|---|---|---|---|---|---|---|---|
| A3L-4 | 1.026 | 1.068 | 2.5 | 3.2 | 3.7 | 4.6 | 6.0 |
| A7L-4 | 1.026 | 1.187 | 1.8 | 2.3 | 2.7 | 3.2 | 3.7 |
| A14L-4 | 1.026 | 1.202 | 0.8 | 1.5 | 1.8 | 2.3 | 3.3 |
| A3L-7 | 1.612 | 2.1449 | 1.3 | 1.8 | 2.1 | 2.6 | 3.2 |
| A7L-7 | 1.612 | 2.0359 | 1.3 | 1.8 | 2.1 | 2.4 | 2.9 |
| A14L-7 | 1.612 | 1.4799 | 1.6 | 2.1 | 2.4 | 2.8 | 3.4 |
Disclaimer/Publisher’s Note: The statements, opinions and data contained in all publications are solely those of the individual author(s) and contributor(s) and not of MDPI and/or the editor(s). MDPI and/or the editor(s) disclaim responsibility for any injury to people or property resulting from any ideas, methods, instructions or products referred to in the content. |
© 2023 by the authors. Licensee MDPI, Basel, Switzerland. This article is an open access article distributed under the terms and conditions of the Creative Commons Attribution (CC BY) license (https://creativecommons.org/licenses/by/4.0/).
Share and Cite
MDPI and ACS Style
Zhang, J.; Fan, P.; Cheng, S. Experimental Study on Long-Term Performance of Concrete T-Beam. Buildings 2023, 13, 1005. https://doi.org/10.3390/buildings13041005
AMA Style
Zhang J, Fan P, Cheng S. Experimental Study on Long-Term Performance of Concrete T-Beam. Buildings. 2023; 13(4):1005. https://doi.org/10.3390/buildings13041005
Chicago/Turabian StyleZhang, Jinquan, Ping Fan, and Shoushan Cheng. 2023. "Experimental Study on Long-Term Performance of Concrete T-Beam" Buildings 13, no. 4: 1005. https://doi.org/10.3390/buildings13041005
Note that from the first issue of 2016, this journal uses article numbers instead of page numbers. See further details here.