
An Insight into the Suitability of Clayey Raw Materials: The Ceramic Provinces of the Northern Peloponnese and South Epirus, Greece


1
Department of Geology, University of Patras, Rio, 265 04 Patras, Greece
2
Laboratory of Electron Microscopy and Microanalysis, School of Natural Sciences, University of Patras, Rio, 265 04 Patras, Greece
*
Author to whom correspondence should be addressed.
Buildings 2023, 13(2), 473; https://doi.org/10.3390/buildings13020473
Submission received: 7 December 2022
/
Revised: 3 February 2023
/
Accepted: 7 February 2023
/
Published: 9 February 2023
(This article belongs to the Section Building Materials, and Repair & Renovation)
Abstract
:Corinth, Achaea in the northern Peloponnese, and Nicopolis in Epirus (Greece) have a strong archaeological record of ceramic production, from the Early Helladic to Late Roman periods. Important archaeological sites, such as Helike, Aigeira, the settlement of Derveni, and the cities of Patras and Nicopolis, offer data and findings of exceptional quality. One of the main pillars for the development of the ceramic production in these areas was the availability of local natural resources, among which are the clayey sedimentary deposits that outcrop in the area. This study investigates the physical-technological properties (plasticity and granulometry), the mineralogical composition of clayey raw materials, in order to test their suitability for ceramic production across the entire geographic area. Our aim was to differentiate the three main “ceramic” provinces, based upon the above-mentioned properties. New data from western Achaea and south Epirus are presented and compared with previous research conducted in Corinthia and eastern Achaea. The results obtained showed that the clays sampled from Corinthia and eastern Achaea are carbonatic materials of poor plasticity, whereas those from western Achaea and Epirus are either Ca-rich or Ca-poor materials, with the majority exhibiting a better plasticity. The results from this study are expected to constitute an important archaeometric tool for tackling archaeological issues by means of provenance and ceramic technology within the region and in the surrounding areas.
1. Introduction
Achaea is a province located in the western part of the northern Peloponnese, and according to the Greek geographer Pausanias, was extended from river Sythas in the east (Paus. VII, 27.12) to the river Larisos in the west (Paus. VII, 17.5). The province of Achaea was divided into two regions (eastern and western) since the Middle Neolithic Period and from the Early Helladic II (EH II) period, based upon archaeological findings [1]. During this period, inhabitants from two different directions arrived and created settlements. One route was the Corinthian Isthmus and the other the Antirio-Rio, having the mountain of Panachaicos as a natural barrier. During the Early Geometric Period (900–850 BCE), several examples show that Eastern Achaea was influenced by Argolid and Corinthia. According to Gadolou [2], Corinth continued the imports in eastern Achaea into the Late Geometric Period (760–700 BCE) as well. One of the abovementioned examples is the crater-shaped wine-cup skyphos, a common type of pottery in Derveni and Argolid, or the black-painted skyphos, a common type in Neos Erineos of Aigialeia and Corinth, but also in one site in western Achaea [1,2]. Western Achaea seems to have contacts during the Geometric Period with Cephalonia, Ithaca, Aetolia, Elis, and Messenia, since common characteristics of all these regions are shown in their vases.
During the Mycenaean Period (1600 to 1100 B.C.), according to Papadopoulos [3], the pottery from all the Mycenaean sites of Achaea shows clear differentiation between western (WA) and eastern Achaea (EA), and especially in Aigion, considering once again the Mt. Panachaicos border as a cause of this differentiation [3].
Focusing on the WA, the most well-known city and the area that was firstly inhabited in the 3rd millennium BC is Patras. However, the city of Patras flourished during the Mycenean period (1600–1100 B.C.). There is not enough evidence about the Geometric and Archaic Periods (800–500 B.C.), but it seems that Patras starts to become a city during the classical period. Later in the Roman period, the city reaches the highest peak when the port becomes the major communication hub of Greece with Italy, while the port of Corinth had been destroyed. Furthermore, the foundation of a Roman colony by Augustus in Patras contributes even more to the flourishing of the city [4]. During the Roman Empire, significant constructions and architectural models built with fired bricks dominated. Several workshops for tiles and fired bricks, dating in Roman period, have been discovered in Patras, proving the vast production and supply of these materials [5].
In south Epirus, many archaeological sites of interest and possible centers of ceramic production are met. Some of these are the Roman ancient city of Nicopolis, which is located close to Preveza. Ancient Nicopolis is considered a symbol of Emperor Octavius’ victory against Marcus Antonius and Queen Cleopatra VII of Egypt, in the naval battle of Actium (31 B.C.). Moreover, it was the control center of western Greece across the city of Patras. The two cities were connected commercially, since products of Patras, e.g., oil lamps, have been found in Nicopolis [6]. The archaeometric studies which are found in the literature regarding pottery from western Achaea and south Epirus are few [7], whereas from Eastern Achaea, only the analysis of Early Heladic II–III pottery from the Ancient city of Helike has been recorded [8,9,10,11].
The present study is actually the sequel of a previous research in the northern Peloponnese, and specifically in Corinthia (C), Xylokastro (X), and eastern Achaea (EA) [10,12]. In the present paper, the research is extended in new regions, with western Achaea (WA) and south Epirus (SE) aiming to complete the characterization of the clayey raw materials concerning their suitability for ceramic manufacturing. The new results will be compared and correlated with the obtained data from the characterization of the samples collected from western Achaea (WA) and south Epirus (SE). Furthermore, the possible differences among the studied regions and the discovery of potential clayey raw materials for ceramic production will possibly trigger similar research in the neighboring regions.
2. Sampling and Geological Setting
2.1. Geological Setting
The area of south Epirus (including the prefecture of Aetoloacarnania) consists mainly of formations of the External Hellenides that include the Ionian, Gavrovo-Tripoli, and Olonou-Pindos zones (alpine formations). These geotectonic zones are mainly represented by carbonate rocks and formations of Triassic to Eocene age, and show a significant development of the flysch formation. The typical stratigraphic sequence consists of the evaporitic series (not present in all zones) and Triassic breccia, the carbonate series of Upper Triassic-Eocene age and flysch. The evaporitic series of the Ionian zone consists of gypsum deposits and anhydrite. The Triassic breccia are mainly composed of limestone-dolomite with the intercalations of dark-black limestone, gypsum, and anhydrite. They have a significant surface occurrence and extend into the Ambracian gulf. The carbonate sequence begins with Jurassic limestones and cherts. They occur in extended outcrops of medium-thick-bedded limestones, which in places become dolomitic. The stratigraphy of the Ionian zone ends with the formation of flysch, which consists mainly of fine-grained sediments such as siltstones, shales, sandstones, and to a lesser extent conglomerate. This formation has a large growth and thickness in the eastern part of the zone.
In the regions of Amfilochia, Vonitsa, and Palairos, the formations of the Alpine basement belong to the Ionian zone and consist of upper Eocene-lower Miocene flysch, which consists of thin-layered marly clay horizons wherein the raw materials were detected. Similarly, clayey sediments were recognized in Holocene deposits that are formations, such as [13,14] (Figure 1):
- Recent deposits: conglomerates of various sized gravels, sands, clay-sandy materials, clays, and dark-colored muds.
- Recent shoals and marshy deposits: silts and clayey-sandy deposits of gray-black color due to the contained organic matter. In places, marsh deposits compose of brownish-black loamy clays.
- Recent talus cones that develop at torrent estuaries and slopes. The sediments dating from the Upper Miocene to Pleistocene include the following formations, from the youngest to the oldest:
- ▪
- Old talus cones, which consist of calcareous breccia, connected with calcareous matrix. Their deeper members are intercalated with layers of reddish-brown clay.
- ▪
- Brown-red coarse-grained sands, with intercalations of clayey sands.
- ▪
- Reddish breccia and conglomerate of limestone and chert with calcareous and clayey matrix.
- ▪
- Lacustrine brackish and marine sediments: the deeper members are composed of lacustrine yellowish clayey marls and grey-black clays with thin lignite layers. These sediments transition upwards to brown-colored materials with cherty breccias, sands, cobbles, and sandstones.
- ▪
- Clay-sandstone-conglomerates: marine deposits in which brackish and lacustrine sediments are intercalated. The lower members start with calcarenites and transition upwards to alternations of sandy clays and yellowish sands.
In western Achaea, the Ionian zone outcrops over a limited area, due to the coverage by the Neogene and Quaternary deposits, and is limited to the north-western part of the prefecture, in the broader area of Araxos. The lithostratigraphic structure of the zone is described in the geological sheet “N. Manolada” of IGME, and is composed mainly of limestones and flysch. At the southwestern end of the prefecture, the sedimentary series of the Gavrovo-Tripoli zone develops (Figure 2). The zone is mainly structured by dolomites and limestones of different geological ages, as well as Oligocene and Eocene flysch.
The central and mainly eastern most mountainous part of Achaea is occupied by the thick lithological sequence of the Olonos-Pindos Zone, which is composed of limestones and flysch of different periods and radiolarites. Regarding Neogene and Quaternary deposits that outcrop in the studied area, their main characteristic is frequent lithological change, both horizontally and vertically. They include marine, lagoonal, lacustrine, or even terrestrial sediments, and develop on the surface in a significant area of the western part of the prefecture of Achaia. Holocene deposits consist mainly of: (1) sands, (2) recent deposits and alluvial formations, (3) lagoonal deposits, which consist of silt and clayey materials, and (4) Quaternary deposits, which consist of unconsolidated conglomerates, in some cases intercalated with reddish sand.
In more detail and concerning the Pleistocene and Pliocene deposits, in the easternmost part of the area, blue and argillaceous clays of undivided Plio-Pleistocene age appear. Further west are Pleistocene deposits consisting mainly of: (1) the red argillaceous sand found over a larger area in the western-most part of Achaea and from the Valmi formation. The latter consists of the following sediment types: (1) brown to green clay alternations, (2) white to yellow sands and silts, and (3) consolidated or loose clayey marls.
2.2. Sampling Criteria
The selection of locations for the collection of the clayey raw materials was based on the geological formations, studying the relevant literature [13,14,15,16,17,18,19,20,21,22], and taking into consideration the distance to archaeological sites or potential production centers (ancient Helike, city of Patras, ancient Palairos, Thermos site, ancient Nicopolis). The sampling strategy was designed in such a way to cover a wide area from western Achaea and south Epirus. Specifically, it started from the region of Aigialeia to the region Araxos (western Achaea) and Kleitoria (south-eastern part of Achaea), and from the northern part of Aetolia-Acarnania (Palairos, Vonitsa, Aktio) to the south part of Epirus (Nikopolis and Preveza to Vonitsa and Amfilochia). Sampling was performed on clayey-rich outcrops dating from different ages. In Table 1, the geological formations are presented, along with the collected and studied samples, as well as the age and the sampling locations. For more information for the samples EA, C, and X, see in Xanthopoulou et al. [10].
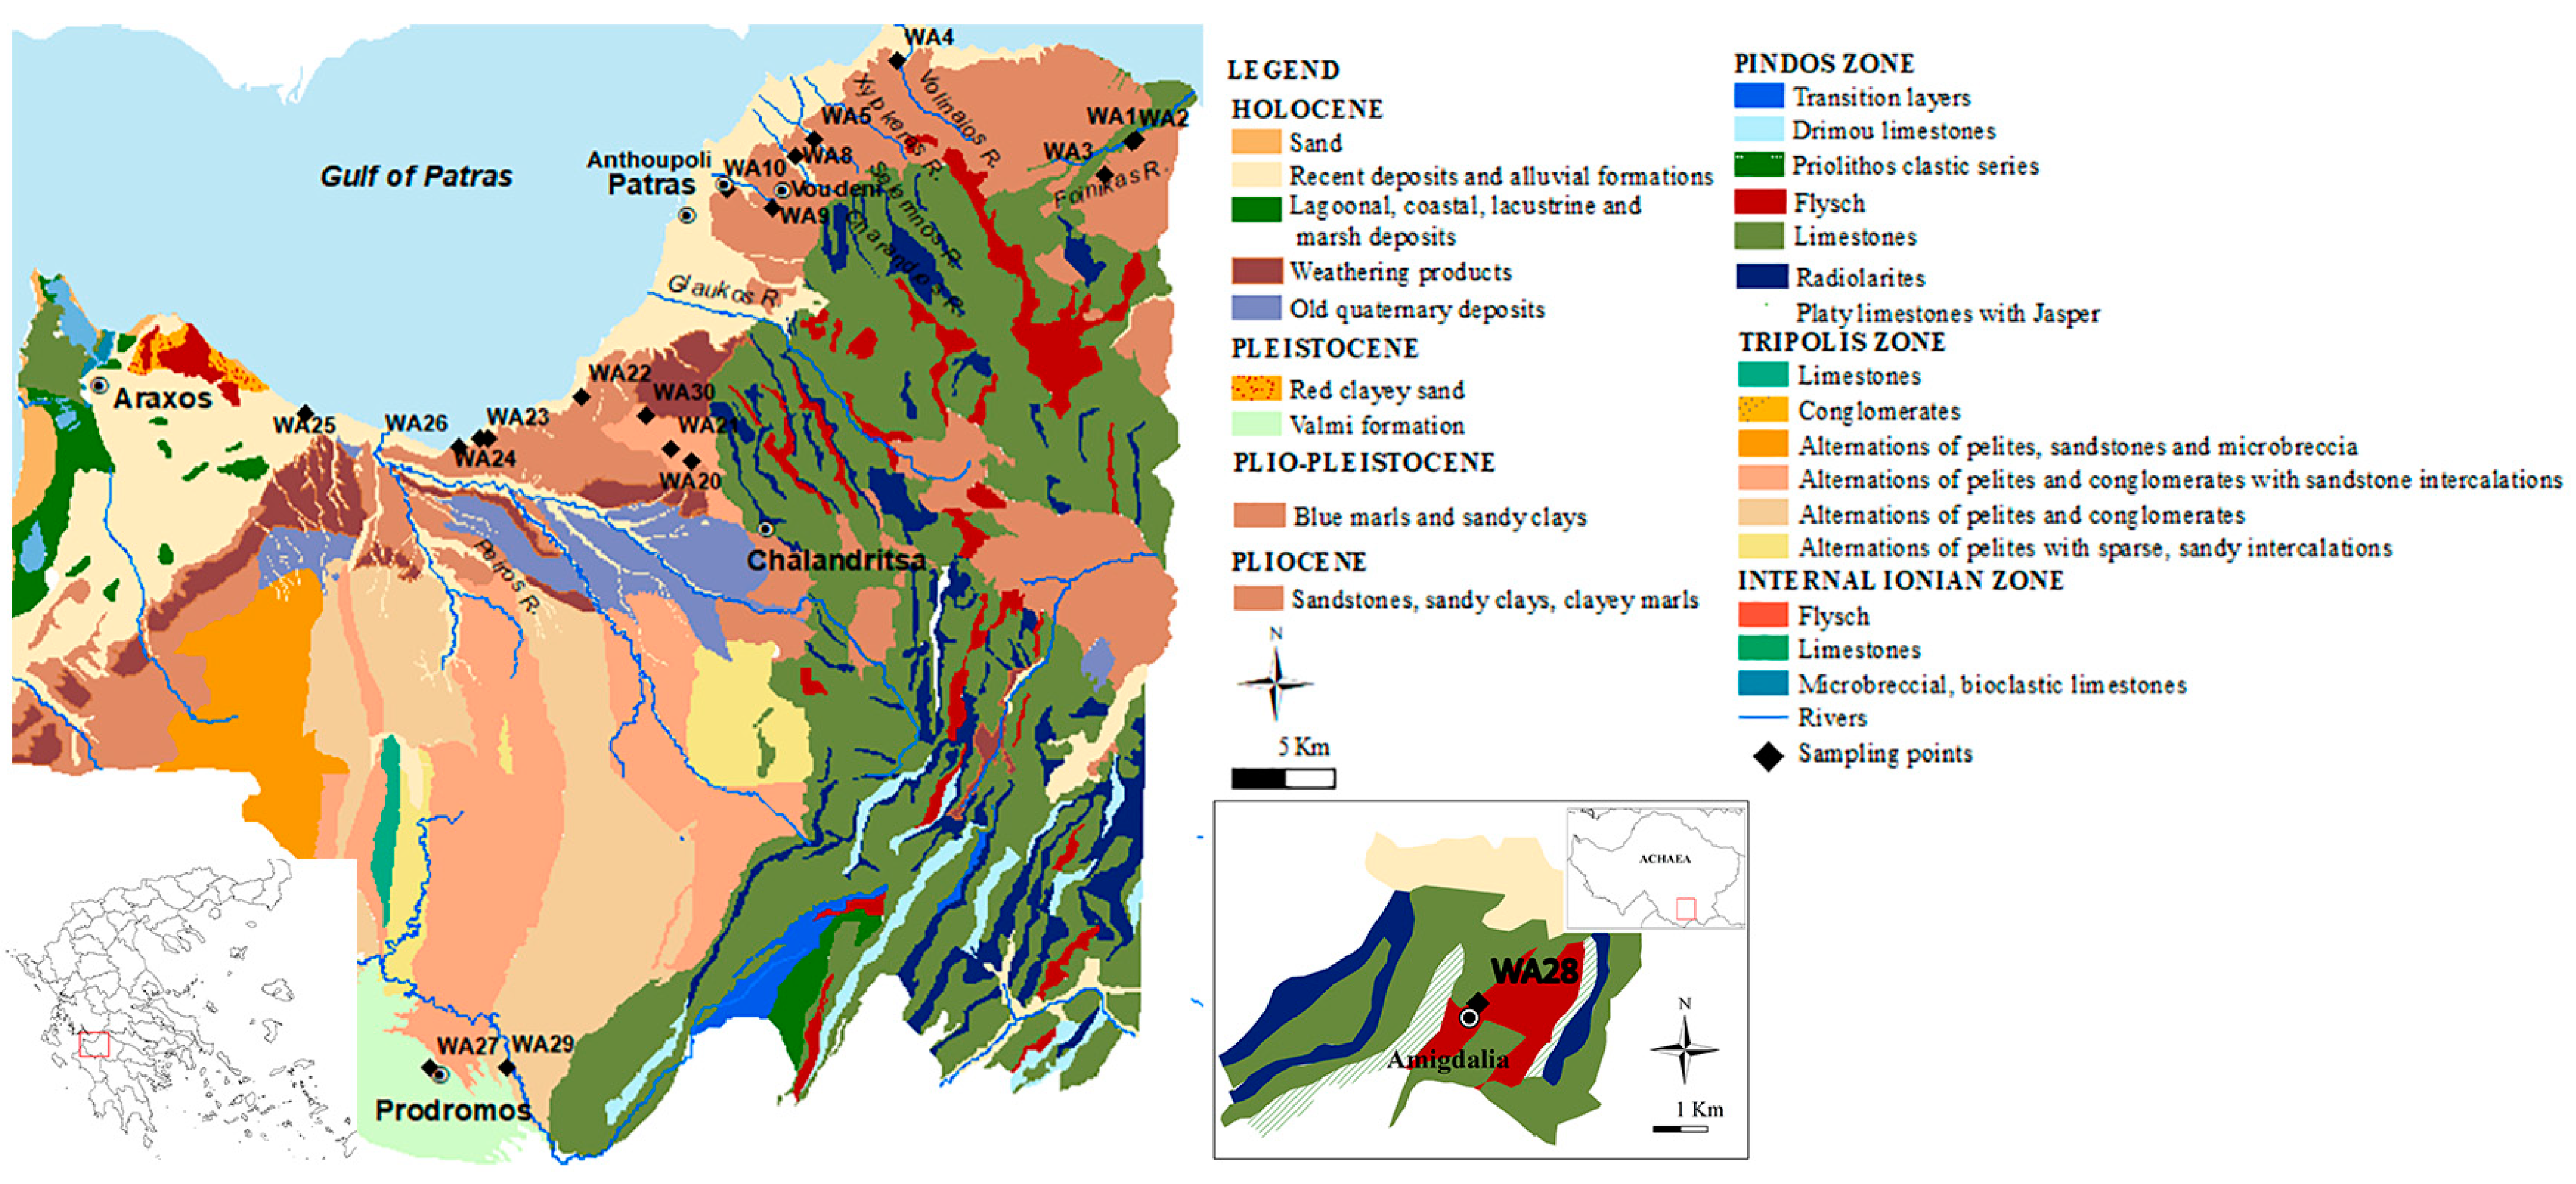
In the case of western Achaea, the samples WA1, WA2, and WA3 were collected from or close to the riverbank of Foinikas, the samples WA7 and WA8 from the torrent Charandros, and the sample WA9 from an outcrop close to the Mycenean cemetery of the region Vounteni (Figure 1). All comprise Plio-Pleistocene blue marls and sandy clay deposits. The samples WA4 and WA5 come from alluvial deposits dated to the Holocene and were collected from Volinaios and Selemnos rivers, respectively. Likewise, the sample WA10 comes from a Holocene deposit which is located in the region Anthoupoli (Figure 1). Near the aforementioned samples, the ancient city of Helike is located, which is considered a ceramic production center [8,9,10,11], whereas all are located to the east of the city of Patras. Towards the western part of Achaea and west of the city of Patras, the samples WA22–WA27 and WA30 were collected along the coastline from Holocene and Pliocene deposits that are alluvial formations and intercalations of sandstones, sandy clays, and clayey marls. The sample WA21 was collected from a large formation dating at the Upper Eocene-Oligocene and is characterized by alternations of mudstone and conglomerate with sandstone intercalations. From a formation of same age, but far away from the sample WA21, another deposit of blue mudstones was detected and sampled (WA29). Finally, sample WA28 was collected in the region Amygdalia from the flysch dated to the lower Paleocene-Eocene, and is composed of sandstones and shales.
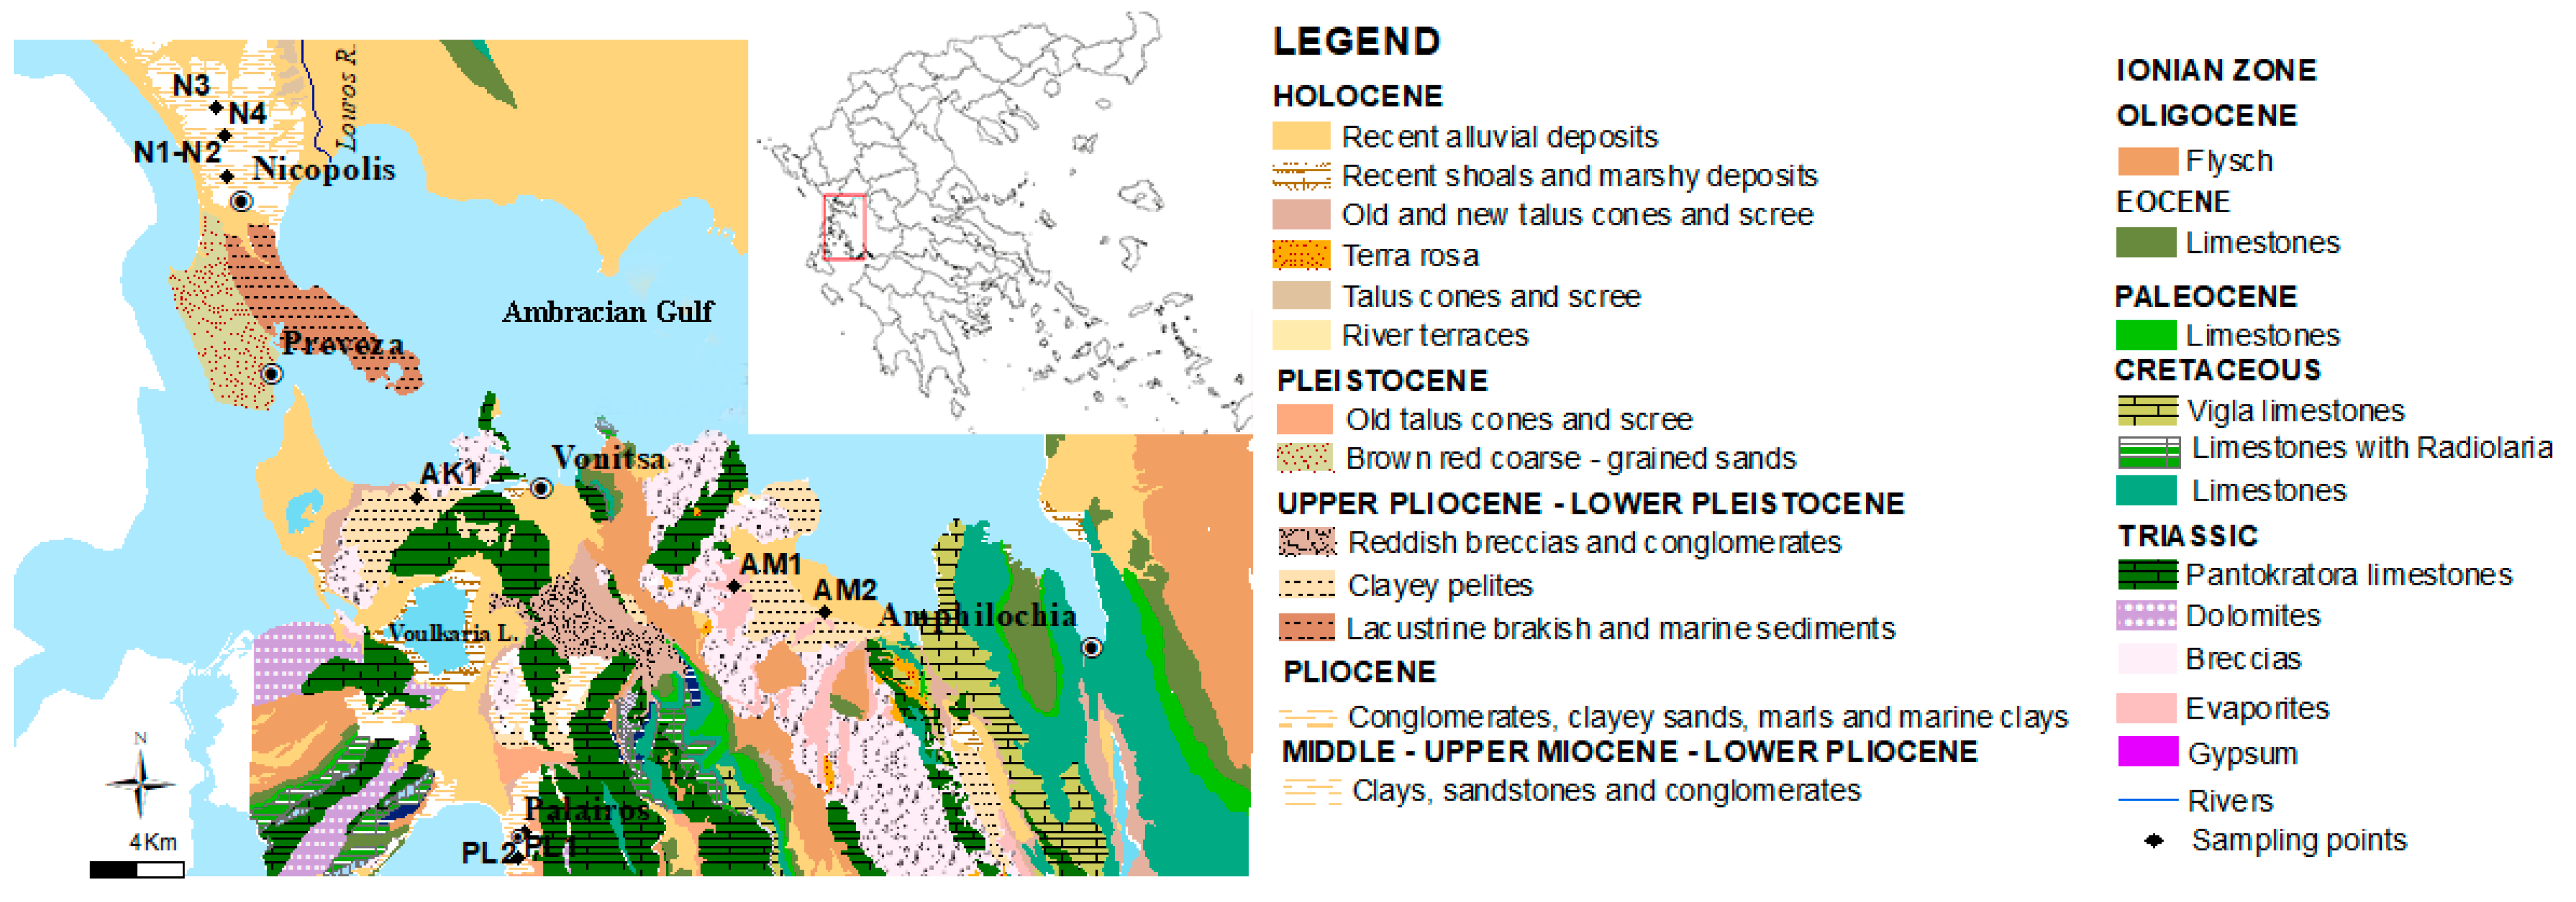
A similar sampling strategy was adopted at South Epirus and at all the regions to the south of Epirus. Thus, for simplicity, all of the samples recorded (PL1, PL2, Ak1, V1, V2, N1, N2, N3, N4, GR1, AM1, and AM2) in this area are considered as samples of south Epirus. The samples PL1 and PL2 were collected in the area of Palairos (Figure 2). Specifically, they were taken from clayey layers embedded in conglomerates and sandstones dating to the Middle-Upper Miocene-Lower Pliocene. The samples AM1 and AM2 were collected in Amfilochia from clayey mudstones, in contact with evaporite formations. The sample AK1 was taken from the region Aktio and from grey-colored clayey mudstones, dating to the Upper Pliocene-Lower Pleistocene. Four samples (N1–N4) were collected around the ancient city of Nicopolis. All came from a Pliocene formation that is composed of conglomerates, clayey sands, marls, and marine clays. Two samples (V1 and V2) were collected in Vonitsa from recent alluvial deposits which are in contact with the limestones of Pantokratora. Specifically, they are reddish clayey sediments, mixed with pebbles. One more sample (GR1) was taken in the region Grammatikou from the Kourkoutas stream. The formation represents lacustrine beds, which consist of marls, clays, sandstones, and conglomerates.
3. Methods and Analytical Techniques
Thirty-one samples were treated following a standard workflow of pre-treatment (drying, grinding, and pulverization), to be analyzed using X-ray powder diffraction techniques (both bulk and oriented samples). The clay minerals were evaluated by means of X-ray powder diffraction (XRPD) after extraction of the clay fraction (<2 μm) through sedimentation, according to Stoke’s law [23]. Four grams per each sample were soaked in distilled water in cylindrical tubes. Three separate oriented aggregates were prepared after various treatments: air dried at room temperature, ethylene-glycol (EG) solvated, and heated at 490 °C for 2 h (for more details see the Appendix A). Clay minerals were not determined in five samples, either because the clay mineral percentage in bulk analysis was very low or the high amount of carbonates did not allow the successful extraction of the clay minerals due to the aggregation and different settling velocity of the carbonate grains. Both bulk samples and oriented aggregates were analyzed using a Bruker D8 Advance diffractometer with Ni-filtered Cu-Ka radiation, operating at 40 kV/40 mA, equipped with a Bruker LynxEye fast detector. The diffractometer belongs to the equipment of the Minerals and Rocks Research Laboratory of the Department of Geology at the University of Patras. Bulk samples were scanned from 2 to 70° 2θ and oriented clay preparations from 2 to 30° 2θ, with scanning angle step of 0.015° 2θ and a step time of 0.1 s. Qualitative analysis was performed using the EVA software (Bruker-AXS, Madison, WI, USA) based on the ICDD Powder Diffraction File (2006 version). Semi-quantitative analysis of the bulk material was determined based on Rietveld-based refinement and using Topas software. The mineral quantification using TOPAS was done for first time for all the samples (C, X, EA, WA, and SE). The semi-quantitative determination for the clay minerals was performed measuring the height of the 001 reflection for each clay mineral and using the X-ray diffractogram of the glycolated sample. Each height was multiplied by a correction factor, taking into consideration the crystallinity of the clay minerals [24,25].
Particle size distribution was determined for twenty-five samples, using a Malvern Mastersizer 2000 of the Laboratory of Sedimentology of the Department of Geology at the University of Patras. The samples were dispersed in water using an ultrasound bath. The obtained grain-size curves were used to specify the classification parameters of the clays in the clay-silt-sand diagram [26] and especially the >63 μm, 4–63 μm and <4 μm fractions.
The study of the plasticity provides significant information as the silts’ and clays’ properties are affected depending on the water content. Plasticity describes the ability of a sediment or soil to change its behavior in response to moisture. Plasticity indices are quantified by determining the Atterberg limits (liquid limit, LL and plastic limit, PL), which can be used as a reference for the clay plasticity. The clayey material reaches a plastic state after the measurement of two critical parameters, the Atterberg limits (plastic and liquid limits) and the plasticity index. The liquid limit (LL) refers to the percentage of the moisture of a clay, at which the material begins to behave as fluid. The Atterberg limits were determined (for 25 samples) using the Casagrande cup, while the plasticity index was calculated by the numerical difference between the liquid and plastic limit.
Thirty samples of the clayey sediments were chemically analyzed through Wavelength Dispersive X-Ray Fluorescence (WD-XRF). The major (SiO2, Al2O3, CaO, MgO, MnO, Fe2O3, K2O, Na2O, P2O5, TiO2) and minor elements were measured in the Laboratory of Electron Microscopy and Microanalysis at the University of Patras, Greece, deploying a RIGAKU ZSX PRIMUS II spectrometer equipped with the crystals LIF (200), LIF (220), PET, Ge, RX-25, RX-61, RX-40, and RX-75. An amount of 1.8 g of dried ground sample was mixed with 0.2 g of wax (acting as a binder) and pressed on a base of boric acid to a circular powder pellet of 3.2 cm in diameter. The WD-XRF spectrometer is equipped with a Rh-anode running at 4 kW, for major and minor element analysis. The oxide concentration (wt.%) of the major elements was normalized against loss on ignition (LOI, wt.%). Accuracy, precision and detection limits are shown in Table A1 (Appendix A).
The trace elements (Zr, Sc, Th) and the rare earth elements (REE: La, Ce, Pr, Nd, Sm, Eu, Gd, Tb, Dy, Er, Tm, Yb, Lu) of the clayey sediments (n = 20) (see Table A1, Appendix A), were determined by means of Inductively Coupled Plasma Mass Spectrometry (ICP-MS, Code WRA4Β2), at the Activation Laboratories Ltd. (Ancaster, ON, Canada). A list with all the samples, techniques and methods used is given in the Table A5 (Appendix A).
4. Results and Discussion
4.1. Mineralogical Analysis
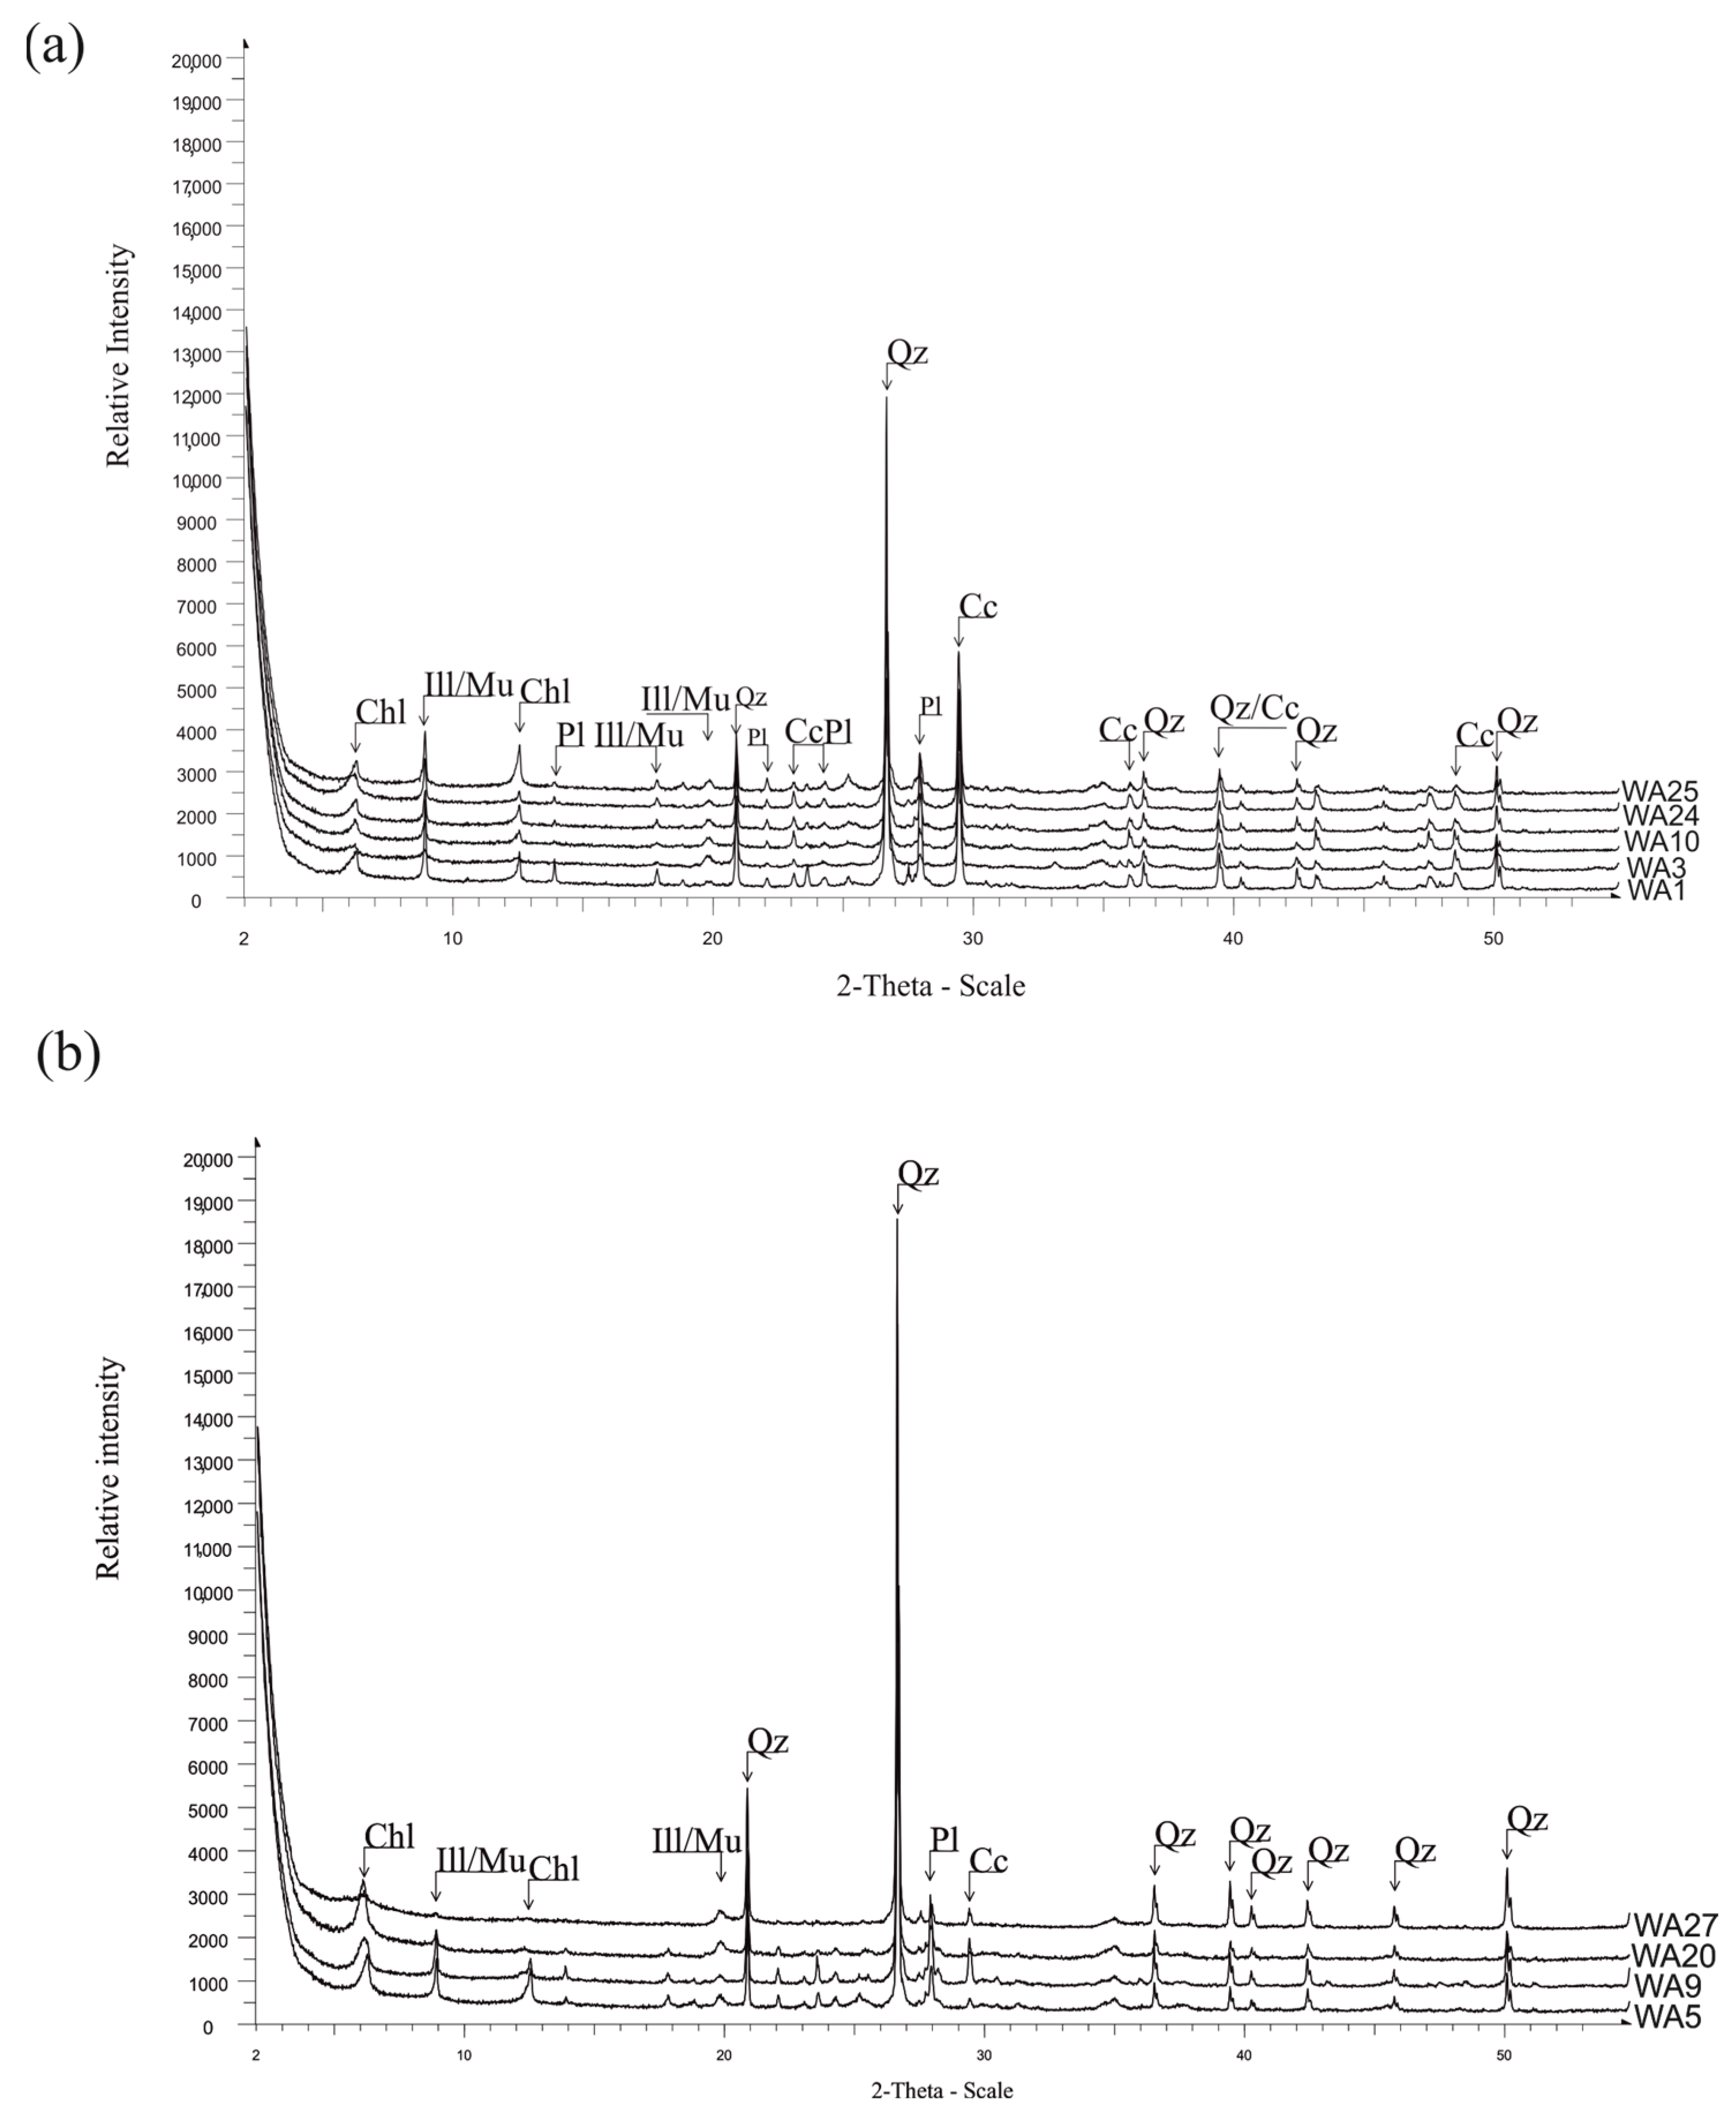
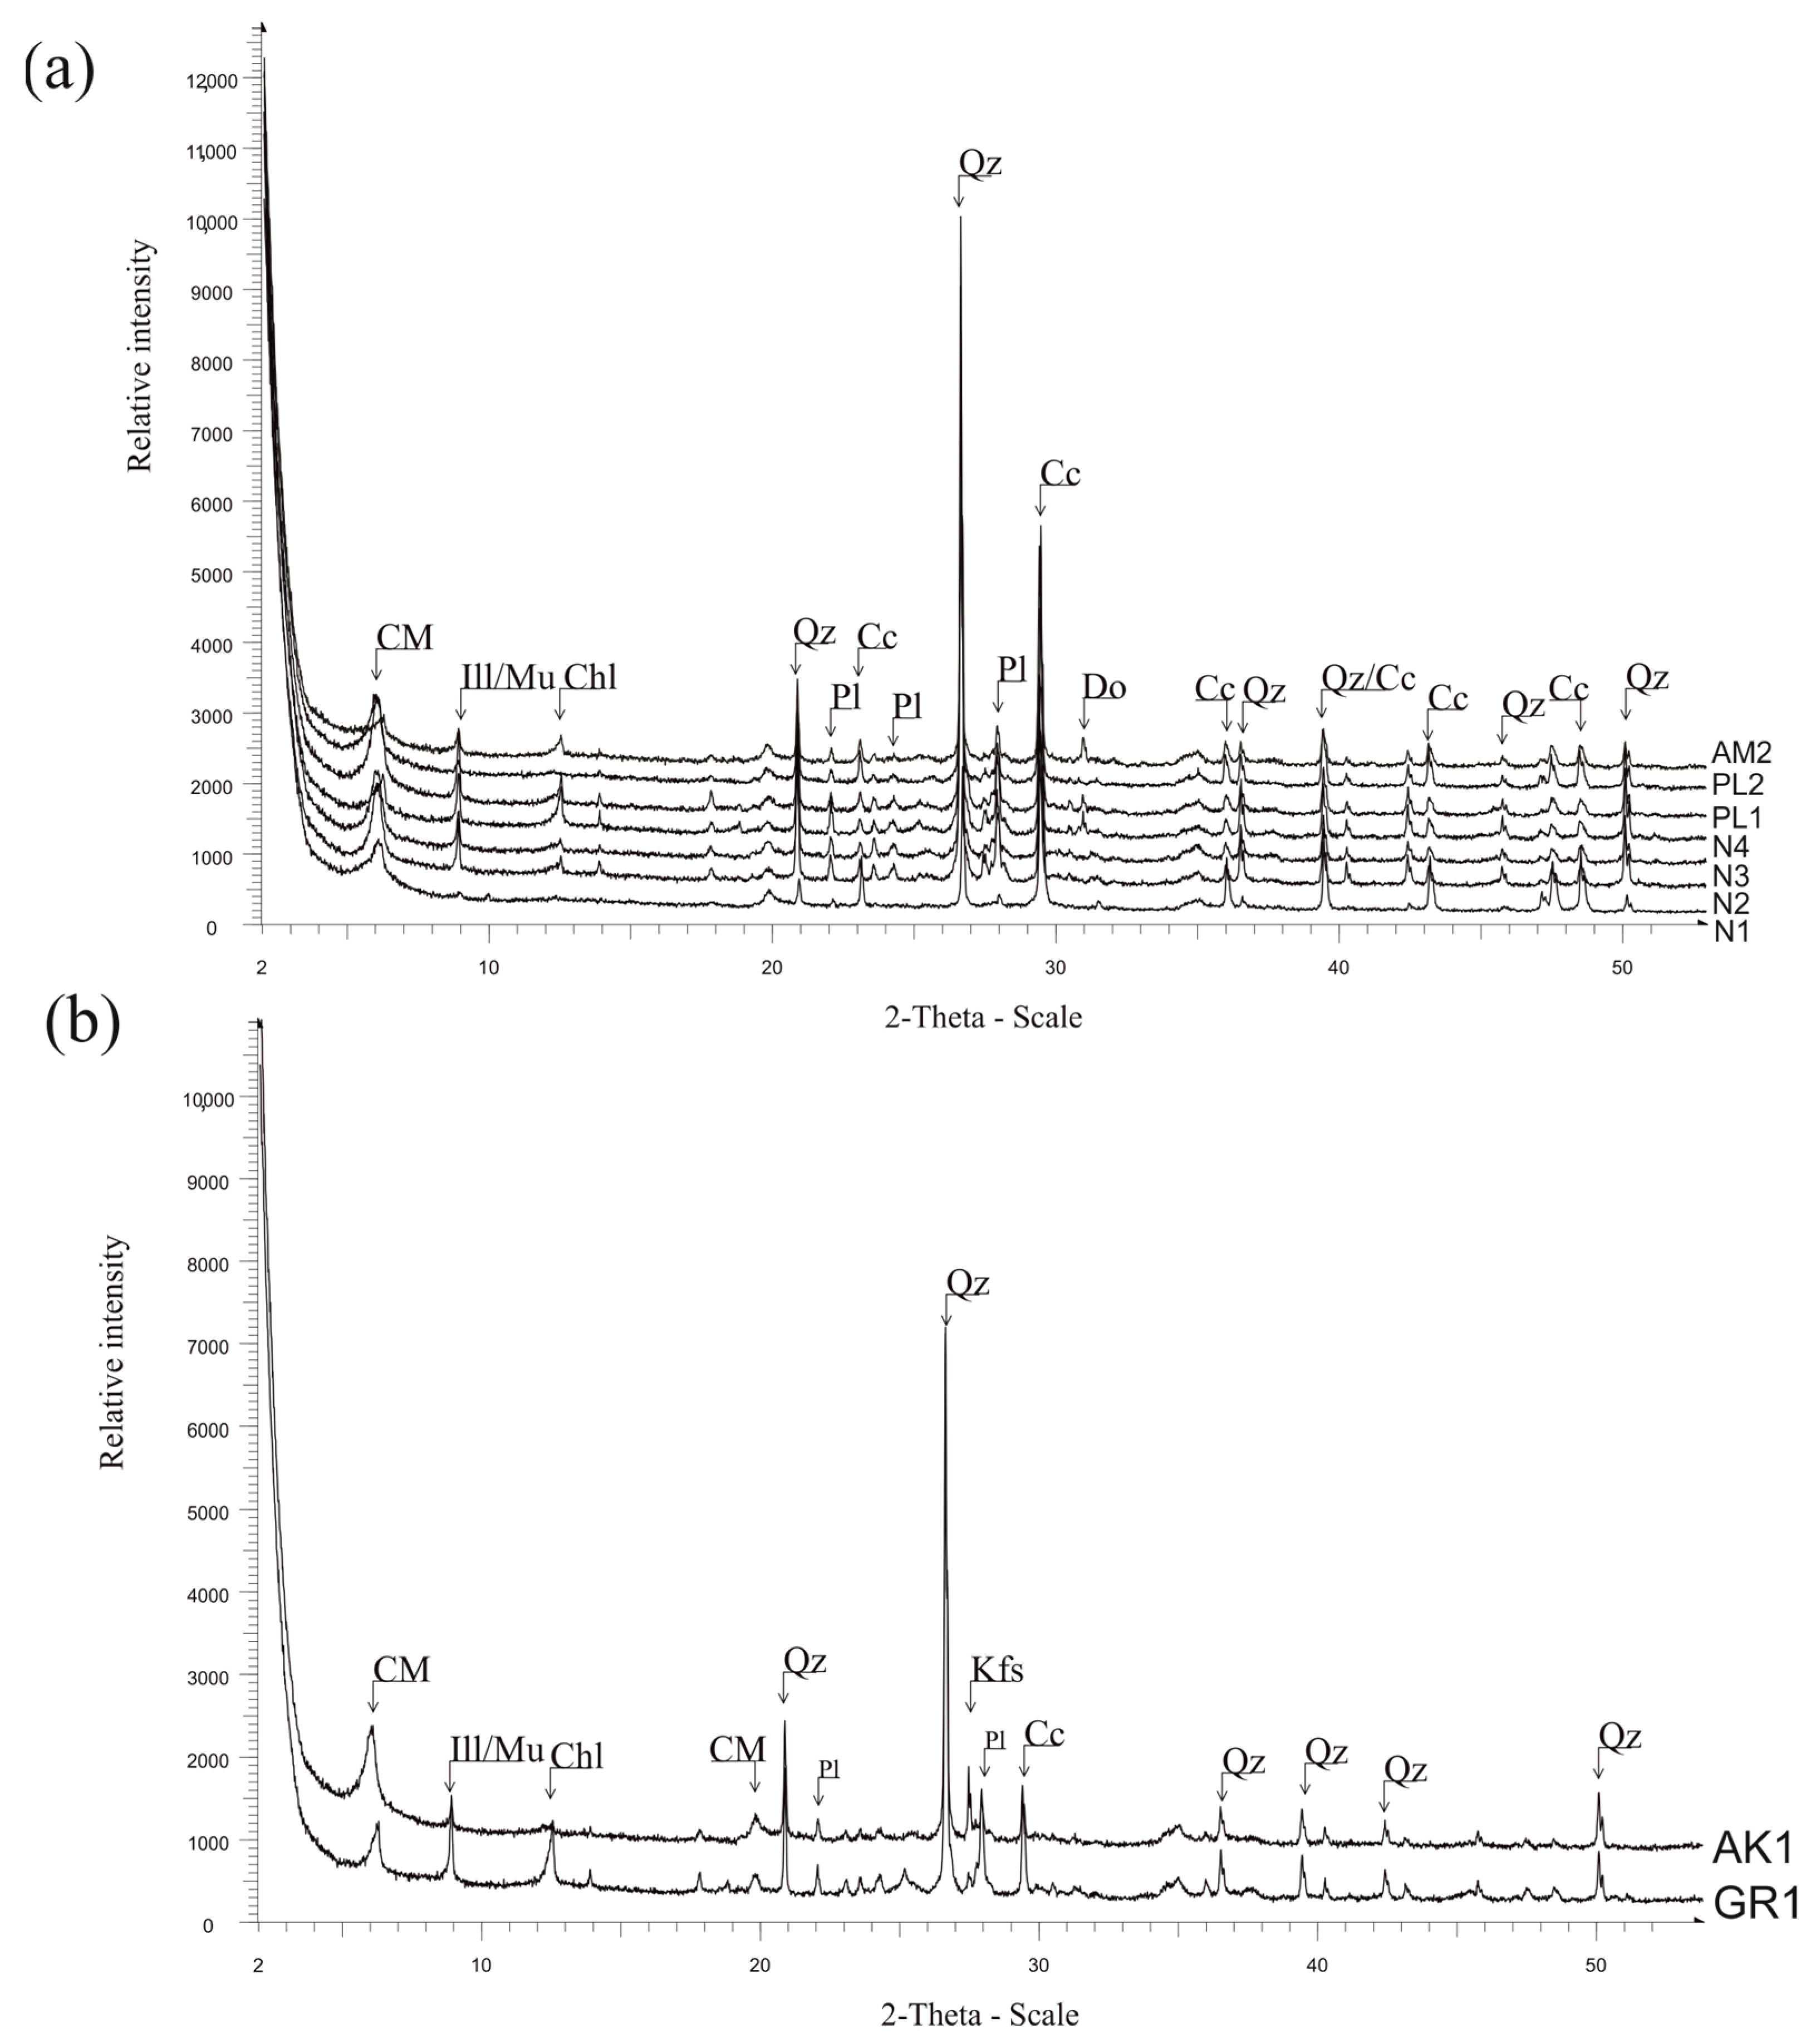
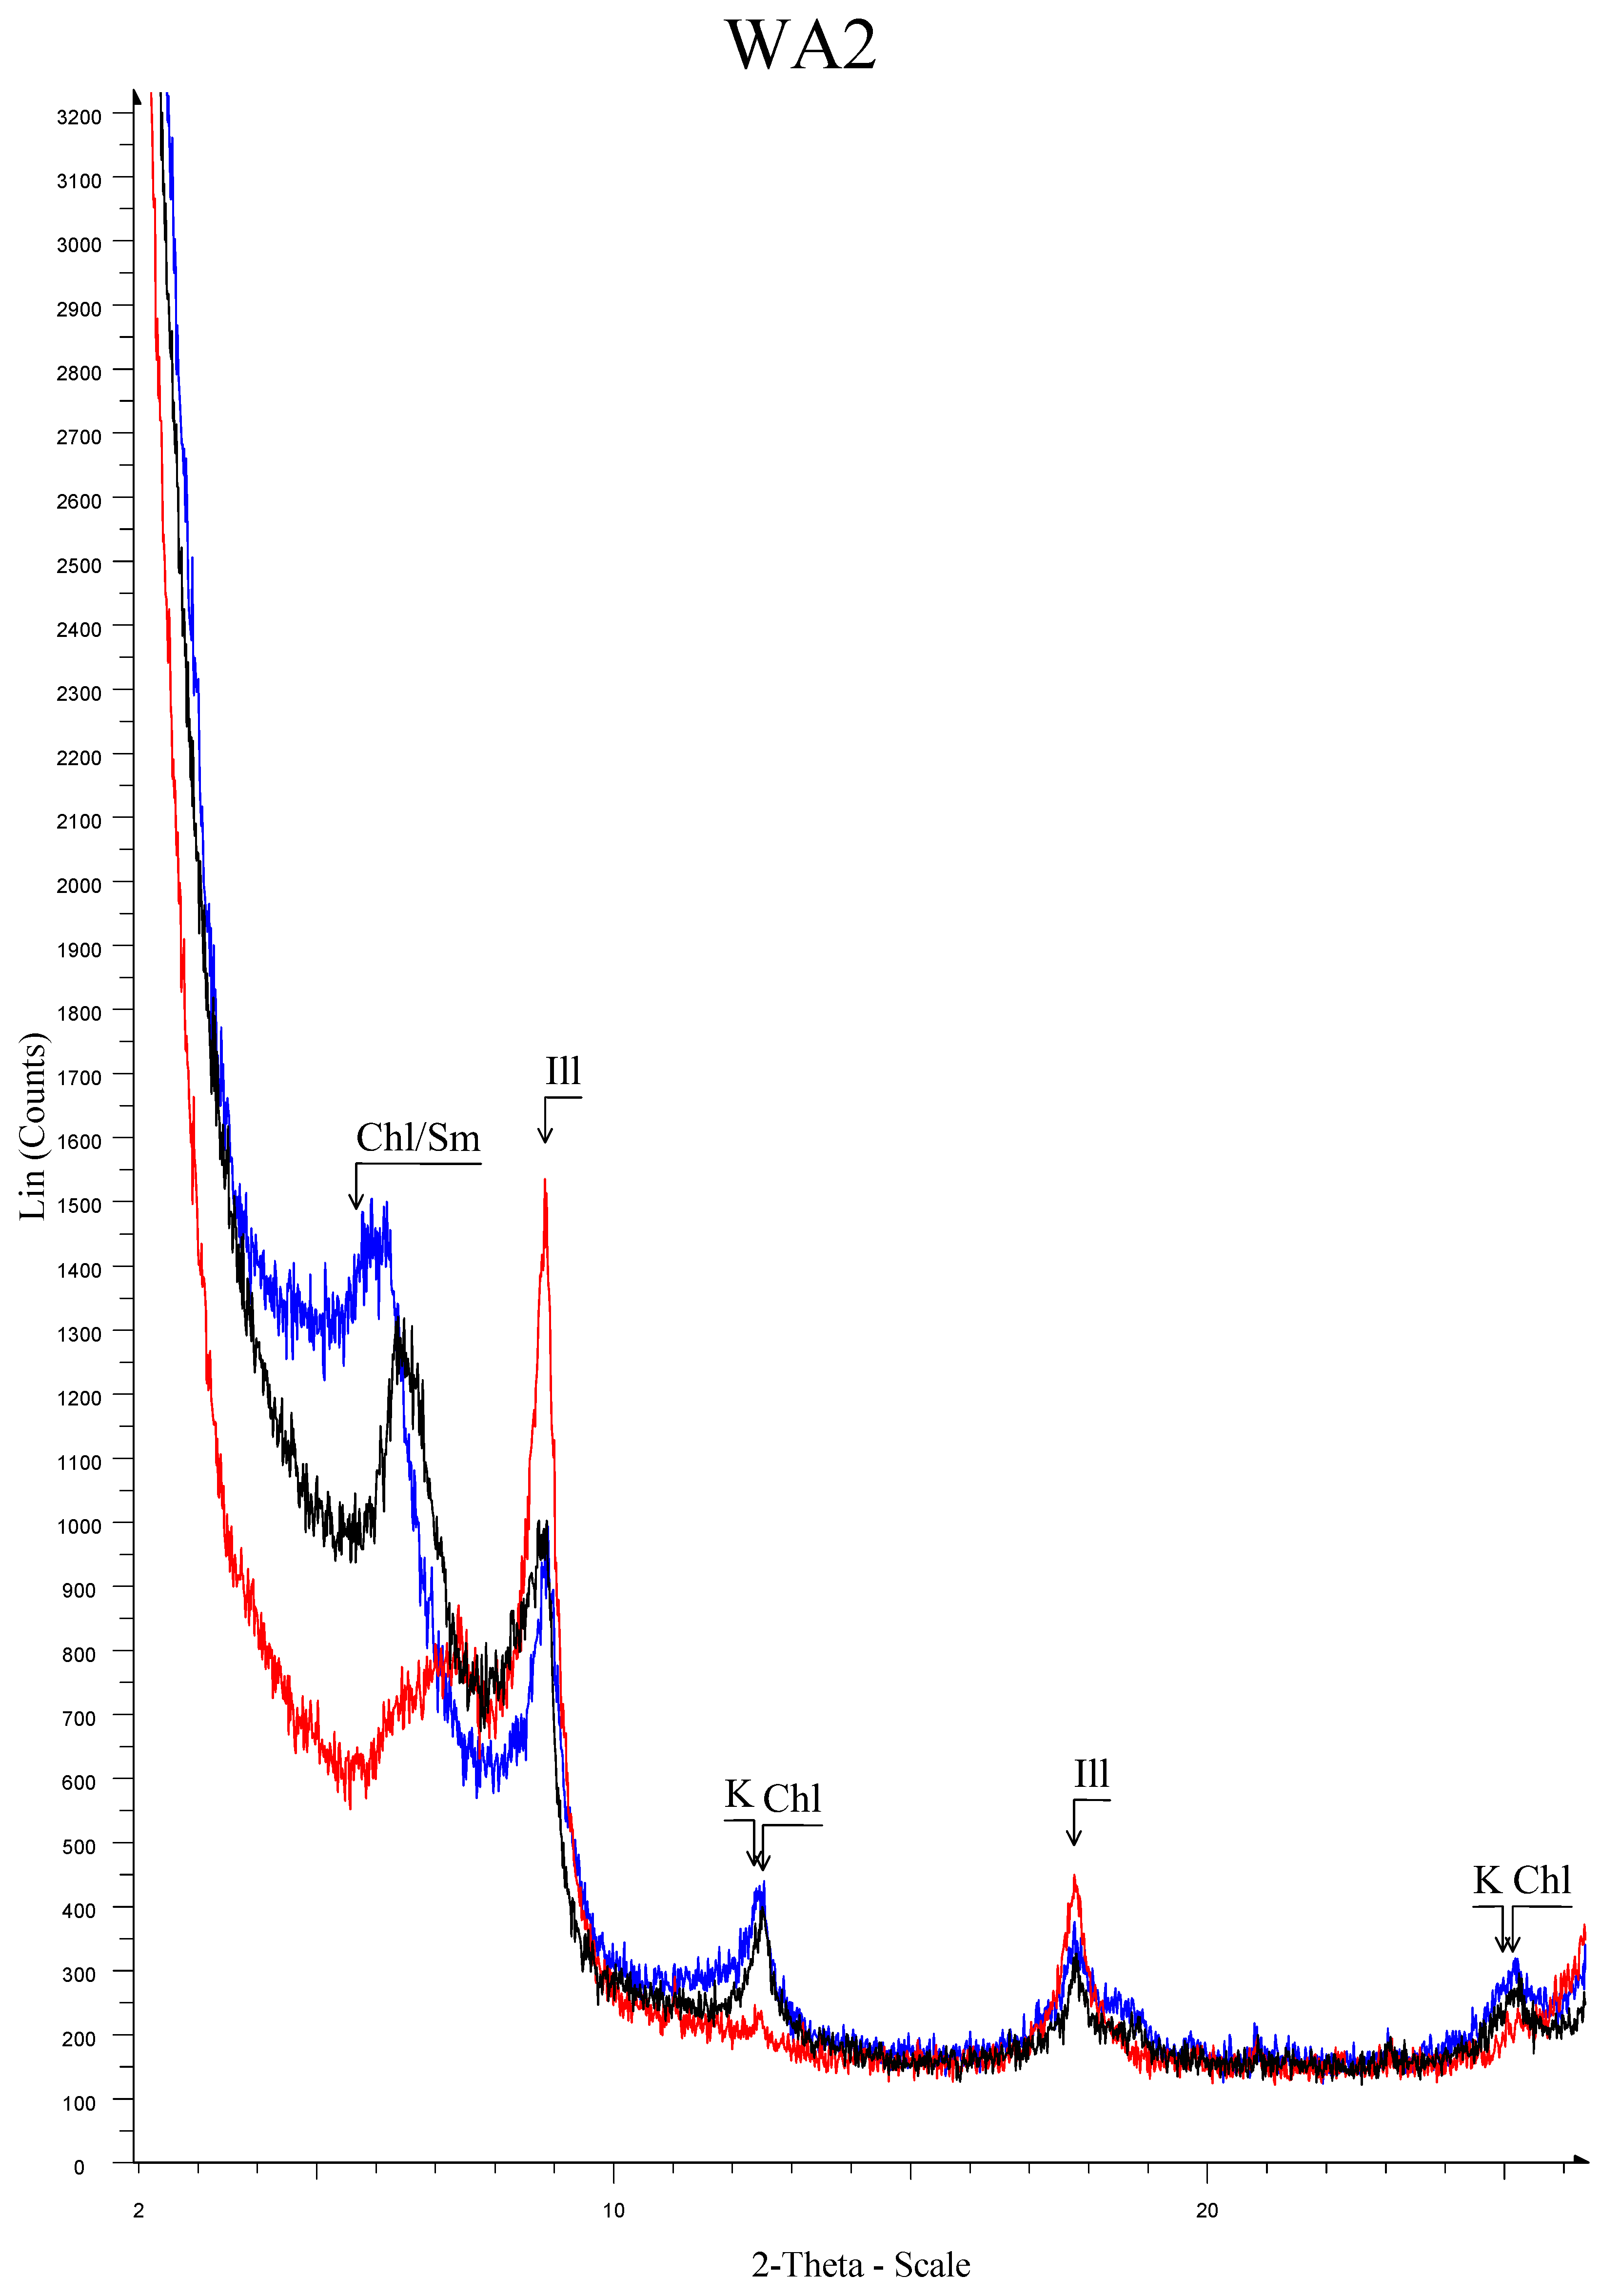
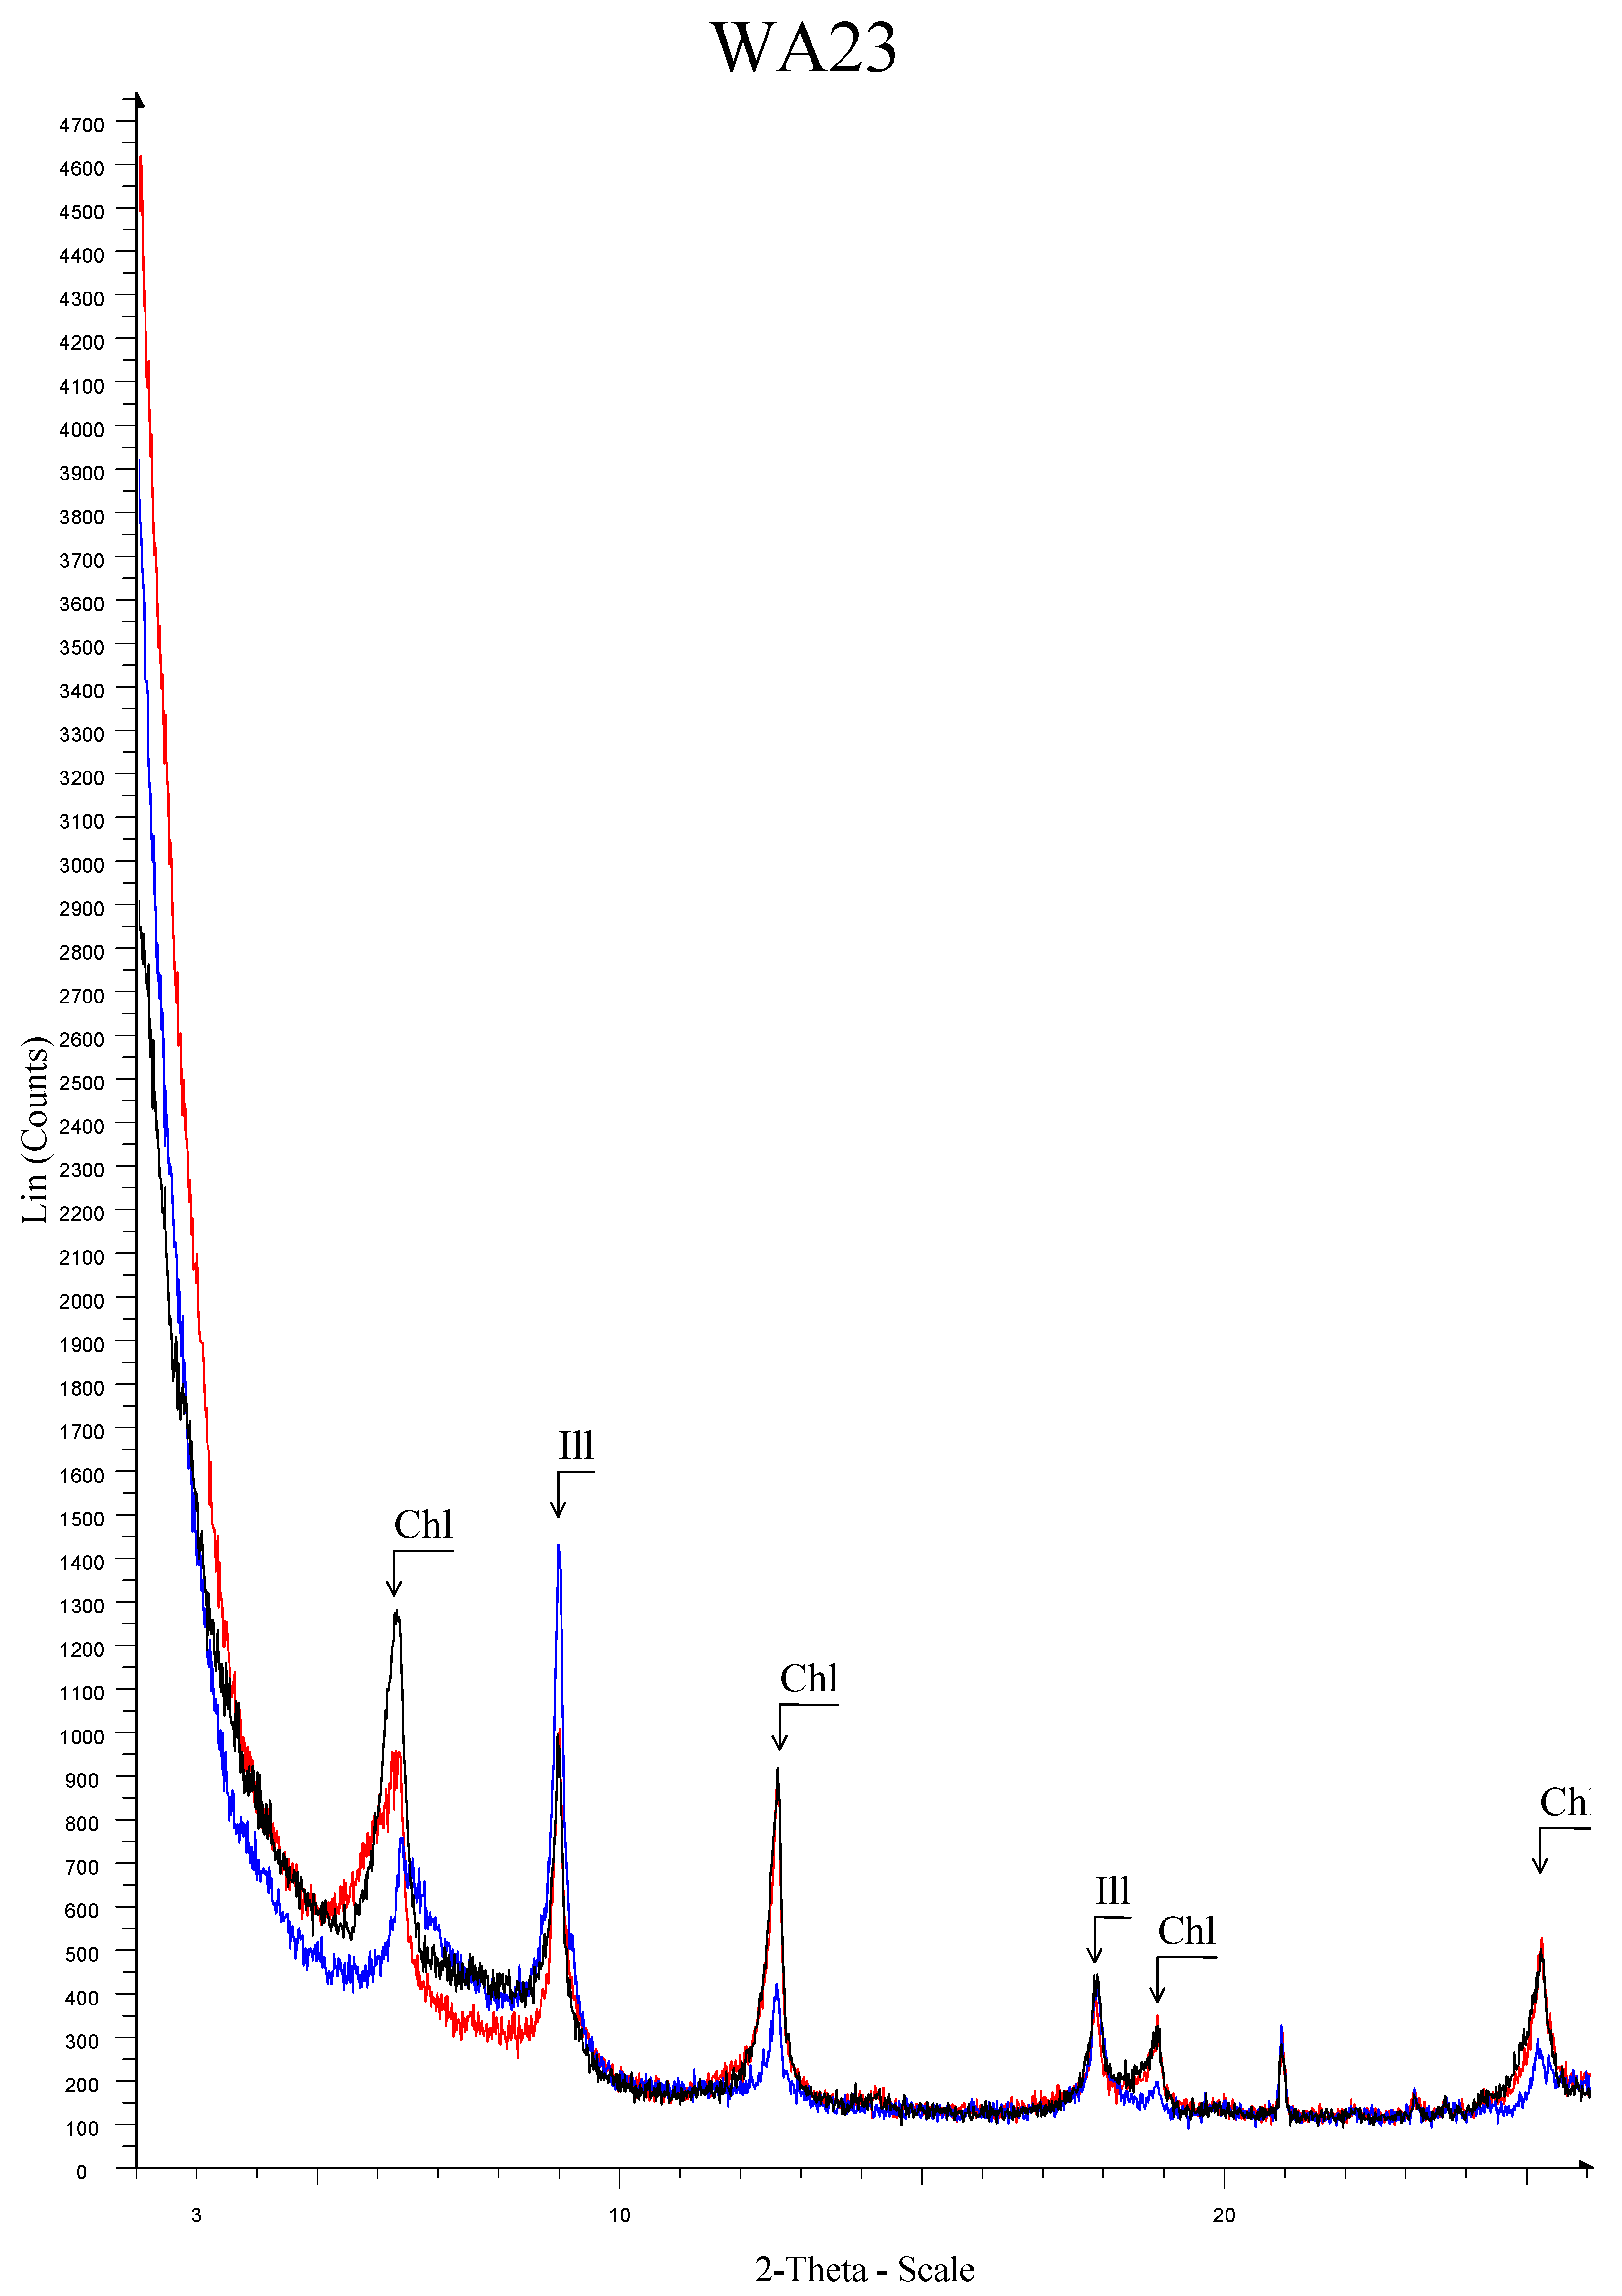
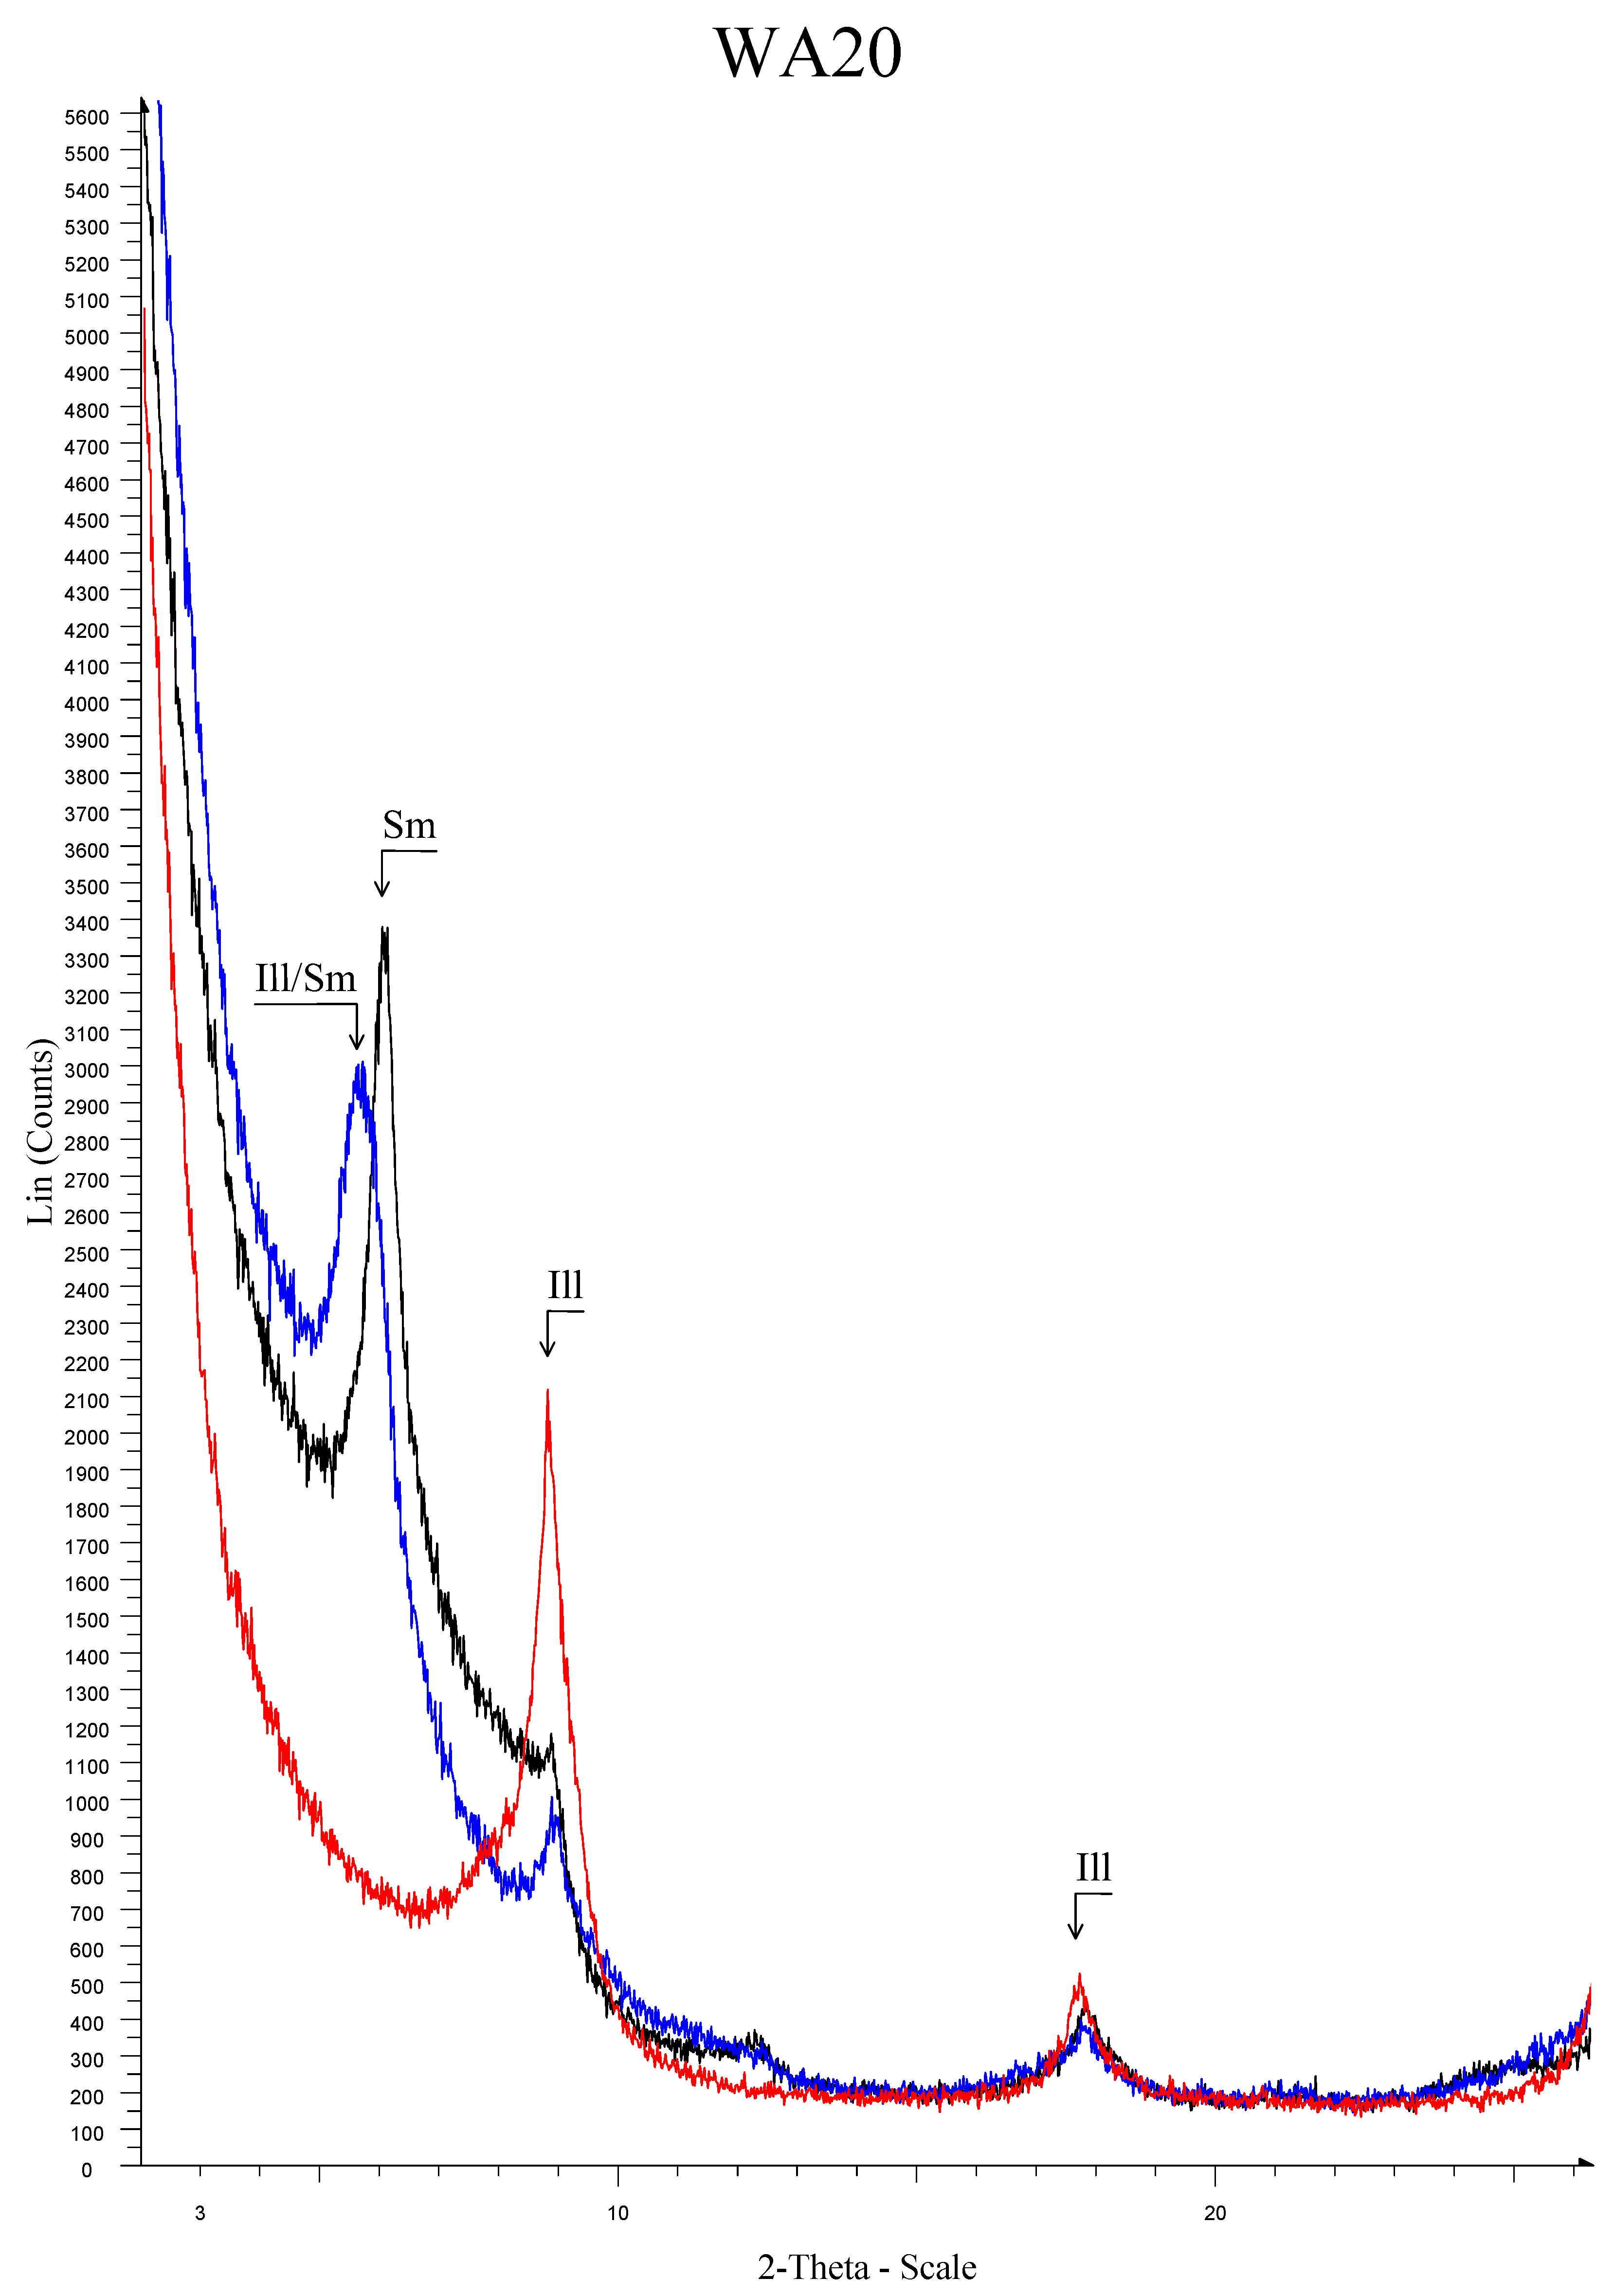
The relative abundance of the main mineralogical phases for all the studied samples recognized by X-ray powder diffraction (XRPD) is given in Table 2. According to the content in calcite or/and dolomite, the samples from WA are represented by two groups, the calcareous (n = 18) and non-calcareous (n = 4) (Figure A1a,b, Appendix A). Similarly, the samples from SE are mainly calcareous (n = 10), with one exception of non-calcareous (AK1) and one sample which is characterized as dolomitic (AM1) (Figure A2a,b, Appendix A). Based on the clay mineralogy, WA samples (from WA1 to WA10 and WA25) (Figure A3, Appendix A) are characterized as illitic clayey raw materials with a high contribution from mixed layers, such as chlorite-smectite, illite-smectite, and chlorite-vermiculite. WA21, WA23, WA24, WA29, and WA30 are characterized as illitic-chloritic (Figure A4, Appendix A), whereas the samples from WA20, WA22, WA27, and WA28 are primarily abundant in smectite and in the mixed layers chlorite-smectite, illite-smectite, and chlorite-vermiculite (Figure A5, Appendix A). On the contrary, the SE samples are abundant in mixed layers and smectite and much less in illite, chlorite, and kaolinite, in comparison to the western Achaean samples (Figure A6, Appendix A). Concerning the samples from EA, C, and X, they are characterized as calcareous, dolomitic-calcareous, and non-calcareous sediments, since their content in carbonates is higher [10,11,12]. Based on clay mineralogy, they are represented by illitic-chloritic, illitic, and illite-smectite-kaolinitic sediments with the participation of mixed-layers.
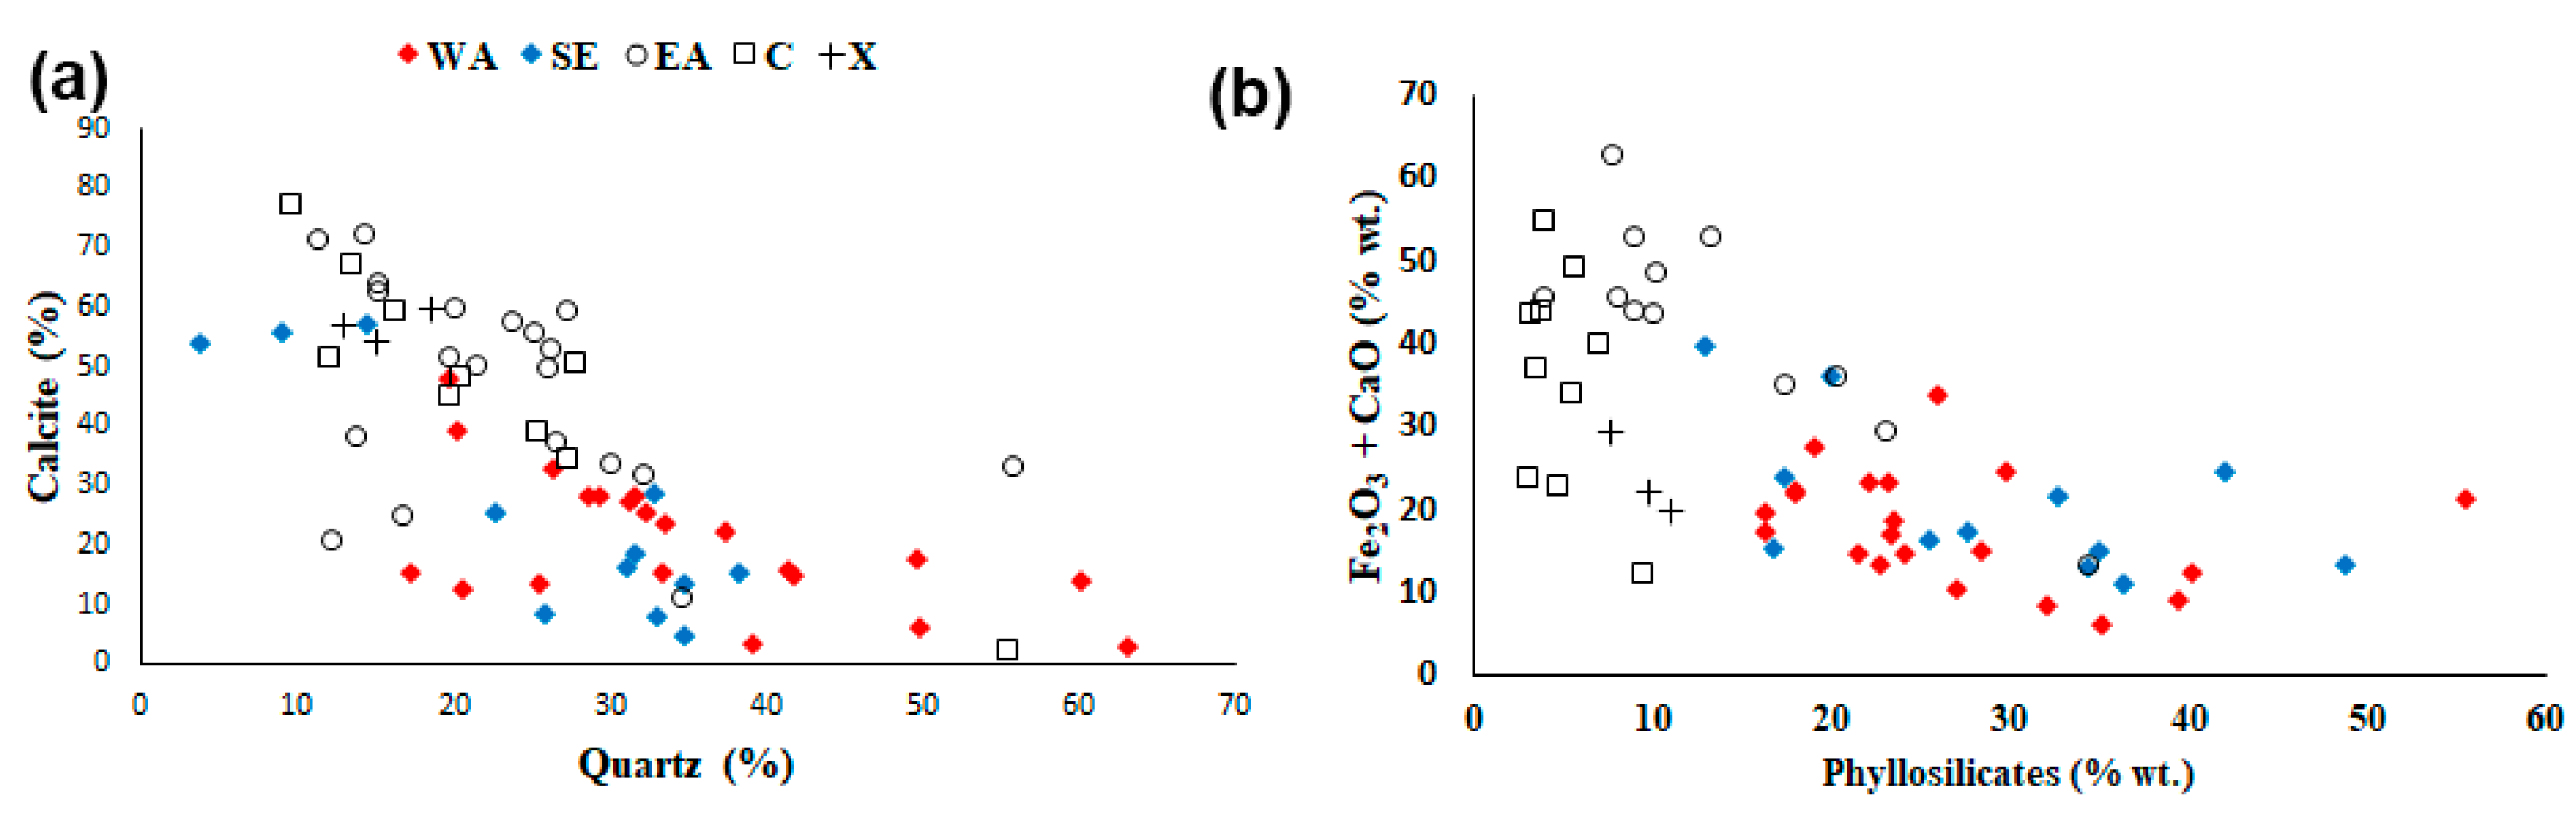
The comparison among the samples from Corinth to western Achaea and south Epirus revealed differentiations mainly among the samples analyzed here (WA and SE), and with those from C, X, and EA. These differences concern the bulk mineralogy, the clay mineralogy, and to a lesser extent their technological properties and their parent rock origin. The mineralogical assemblages showed differences regarding the content of calcite and the presence of dolomite and the content of the clay minerals. WA samples are split between calcareous and non-calcareous, having four samples with low content in CaO. On the contrary, the samples from C, X, and EA include a group of samples which were characterized as dolomitic clayey sediments. Similarly, SE samples are all rich in calcite, with the exception of sample AM1 which is characterized as calcareous-dolomitic sediment. Among the samples from northern Peloponnese and based on the scatter diagram quartz-calcite (Figure 3a), the samples from WA are poorer in calcite content and richer in quartz, compared to the samples from EA, C and X. In addition, the samples from WA and SE, have higher content in feldspars, particularly in plagioclase (Table 2), in comparison to the samples from C, X, and EA, wherein the majority of the samples contain less than 10% feldspars (Table 2 and Table A4 in Appendix A). The presence of carbonates plays a crucial role during firing, since it results in the formation of small pores and new mineralogical phases (such as plagioclase, pyroxene, and gehlenite) that control the firing shrinkage, the thermal and moisture expansion, and produce net-shaped feasible tiles [28,29]. Thus, the samples from Corinth, Xylokastro, and eastern Achaea, as high calcareous samples, are expected to contribute to the ceramic manufacturing with different porosity (pore size and distribution), as well as different firing behaviour. On the contrary, the WA and SE samples that have lower content in calcite and are richer in silicates (such as quartz and feldspars). The low amount of carbonates makes the materials suitable for cooking ware, since they have good thermal resistance, specifically at low firing temperatures (<850 °C) [30]. Moreover, the same clays (of low amount in carbonates) could be used by adding abundant temper to improve the toughness of the ceramic body [31]. The presence of feldspars, and particularly plagioclase, which act as fluxing agents for the acceleration of the sintering process [32], indicates that the specific raw materials could have contributed to a different firing process in relation to the temperature choice and firing time.
According to the clay mineralogy, a group of the studied samples (WA) is characterized as illitic clayey sediments with the presence of mixed layers, such as chlorite-smectite, illite-smectite, and chlorite-vermiculite (WA1–WA10 and WA25). These sediments are either marls of Pliocene-Pleistocene age or Holocene alluvial deposits. Only the sample WA9 comes from a Pliocene lagoonal deposit. The other group of the western Achaea samples is an illitic-chloritic group, which are either Holocene alluvial deposits and weathering products (WA23, WA30), or Pliocene marine deposits (WA24). The exception is sample WA21 that originates from flysch sediments consisting of mudstones and conglomerates. The last group of WA samples includes smectite-rich sediments with relatively high content in mixed layers of chlorite-smectite, illite-smectite, and chlorite-vermiculite. The samples WA20 and WA22 come from the same deposits as WA21 and WA24, respectively. WA27 comes from a Pleistocene fluvial and/or lacustrine deposit, whereas WA28 is from flysch rocks. Thus, based on mineralogy, the samples from western Achaea can be characterized as calcareous illitic, illitic-chloritic, and smectite clays, that can be used as “porous” clays which contribute to the development of porous ceramics and have been mainly used to make brick-tiles, amphorae, and water pipe [33]. There is a smaller group that is characterized as non-calcareous illitic, illitic-chloritic, and smectite clays, and these are vitrifying clays that can be used to the construction of floor tiles, stoneware, or porcelains [33].
The samples from south Epirus are mainly calcareous smectite samples. These samples can be utilized as additives to the raw materials since they react during the drying state and favor shrinkage and particles adhesion [33]. It is worth mentioning the AM1 sample, which originates from evaporite deposits and was collected in the Amfilochia region, is rich in calcite and dolomite, and consequently in CaO and MgO, whereas the loss on ignition has been calculated to be about 29 wt%. The high LOI can cause shrinkage, a parameter that allows to predict expansion after firing [33].
4.2. Technological Properties (Particle Size and Plasticity)
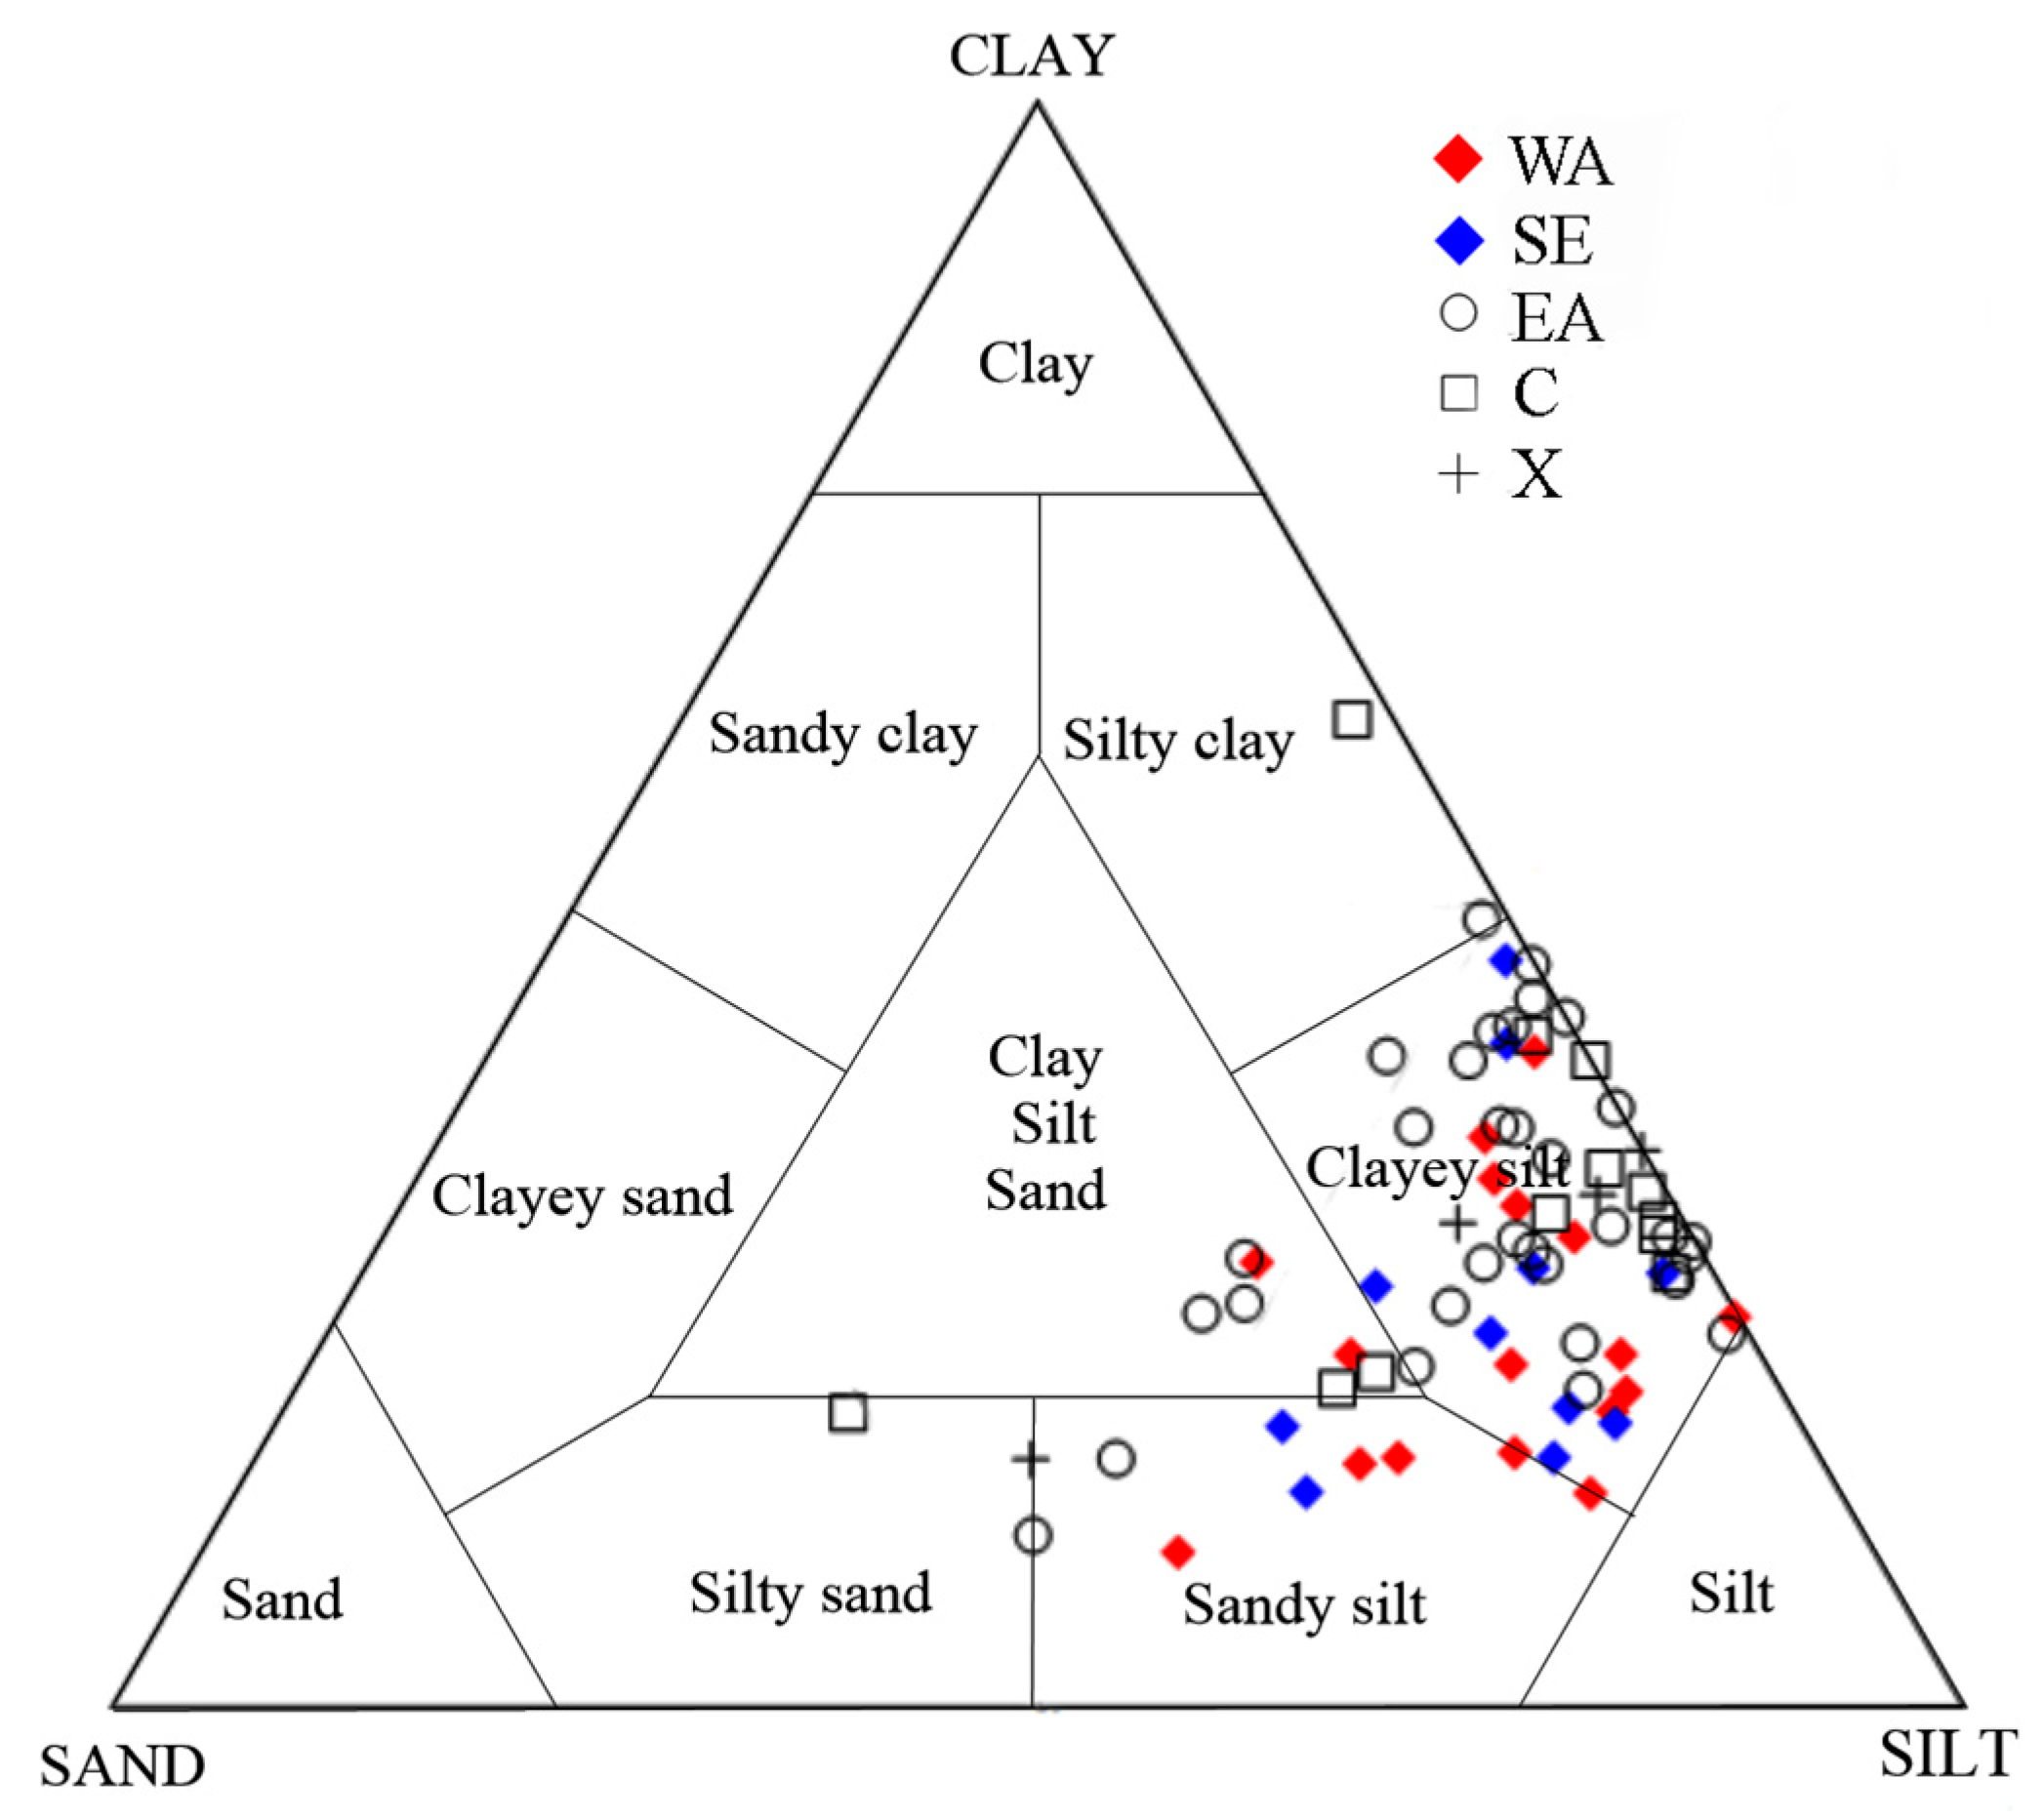
The results of the particle size analysis are given in Table 3 and are plotted on the ternary diagram proposed by Shepard [26] (Figure 4). The majority of the samples for both studied areas is plotted on the clayey silt field. Five samples (WA1, WA4, WA9, N3, and N1) proved to have higher content in the sand fraction and are plotted on the sandy silts, whereas two samples (WA20 and WA27) from WA have intermediate content in the fractions of sand, silt, and clay. In comparison to the clays from EA, X, and C, which have been already discussed elsewhere [8], they seem to have slight differentiations and be richer in the silt fraction (Figure 4).
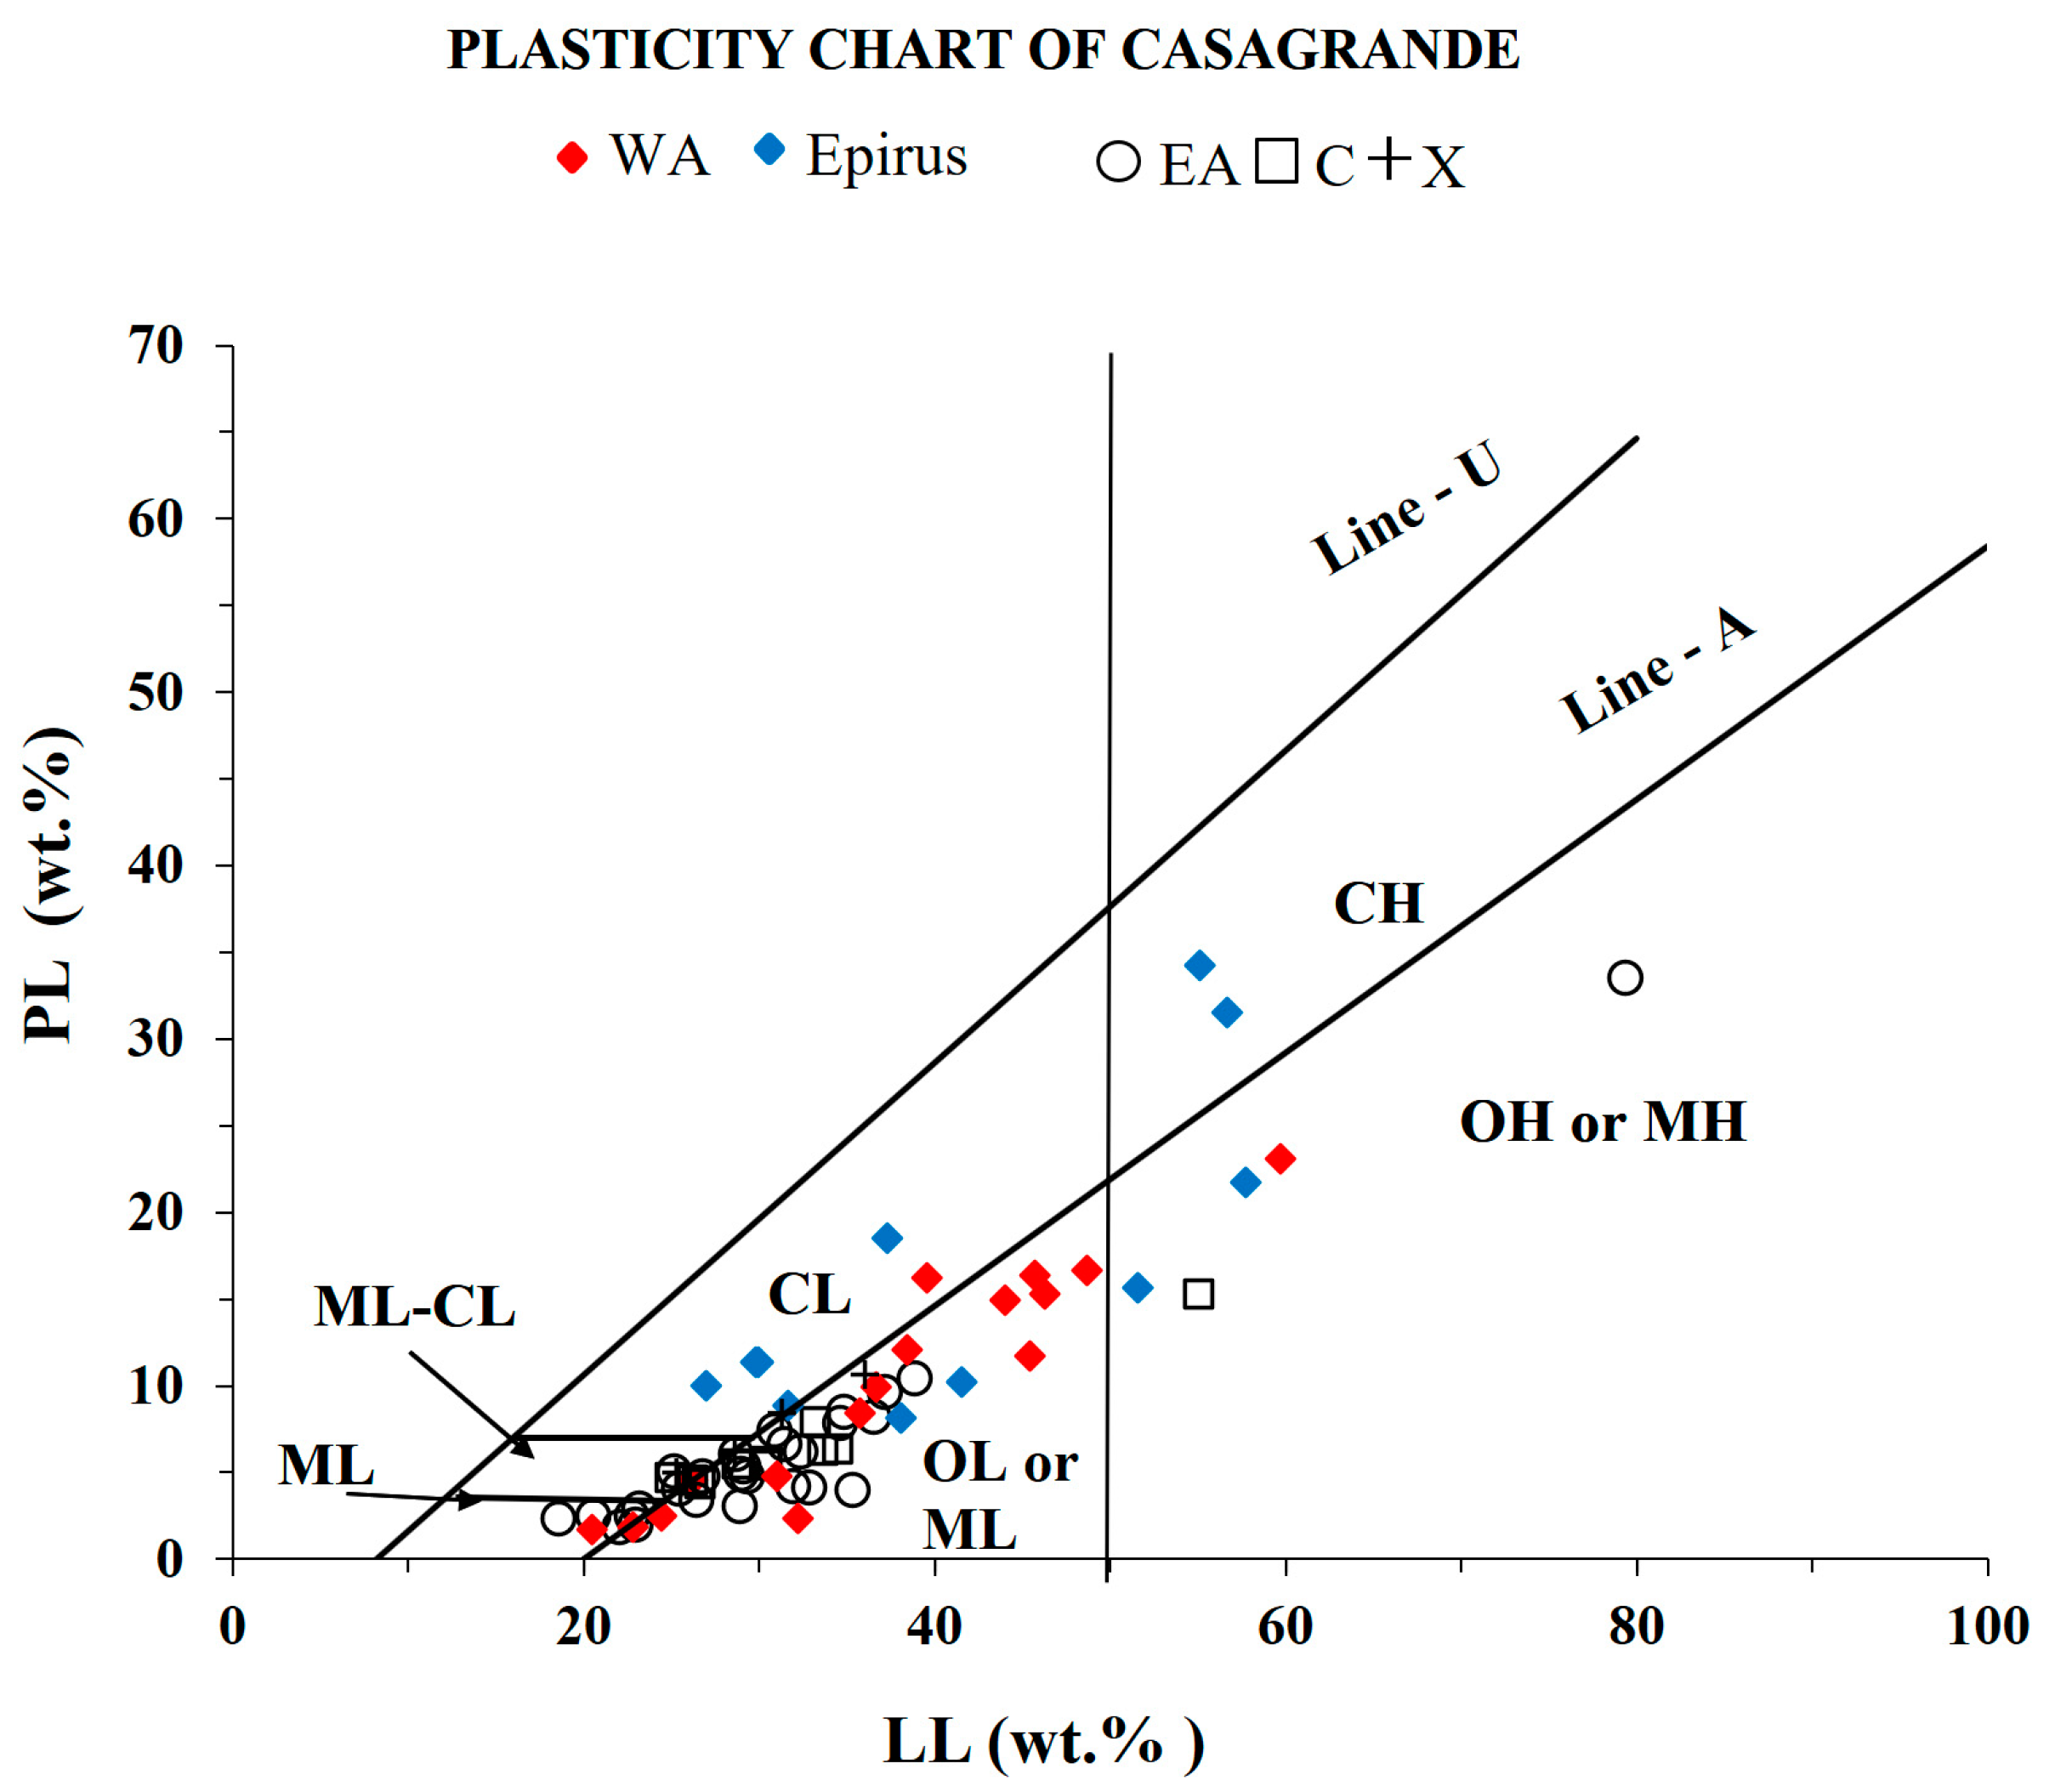
In the plot of all the studied samples, on Casagrande’s chart, the samples WA23, AM2, and PL2 are characterized as silts of high plasticity, whereas AM2 and PL2 are clays of high plasticity (Figure 5). The presence and high percentage of smectite in the two last samples is correlated with the high plasticity index. Four samples (N1, N2, N3, and WA5) are plotted on the field of clays of low plasticity and one on silts of low plasticity. In relation to the samples from eastern Achaea and Corinth, the samples from western Achaea have LL and PI, whereas the majority of the samples from south Epirus have a higher plasticity index (Table 3).
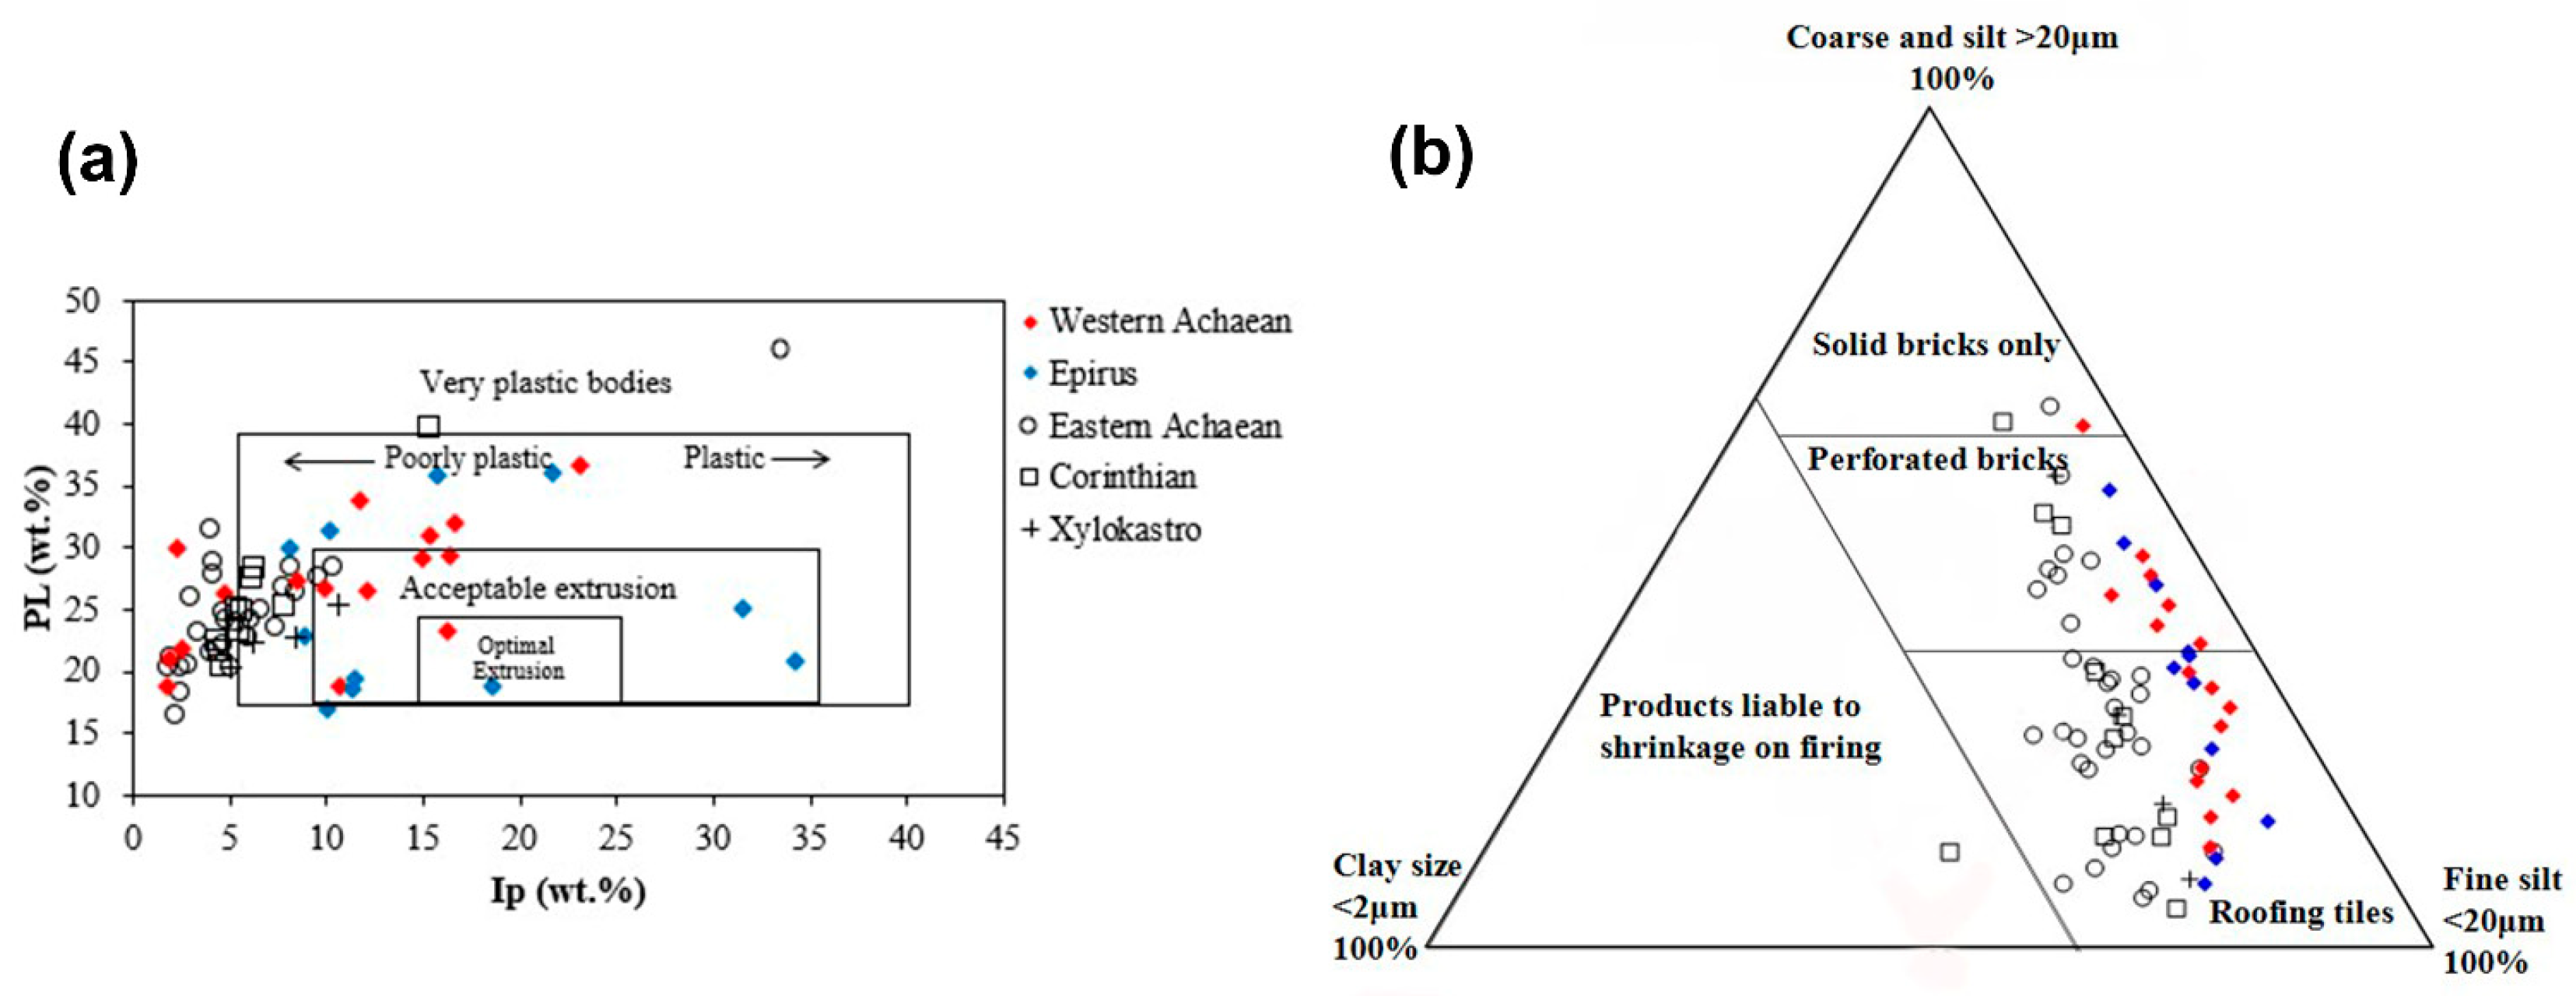
In terms of plasticity and particle size distribution of the studied samples, their plot in the plasticity chart proposed by Marsigli and Dondi [35] shows that samples from WA tend to be more plastic bodies than the rest of the eastern Peloponnese, whereas two samples from SE are plotted on the plastic bodies, and one is suitable for optimal extrusion (Figure 6a). The particle size distribution shows that WA and SE samples are richer in the silt fraction compared to EA, C, and X samples, a fact that does not correlate to the plasticity results, since the smaller the particle size the higher the plasticity. However, it is well-known that high content in clay minerals such as smectite affects the plasticity of the materials. In this case, the aforementioned samples are richer in clay minerals and particularly in smectite, either as a pure mineralogical phase or incorporated in a mixed-layer.
To assess the suitability of the studied samples according to the particle size distribution, they are plotted in the ternary diagram proposed by Bender and Handle [36] (Figure 6b). The samples from eastern regions of Achaea seem to be richer in the clay fraction than WA and SE samples. Those which have a higher sand fraction could have been utilized to produce perforated bricks and common ware, such as tableware, and amphorae productions in the antiquity. The latter were presumably mixed with temper in order to improve the plasticity and molding behavior.
4.3. Bulk Chemical Analysis of the Clayey Raw Materials
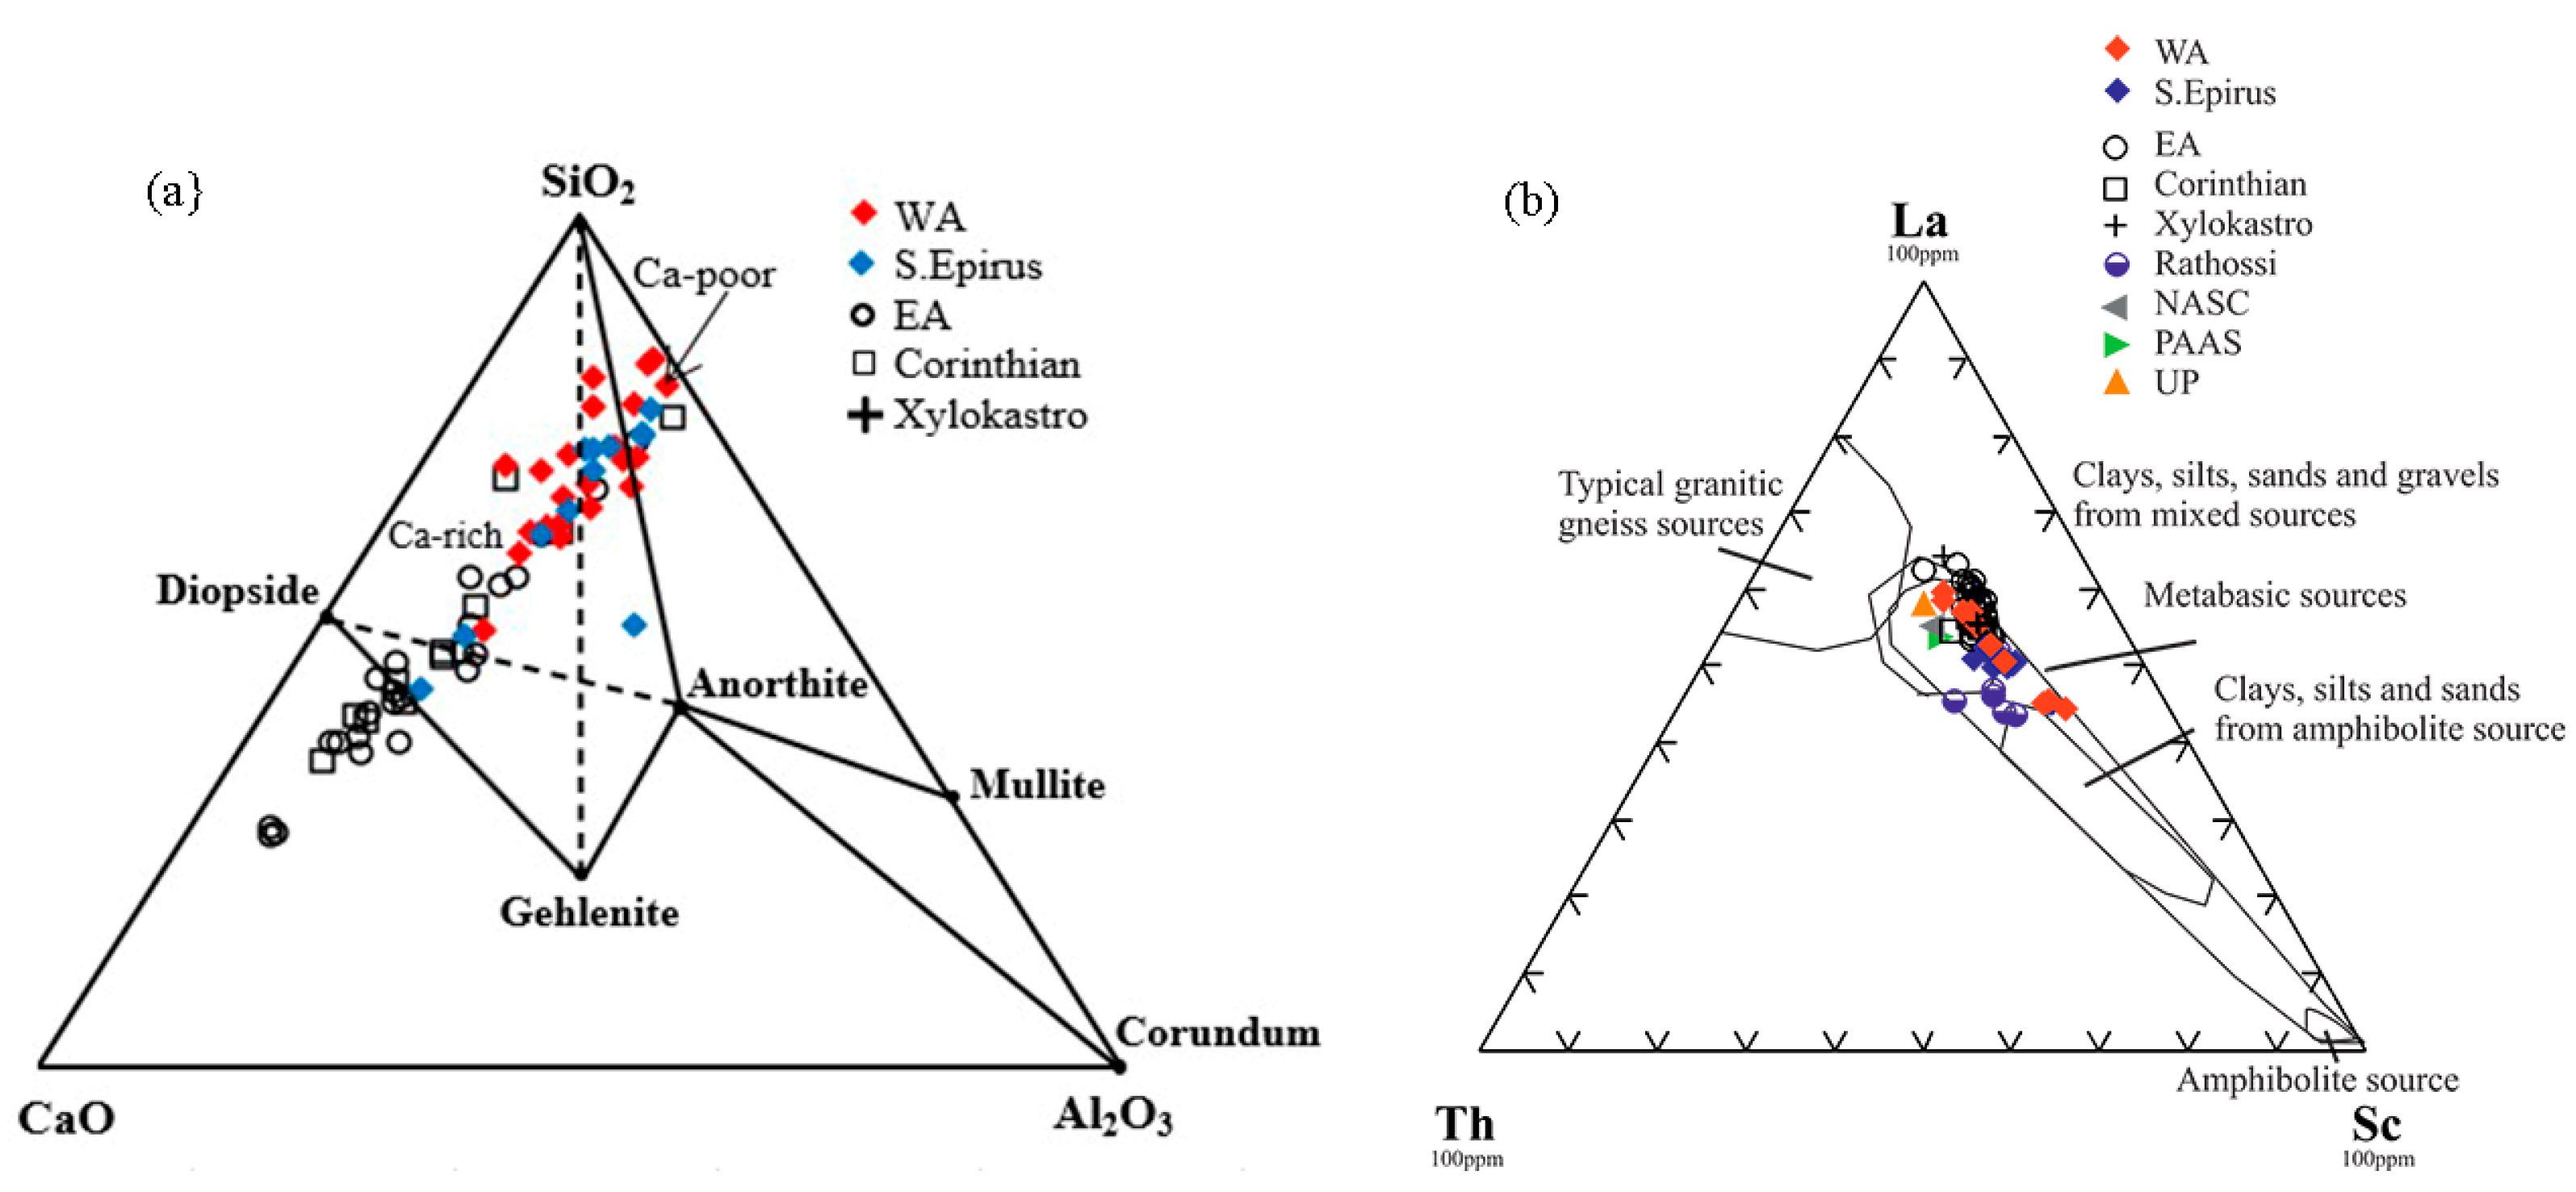
The projection of the geochemical analyses on the SiO2-CaO-Al2O3 ternary diagram [37] results into two broad main groups considering their CaO content (Figure 7a). Most of the samples from WA and SE (27 individuals) are chiefly plotted in the Ca-rich field. Those samples can be subdivided further in two subgroups: one comprises three samples from both areas, (WA14, AM1, and V1), which are characterized as high calcareous sediments, since their content in CaO (wt%) ranges between 29 wt and 36 wt%, and those where CaO content is between ~7–21 wt% (Table 4). There are seven samples (WA5, WA9, WA20, WA27, AM2, AK1, and GR1) that are plotted in the Ca-poor field, since their CaO content is under 6 wt%. One sample (V2) is rich in Al2O3, a fact which is related to the high content in clay minerals, as they are determined with XRPD. In the same ternary diagram, chemical analyses results have been plotted to observe possible compositional differentiations from Corinth to western Achaea and south Epirus samples. From East to West of the northern Peloponnese, the content of calcium oxide seems to decrease. The samples from south Epirus are characterized by a wide range in the content of CaO. The chemical analyses results of the eastern Achaea, Corinth, and Xylokastro samples are given elsewhere [10,12].
The analysis of the rare earth elements is considered crucial since according to [37,38,39,40,41,42,43,44,45] they reflect the parent rock composition, and their distribution has been used as an index of the sediment’s provenance. The use of the La-Sc-Th ternary diagram (Figure 7b) can provide significant evidence for the provenance of the fine-grained sediments, since it discriminates the low-silica rocks (basic) from the high-silica rocks (felsic) [43,44]. Dare are given in Table A2 (Appendix A). The clayey sediments considered in the present study (western Achaean and south Epirus) are plotted in the La-Sc-Th ternary diagram, together with the results of clayey sediments reported from the previous research by Xanthopoulou [10] and Xanthopoulou et al. [12] and [7], in order to investigate possible geochemical similarities or discrepancies between the two regions of Achaea. The majority of the studied samples is plotted towards the edge of La apex and in the field of clays, silts, sands, and gravels from mixed sources, indicating a high-silica source or sediments that came from different sources. Three samples from WA (WA1, WA4, and WA9) are plotted towards the Sc apex as the samples from other sites in Western Achaea (published elsewhere) [7], suggesting a low-silica source. The fact that all the studied samples are plotted close to the values of UCC (Upper Continental Crust), NASC (North American Shale), and PAAS (Post-Archaean Average Shale), suggests that although the sediments were probably subjected to intense weathering; La, Sc, and Th have remained immobile [43].
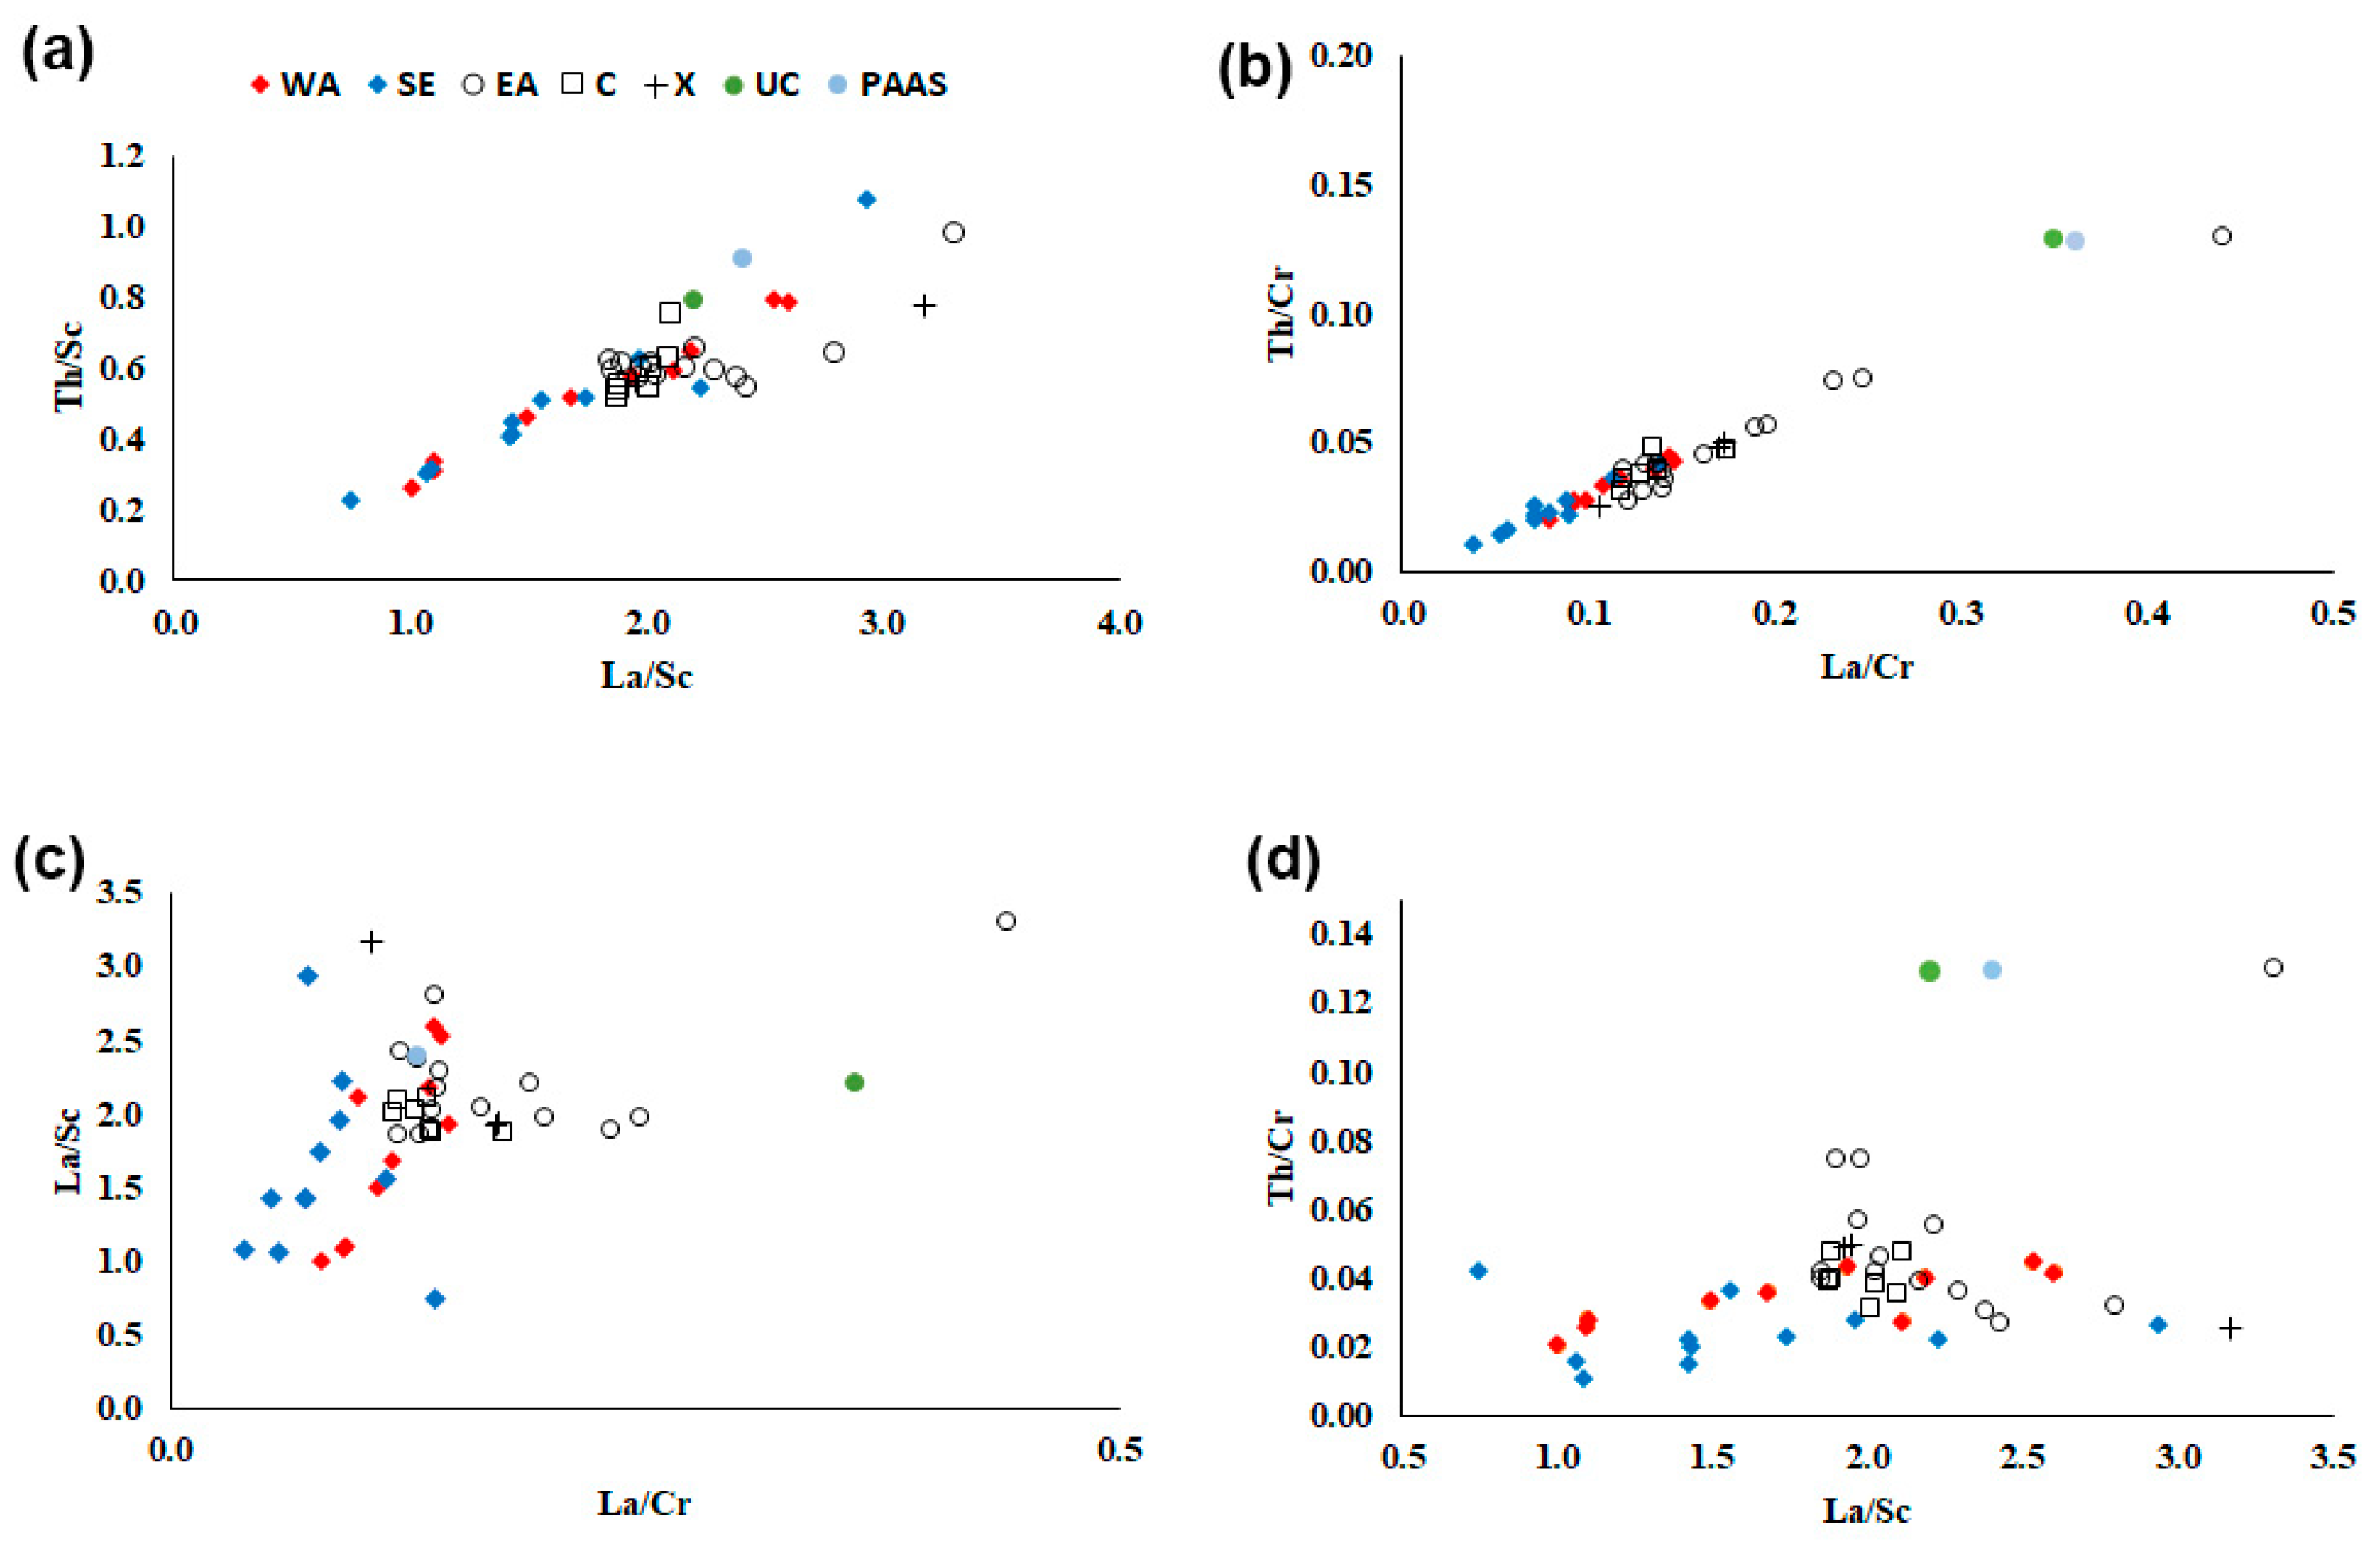
Furthermore, the use of ratios between the immobile elements that have high values in silicate-rich rocks (La, Th) or have high values in basic rocks (Co, Sc, Cr) and their plots in scatter diagrams (Figure 8), showed slight discrimination between the samples of WA, C and X samples. Concerning the samples from SE, there is an obvious discrimination in relation to the previous group of samples. Figure 8a,b displays the positive correlation of the La/Sc to Th/Sc and La/Cr to Th/Cr cross-plots. The first diagram shows a spread in the ratios of the samples from WA and SE, whereas the samples from the northeastern Peloponnese are clustered, since they have an average of La/Sc ranging from 1.99 to 2.35. The same is observed in the plot of La/Cr to Th/Cr ratios, where the average of La/Cr reaches 0.18 for EA samples, higher than WA samples, where it is 0.12. Moreover, the samples from SE are differentiated in the plots of La/Cr-Th/Cr and La/Cr-La/Sc (Figure 8c). Similarly, the cross-plot of La/Sc-Th/Cr ratios illustrates the gathering of the samples from the northeastern Peloponnese (Figure 8d). The elemental ratios were compared to the Post-Archaean Australian Shales Average (PAAS) and to the Upper Continent Crust (UC) values [42,43,44,45]. Thus, the ratios of the clayey sediments from the northeastern Peloponnese are not significantly different from UCC in the scatter diagram of La/Sc-Th/Sc and from PAAS in the scatter diagram of La/Cr-La/Sc. On the other hand, the samples from WA and SE have lower ratios from UCC and PAAS. All the ratios are given in Table A3 in the Appendix A.
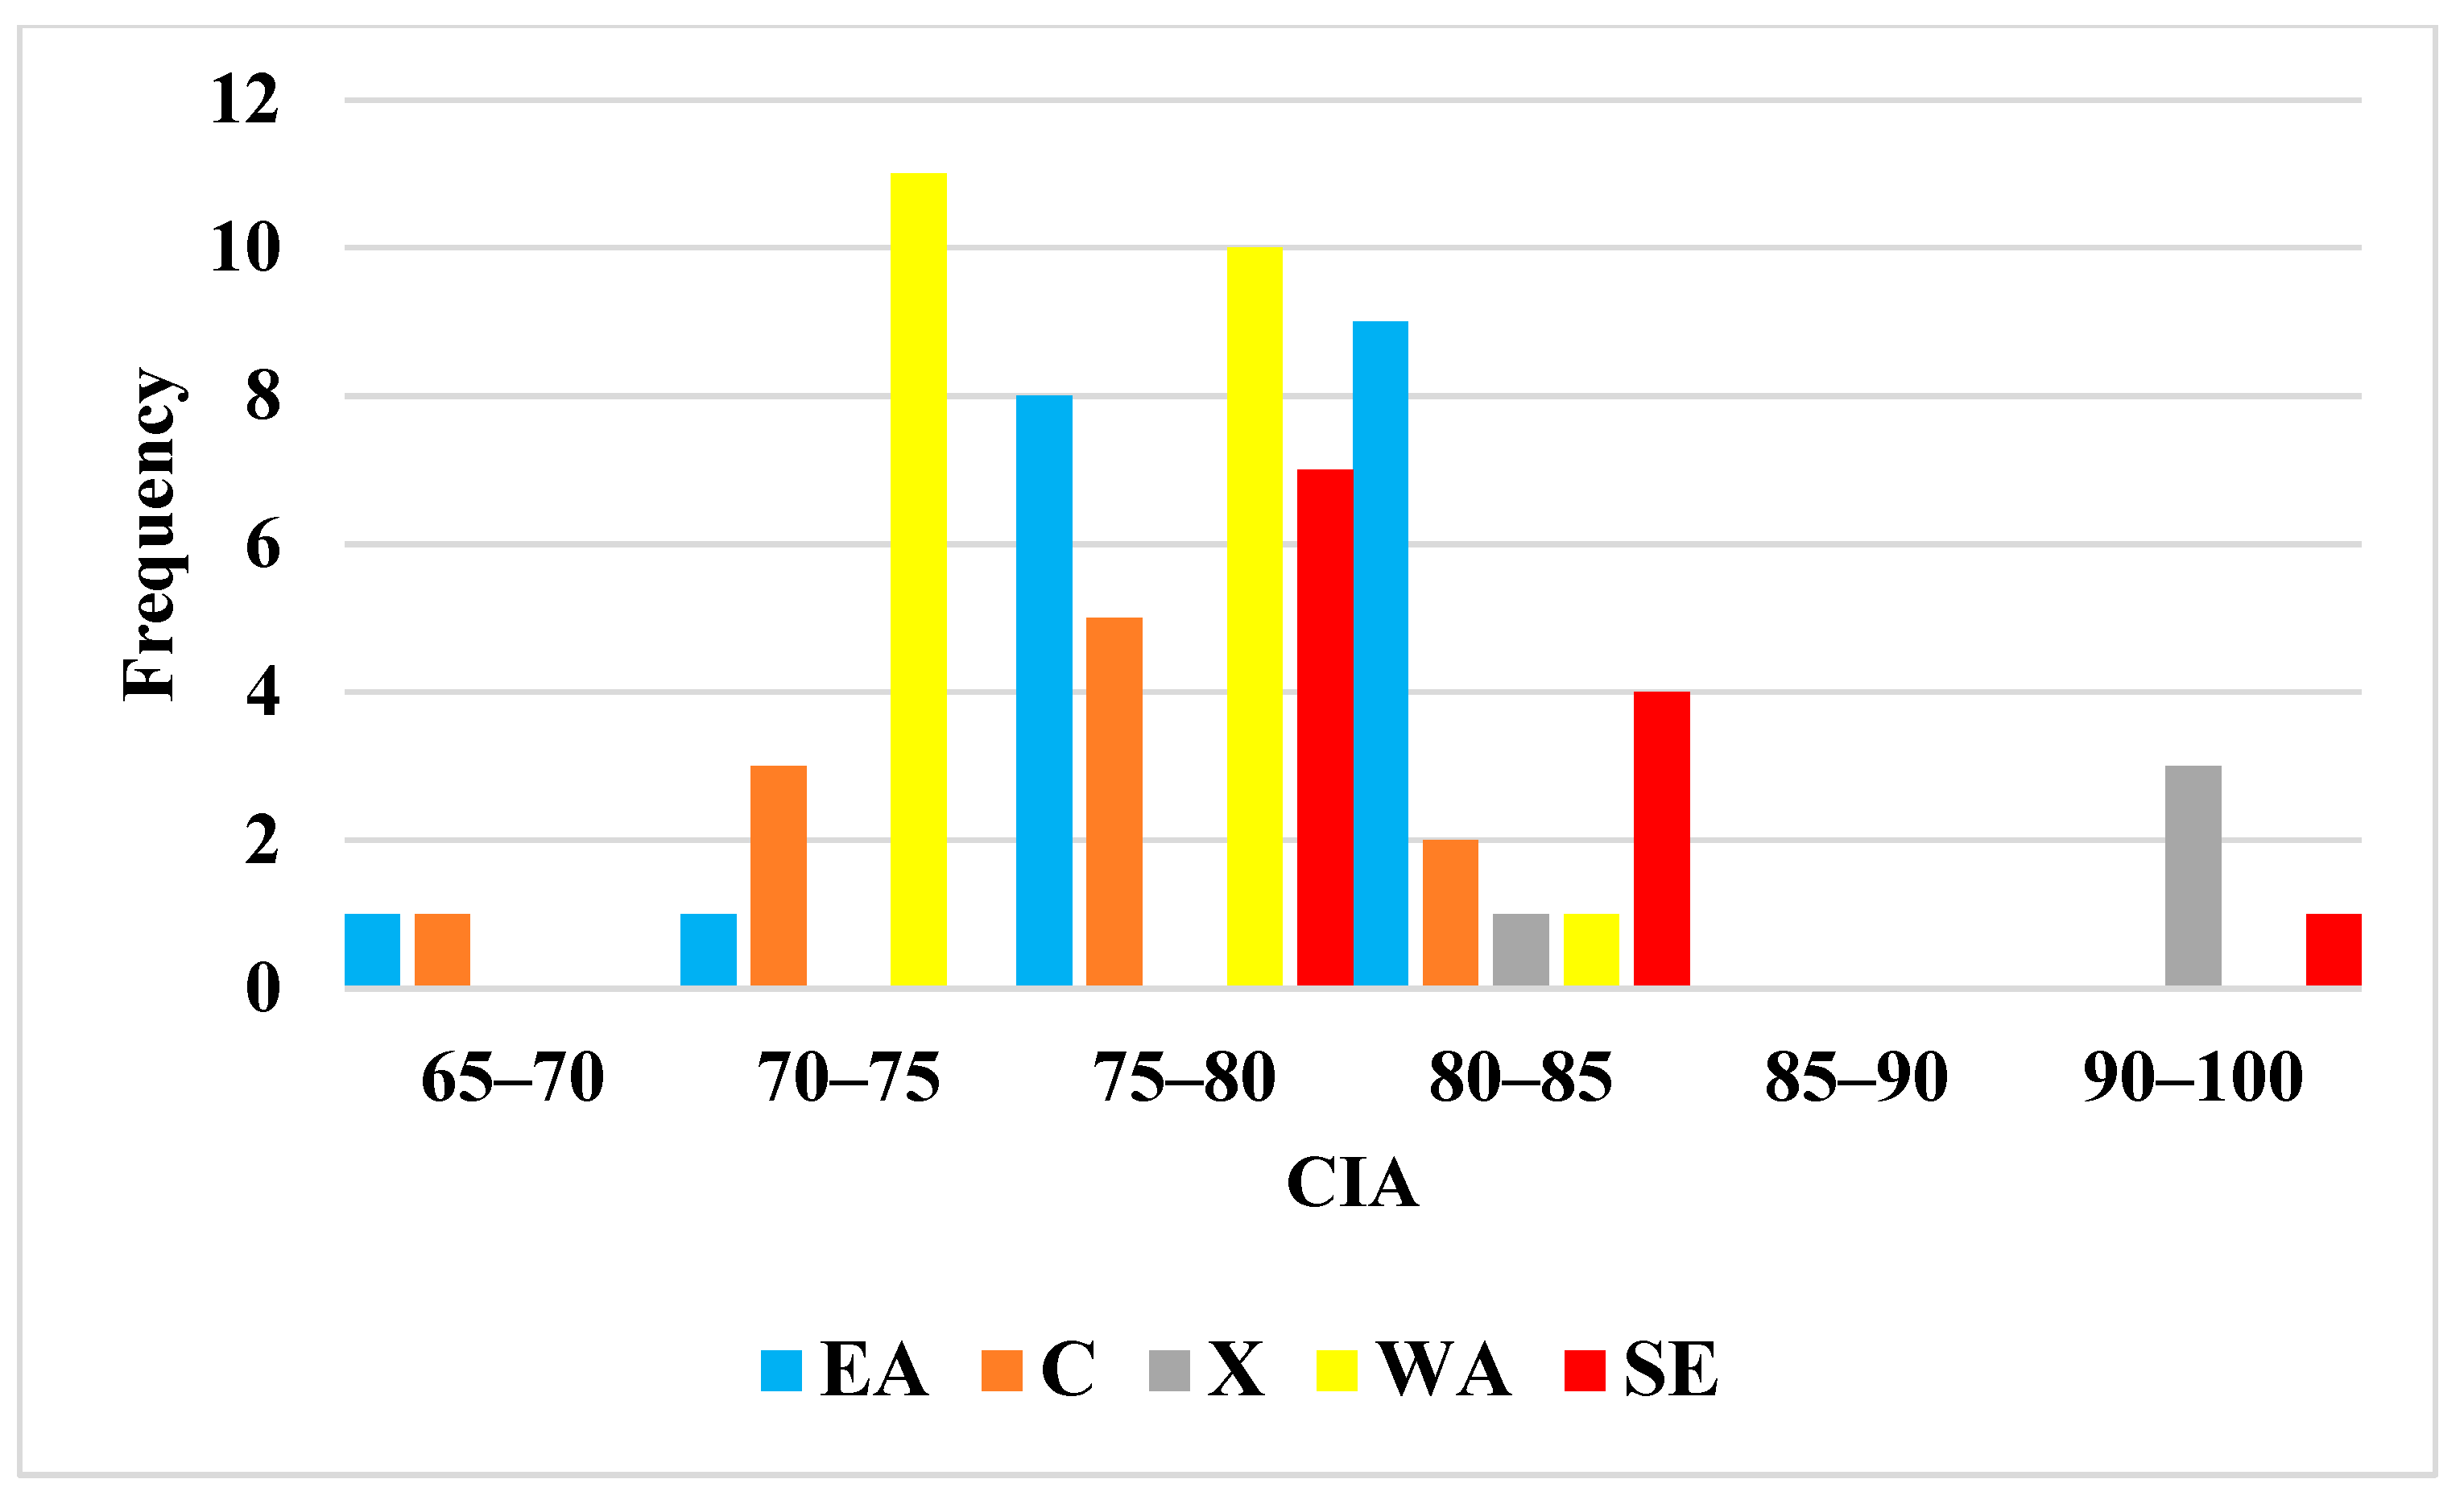
Another means of discrimination is the chemical index of weathering or alteration (CIP) that has been proposed by Nesbitt and Young [46], taking into consideration that the upper crust consists of plagioclase, quartz, and potassium feldspar; the latter are the most labile minerals, susceptible to the weathering and consequently the formation of clay minerals [46]. Since, calcium, potassium, and sodium are removed from the feldspars, Al2O3 content increases in the weathered product compared to the alkaline elements. Thus, the chemical index of alteration (CIA) is considered a good measure of the degree of weathering and is given by the equation CIA = [Al2O3/(Al2O3 + CaO* + Na2O + K2O] × 100, using the molecular proportions of the oxides. Because CaO is considered partially incorporated in silicates of the rock, and since in the studied cases carbonates are abundant, the equation is used modified as CIA = [Al2O3/(Al2O3 + N a2O + K2O] × 100 [47]. The chemical index of alteration (CIA) for the samples from the northeastern Peloponnese ranges from 65 to 85, apart from three samples from Xylokastro which have a much higher index reaching 93 (Figure 9). The samples from western Achaea show a slight difference with a range from 70 to 80, whereas the majority of the samples from south Epirus have an index ranging from 75 to 85. The highest indices for the samples from north-eastern Peloponnese suggest the incorporation of slightly higher weathered material, particularly in Xylokastro samples. Harnois [48] proposed that the CIA increases according to the degree of depletion of the sediments in Ca and Na in relation to Al. Thus, the parent rocks of the samples from Corinth, eastern Achaea, and especially from Xylokastro seem to have undergone a higher degree of weathering. The values for CIA of all samples are given in Table A3 in the Appendix A.
In terms of how the chemical composition controls the behavior of the raw material during firing, the content in alkaline and/or alkaline-earth oxides, such as Na2O, K2O, and CaO, contributes to the fusibility of the material, SiO2 and Al2O3 contributes to the refractory feature of the clay paste, and Fe2O3 influences the colour of the end material. The high content of CaO combined with the content of Fe2O3 distinguishes the ceramic bodies in yellowish or pinkish shades. The scatter diagram (Figure 3b) shows the plot of the phyllosilicates versus the sum of CaO and Fe2O3 for the samples from all regions. It displays a clear discrimination between the samples from C, X, and ΕA from the rest of the samples. The samples from ΕA are richer in CaO + Fe2O3 compared to the samples from C and X. The content in Fe2O3 distinguishes the ceramic bodies into light-firing (from white to light brown) and dark-firing (from pink to dark brown) [49]. The samples from ΕA are richer in Fe2O3, which indicates that the ceramic body would obtain a white to light brown colour after firing. Indeed, according to Xanthopoulou [10], the construction of experimental briquettes from these clays were showed to take on a mainly pale yellow or pale brown colour after firing. On the contrary, the samples from C that contain more CaO had yellowish or pale yellow or pinkish shades. The samples from X seem to have lower CaO + Fe2O3, indicating dark-firing, a fact which is verified by the pale brown and pale yellow colour of the experimental briquettes in Xanthopoulou [10]. The rest of the samples are shown to be richer in phyllosilicates and contain less CaO + Fe2O3. That means that the ceramic body would obtain slightly darker shades after firing.
Regarding the origin of all the samples, it seems that those from western Achaea originate from silicate-rich rocks compared to the ΕA, C, and X samples. Furthermore, according to the chemical index of weathering, the samples from WA are less weathered materials, in relation to the eastern region samples, indicating a different parent rock.
5. Conclusions
The mineralogical and chemical study of clayey sediments from western Achaia (WA) and south Epirus (SE), and their comparison with previously studied clays from eastern Achaia (EA), Corinthia (C), and the Xylokastro area (X), enabled us to reveal eventual compositional differences among them. Moreover, the characterization of their compositional variability and the evaluation of their technological properties provided important aspects on their suitability and use as proper ceramic materials. The results obtained so far have permitted us to draw the following conclusions:
- In terms of the mineralogical composition, the samples from WA and SE are poorer in carbonates (i.e., calcite and/or dolomite) and richer in plagioclase than those studied from EA, C, and X. We can thus infer that their employment in ceramic manufacture will require the application of a different technological approach (e.g., firing temperature) in respect to what has been acknowledged for clay materials from EA, C, and X in previous studies [10,12].
- WA and SE samples are also richer in clay minerals. On the contrary, EA, C, and X samples are either poorer in smectite or smectite participates only in mixed-layers.
- Concerning the technological parameters, the WA and SE samples are richer in the silt fraction, and a greater number of them are characterized by higher plastic limits.
- The high calcium content and the fine particle size attested in eastern Peloponnese samples are characteristics of majolica manufacturing [50]. This type of raw material could be used by the ancient potters after their pretreatment, such as levigation or settling, in order to succeed the optimal properties [12]. Moreover, these raw materials could be chosen for the manufacture of pottery belonging to the light firing and are useful for the decorations.
- Due to their calcareous nature and similarly to what has already been attested for those from EA, C, and X, the clay materials studied herein can be used as “porous” clays.
- Finally, WA and SE samples are plagioclase-rich and can thus be characterized as vitrifying clays. Likewise, raw materials are suitable for making ceramic products with low open porosity and high mechanical resistance [33].
The detailed description of the compositional range and the technological parameters of the clayey raw materials cropping out in the study area contributes to the completion of the puzzle that comprises the ceramic raw materials available in the wider area of western Greece. The geology of this area is characterized by the successive repetitions of the geological units that consist of it, thus its in-depth characterization can be proven an integral element for the archaeometric studies that are increasing exponential in the wider area, both spatially and temporally. Ultimately, the current research will potentially trigger likewise approaches in the neighboring areas, providing a robust tool for provenance and technological issues in ancient ceramic manufacture.
Author Contributions
Conceptualization, V.X. and I.I.; methodology, V.X.; software, V.X.; validation, V.X. formal analysis, V.X.; investigation, V.X. and I.I.; resources, V.X. and I.I.; data curation, V.X.; writing—original draft preparation, V.X.; writing—review and editing, V.X. and I.I.; visualization, V.X. and I.I.; supervision, V.X. and I.I.; project administration, V.X. and I.I.; funding acquisition, V.X. All authors have read and agreed to the published version of the manuscript.
Funding
This research is co-financed by Greece and the European Union (European Social Fund-ESF) through the Operational Programme «Human Resources Development, Education and Lifelong Learning» in the context of the project “Reinforcement of Postdoctoral Researchers-2nd Cycle” (MIS-5033021), implemented by the State Scholarships Foundation (IKY). The funding number of the scholarship is 2019-050-0503-18714.
Data Availability Statement
https://www.didaktorika.gr/eadd/browse?type=author&order=ASC&sort_by=2&rpp=50&value=Xanthopoulou%2C+Vayia+A; “URL (accessed on 6 February 2023)” https://nemertes.library.upatras.gr/items/19c023a1-344a-4d5c-92fb-a027424a9d9a, “URL (accessed on 6 February 2023)”.
Acknowledgments
The authors thank the State Scholarships Foundation (IKY) for the research funding. In addition, the authors thank the laboratory of Sedimentology of the Department of Geology, of the University of Patras, for the particle size analysis.
Conflicts of Interest
The authors declare no conflict of interest.
Appendix A
Procedure of the extraction of clay fraction.
After quartering the total amount of the collected material, a small aliquot of the original sample weighing ca. 10 g was gently pulverized in a porcelain mortar using a rubber pestle. Then, 4 g of the pulverized material was placed in a glass tube with a diameter of 2.5 cm and a height of 15 cm with two lines marked on it with a diamond pen; the first line at a height of 2 cm, and the second at 6 cm. The tube was then filled with deionized water up to the first line and some time was allowed to ensure no flocculation occurred. If so, a small amount of Calgon (sodium polyphosphate) was added and the mixture was placed in an ultrasonic bath for 10 min. It was then allowed to settle for 3 h and the material in suspension between the two lines was taken up with a syringe and spread on 3 different smeared glass slides. The slides with the clay fraction were put in a desiccator and left to dry overnight.
Figure A1.
Representative composite X-ray diffractograms of the samples from WA: (a) calcareous and (b) non-calcareous. Abbreviations: Qz = Quartz, Cc = Calcite, Pl = Plagioclase, Chl = Chlorite, Ill = Illite, Mu = Muscovite.
Figure A1.
Representative composite X-ray diffractograms of the samples from WA: (a) calcareous and (b) non-calcareous. Abbreviations: Qz = Quartz, Cc = Calcite, Pl = Plagioclase, Chl = Chlorite, Ill = Illite, Mu = Muscovite.

Figure A2.
Representative composite X-ray diffractograms of the samples from SE: (a) calcareous and (b) non-calcareous. Abbreviations: Qz = Quartz, Cc = Calcite, Pl = Plagioclase, Do = Dolomite, Chl = Chlorite, Ill = Illite, Mu = Muscovite, CM = Clay minerals.
Figure A2.
Representative composite X-ray diffractograms of the samples from SE: (a) calcareous and (b) non-calcareous. Abbreviations: Qz = Quartz, Cc = Calcite, Pl = Plagioclase, Do = Dolomite, Chl = Chlorite, Ill = Illite, Mu = Muscovite, CM = Clay minerals.

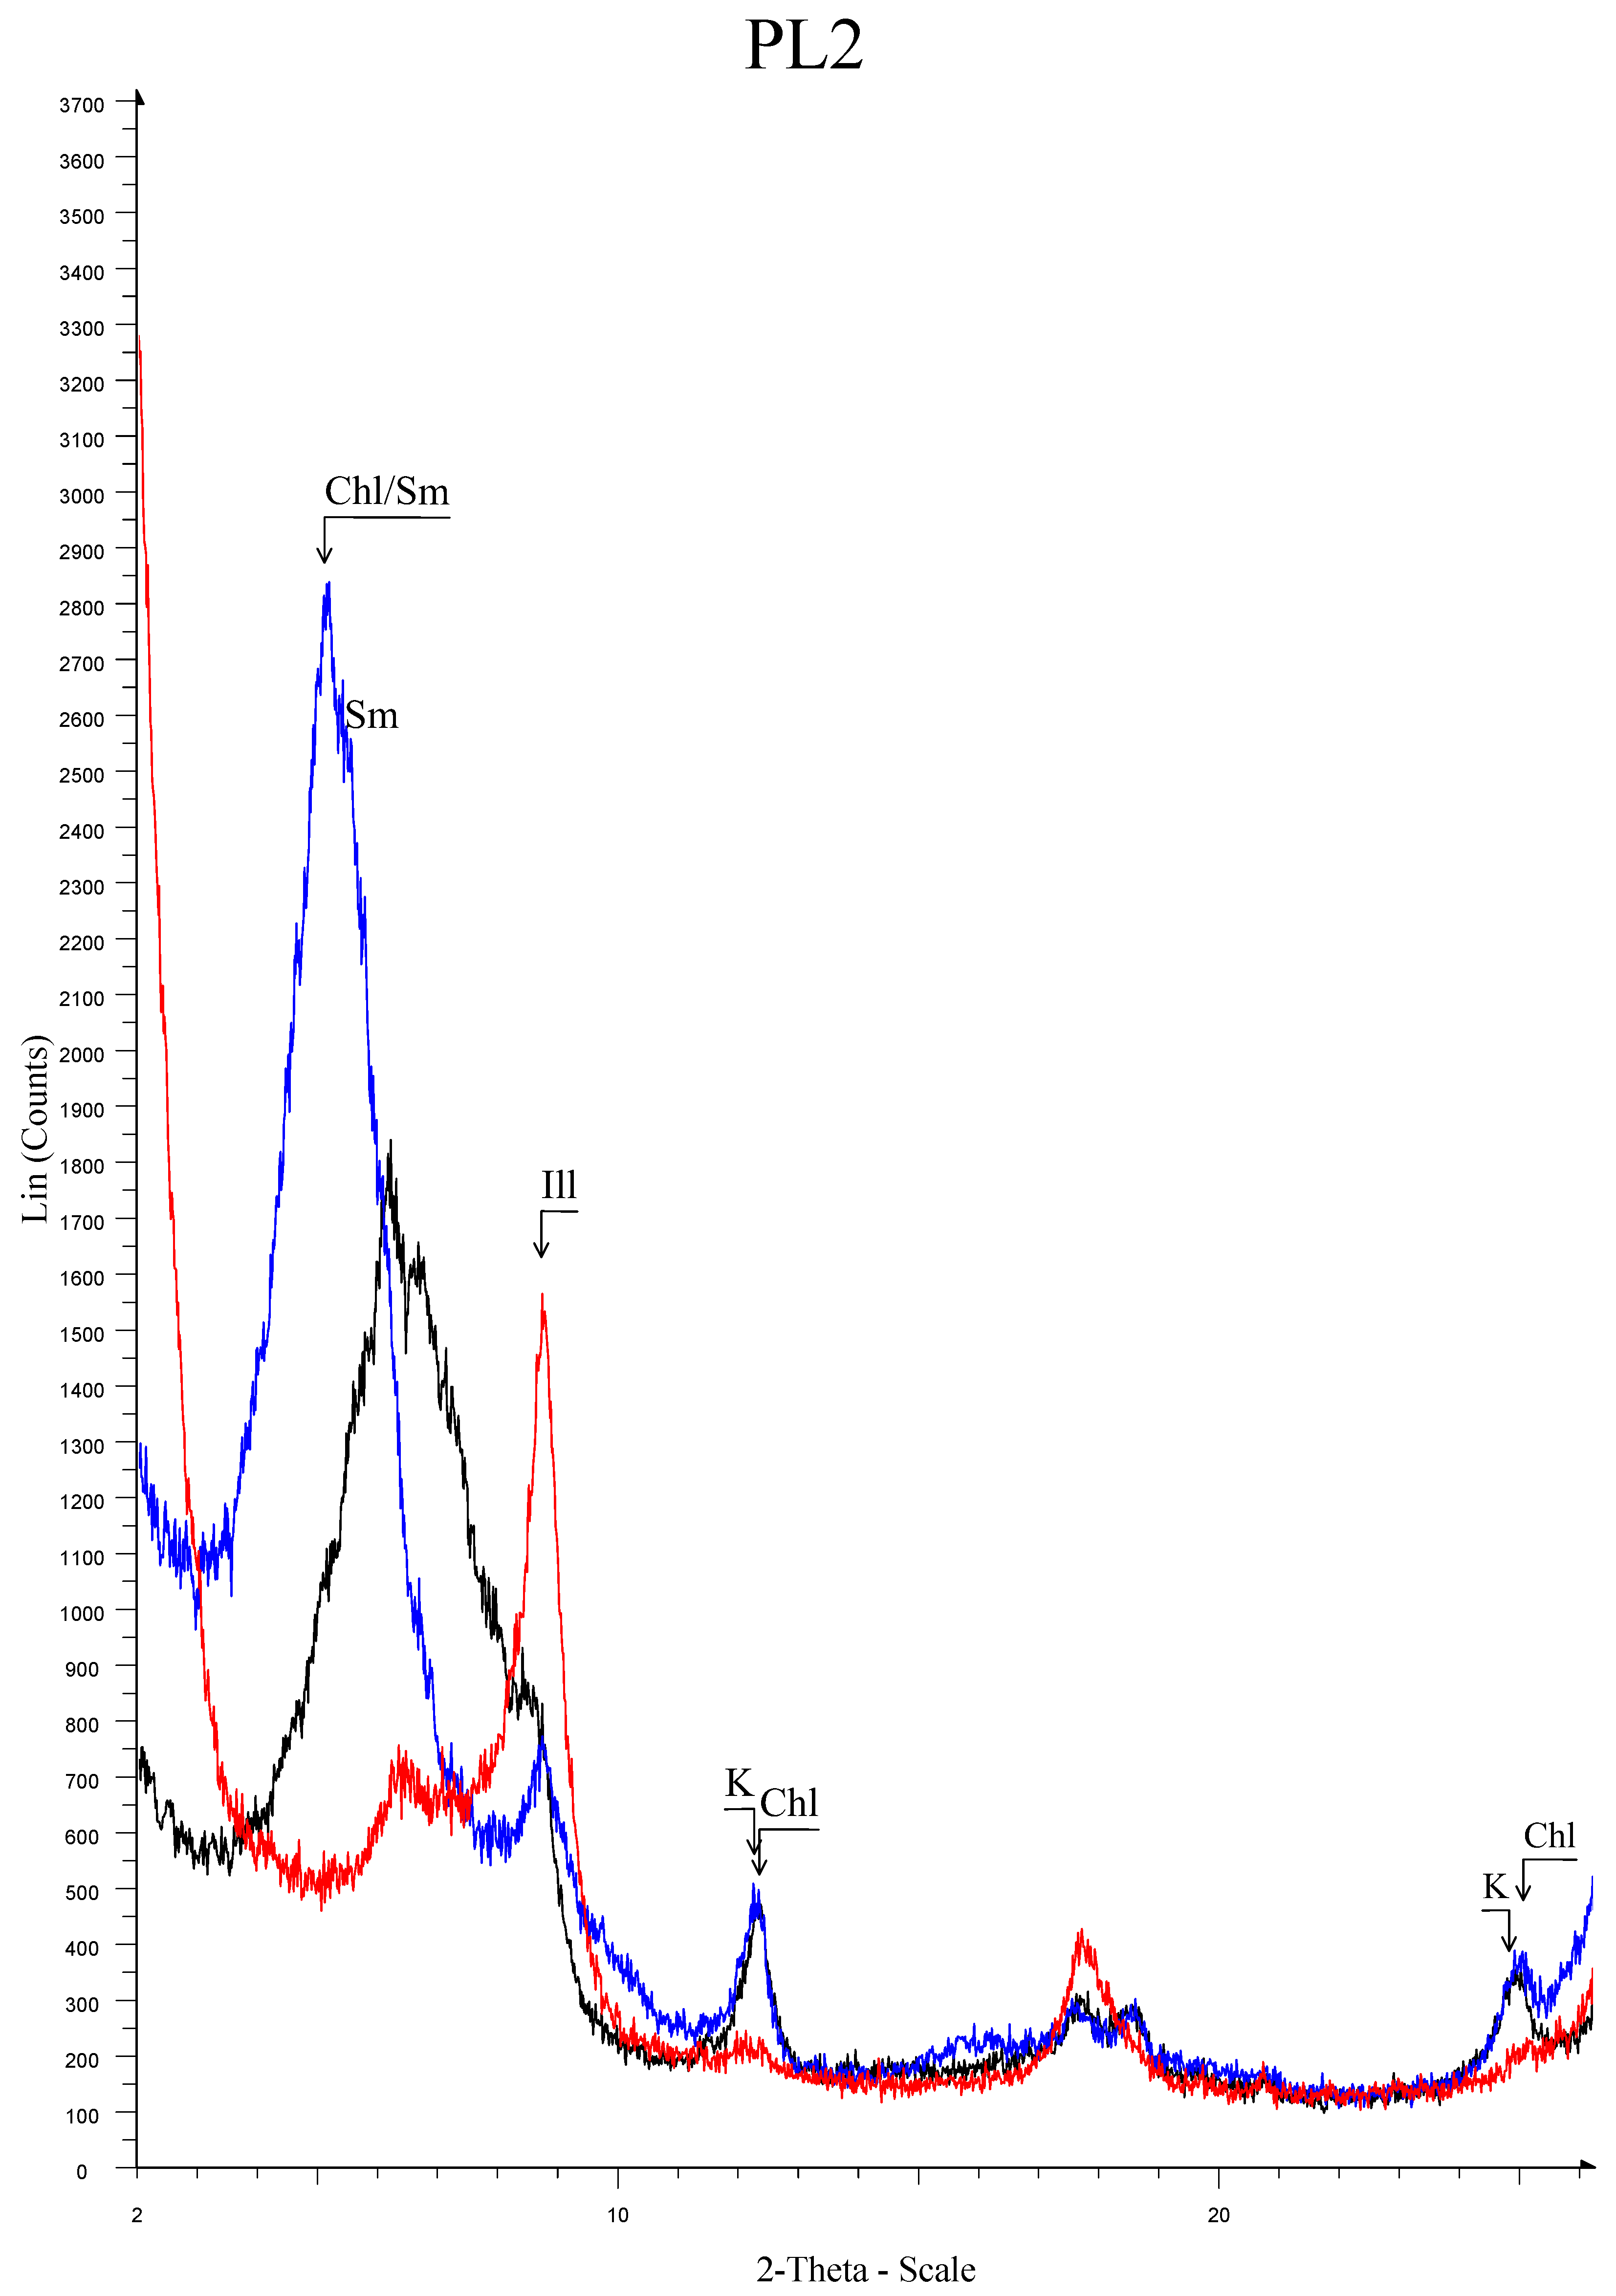
Figure A3.
Representative composite diffractogram of the illitic clayey raw materials established according to the clay minerals content revealed from the <2 μm fraction. The diffraction pattern of each preparation is intentionally equally displaced in respect to Y axis to obtain a better visual. Abbreviations: Ill = Illite, Chl = Chlorite, K = Kaolinite, Chl/Sm = Chlorite/Smectite. Red line = heated at 490 °C; Blue line = ethylene-glycol solvation; Black line = air dried.

Figure A4.
Representative composite diffractogram of the illitic-chloritic clayey raw materials established according to the clay minerals content revealed from the <2 μm fraction. The diffraction pattern of each preparation is intentionally equally displaced in respect to the Y axis for obtaining the better visual. Abbreviations: Ill = Illite, Chl = Chlorite. Red line = heated at 490 °C; Blue line = ethylene-glycol solvation; Black line = air dried.

Figure A5.
Representative composite diffractogram of the smectite clayey raw materials established according to the clay mineral content revealed from the <2 μm fraction. The diffraction pattern of each preparation is intentionally equally displaced in respect to Y axis to obtain a better visual. Abbreviations: Sm = Smectite, Ill = Illite, Ill/Sm = Illite/Smectite. Red line = heated at 490 °C; Blue line = ethylene-glycol solvation; Black line = air dried.

Figure A6.
Representative composite diffractogram of SE clayey raw materials established according to the clay minerals content revealed from the <2 μm fraction. The diffraction pattern of each preparation is intentionally equally displaced in respect to the Y axis to obtain a better visual. Abbreviations: Sm = Smectite, Chl = Chlorite, K = Kaolinite, Ill = Illite, Chl/Sm = Chlorite/Smectite. Red line = heated at 490 °C; Blue line = ethylene-glycol solvation; Black line = air dried.


Table A1.
Precision, accuracy, and detection limits of the WD-XRF of the Laboratory of Electron Microscopy and Microanalysis, University of Patras, Greece.
Table A1.
Precision, accuracy, and detection limits of the WD-XRF of the Laboratory of Electron Microscopy and Microanalysis, University of Patras, Greece.
| Precision | Accuracy | Detection Limits (LDL) | |
|---|---|---|---|
| Na2O | 0.98 | −1.54 | 0.01 |
| MgO | 3.47 | −18.81 | 0.01 |
| Al2O3 (%) | 0.52 | 1.07 | 0.001 |
| SiO2 | 0.42 | −0.65 | 0.004 |
| P2O5 | 0.26 | −1.88 | 0.01 |
| K2O | 1.23 | 3.35 | 0.05 |
| CaO | 0.65 | −5.91 | 0.001 |
| TiO2 | 0.83 | 0.13 | 0.01 |
| MnO | 3.17 | −4.86 | 0.01 |
| Fe2O3 | 0.35 | −6.59 | 0.01 |
| V | 2.45 | −13.33 | 2.12 |
| Cr | 3.43 | −6.62 | 0.29 |
| Co | 4.81 | −35.71 | 1.04 |
| Ni | 4.19 | 11.18 | 0.12 |
| Cu | 3.33 | −7.08 | 10 |
| Zn | 1.15 | −3.11 | 15.87 |
| Rb | 1.15 | −13.81 | 0.039 |
| Sr | 0.33 | −2.05 | 0.2 |
| Y | 7.85 | −13.00 | 0.016 |
| Zr | 0.44 | 2.50 | 0.034 |
| Ba | 2.10 | −3.43 | 3.38 |
| Pb | 4.84 | −26.19 | 5.7 |
Table A2.
Elemental concentrations obtained through inductively coupled plasma mass spectrometry (ICP-MS) for the clay-rich samples.
Table A2.
Elemental concentrations obtained through inductively coupled plasma mass spectrometry (ICP-MS) for the clay-rich samples.
| SAMPLES | Cr | Ba | Ga | Lu | La | Ce | Pr | Nd | Sm | Eu | Gd | Dy | Er | Tm | Yb | Ta | Th | Sc | Co |
|---|---|---|---|---|---|---|---|---|---|---|---|---|---|---|---|---|---|---|---|
| PL1 | 370 | 229 | 11 | 0.28 | 19.7 | 37.7 | 4.5 | 18.1 | 3.6 | 0.83 | 3.2 | 3.3 | 1.9 | 0.26 | 1.9 | 0.5 | 5.6 | 13.9 | 17 |
| PL2 | 290 | 230 | 14 | 0.3 | 22.9 | 43.4 | 5.12 | 20.2 | 4.1 | 0.9 | 3.7 | 3.6 | 2.1 | 0.31 | 1.9 | 0.7 | 6.8 | 13.1 | 20 |
| V1 | 180 | 299 | 10 | 0.21 | 16 | 30.1 | 3.68 | 14.3 | 2.9 | 0.6 | 2.4 | 2.5 | 1.5 | 0.22 | 1.4 | 0.5 | 5.1 | 8.1 | 14 |
| AM1 | 90 | 124 | 8 | 0.13 | 12.5 | 24.7 | 2.79 | 10.4 | 2.1 | 0.43 | 1.7 | 1.7 | 1 | 0.14 | 0.9 | 0.4 | 3.8 | 16.7 | 6 |
| AM2 | 390 | 360 | 18 | 0.4 | 28.1 | 70.6 | 6.55 | 24.6 | 5.1 | 1.03 | 4.3 | 4.5 | 2.6 | 0.39 | 2.6 | 1.2 | 10.3 | 9.6 | 25 |
| N1 | 340 | 258 | 11 | 0.3 | 19.3 | 38.2 | 4.48 | 17.5 | 3.9 | 0.81 | 3.4 | 3.4 | 2 | 0.28 | 1.8 | 0.6 | 5.5 | 18.1 | 17 |
| N2 | 350 | 303 | 15 | 0.33 | 24.9 | 49 | 5.85 | 23.5 | 4.9 | 1.03 | 4.1 | 4.1 | 2.3 | 0.34 | 2.2 | 0.8 | 7.8 | 17.4 | 20 |
| N3 | 490 | 254 | 11 | 0.27 | 18.9 | 37.8 | 4.39 | 16.9 | 3.6 | 0.81 | 3.2 | 3.3 | 1.8 | 0.25 | 1.7 | 0.6 | 5.5 | 17.4 | 19 |
| N4 | 320 | 270 | 13 | 0.34 | 22.9 | 44.8 | 5.45 | 21.3 | 4.6 | 0.91 | 3.8 | 3.9 | 2.2 | 0.31 | 2.1 | 0.6 | 6.6 | 16.0 | 17 |
| AK1 | 430 | 350 | 19 | 0.47 | 38.8 | 62.3 | 8.35 | 31.9 | 6.4 | 1.43 | 5.9 | 5.5 | 3.2 | 0.45 | 3 | 0.9 | 9.5 | 17.4 | 28 |
| GR1 | 230 | 311 | 16 | 0.36 | 26 | 52.2 | 6.01 | 23.1 | 4.9 | 1 | 4 | 4 | 2.3 | 0.35 | 2.4 | 0.9 | 8.5 | 16.7 | 17 |
| WA1 | 230 | 207 | 8 | 0.26 | 18.2 | 35 | 4.15 | 16.4 | 3.2 | 0.72 | 3 | 3.1 | 1.8 | 0.26 | 1.6 | 0.6 | 4.8 | 18.1 | 11 |
| WA4 | 200 | 263 | 10 | 0.25 | 18.3 | 36.5 | 4.38 | 17.3 | 3.7 | 0.82 | 3.2 | 3.2 | 1.9 | 0.27 | 1.7 | 0.6 | 5.2 | 16.7 | 13 |
| WA5 | 250 | 340 | 21 | 0.44 | 36.5 | 71.6 | 8.43 | 32.2 | 6.6 | 1.4 | 5.3 | 5.2 | 3 | 0.43 | 2.9 | 1.1 | 10.9 | 18.9 | 29 |
| WA9 | 240 | 248 | 13 | 0.32 | 22.3 | 44.2 | 5.19 | 19.5 | 4.2 | 0.88 | 3.4 | 3.6 | 2.1 | 0.3 | 2 | 0.7 | 6.8 | 20.3 | 14 |
| WA10 | 220 | 363 | 19 | 0.35 | 31.5 | 61.8 | 7.17 | 27.2 | 5.5 | 1.17 | 4.4 | 4.4 | 2.5 | 0.35 | 2.4 | 0.9 | 9.9 | 12.4 | 24 |
| WA20 | 310 | 335 | 15 | 0.38 | 30.8 | 54.1 | 7.5 | 29 | 6.2 | 1.32 | 5.2 | 4.8 | 2.6 | 0.37 | 2.3 | 0.7 | 8.6 | 14.6 | 17 |
| WA22 | 200 | 241 | 15 | 0.34 | 27.2 | 51.7 | 6.28 | 23.4 | 4.8 | 1.05 | 4.2 | 4.2 | 2.2 | 0.33 | 2.2 | 0.7 | 8.1 | 12.4 | 20 |
| WA26 | 180 | 237 | 16 | 0.31 | 24.9 | 47.3 | 5.61 | 22.3 | 4.4 | 0.97 | 3.7 | 3.7 | 2.2 | 0.31 | 2 | 0.7 | 7.5 | 9.6 | 25 |
| WA28 | 230 | 274 | 15 | 0.37 | 26.9 | 53.6 | 6.25 | 24.5 | 4.9 | 1.13 | 4.3 | 4.4 | 2.6 | 0.38 | 2.5 | 0.9 | 8.3 | 16.0 | 18 |
Table A3.
Elemental ratios for all the samples from the northern Peloponnese and south Epirus, and the chemical index of alteration (CIA).
Table A3.
Elemental ratios for all the samples from the northern Peloponnese and south Epirus, and the chemical index of alteration (CIA).
| SAMPLES | La/Sc | Th/Sc | La/Cr | Th/Cr | Th/Co | CIA |
|---|---|---|---|---|---|---|
| PL1 | 1.42 | 0.40 | 0.05 | 0.02 | 0.3 | 79.4 |
| PL2 | 1.74 | 0.52 | 0.08 | 0.02 | 0.3 | 76.3 |
| V1 | 1.96 | 0.63 | 0.09 | 0.03 | 0.4 | 80.3 |
| AM1 | 0.75 | 0.23 | 0.14 | 0.04 | 0.6 | 82.6 |
| AM2 | 2.94 | 1.08 | 0.07 | 0.03 | 0.4 | 83.8 |
| N1 | 1.06 | 0.30 | 0.06 | 0.02 | 0.3 | 76.7 |
| N2 | 1.43 | 0.45 | 0.07 | 0.02 | 0.4 | 76.7 |
| N3 | 1.08 | 0.32 | 0.04 | 0.01 | 0.3 | 75.8 |
| N4 | 1.43 | 0.41 | 0.07 | 0.02 | 0.4 | 77.1 |
| AK1 | 2.23 | 0.55 | 0.09 | 0.02 | 0.3 | 80.0 |
| GR1 | 1.56 | 0.51 | 0.11 | 0.04 | 0.5 | 74.6 |
| WA1 | 1.00 | 0.26 | 0.08 | 0.02 | 0.4 | 73.3 |
| WA4 | 1.09 | 0.31 | 0.09 | 0.03 | 0.4 | 74.7 |
| WA5 | 1.94 | 0.58 | 0.15 | 0.04 | 0.4 | 76.6 |
| WA9 | 1.10 | 0.34 | 0.09 | 0.03 | 0.5 | 75.0 |
| WA10 | 2.53 | 0.80 | 0.14 | 0.05 | 0.4 | 75.9 |
| WA20 | 2.11 | 0.59 | 0.10 | 0.03 | 0.5 | 75.6 |
| WA22 | 2.19 | 0.65 | 0.14 | 0.04 | 0.4 | 75.4 |
| WA26 | 2.60 | 0.78 | 0.14 | 0.04 | 0.3 | 70.7 |
| WA28 | 1.68 | 0.52 | 0.12 | 0.04 | 0.5 | 77.5 |
| HS33 | 2.17 | 0.60 | 0.14 | 0.04 | 0.3 | 75.7 |
| HS35a | 1.98 | 0.60 | 0.25 | 0.08 | 0.5 | 67.3 |
| HS38 | 2.80 | 0.64 | 0.14 | 0.03 | 0.3 | 82.3 |
| HS45 | 2.03 | 0.61 | 0.14 | 0.04 | 0.4 | 77.7 |
| HS47 | 2.04 | 0.58 | 0.16 | 0.05 | 0.3 | 82.0 |
| HS50 | 2.43 | 0.54 | 0.12 | 0.03 | 0.3 | 81.8 |
| HS51 | 2.38 | 0.57 | 0.13 | 0.03 | 0.3 | 84.0 |
| HS55a | 2.30 | 0.59 | 0.14 | 0.04 | 0.4 | 80.1 |
| C2 | 2.01 | 0.54 | 0.12 | 0.03 | 0.3 | 81.2 |
| C4 | 1.88 | 0.54 | 0.14 | 0.04 | 0.4 | 78.5 |
| C6 | 1.88 | 0.52 | 0.18 | 0.05 | 0.3 | 81.4 |
| C9 | 2.11 | 0.75 | 0.14 | 0.05 | 0.4 | 81.8 |
| C10 | 2.10 | 0.63 | 0.12 | 0.04 | 0.4 | 79.4 |
| C11 | 1.89 | 0.55 | 0.14 | 0.04 | 0.4 | 70.8 |
| C14 | 2.03 | 0.60 | 0.13 | 0.04 | 0.2 | 91.3 |
| X1 | 3.18 | 0.78 | 0.11 | 0.03 | 0.6 | 84.8 |
| X3 | 1.95 | 0.56 | 0.17 | 0.05 | 0.5 | 93.4 |
| X4 | 1.93 | 0.55 | 0.17 | 0.05 | 0.4 | 92.8 |
| UC | 2.21 | 0.79 | 0.36 | 0.13 | 0.63 | - |
| PAAS | 2.4 | 0.91 | 0.35 | 0.13 | 0.63 | - |
Table A4.
Mineralogical composition of the whole sediment of EA, C, and X clayey raw materials (relative abundance %). Abbreviations: CM = total clay minerals.
Table A4.
Mineralogical composition of the whole sediment of EA, C, and X clayey raw materials (relative abundance %). Abbreviations: CM = total clay minerals.
| Samples | Quartz | Calcite | Plagioclase | K-Feldspar | Dolomite | Gypsum | CM |
|---|---|---|---|---|---|---|---|
| C2 | 12 | 52 | 14 | - | - | - | 23 |
| C4 | 25 | 39 | 8 | - | 1 | - | 27 |
| C5 | 27 | 34 | 23 | - | - | - | 16 |
| C6 | 21 | 48 | 11 | - | - | 1 | 19 |
| C8 | 28 | 50 | 10 | - | 3 | - | 8 |
| C9 | 56 | 2 | 0 | - | - | - | 42 |
| C10 | 20 | 45 | 12 | - | - | - | 23 |
| C11 | 16 | 59 | 3 | - | 10 | - | 12 |
| C13 | 10 | 77 | 4 | - | - | - | 9 |
| C14 | 14 | 67 | 7 | - | - | - | 13 |
| X1 | 19 | 60 | 4 | - | 10 | - | 8 |
| X2 | 13 | 57 | 5 | - | 14 | - | 11 |
| X3 | 15 | 54 | 6 | - | 15 | - | 10 |
| HS31 | 56 | 33 | 7 | - | - | - | 4 |
| HS32a | 30 | 34 | 10 | 8 | 3 | - | 15 |
| HS23b | 32 | 32 | 13 | - | 3 | - | 20 |
| HS33 | 27 | 37 | 13 | - | - | - | 23 |
| HS35a | 17 | 25 | 9 | - | 32 | - | 17 |
| HS36a | 33 | 50 | 9 | - | 7 | ||
| HS36b | 27 | 59 | 6 | - | - | - | 8 |
| HS38 | 15 | 63 | 4 | - | 5 | - | 13 |
| HS39 | 15 | 64 | 6 | - | 3 | - | 11 |
| HS41a | 14 | 38 | 7 | 7 | 22 | - | 12 |
| HS41c | 12 | 20 | 13 | - | 42 | - | 12 |
| HS44 | 14 | 72 | 4 | - | 3 | - | 7 |
| HS45 | 35 | 11 | 20 | - | - | - | 34 |
| HS46 | 26 | 53 | 6 | - | 4 | - | 10 |
| HS47 | 21 | 50 | 8 | - | - | - | 20 |
| HS49 | 20 | 51 | 7 | - | 13 | - | 9 |
| HS50 | 20 | 60 | 4 | - | 8 | - | 8 |
| HS51 | 11 | 71 | 4 | - | 6 | - | 8 |
| HS54 | 25 | 55 | 9 | - | - | - | 10 |
| HS55a | 24 | 57 | 10 | - | - | - | 9 |
Table A5.
List of the studied samples and the analytical techniques and methods used.
| SAMPLES | XRPD | XRF | ICP-MS | PLASTICITY | GRANULOMETRY | |
|---|---|---|---|---|---|---|
| Bulk | Clay Fraction | |||||
| WA1 | ✓ | ✓ | ✓ | ✓ | ✓ | ✓ |
| WA2 | ✓ | ✓ | ✓ | |||
| WA3 | ✓ | ✓ | ||||
| WA4 | ✓ | ✓ | ✓ | ✓ | ||
| WA5 | ✓ | ✓ | ✓ | ✓ | ✓ | ✓ |
| WA8 | ✓ | |||||
| WA9 | ✓ | ✓ | ✓ | ✓ | ✓ | ✓ |
| WA10 | ✓ | ✓ | ✓ | ✓ | ✓ | ✓ |
| WA20 | ✓ | ✓ | ✓ | ✓ | ✓ | ✓ |
| WA21 | ✓ | ✓ | ✓ | ✓ | ✓ | |
| WA22 | ✓ | ✓ | ✓ | ✓ | ✓ | ✓ |
| WA23 | ✓ | ✓ | ✓ | ✓ | ✓ | |
| WA24 | ✓ | ✓ | ✓ | |||
| WA25 | ✓ | ✓ | ✓ | ✓ | ✓ | |
| WA26 | ✓ | ✓ | ✓ | ✓ | ✓ | ✓ |
| WA27 | ✓ | ✓ | ✓ | ✓ | ✓ | |
| WA28 | ✓ | ✓ | ✓ | ✓ | ✓ | ✓ |
| WA29 | ✓ | ✓ | ✓ | ✓ | ✓ | |
| WA30 | ✓ | ✓ | ✓ | ✓ | ||
| PL1 | ✓ | ✓ | ✓ | ✓ | ✓ | ✓ |
| PL2 | ✓ | ✓ | ✓ | ✓ | ✓ | ✓ |
| AM1 | ✓ | ✓ | ✓ | ✓ | ✓ | ✓ |
| AM2 | ✓ | ✓ | ✓ | ✓ | ✓ | ✓ |
| AK1 | ✓ | ✓ | ✓ | ✓ | ✓ | ✓ |
| N1 | ✓ | ✓ | ✓ | ✓ | ✓ | ✓ |
| Ν2 | ✓ | ✓ | ✓ | ✓ | ✓ | ✓ |
| N3 | ✓ | ✓ | ✓ | ✓ | ✓ | ✓ |
| N4 | ✓ | ✓ | ✓ | ✓ | ✓ | ✓ |
| GR1 | ✓ | ✓ | ✓ | ✓ | ✓ | ✓ |
| V1 | ✓ | ✓ | ✓ | ✓ | ✓ | |
| V2 | ✓ | ✓ | ||||
References
- Papadopoulos, I. ACHAIA: Eastern and Western. In Archaeopress Archaeology; Achaios, E., Papadopoulou-Chrysikopoulou, V., Chrysikopoulos, G., Christakopoulou, G., Eds.; Archaeopress Publishing Ltd., England by Holywell Press: Oxford, UK, 2016. [Google Scholar]
- Gadolou, A. Achaea in Prehistoric Times. The Ceramic Production and the Burial Customs. Repository of the Archaeological Receipts and Expropriations Fund, Archaeological Collection, Athens, Greece. 2008. Available online: http://www.tap.gr/tapadb/index.php/component/jshopping/product/view/6/1438 (accessed on 6 February 2023).
- Papadopoulos, T. A Late Mycenaean Koiné in Western Greece and Adjacent Ionian Islands; Institute of Classical Studies: London, UK, 1995; pp. 201–208. Available online: https://onlinelibrary.wiley.com/doi/abs/10.1111/j.2041-5370.1995.tb02112.x (accessed on 6 February 2023).
- Petropoulos, M. The mycenaean cemetery at nikoleika near aigion. In LH IIIC Chronology and Synchronisms II, LH III C Middle: Proceedings of the International Workshop Held at the Austrian Academy of Sciences at Vienna, Vienna, Germany, 29–30 October 2004; Deger-Jalkotzy, S., Zavadil, M., Eds.; Verlag der Österreichischen Akademie der Wissenschaften: Vienna, Germany, 2007; pp. 253–285. [Google Scholar]
- Petropoulos, M. Roman Lamps Workshops at Patra and the Lychnomanteio; Archaeological Bulletin, Ministry of Cultural Heritage: Athens, Greece, 1999; Volume 70. [Google Scholar]
- Petropoulos, M.; Pontrandolfo, A.; Rizakis, A.D. Prima Campagna di Ricognizioni Archeologiche in Egialea (Settembre-Ottobre 2002); Annuario della Scuola Archeologica di Atene LXXX, Serie III, 2, Tomo II; All’Insegna del Giglio: Roma, Italy, 2002; pp. 939–965. [Google Scholar]
- Rathossi, C. Ancient Ceramics from NW Peloponnese and the Provenance of Their Raw Materials: A Petrographic, Mineralogical, Geochemical and Archaeometric Approach. Ph.D. Thesis, University of Patras, Patras, Greece, 2005. [Google Scholar]
- Katsarou-Tzeveleki, S. Morphology and distribution of pottery at the early helladic settlement of Helike. In Helike IV. Ancient Helike and Aigialeia. Protohelladika; Katsonopoulou, D., Ed.; The Southern and Central Greek Mainland: Athens, Greece, 2011; pp. 89–125. [Google Scholar]
- Iliopoulos, I.; Xanthopoulou, V.; Tsolis-Katagas, P. A petrographic settlement of Helike, Achaea, Greece. In Helike IV. Ancient Helike and Aigialeia. Protohelladika; Katsonopoulou, D., Ed.; The Southern and Central Greek Mainland: Athens, Greece, 2011; pp. 127–142. [Google Scholar]
- Xanthopoulou, V. Assessment of Clayey Raw Material Suitability for Ceramic Production in Northern Peloponnese: An Archaeometric Approach. Ph.D. Thesis, Department of Geology, School of Natural Sciences, University of Patras, Patras, Greece, 2019. [Google Scholar]
- Xanthopoulou, V.; Iliopoulos, I.; Katsonopoulou, D.; Katsarou, S. Standardized patterns in the ceramic craft at early bronze age helike, Achaea, Greece. Archaeol. Anthropol. Sci. 2022, 14, 154. [Google Scholar] [CrossRef]
- Xanthopoulou, V.; Iliopoulos, I.; Avramidis, P. Assessment of clayey raw material suitability for ceramic pro-duction, in the Northern Peloponnese, Greece. Archaeol. Anthropol. Sci. 2021, 13, 50. [Google Scholar] [CrossRef]
- Tsoflias, P.; Loftus, D.L. Geological Map of Greece in 1:50,000—Nafpaktos Sheet; IGME: Athens, Greece, 1971. [Google Scholar]
- Tsoflias, P.; Fleury, J.J. Geological Map of Greece, Patrai Sheet, 1:50.000; Institute of Geology and Mineral Exploration: Athens, Greece, 1980. [Google Scholar]
- Tsoflias, P.; Fleury, J.J.; Bizon, G.; Stoppeld, D.; Symeonidis, N. Geological Map of Greece, Khalandritasa Sheet, 1:50.000; Institute of Geology and Mineral Exploration: Athens, Greece, 1984. [Google Scholar]
- Dercourt, J.; Dercourt, F.; Meilliez, J.M.; Flament, P.; de Wever, J.J. Fleury. Kertezi Sheet IGME, Athens, 1:50,000 Map of Greece; IGME: Athens, Greece, 1978. [Google Scholar]
- Tsoflias, P. Geological Sheet of Nea Manolas (1:50.000); IGME: Athens, Greece, 1977. [Google Scholar]
- Fleury, J.J.; De Wever, P.; Izart, A.; Dercourt, J. Geological Map of Greece: Goumeron Sheet, Scale 1:50,000; IGME: Athens, Greece, 1981. [Google Scholar]
- Manacos, K.; Skourtsi-Koronaiou, V.; Ioakim, C. Geological Map of Greece in scale 1:50,000, “Vonitsa” Sheet; Institute of Geology and Mineral Exploration: Athens, Greece, 1996. [Google Scholar]
- Bizon, J.J.; Douthe, P.; Latreille, M.; Perrier, R.; Rochet, J.; Savoyat, E.; Bizon, G. Geological Map of Greece in Scale 1:50,000, “Kanallakion” Sheet; Institute of Geology and Mineral Exploration: Athens, Greece, 1967. [Google Scholar]
- Savoyat, E.; Monopolis, D.; Bizon, G. Geological Map of Greece in Scale 1:50,000, “Peta” Sheet; Institute of Geology and Mineral Exploration: Athens, Greece, 1966. [Google Scholar]
- Latreille, M.; Savoyat, E.; Monopolis, D.; Bizon, J.J.; Bizon, G. Geological Map of Greece in Scale 1:50,000, “Arta” Sheet; Institute of Geology and Mineral Exploration: Athens, Greece, 1969. [Google Scholar]
- Brown, G.; Brindley, G.W. (Eds.) X-ray diffraction procedures for clay mineral identification. In Crystal Structures of Clay Minerals and Their X-ray Identification; European Mineralogical Union: London, UK, 1980; p. 305359. [Google Scholar]
- Środoń, J.; Drits, V.A.; Douglas, K.; McCarty, D.K.; Hsieh, J.C.C.; Eberl, D.D. Quantitative X-ray diffraction analysis of clay-bearing rocks from random preparations. Clays Clay Min. 2001, 49, 514–528. [Google Scholar] [CrossRef]
- Kahle, M.; Kleber, M.; Jahn, R. Review of XRD-based quantitative analyses of clay minerals in soils: The suitability of mineral intensity factors. Geoderma 2002, 109, 191–205. [Google Scholar] [CrossRef]
- Shepard, F.P. Nomenclature based on sand-silt-clay ratios. J. Sediment. Petrol. 1954, 24, 151–158. [Google Scholar]
- Kretz, R. Symbols of rock-forming minerals. Am. Mineral. 1983, 68, 277–279. [Google Scholar]
- Billi, F.; Dondi, M.; Fabbri, B.; Morandi, N. Carbonatic clays for the production of porous ceramic tiles by fast single firing. Geol. Carpathica-Clays 1992, 2, 91–95. [Google Scholar]
- Dagounaki, C.; Sikalidis, C.; Kassoli-Fournaraki, A.; Tsirambides, A. The influence of carbonates on the techno-logical properties of an industrial red clay. Ind. Ceram. 2008, 28, 181–187. [Google Scholar]
- Hein, A.; Müller, N.; Day, P.M.; Kilikoglou, V. Thermal conductivity of archaeological ceramics: The effect of inclu-sions, porosity and firing temperature. Thermochim. Acta 2008, 480, 35–42. [Google Scholar] [CrossRef]
- Tite, M.S.; Kilikoglou, V.; Vekinis, G. Strength, toughness and thermal shock resistance of ancient ceramics, and their influence on technological choice. Archaeometry 2001, 43, 301–324. [Google Scholar] [CrossRef]
- Sokolář, R.; Keršnerová, L.; Šveda, M. The effect of different fluxing agents on the sintering of dry pressed porcelain bodies. J. Asian Ceram. Soc. 2017, 5, 290–294. [Google Scholar] [CrossRef]
- Gualtieri, S. Ceramic raw materials. How to establish the technological suitability of a raw material. Archaeol. Anthropol. Sci. 2020, 12, 183. [Google Scholar] [CrossRef]
- Casagrande, A. Notes on the design of the liquid limit device. Geotechnique 1985, 8, 84–91. [Google Scholar] [CrossRef]
- Marsigli, M.; Dondi, M. Plasticita delle argille italiane per laterizi e previsione del loro comportamento in foggiatura. L’Industria Laterizi 1977, 46, 214–222. [Google Scholar]
- Bender, W.F.; Ash, E.A. Brick and Tile Making-Procedures and Operating Practice in the Heavy Clay Industries; Bauverlag GMBH: Gütersloh, Germany, 1982. [Google Scholar]
- Levin, E.M.; Robbins, C.R.; McMurdie, H.F. Phase Diagrams for Ceramics; American Ceramic Society: Columbus, OH, USA, 1964; p. 601. [Google Scholar]
- Cullers, R.L.; Barrett, T.; Carlson, R.; Robinson, B. Rare-earth element and mineralogic changes in Holocene soil and stream sediment: A case study in the Wet Mountains, Colorado, U.S.A. Chem. Geol. 1987, 63, 275–297. [Google Scholar] [CrossRef]
- Taylor, S.R.; McLennan, S.M. The composition and evolution of the continental crust: Rare earth element evidence from sedimentary rocks. Philos. Trans. R. Soc. London. Ser. A Math. Phys. Sci. 1981, 301, 381–399. [Google Scholar]
- Taylor, S.R.; McLennan, S.M. The rare-earth evidence in Precambrian sedimentary rocks: Implications for crustal evolution. In Precambrian Plate Tectonics; Kröner, A., Ed.; Elsevier: Amsterdam, The Netherlands, 1981; pp. 527–548. [Google Scholar]
- Wronkiewicz, D.J.; Condie, K.C. Geochemistry of Archean shales from the witwatersrand supergroup, South Africa: Source-area weathering and provenance. Geochim. Cosmochim. Acta 1987, 51, 2401–2416. [Google Scholar] [CrossRef]
- Cullers, R.L. Mineralogical and chemical changes of soil and stream sediment formed by intense weathering of the Danburg granite, Georgia, USA. Lithos 1987, 21, 301–314. [Google Scholar] [CrossRef]
- Cullers, R.L. The chemical signature of source rocks in size fractions of Holocene stream sediment derived from metamorphic rocks in the wet mountains region, Colorado, USA. Chem. Geol. 1994, 113, 327–343. [Google Scholar] [CrossRef]
- Cullers, R.L. The controls on the major-and trace-element variation of shales, siltstones and sandstones of Pennsylvanian-Permian age from uplifted continental blocks in Colorado to platform sediments in Kansas, USA. Geochim. Et Cosmochim. Acta 1994, 58, 4955–4972. [Google Scholar] [CrossRef]
- Cullers, R.L.; Basu, A.; Suttner, L. Geochemical signature of provenance in sand-size material in soils and stream sediments near the Tobacco Root batholith, Montana, USA. Chem. Geol. 1988, 70, 335–348. [Google Scholar] [CrossRef]
- Nesbitt, H.W.; Young, G.M. Early proterozoic climates and plate motions inferred from major element chemistry of lutites. Nature 1982, 299, 715–717. [Google Scholar] [CrossRef]
- Tripathy, G.R.; Singh, S.K.; Ramaswamy, V. Major and trace element geochemistry of Bay of Bengal sediments: Implications to provenances and their controlling factors. Palaeogeogr. Palaeoclimatol. Palaeoecol. 2014, 397, 20–30. [Google Scholar] [CrossRef]
- Harnois, L. The CIW index: A new chemical index of weathering. Sediment. Geol. 1988, 55, 319–322. [Google Scholar] [CrossRef]
- Dondi, M.; Raimondo, M.; Zanelli, C. Clays and bodies for ceramic tiles: Reappraisal and technological classification. Appl. Clay Sci. 2014, 96, 91–109. [Google Scholar] [CrossRef]
- Pradell, T.; Molera, J. Ceramic technology. How to characterize ceramic glazes. Archaeol. Anthropol. Sci. 2020, 12, 189. [Google Scholar] [CrossRef]
Figure 1.
Modified geological map of Western Achaea, combined from IGME sheets of Nafpaktos, Patrai, Khalandritsa, Kertezi, Nea Manolas, Goumeron, and Dafni [13,14,15,16,17,18].

Figure 2.
Modified geological map of south Epirus, combined from IGME sheets of Peta, Vonitsa, Kanalaki, and Arta [19,20,21,22].

Figure 3.
(a) Plots of quartz versus calcite content and (b) scatter diagram of Fe2O3 + CaO vs. the % percentage weight of phyllosilicates.
Figure 3.
(a) Plots of quartz versus calcite content and (b) scatter diagram of Fe2O3 + CaO vs. the % percentage weight of phyllosilicates.

Figure 4.
Classification of the studied samples vs. eastern Achaean, Corinthian, and Xylokastro clay-rich sediments according to their grain size distribution and their projection on the Shepard diagram [26]. The data for Eastern Achaean, Corinthia, and Xyloakastro are given elsewhere [12].

Figure 5.
Plot on Casagrande’ s plasticity chart [34] of the studied clayey samples. Abbreviations: ML-CL = soils of clay and silt, ML = silt of low plasticity, OL or ML = organic silt or silt of low plasticity, OH or MH = organic silt or silt of high plasticity, CL = clay of low plasticity or lean clay, CH = clay of high plasticity or fat clay. The vertical line shows the liquid limit 50% that divides the chart into four main fields. The data for Eastern Achaean, Corinthia, and Xyloakastro are given elsewhere [12].

Figure 6.
(a) Classification of molding behavior using plastic limits (PL) and plasticity index (Ip) values [35]. (b) Plot of the studied materials based on recommended grain sizes for the production of bricks and tiles [36]. The data for Eastern Achaean, Corinthia, and Xyloakastro are given elsewhere [12].

Figure 7.
(a) Plot of the chemical data of the studied samples on the ternary diagram Al2O3-CaO-SiO2 (ACS) [23], and (b) La-Th-Sc ternary diagram proposed by Cullers [29]. The clayey sediments of western Achaea [32] are also plotted for comparison purposes. Abbreviations: WA: western Achaea; EA: eastern Achaea; PAAS = Post-Archean Average Shale; UP = Upper Crust (data from [34]) NASC = North American Shale Composite (data from [38,39]). The data for Eastern Achaean, Corinthia, and Xyloakastro and for other sites of WA are given elsewhere [7,12].

Figure 8.
Plots of the elemental ratios (a) Th/Sc-La/Sc; (b) Th/Cr-La/Cr; (c) La/Sc-La/Cr; and (d) Th/Cr-La/Sc. The data of EA, X, and C are published elsewhere [12].
Figure 8.
Plots of the elemental ratios (a) Th/Sc-La/Sc; (b) Th/Cr-La/Cr; (c) La/Sc-La/Cr; and (d) Th/Cr-La/Sc. The data of EA, X, and C are published elsewhere [12].

Figure 9.
Chemical index of alteration (CIA) for the studied samples from western Achaea (WA) and south Epirus (SE) in comparison with the CIA of the samples from the northeastern Peloponnese (EA: eastern Achaea, C: Corinth, and X: Xylokastro).
Figure 9.
Chemical index of alteration (CIA) for the studied samples from western Achaea (WA) and south Epirus (SE) in comparison with the CIA of the samples from the northeastern Peloponnese (EA: eastern Achaea, C: Corinth, and X: Xylokastro).

Table 1.
List with the studied samples, coordinates of sampling locations, and the respective geological formations. Abbreviations: WA = western Achaean; AK = Aktio; AM = Amfilochia; GR = Grammatiko; N = Nikopoli; V = Vonitsa; PL = Palairos.
Table 1.
List with the studied samples, coordinates of sampling locations, and the respective geological formations. Abbreviations: WA = western Achaean; AK = Aktio; AM = Amfilochia; GR = Grammatiko; N = Nikopoli; V = Vonitsa; PL = Palairos.
| SAMPLES | COORDINATES | AGE | GEOLOGICAL FORMATIONS | |
|---|---|---|---|---|
| Latitude | Longitude | |||
| WA1 | 38°17′5.8 | 21°59′8.32 | PLIOCENE-PLEISTOCENE | Blue marls and sandy clays |
| WA2 | 38°17′1.45 | 21°59′0.47 | PLIOCENE-PLEISTOCENE | Blue marls and sandy clays |
| WA3 | 38°16′9.67 | 21°58′6.25 | PLIOCENE-PLEISTOCENE | Blue marls and sandy clays |
| WA4 | 38°19′1.84 | 21°51′3.39 | HOLOCENE | Recent deposits and alluvial formations |
| WA5 | 38°16′53.70 | 21°48′17.88 | HOLOCENE | Recent deposits and alluvial formations |
| WA8 | 38°16′24.95 | 21°47′40.62 | PLIOCENE-PLEISTOCENE | Blue marls and sandy clays |
| WA9 | 38°15′2.39 | 21°46′56.52 | PLIOCENE-PLEISTOCENE | Blue marls and sandy clays |
| WA10 | 38°15′29.57 | 21°45′24.22 | HOLOCENE | Recent deposits and alluvial formations |
| WA20 | 38°8′15.76 | 21°44′28.72 | UPPER EOCENE-OLIGOCENE | Alterations of mudstones and conglomerates with sandstone intercalations |
| WA21 | 38°8′36.86 | 21°43′44.73 | UPPER EOCENE-OLIGOCENE | Alterations of mudstones and conglomerates with sandstone intercalations |
| WA22 | 38°9′55.86 | 21°40′41.70 | PLIOCENE | Sandstones, sandy clays, clayey marls |
| WA23 | 38°8′43.78 | 21°37′18.43 | HOLOCENE | Recent deposits and alluvial formations |
| WA24 | 38°8′43.96 | 21°37′36.27 | PLIOCENE | Sandstones, sandy clays, and clayey marls |
| WA25 | 38°9′29.57 | 21°31′29.12 | HOLOCENE | Recent deposits and alluvial formations |
| WA26 | 38°8′30.87 | 21°36′37.88 | PLIOCENE | Sandstones, sandy clays, and clayey marls |
| WA27 | 37°52′0.93 | 21°36′11.67 | PLEISTOCENE | Valmi formation |
| WA28 | 37°52′2.06 | 22°4′5.35 | LOWER PALEOCENE-EOCENE | Flysch: sandstones, calcareous sandstones, and shales |
| WA29 | 37°52′5.86 | 21°38′43.68 | UPPER EOCENE-OLIGOCENE | Blue mudstones |
| WA30 | 38°9′29.60 | 21°42′54.26 | HOLOCENE | Weathering products |
| PL1 | 38°46′26.10 | 20°53′0.95 | MIDDLE-UPPER MIOCENE-LOWER PLIOCENE | Clays, sandstones and conglomerates |
| PL2 | 38°47′2.91 | 20°53′8.97 | MIDDLE-UPPER MIOCENE-LOWER PLIOCENE | Clays, sandstones and conglomerates |
| AM1 | 38°52′57.99 | 20°59′12.84 | UPPER PLIOCENE-LOWER PLEISTOCENE | Clayey mudstones |
| AM2 | 38°52′25.93 | 21°1′57.66 | UPPER PLIOCENE-LOWER PLEISTOCENE | Clayey mudstones |
| AK1 | 38°54′48.82 | 20°49′34.71 | UPPER PLIOCENE-LOWER PLEISTOCENE | Clayey mudstones |
| N1, N2 | 39°2′11.74 | 20°43′33.46 | PLIOCENE | Conglomerates, clayey sands, marls and marine clays |
| N3 | 39°3′46.07 | 20°43′9.14 | PLIOCENE | Conglomerates, clayey sands, marls and marine clays |
| N4 | 39°3′7.08 | 20°43′24.01 | PLIOCENE | Conglomerates, clayey sands, marls and marine clays |
| GR1 | 38°31′28.09 | 21°29′36.34 | PLIOCENE | Lacustrine beds: bioclastic marly limestone, marl, clay, sandstone and conglomerate |
| V1 | 38°54′34.60 | 20°58′12.32 | UPPER TRIASSIC-MIDDLE LIAS | Recent alluvial deposits |
| V2 | 38°54′36.32 | 20°58′13.79 | UPPER TRIASSIC-MIDDLE LIAS | Recent alluvial deposits |
Table 2.
Mineralogical composition of the whole-sediment and of the <0.002 mm fraction of the investigated clayey raw materials (relative abundance %) (Legend: Qz = Quartz; Kfs = K-feldspar; Cc = Calcite; Do = Dolomite; Pl = Plagioclase; CM = total clay minerals; K = Kaolinite; Chl = Chlorite; Ill = Illite; Sm = smectite; Chl/Sm = Chlorite/Smectite; Ill/Sm = Il-lite/Smectite; Chl/V = Chlorite/Vermiculite; - = not detected; blank lines = samples are not analyzed. Mineral symbols after Kretz [27]).
| Whole Sediment | <0.002 mm Fraction | ||||||||||||
|---|---|---|---|---|---|---|---|---|---|---|---|---|---|
| SAMPLES | Qz | Cc | Pl | Do | Kfs | CM | Ill | Chl | K | Chl/Sm | Ill/Sm | Chl/V | Sm |
| WA1 | 37 | 22 | 24 | - | - | 16 | 14.9 | 3.0 | - | 82.2 | - | - | - |
| WA2 | 32 | 26 | 24 | - | - | 18 | 28.3 | 1.3 | 0.3 | 70.1 | - | - | - |
| WA3 | 50 | 17 | 10 | - | - | 23 | |||||||
| WA4 | 41 | 16 | 27 | - | - | 16 | 12.1 | 1.1 | - | 84.6 | 2.2 | - | - |
| WA5 | 39 | 3 | 25 | - | - | 32 | 13.7 | 4.2 | 0.2 | 81.9 | - | - | - |
| WA8 | 48 | 34 | 12 | 6 | |||||||||
| WA9 | 50 | 6 | 26 | - | - | 18 | 14.0 | 0.6 | - | - | - | 85.4 | - |
| WA10 | 26 | 33 | 14 | - | - | 27 | 20.5 | 6.6 | - | - | 72.9 | - | - |
| WA20 | 37 | - | 23 | - | - | 40 | 4.06 | - | - | - | 48.8 | - | 47.2 |
| WA21 | 21 | 13 | 17 | - | 10 | 39 | 51 | 40 | 9 | - | - | - | - |
| WA22 | 29 | 28 | 14 | - | - | 28 | 10.6 | - | 0.3 | - | 52.7 | - | 36.4 |
| WA23 | 17 | 15 | 12 | - | - | 56 | 48.3 | 51.6 | - | - | - | - | - |
| WA24 | 34 | 23 | 20 | - | - | 23 | 18.6 | 18.7 | 4.1 | 58.6 | - | - | - |
| WA25 | 32 | 28 | 16 | - | - | 24 | 20.7 | - | - | 67.5 | - | 11.8 | - |
| WA26 | 20 | 39 | 10 | - | - | 30 | 23.4 | 61.8 | 14.7 | - | - | - | - |
| WA27 | 63 | 3 | 9 | - | 6 | 19 | - | 0.9 | - | - | 52.7 | - | 46.4 |
| WA28 | 33 | 15 | 16 | - | - | 35 | 4.2 | 13.7 | - | - | - | - | 82.1 |
| WA29 | 29 | 28 | 19 | - | - | 24 | 60.9 | 39.1 | - | - | - | - | |
| WA30 | 25 | 13 | 20 | - | 3 | 38 | 39.7 | 60.3 | - | - | - | - | - |
| AK1 | 35 | 5 | 21 | - | 3 | 36 | 0.9 | - | - | - | 99.1 | - | - |
| AM1 | 9 | 56 | - | 22 | - | 13 | |||||||
| AM2 | 33 | 8 | 10 | - | - | 49 | 14.6 | - | 4.9 | - | 46.0 | - | 34.5 |
| GR1 | 26 | 8 | 21 | - | 10 | 34 | 22.9 | 21.5 | - | 55.7 | - | - | - |
| N1 | 41 | 13 | 30 | - | - | 17 | 5.2 | - | - | 94.8 | - | - | - |
| N2 | 31 | 16 | 18 | - | - | 35 | 3.7 | - | - | 96.3 | - | - | - |
| N3 | 38 | 15 | 17 | 1 | - | 25 | 2.0 | - | - | 98.0 | - | - | - |
| N4 | 32 | 19 | 22 | 1 | - | 28 | 3.1 | - | 0.8 | - | - | - | 96.1 |
| PL1 | 33 | 29 | 12 | - | 9 | 17 | 13.1 | - | - | - | - | - | 86.9 |
| PL2 | 23 | 26 | 8 | 2 | 9 | 33 | 1.5 | 1.3 | 0.4 | 58.0 | - | - | 38.7 |
| V1 | 15 | 57 | 8 | - | - | 20 | |||||||
| V2 | 4 | 54 | - | - | - | 42 | |||||||
Table 3.
The Atterberg limit values (in wt.%) for the samples considered in the present study. Abbreviations: LL = liquid limit; PL = plastic limit; Ip = plasticity index and the proportions of the main granulometric fractions of the studied clay-rich raw material in wt.%.
Table 3.
The Atterberg limit values (in wt.%) for the samples considered in the present study. Abbreviations: LL = liquid limit; PL = plastic limit; Ip = plasticity index and the proportions of the main granulometric fractions of the studied clay-rich raw material in wt.%.
| SAMPLES | WA1 | WA5 | WA9 | WA10 | WA20 | WA21 | WA22 | WA23 | WA25 | WA26 | WA27 | WA28 | WA29 |
|---|---|---|---|---|---|---|---|---|---|---|---|---|---|
| CLAY | 16 | 18 | 15 | 29 | 22 | 22 | 31 | 41 | 33 | 36 | 28 | 21 | 20 |
| SILT | 62 | 72 | 60 | 64 | 56 | 71 | 60 | 56 | 58 | 57 | 48 | 65 | 72 |
| SAND | 23 | 10 | 25 | 6 | 22 | 8 | 8 | 3 | 9 | 8 | 24 | 14 | 8 |
| PL | 19 | 23 | 22 | 29 | 27 | 29 | 32 | 37 | 21 | 34 | 26 | 31 | 30 |
| LL | 21 | 40 | 24 | 44 | 37 | 46 | 49 | 60 | 23 | 45 | 38 | 46 | 32 |
| Ip | 2 | 16 | 3 | 15 | 10 | 16 | 17 | 23 | 2 | 12 | 12 | 15 | 2 |
| SAMPLES | WA30 | N1 | N2 | N3 | Ν4 | PL1 | PL2 | GR1 | V1 | AM1 | AM2 | AK1 | |
| CLAY | 24 | 13 | 16 | 17 | 18 | 23 | 27 | 19 | 41 | 26 | 47 | 27 | |
| SILT | 75 | 58 | 70 | 54 | 72 | 63 | 63 | 69 | 55 | 55 | 52 | 70 | |
| SAND | 0 | 29 | 14 | 28 | 10 | 14 | 10 | 12 | 4 | 19 | 1 | 3 | |
| PL | 27 | 19 | 19 | 17 | 30 | 23 | 21 | 19 | 31 | 36 | 25 | 36 | |
| LL | 36 | 30 | 37 | 27 | 38 | 32 | 55 | 30 | 42 | 52 | 57 | 58 | |
| Ip | 8 | 11 | 19 | 10 | 8 | 9 | 34 | 11 | 10 | 16 | 32 | 22 |
Table 4.
Elemental concentrations (wt.%, water-free basis) obtained through X-ray fluorescence for the clay-rich samples.
Table 4.
Elemental concentrations (wt.%, water-free basis) obtained through X-ray fluorescence for the clay-rich samples.
| SAMPLES | Na2O | MgO | Al2O3 | SiO2 | P2O5 | K2O | CaO | TiO2 | MnO | Fe2O3 |
|---|---|---|---|---|---|---|---|---|---|---|
| WA1 | 1.11 | 2.61 | 10.33 | 63.66 | 0.13 | 1.79 | 16.88 | 0.60 | 0.07 | 2.80 |
| WA2 | 0.90 | 3.17 | 14.15 | 55.93 | 0.15 | 2.79 | 17.44 | 0.80 | 0.08 | 4.59 |
| WA3 | 0.52 | 3.05 | 10.79 | 68.63 | 0.12 | 2.77 | 8.89 | 0.53 | 0.14 | 4.55 |
| WA4 | 1.02 | 2.68 | 11.57 | 64.41 | 0.14 | 2.08 | 13.45 | 0.70 | 0.10 | 3.86 |
| WA5 | 0.95 | 3.94 | 15.17 | 67.66 | 0.08 | 2.84 | 1.73 | 0.93 | 0.04 | 6.66 |
| WA8 | 0.42 | 2.04 | 7.08 | 66.00 | 0.11 | 1.76 | 20.09 | 0.33 | 0.11 | 2.04 |
| WA9 | 1.18 | 3.49 | 13.99 | 67.51 | 0.09 | 2.51 | 5.21 | 0.79 | 0.05 | 5.18 |
| WA10 | 0.66 | 3.35 | 14.58 | 53.75 | 0.13 | 3.28 | 17.99 | 0.81 | 0.12 | 5.33 |
| WA20 | 0.51 | 2.86 | 12.92 | 70.72 | 0.05 | 3.08 | 1.40 | 0.85 | 0.10 | 7.51 |
| WA21 | 1.10 | 4.31 | 15.95 | 59.23 | 0.10 | 3.41 | 7.38 | 0.94 | 0.11 | 7.48 |
| WA22 | 0.50 | 2.79 | 12.98 | 58.35 | 0.13 | 3.16 | 15.76 | 0.80 | 0.12 | 5.42 |
| WA23 | 0.62 | 3.97 | 16.91 | 55.98 | 0.11 | 4.42 | 9.36 | 1.08 | 0.07 | 7.48 |
| WA24 | 0.87 | 3.51 | 14.11 | 58.66 | 0.16 | 3.07 | 13.00 | 0.88 | 0.11 | 5.63 |
| WA25 | 0.75 | 2.88 | 12.37 | 55.80 | 0.10 | 2.59 | 20.82 | 0.67 | 0.14 | 3.87 |
| WA26 | 0.84 | 3.34 | 12.16 | 51.76 | 0.12 | 3.38 | 21.93 | 0.83 | 0.11 | 5.53 |
| WA27 | 0.36 | 1.99 | 13.65 | 75.51 | 0.01 | 1.53 | 2.35 | 0.78 | 0.19 | 3.62 |
| WA28 | 0.92 | 3.28 | 15.67 | 61.49 | 0.08 | 2.82 | 9.06 | 0.94 | 0.10 | 5.65 |
| WA29 | 0.82 | 3.56 | 15.34 | 55.82 | 0.12 | 3.45 | 13.90 | 0.88 | 0.10 | 6.01 |
| PL1 | 0.63 | 2.94 | 13.45 | 55.73 | 0.17 | 2.27 | 20.07 | 0.72 | 0.05 | 3.97 |
| PL2 | 0.64 | 4.33 | 13.95 | 55.65 | 0.11 | 3.02 | 15.70 | 0.79 | 0.08 | 5.72 |
| N1 | 0.98 | 3.83 | 13.08 | 63.55 | 0.11 | 2.17 | 10.88 | 0.72 | 0.08 | 4.60 |
| N2 | 0.97 | 4.13 | 14.02 | 62.44 | 0.12 | 2.47 | 9.29 | 0.81 | 0.08 | 5.69 |
| N3 | 0.97 | 4.57 | 12.23 | 62.81 | 0.10 | 2.15 | 11.46 | 0.69 | 0.08 | 4.94 |
| N4 | 0.88 | 4.16 | 14.05 | 60.17 | 0.11 | 2.53 | 11.84 | 0.79 | 0.10 | 5.37 |
| AM1 | 0.12 | 7.77 | 11.35 | 38.48 | 0.09 | 2.03 | 36.99 | 0.51 | 0.03 | 2.62 |
| AM2 | 0.29 | 3.83 | 15.72 | 63.37 | 0.05 | 2.37 | 6.05 | 0.93 | 0.14 | 7.26 |
| AK1 | 0.59 | 3.62 | 15.23 | 65.82 | 0.07 | 2.62 | 4.22 | 0.92 | 0.07 | 6.84 |
| V1 | 0.33 | 2.53 | 12.62 | 45.40 | 0.12 | 2.36 | 31.89 | 0.66 | 0.05 | 4.04 |
| V2 | 0.11 | 1.52 | 25.40 | 45.16 | 0.08 | 2.01 | 16.68 | 1.12 | 0.06 | 7.86 |
| GR1 | 1.01 | 4.33 | 15.53 | 61.70 | 0.10 | 3.35 | 6.06 | 0.96 | 0.06 | 6.90 |
Disclaimer/Publisher’s Note: The statements, opinions and data contained in all publications are solely those of the individual author(s) and contributor(s) and not of MDPI and/or the editor(s). MDPI and/or the editor(s) disclaim responsibility for any injury to people or property resulting from any ideas, methods, instructions or products referred to in the content. |
© 2023 by the authors. Licensee MDPI, Basel, Switzerland. This article is an open access article distributed under the terms and conditions of the Creative Commons Attribution (CC BY) license (https://creativecommons.org/licenses/by/4.0/).
Share and Cite
MDPI and ACS Style
Xanthopoulou, V.; Iliopoulos, I. An Insight into the Suitability of Clayey Raw Materials: The Ceramic Provinces of the Northern Peloponnese and South Epirus, Greece. Buildings 2023, 13, 473. https://doi.org/10.3390/buildings13020473
AMA Style
Xanthopoulou V, Iliopoulos I. An Insight into the Suitability of Clayey Raw Materials: The Ceramic Provinces of the Northern Peloponnese and South Epirus, Greece. Buildings. 2023; 13(2):473. https://doi.org/10.3390/buildings13020473
Chicago/Turabian StyleXanthopoulou, Vayia, and Ioannis Iliopoulos. 2023. "An Insight into the Suitability of Clayey Raw Materials: The Ceramic Provinces of the Northern Peloponnese and South Epirus, Greece" Buildings 13, no. 2: 473. https://doi.org/10.3390/buildings13020473
Note that from the first issue of 2016, this journal uses article numbers instead of page numbers. See further details here.