Article

Flexural Strength of Partially Concrete-Filled Steel Tubes Subjected to Lateral Loads by Experimental Testing and Finite Element Modelling

by
Thi Tuyet Trinh Nguyen
1,
Van Bac Nguyen
2,* and
Minh Quan Thai
3
1
Faculty of Civil Engineering, University of Transport and Communications, 3 Cau Giay Street, Dong Da, Hanoi 11500, Vietnam
2
College of Science and Engineering, University of Derby, Markeaton Street, Derby DE22 3AW, UK
3
Faculty of Construction Engineering, University of Transport and Communications, 3 Cau Giay Street, Dong Da, Hanoi 11500, Vietnam
*
Author to whom correspondence should be addressed.
Buildings 2023, 13(1), 216; https://doi.org/10.3390/buildings13010216
Submission received: 20 November 2022 / Revised: 27 December 2022 / Accepted: 3 January 2023 / Published: 12 January 2023

Abstract

:
In this paper, the flexural strength and buckling of the partially concrete-filled steel tubes (PCFST) under laterally repeated loads was investigated through three-point bending test configuration. Three-dimensional Finite Element (FE) models of the bending tests of the PCFST were developed, in which the concrete filling was modelled using elastic-plastic-fracture model capturing crack development and the tube steel was modelled using elastic-plasticity model. The bond between concrete and tube was considered as frictional touching contact. The validation showed the FE results including the ultimate flexural load and buckling failure mode of the steel tube were in excellent agreement with the experimental ones. A parametric study was then conducted using the verified FE models to investigate the effects of the tube diameter-to-thickness ratio, the concrete filling length ratio, the compressive strength of concrete, and the tube steel’s yield and tensile strengths on the PCFST’s ultimate flexural strength. Based on this study, buckling modes, the optimal concrete filling lengths, and the confined compressive strengths of concrete were determined considering the effects of all these parameters. The confined compressive stresses and strains in concrete predicted by the FE models were evaluated against those determined by theoretical models. The results revealed that the effects of concrete compressive strength to the PCFST’s flexural capacity was insignificant while increasing the tube diameter-to-thickness ratio or the tube steel’s yield and tensile strengths could significantly increase the PCFST’s flexural capacity and the confined compressive strength of concrete; and there was an optimal length of concrete filling at about 66% of the tube length. It demonstrated that the Finite Element analysis can therefore be used as a powerful method to the analysis and design the PCFST columns under lateral loads.

1. Introduction

Concrete-filled steel tube (CFST) structures are members with a steel tube and filled concrete working complementarily to support load and provide stiffness. CFST sections have been widely used in civil engineering structures including columns and piles in bridges, transmission tower, offshore, drilled-shaft foundations and power plant structures (Gupta et al., 2007; Han et al., 2014; Brown et al., 2015) [1,2,3]. The use of CFST sections has been significantly increasing in the last few decades owning to its substantial structural benefits such as: (1) the steel sections provide the tensile strength and some of the shear strength for the concrete core, therefore, longitudinal and transverse reinforcement were usually not required for the concrete, (2) concrete confinement is provided by the steel tube, increasing the compressive strength and strain capacity, (3) the steel sections served as a formwork for casting concrete and this could significantly reduce the construction costs, and (4) the materials are more complementary that the steel enhances the concrete core’s strength and ductility that prevented the concrete from crushing and cracking while in the same time the concrete core enhanced the buckling and compressive strengths of the steel sections. CFST members have been used as main girders of a railway bridge as it could reduce noise and vibration levels induced by trains, which was a major disadvantage of steel girders for railway bridges [4].
There have been numerous studies to investigate the flexural behaviour of CFST members. Experimental studies mainly investigated the large deformation bending behaviour of circular and square CFST tubes with the diameter to wall thickness ratio ranging from 10 to 110 [5,6,7,8,9,10,11,12]. The common testing configurations were in four-point bending tests. It was found that in general, the infilled concrete enhances strength, ductility, and energy absorption especially for thinner sections. Analytical methods have been proposed for obtaining the flexural capacity and stiffness of CFST tubes [8,13,14]. Numerical modelling, including the Finite Element (FE) analysis, has been used by many researchers to study the behaviour of CFST sections subjected to bending [15,16,17,18]. In these studies, good agreement was observed between the predicted load versus deformation curves, failure modes and bending capacities and the experiment results. Numerical modelling studies were able to investigate the full range of important design parameters including geometries, sizes, and demands that are difficult or even impossible to be simulated experimentally. In most recent studies, the mechanical performance of circular steel reinforced CFST members under pure bending loads of profiled I steel section was carried out [19]. In this study, failure modes, lateral deflection, longitudinal strain distribution, bending moment-curvature curves and flexural capacity were experimentally and numerically analysed. The dynamic response of steel-reinforced concrete-filled circular and square steel CFST members under lateral impact load was carried out [20,21]. In addition, circular and square steel reinforced CFST specimens with different boundary conditions were tested via a drop hammer impact device. The damage modes, impact forces, mid-span displacement responses and energy absorption capacities of the tested specimens are experimentally and numerically evaluated to investigate the impact behaviours of square steel reinforced CFST members. In another study [22], the behaviour of the circular steel-reinforced concrete filled steel tubular CFST members under compression-bending-shear loading was experimentally and numerically investigated. Debnath and Chan’s study [23] conducted numerical investigation for the behaviour of a blind-bolted connection with concrete-filled steel tube (CFST) with an open steel section. In this study, a concrete damage plasticity model for representing the concrete non-linear behaviour (using ABAQUS software); the model was characterized by the formation of unrecoverable deformation after unloading on the specimen, whereas the damage model is concerned with the reduction of elastic stiffness of concrete. In [24], an alternative modelling method that could predict the impact behaviour of CFST columns with high efficiency and low requirements in computer resources was developed. It included a nonlinear fibre-based beam-column element model to simulate the behaviour of CFST columns under impact loading. It was found that the fibre-based elements considering confinement effects induced by steel tubes could accurately predict the force versus deformation relationship of the CFST columns under monotonic loading. The computational efficiency can be significantly improved by using the developed model.
In terms of design codes of practices, modern design codes on steel-concrete composite members such as American, Chinese, European, and Japanese codes, do not provide guidance on the use of high strength construction materials, such as the high strength concrete and high tensile steel section. Recently, there have been a lot of new development about CFST high strength members subjected to compression, combines loading and shear loading presented in the latest reports [25,26]. They included: the optimum reinforcement ratio for high strength steel-concrete composite structural members, material compatibility between concrete and steel grades for the design of high strength composite members (for better bonding and design efficiency), and the design detailing practices for typical joints between steel-concrete composite columns and other structural components, including maximum values of plate slenderness to avoid local buckling.
CFST sections have been utilised in columns and piles supporting platforms in offshore structures, supporting roofs of storage tanks, bridge piers and in general as columns in structures with tall piers in high seismic regions due to their superior strength and ductility [5]. CFST sections have been widely used for columns, piers and piles in bridge and foundation construction in many countries in Asia including Japan and China whilst the use of CFST in bridge and foundation construction has been limited in the United States [14]. The use of CFST tubes for bridges, foundation construction and supporting platforms in offshore structures offered many potential advantages. When the CFST sections were used for columns and piles in bridge and foundation construction of highway or flyover, the steel piling construction method could reduce the construction area, construction time and the environmental impact.
In these pile structures, filling thin-walled steel tubes with concrete was shown to increase their flexural strength and stiffness significantly, at a modest increase in cost, but it increased the structure’s dead weight significantly [7]. A popular current application of steel tubes in bridge construction has been in the field of seismic retrofit including jacketing of deficient reinforced concrete columns [27]. Another application was the utilisation of the steel tube to form piles and drilled-shaft foundations with an internal concrete or reinforced concrete member [7,28]. In these applications, the combination of the large seismic loads and relatively weak and flexible soils found in sedimentary deposits increasingly required deep piles or drilled shaft foundations. The top of piles could subject to the large moment caused by the lateral loads. The bending moment distribution in the piles had the triangular form with the maximum moment located around the ground level and much smaller moments over the length when going deeper under the ground, as shown in the right side of Figure 1 [29]. Therefore, filling the entire length of piles with concrete was unnecessary and uneconomical but only required for the upper part where bending moments were significant, i.e., filling concrete down to 15 m from ground level (the grey colour represents the “imagined” concrete filling). In such cases, a typical configuration of the pile was that the steel tube stood continuously from the foundation bed to the pier, and the concrete was filled into the upper part of steel tube, leading to a partially CFST piles.
Contrary to numerous studies on the flexural behaviour of CFST members, there has relatively been little work has been carried out on the flexural behaviour of partially concrete-filled steel tubes (PCFST) members under lateral loading. The common test configuration was cantilever under lateral loads and test specimens were usually small scales in comparison to the real structural members: CFST tubes of up to 1500 mm long [28,30]. Experimental studies of concrete-filled steel box columns under cyclic lateral loading were presented in a previous study [31,32]. In the experimental work of cyclic tests, the effects of main parameters, such as the width-thickness ratio, number of loading cycles, length of filled-in concrete and the filled-in concrete on the column behaviour, were studied. Fam and Mitchell’s study [28] conducted experimental tests on PCFST poles in a cantilever beam setting under a lateral load at the free end. The poles were filled with varying amounts of concrete from the fixed end, within 0, 15, 33, and 100% of their lengths. It was found that flexural strength increased as the length of concrete filling increased, until it reached a plateau corresponding to about double the strength of the hollow tube, when the concrete filling was about one third to half of the clear length. Analytical models using moment-curvature method was developed and used in a parametric study to study the effect of length of the partial concrete filling on the maximum bending load [28]. Recently, Khalifa et al. [30] carried out both experimental and analytical investigations on noncompact circular hole section steel tubes with partial concrete filling, tested as cantilevers under flexural loading. The diameter-to-thickness ratio was ranging from 57 to 101 and the ratio of concrete filling length measured from the fixed base was from 11 to 100% of the total length. An analytical approach based on moment-curvature method was adopted to investigate the optimal concrete filling ratio for different diameter-to-thickness ratios and different steel grades. The study revealed that the optimum filling ratio lies in the range between 22% and 62%, which saves at least 40% of the typically used concrete volume required for the equivalent fully filled tubes.
From the above review, it can be found that most of studies on flexural behaviour were for CFST members and studies of partially concrete-filled steel tube members were relatively limited, especially on analysing the behaviour of such infrastructure members subjected to lateral loads. They were on small-scaled models suitable for laboratory testing and the testing configuration was cantilever with load applied at the structure’s free end or four-point bending tests. However, in the cases of seismic load, it exerted lateral forces to columns or piles at a position in between the two end supports, causing bending moment distribution as shown in Figure 1; therefore, a general three-point bending test configuration would be more suitable to generate the comparable bending moment distribution. In addition, previous studies of PCFST members used analytical models using moment-curvature method. The advantage of such models was simple and efficiency in calculation [28,30], but they were not capable of accurately simulating the composite (contact) action between concrete filling and steel tube, the tube buckling phenomenon, and the crack development and fracture or damage in the concrete filling. Regarding optimisation of concrete filling lengths, there have not been studies using numerical modelling approaches that considered the effect of both the tube buckling failure and concrete filling’s material properties on strength of the PCFST. In addition, the effect of the steel tube’s diameter and thickness, and steel’s material properties on concrete confined strengths have not been studied in detail.
The research study described herein was conducted with the objective of providing understanding and enhancement for the challenges presented above. In this paper, three-point beam bending tests under laterally repeated loading were carried out to determine the flexural strength of the PCFST. They were tested in full scale, reflecting the structures in real applications. This three-point bending configuration could be well reflected the applications of piles from ground or foundation in supporting platforms (in building structures, offshore structures, supporting roofs of storage tanks and bridge piers under lateral loads at a structural height level) for the cases of earthquake loading. Together with the bending tests, material tests of the concrete and tubular steel were also conducted to determine the material properties. A three dimensional (3-D) Finite Element modelling approach of the bending tests was developed and validated by the experimental results. The concrete filling was modelled using elastic-plastic-fracture model considering crack development and steel tube was modelled using elastic-plasticity model. The bond between concrete filling and steel tube were modelled using frictional contact laws. This modelling approach was used to model the composite action, the relative movement between the steel tube and the concrete filling, the effects of confinement and the damage in concrete (through cracks) directly. As the steel tube could move relative to the concrete filling such that local buckling of steel tube could be captured. A parametric study was carried out to study the effects of the tube diameter diameter-to to-thickness ratio, the concrete filling length ratio, the compressive strength of concrete, and the tube steel’s yield and tensile strengths on the PCFST’s maximum ultimate flexural strength. It also focused upon investigations for the optimal length of concrete filling, the behaviour at transition part between concrete core and steel tube (the position of the neutral axis), and the confinement effect of various parameters on the concrete compressive strength under lateral loading.

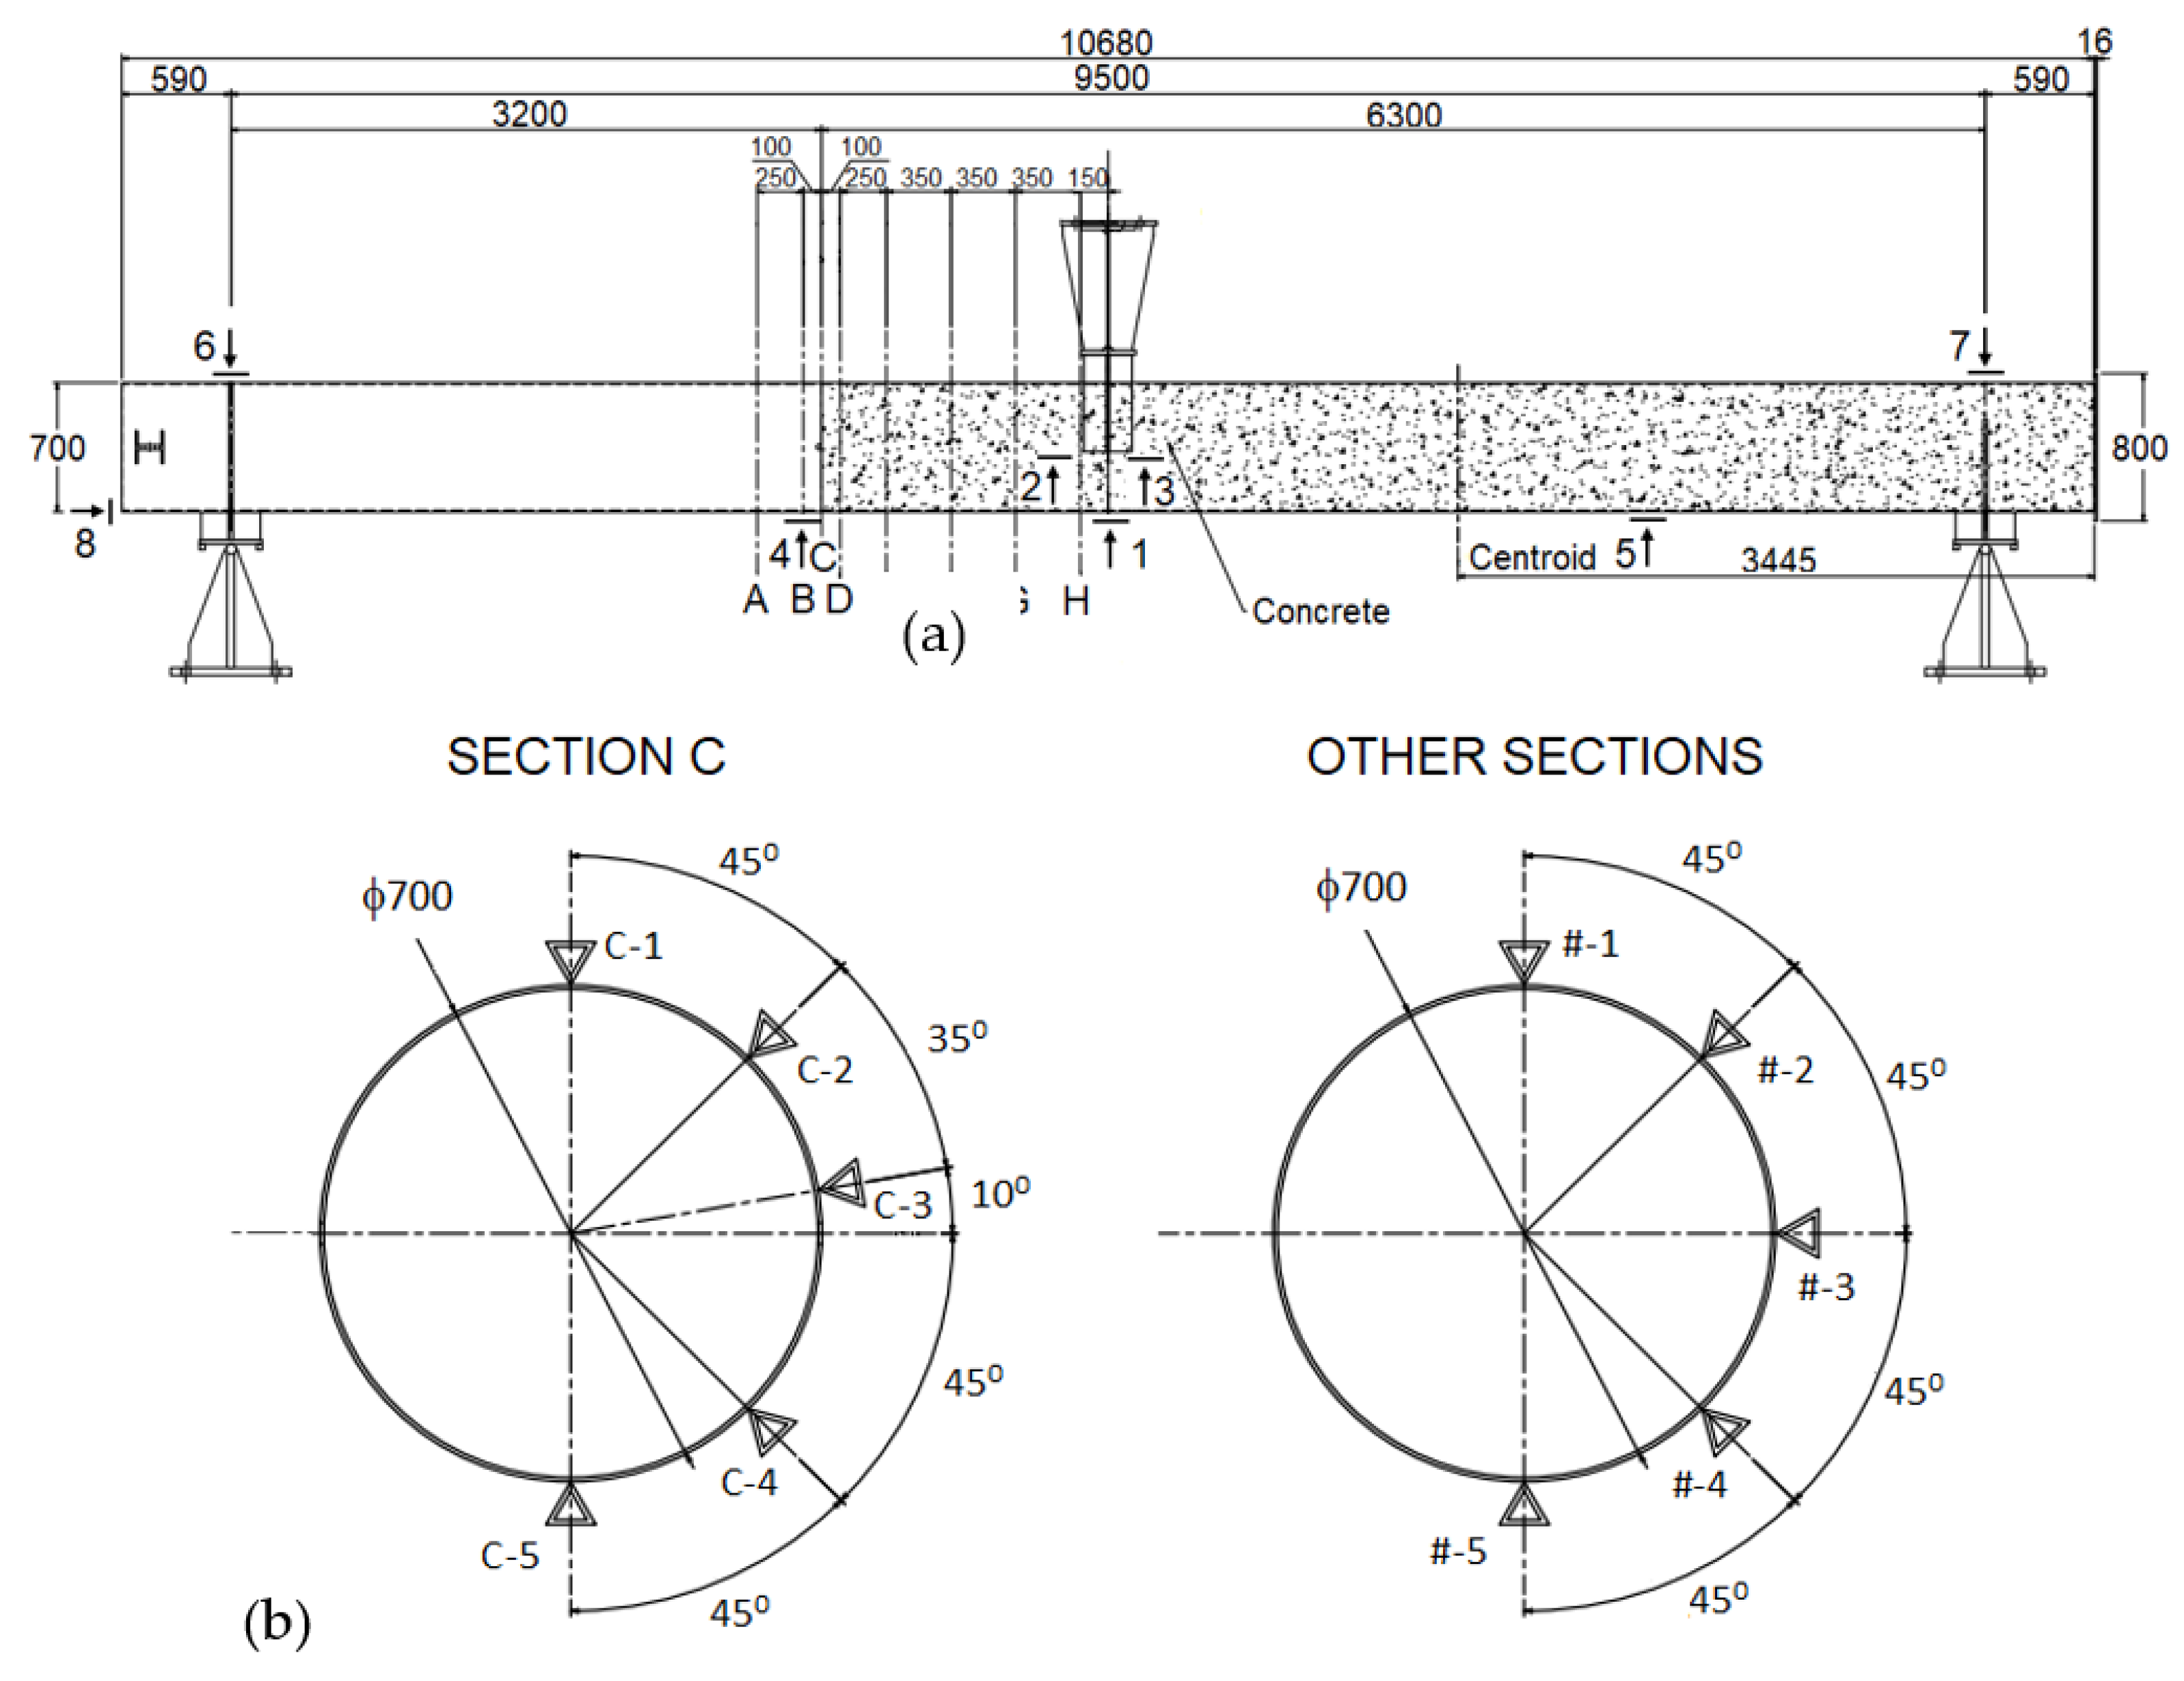
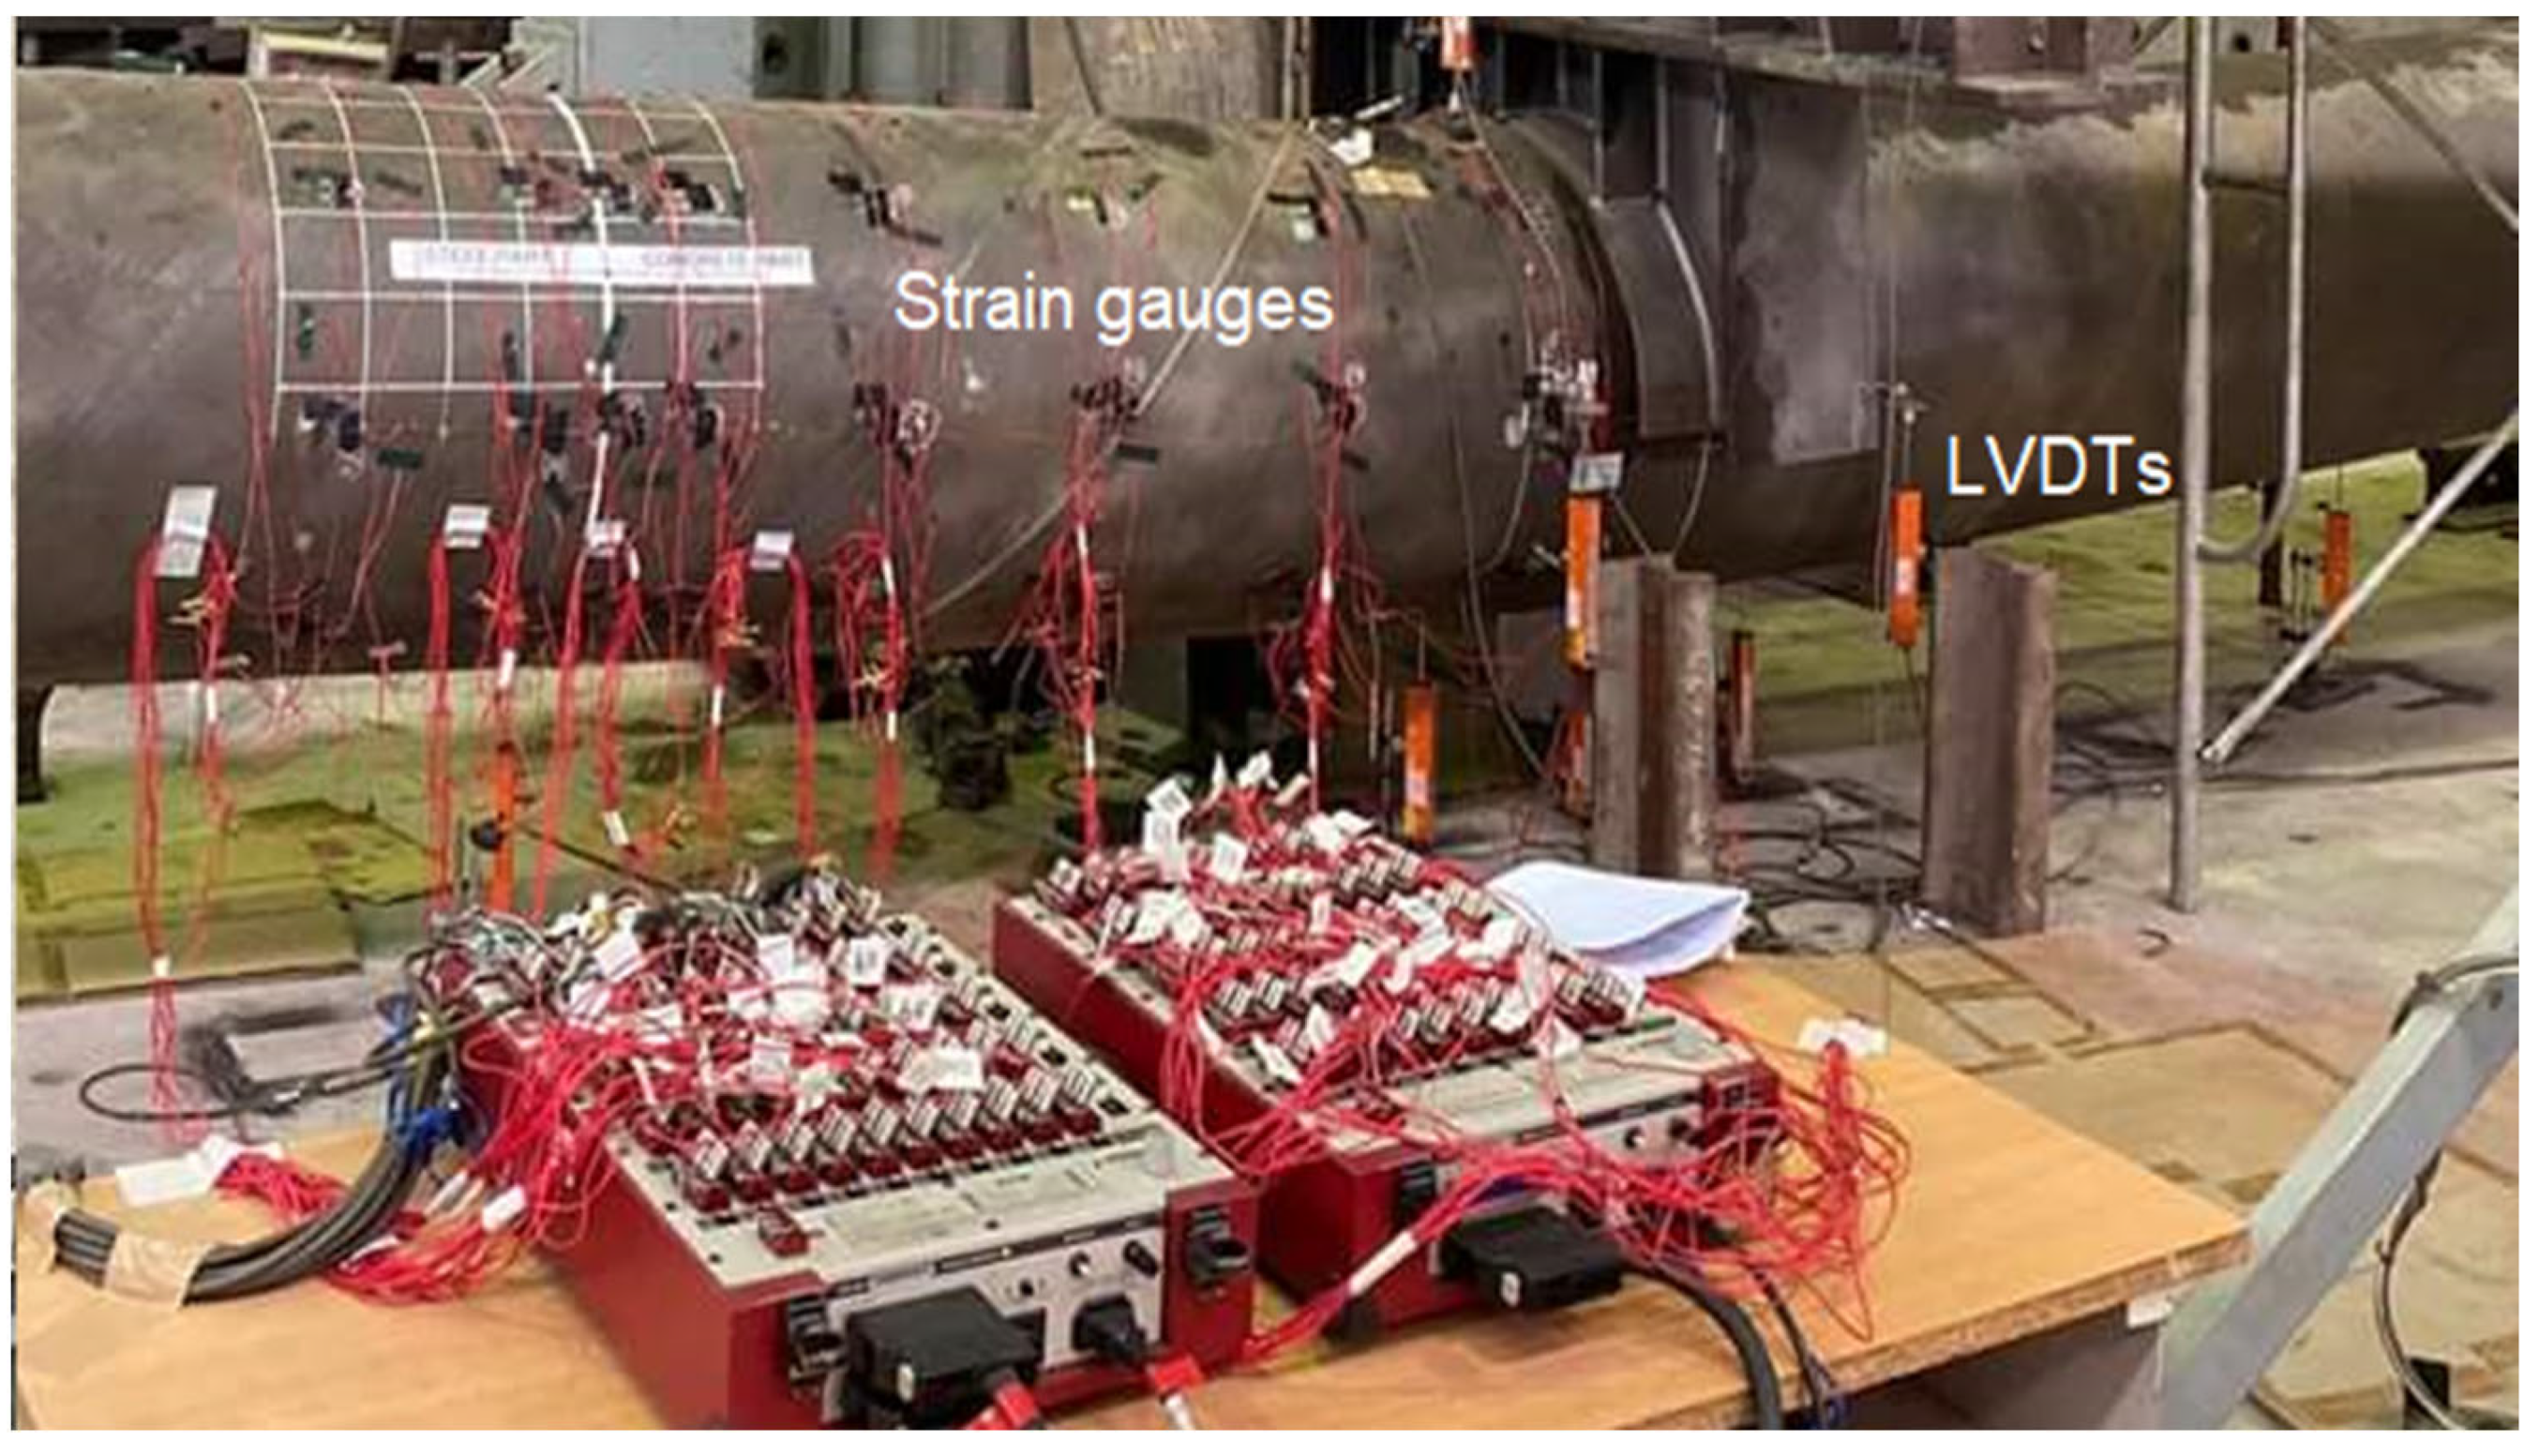
2. Experimental Test Programme

The steel tube was fabricated then the concrete was filled in steel tube with the predefined length. When the concrete reached the 28 days age, the PCFST specimen is placed in laboratory for testing. The circular steel tube was fabricated using cold-formed process and welded with high frequency butt weld. The tube length was determined based on the laboratory’s testing space and by reference to the lengths of the concrete-fille steel tubes in many practical applications. Initially, analytical studies were carried out to determine the length of the concrete filling for the experimental test. When the length of concrete was less than or equal half of the length of the tube, the resistance of the concrete filled part was about 30% greater than that of the steel part. When the length of concrete was more than three quarters of the length of the tube, the resistance of the steel part was very small in comparison to its maximum resistance [33,34]. Based on this observation, the length of the filled concrete was predefined in the range of 6–7 m. Therefore, in this study, the PCFST specimen had a span length of 9500 mm, and the length of the filled concrete of 6300 mm. The steel tube had a diameter of 700 mm, and a thickness of 9 mm. They were maximum tube sizes in consideration of the capacity of test equipment used in laboratory; this indicated that this was the best choice for the purpose of full-scale testing of pile structures, reflecting the structures in real applications. The tube had spiral ribs on the inside surface, as shown in Figure 2, (each rib has 12 mm width × 4.5 mm height) to enhance the bond between concrete filling and the steel tube. There was one test available for this study. However, it was deemed reasonable for the purposes of investigating the structural behaviour of the PCFST, especially for the transition behaviour between the steel tube and concrete-filled steel tube and the concrete filling length. For this reason, Finite Element models were developed to replicate the experimental test to help get insight into the behaviour of PCFST specimen.
The mechanical properties of the steel tube material were determined by tensile testing on the steel samples taken from the steel sheets prior to the tube’s cold rolled forming process. They were cut in the same direction of the tube’s longitudinal direction so that the stress-strain data obtained from the tensile tests could be represented as stresses and strains of the steel tube in that direction (normal bending stresses and strains). The steel grade was with a nominal Young’s modulus of 200 GPa. The mechanical properties of the tested coupons were obtained as follows: a yield stress of 382 N/mm2 at a strain of 0.2%, a tensile strength of 542 N/mm2 at a strain of 20%, and a final elongation of 32%. The stress-strain behaviour obtained from steel coupon tests are shown in Figure 2. The cube compressive strength and elastic modulus of concrete were obtained by testing cylinder specimens. Three 150 mm (diameter) × 300 mm (height) concrete cylinders of the same concrete mix were prepared during the fabrication of the specimens and tested at the same time of testing the PCFST. The concrete mix had the ratio of cement:sand:coarse aggregates as 1:2.5:3, and the detailed properties were shown in Table 1. The average values of concrete cube compressive strength measured at 7, 14, 21 and 28 days were 25.20, 33.30, 39.80 and 41.00 N/mm2, respectively, as shown in Figure 3, and the elastic modulus of concrete was 25.50 GPa. The concrete strength measured at 28 days of 41.00 N/mm2 and the corresponding strain was 0.002 were used in this study.
Experimental tests complying with standards AASHTO T 177 [35] and ASTM C293/C293M-16 [36] were carried out to obtain the structural behaviour of the PCFST specimen, and to evaluate the FE modelling results. The test setup is shown in Figure 4 which also illustrates the instrumentation for measurement including displacement transducers and strain gauges.
A calibrated test rig was used for the tests. The rig consists of two 1000 kN capacity hydraulic jack actuator controllers (ANIPC 800 ANCO Engineers, inc.) attached to the horizontal beams of the test frame. The load from the hydraulic jacks applied vertically to the horizontal rigid frame and transferred to the tube through a curved plate placed at the top of the tube, as shown in Figure 4. This was to model a concentrated load applying at the mid-span of the tube. Rotating end station through rollers was used to model the pin end condition of the specimen at supports. At each end, the tube was welded to a rigid plate which was supported by a roller. Electrical strain gauges (KFGS-10-120-C1-11 L3M2R model with a gauge length of 10 mm and a gauge factor of 2.10 ± 1.0%, Kyowa Electronic Instruments) were used to measure the axial and hoop strains along the tube specimen. To evaluate the behaviour of the PCFST at mid-span and around the transition of the concrete filling and steel tube, the strain gauge arrangement had the layout shown in Figure 5. Ten strain gauges were mounted on the circumference of a circle of each cross section position- they included strain gauges attached in longitudinal direction and hoop direction; there were four cross section positions for these strain gauges in the longitudinal view. Section H was at the position at the loading point. Section C was at the position at end of concrete filling. This arrangement provided strain data for determining the position of the tube’s neutral axis and for validation of FE models. LVDTs or displacement sensors (SDP-200D, SDP-100C model, ±100 mm, LVDTs with 5 Vdc output) were used for determining the concrete filling’s longitudinal lengthening and globally vertical displacements. There were 8 LVDTs at 8 positions, numbered 1 to 8, as shown in Figure 5. The out-of-plane displacements were also utilised to evaluate the local buckling modes. A 3-dimensional view of instrumentation arrangement of strain gauges and LVDTs is shown in Figure 6.

Testing Procedure

The 3-point bending test of the PCFST was carried out to evaluate the behaviour of the PCFST and at the transition between the filled concrete and steel tube. The load cell moved vertically down to apply a downward load through the beam via several welded plate stiffeners, which contacted the tube specimen at mid-span, as shown in Figure 4. A displacement control was adopted to drive the load cell actuator at a constant rate of 1 mm/min. The load was spread to the tube specimen via this rigid beam-stiffeners system. In this testing arrangement, in-plane bending of the tube specimen could be obtained between the loading point and the two end supports without the presence of axial force. Prior to each test the tube specimen was pre-loaded at low load levels to remove any clearance in the connections, checking the displacement sensors and strain gauges, and the load cell. The applied load then returned to zero and the displacement sensors and strain gauge readings were also set to zero. The specimens were loaded via the hydraulic jacks where displacement control was adopted to drive the load cell actuator at a constant rate. In this study, the tube specimen was loaded under repeated loading-unloading cycles to the maximum load and the test stopped after 20 repeated cycles. This selection was based on FE simulations done prior to the experimental testing to expect the steel material reached its tensile strength, and the observation during the test showed that the tube’s strength slowly going down after passing the ultimate load that it was enough that all important information of the PCFST’s flexural behaviour was obtained for this study. In fact, in the experimental results, the load-displacement curve, as shown in Figure 11, and the steel’s stress-strain curves obtained by the FE models, as shown in Figure 10, clearly confirmed that the tube reached the ultimate capacity, and the steel material also reached the tensile strength. The data associated with load, displacement and strain gauge readings were recorded by the LabVIEW data acquisition software (National Instruments). Based on these data, load-deflection and load-strain curves were plotted.

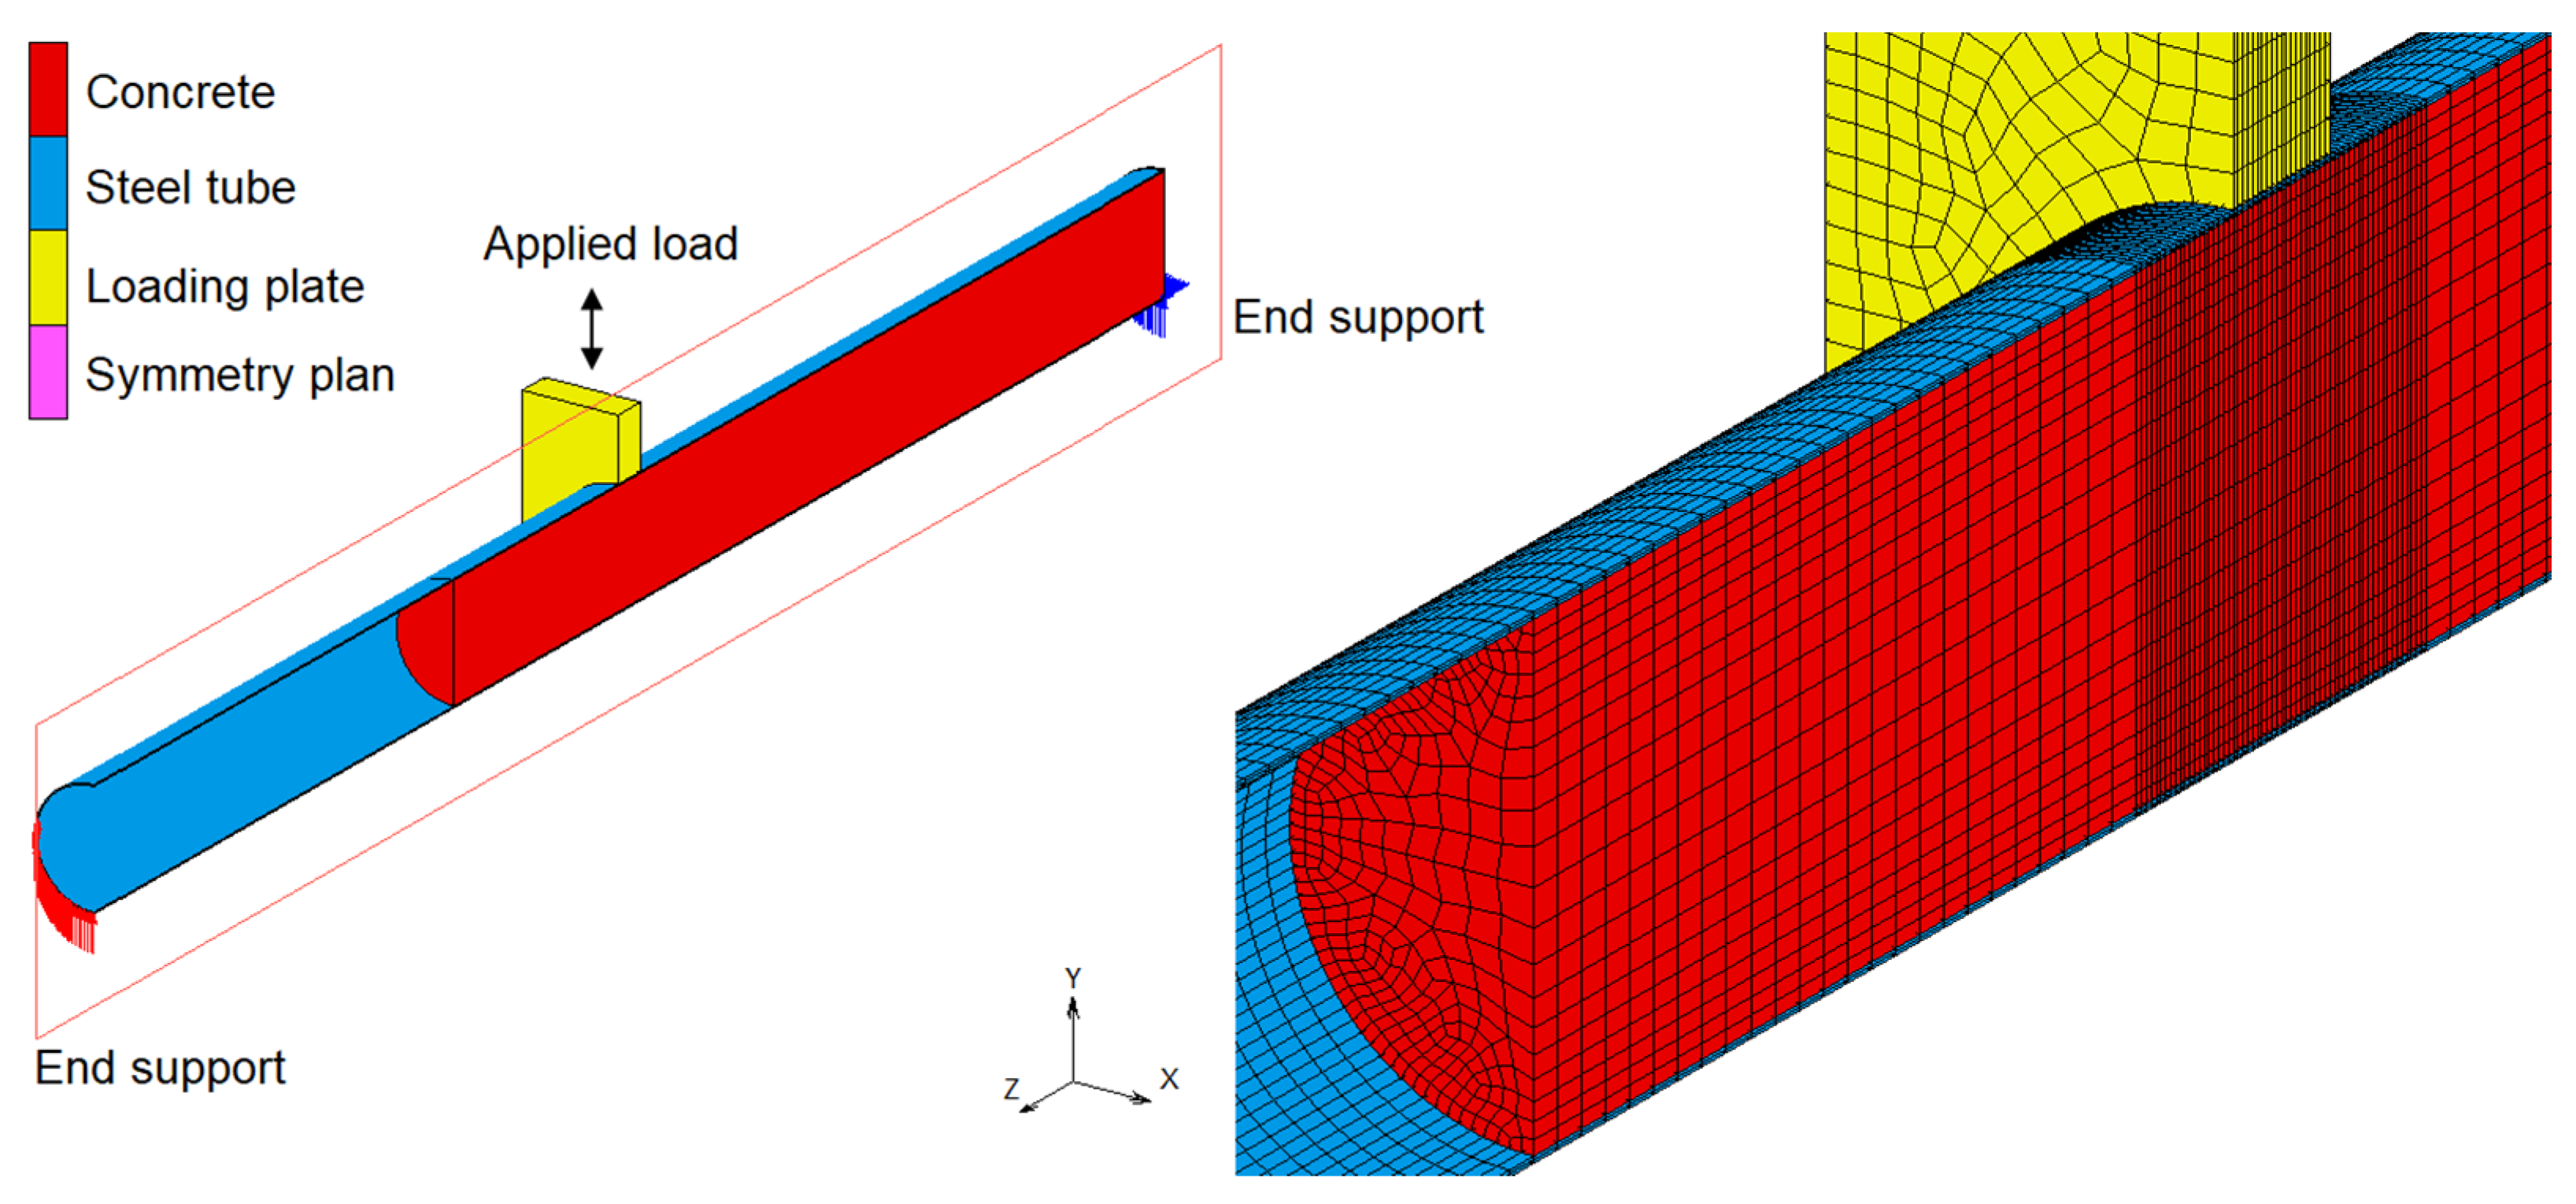
3. Finite Element Modelling

Finite Element simulations were conducted using Marc (MSC Software, version 2021) to simulate the three-point bending test of the tube. Figure 7 illustrates the FE model setup for the partially concrete-filled tube specimen. By taking advantage of symmetry, only a half of the test specimen in longitudinal direction was modelled.
In the experiment, at each end the tube was welded to a thick steel plate which was placed over a roll. In the FE model, for simplicity, one end of the tube was set to be supported with restricting displacements in vertical direction and the other end was supported with restricting displacements in vertical and horizontal directions. However, these restricting displacements were only applied on two third of the tube’s diameter from the bottom (Figure 7) to consider the effects of the rigid steel place. This boundary length was determined by trial-and-error with different lengths when comparing the simulation results of each case with the experimental result. The steel tube was presented by solid elements with a size of 50 mm × 18 mm × 4.5 mm; in the region around the loading plate the elements had small size of 10 mm × 18 mm × 4.5 mm. The concrete was presented by solid elements with sizes ranging from 50 mm × 50 mm × 50 mm to 18 mm × 18 mm × 18 mm and as small as 10 mm × 10 mm × 10 mm in the region around the loading plate. The steel tube was modelled using 28,560 elements while the concrete was modelled using 49,938 elements; they are 3-D, eight-node, first-order, arbitrarily distorted brick elements with global displacements and rotations as degrees of freedom (element type 7).
The material properties of the steel tube were obtained from physical tensile tests. The steel tube was modelled by an elastic-plasticity model with an elastic modulus E = 200,000 N/mm2, the Poisson’s ratio ν = 0.3, the density ρ = 7890 kg/m3, the yield stress σy = 382 N/mm2 and the tensile strength σt = 542 N/mm2. The von Mises yield criterion with “isotropic hardening” rule was employed to define the elastic limit of the tube steel when it was subjected to multi-axial stresses. The response of the steel tube was modelled by an elastic-plasticity theory with associated flow rule.
The constitutive model proposed by Buyukozturk [37] was adopted in this study for modelling the concrete material behaviour in compression and in tension. The typical strain-softening relationship of concrete used in the FE model is shown in Figure 8, where compressive stresses are shown as negative. In Figure 8 the area under the tension-softening region represented fracture energy Gf. Upon cracking, the stresses went to zero, the material lost all load-carrying capacity in tension.
In FE analysis, the stress and strain data for steel tube and concrete filling were obtained locations where they were maximum values in compression and in tension for investigating the PCFST behaviour and concrete confinement. They were at the material points located at the outer fibres of steel tube and concrete filling at mid-span cross section as shown in Figure 9.

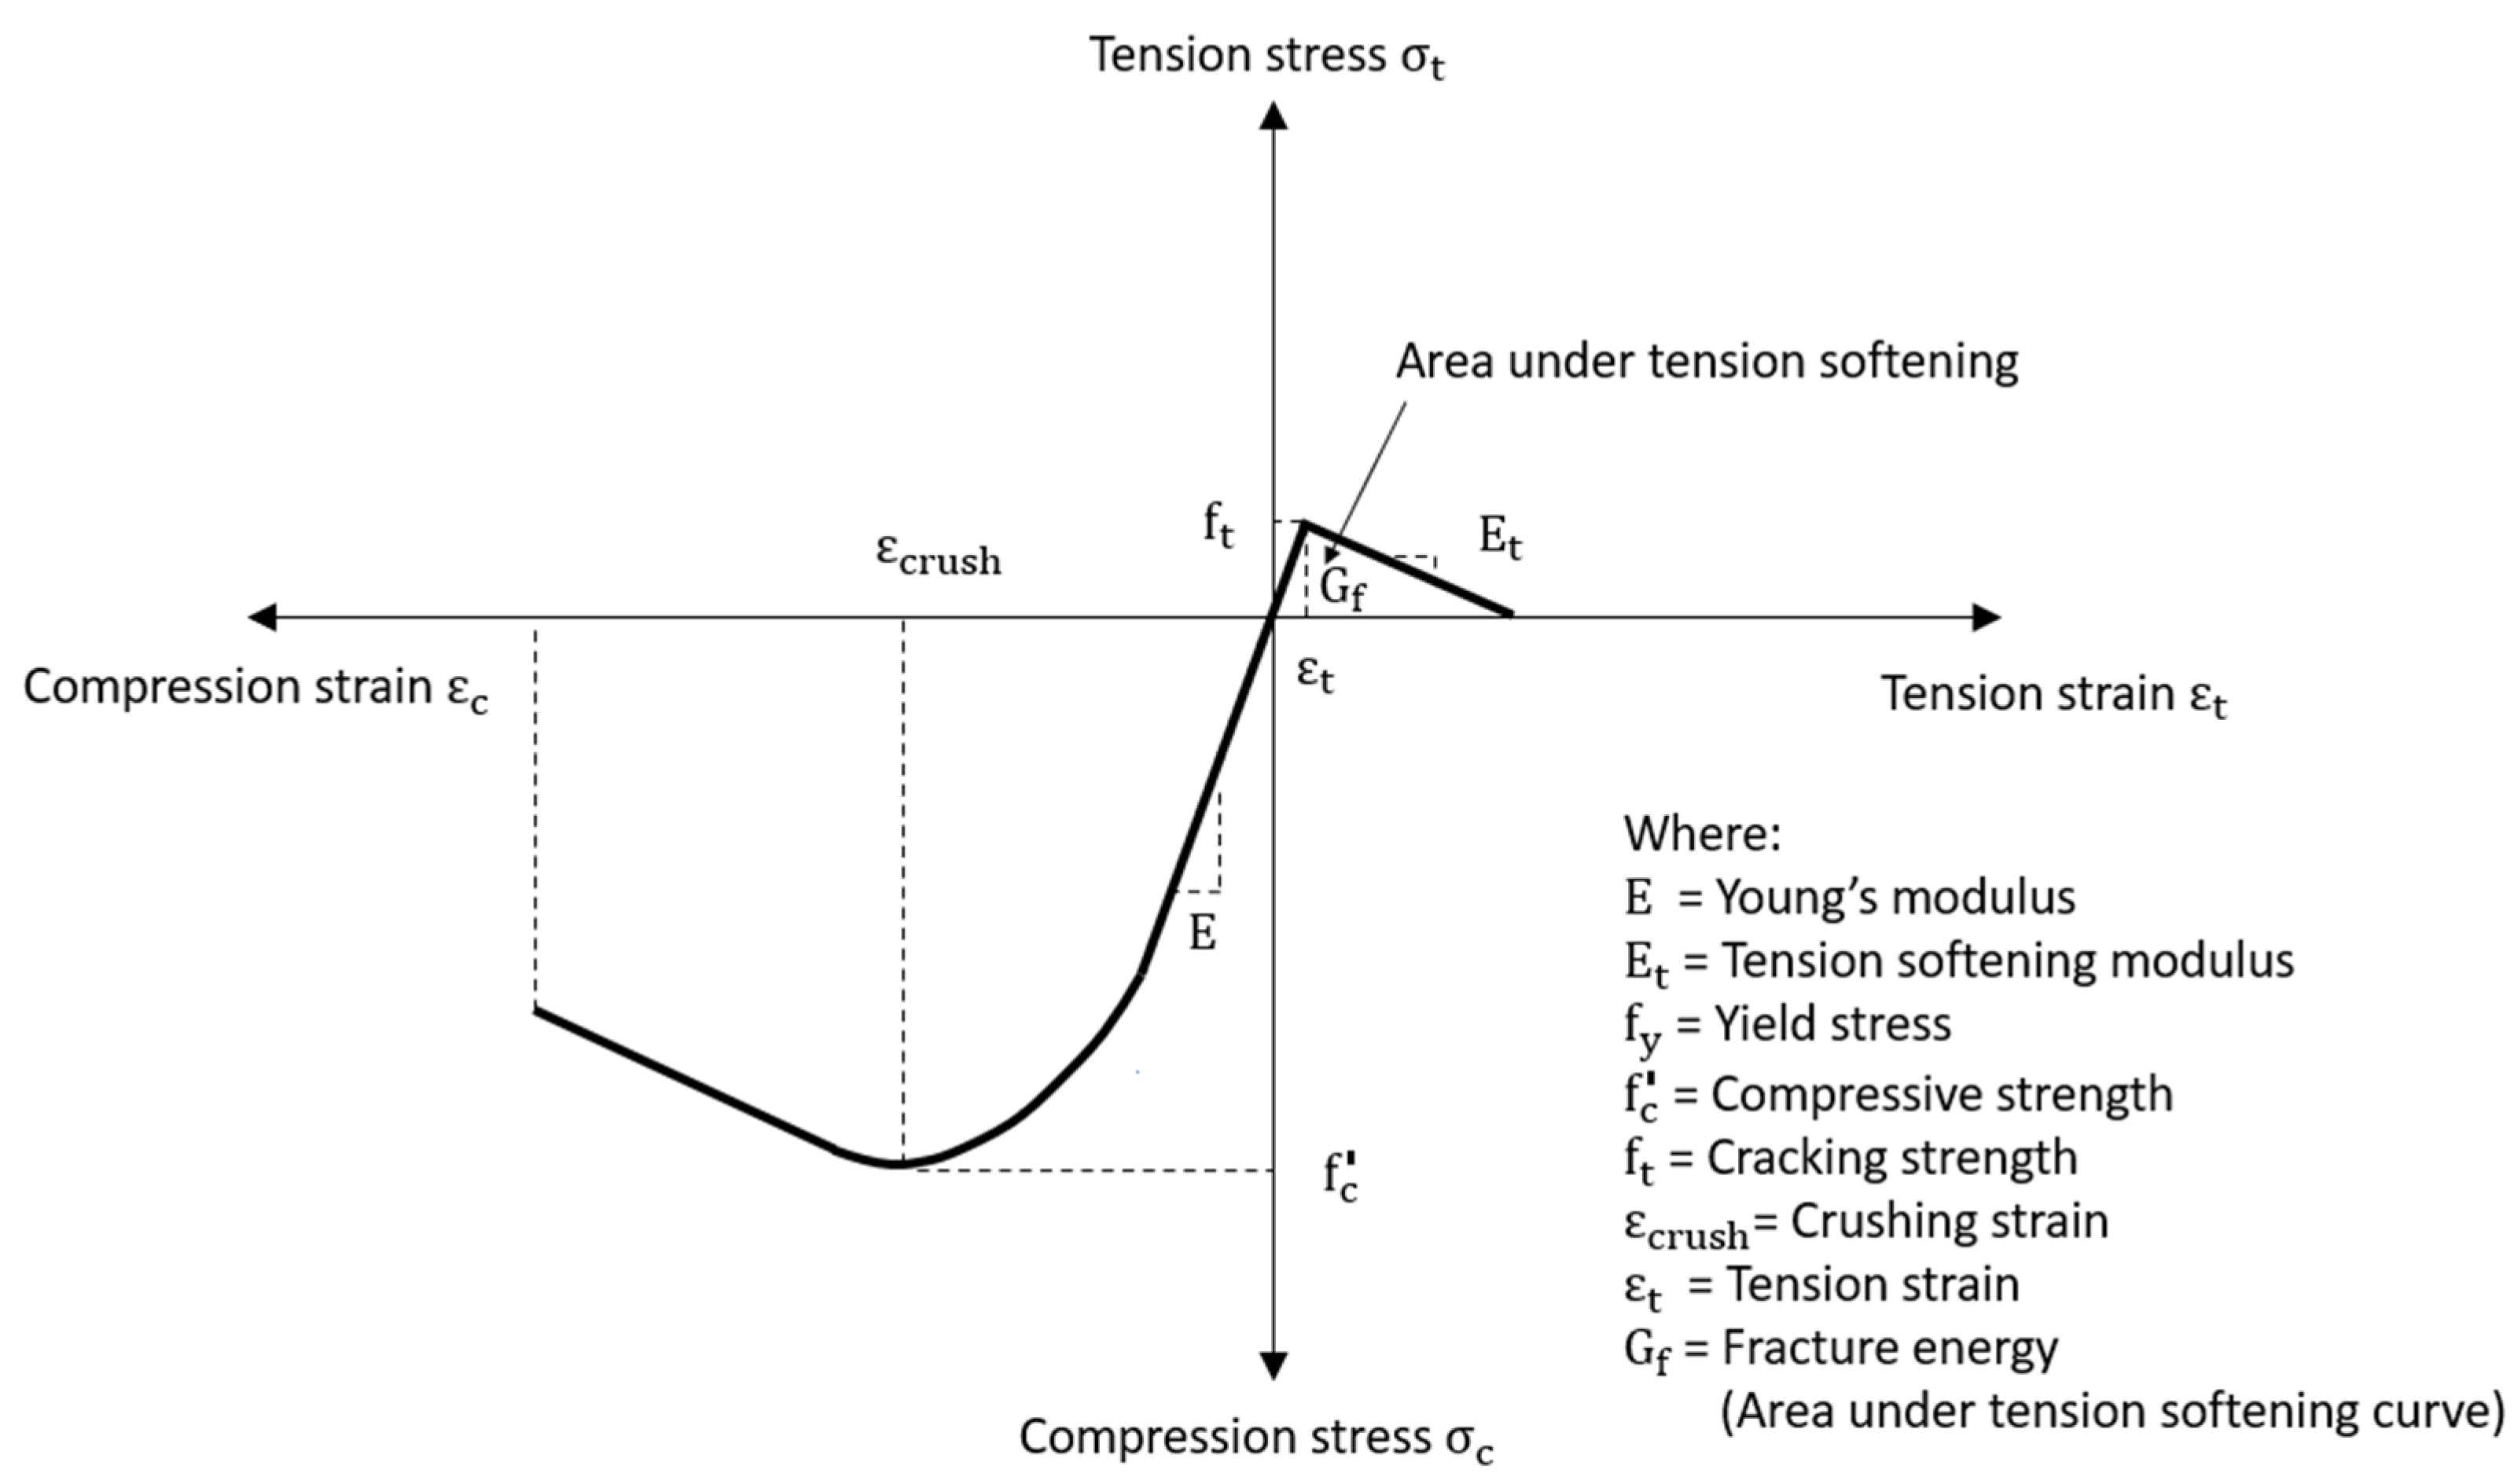
3.1. Concrete in Compression

The concrete in compression was modelled as an elastic-plastic theory with associated flow and isotropic hardening rule. The general failure surface and yield surface for concrete in compression were derived from the generalised Mohr-Coulomb behaviour, together with the experimental data as follows:
3 J 2 +   σ ¯ J 1 + J 1 2 5 =   σ ¯ 2 9
where   σ ¯ = P 3 with P was the hydraulic pressure; J1 and J2 were the principal stress invariants.
It was assumed that no plastic deformation appeared when the equivalent stress was smaller than 0.3 times compressive strength and before yielding, the concrete was assumed to be linear. The material properties of the concrete filling were obtained from the uniaxial compressive tests in which the compressive strength of concrete after 28 days was 41 N/mm2 and the corresponding strain was 0.002. Other material properties of concrete were the elastic modulus of concrete E = 25500 N/mm2, the Poisson’s ratio ν = 0.2, the density ρ = 2500 kg/m3. The material properties of confined concrete were usually used for the concrete filling by assuming that the filled concrete was subjected to laterally confining pressure from the steel tube. Therefore, the equivalent model of the confined concrete materials, proposed by Mander and other researchers [38], was employed. In this study, the uniaxial compressive strength was 41 N/mm2 and the corresponding strain was 0.002, as forementioned in Section “Experimental test programme”. The value of the compressive strength and the corresponding strain of this confined concrete model, were calculated as 46 N/mm2 and 0.003, respectively, using Equations (A1) and (A2), as shown in Appendix A. Therefore, these values were used as the input compressive strength for concrete elements in the FE models in this study. However, to investigate the effect of the compressive strength on the concrete filling’s and the PCFST’s flexural capacities, different values of the compressive strength were also used as the input strengths for concrete. They included the compressive strength of 41 N/mm2 and 36 N/mm2. Because the interaction (contact) between the concrete filling and stell tube was modelled, the filled concrete was subjected to laterally confining pressure from the steel tube. Hence, the confined compressive stresses and strains in concrete could be predicted by the FE models and compared with those determined by theoretical models.

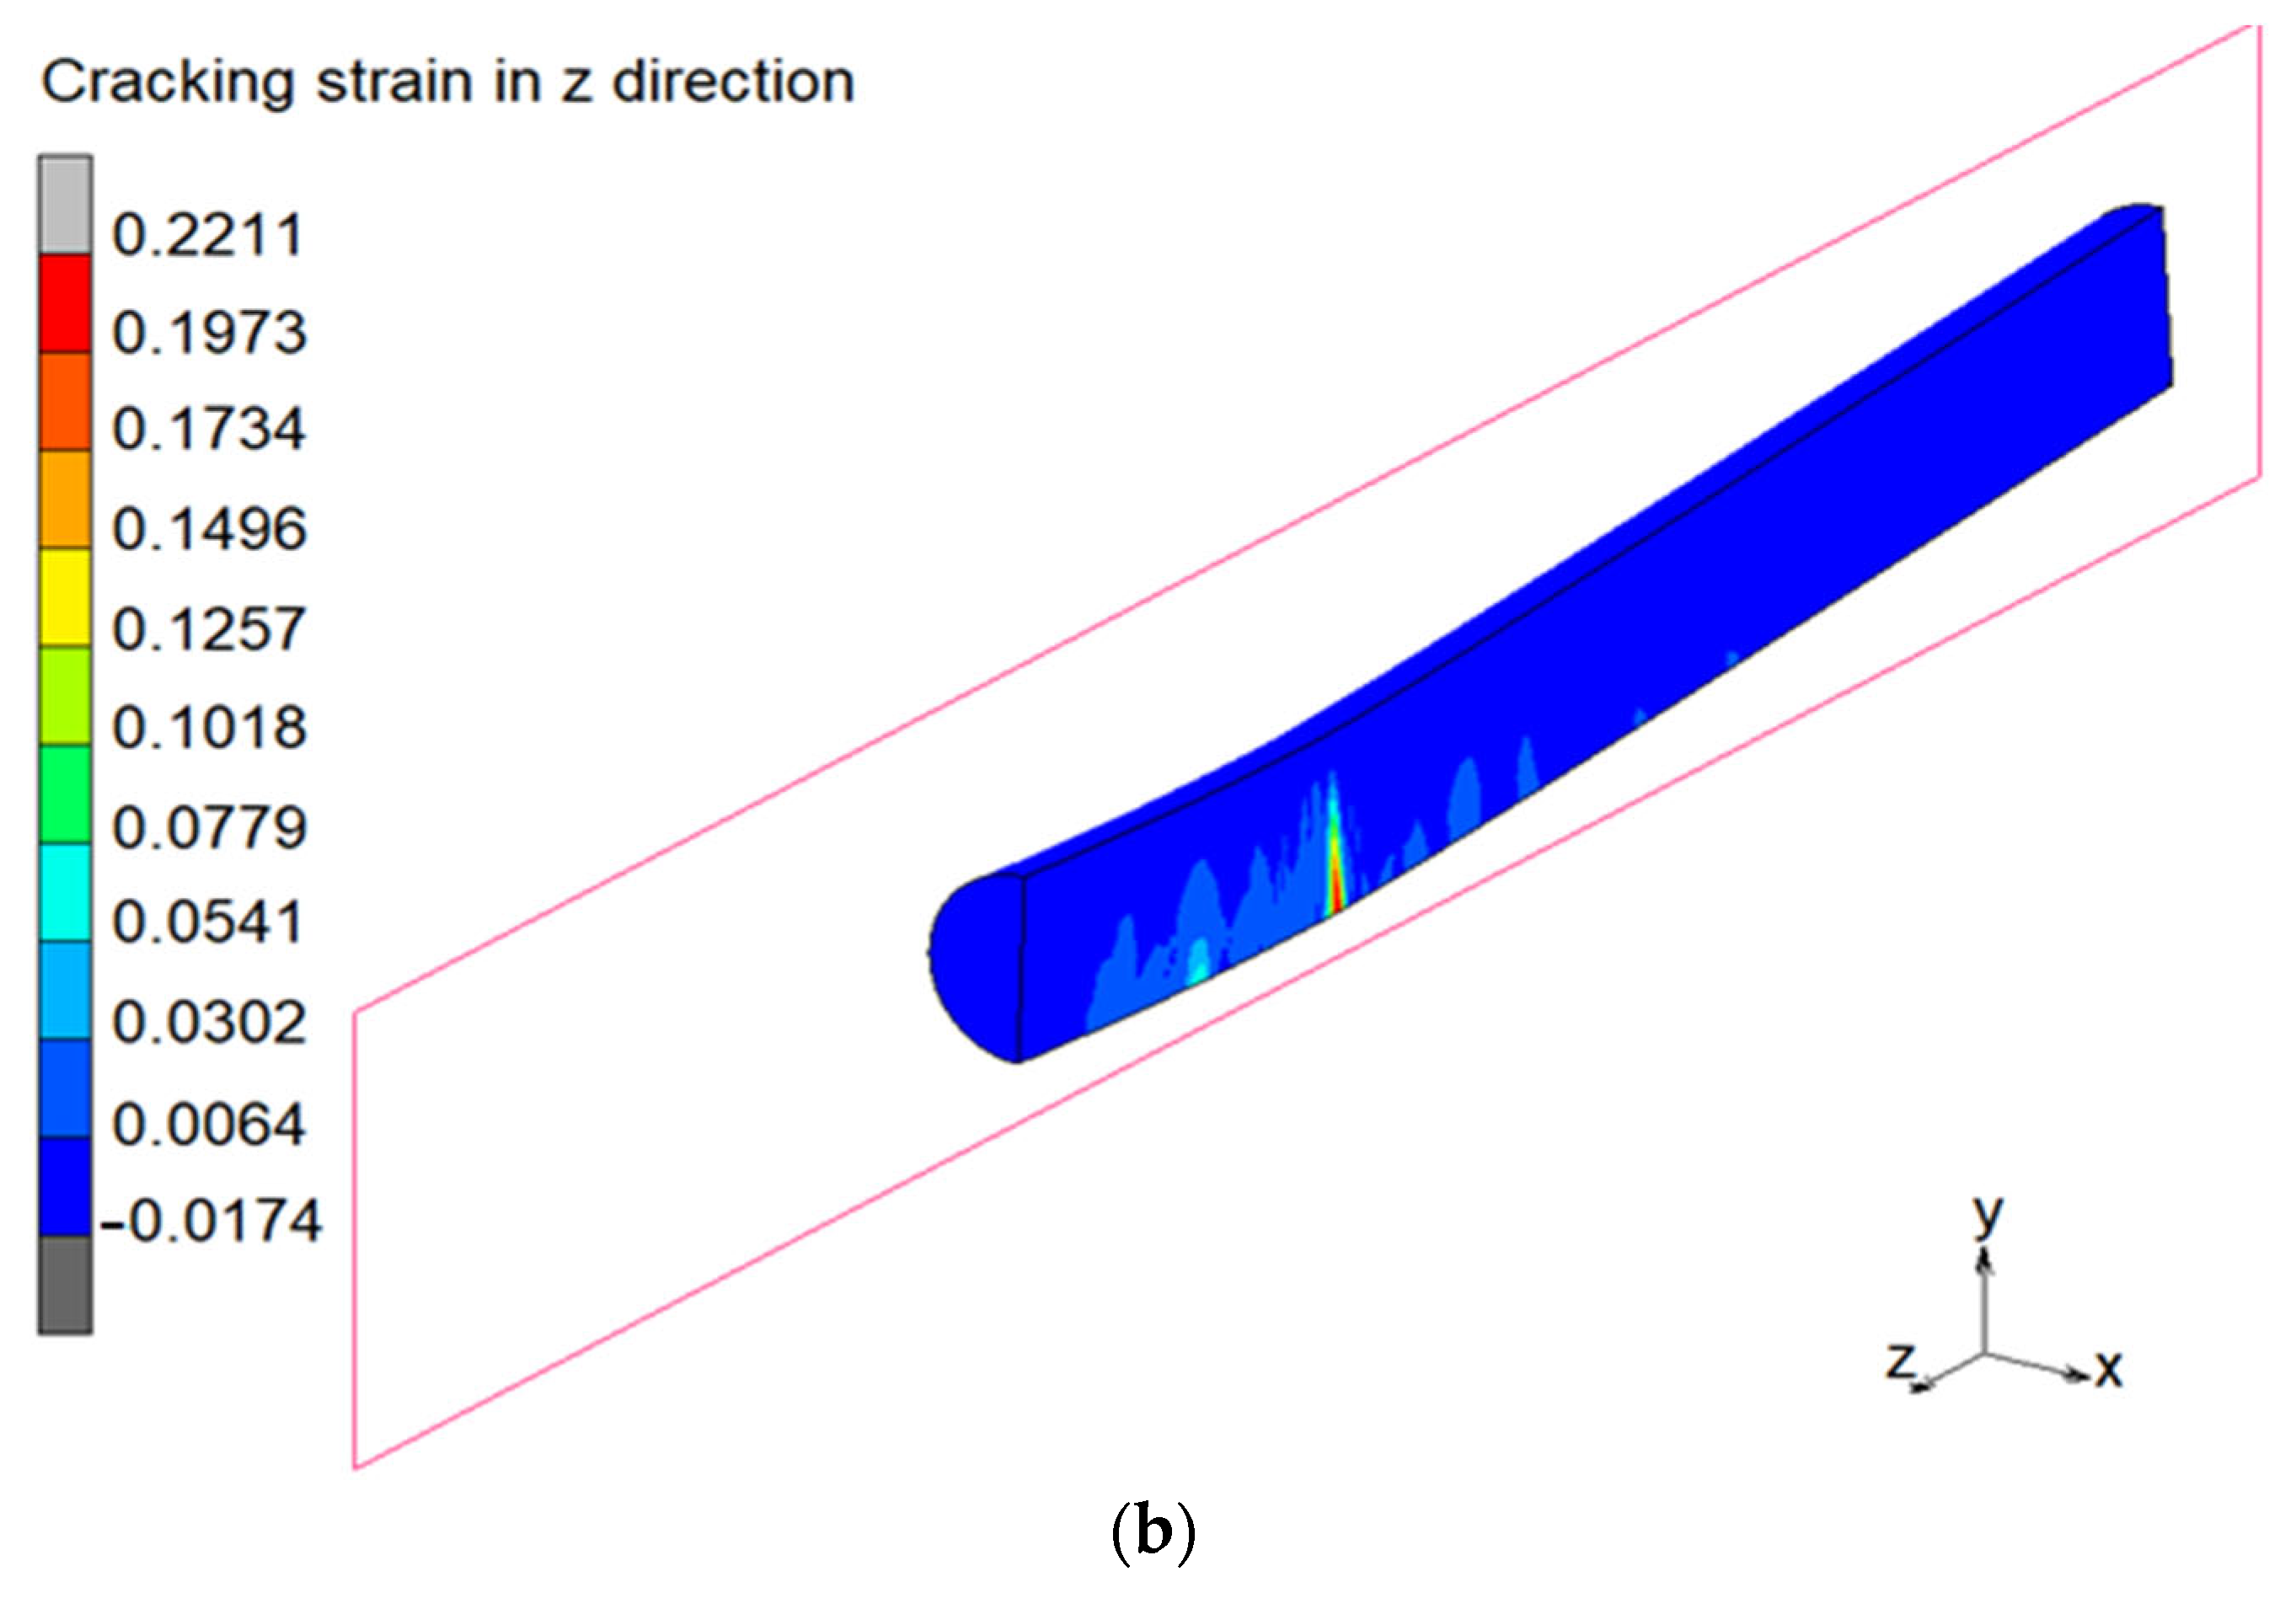
3.2. Concrete in Tension

The concrete in tension was modelled using elastic-plastic-fracture material with the adoption of the “smeared” crack approach and strain softening rule for presenting the crack formation. In this type of model, a crack developed in concrete material when the maximum principal tensile stress in a direction exceeded the specified cracking stress value. The cracks occurred at a material level instead of creating gaps between elements, and the formation of cracks was simulated by replacing the isotropic stiffness matrix by an orthotropic stiffness matrix upon crack formation [39,40]. In the FE model, the fracture energy dissipation was accomplished using the crack band model originally proposed in [41]. The energy per unit area Gf required to completely open a crack was defined as
G f = l c 0 ε 0 σ n d ε n
In which lc was the crack band width and was equal to the width of the element in the direction perpendicular to the crack; σn was the stress normal to the crack plane; εn was the strain normal to the crack plane; ε0 was the strain at end of softening curve; Gf was the fracture energy per unit area determined from experimental data or from codes of practices. In this study, the linear softening model was used, as shown in Figure 8. The tension-softening modulus was assumed to be 5 to 10% of the modulus of elasticity as usually adopted in literature. When the element size lc, the fracture energy Gf and tensile strength of concrete were known, the stress-strain relationship of the linear softening model could be determined by Equation (2). The crack initiation and propagation in the concrete was modelled by specifying cracking stress, tension-softening modulus, and shear retention values for the concrete. After the crack was formed following the train-softening path, the load-carrying capacity of concrete in tension across the crack diminished, as illustrated in Figure 8.
The contact between the concrete filling and the steel tube was modelled as contact surfaces using 3-D contact elements. The friction between the concrete filling and the steel tube was assumed isotropic and modelled by Coulomb’s law with a friction constant of 0.3. Coulomb friction model was chosen following a vast of studies in literature have also used this model for concrete-steel simulations. The value of 0.3 for the friction coefficient was not validated against physical measurements as physical data for friction was not available. However, this value was chosen based on values suggested in literature. In addition, if the consistency of results could be obtained (for bending test simulations in comparison with tests, especially in terms of buckling failure modes of the steel tube) it could seem to further justify such assumption. A study was carried out to investigate the effects of concrete parameters to the reliability of the FE model and results. Based on this investigation, a set of appropriate parameters were selected as follows:
(i)
Mesh density: two different meshes, MESH I and MESH II, with the same small size in the region around the loading plate, were used for the concrete filling. MESH I had 49,938 solid elements of 50 mm × 50 mm × 50 mm, and MESH II was a very fine mesh, of 82,656 elements of 50 mm × 50 mm × 25 mm. The simulation results revealed that the maximum loads in MESH I differed from those of MESH II by less than 2%, but the analysis time was twice expensive for MESH II. Therefore, MESH I was considered accurate enough to be used in this study.
(ii)
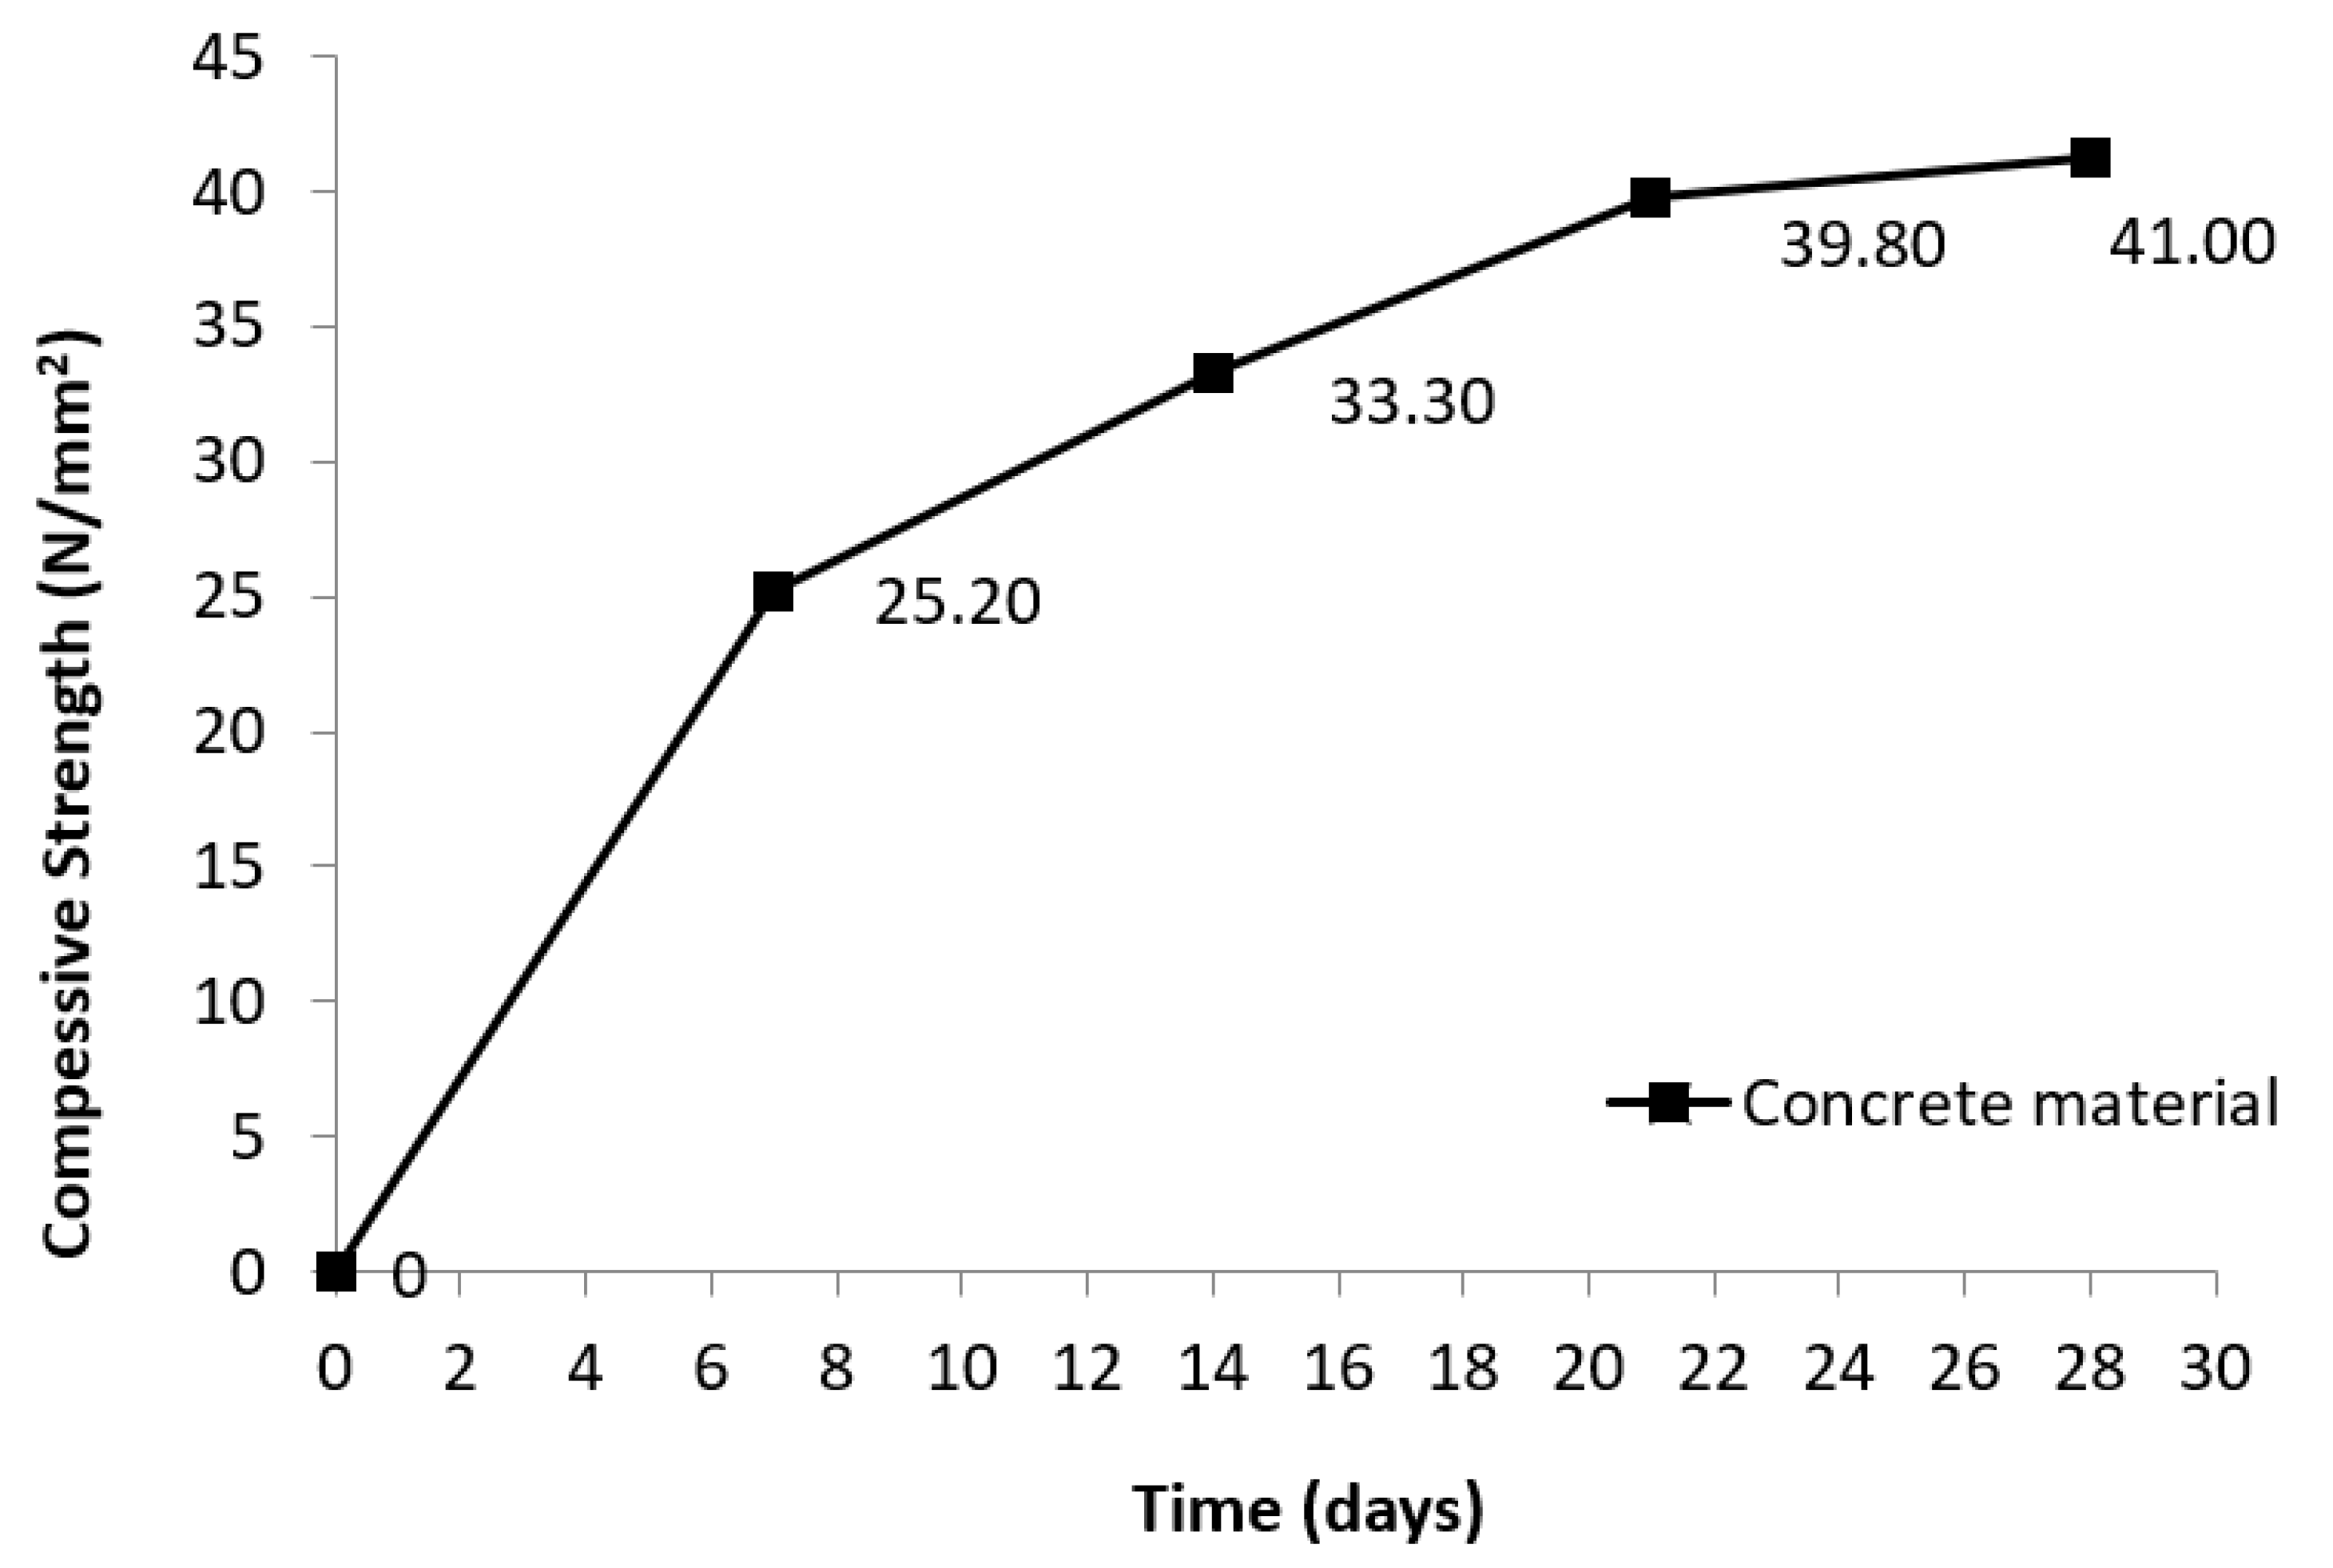
Compressive strength: values of 41 N/mm2 and 46 N/mm2 were used for the compressive strength of concrete material in the FE models. The first value was for the concrete obtained from testing, and the second value was for confined concrete, proposed in [38], as presented in Appendix A. The two FE models, however, obtained similar results in terms of load-displacement relationship and maximum loads despite a small difference in their compressive strength values. It was because under the applied loads, the concrete filling was confined by the steel tube based on their frictional contact and structural configuration. This resulted in a significant increase in the compressive strength in the concrete filling after the yield point; it meant there was not crushing in the compressive region of concrete.
(iii)
Shear retention factor: in the literature on nonlinear Finite Element modelling of reinforced concrete structures, a range of values between 0.1 to 0.5 was suggested for the shear retention factor [42,43]; therefore, these values were investigated in this study. It was found that when values of shear retention factor were relatively small, they led to numerical instabilities in the Finite Element analysis; when values were from 0.2 to 0.5 the maximum load values differed to the experimental result from 1% to 3%, respectively. For these reasons, the typical value of 0.2 was used for the shear retention factor in this study.
(iv)
Cracking strength: the values of cracking stress f t in the range of 5 to 10% of the compressive strength f c [38,41] which were of 2.5 to 4.6 N/mm2 were investigated. It was found that the maximum load values were greater than the experimental values from 1% to 3% for the cracking strength of 2.5 and 4.5 N/mm2, respectively. In this study, the value of cracking stress was taken as 2.5 N/mm2.
(v)
Tension softening modulus: The tension-softening modulus E t was assumed to be 5 to 10% of the modulus of elasticity. The investigation also included the case that the tension softening modulus was specified to zero for modelling concrete as a complete brittle material (the sudden cracking with a complete loss of the stiffness upon cracking). It was found that the maximum load values differed to the experimental result from −12% (when E t was zero) to 2% (when E t was 10% of the modulus of elasticity). In this study, the tension softening modulus E t was assumed to be 1930 N/mm2 which had a maximum difference of less than 1% to the experimental value.
(vi)
Loading step: an initial fraction of loading time of 0.001 s and a maximum fraction of loading time of 0.005 s were used for the solution to be stable and reliable. The time step was selected through a trial-and-error procedure by continuously reducing the time step until similar results were obtained. In particular, the first analysis started with a maximum time step of 0.02 s and then it reduced time step to a smaller one until a time step of 0.001 s. The amount of time step in one reduction varied from 0.0005 s up to 0.05 s was selected from comparing the result of the second analysis to the first analysis’s. The compared results were the slopes of load-displacement curves and the ultimate forces in the bending simulations of the PCFST specimen. The maximum difference in the slopes and in the ultimate forces was set up within 5%. It was found that converged results were observed when time step was small enough, and similar results were obtained for the analysis with a time step of 0.001 s and 0.002 s. In this study, a maximum time step of 0.001 s was selected for accuracy reasons. It should be noted that this time step was selected in association with a reasonable finite element mesh (refer to 3(i)), an implicit analysis type with a full iteration method (refer to 3(viii)), and a strict convergence tolerance (force tolerance of 0.01 and displacement tolerance of 0.01, refer to 3(vii)). The convergence and consistency of the numerical results seem to justify such time step. Excellent agreements when comparing with experimental results from the bending test further validated this time step selection.
(vii)
Analysis tolerance: a relative force tolerance of 0.01 and a relative displacement tolerance of 0.01 were used for the solution to be reliable.
(viii)
Analysis type: an implicit, static analysis was employed. A full Newton-Raphson method was used for the iterative procedure.

4. Parametric Study

A parametric study was carried out using the previously verified FE model to investigate the effects of different parameters on the PCFST’s flexural strength, the concrete filling lengths, the behaviour of the transition of the concrete filling and steel tube (position of the neutral axis), and the confined concrete strengths. The parameters included: the tube diameter-to-thickness ratio D/t, the concrete filling length-to-total length ratio Lf/L, the compressive strength of concrete, and the yield stress and tensile strength of steel tube. For each parametric study, the equivalent envelope (the load-displacement curve of the PCFST when it was subjected to monotonic loading) was obtained, and the ultimate load was extracted from this load-displacement curve.

4.1. The Tube Diameter-to-Thickness Ratio D/t

In this study, the tested steel tube which had a length of 9.5 m, a thickness of 9 mm and an inner diameter of 700 mm, associating with a tube diameter-to-thickness ratio D/t of 78 was considered as the reference structure. The material properties of concrete and steel were assumed the same with those used in the FE modelling of the experimental test. Three wall thicknesses were considered, including 18 mm, 9 mm and 5 mm which corresponded to D/t ratios of 39, 78 and 140, respectively. This large range of D/t ratio could represent the full range of the structure behaviour and failure modes from elastic local buckling to fully plastic failure and cracking in the concrete filling.

4.2. The Concrete Filling Length-to-Total Length Ratio Lf/L

For each D/t ratio of the PCFST structure, the concrete filling length Lf varied that the ratio Lf/L was set at six different values: 0, 0.34, 0.50, 0.60, 0.66 and 1. The value of zero means there was no concrete filling whilst the unity value means the concrete filling length equals the tube length. The material properties of concrete and steel were assumed the same with those used in the FE modelling of the experimental test. The ultimate loads of the FE models with different values of parameters D/t and Lf/L were obtained for evaluating the effects of these parameters on the flexural strength of PCFST structures. They were also used to predict the optimal length of partial concrete filling after which there was no gain to the maximum load of the PCFST.

4.3. The Compressive Strength of Concrete f’c

Different values of compressive strength were used for concrete material in the FE models. They included f’c = 36 N/mm2, 41 N/mm2 and 46 N/mm2. The value of 36 N/mm2 was an assumed value. The value of 41 N/mm2 was obtained from testing for the unconfined concrete while the value of 46 N/mm2 was obtained from the unconfined concrete of 41 N/mm2 with confinement consideration, using the theoretical model, proposed by [38]. By selecting these values, the effects of the compressive strength on the PCFST’s flexural strength could be studied. Furthermore, the confined strength of concrete filling predicted by the FE modelling and by the theoretical model could be compared. For each compressive strength, there were three different sets of steel grades: σy = 334 N/mm2 and σt = 448 N/mm2, σy = 382 N/mm2 and σt = 542 N/mm2, and σy = 458 N/mm2 and σt = 650 N/mm2.

4.4. The Steel’s Yield Stress σy and Tensile Strength σt

Different values of yield stress and tensile strength of steel were used for steel tubes in the FE models. They included three different sets of steel grades: σy = 334 N/mm2 and σt = 448 N/mm2, σy = 382 N/mm2 and σt = 542 N/mm2, and σy = 458 N/mm2 and σt = 650 N/mm2. The second set was material properties of steel tube used in the FE modelling of the experimental test and was considered as the reference set. The values of the steel strengths in the first set were 10% smaller than those of the reference set whilst the values of the steel strengths in the third set were 10% greater than those of the reference set. For set of steel grades, there were three different values of compressive strength, f c = 36 N/mm2, 41 N/mm2 and 46 N/mm2.

5. Result and Discussion

5.1. Experimental Results

The strain data were obtained at cross section locations shown in Figure 5. It was found that strain values were largest at cross sections near loading point whilst strain values were smaller near the boundary between steel tube and concrete filled steel tube (cross sections C and D). Plastic strains were generated when the applied load went beyond 800 kN in the 1st cycle. Figure 10 shows strain-load curves at cross section H near the loading point where largest values of strain in both compression and tension sides were recorded. It was observed that the largest value of strain occurred around the location at the loading point which was represented by Section H. Section H had strain gauges numbered as 90, 92, 94, 96, and 98 in the longitudinal direction, and 91, 93, 95, 97, and 99 in the hoop direction, as shown in Figure 10a. The tension side of Section H generated the largest strain during the test. The compression side of Section H also generated large strains which was about 0.015, where the buckling of the steel tube occurred. All measured strains, except the strains at No. 94 and 95, exceeded its yield strain which indicated that the steel material behaved in the plastic region. In the tension side, strains in the longitudinal direction (No. 98) achieved plastic levels before the PCFST reached the ultimate load, and the strain gauge might be peeled off or damaged. In the compression side, strains in the longitudinal direction (No. 90) and in hoop direction (No. 91) achieved its maximum capacity, indicating that the strain gauges did not expand further/ or the readings were not valid after the ultimate load was reached.
Figure 4b illustrates the deformed specimen of the PCFST specimen at maximum loading. Figure 11 shows the load-displacement curves at the loading point which also presents the envelope of experimental load-displacement curve (a line goes through all maximum load values of the loading process) and the FE load-displacement curves. It was observed that the tube remained elastic at the initial loading level up to 800 kN. After that, the axial stiffness reduced slightly as the tube went into the plastic region. The stiffness reduced until the ultimate (maximum) load was reached at about 1190 kN. The steel tube started buckling in the top side near the loading point (the compression region) after 7 cycles of loading-unloading; at this point the vertical displacement reached 120 mm. The buckling deformation was fully developed when the vertical displacement reached approximate 200 mm (at the 12th cycle of the loading-unloading process) and at this point, the load was 1190 kN. This load value remained almost unchanged for the next 3 consecutive loading cycles, indicating that this was the ultimate (maximum) load. The load was then gradually decreased for the last cycles. However, the deformation of the tube kept increasing, as shown in Figure 11. In addition, it was observed that there was no slippage was observed between the steel tube and concrete filling.

5.2. Finite Element Modelling Results and Validation

Figure 11 shows the comparison between the experimental and FE load-vertical displacement curves for the PCFST specimen while the stress-strain curves of concrete filling and steel tube are illustrated in Figure 12 (the stress and strain data were obtained at the material points of concrete and steel in compression and tension at the outer fibres, as shown in Figure 9). As mentioned above, the experimental result shows that the maximum load was of 1190 kN after 12 cycles at a displacement of approximate 200 mm. Hence, in the FE modelling, only the first 14 cycles were performed because it was enough to capture the behaviour of the PCFST specimen. It can be seen the FE maximum load was occurred at the 12th cycle of the loading-unloading process and its magnitude (of 1200 kN) was in excellent agreement with the experimental result (of 1190 kN), with a maximum difference of less than 1%. The envelope of FE load-displacement curve for repeated loading could be obtained in a similar way to the experimental results as explained earlier. Alternatively, the equivalent envelope could be obtained as the load-displacement curve of the PCFST when it was subjected to monotonic loading. The stress-strain curves in Figure 12 clearly show the behaviour of steel tube and concrete filling at the outer fibres at the mid-span cross section of the PCFST.
Generally, the FE predicted values for both stiffness and maximum load of each loading cycle were in good agreement with the experimental values. The initial stiffness and behaviour predicted by the simulation (for loading up to 400 kN) are excellent agreement with the experimental results. The tube then entered the partially elastic plastic range where there was a nonlinear relationship between the load and displacement where the flexural stiffness gradually reduced. When the plasticity further developed in the steel tube and cracks formed in the concrete filling around the mid-span region, the flexural stiffness significantly reduced until the maximum load was reached. After that point, the load still exhibited the same load bearing capacity until the end of the 14th cycles. It can be seen from Figure 11 that the experimental curves had slightly less stiffness than the FE ones after the initial stage of loading. In the FE load-displacement curves, the stiffnesses of the loading and unloading curves were greater than those in the experimental ones. In addition, they were unchanged during the unloading process. This was because the concrete model used in the FE modelling did not have a constitutive damage model that was able to capture the damage behaviour in the concrete. Lesser stiffness in the experimental curves for both loading and unloading could be due to some degree of imperfections and damage occurred in the concrete filling, which was extremely difficult to model for such concrete filled steel tube structures. Figure 13 shows the deformed mode shape and stress distribution of the PCFST specimen around the loading point in experiment, in which the FE modelling shape was also illustrated for comparison. The steel tube buckled near the loading point and was fully formed at the vertical displacement of approximate 200 mm and the maximum load of 1200 kN. It can be seen the buckled modes predicted by FE model was very similar to the experimental mode.
The FE model revealed that as the load increased, a wavelike deformation appeared along the length of the steel tube on the top side near the loading point. The steel tube clearly exhibited ‘local buckling’ and this phenomenon occurred due to the large compression on the thin-walled steel tube, indicating the loss of bonding between the steel tube and concrete fill in this local region. The development of the compression stresses and local buckling shape of the steel tube are illustrated in Figure 14. Despite this local buckling in the steel tube, the load-bearing capacity of the PCFST specimen was almost unchanged and the PCFST specimen was not failed under this mode. It is because the steel tube and concrete filling still worked as a whole ‘composite’ structure that prevented the buckling failure of the steel tube.
The behaviour of concrete filling in the PCFST specimen at the maximum load (at the 12th cycle) are shown in Figure 15 through the normal stress and strain distributions in the concrete filling. The concrete filling was under compression in a small region on top of the PCFST specimen, and a compressive region underneath the loading plate, as illustrated in Figure 15a. It can be seen the compressive stresses in concrete filling surrounding loading point were larger than its compressive strength, indicating that concrete filling was well confined. There was a large region around the lower half of the specimen that the concrete filling was under tension. The normal stresses caused cracking in tension concrete, indicating through the cracking strain contour and values. At the beginning of loading, “smeared” cracks (micro-cracks) occurred in a large region at the bottom of the specimen; when load increased (beyond 400 kN), more cracks developed in a narrow band under loading point position, as presented in Figure 15b. This was equivalent to the development and propagation of individual “macro” cracks. This further confirms the capability of the concrete model used in this study in predicting the crack development and in providing insight into the behaviour of the concrete fill.
Figure 16 compares the load-longitudinal strain responses of the tested and FE analysis specimens; the measurements on the cross-section H position at loads up to 900 kN of the 1st cycle, as shown in Figure 10, were taken as an example.
The difference between the experimental and predicted longitudinal strains was from 2% to 14%. Visual inspection indicates the experimental and predicted stiffness were almost similar up to the investigated load. It clearly confirms the excellent agreement between the FE modelling and experimental results. The positive values of the longitudinal strain number 94 (at the longitudinally central axis of the specimen) meant that this region was in tension, implying that the neutral axis of the steel tube was shifted up from the central axis for the steel tube.
The location of the neutral axis on the height (diameter) of the cross-section H could be determined by plotting the longitudinal strain values at positions 90, 92, 94, 96 and 98 against their heights; the height at which the longitudinal strain value was zero was the location of the neutral axis. Similarly, the locations of the neutral axis on the height of the cross-sections A, C, E, F and G could be obtained. Figure 17 shows the neutral axis in the transition region including sections A, C, E, F, G and H (as shown in Figure 3), measured by experimental strain data and predicted by FE analysis. As expected, the two neutral axes were comparable because strain predicted by the FE modelling were closely agreed with the experimental measurements with a maximum difference of 14% in strain values, as presented in Figure 16.

5.3. Parametric Study Results

5.3.1. Effects of the Tube Diameter-to-Thickness Ratio D/t

Table 2 shows the PCFST’s ultimate flexural loads for different values of D/t ratio and concrete filling length ratio Lf/L, using the FE model predictions. The ultimate loads were obtained from the envelope of maximum load values of the FE load-displacement curves. Figure 18 illustrates all enveloped load-displacement curves of different concrete filling length ratios at the tube diameter-to-thickness ratio D/t = 78. Figure 19 presents the relationship between the concrete filling length ratio and the ultimate load with different values of D/t ratio. It could be seen from Table 2 that for each concrete filling length, the ultimate load increased as the D/t ratio decreased, but at different rates. Decreasing the values of D/t significantly increased the ultimate flexural loads. The results show that the ultimate load increased as the D/t ratio decreased, but at different rates: when D/t ratio decreased twice, from 140 to 78, the maximum load increased 58%; however, when D/t ratio decreased twice, from 78 to 39, the maximum load increased 95%, that was nearly two times the previous change in D/t ratio. When the D/t ratio increased the tube was more vulnerable to fail by local buckling (buckled shapes formed around the loading point). It indicated the significant effects of increasing the tube’s thickness on increasing the PCFST’s ultimate flexural strength.

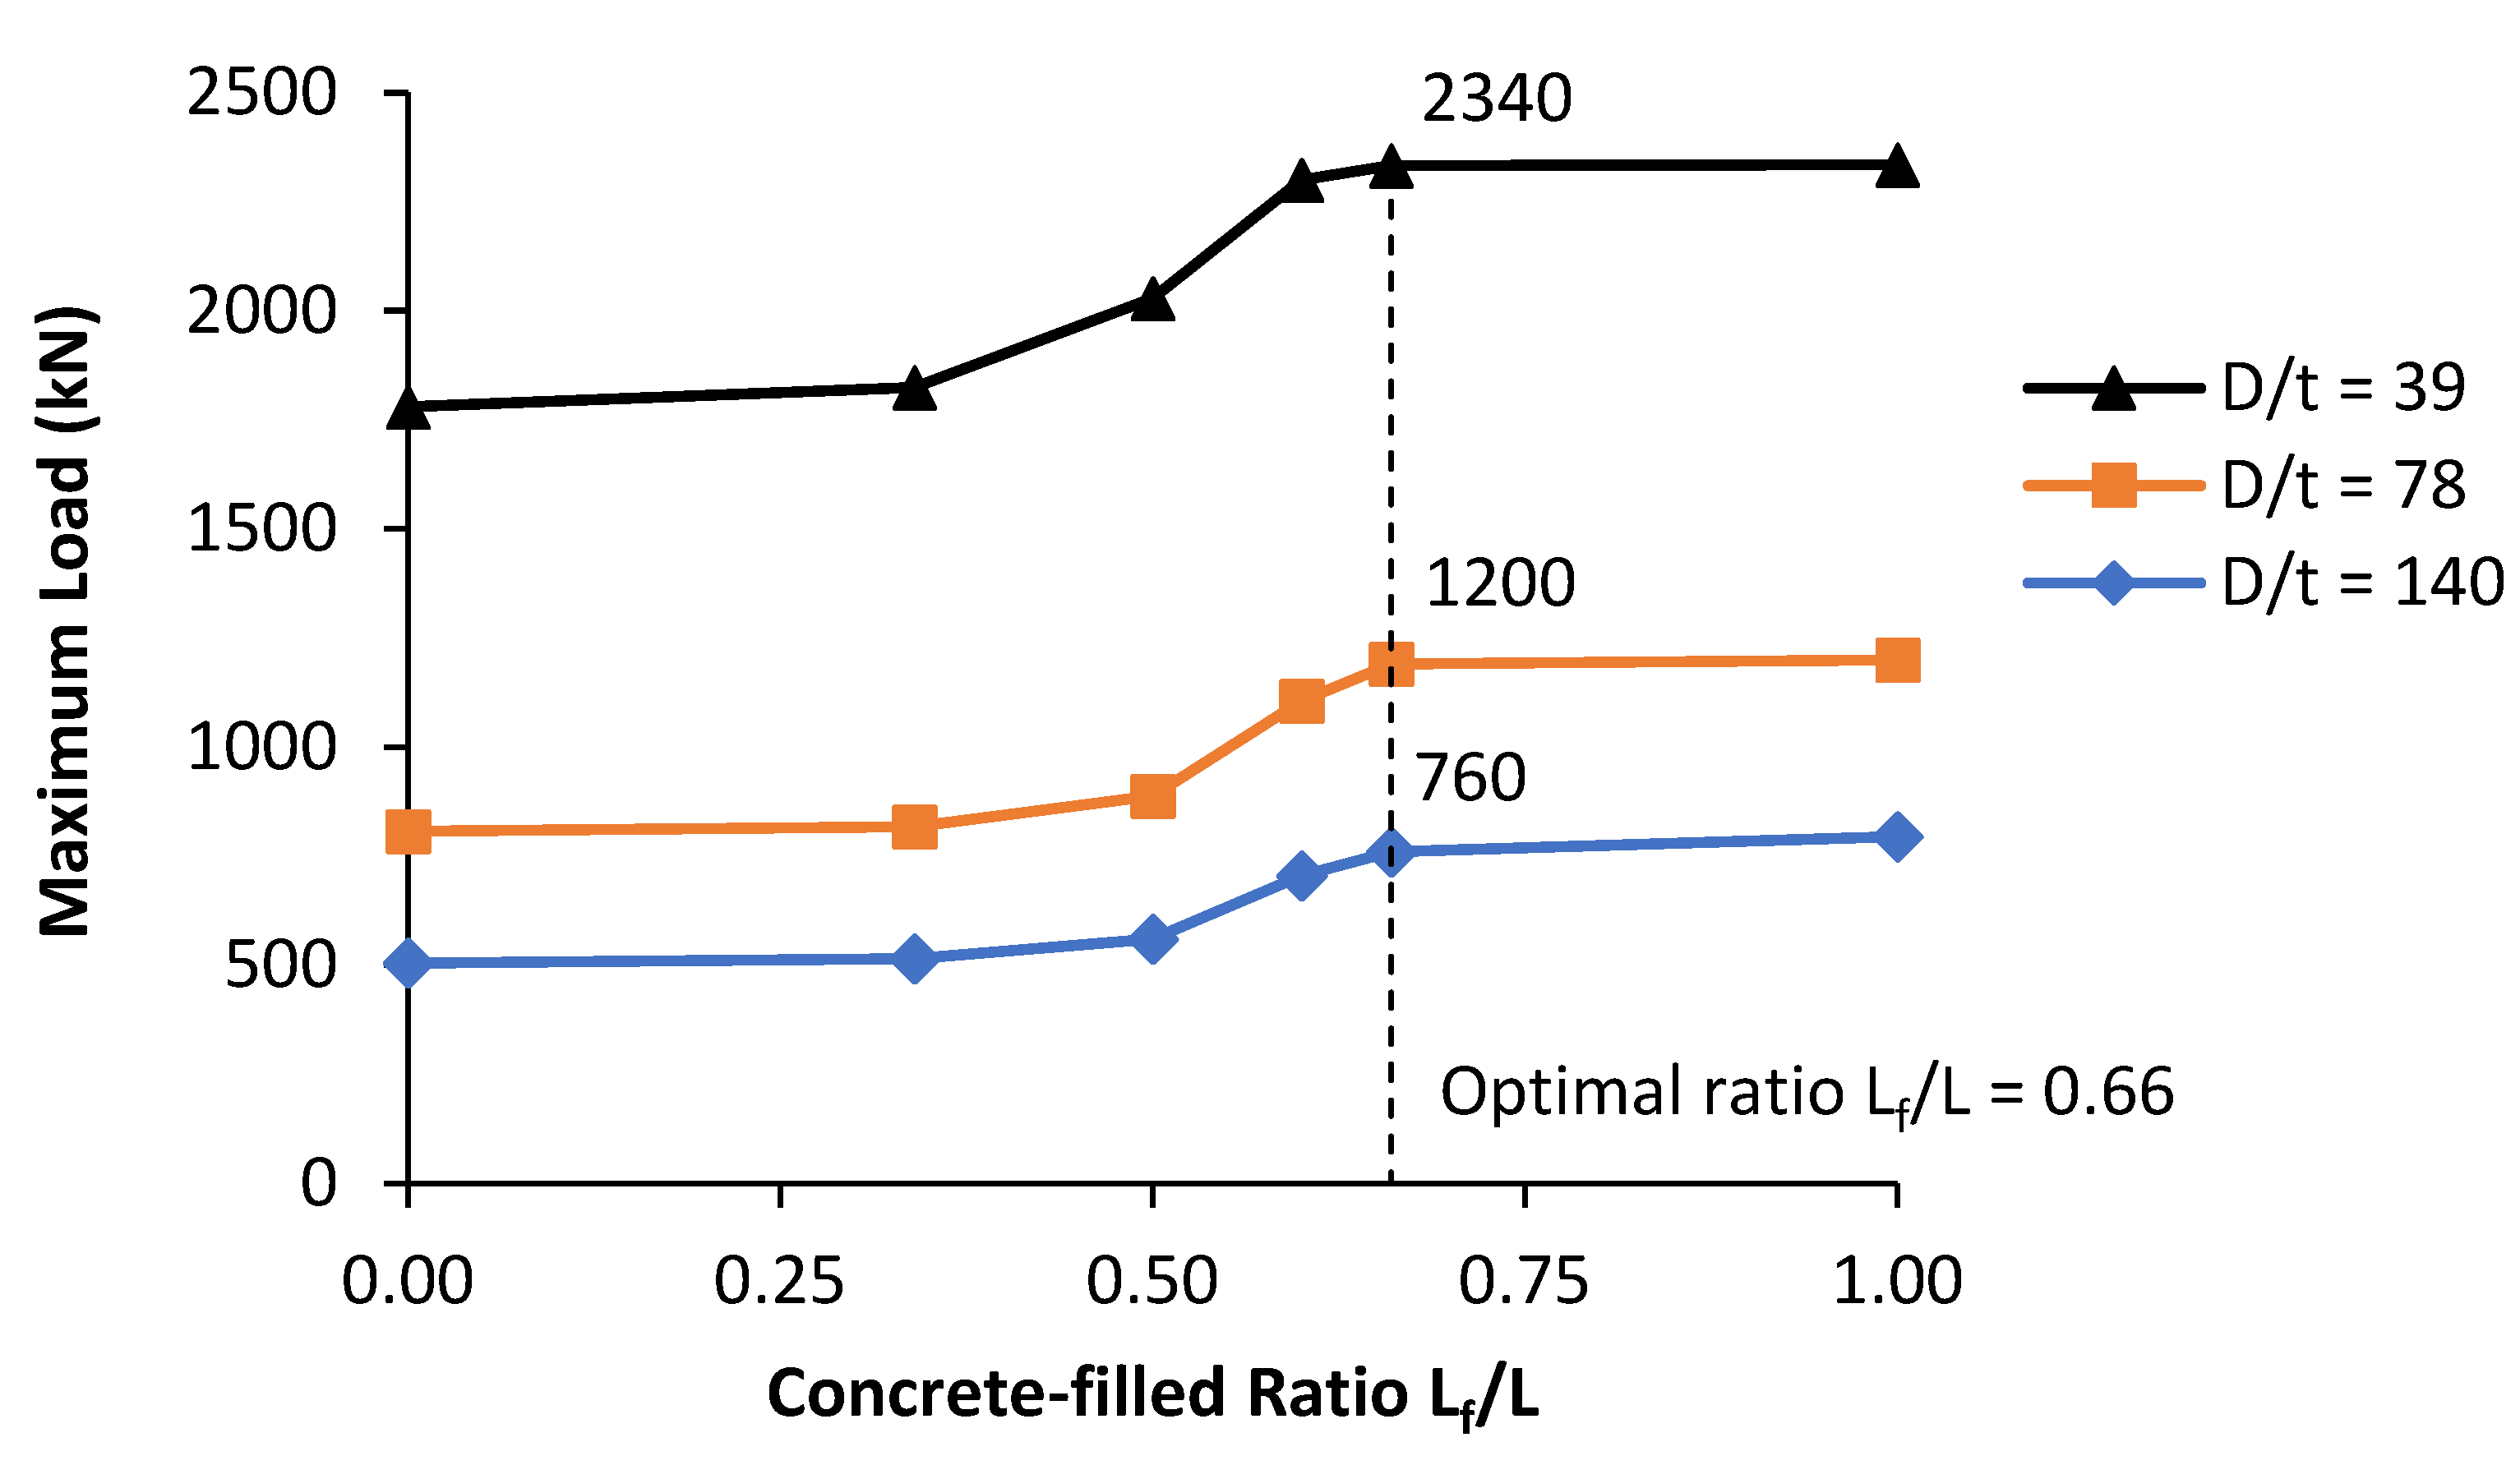
5.3.2. Effects of the Concrete Filling Length-to-Total Length Ratio Lf/L and the Optimal Length

Figure 18 and Figure 19 clearly shows that in general, the maximum load gradually increased with increasing the concrete filling lengths. When the values of Lf/L increased from 0.00 (no concrete filling) to 0.34, there was unnoticeable increase in the PCFST’s ultimate flexural loads. However, noticeable increase was shown when the values of Lf/L increased from 0.34 to 0.66. After the value of 0.66, it reached a plateau equivalent to the totally concrete filled tube capacity; it was where the optimal concrete filling ratio was determined. From Figure 19, it is evident that the optimal concrete filling ratio was dependable on the diameter-to-thickness ratio of PCFSTs.
First group of D/t = 39 achieved full plastic moment of composite section at mid-span with about 66% filling ratio. The optimal filling ratio increased to 66% and 60% for the second group of D/t = 78 and third group of D/t = 140, respectively. This confirms the hypothesis that complete filling of the tube with concrete was unnecessary. The results show that the optimal concrete filling ratio for the PCFSTs increased as D/t ratio increases. When the Lf/L ratio decreased and D/t ratio increased, the tubes were more prone to local buckling failure; therefore, it was necessary to increase the filling ratio up to the optimal concrete fill length as discussed earlier.
From Figure 19, it can also be seen that when the concrete fill length ratio increased from 0 to 0.34, the maximum load was almost unchanged; when the ratio increased from 0.34 to 0.66, the maximum load increased gradually until it reached the maximum value at around 0.66; after that point, increasing the length of the filled concrete did not enhance further the maximum load. This point determined the optimal length of the partial concrete filling considering the PCFST dimensions through D/t ratio. It is also evident that the optimal concrete filling ratio depended upon the diameter-to-thickness D/t ratio of the PCFSTs. For the tubes of D/t = 39 and 78 the optimal concrete fill length ratio was about 0.66 or 66%. For the tubes of D/t = 140 the optimal concrete fill length ratio slightly increased, but it was not significant. This showed that the length of the filled concrete selected initially for the experimental test was almost the same with the optimal length revealed by the FE results. In addition, it was observed that when the concrete filling length ratio was small, from 0 to 0.34, the tubes were buckled at two locations symmetrical through the loading point for all the tubes. However, when the concrete filling length ratio increased over 0.34, the tubes were buckled at one location near the loading point (as shown in Figure 13 and Figure 14); and it was more visible with the tubes of large D/t values, including 140 and 78

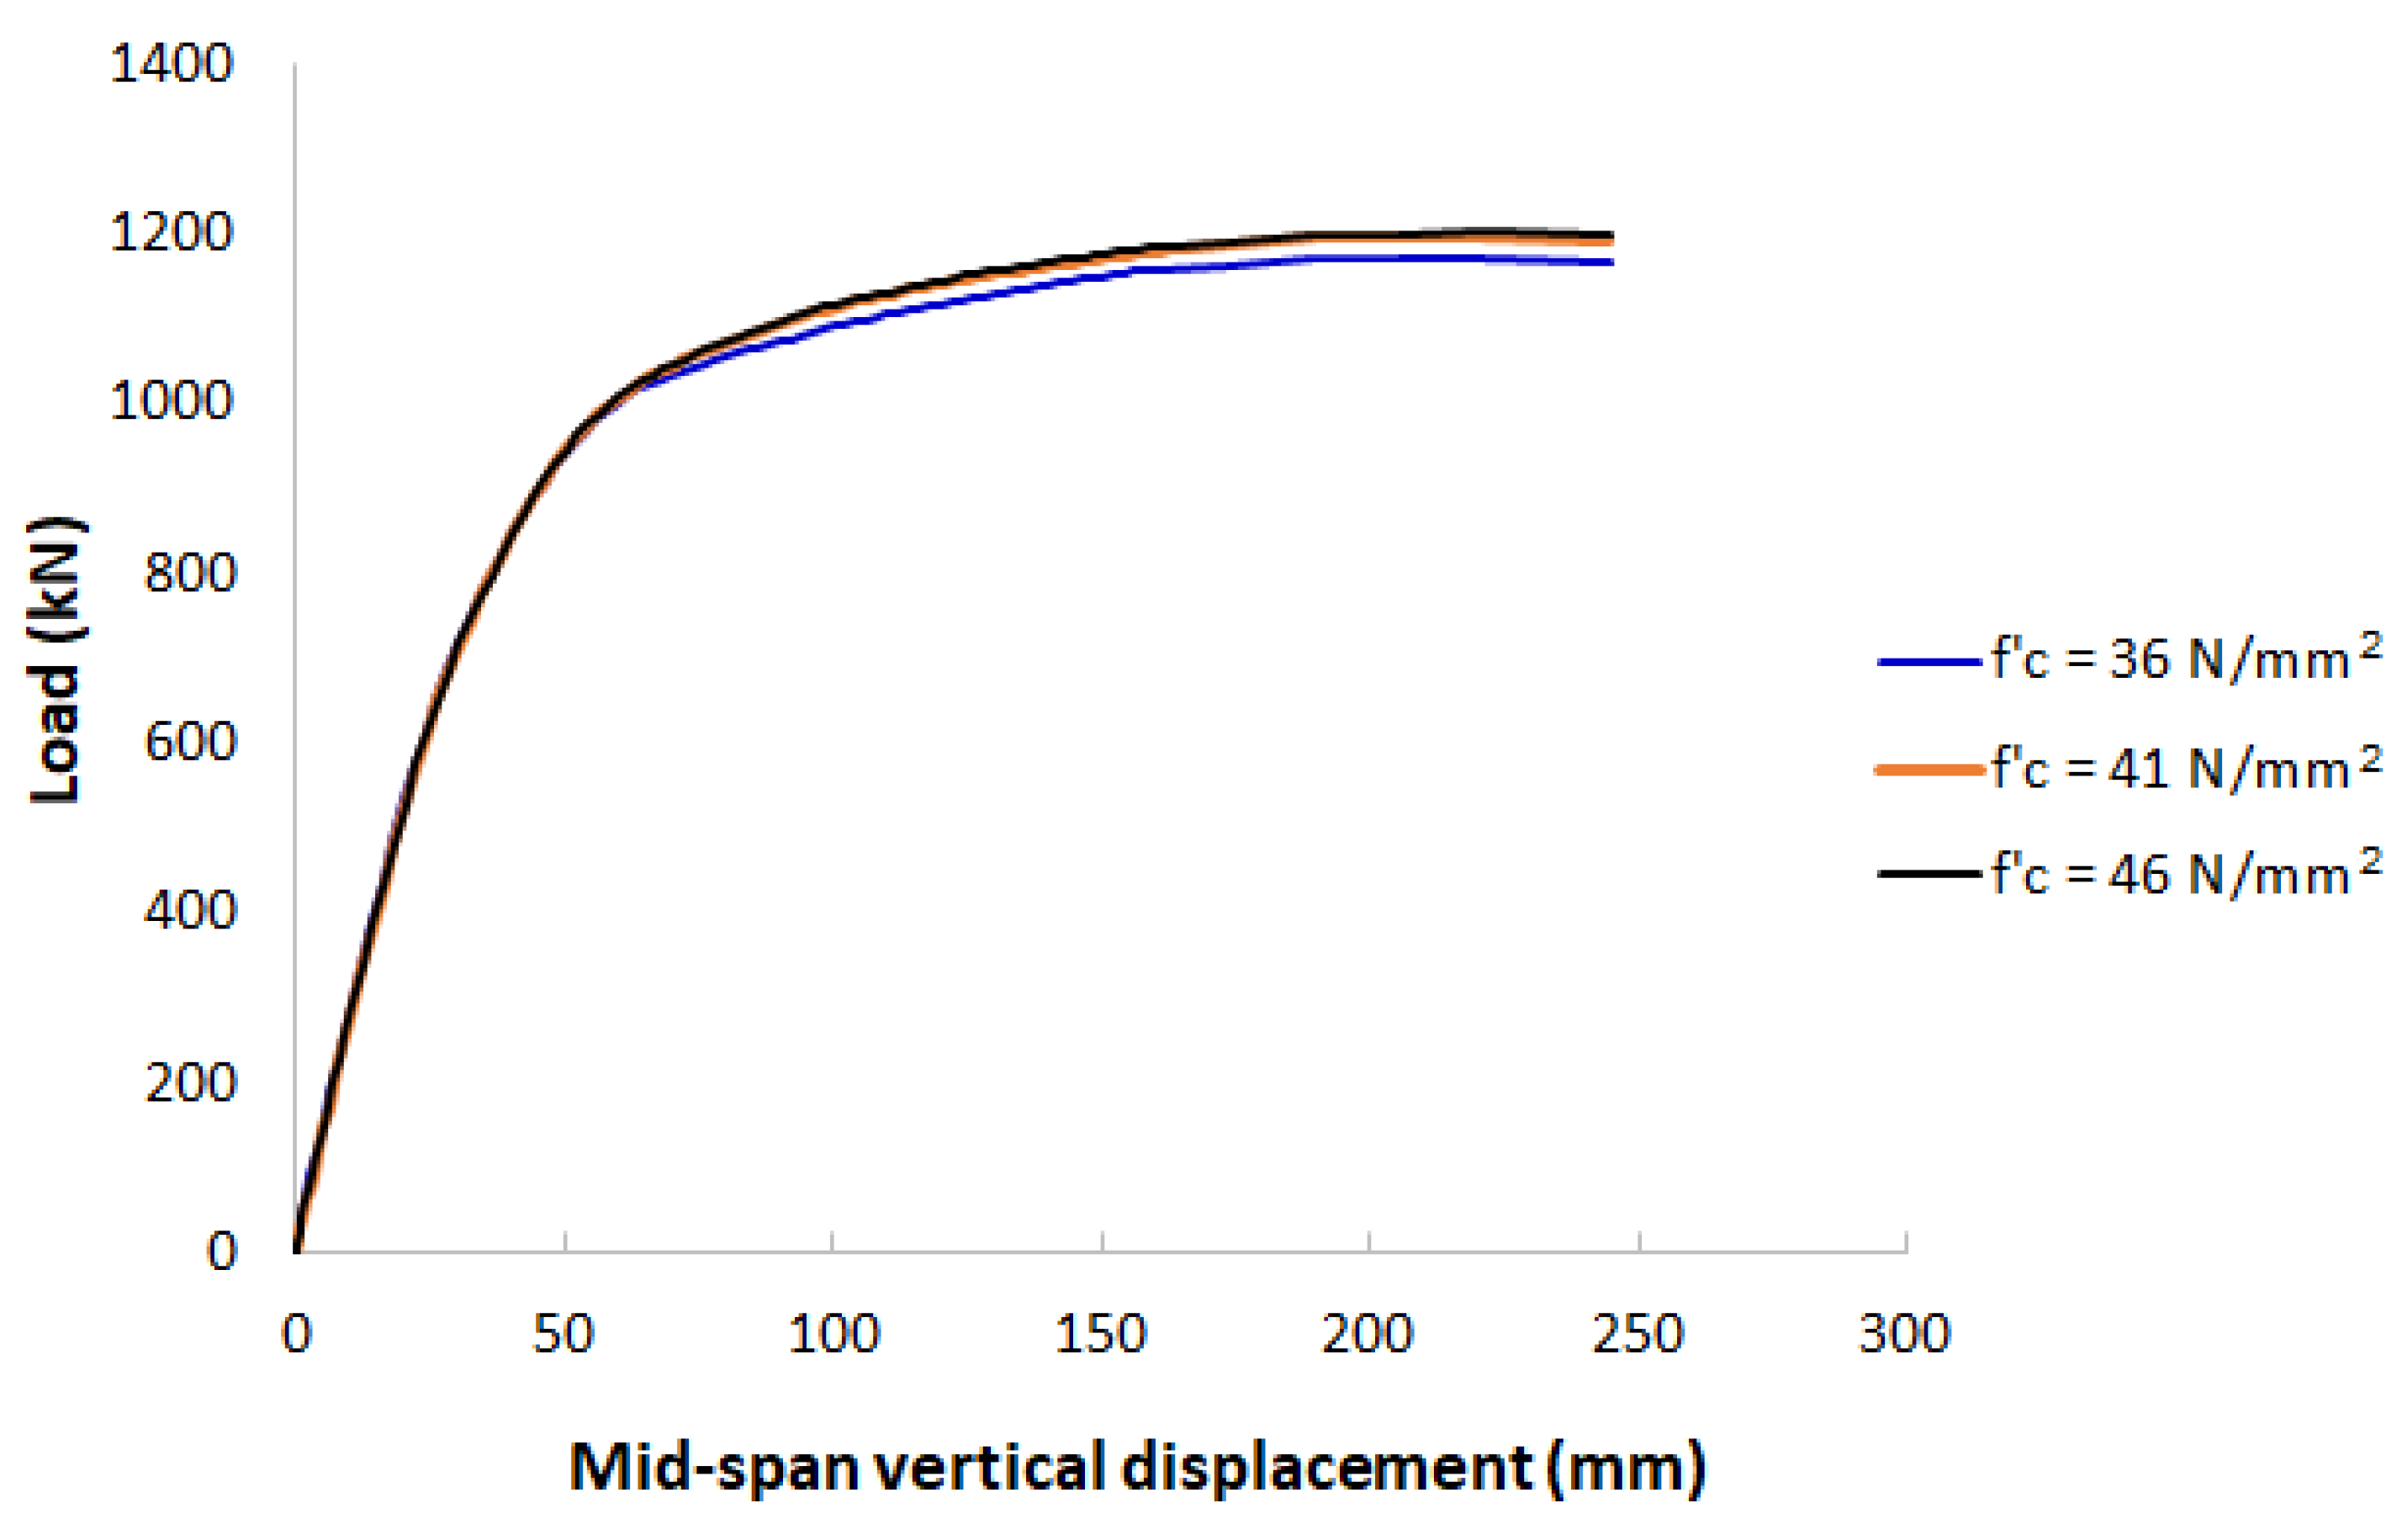
5.3.3. Effects of the Concrete Compressive Strength f c

Table 3 shows the effects of the compressive strength of concrete on the PCFST’s ultimate load, and the confined strength of concrete predicted by Finite Element Analysis, as shown in columns (3) and (4)–(6), respectively. For each compressive strength, there were three different sets of steel grades as shown in columns (1) and (2). All studies were carried out at the reference PCFST model with the concrete filling length ratio of 0.66 and the tube diameter-to-thickness ratio D/t = 78. In which, f cc _ FEA is the confined strength of concrete predicted by FEA, ε cc _ FEA is the strain at the confined strength f cc _ FEA . The confined strength of concrete f cc _ THEO and the strain at the confined strength ε cc _ THEO calculated by theoretical model are also presented in columns (7) and (8). The results show that for the same steel grade, when the compressive strength increased from 36 N/mm2 to 41 N/mm2, the maximum increase of the PCFST’s flexural load was 2%; when the compressive strength increased from 41 N/mm2 to 46 N/mm2, the maximum increase of the PCFST’s flexural load was 1%. It concluded that for the same steel grade, the compressive strength of concrete had insignificant effects on the PCFST’s flexural strength. Figure 20 shows the enveloped load-displacement curves of different compressive strength values while Figure 21 illustrates the stress-strain curves of concrete at the material points, for the case of the steel strength σy = 382 N/mm2 and σt = 542 N/mm2. It could be seen that when the compressive strength changed from 41 N/mm2 to 46 N/mm2, their load-displacement curves and the PCFST’s ultimate loads were almost identical.

5.3.4. Effects of the Steel’s Yield Stress σy and Tensile Strength σt

Different values of yield stress and tensile strength of steel were used for steel tubes, including three different sets of steel grades: σy = 334 N/mm2 and σt = 448 N/mm2, σy = 382 N/mm2 and σt = 542 N/mm2, and σy = 458 N/mm2 and σt = 650 N/mm2. Table 3 shows the effects of the steel strengths on the PCFST’s ultimate load, and the confined strength of concrete predicted. All studies were carried out at the reference PCFST model with the concrete filling length ratio of 0.66 and the tube diameter-to-thickness ratio D/t = 78. The results show that for the same concrete grade, when the steel strengths increased from σy = 334 N/mm2 and σt = 448 N/mm2 to σy = 382 N/mm2 and σt = 542 N/mm2, the maximum increase of the PCFST’s flexural load was 12–14%; when the steel strengths increased from σy = 382 N/mm2 and σt = 542 N/mm2 to σy = 450 N/mm2 and σt = 650 N/mm2, the maximum increase of the PCFST’s flexural load was 13–14%. It showed the significant effects of the material properties of steel tube on the PCFST’s flexural strength capacity.

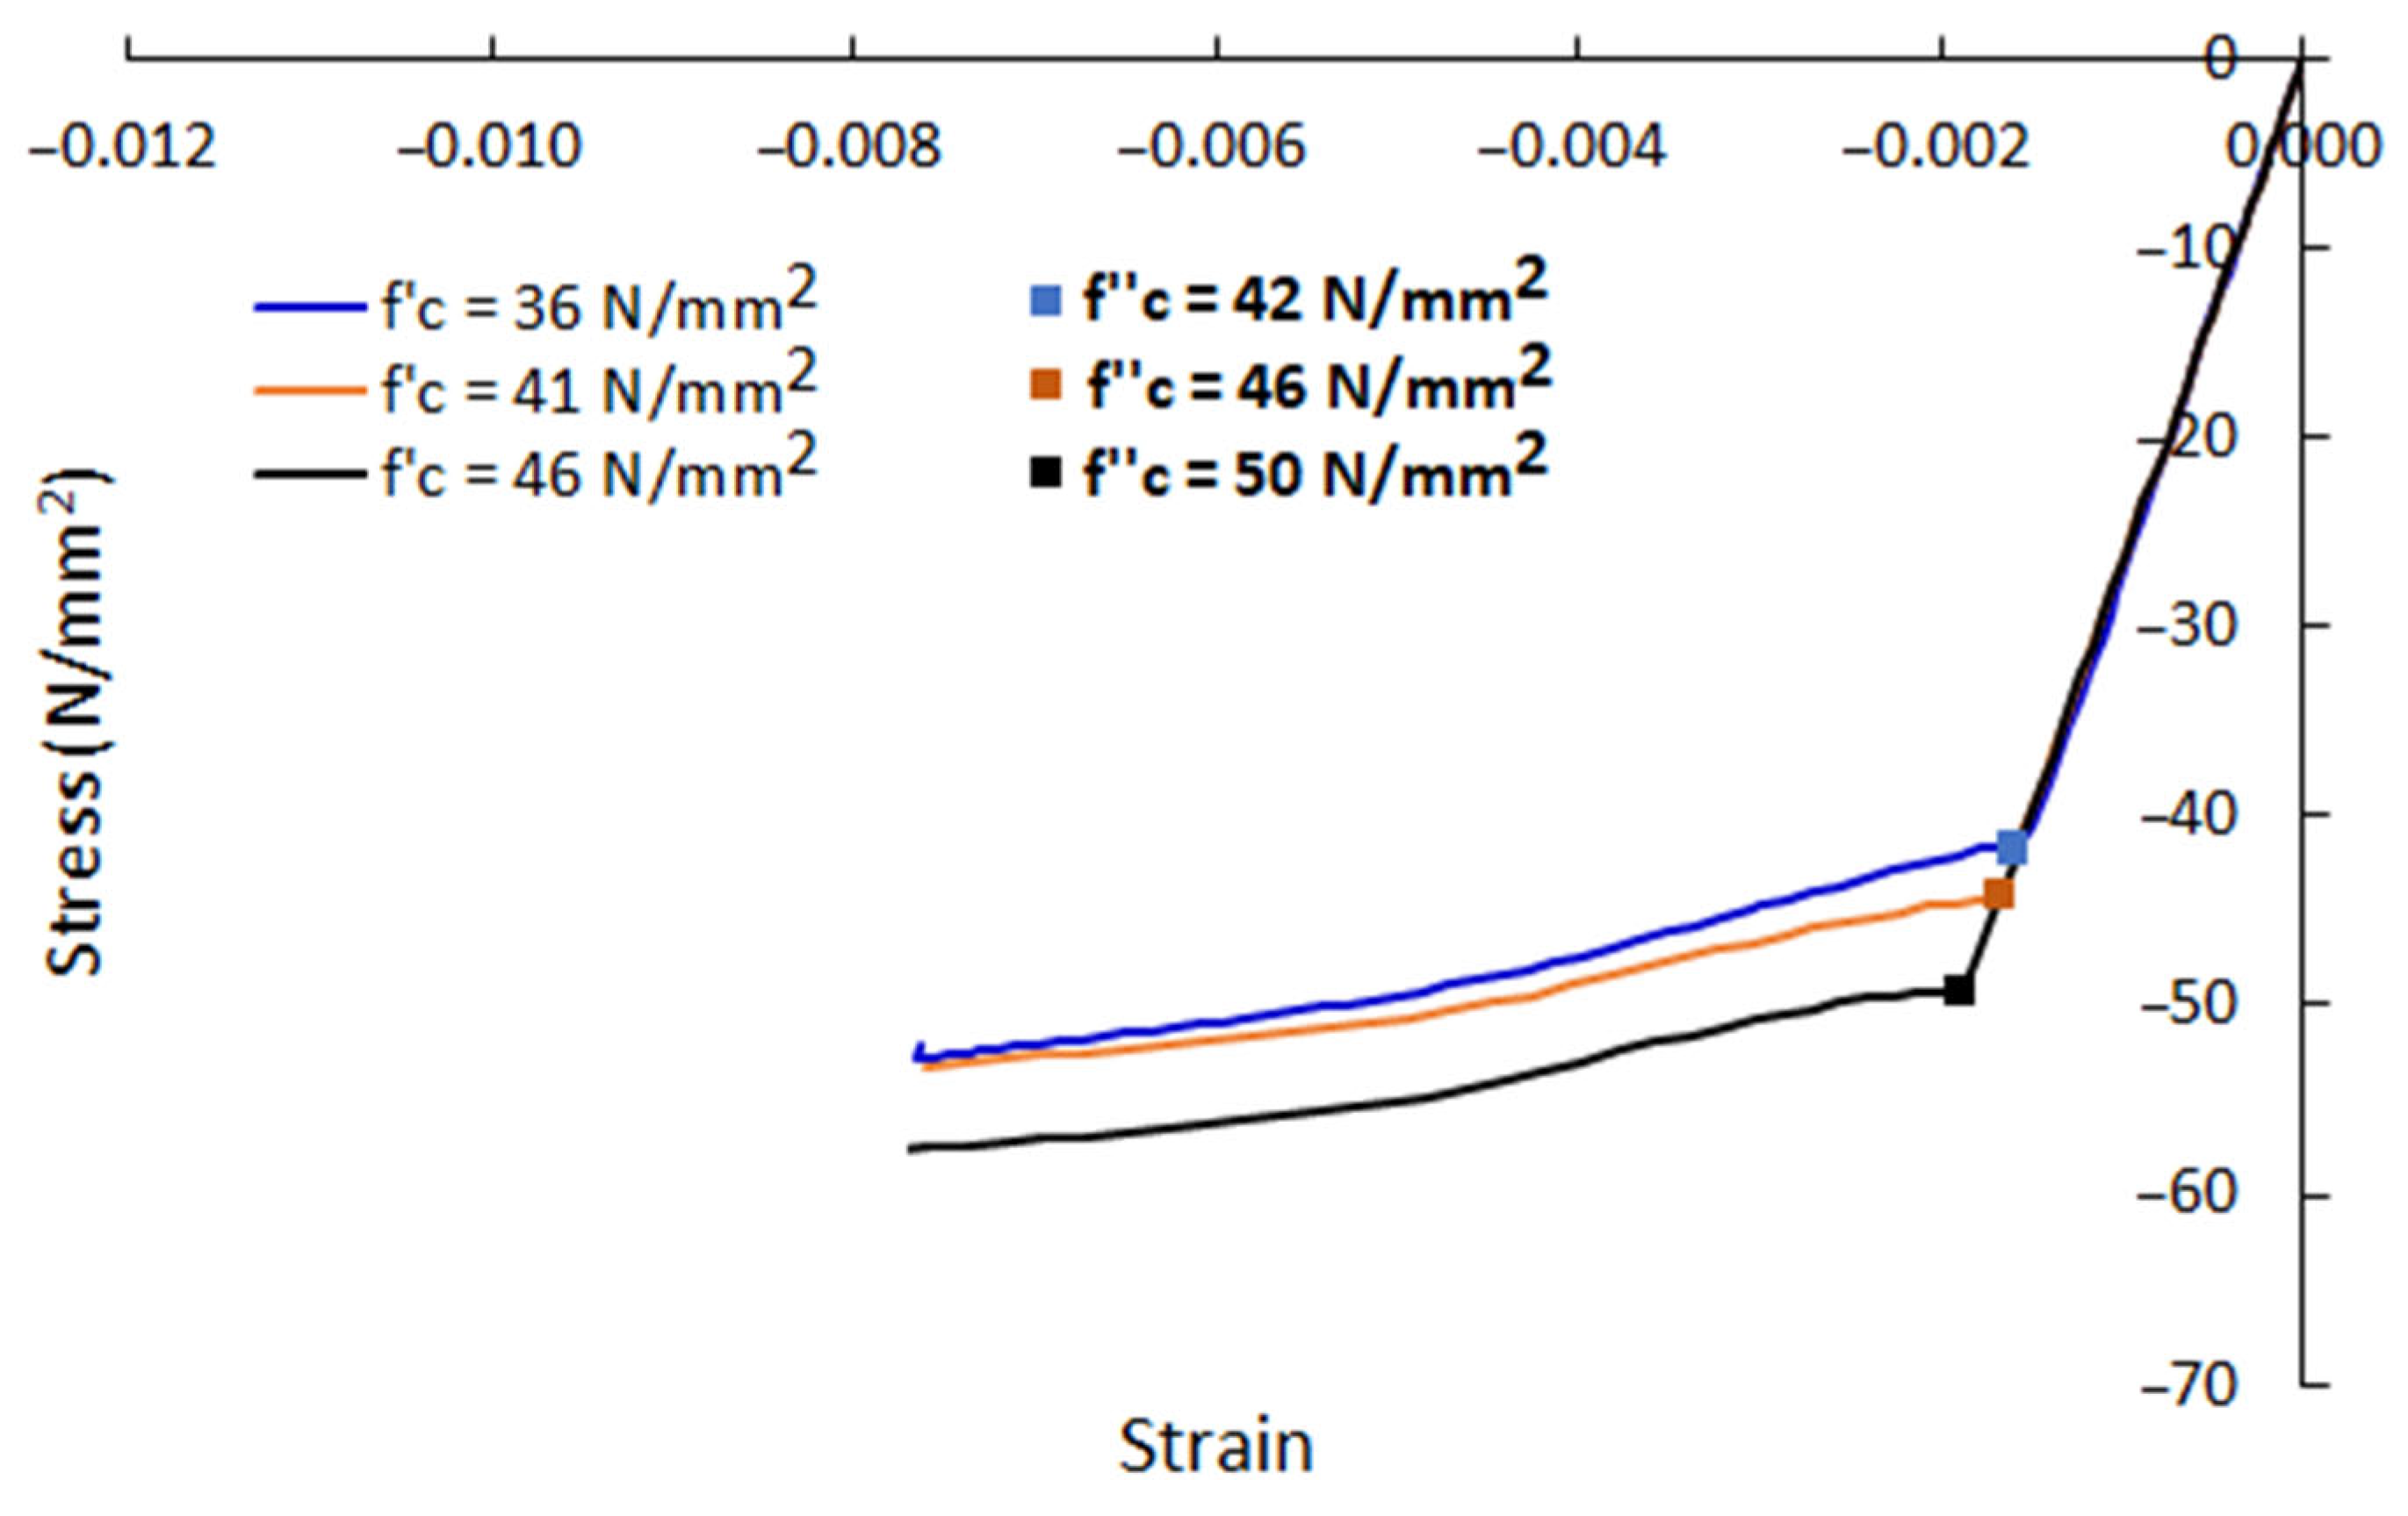
5.3.5. The Confined Strength of Concrete f cc

The confined strength of concrete f cc were studied through the effects of different parameters. Table 3 shows the effects of the compressive strength of concrete f c and the steel tube strengths σ y ,   σ t on the confined strength of concrete f cc and the corresponding strain ε cc predicted by Finite Element Analysis. The compressive strength of concrete at the PCFST’s ultimate load predicted by FEA was also provided, as shown in column (6). Table 4 shows the effects of the tube diameter-to-thickness ratio D/t and the concrete filling length ratio Lf/L on the confined strength of concrete f cc and the corresponding strain ε cc predicted by Finite Element Analysis (only the concrete filling length ratios of 0.66 and 1.00 were presented on Table 4 as the confinement effects was not significant for shorter concrete filling lengths). Figure 21 shows the confined strength of concrete at different values of the compressive strength of concrete, for the case of the steel strength σy = 382 N/mm2 and σt = 542 N/mm2. It could be seen from Table 3 that for the same steel grade, the confined stresses developed in the concrete filling f cc _ FEA were increased when the compressive strength increased, with a maximum difference of 9%; however, this did not significantly affect the PCFST’s ultimate strength, as shown in Table 3. For the case of the steel strength σy = 382 N/mm2 and σt = 542 N/mm2, the confined strengths of concrete at different compressive strengths were shown in the stress-strain curves of concrete in Figure 21. For the same concrete compressive grade, the confined stresses developed in the concrete filling f cc _ FEA were increased when the steel strengths increased, with a maximum difference of 5%; however, this significantly affected the PCFST’s ultimate strength, as shown in Table 3. It could be observed from Table 4 that when the concrete filling length was equal or greater than 66% of the tube length, the confined strengths of concrete were the same. When the tube’s thicknesses were increased from 9 mm to 18 mm (reducing D/t from 78 to 39), the confined stresses developed in the concrete filling f cc _ FEA increased significantly, by 2.4 times; however, when the tube’s thicknesses were increased from 5 mm to 9 mm (reducing D/t from 39 to 140), the confined stresses were not significantly changed.
The compressive strength of concrete at the PCFST’s ultimate load f cc _ FEA predicted by FEA, as presented in column (6) of Table 3 and Table 4, showed that after the first point of confinement f cc _ FEA , the concreted was further confined/ compressed to higher values of the compressive strength. The range of increase of compressive strength from the first confined strength to the compressive strength at the PCFST’s ultimate load was from 12% to 30%. The confined strengths and their corresponding strains predicted by FE analysis were compared with those calculated by the theoretical model [38] as shown in columns (9) and (10) in Table 3 and Table 4. It showed an excellent agreement between the confined strengths predicted by the two methods. When the tube thickness was significant, i.e., D/t = 39, the FE modelling predicted large values for the concrete confined strength in comparison with the theoretical values (120 N/mm2 in comparison with 64 N/mm2). This deemed to be reasonable for the assumption that there was a perfect bond between steel tube and the concrete filling. However, the strains predicted by FE analysis were much lower than those calculated by the theoretical model. The reasons could be due to the greater stiffness in the FE models as explained earlier (the concrete model used in the FE modelling did not have a constitutive damage model that was able to capture the micro-damage in the concrete) or different confinement conditions considered in the theoretical model (concrete was confined by spiral/ hoop steel reinforcements in axial compression tests rather than by steel tube under flexural testing). It was revealed that, for the case of the steel strength σy = 382 N/mm2 and σt = 542 N/mm2, when the compressive strength of concrete was 41 N/mm2, the confined strength was 46 N/mm2, and when the compressive strength of concrete was 46 N/mm2, the confined strength was 50 N/mm2. However, the load-displacement curves and the PCFST’s ultimate loads for these two cases were almost identical, as shown in Figure 20. This confirmed the discussions in the Section “Finite Element Modelling” (ii) Compressive strength, and in the Section “Finite Element modelling results and validation”.

6. Conclusions

The experimental test and numerical modelling for the partially concrete-filled steel tubes were presented. A simply supported PCFST specimen was tested under the three-point bending configuration. In addition to the experimental test, a non-linear FE model was developed in which the filled concrete was modelled considering the confining pressure from the steel tube; the concrete in tension was modelled with the adoption of the smeared crack approach and strain softening rule for presenting the crack formation and propagation. The FE model was validated by comparing its predicted results with those of experimental test results for the three-point bending tests. The following conclusions were drawn based on the results and discussions of this study:
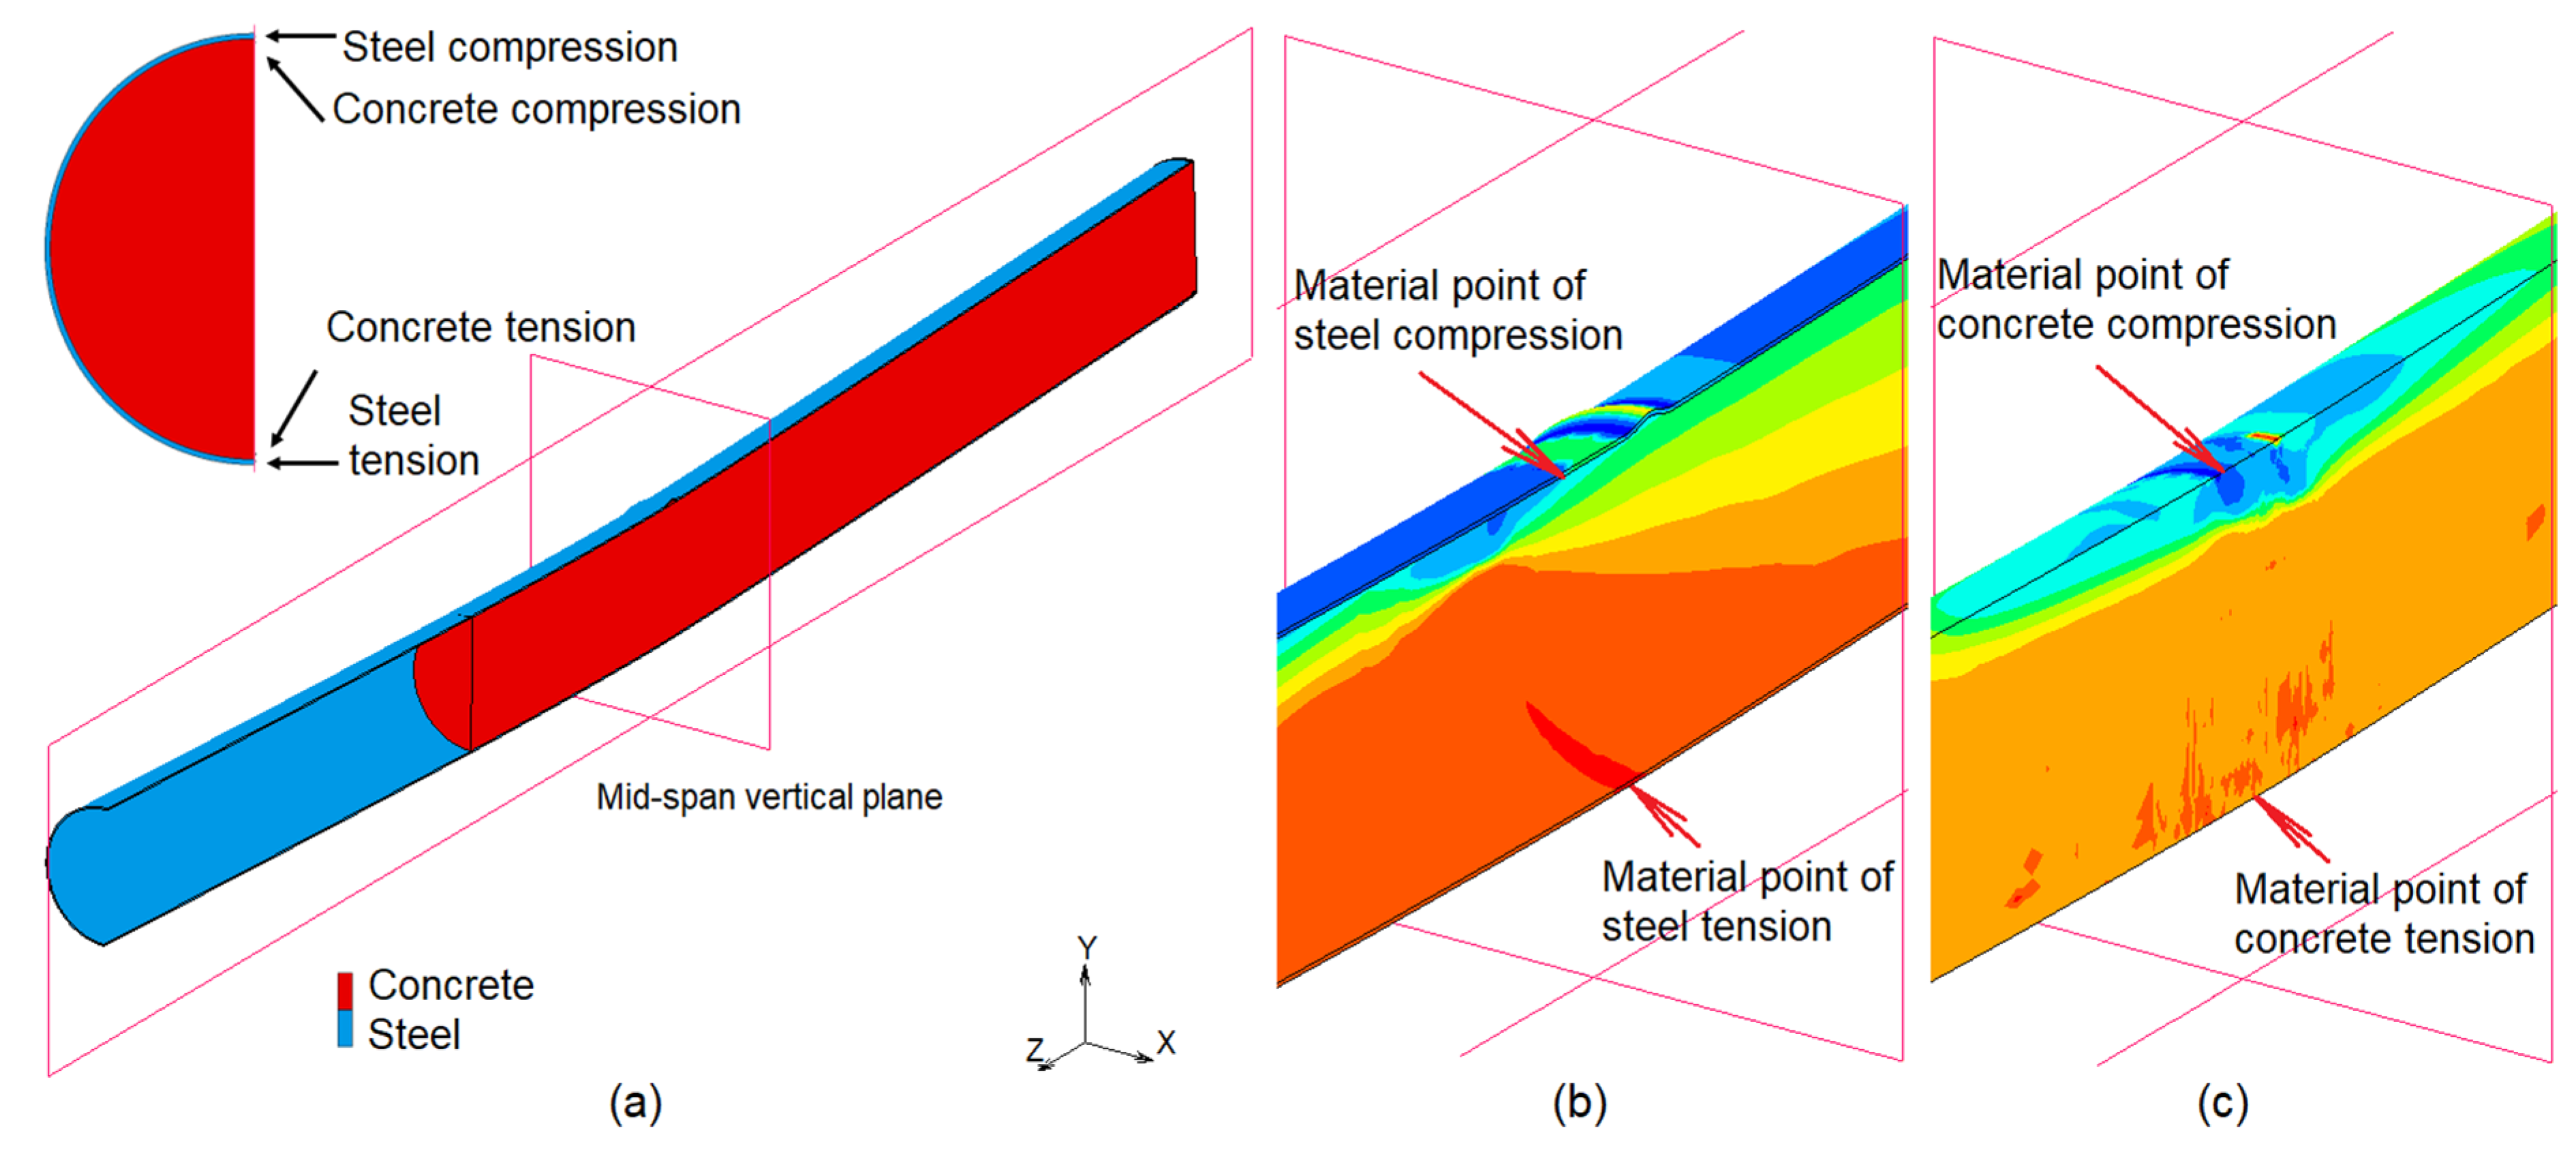
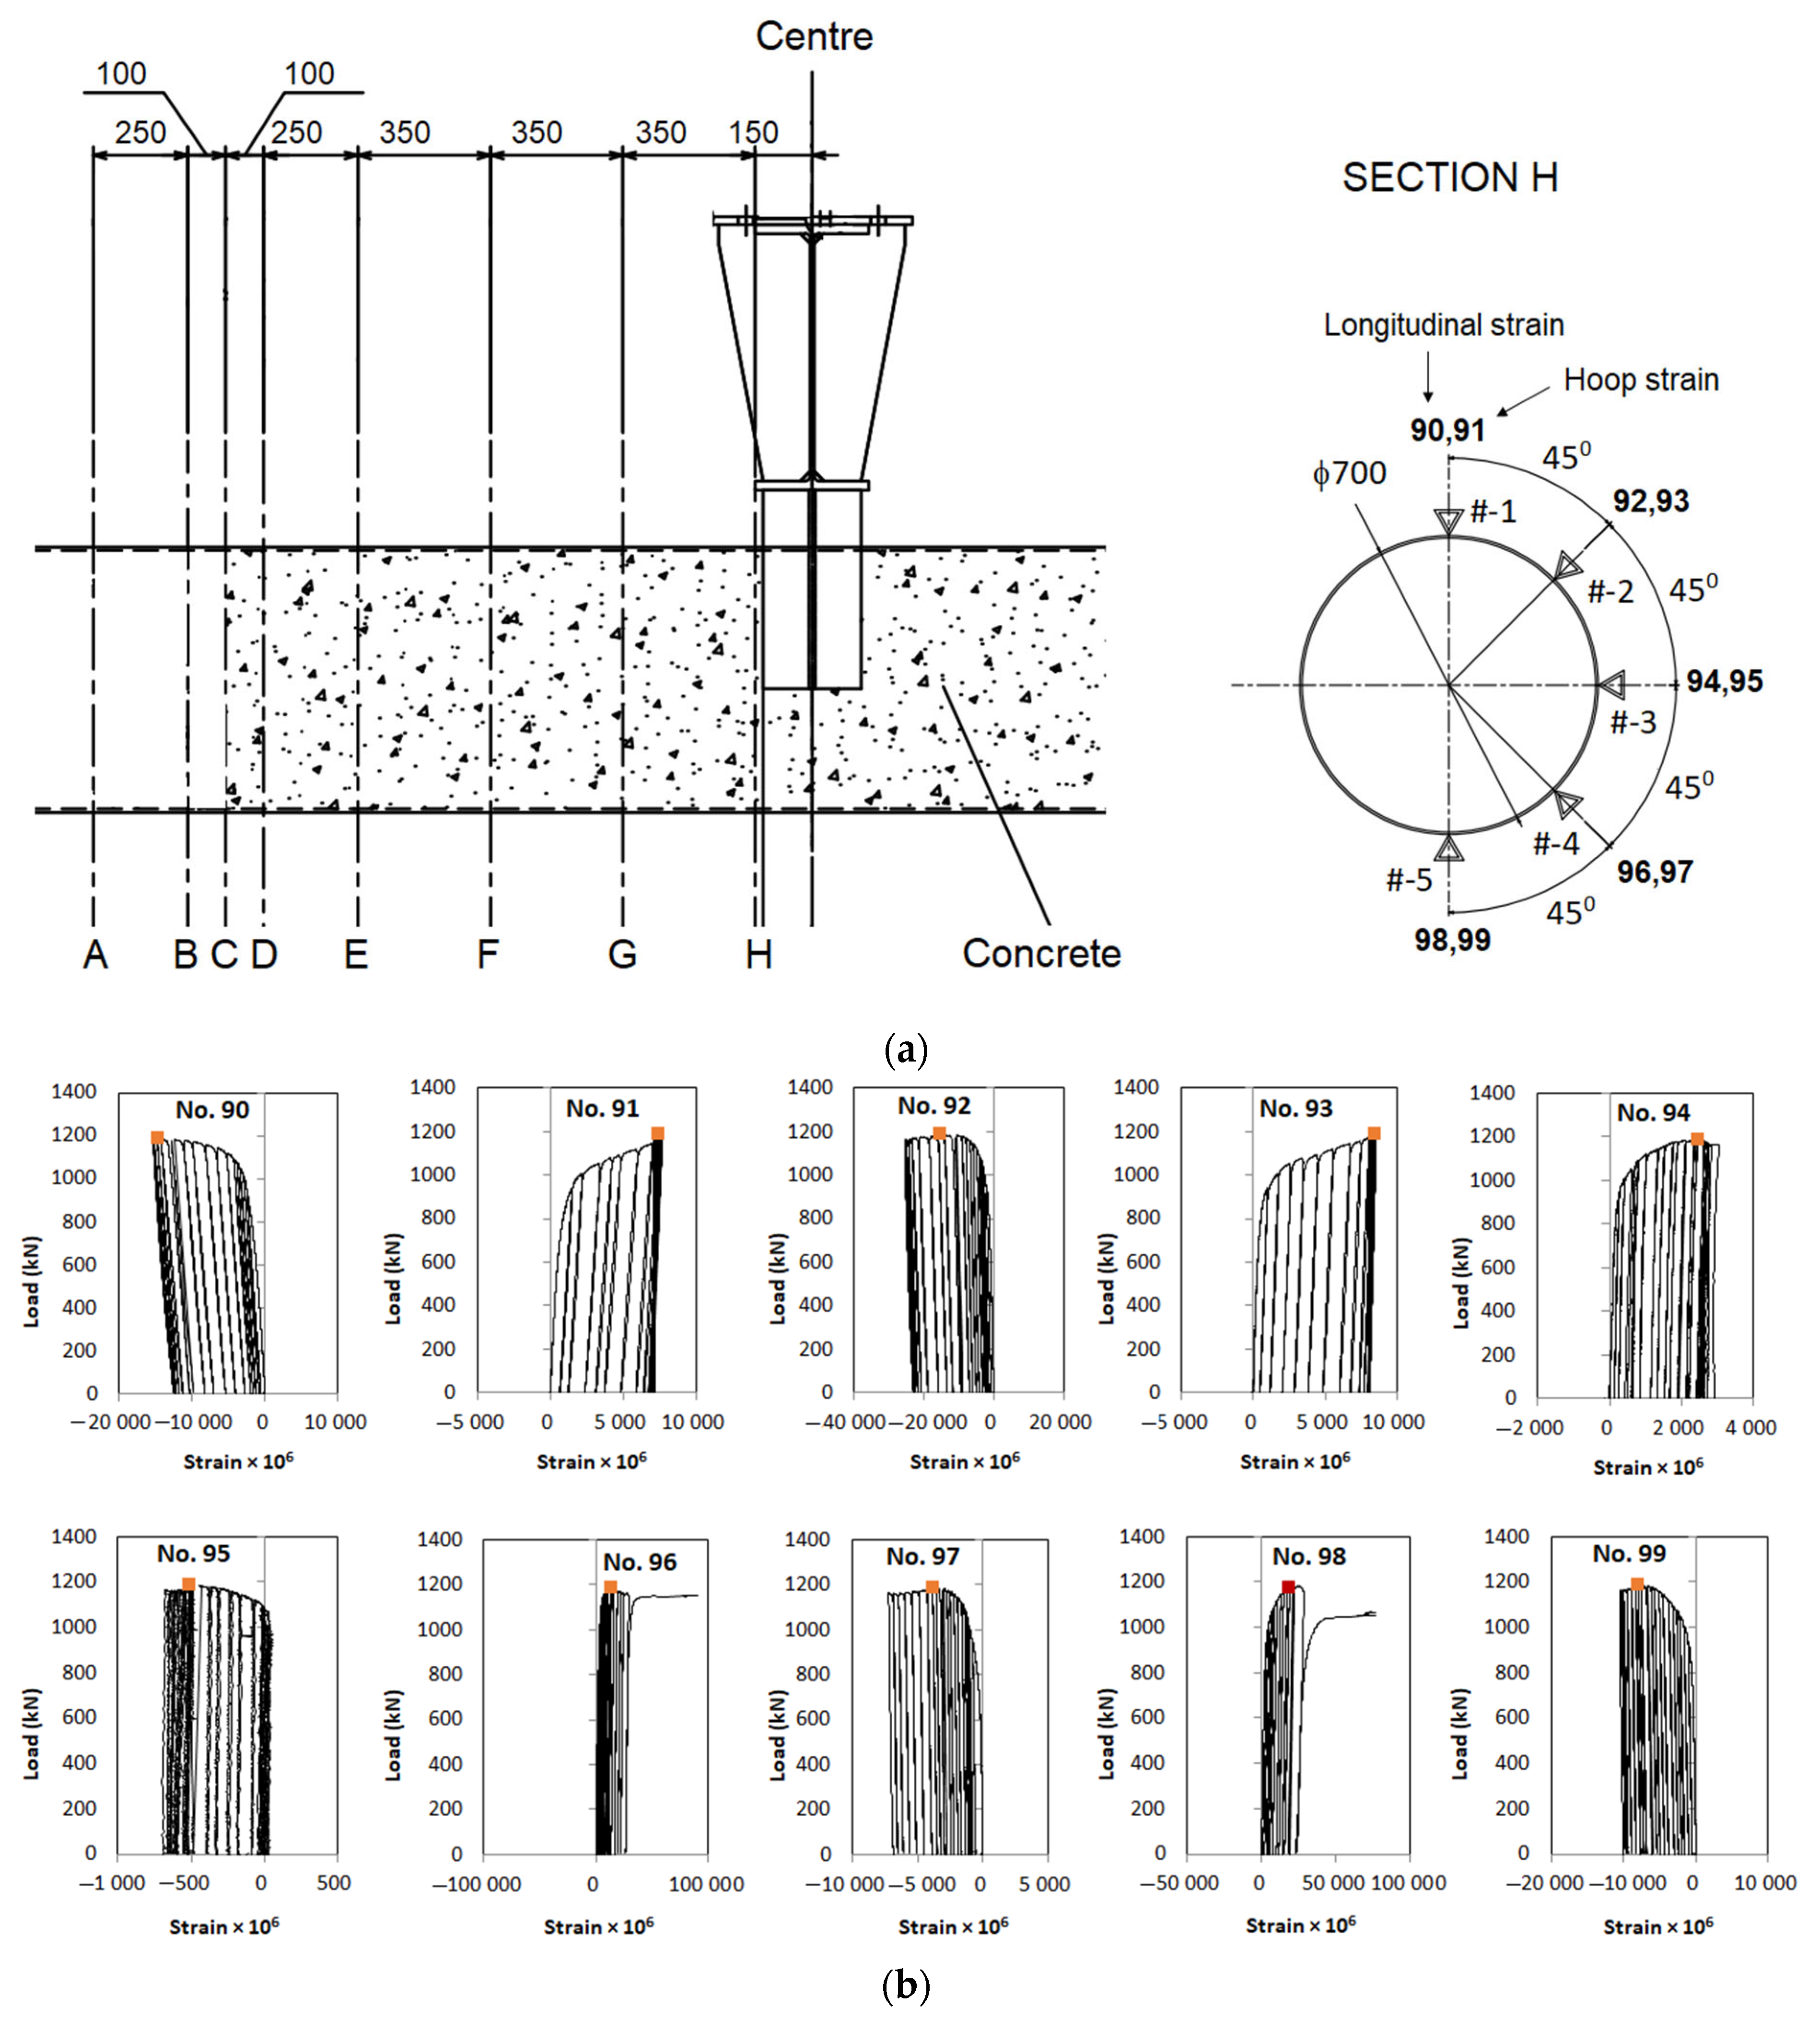
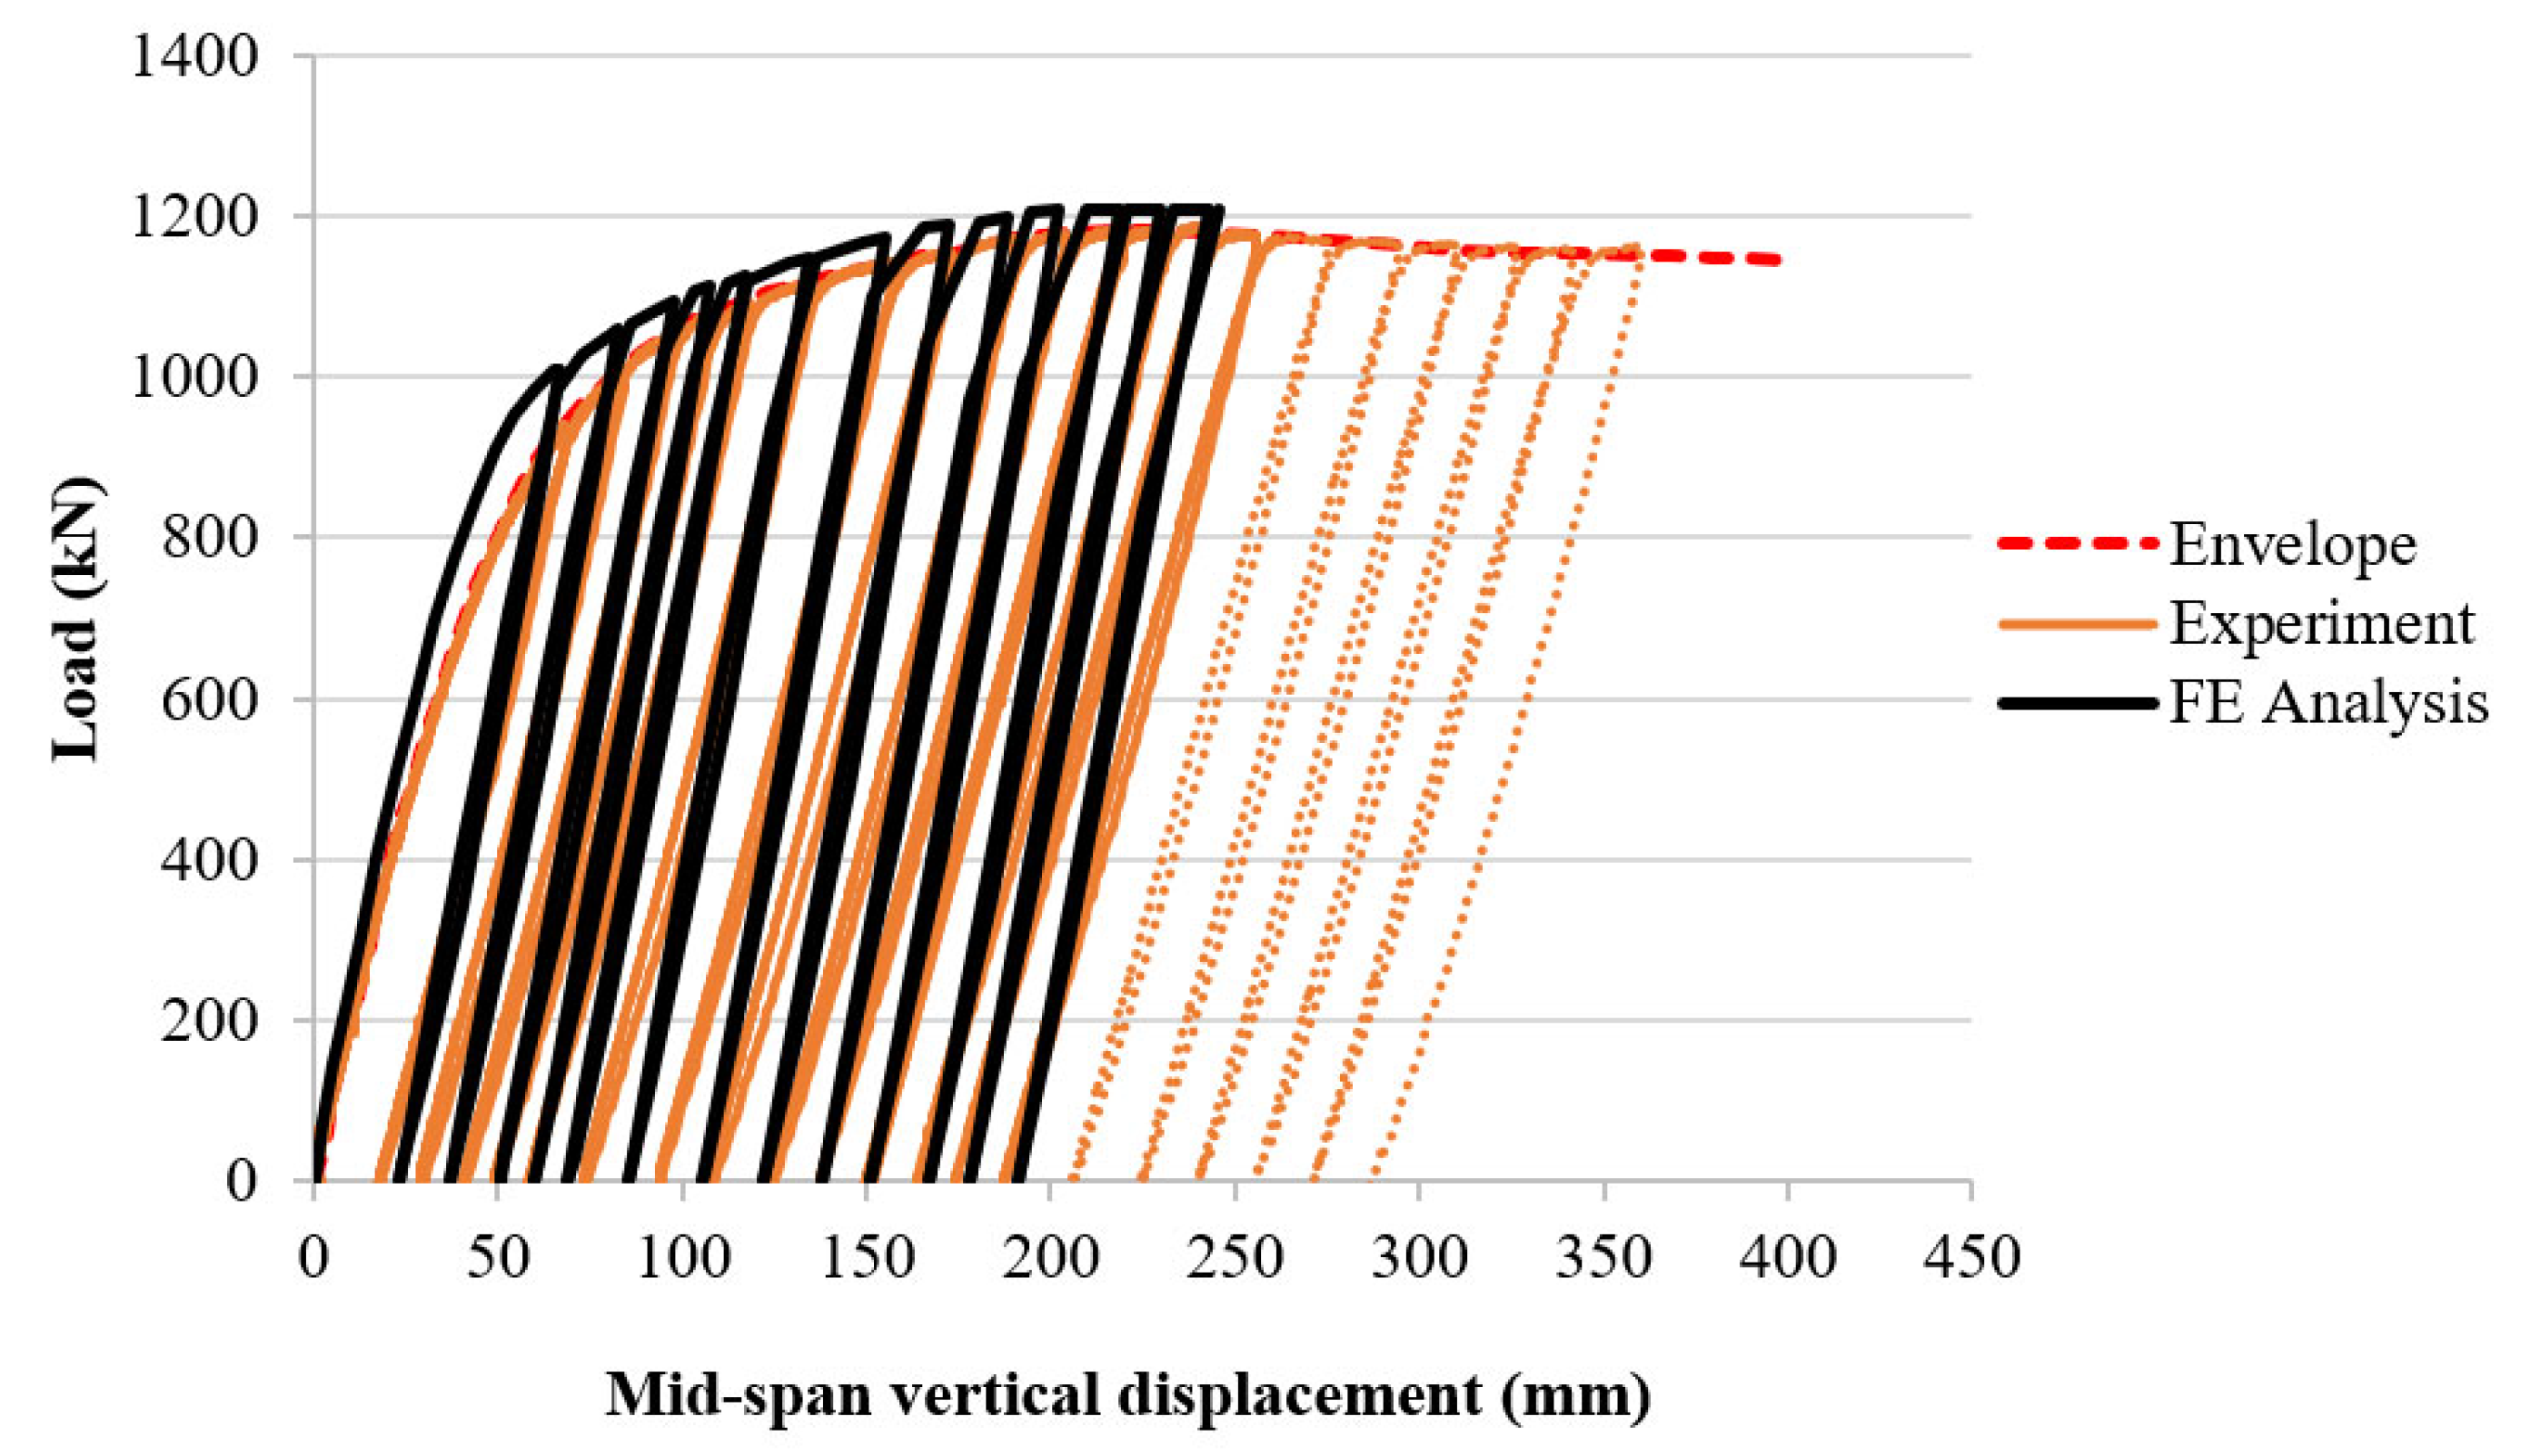
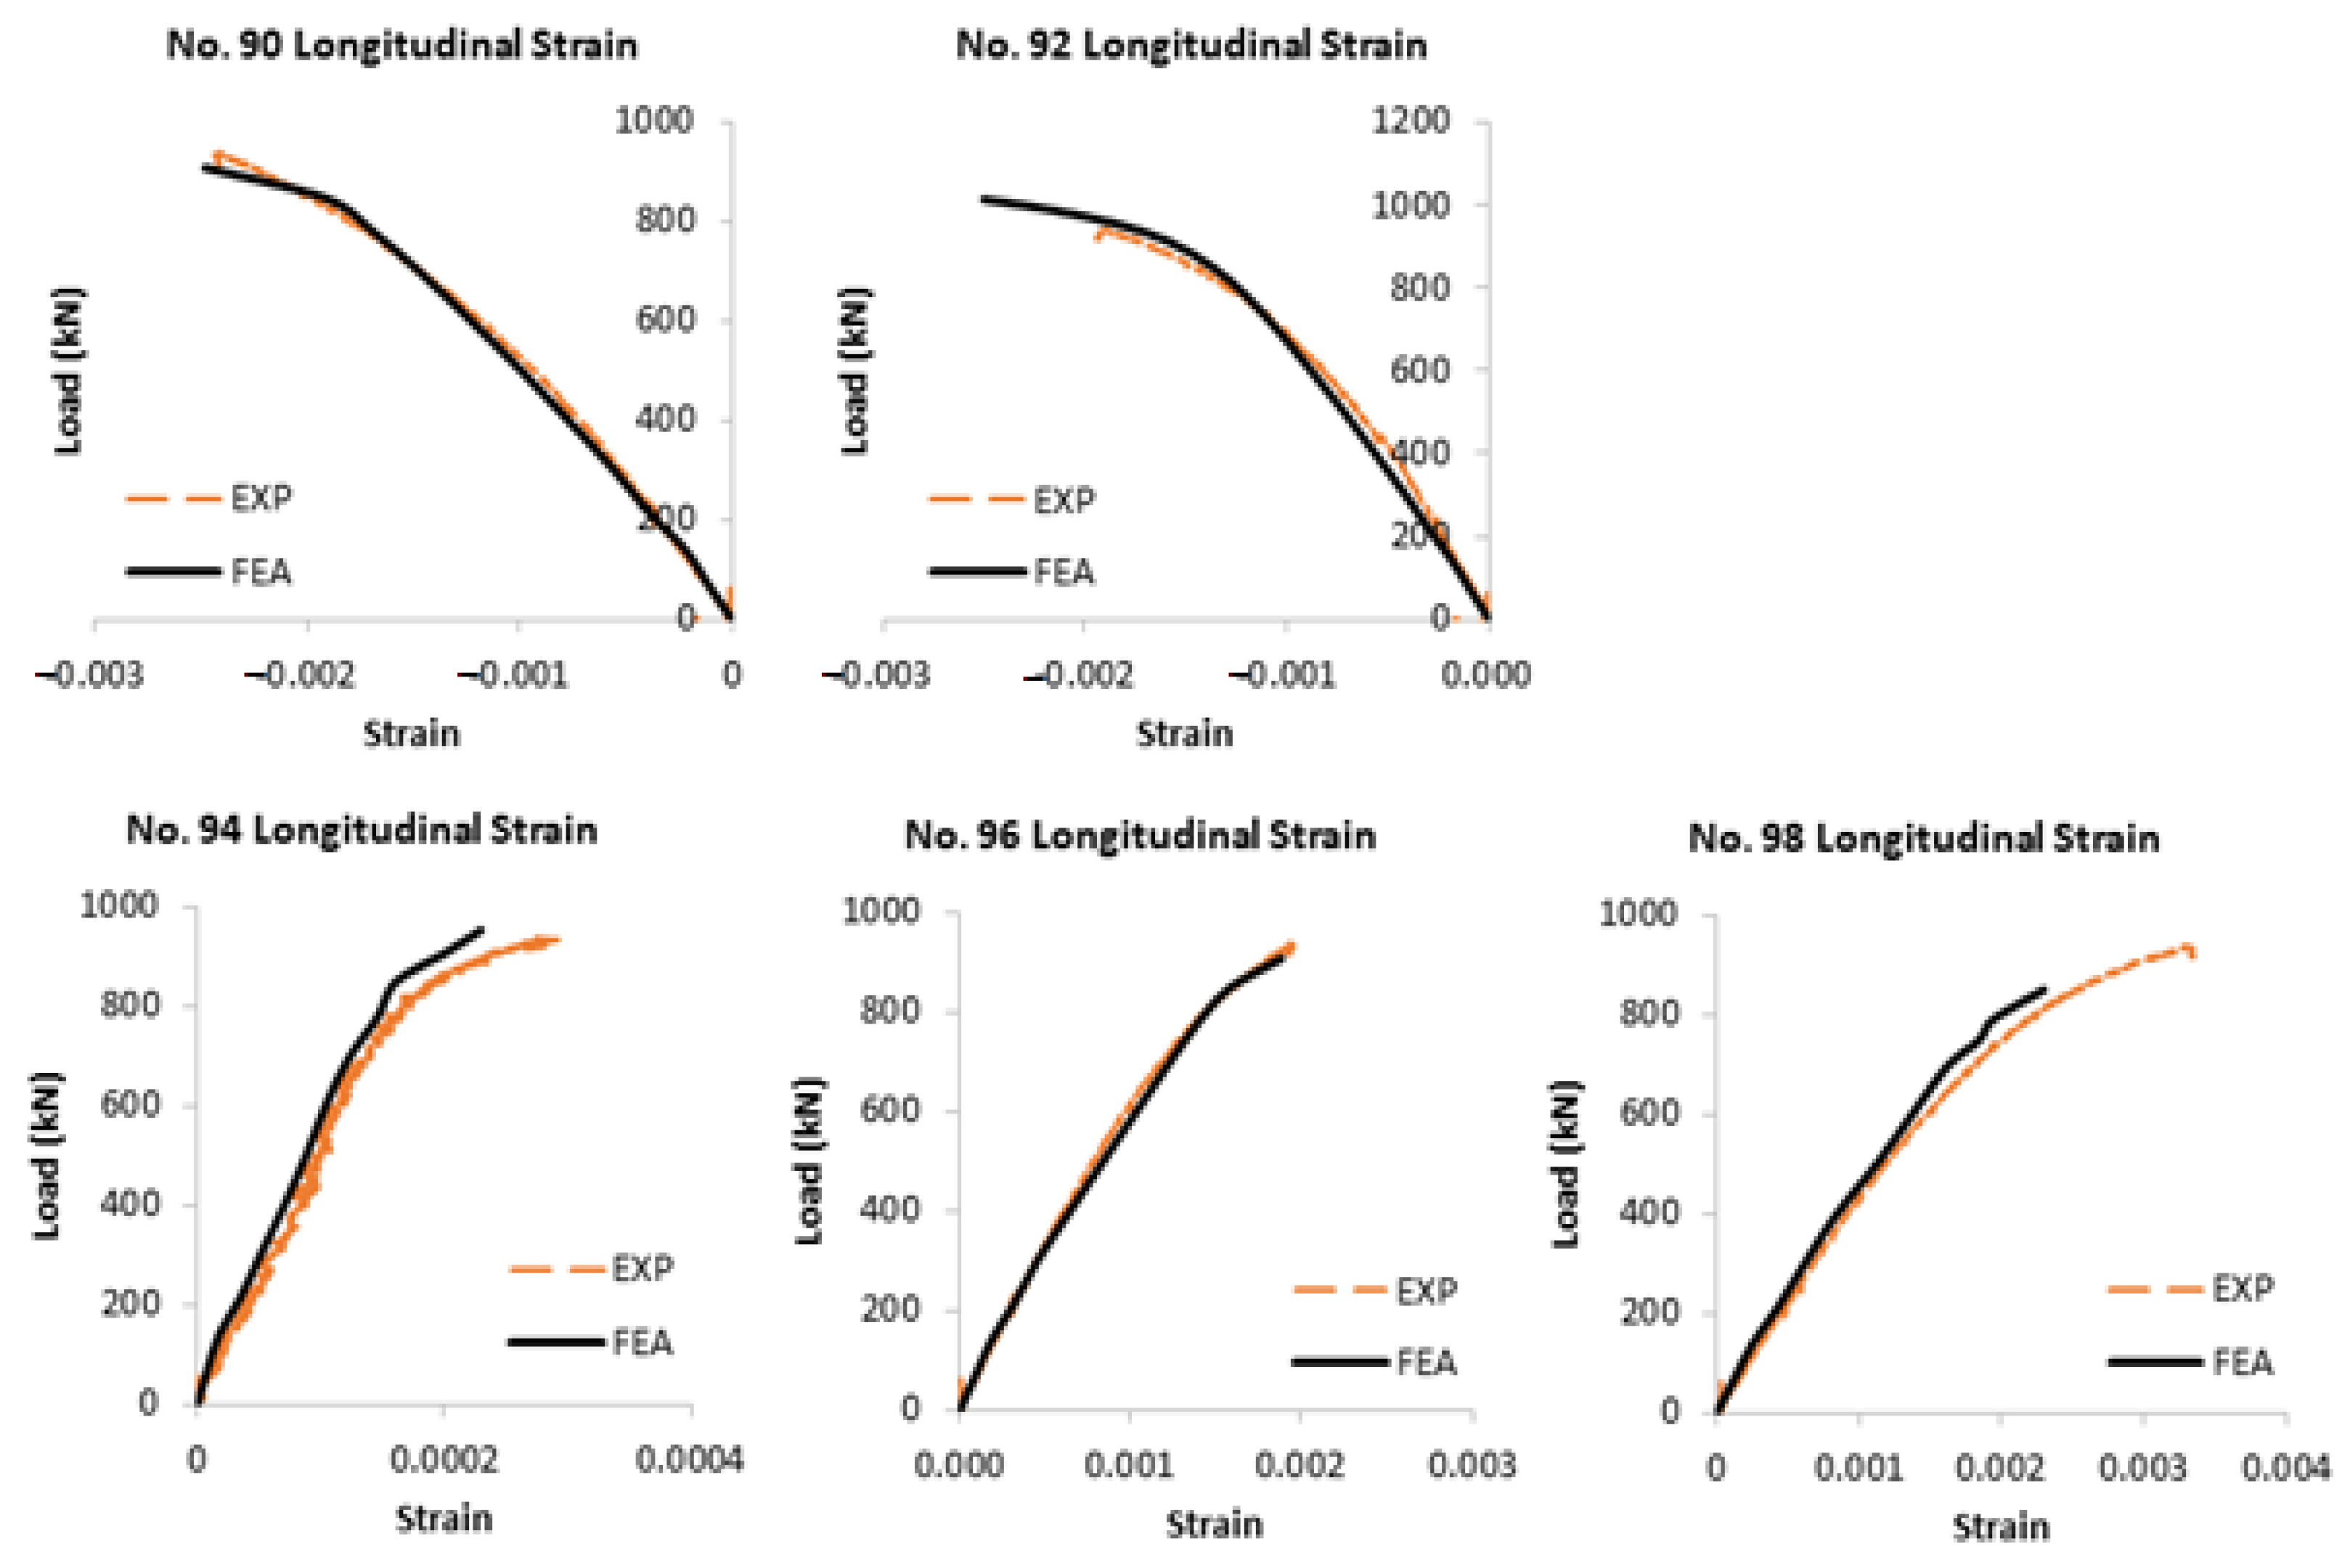
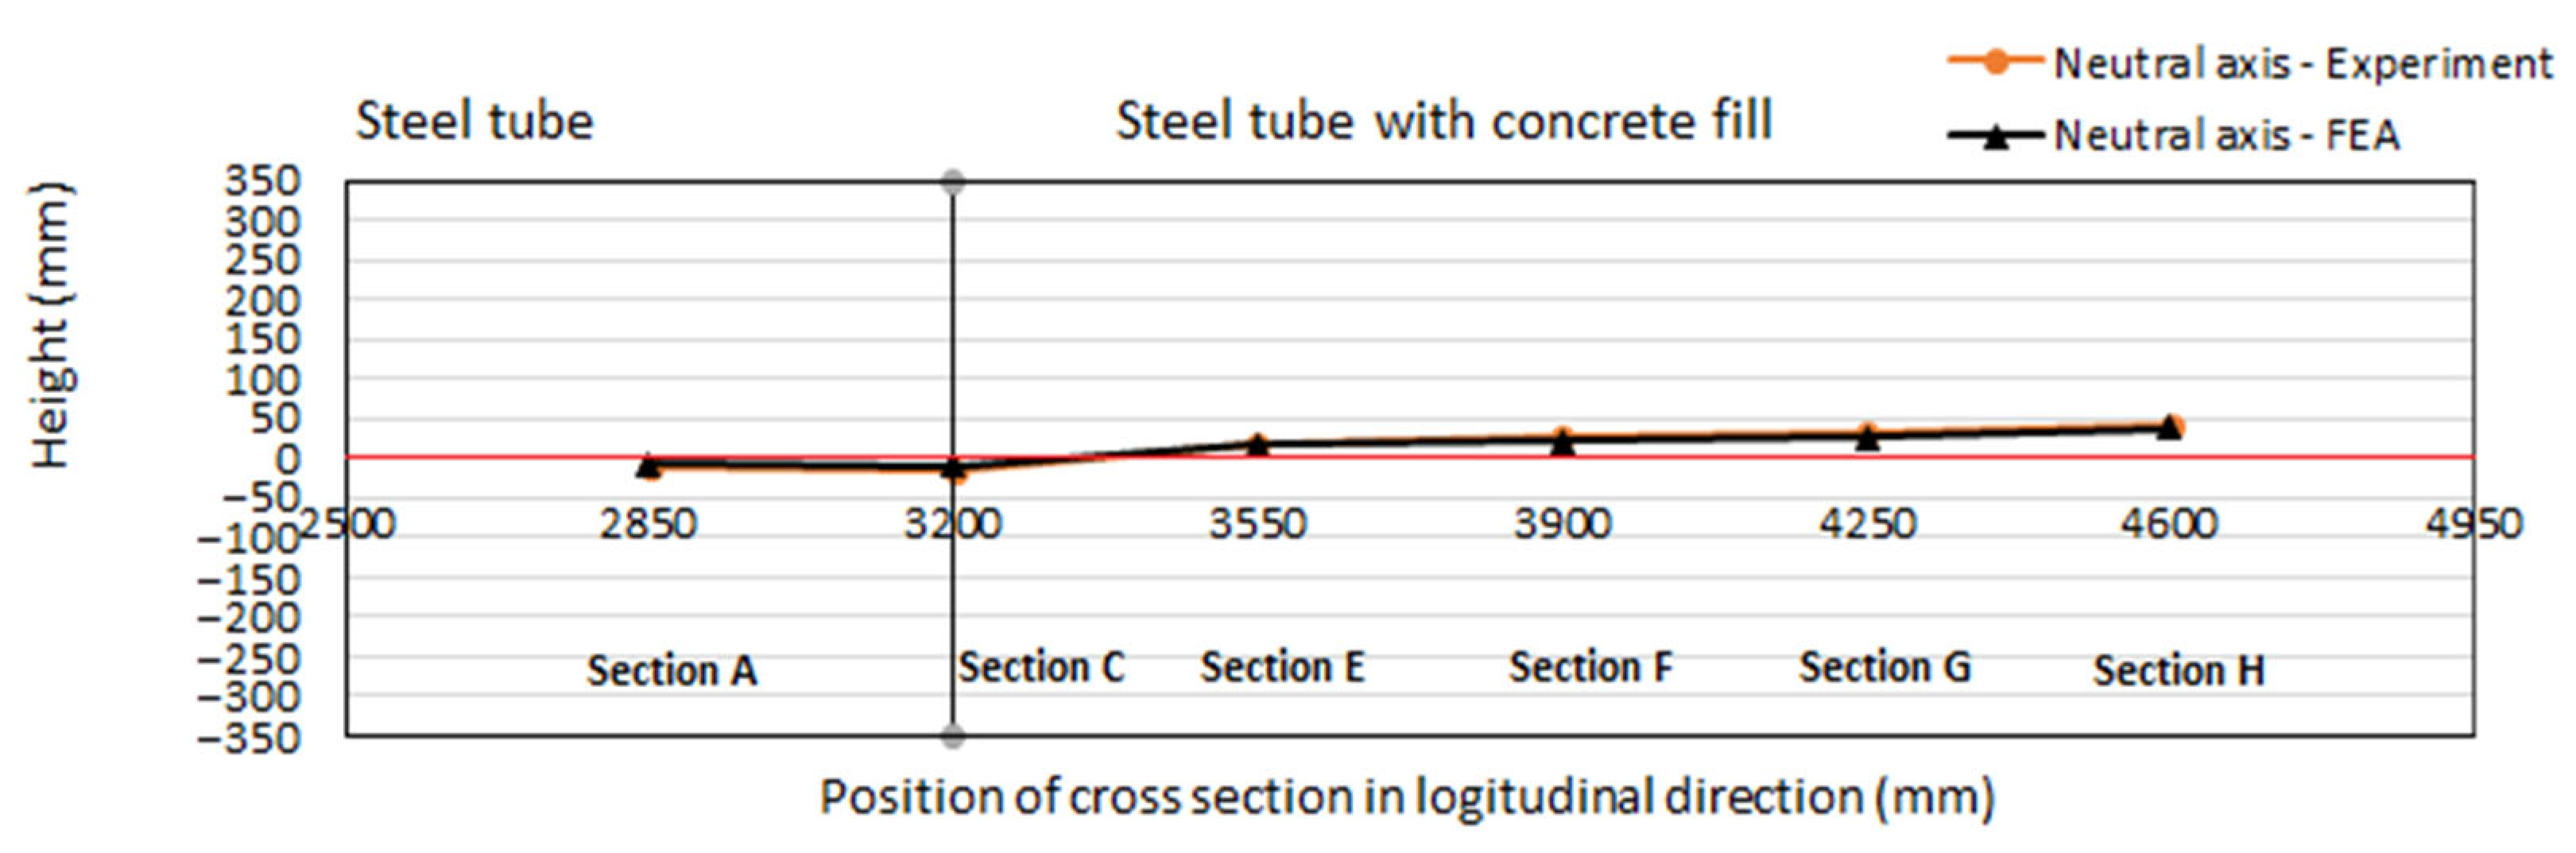
  • The comparisons show excellent agreements between the experimental test and Finite Element results, including load-vertical displacement curves, longitudinal strain measurements at some cross-sections, buckling failure modes, and neutral axis positions in the transition area between steel tube and steel tube with concrete fill. Based on this validation, a comprehensive parametric study was then conducted to investigate the effects of the tube diameter-to-thickness ratio, the concrete filling length ratio, the compressive strength of concrete, and the tube steel’s yield and tensile strengths on the PCFST’s ultimate flexural strength and the confined strength of the concrete filling. Based on these studies, the confined strength of concrete predicted by FE modelling was evaluated considering the effects of different parameters and validating against the theoretical values.
  • The results show that the ultimate load significantly increased when the tube diameter-to-thickness ratio D/t decreased, i.e., when D/t ratio decreased from 78 to 39, the ultimate load increased more than 95. When the D/t ratio increased, the tube became more vulnerable to failure by local buckling (buckled shapes formed around the loading point). It indicated the significant effects of increasing the tube’s thickness on increasing the PCFST’s ultimate flexural strength.
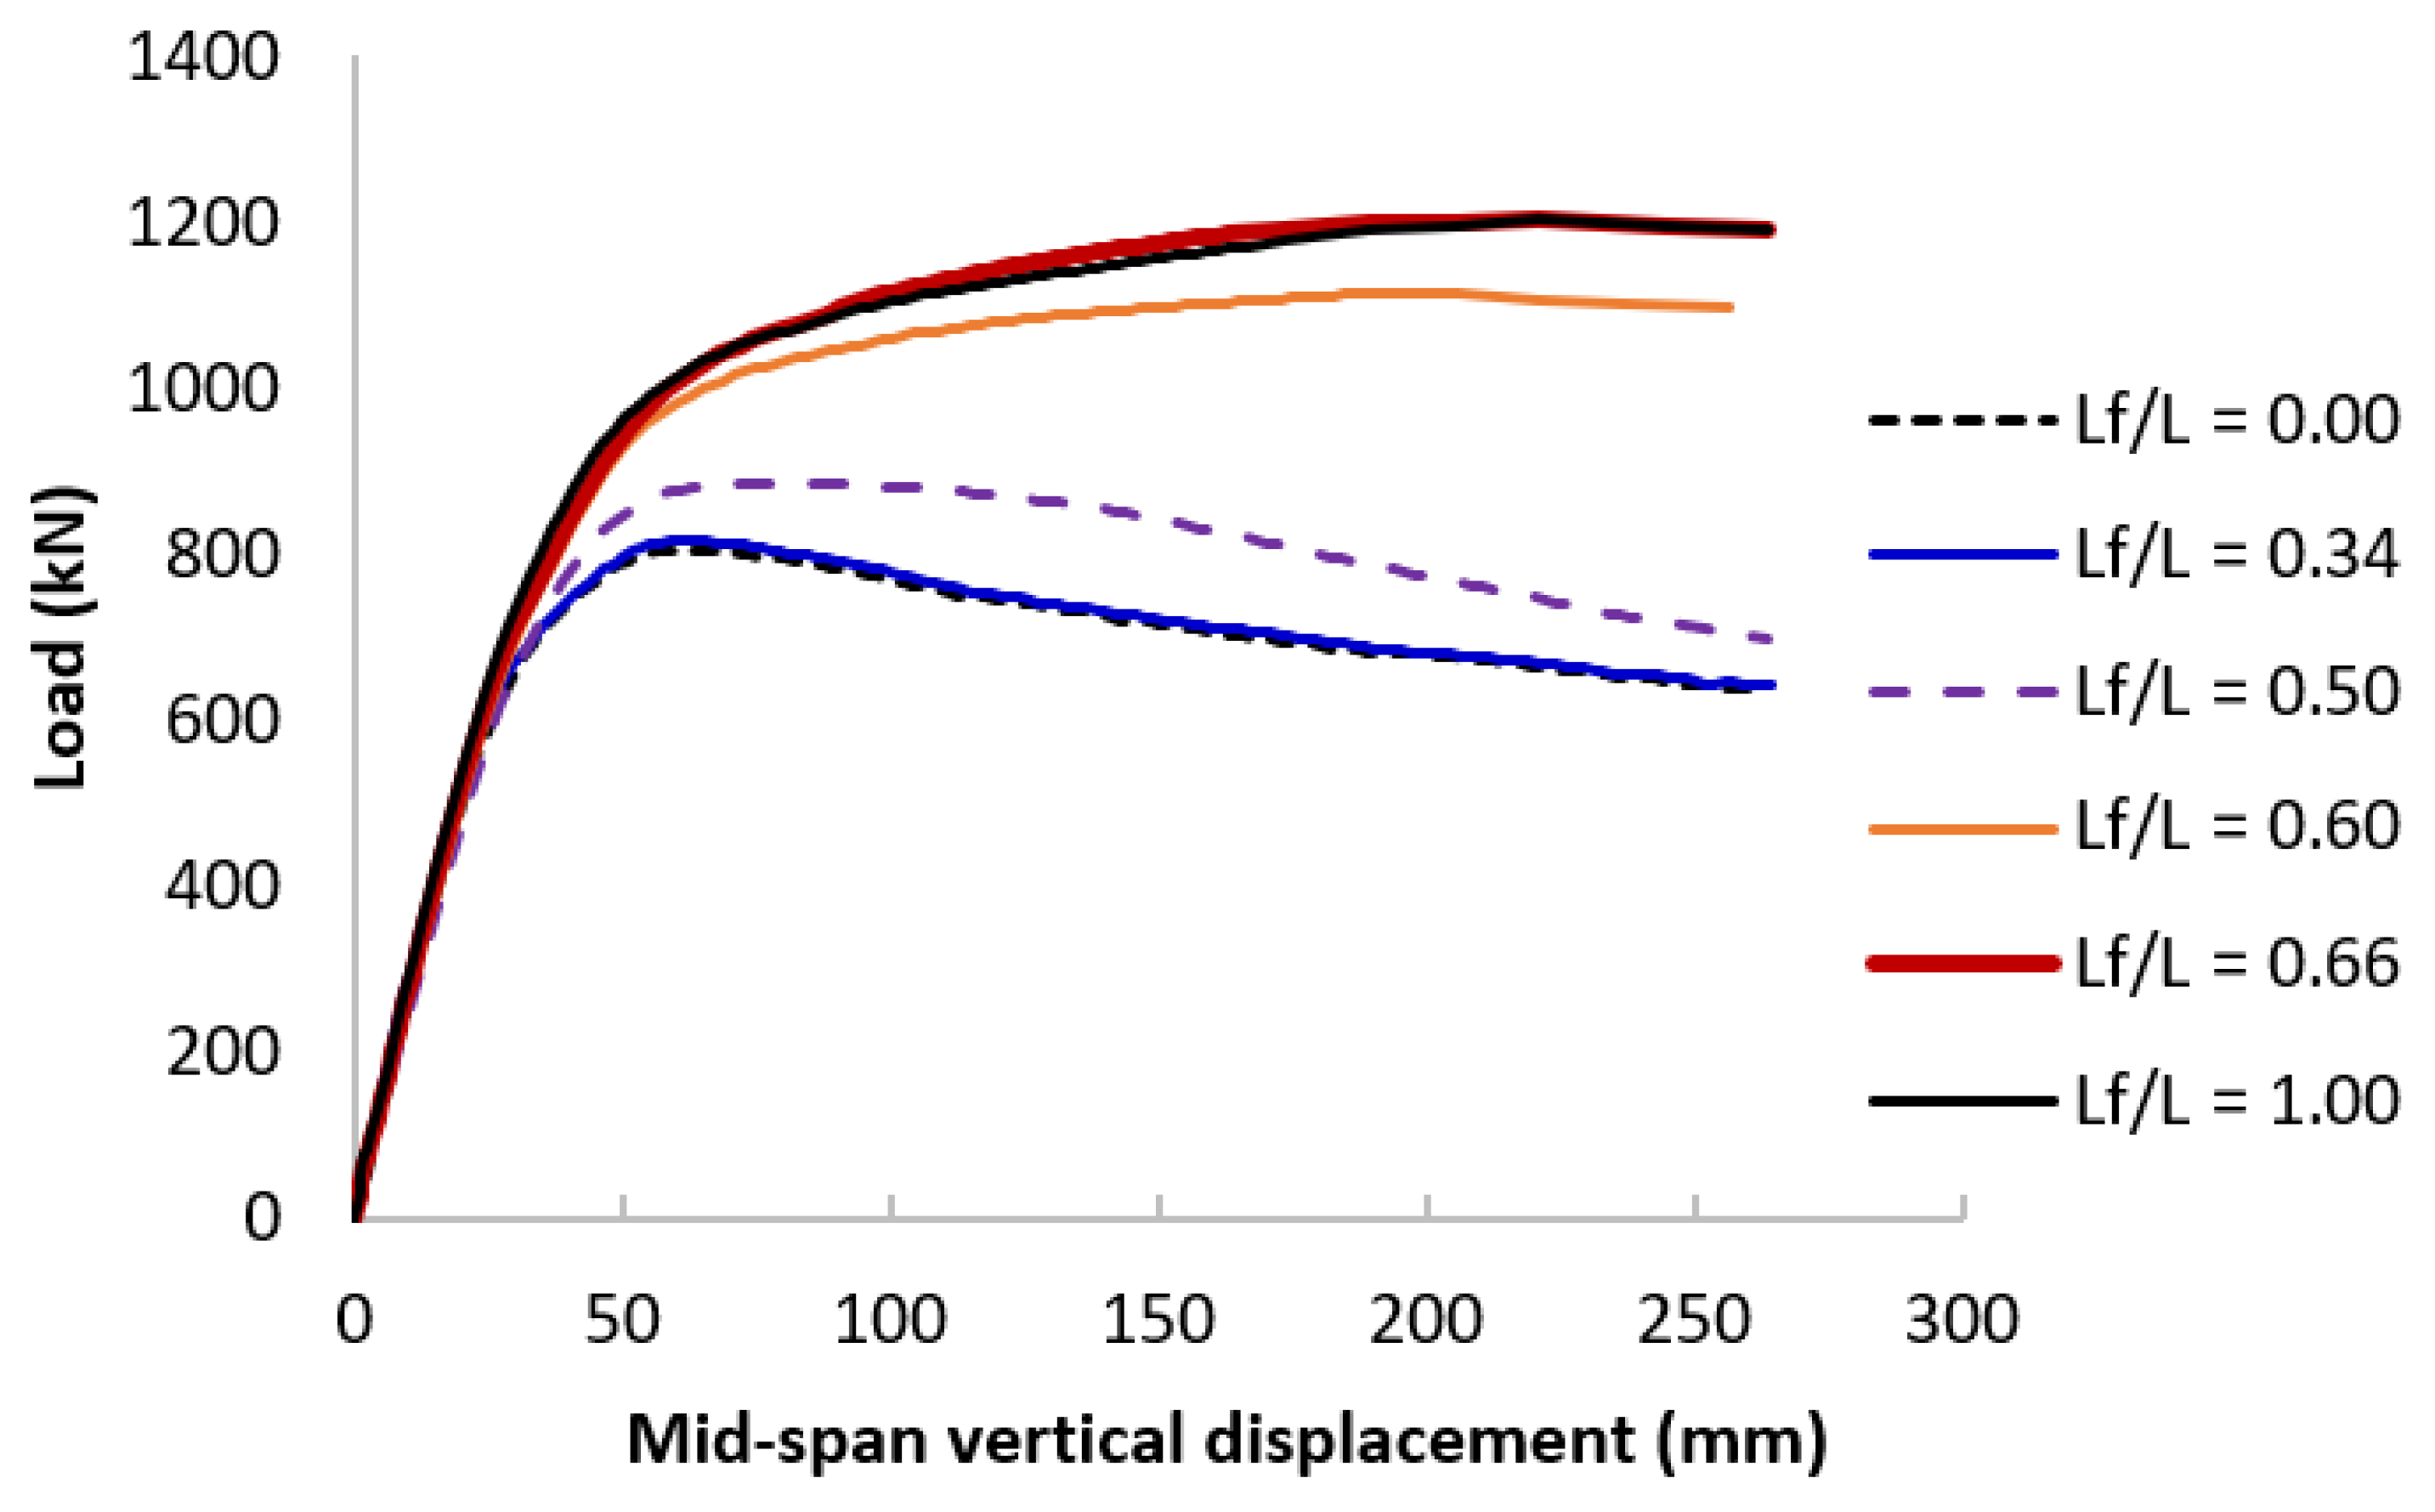
  • An optimal length of the partial concrete filling could be determined considering the PCFST dimensions through D/t ratios. It was found that when the optimal length was about 66% of the tube length, the ultimate flexural strength of the PCFST was the same with that of the tube fully filed with concrete for its entire length. The PCFST with this optimal length of concrete filling defined the best flexural strength-to-weight ratio for the PCFST.
  • The compressive strength of concrete did not have significant effects on the PCFST’s flexural strength, i.e., changing the compressive strength by 30% only resulted in a maximum difference of 2% for the PCFST’s ultimate loads.
  • The material properties of the steel tube (yield stress and tensile strength) had significant effects on the PCFST’s flexural strength, i.e., when the steel strengths increased by 10%, the PCFST’s ultimate load could increase up to 14%.
  • The confined stresses developed in the concrete filling predicted by FE modelling increased when the compressive strength increased, with a maximum difference of 9% for the same steel grade but this did not significantly affect the PCFST’s ultimate strength.
  • The confined stresses developed in the concrete filling predicted by FE modelling increased when the steel’s yield stress and tensile strength increased, with a maximum difference of 5% and this significantly affected the PCFST’s ultimate strength, i.e., a maximum increase of 14%.
  • The confined stresses developed in the concrete filling predicted by FE modelling remained unchanged when the concrete filling length was equal or greater than 66% of the tube length. However, it increased significantly, by 2.4 times when the tube’s thicknesses increased.
  • The confined strengths predicted by FE analysis were in excellent agreement with those calculated by the theoretical model while the corresponding strains were lower than those calculated by the theoretical model.
The full-scale experiment of the partially concrete-filled steel tube specimen under three-point bending test provided insight into the behaviour of this kind of structures in practical applications. The most common applications include bridge columns and piles under lateral applied loads including earthquake excitations. The test results were in very good agreement with the Finite Element results; it further indicated that the experiment was accurately set up. The FE modelling approach reported here provides a powerful tool to simulate the mechanical tests of partially concrete-filled steel tube specimens. It enables the consequences of the design of partially concrete-filled steel tubes under loading to be developed. The approach can be used as an alternative and complementary method to the experimental testing and flexural strength design of partially concrete-filled steel tubes for various applications.

Author Contributions

Conceptualization, T.T.T.N. and V.B.N.; methodology, T.T.T.N., M.Q.T. and V.B.N.; software, M.Q.T. and V.B.N.; validation, T.T.T.N., M.Q.T. and V.B.N.; formal analysis, T.T.T.N., M.Q.T. and V.B.N.; investigation, T.T.T.N., M.Q.T. and V.B.N.; resources, T.T.T.N. and V.B.N.; data curation, T.T.T.N. and V.B.N.; writing—original draft preparation, T.T.T.N., M.Q.T. and V.B.N.; writing—review and editing, V.B.N.; visualization, T.T.T.N., M.Q.T. and V.B.N.; supervision, T.T.T.N. and V.B.N.; project administration, T.T.T.N.; funding acquisition, T.T.T.N. and V.B.N. All authors have read and agreed to the published version of the manuscript.

Funding

The authors would like to acknowledge the Ministry of Transportation of Vietnam for the financial support for the project (No. DT194047) entitled "Investigation of steel pile foundation- column structures using rapid construction methods for urban bridge projects in Vietnam" where part of the experimental result was used in this paper.

Data Availability Statement

The data presented in this study are available on request.

Acknowledgments

The authors would like to thank Nippon Steel Corporation for providing technical supports for the experimental work. The authors would like to thank the University of Transport and Communications, Vietnam for the support on conducting the experiments in the Heavy Structures Testing Laboratory. The authors are also grateful to MSC Software in the UK for their software support during this research.

Conflicts of Interest

This manuscript has not been submitted to, nor is it under review by, another journal or other publishing venue. The authors have no affiliation with any organization with a direct or indirect financial interest in the subject matter discussed in the manuscript.

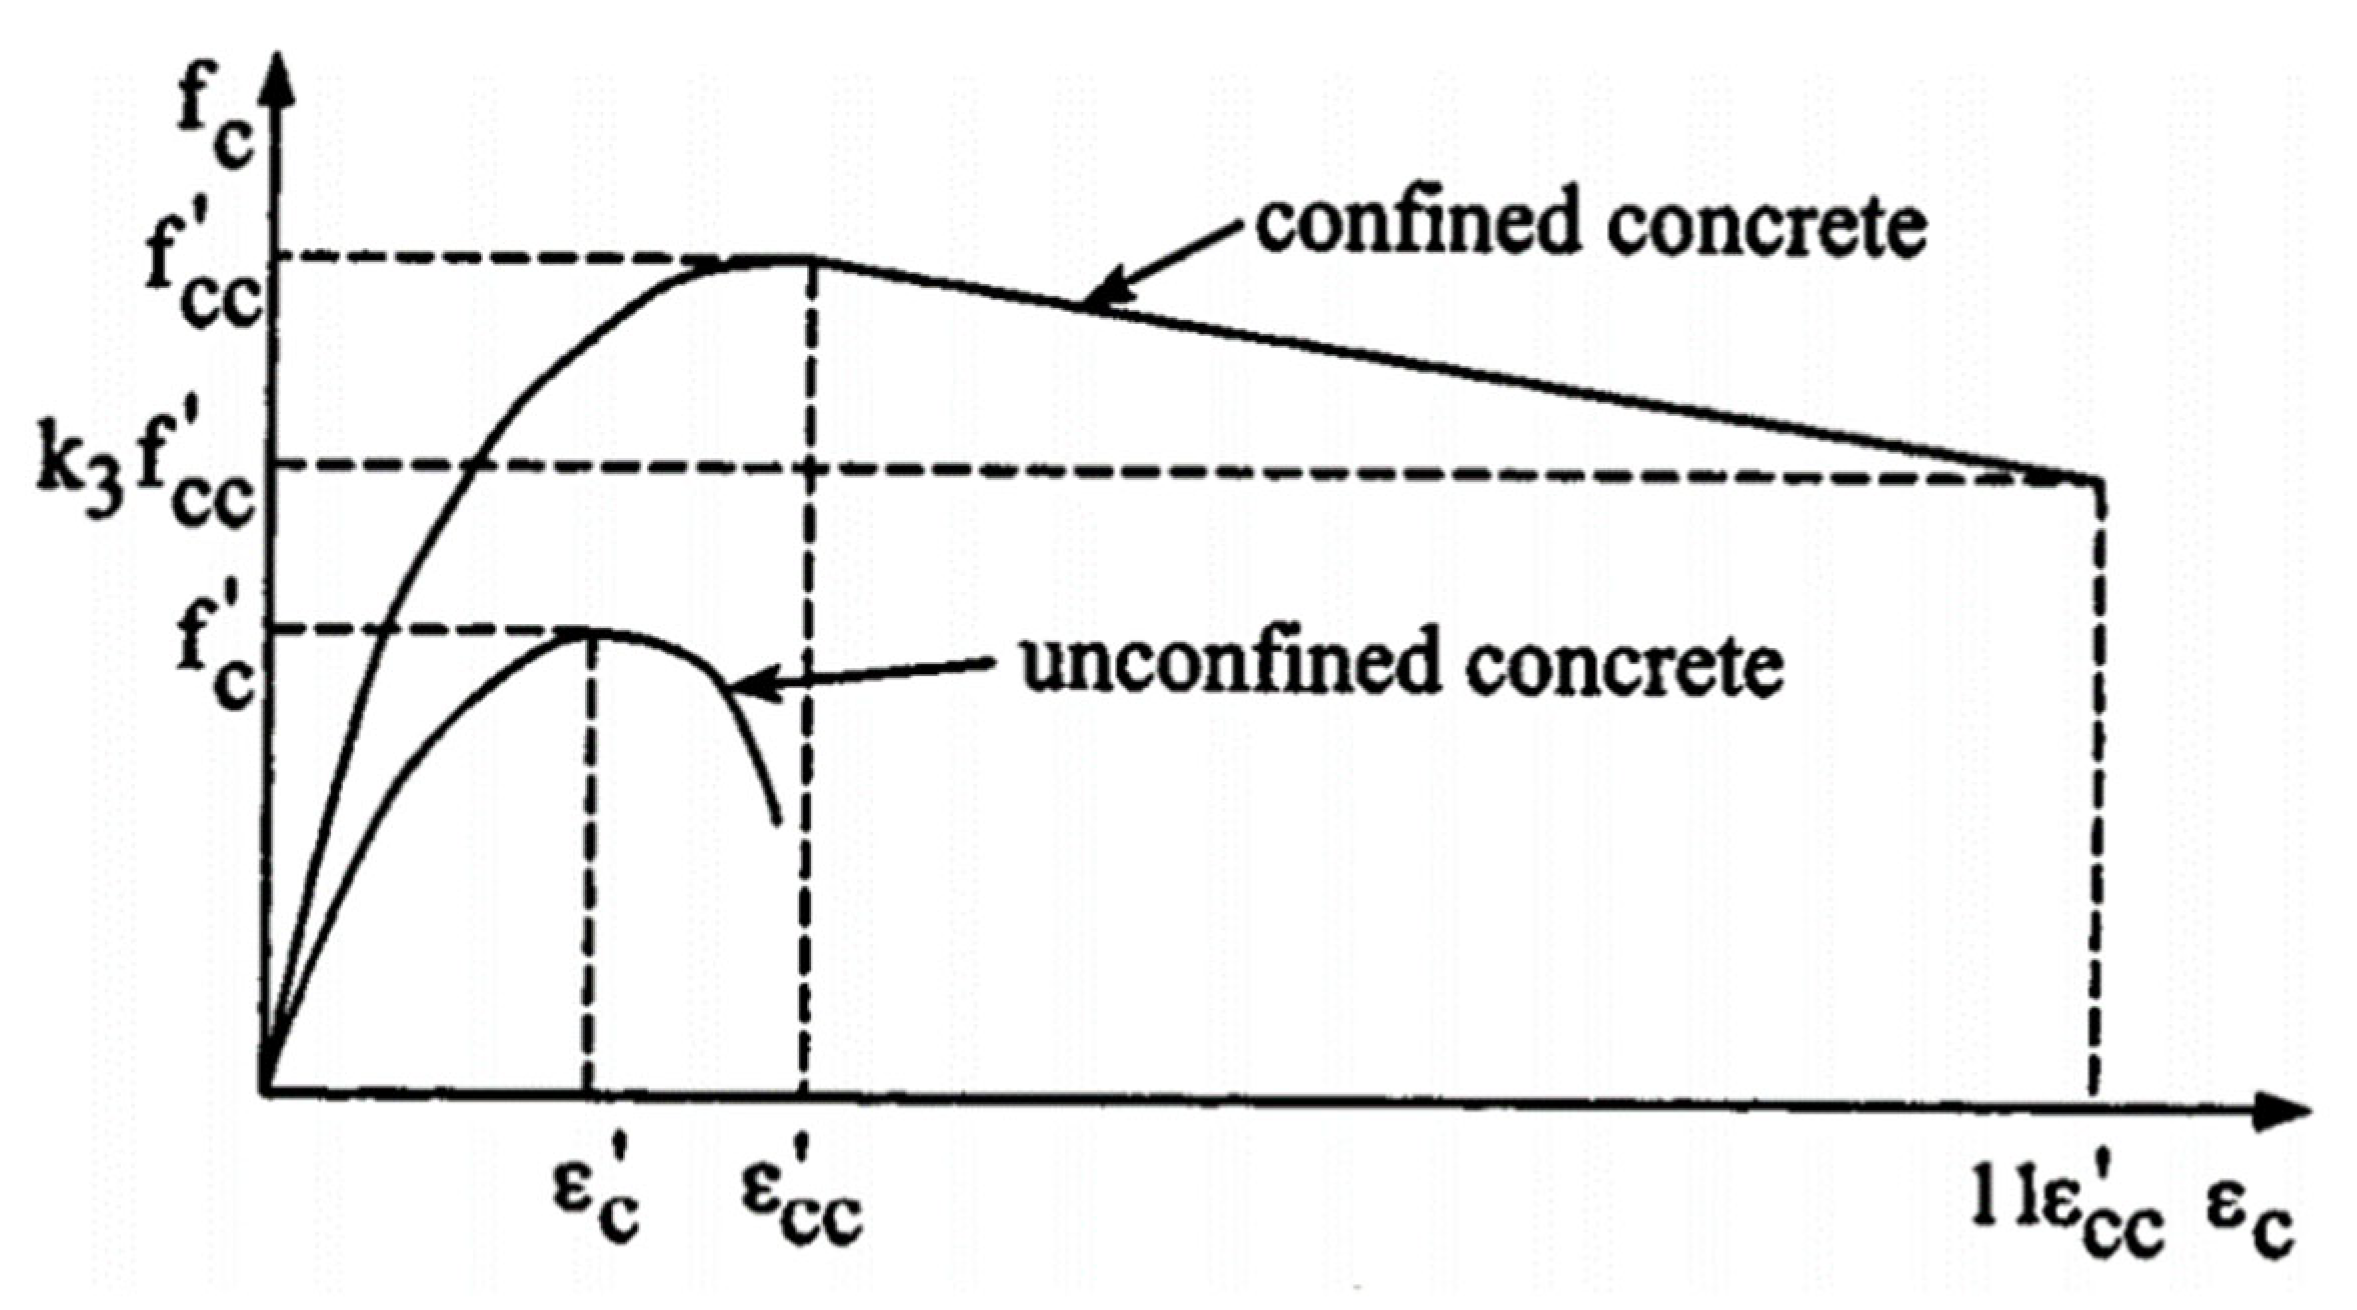
Appendix A. Confined Concrete Model and Properties

The equivalent model of uniaxial compressive strength and the corresponding strain of the unconfined and confined concrete materials, proposed by Mander and other researchers [38], as shown in Figure A1, was employed in this study to determine values of stresses and strains in concrete after yielding.
Figure A1. Typical stress-strain relationship for confined concrete used in FE model.
Buildings 13 00216 g0a1
When the concrete-filled steel tube was deformed in bending under applied loads, the filled concrete was subjected to laterally confining pressure from the steel tube, the uniaxial compressive strength f cc and the corresponding strain ε cc were much higher than those of unconfined concrete f c and ε c . The relations between f cc and f c and between ε cc and ε c were obtained by the following equations.
f cc = f c + k 1 f l
ε cc = ε c 1 + k 2 f l f c
In which f l was the confining pressure around the concrete core; k1 and k2 were constants and could be obtained from experimental data. In this study, values of k1 and k2 were set as 4.1 and 20.5 based on the previous studies [44]. The value of ε c was usually in the range of 0.002 to 0.003. A representative value used in the analysis was ε c = 0.002. The equivalent uniaxial stress-strain curve for concrete was assumed to be linear before yielding when the concrete strain ε c was less than ε cc . When ε c was greater than ε cc a linear descending line was used to model the softening behaviour of concrete, as shown in Figure 8. Assuming that the descending line was to be terminated at the point where f c = k 3 f cc and ε c = 11 ε cc in which k3 was considered as the material degradation parameter. The two parameters f l and k 3 were depended on the diameter-to-thickness ratio (D/t), cross-sectional shape, and stiffening mean. Their appropriate values were determined through the following equations which were obtained by matching the numerical results with experimental results (Hu et al., 2005).
f l f y = 0.006241 0.0000357 D t ,   with   47 D t 150  
k 3 = 0.0000339 D t 2 0.010085 D t + 1.3491 ,   with   40 D / t 150
where D was the diameter of the tube and t is the thickness of the tube. With D = 700 mm and t = 9 mm, the values of f l and k 3 were 1.2366 N/mm2 and 0.7698, respectively. The concrete compressive strengths of 46 N/mm2 at a strain of 0.003 was also used in the FE models.

References

  1. Gupta, P.K.; Sarda, S.M.; Kumar, M.S. Experimental and computational study of concrete filled steel tubular columns under axial loads. J. Constr. Steel Res. 2007, 63, 182–193. [Google Scholar] [CrossRef]
  2. Han, L.H.; Li, W.; Bjorhovde, R. Developments and advanced applications of concrete-filled steel tubular (CFST) structures. J. Constr. Steel Res. 2014, 100, 211–228. [Google Scholar] [CrossRef]
  3. Brown, N.K.; Kowalsky, M.K.; Nau, J.M. Impact of D/t on seismic behavior of reinforced concrete fill steel tubes. J. Constr. Steel Res. 2015, 107, 111–123. [Google Scholar] [CrossRef]
  4. Elremaily, A.; Azizinamini, A. Behavior and strength of circular concrete-filled tube columns. J. Constr. Steel Res. 2002, 58, 1567–1591. [Google Scholar] [CrossRef]
  5. Kilpatrick, A.E.; Vijaya, R.B. Tests on high-strength concrete filled steel tubular columns. ACI Struct. J. 1999, 96, 268–274. [Google Scholar]
  6. Roeder, C.W.; Lehman, D.E.; Bishop, E. Strength and stiffness of circular concrete-filled tubes. J. Struct. Eng. 2010, 136, 1545–1553. [Google Scholar] [CrossRef]
  7. Mitchell, J.R.; Fam, A.Z. Tests and analysis of cantilevered GFRP tubular poles with partial concrete filling. J. Compos. Constr. 2010, 14, 115–124. [Google Scholar] [CrossRef]
  8. Elchalakani, M.; Zhao, X.L.; Grzebieta, R.H. Concrete-filled circular steel tubes subjected to pure bending. J. Constr. Steel Res. 2001, 57, 1141–1168. [Google Scholar] [CrossRef]
  9. Jiang, A.Y.; Chen, J.; Jin, W.L. Experimental investigation and design of thin-walled concrete-filled steel tubes subject to bending. Thin-Walled Struct. 2013, 63, 44–50. [Google Scholar] [CrossRef]
  10. Wang, Z.B.; Yu, Q.; Tao, Z. Behaviour of CFRP externally reinforced circular CFST members under combined tension and bending. J. Constr. Steel Res. 2015, 106, 122–137. [Google Scholar] [CrossRef]
  11. Gunawardena, Y.; Aslani, F. Static flexural behaviour of concrete-filled spiral-welded stainless-steel tubes. Thin-Walled Struct. 2020, 151, 1–21. [Google Scholar] [CrossRef]
  12. Goto, Y.; Kumar, G.P.; Kawanishi, N. Nonlinear Finite-Element analysis for hysteretic behavior of thin-walled circular steel columns with in-filled concrete. J. Struct. Eng. 2010, 136, 1413–1422. [Google Scholar] [CrossRef]
  13. Han, L.H.; Lu, H.; Yao, G.H.; Liao, F.Y. Flexural study on the flexural behaviour of concrete-filled steel tubes. J. Constr. Steel Res. 2004, 60, 313–337. [Google Scholar] [CrossRef]
  14. Roeder, C.W.; Stephen, M.T.; Lehman, D.E. Concrete filled steel tubes for bridge pier and foundation construction. Int. J. Steel Struct. 2018, 18, 39–49. [Google Scholar] [CrossRef]
  15. Qiu, W.; McCann, F.; Espinos, A.; Romero, M.L.; Gardner, L. Numerical analysis and design of slender concrete-filled elliptical hollow section columns and beam-columns. Eng. Struct. 2017, 131, 90–100. [Google Scholar] [CrossRef]
  16. Hu, H.T.; Huang, C.S.; Chen, Z.L. Finite element analysis of CFT columns subjected to an axial compressive force and bending moment in combination. J. Constr. Steel Res. 2005, 61, 1692–1712. [Google Scholar] [CrossRef]
  17. Moon, J.; Roeder, C.W.; Lehman, D.E.; Lee, H.E. Analytical modelling of bending of circular concrete-filled steel tubes. Eng. Struct. 2012, 42, 349–361. [Google Scholar] [CrossRef]
  18. Zheng, Y.; He, C.; Zheng, L. Experimental and numerical investigation of circular double-tube concrete filled stainless steel tubular columns under cyclic loading. Thin-Walled Struct. 2018, 132, 151–166. [Google Scholar] [CrossRef]
  19. Shi, Y.L.; Xian, W.; Wang, W.D.; Li, H.W. Mechanical behaviour of circular steel-reinforced concrete-filled steel tubular members under pure bending loads. Structures 2020, 25, 8–23. [Google Scholar] [CrossRef]
  20. Xian, W.; Wang, W.D.; Wang, R.; Chen, W.; Hao, H. Dynamic response of steel-reinforced concrete-filled circular steel tubular members under lateral impact loads. Thin-Walled Struct. 2020, 151, 106736. [Google Scholar] [CrossRef]
  21. Xian, W.; Chen, W.; Hao, H.; Wang, W.D. Experimental and numerical studies on square steel-reinforced concrete-filled steel tubular (SRCFST) members subjected to lateral impact. Thin-Walled Struct. 2021, 160, 107409. [Google Scholar] [CrossRef]
  22. Wang, W.D.; Ji, S.H.; Xian, W.; Shi, Y.L. Experimental and numerical investigations of steel-reinforced concrete-filled steel tubular members under compression-bending-shear loads. J. Constr. Steel Res. 2021, 181, 106609. [Google Scholar] [CrossRef]
  23. Debnath, P.P.; Chan, T.M. A comprehensive numerical approach for modelling blind-bolted CFST connections. Structures 2021, 33, 2208–2225. [Google Scholar] [CrossRef]
  24. Kang, L.; Fan, W.; Liu, B.; Liu, Y. Numerically efficient analysis of concrete-filled steel tubular columns under lateral impact loading. J. Constr. Steel Res. 2020, 179, 106564. [Google Scholar] [CrossRef]
  25. Building and Construction Authority. BC4. Design Guide for Steel-Concrete Composite Columns with High Strength Materials—An Extension of Eurocode 4 Method To C90/105 Concrete and S550 Steel; Building and Construction Authority: Singapore, 2021. [Google Scholar]
  26. Liew, J.Y.R.; Xiong, M.-X.; Lai, B.-L. Design of Steel-Concrete Composite Structures—An Extension of EN1994-1-1 to High Strength Materials; Elsevier: Amsterdam, The Netherlands, 2021. [Google Scholar]
  27. Xiao, Y.; Wu, H. Retrofit of reinforced concrete columns using partially stiffened steel jackets. J. Struct. Eng. 2003, 12, 725–732. [Google Scholar] [CrossRef]
  28. Fam, A.; Mitchell, J. Enhancing flexural performance of free-standing tubular steel poles using an optimal partial concrete fill. Can. J. Civ. Eng. 2011, 38, 1145–1157. [Google Scholar] [CrossRef]
  29. Gerolymos, N.; Drosos, V.; Gazetas, G. Seismic response of single column bent on pile: Evidence of beneficial role of pile and soil inelasticity. Bull. Earthq. Eng. 2009, 7, 547–573. [Google Scholar] [CrossRef]
  30. Khalifa, M.; Shaat, A.; Ibrahim, S. Optimum concrete filling ratio for partially filled noncompact steel tubes. Thin-Walled Struct. 2019, 134, 159–173. [Google Scholar] [CrossRef]
  31. Liao, F.Y.; Han, L.H.; Tao, Z.; Rasmussen, K.J.R. Experimental behavior of concrete-filled stainless steel tubular columns under cyclic lateral loading. J. Struct. Eng. 2017, 14, 04016219. [Google Scholar] [CrossRef]
  32. Yuan, H.; Dang, J.; Aoki, T. Behavior of partially concrete-filled steel tube bridge piers under bi-directional seismic excitations. J. Constr. Steel Res. 2014, 93, 44–54. [Google Scholar] [CrossRef]
  33. Nguyen, T.T.T.; Thai, M.Q.; Dao, D.L. Simulation of the bending behaviour of concrete-filled steel tubes. Transp. J. 2020, 1–2, 50–53. (In Vietnamese) [Google Scholar]
  34. Nguyen, T.T.T.; Tran, V.N.; Tran, M.L. Studying applications of the pile and pile continuous structures for urban bridges in Vietnam. Transp. J. 2019, 12, 28–31. (In Vietnamese) [Google Scholar]
  35. AASHTO T 177; Standard Method of Test for Flexural Strength of Concrete Using Simple Beam with Center-Point Loading. The American Association of State Highway and Transportation Official: Washington, DC, USA, 2017.
  36. ASTM C293/C293M-16; Standard Method of Test for Flexural Strength of Concrete (Using Simple beam with center-point loading). The American Society for Testing and Materials: West Conshohocken, PA, USA, 2016.
  37. Buyukozturk, O. Nonlinear analysis of reinforced concrete structures. Comput. Struct. 1977, 7, 149–156. [Google Scholar] [CrossRef]
  38. Mander, J.B.; Priestley, M.J.N.; Park, N. Theoretical stress-strain model for confined concrete. J. Struct. Eng. 1988, 114, 1804–1826. [Google Scholar] [CrossRef] [Green Version]
  39. Jefferson, A. Craft—A plastic-damage-contact model for concrete. I. Model theory and thermodynamic considerations. Int. J. Solids Struct. 2003, 40, 5973–5999. [Google Scholar] [CrossRef]
  40. Nguyen, V.B. Numerical Modelling of Reinforced Concrete Bridge Pier Under Artificially Generated Earthquake Time-Histories. Ph.D. Thesis, University of Birmingham, Birmingham, UK, 2006. [Google Scholar]
  41. Bazant, Z.P.; Oh, B.H. Crack band theory for fracture of concrete. Mater. Struct. 1983, 16, 155–177. [Google Scholar]
  42. Bedard, C.; Kotsovos, M.D. Fracture processes of concrete for NLFEA methods. J. Struct. Eng. 1986, 112, 573–587. [Google Scholar] [CrossRef]
  43. Baran, E.; Schultz, A.E.; French, C.E. Performance of a prestressed concrete pedestrian bridge system under equivalent static lateral impact loads. J. Perform. Constr. Facil. 2013, 27, 450–459. [Google Scholar] [CrossRef]
  44. Richart, F.E.; Brandtzaeg, A.; Brown, R.L. A Study of The Failure of Concrete Under Combined Compressive Stresses; University of Illinois Engineering Experimental Station: Champaign, IL, USA, 1928. [Google Scholar]
Figure 1. Maximum bending moment distributions for a free-head pile-column with the above ground height H = 10 m and the tube diameter b = d = 1.5 m (Gerolymos et al. [29]).
Buildings 13 00216 g001
Figure 2. Stress-strain curve of steel material of the tube.
Buildings 13 00216 g002
Figure 3. Compressive strengths of concrete cubes tested at 7, 14, 21 and 28 days.
Buildings 13 00216 g003
Figure 4. Three-point bending test setup (a) schematic diagram of test setup, (b) a three-dimensional view of the test setup. The small box shows a closer view of spiral ribs inside the steel tube and concrete filling.
Buildings 13 00216 g004
Figure 5. Locations of strain gauges and displacement sensors (a) in longitudinal direction, strain gauges are on cross sections A-H and displacement sensors (defined by arrow symbols with numbers 1–8), (b) strain gauges’ locations on cross sections.
Buildings 13 00216 g005
Figure 6. A 3-dimensional view of instrumentation arrangement of strain gauges and LVDTs.
Buildings 13 00216 g006
Figure 7. FE model of the bending test setup including boundary conditions and a closer view of the mesh around the mid-span of the PCFST specimen.
Buildings 13 00216 g007
Figure 8. Idealised stress-strain relationship for concrete used in FE concrete material model.
Buildings 13 00216 g008
Figure 9. Material points of steel tube and concrete filling at the outer fibres at mid-span cross section where the FE stress-strain data were extracted for investigating the PCFST behaviour and concrete confinement (a) mid-span cross section and material points, (b) steel tube, and (c) concrete filling. The contour blue and red colours represent the maximum compressive and tensile stresses in the tube’s longitudinal direction.
Buildings 13 00216 g009
Figure 10. Strain data at cross section H (a) strain measurement locations, and (b) strain-load curves for longitudinal strains (even numbers) and hoop strains (odd numbers). The red square marked the position of the ultimate load.
Buildings 13 00216 g010
Figure 11. The comparison of load-vertical displacement curves between experimental results and FE analysis (presented for the first 14 cycles of the loading-unloading process) “Envelope” is the envelope of load values of the experimental curve not including unloading-loading values.
Buildings 13 00216 g011
Figure 12. The stress-strain curves at material points of (a) steel tube where the box shows a closer view of stress-strain curves in compression, and (b) concrete filling. The positive values are for “tensile” stresses and the negative values are for “compressive” stresses.
Buildings 13 00216 g012
Figure 13. The local buckling of the PCFST specimen: (a) testing, and (b) FE deformed shape, and (c) stress distribution (red colours indicate maximum stress in tension, and blue colours indicate maximum stress in compression).
Buildings 13 00216 g013
Figure 14. Stress contour and local buckling shapes of the PCFST (a) at the end of the 1st cycle, (b) at the end of the 2nd cycle, and (c) at the end of the 12th cycle, in which blue areas indicate large compression stresses. In this figure, Z is the longitudinal axis of the PCFST specimen.
Buildings 13 00216 g014aBuildings 13 00216 g014b
Figure 15. The behaviour of concrete filling in the PCFST specimen at the end of the 12th cycle (a) normal stress distribution, and (b) cracking strain distribution with a crack band under loading point, in which yellow and red areas indicate large cracking strain. Negative values are for compressive stresses.
Buildings 13 00216 g015aBuildings 13 00216 g015b
Figure 16. Experimental and FE analysis’s load-longitudinal strain responses at the cross-section H position (strains were measured at loads up to 900 kN). Compression strain values are negative, and tension strain values are positive.
Buildings 13 00216 g016
Figure 17. Neutral axis positions in the transition region measured by experiment and predicted by Finite Element analysis.
Buildings 13 00216 g017
Figure 18. Enveloped load-displacement curves of different concrete filling length ratios at the tube diameter-to-thickness ratio D/t = 78.
Buildings 13 00216 g018
Figure 19. Variation of maximum loads with concrete fill length ratio for different tube dimensions D/t.
Buildings 13 00216 g019
Figure 20. Enveloped load-displacement curves at different values of the compressive strength of concrete, for the case of the steel strength σy = 382 N/mm2 and σt = 542 N/mm2.
Buildings 13 00216 g020
Figure 21. Stress-strain curves at material points of concrete at different values of the compressive strength of concrete, for the case of the steel strength σy = 382 N/mm2 and σt = 542 N/mm2.
Buildings 13 00216 g021
Table 1. The properties of concrete mix for concrete filling.
MaterialWeight (kg/m3)Volume (m3)
Water1790.179
Cement3500.112
Coarse aggregates (size: 5–20 mm)10100.015
Sand8350.319
Admixtures1.40.001
Air (1.5%)
Water/Cement ratio = 51%
Cement/Sand ratio = 42%
Table 2. Effects of the tube diameter-to-thickness ratio and the concrete filling length on the PCFST’s ultimate loads.
Concrete Filling Length Ratio Ultimate   Load   P u   k N
L f L D t = 39 D t = 78 D t = 140
(1)(2)(3)(4)
0.001780807505
0.341824817515
0.502029888560
0.6023001105705
0.6623331200760
1.0023351210795
Table 3. Effects of the compressive strength of concrete and yield stress and tensile strength of steel tube on the PCFST’s ultimate load and the confined strength of concrete predicted by Finite Element Analysis and Theoretical Analysis. f c is the compressive strength of concrete, f cc _ FEA is the confined strength of concrete predicted by FEA, ε cc _ FEA is the strain at the confined strength f cc _ FEA , f cc _ FEA is the compressive strength at the PCFST’s ultimate load predicted by FEA, f cc _ THEO is the confined strength of concrete predicted by theoretical model [38], ε cc _ THEO is the strain at the confined strength f cc _ THEO .
Compressive StrengthSteel Yield and Ultimate StrengthUltimate LoadFinite Element Analysis (FEA)Theoretical Analysis (THEO)Comparison
f c   N / m m 2 σ y   a n d   σ t   k N P u   k N f c c _ F E A ε c c _ F E A f c c _ F E A f c c _ T H E O ε c c _ T H E O f c c _ F E A f c c _ T H E O ε c c _ F E A ε c c _ T H E O
(1)(2)(3)(4)(5)(6)(7)(8)(9)(10)
σy = 334, σt = 4881049400.001552400.00331.000.45
36σy = 382, σt = 5421173420.001553410.00351.020.43
σy = 458, σt = 6501343420.001553430.00380.980.39
σy = 334, σt = 4881053440.001756450.00310.980.55
41σy = 382, σt = 5421200460.001758460.00331.000.52
σy = 458, σt = 6501359470.001760480.00350.980.49
σy = 334, σt = 4881064490.001959500.00300.980.63
46σy = 382, σt = 5421200500.001960510..00310.980.61
σy = 334, σt = 4881364520.001964530.00340.980.56
Table 4. Effects of the tube diameter-to-thickness ratio and concrete filling length ratio on the PCFST’s ultimate load and the confined strength of concrete predicted by Finite Element Analysis and Theoretical Analysis. f cc _ FEA is the confined strength of concrete predicted by FEA, ε cc _ FEA is the strain at the confined strength f cc _ FEA , f cc _ FEA is the compressive strength at the PCFST’s ultimate load predicted by FEA, f cc _ THEO is the confined strength of concrete predicted by theoretical model [38], ε cc _ THEO is the strain at the confined strength f cc _ THEO .
Diameter-to-Thickness RatioConcrete Filling Length RatioUltimate LoadFinite Element Analysis (FEA)Theoretical Analysis (THEO)Comparison
D t L f L P u   k N f c c _ F E A ε c c _ F E A f c c _ F E A f c c _ T H E O ε c c _ T H E O f c c _ F E A f c c _ T H E O ε c c _ F E A ε c c _ T H E O
(1)(2)(3)(4)(5)(6)(7)(8)(9)(10)
390.6623331200.0011120640.00581.880.19
1.0023351230.0011123640.00581.920.19
780.661200500.001960510.00310.980.61
1.001210500.001960510.00310.980.61
1400.66760500.001950480.00241.040.79
1.00795500.001956480.00241.040.79
Disclaimer/Publisher’s Note: The statements, opinions and data contained in all publications are solely those of the individual author(s) and contributor(s) and not of MDPI and/or the editor(s). MDPI and/or the editor(s) disclaim responsibility for any injury to people or property resulting from any ideas, methods, instructions or products referred to in the content.

