
Definition of Building Archetypes Based on the Swiss Energy Performance Certificates Database
by
 , and
, and
Alessandro Pongelli
1,
Yasmine Dominique Priore
1,2,
Jean-Philippe Bacher
1 and
Thomas Jusselme
1,* 1
Energy Institute, University of Applied Science of Western Switzerland (HEIA-FR, HES-SO), 1700 Fribourg, Switzerland
2
Chair of Sustainable Construction, ETH Zürich, 8049 Zurich, Switzerland
*
Author to whom correspondence should be addressed.
Buildings 2023, 13(1), 40; https://doi.org/10.3390/buildings13010040
Submission received: 30 September 2022
/
Revised: 5 December 2022
/
Accepted: 20 December 2022
/
Published: 24 December 2022
(This article belongs to the Special Issue Prediction and Monitoring of Building Energy Consumption)
Abstract
:The building stock is responsible for 24% of carbon emissions in Switzerland and 44% of the final energy use. Considering that most of the existing stock will still be in place in 2050, it becomes essential to better understand this source of emissions. Although the Swiss Cantonal Energy Certificate for Buildings (CECB) database has been used in previous research, no comprehensive characterization of the buildings can be found. This data paper presents an analysis and classification of the Swiss building stock based on the data found in the database. The objective is to create a knowledge foundation that can be used in future research on the performance of existing buildings. Using a sample of almost 50,000 buildings and a Python script, datasheets were created for single-family houses and multi-family houses for nine construction periods. These archetypes are described through selected available energy-related parameters, such as energy reference area, U-values, and energy source with indicators such as median, 25th percentile, and 75th percentile or distributions. The resulting data can be used for different purposes: (1) to calibrate energy models; (2) for analysis that requires scaling-up strategies to the whole stock; and (3) to identify weak and/or relevant classes of buildings throughout the stock.
1. Summary
It is often challenging to determine accurate input parameters for energy building/stock simulations, and this influences negatively the final estimates of energy demand or general environmental impacts of the existing buildings. This data paper aims to provide a repository of energy-related building characteristics representing the existing Swiss building stock to overcome this challenge.
Raw data from the CECB database were processed and anonymized to extract a statistical evaluation of the typical building physical properties. The processing was possible with a Python script by connecting all entries of the database and automatically detecting inconsistencies and missing or false data. Finally, all relevant building properties are aggregated into clusters (archetypes) and distributions are represented in the final data sheets.
The data provided within this article consist of nine datasheets, representing construction periods subsets, each describing two building archetypes, one for single-family house and one for multi-family house, for a total of 18 archetypes of the Swiss residential building stock. In addition, the processed data used to create the datasheets are also provided in the Supplementary Materials. The clustering of buildings by periods of construction follows the structure used by the Swiss Federal Statistical Office (FSO) but the last two periods span a 10-years gap instead of 5 years. Each datasheet is structured in the same way and a general legend can be found in Appendix A, Figure A1. In summary, the following descriptions are provided for each archetype:
- Representativity of the archetype to the dataset in percentage and number of entries;
- General information on size, form, and construction type;
- Element-based details (roof, walls, windows, floors);
- Energy supply and needs.
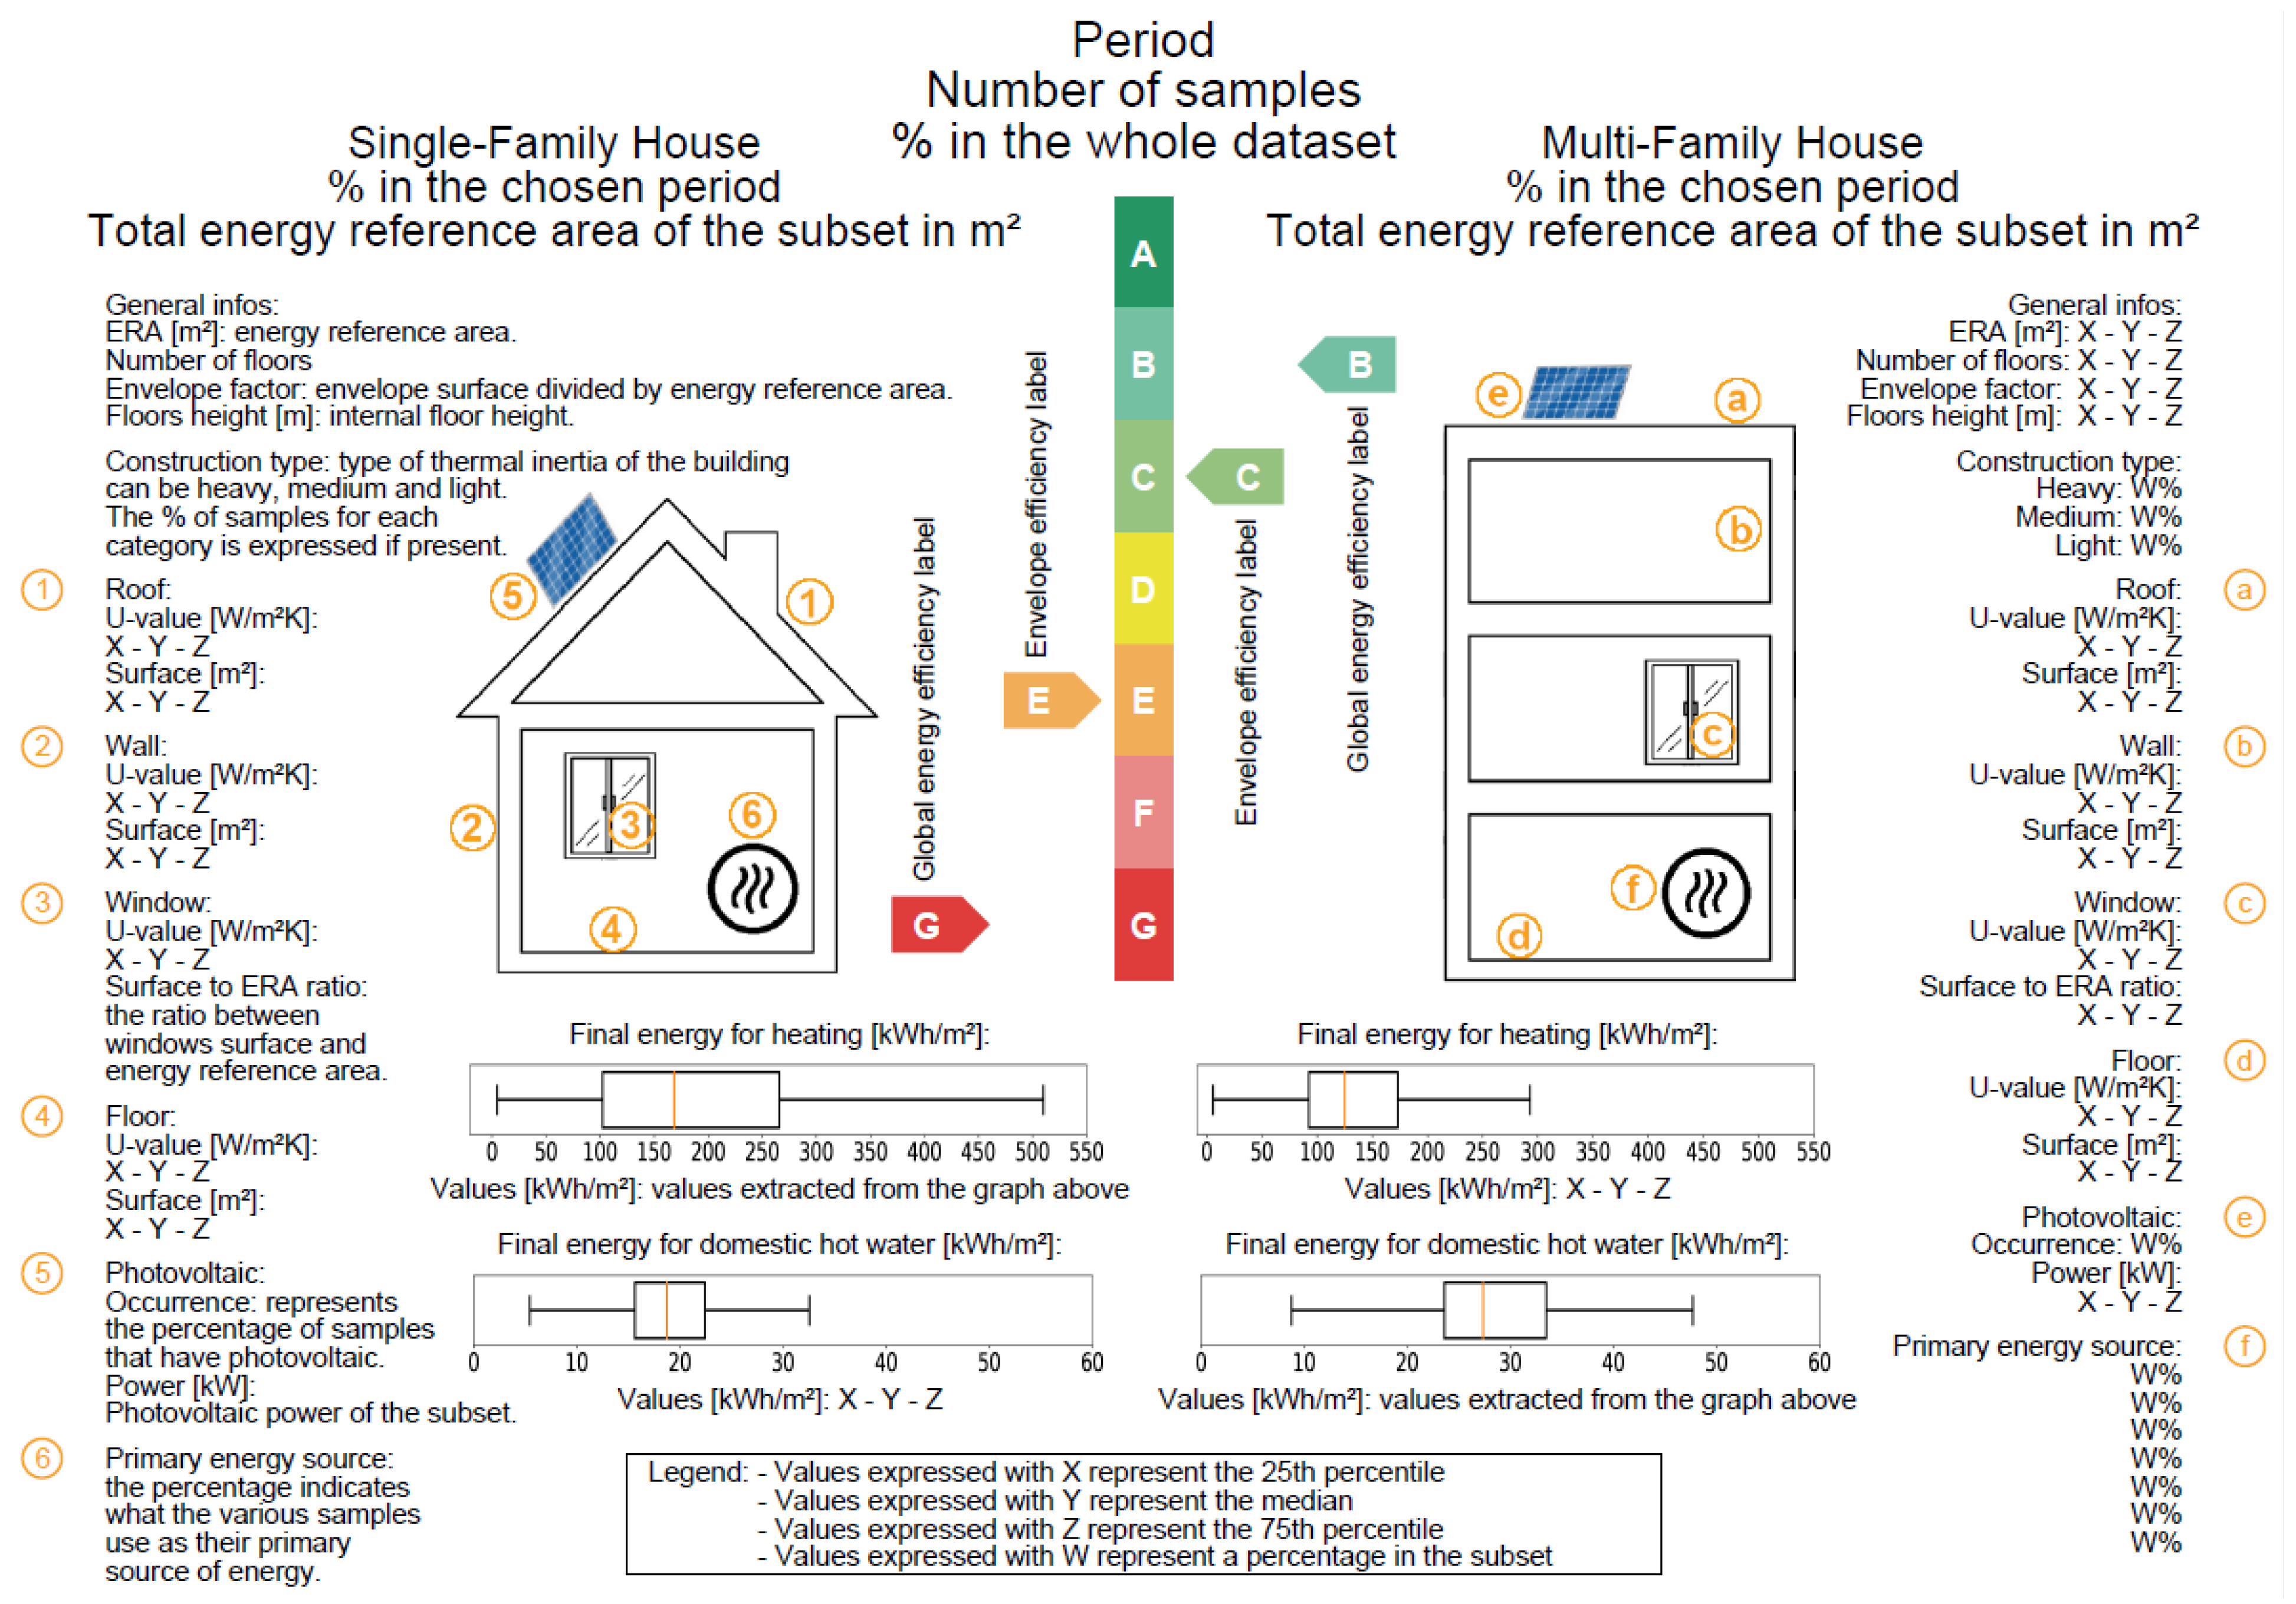
All values are presented with the median, the 25th percentile, and the 75th percentile excluding construction type and primary energy source that are given as distributions.
The data used to define archetypes in this paper are deemed to be representative of the overall Swiss building stock [1] and can be used during energy simulations processes or for more detailed analysis of the whole stock. Some intrinsic limitations must be mentioned. The single certificates are redacted by certified experts but no or limited post-controlling of the entries is conducted. Some values (ex: U-values) are often estimated by means of an integrated wizard and the accuracy of it cannot be checked. To further validate the archetypes, the data could be compared to real data of specific case studies corresponding to the construction year and typology. This step can be carried out only if enough robust data are available.
2. Data Description
2.1. Building Archetypes Description Sheets
In the Supplementary Materials, nine construction periods sheets are found, Figures S1–S9, each representing one single-family house archetype and one multi-family house archetype. The following descriptive characteristics and building properties are presented for each archetype. Unless otherwise specified, all values are shown in 25th percentile—median—75th percentile. The use of the word samples in the following sections refers to the number of entries or buildings included in each archetype and/or characteristics and properties. It does not refer to any further sampling techniques other than the grouping and clustering described in Section 3.
2.1.1. General Characterization of the Buildings Included in the Datasheet
Period of construction: The clustering into periods of construction is explained in Section 3.5.
Number of samples: Number of buildings present in the set period of construction.
Percentage of dataset: Ratio between the number of samples within the specific construction period and the whole dataset.
Building typology: Grouping in single-family house and multi-family house.
Percentage of typology: Share of samples for each typology in the chosen period of construction.
Total energy reference area: Total surface represented in the subset (period of construction—typology). Energy reference area in Switzerland is defined as the gross area included in the thermal envelope of the building and that requires conditioning [2].
2.1.2. General Buildings’ Information
Energy reference area: Distribution of energy reference areas for samples in the subset.
Number of floors: Distribution of number of floors for samples in the subset.
Envelope factor: Distribution of envelope surface divided by the energy reference area for each entry in the subset.
Floors height: Distribution of internal floor height for each entry in the subset.
Construction type: Construction type represents the level of thermal inertia of the building according to the SIA norm SIA380-1 [2] and is divided into the following three levels:
Heavy: At least two of the three thermally active elements (ceiling, floor, and all walls) are massive and without finishing. Thermal capacity over Energy Reference Area (ERA) = 0.5 MJ/(m2.K).
Medium: At least one of the three thermally active elements (ceiling, floor, and all walls) are massive and without finishing. Construction in solid wood. Thermal capacity over ERA = 0.3 MJ/(m2.K).
Light: Light wood construction—framed wood. Thermal capacity over ERA = 0.1 MJ/(m2.K).
2.1.3. Building Elements (Roof, Walls, Windows, and Floors)
U-value: Distribution of U-values for each building element in the subset.
Surface: Distribution of each building element’s surface in the subset.
Surface to ERA ratio (for windows): Distribution of the ratio between windows surface and ERA.
2.1.4. Energy Installations and Performances
Photovoltaic Occurrence: Represents the percentage of samples that reports a photovoltaic installation.
Photovoltaic Power: Distribution of the photovoltaic power installed in the occurring samples of the subset reporting a PV installation.
Primary energy source: Distribution in percentages of primary energy source of energy for heating.
Final energy for heating: Represents the calculated consumption reported from the sampled buildings for heating. The calculation details are available in the CECB normalization manual [3].
Final energy for domestic hot water: Represents the calculated consumption reported from the sampled buildings for hot water. The calculation details are available in the CECB normalization manual [3].
Global energy efficiency: This includes energy needs for heating (including hot water) and technical installations (electrical needs and self-production of electricity). The energy sources are weighted with national factors [4]; using renewable energies and/or heat pumps leads to a better evaluation.
Envelope efficiency: This rating expresses the quality of thermal resistance of the building’s envelope. This includes thermal insulation of external walls, roof, floor, and windows. Thermal bridges and the form of the buildings are also considered.
The rating system with letters A to G is defined by the CECB and a detailed explanation can be found in their manual [5].
2.2. Excel: Multi Family House.xlsx/Single Family House.xlsx
Tables present the same data found in the description sheets described in Section 2.1 but in an Excel format for easier use of the values in future works. Two files are provided, one for multi-family houses and one for single-family houses (Multi Family House.xlsx and Single Family House.xlsx). Each file has nine tabs representing the year clusters.
Each variable presents a column with the count of samples considered for that variable, one column with the 25th percentile, one with the median value, and one with the 75th percentile. Global energy and envelope efficiency are here marked with a number that refers to the corresponding alphabet letter. For the variables expressed in share distributions, the number of samples are listed in the files.
3. Methods
3.1. CECB Dataset
The Cantonal Energy Certificate for Building (CECB in French, GEAK in German, and CECE in Italian) is a tool to evaluate the energy efficiency of the thermal envelope and the energy consumed by the building [6]. The certificate is possible for residential buildings, offices, schools, hotels, commercial buildings, and restaurants, but only residential entries are considered in this paper as the other categories are under-represented and statistical data on it were deemed unreliable. The certification is mostly voluntary in Switzerland except for some cantons that require the certificate in case of sale, renovation, or replacement of the heating system.
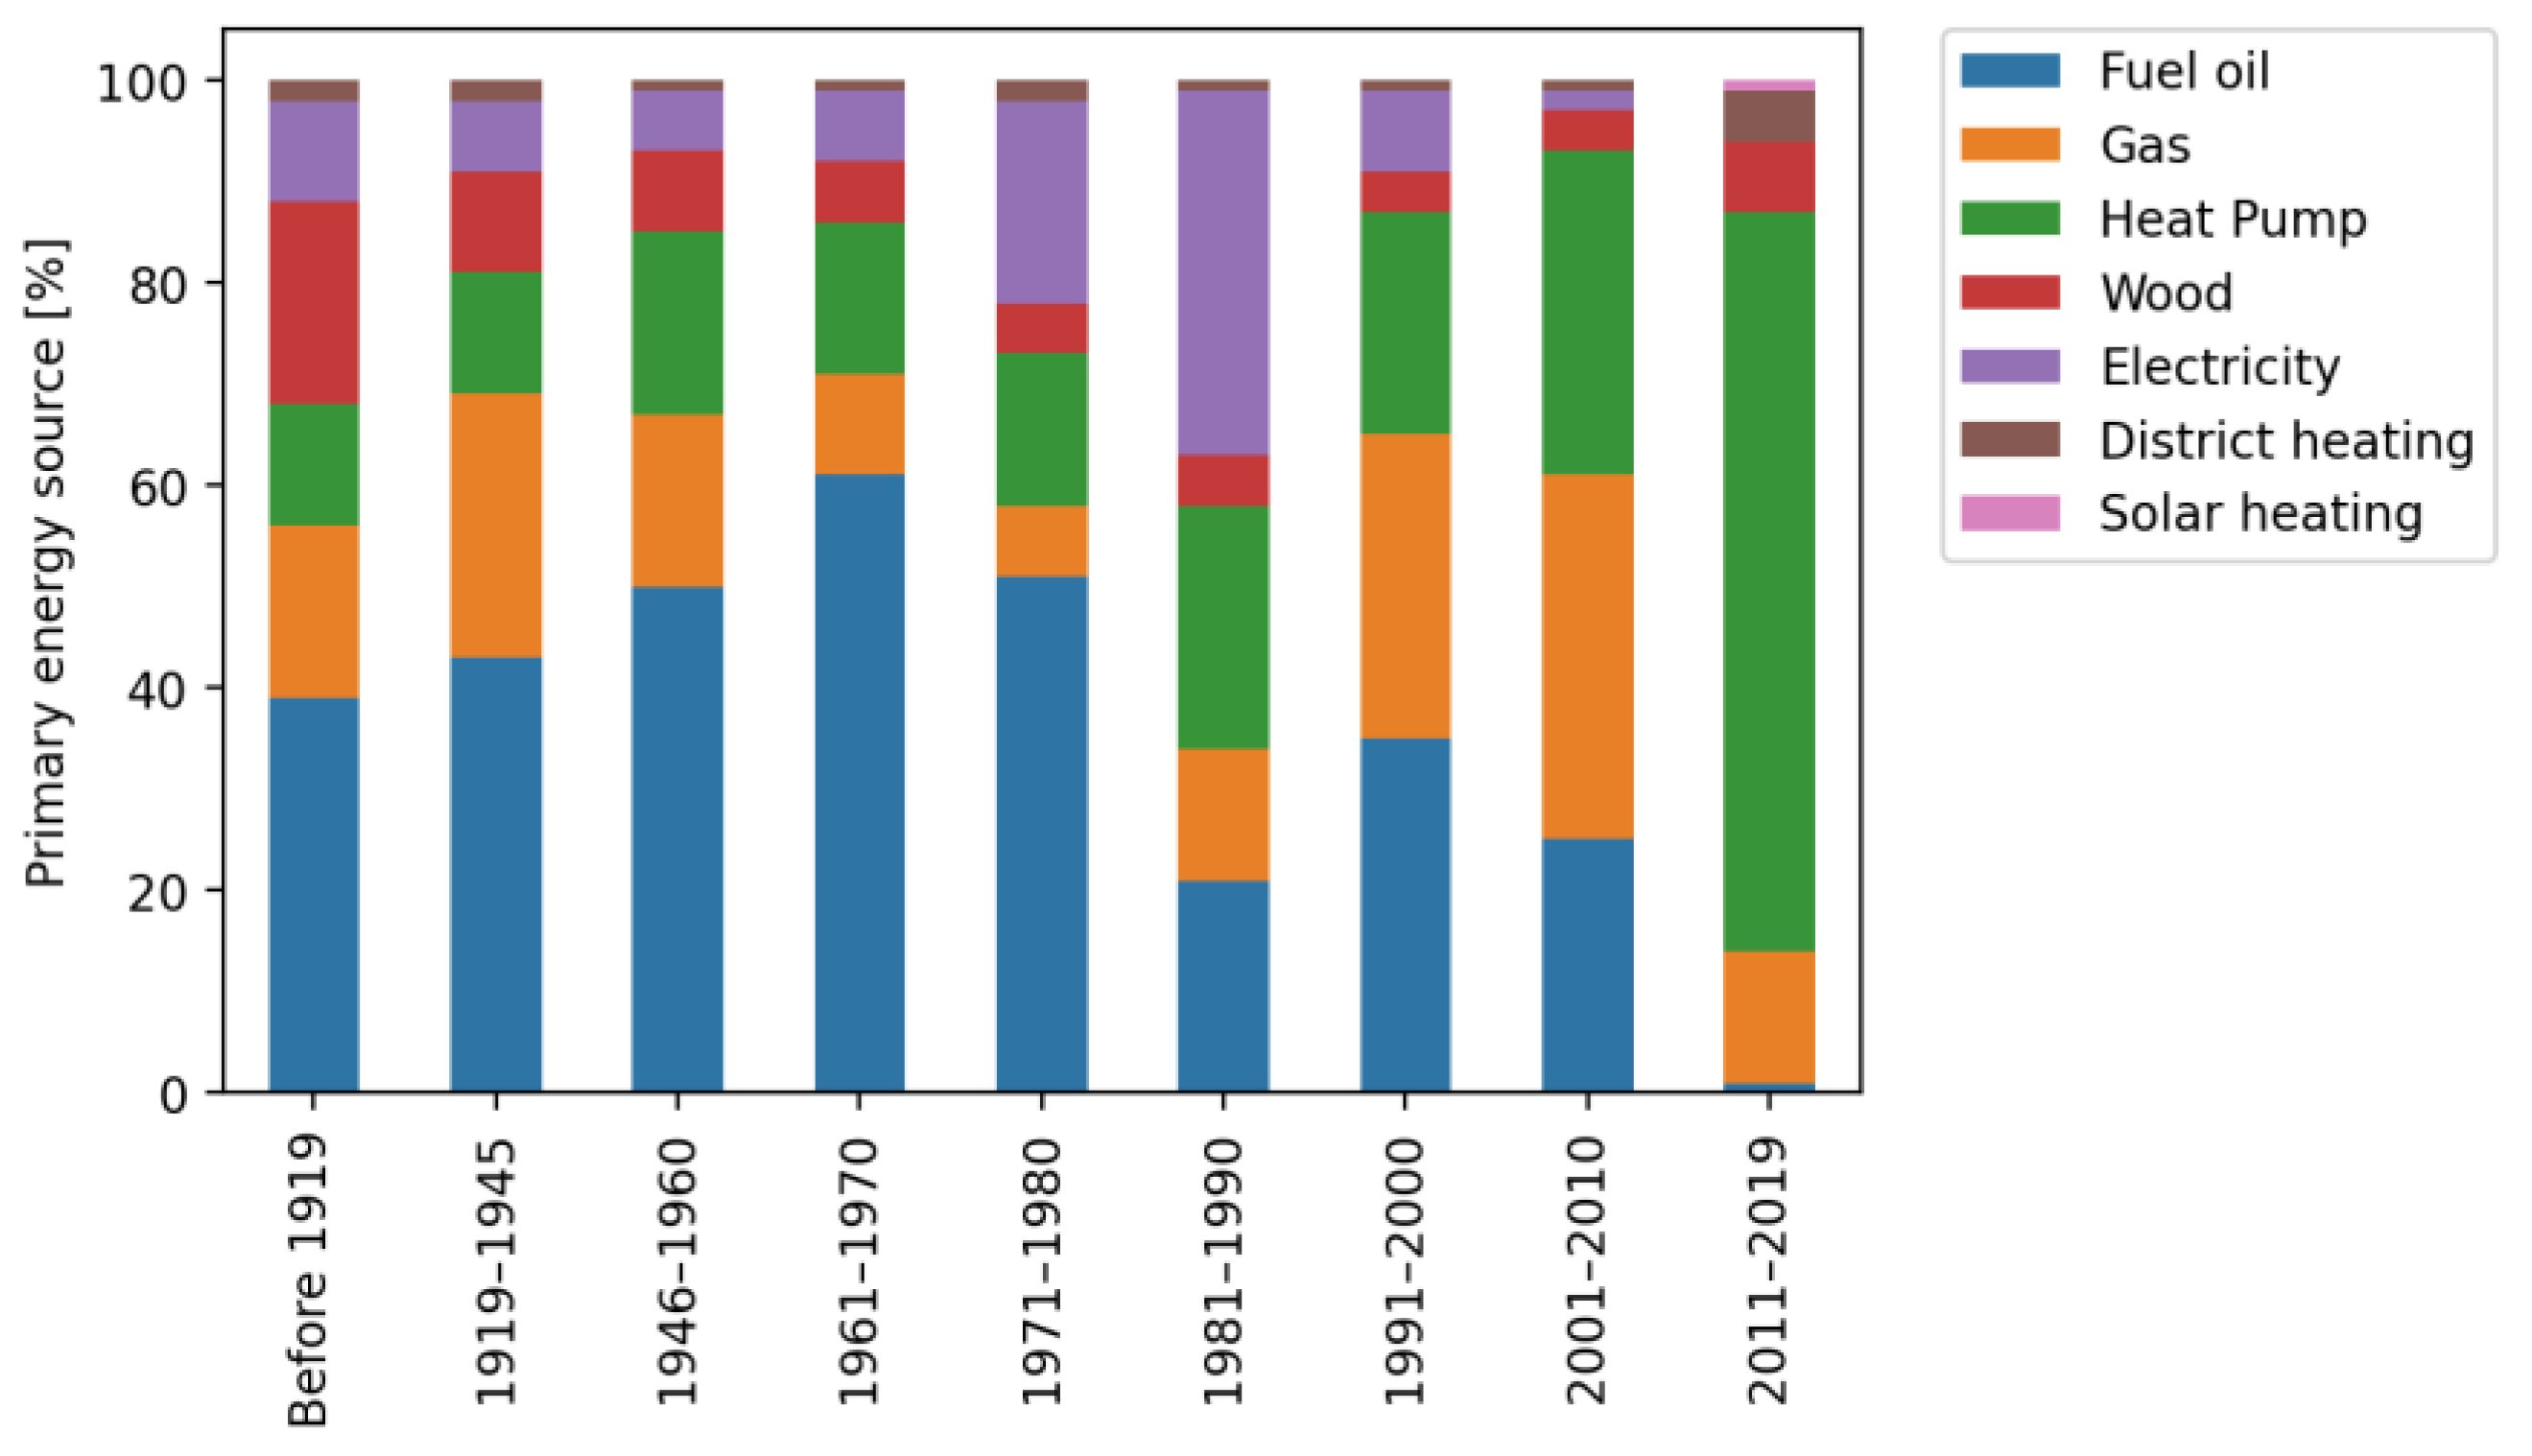
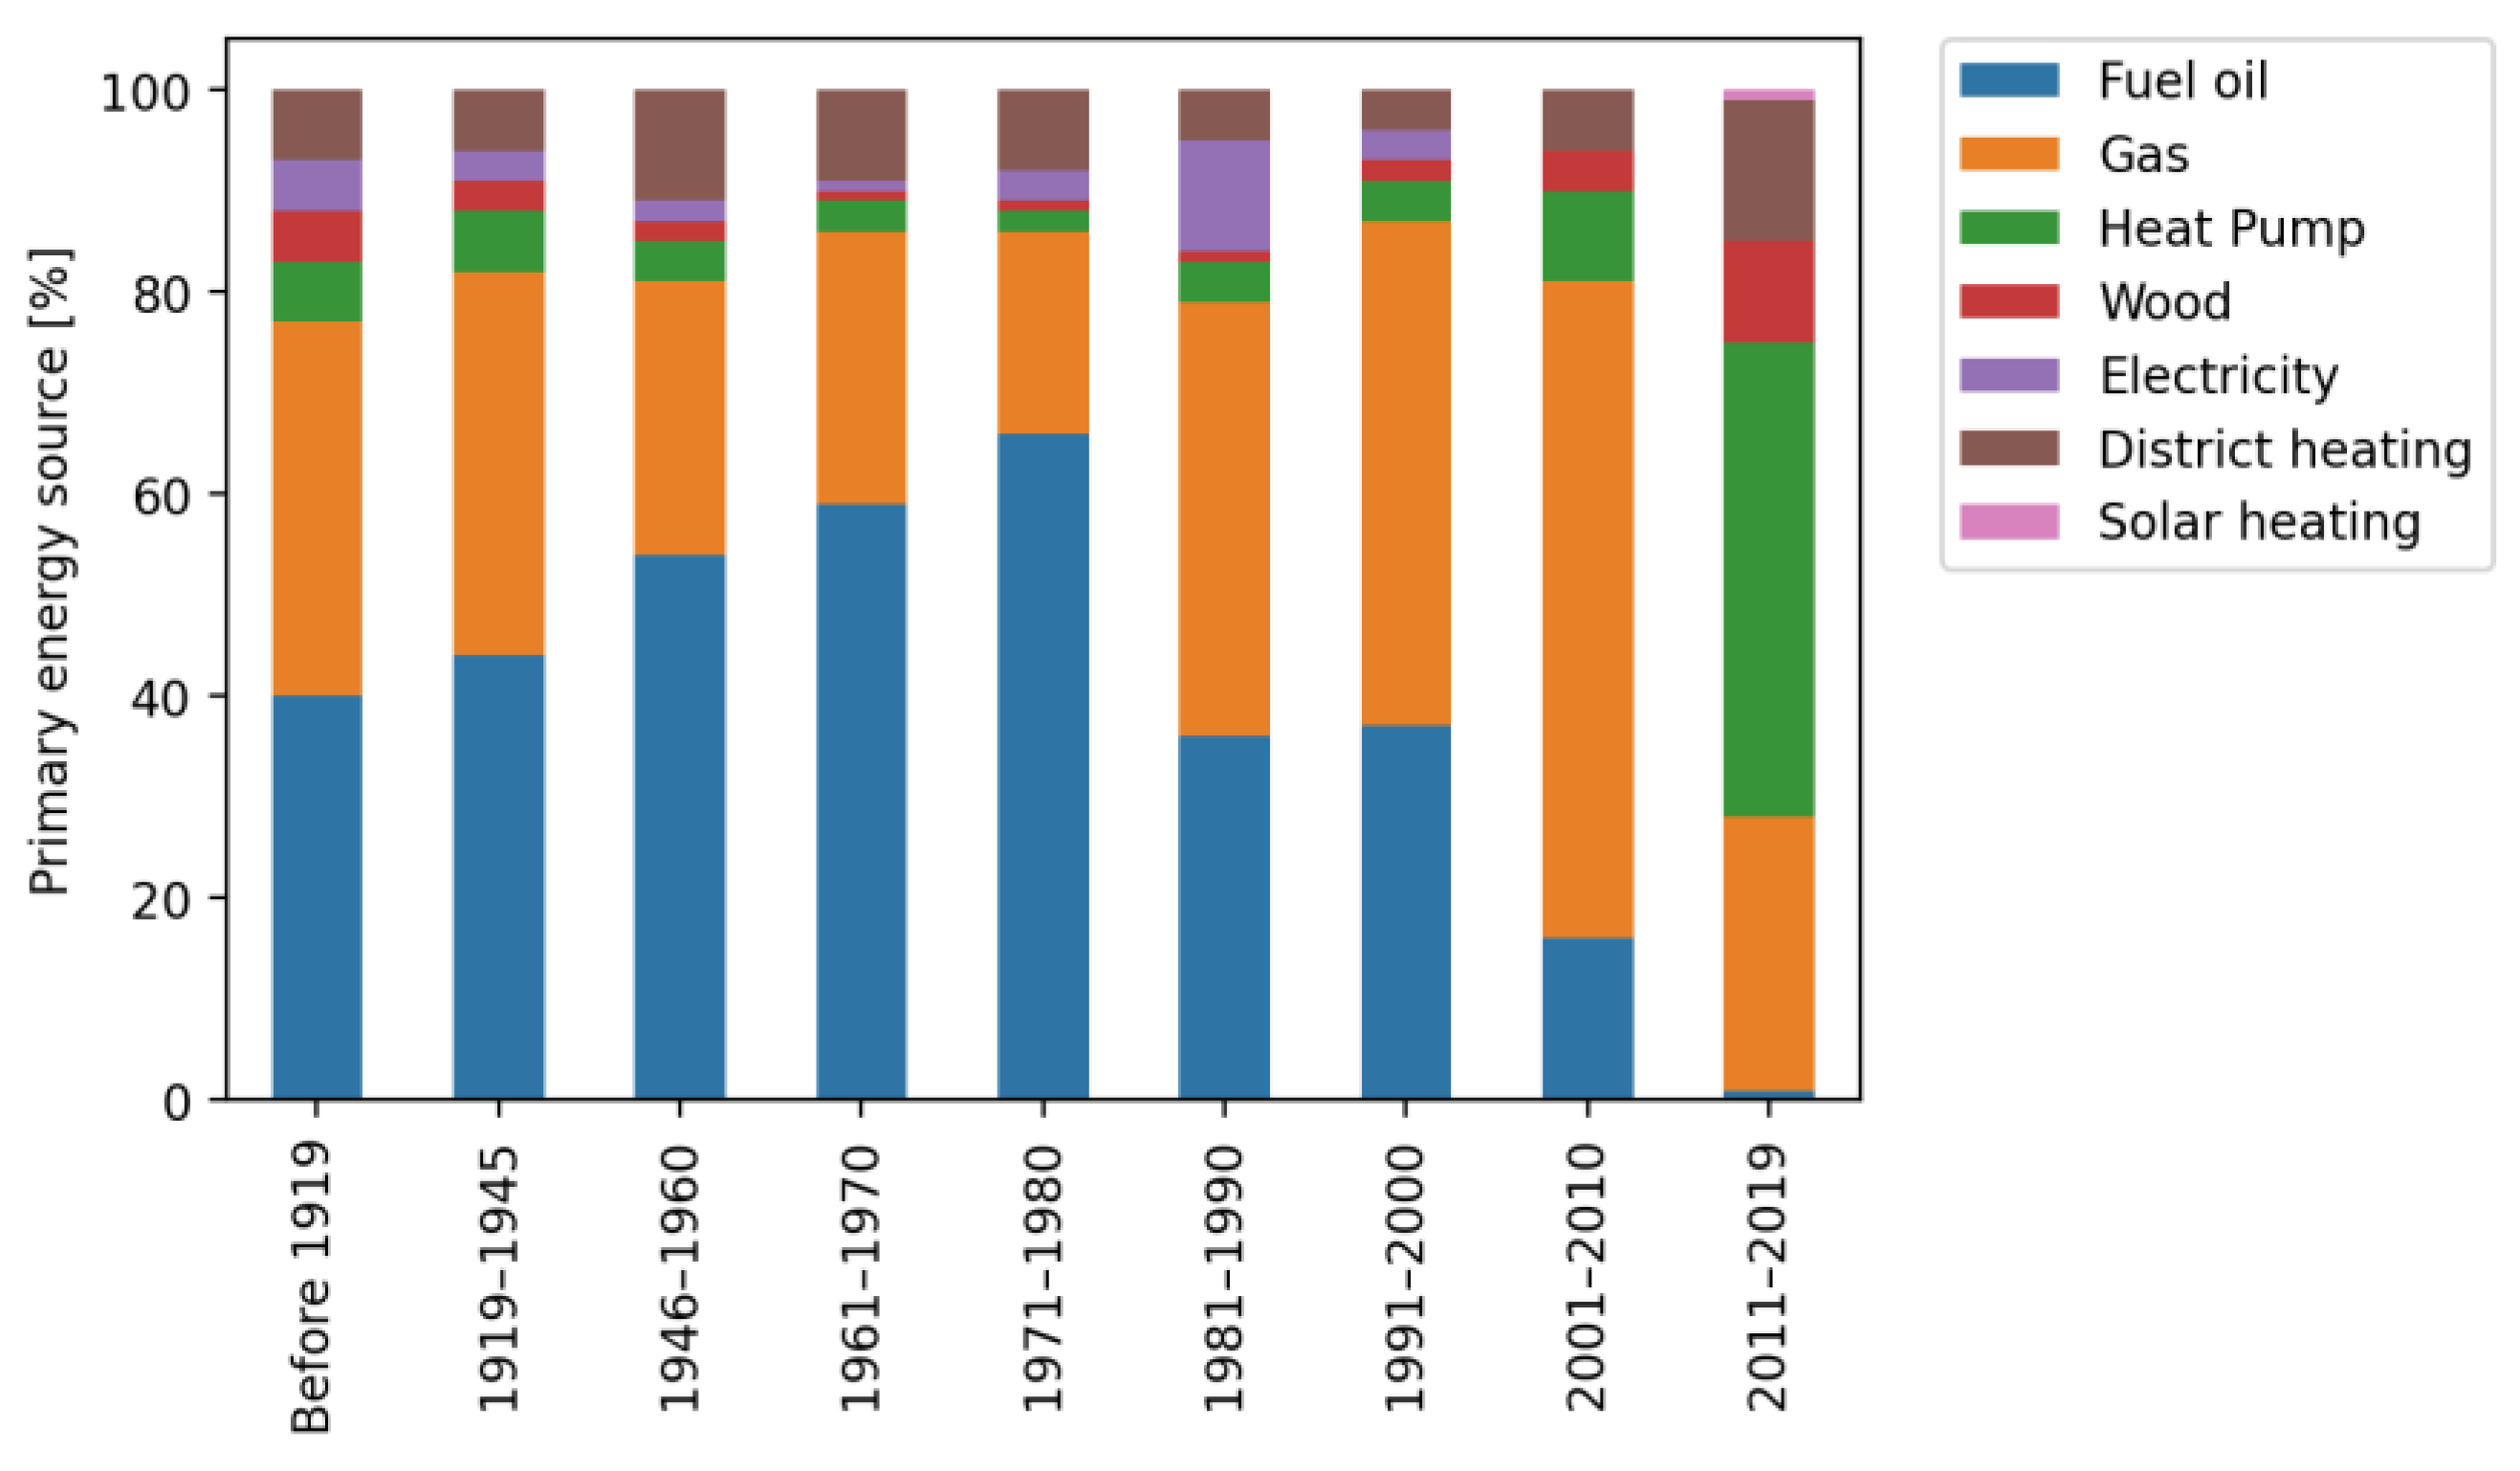
The dataset has been used in previous research [7,8,9,10] and its representativity in regard to the whole building stock has been demonstrated by comparison with the data from the Federal Statistical Office [1]. For example, the distribution of primary energy sources by period of construction for single-family houses (Figure 1) and multi-family houses (Figure 2) can be compared with the one published by the Federal Statistical Office on its website (https://www.bfs.admin.ch/bfs/fr/home/statistiques/construction-logement/batiments/domaine-energetique.html (accessed on 23 December 2021).
The existing literature using the dataset focuses on the following main aspects:
However, information about all energy-related parameters per building archetype is not yet available. The existing literature demonstrates the need for the overall characterization of the building stock in energy-related analysis and this data paper aims at providing the necessary information to conduct further research.
3.2. Data Available and Structure
Raw data from the CECB institution were provided, and the first step to ensure that the data are anonymized was performed in accordance with privacy requirements. The data received were in an Excel format divided into different sheets which include various data collected during the preparation of certificates. Each sheet represents an extraction made from the database. The first extraction of data, dated March 2019, was carried out for everything concerning the surfaces that make up the buildings, i.e., U-values, surfaces, and orientation. The second extraction, also dated March 2019, includes all the energy data of the needs broken down by energy agents and types of use. The third extraction, dated May 2020, includes all the general data of the building, as well as the energy label awarded.
3.3. Data Collection and “Cleaning Up”
As a first step, an aggregation of the three extractions mentioned in Section 3.2 was performed using the python library Pandas (Version: 1.2.2) [11]. This aggregation is based on the unique EGID number of each building so that the data can be linked between the various sheets. Where there were several variants of extracted data for each certificate, it was decided to take the most recent variant into account. This implies that there are values of renovated buildings in the statistics even if their date of construction was before the renovation itself, to have a consistent stock of buildings by date of construction.
Some inconsistencies and missing or false data were identified in the original dataset, and pre-processing of the data was therefore needed. In order to manage and aggregate certain types of data, the NumPy library (Version: 1.20.1) was used [12]. The following steps were conducted:
- Selection of certificates that referred to single-family houses and multi-family houses by eliminating all other certificates.
- Values less than 0 were removed from the entire dataset as all fields cannot have negative values.
- Subsets were generated according to affectation and according to the period of construction of the building, shown in Table 1.
- For each subset, all values that did not meet a z-score of 3 were eliminated; this means that all values that did not exceed the mean value by more than 3 standard deviations were kept. Importantly, it was considered that an aberrant value does not imply that the other data entered in the certificate are wrong, and therefore, it was decided to keep the whole certificate by removing only the single value from the statistics.
- The data were then aggregated in the form of statistics by extracting the value of the 25th percentile, the median, and the 75th percentile. For the two categories of Final energy for heating and Final energy for domestic hot water, it was decided to create a graphic representation by means of boxes and whiskers, providing a more visual idea of the two categories. This representation was created thanks to the Matplotlib library (Version: 3.5.1) [13].
- All the statistics were then merged into pdf sheets using the ReportLab library (Version: 3.6.7) [14].
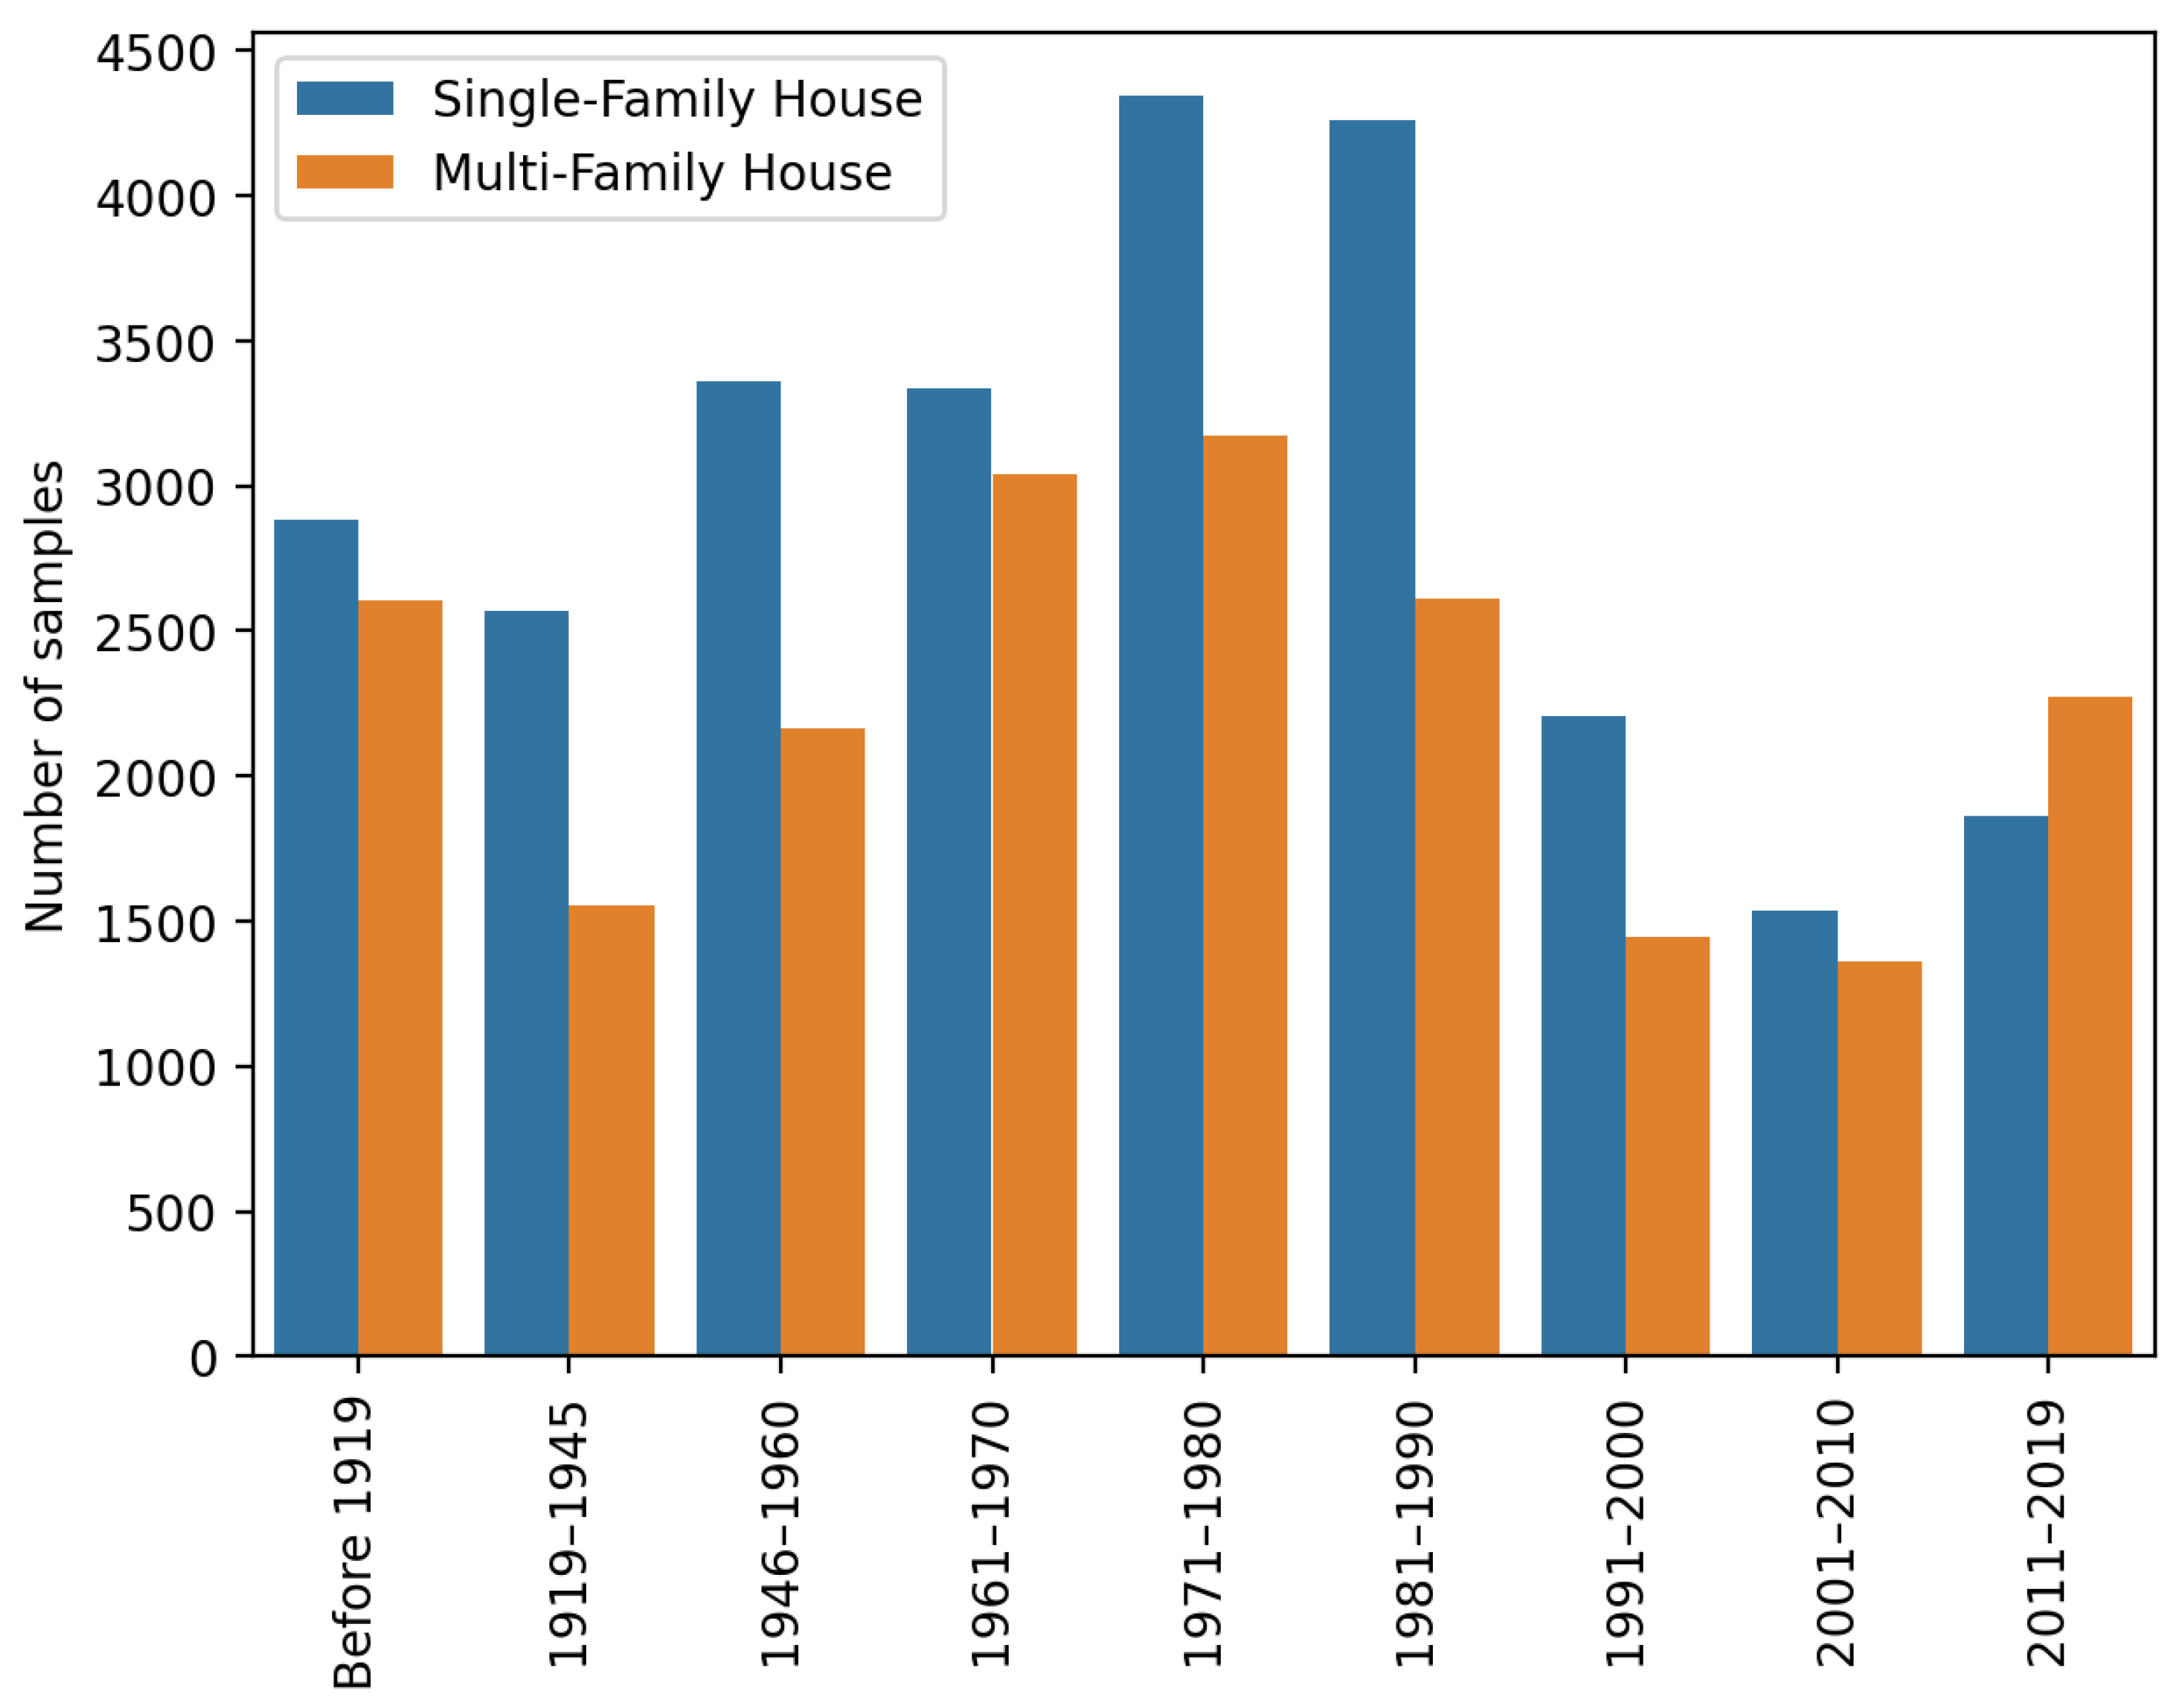
After the cleaning process, it is possible to see, in Figure 3, the breakdown of samples for each period and for the two building typologies. It shows in which period there are more certificates and that the least represented period still has slightly more than 1300 certificates. The reduced number of certificates in newer buildings can be explained by the nature of the certification that is mainly applied to identify renovation measures.
3.4. Building Properties Relevance
A selection and/or clustering of the available parameters was conducted to extract the most relevant and usable data. For this purpose, the priority was given to characteristics needed during energy simulations. The accuracy of such energy simulations heavily depends on the input data [15,16,17], but the availability and accuracy of data, especially in the large-scale/building stock level, are a challenge [15]. The extracted data in this work focus on the following building characteristics:
- Building geometry: Energy reference area; Number of floors; Envelope factor; Floors height;
- Thermal properties and size of envelope elements: surfaces and U-values;
- Heating fuel.
Furthermore, to adequately estimate energy demand for existing buildings with energy simulation tools, input parameters must be calibrated with existing data. For this reason, the extracted data in this work present the total final energy demand for heating and domestic hot water.
3.5. Grouping and Clustering
Grouping and clustering of the dataset was necessary to have a manageable number of end archetypes from the approximately 50,000 buildings present in the initial data. Grouping and clustering techniques are commonly applied to study building energy demands for regional or national scales and to identify representative buildings, or archetypes [18]. Grouping by building type and building age was identified in the literature as a key driver for energy demand [18,19]. Other drivers also identified to be relevant, such as climate, were not included as a grouping parameter in this work, as the distribution of the dataset did not allow it (overrepresentation of buildings from some specific cantons). The building type was already limited to residential use, as described in a previous step, but the dataset is then clustered into single-family houses and multi-family houses. These two types differ substantially in size, occupancy profiles, and overall construction details and were therefore used as two different archetypes.
Building age is often closely linked to energy performance of buildings [20] and usually depicts major economic, regulatory and social changes in the construction techniques. Slightly different clustering structures but similar in logic are used in the literature [20,21]. Finally, the clustering according to the Federal Statistical Office was retained, and Table 1 presents the main reasoning.
4. User Note
The data provided are valuable for further studies in building energy efficiency studies, energy simulations, and stock renewal strategies. Building energy sufficiency studies requires reliable data on the patterns of inefficiency such as the construction type in relation to energy needs or U-values to energy needs. This paper is flexible in its use and patterns, and trends can further be extracted from the data. Building energy simulations also require a high level of detail in the input data given. Often while modeling existing buildings, data are scarcely available, and archetypes can complement the missing values by giving reliable inputs based on the age and the type of the building studied. Furthermore, energy simulations of existing buildings can strongly benefit from calibration datasets. For this reason, data on energy demand of buildings based on age and typology can help the process of adjustment and validation of models based on real data of building performance. Finally, the data provide sufficient information on the characterization of the whole residential building stock. This level of knowledge can benefit strategic studies on renovation strategies to decarbonize the stock.
The data sheets provide a preprocessed data visualization and organization to simplify the process of looking for specific values (for example: the median U-value of walls for a single-family home built between 1991 and 2000). Moreover, the datasheets can be used to perform studies on the development of trends through the years (by analyzing one sheet next to the other) or in-between building typologies (ex: multi-family houses have generally lower energy needs per ERA than single-family houses do). In contrast, the raw data in Excel format allow for a more flexible use of the data by providing the user the freedom to adapt the extraction of data to their needs.
5. Discussion
The data presented in this contribution are in line with existing work and databases available in the European context and in general complement the existing data with the characterization of the Swiss building stock. The TABULA project [22] compiles residential building typologies for 13 European countries based on size, age, and further parameters. In addition, “exemplary buildings” for each building type have been added for showcasing. In comparison to our classification, in addition to single-family houses and multi-family houses, terraced houses and apartment blocks are found in the grouping found in TABULA. The “Building Display Sheets” of the TABULA project showcase a similar list of parameters (surfaces and U-values of building elements, energy category, frequency of building type, etc.). In contrast to our methodology of compiling archetypes, the TABULA project referred to different national partners to develop its own “building typologies” [23] but is not necessarily based on a real database of analyzed existing buildings, as was done in our study. The follow-up project “EPISCOPE” focused on building stock monitoring based on TABULA typologies and tracking energy refurbishment processes. The work and methodology of EPISCOPE could feed further work on the Swiss building stock based on the identified specific archetypes.
The resulting data sheets and excel data are useful tools to provide the often-missing data in energetic studies of existing buildings and to understand the efficiency of the existing stock.
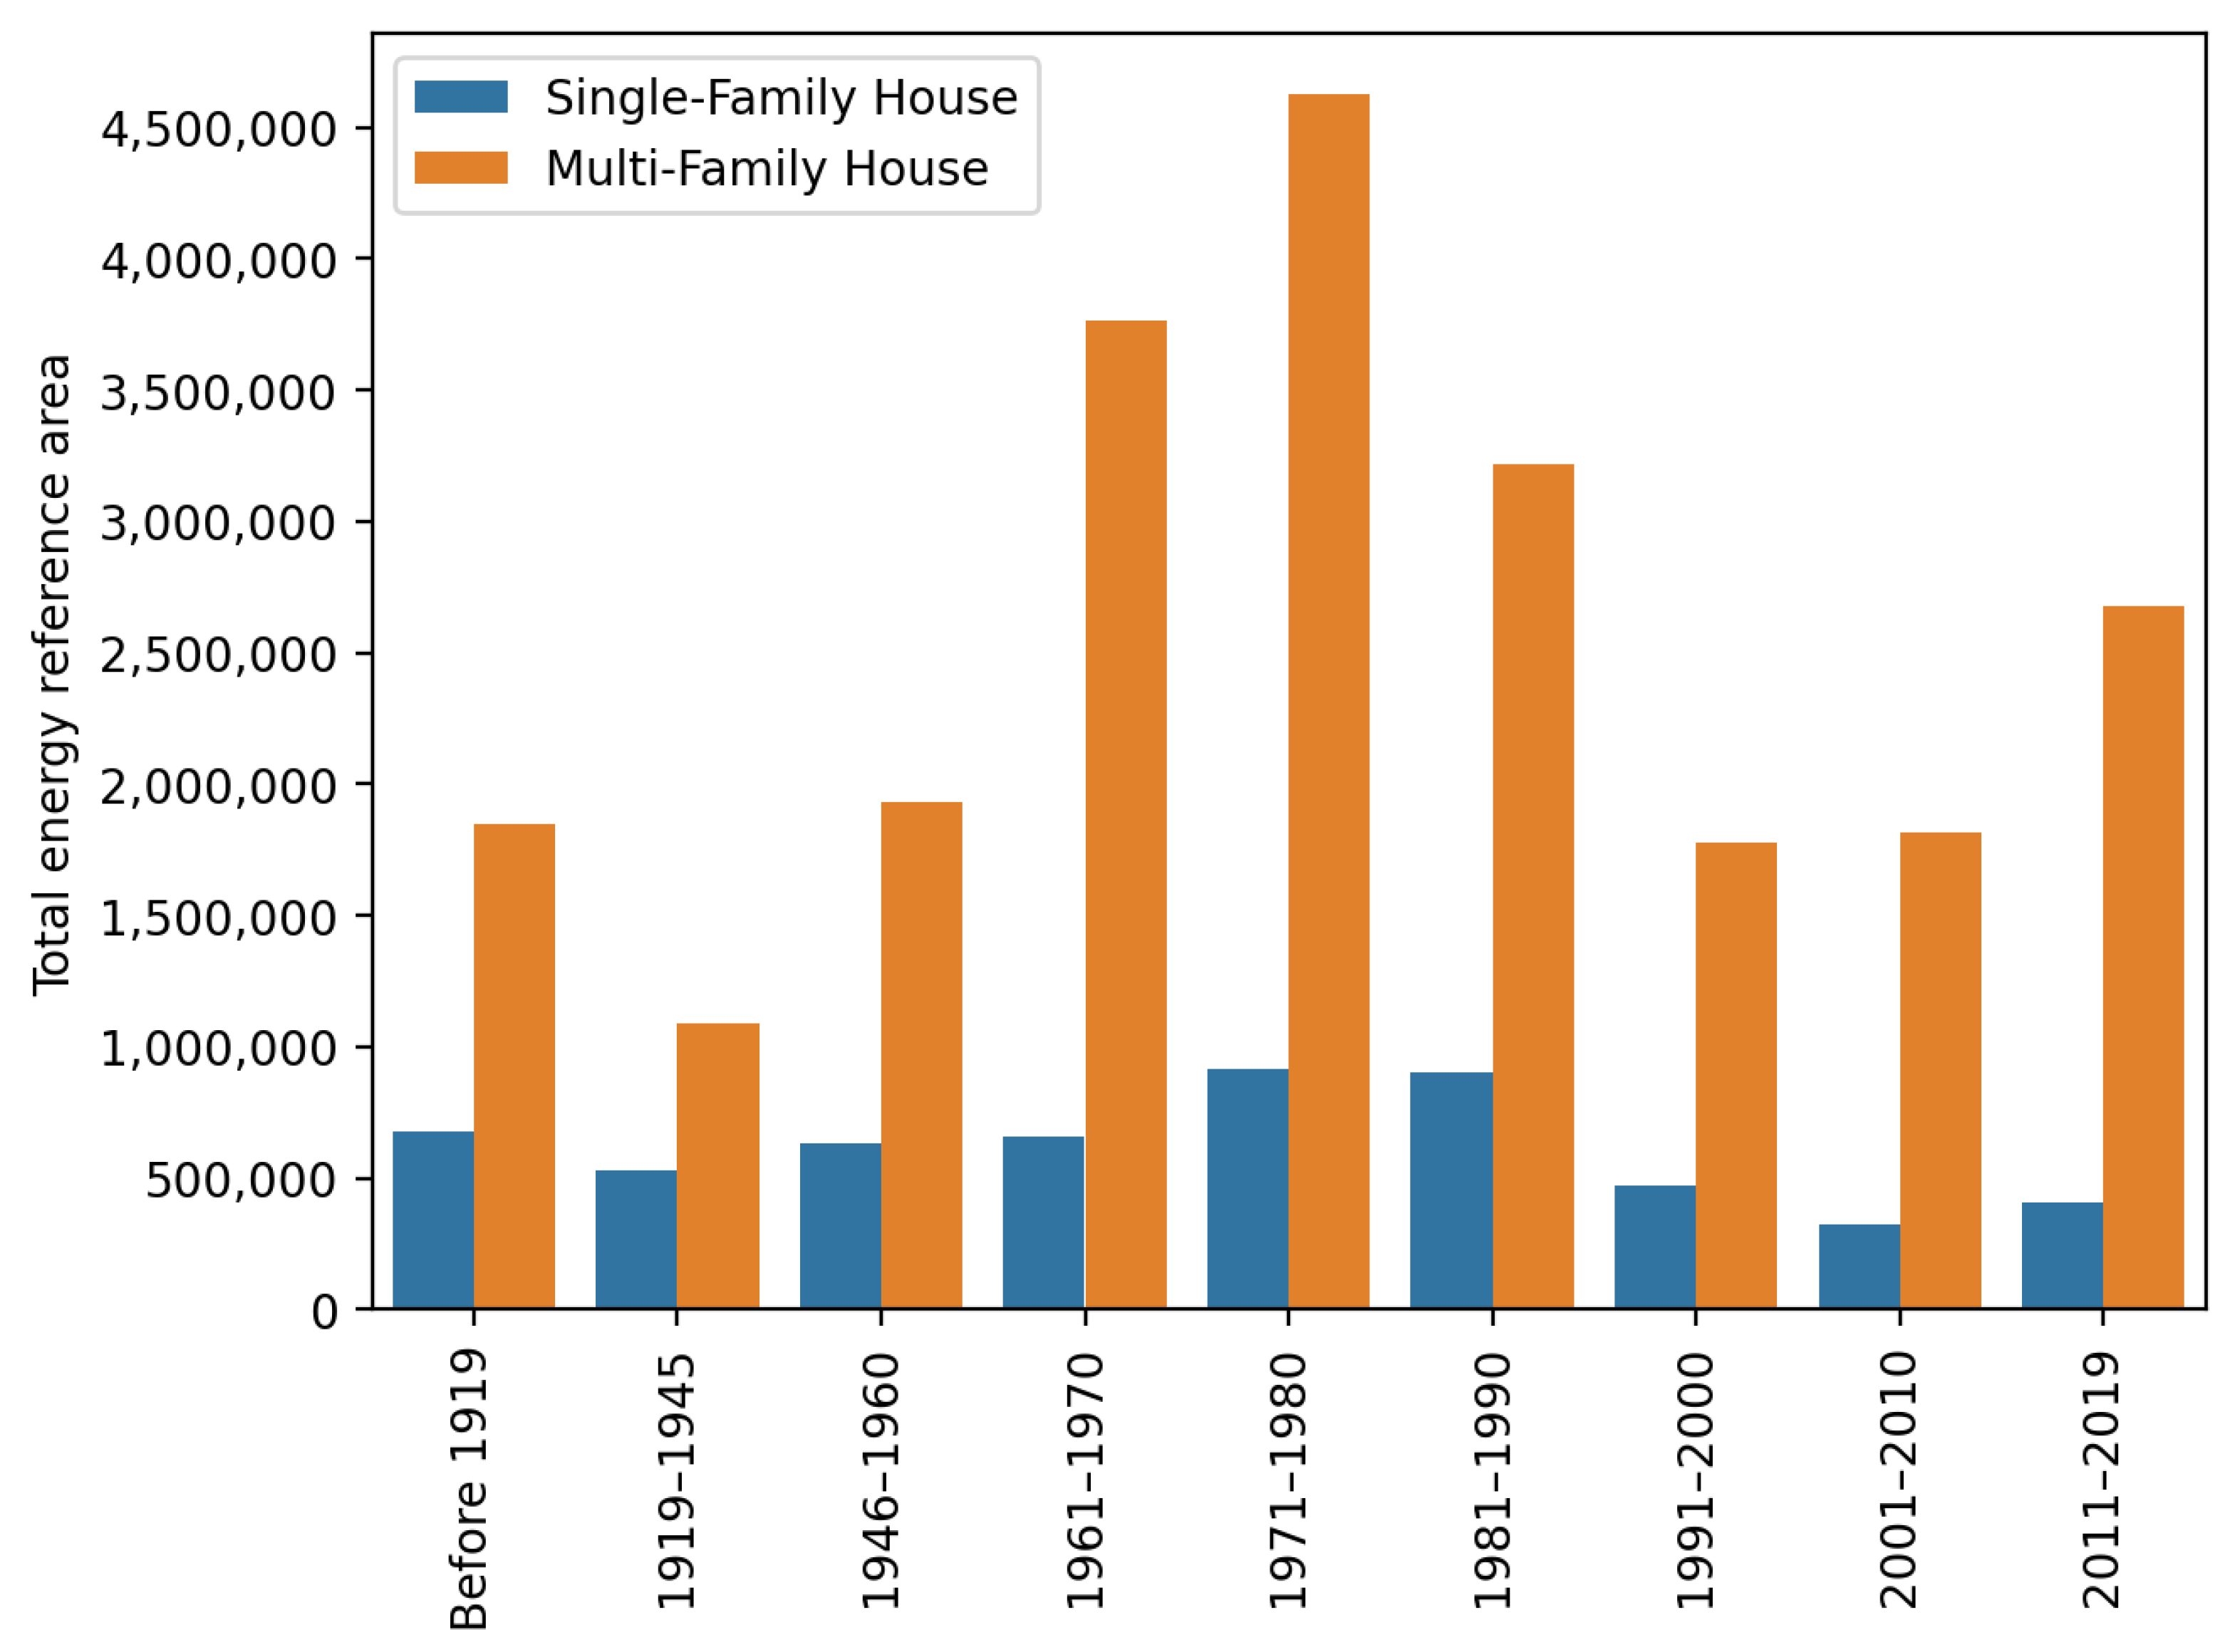
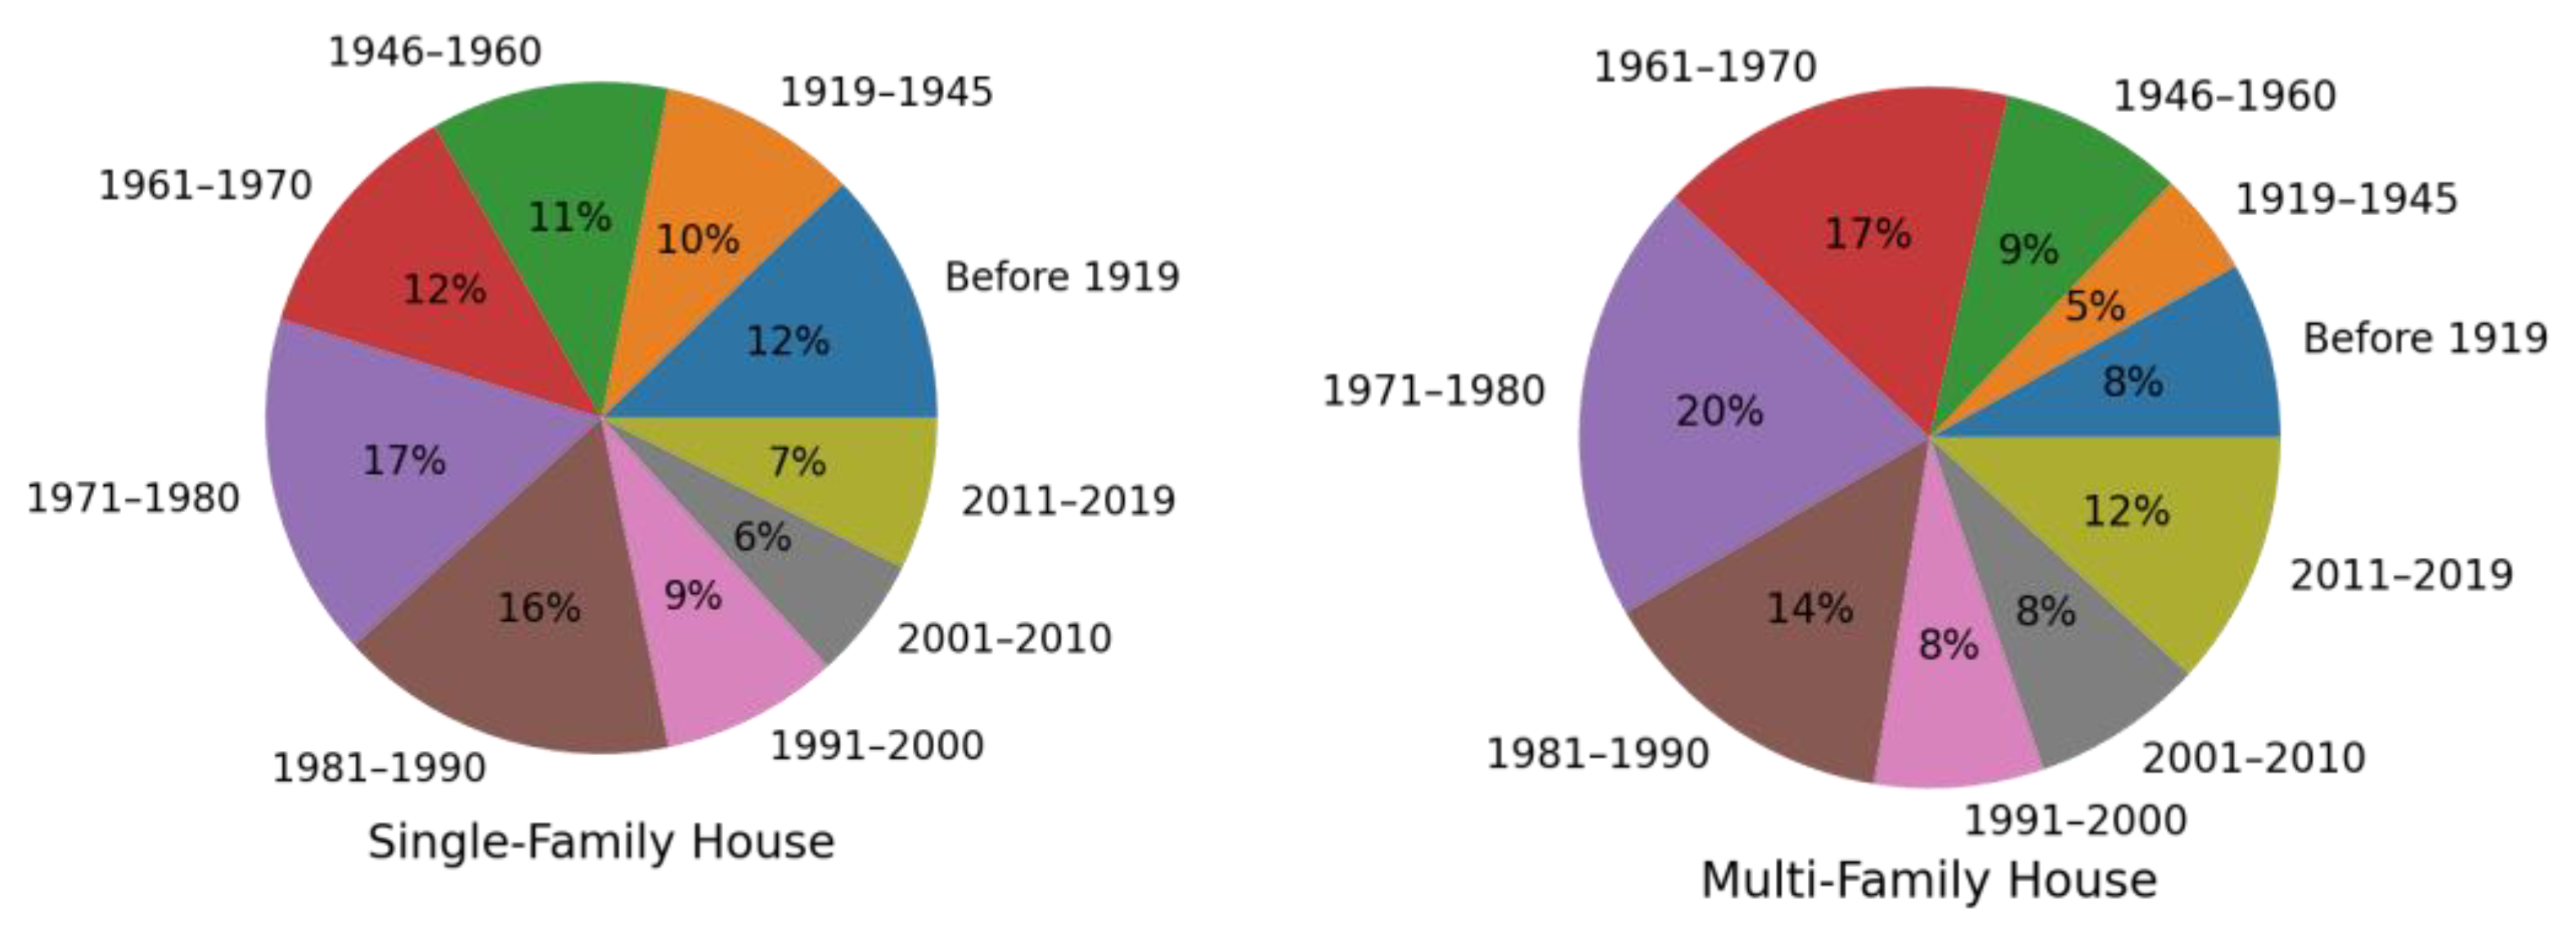
As an example, the energy reference area of each period can be expressed so that it can be compared between the two types of buildings, as shown in Figure 4, or other types of graphs can be used to identify which periods are best represented so that they can be used as targets for projects, as shown in Figure 5.
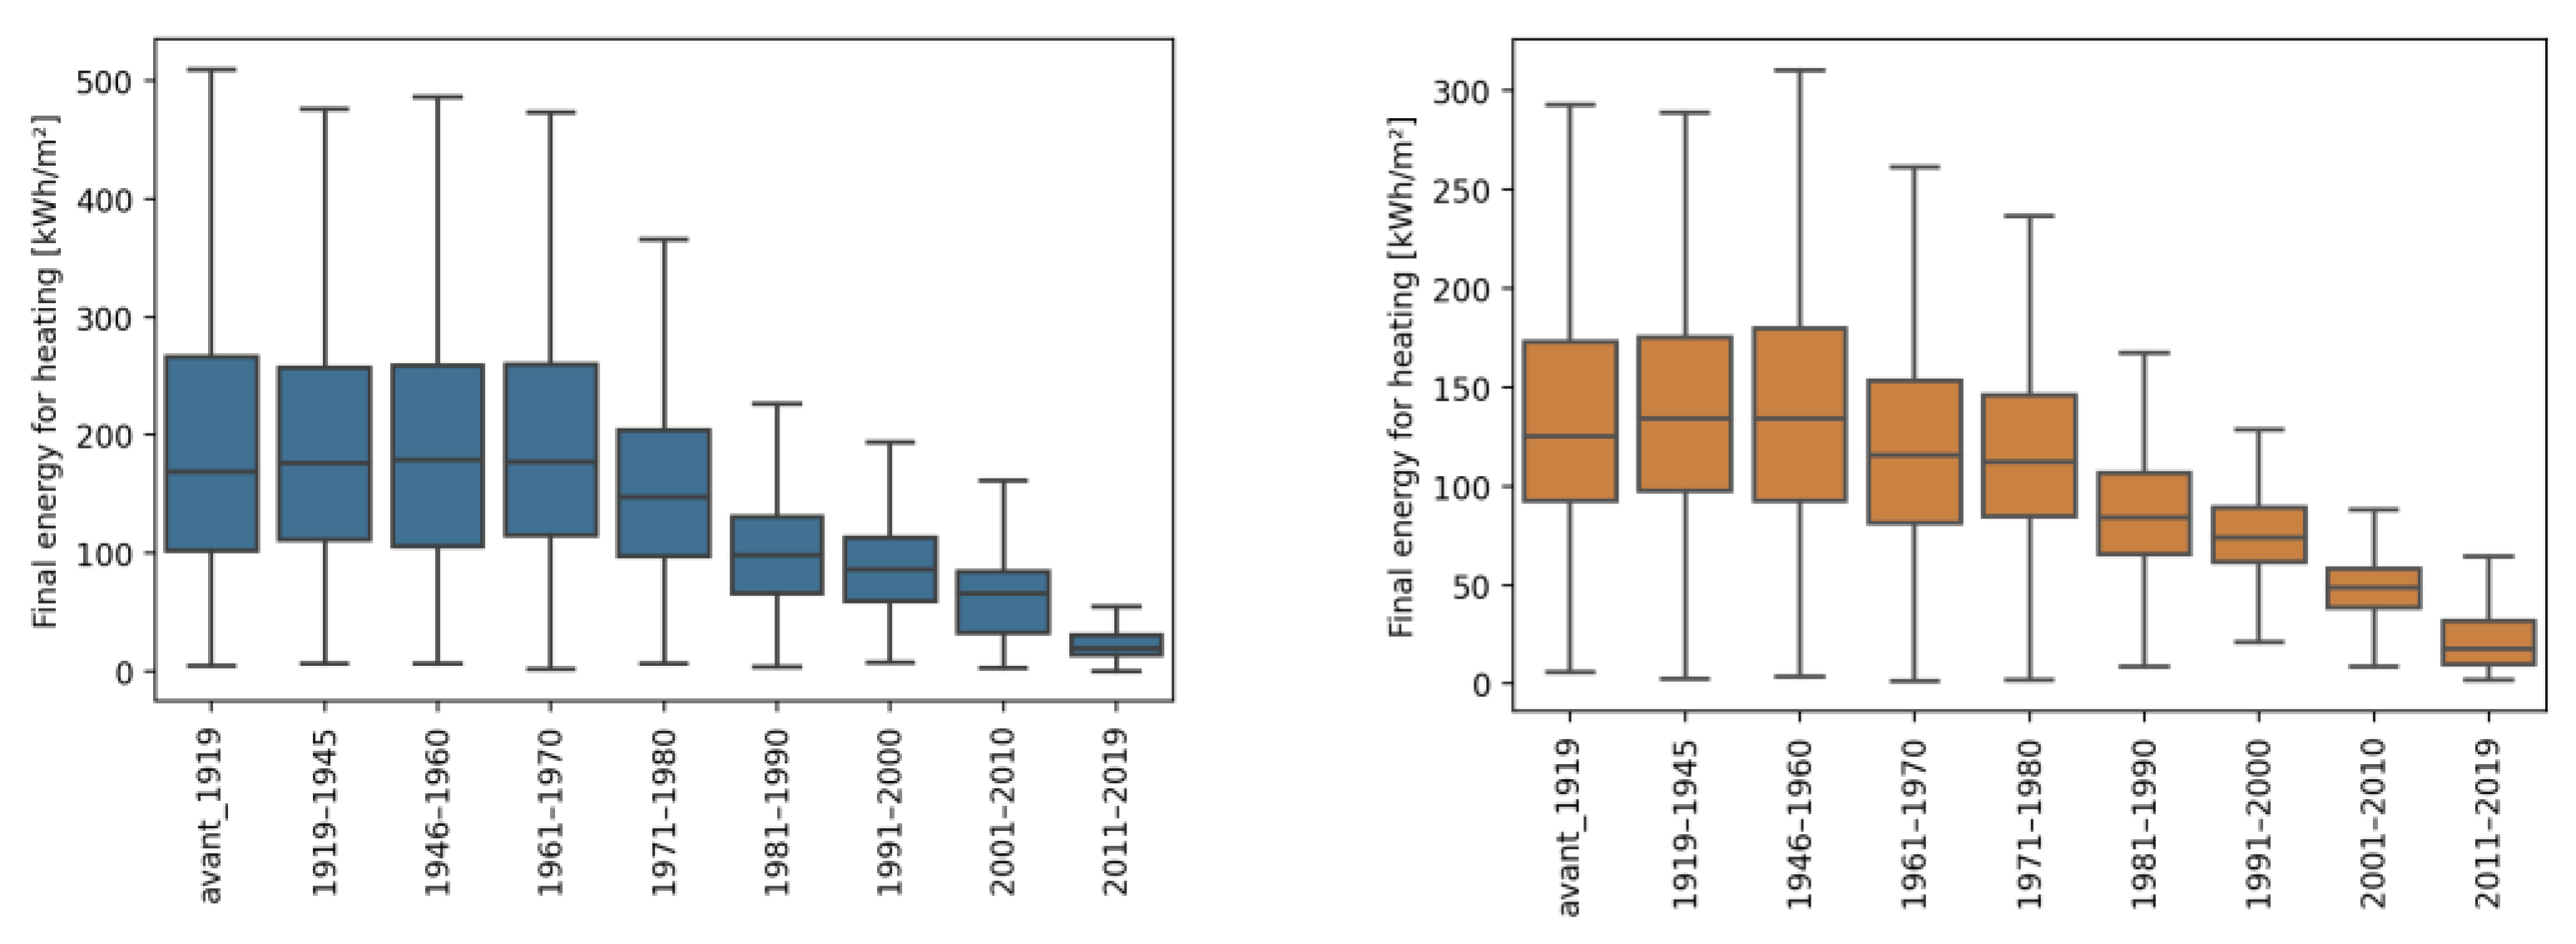
General trends can immediately be identified by quickly scrolling through the different construction periods or the different typologies. For example, energy needs for heating decrease in more recent buildings, as shown in Figure 6, especially after 1980, corresponding to the implementation of new energy laws. Single-family houses have generally higher heating needs than multi-family houses and are usually less compact (envelope factor).
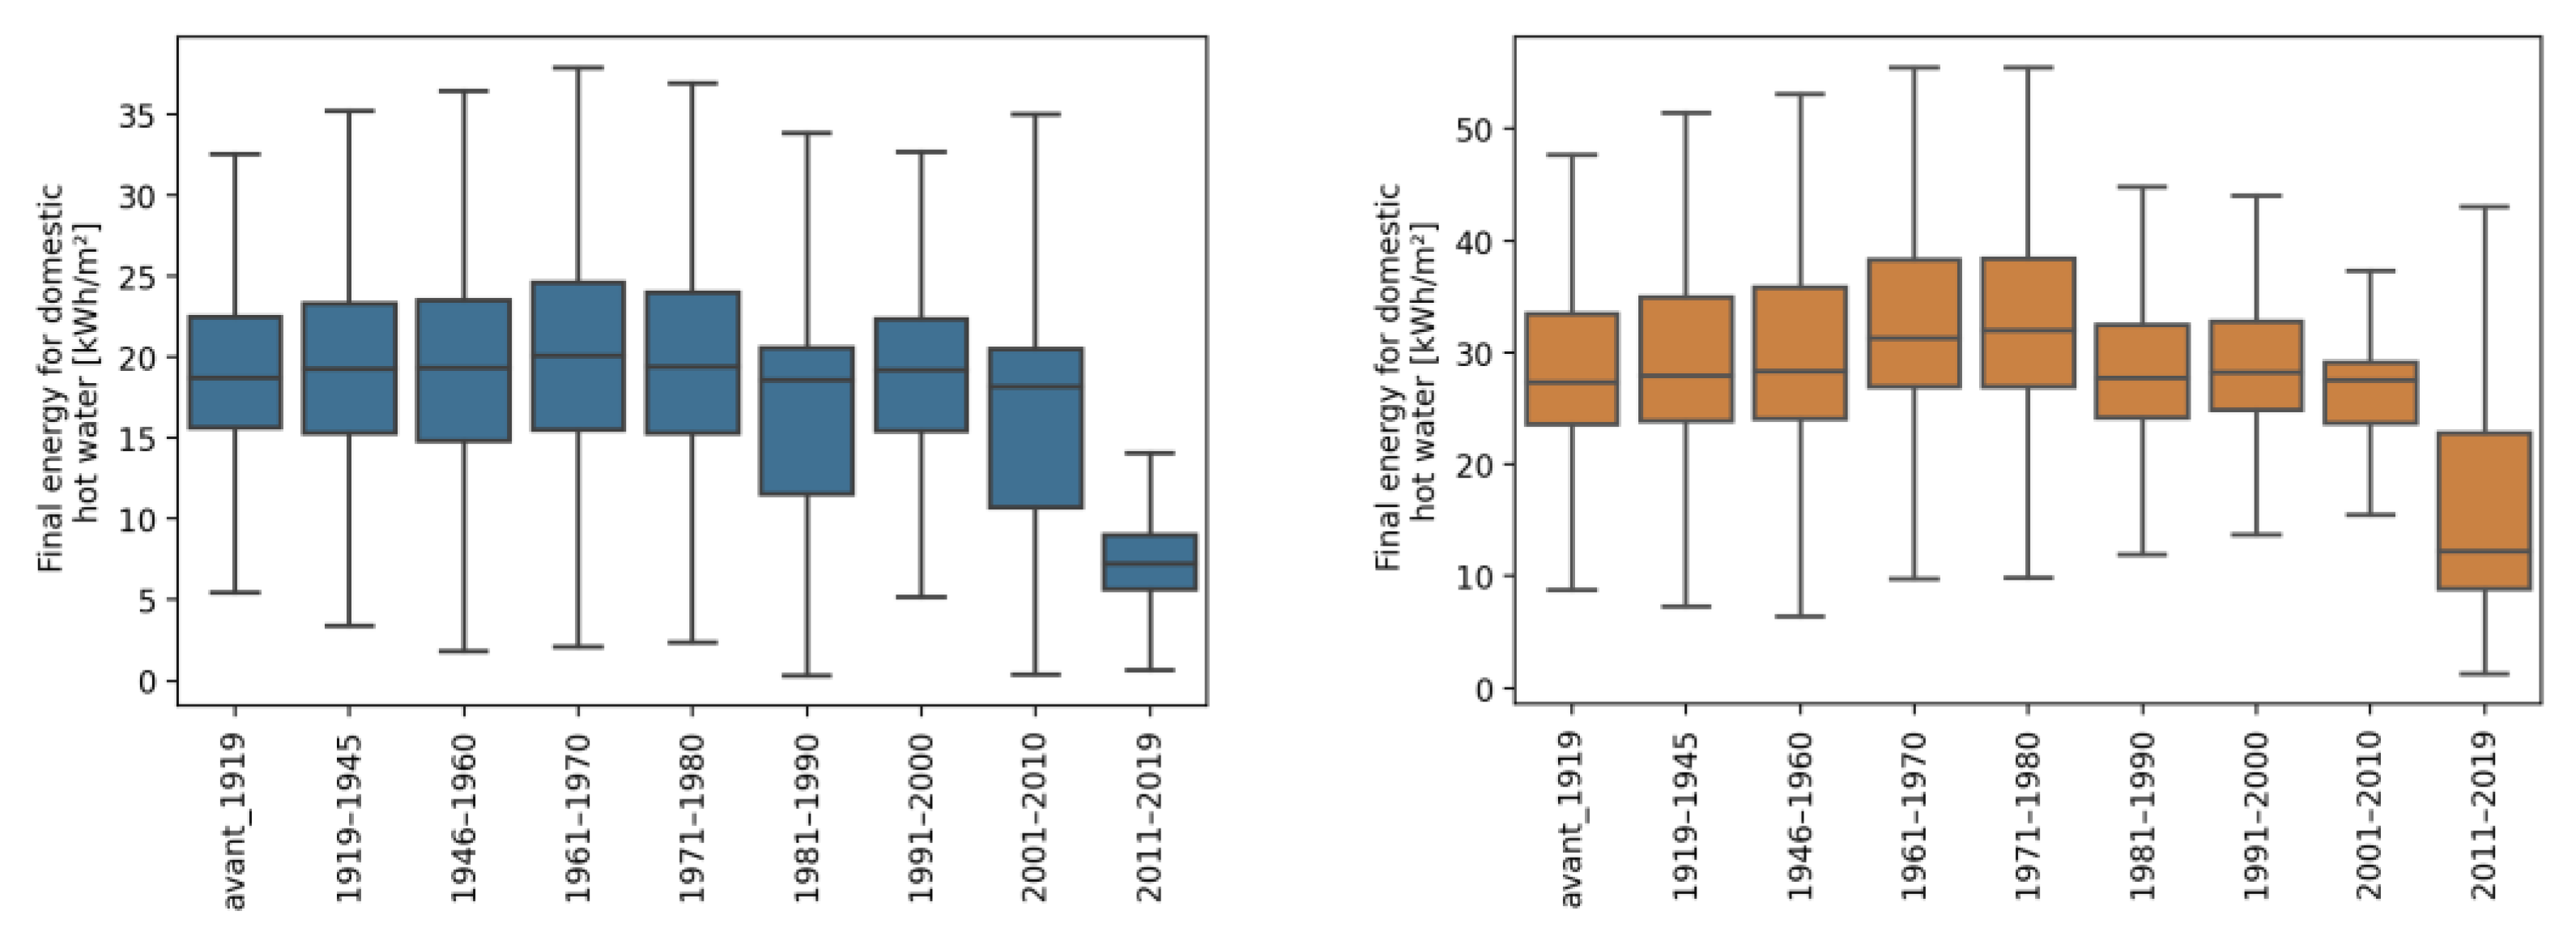
It is also possible to see that the energy needs for hot water stay almost constant until recent years, as shown in Figure 7.
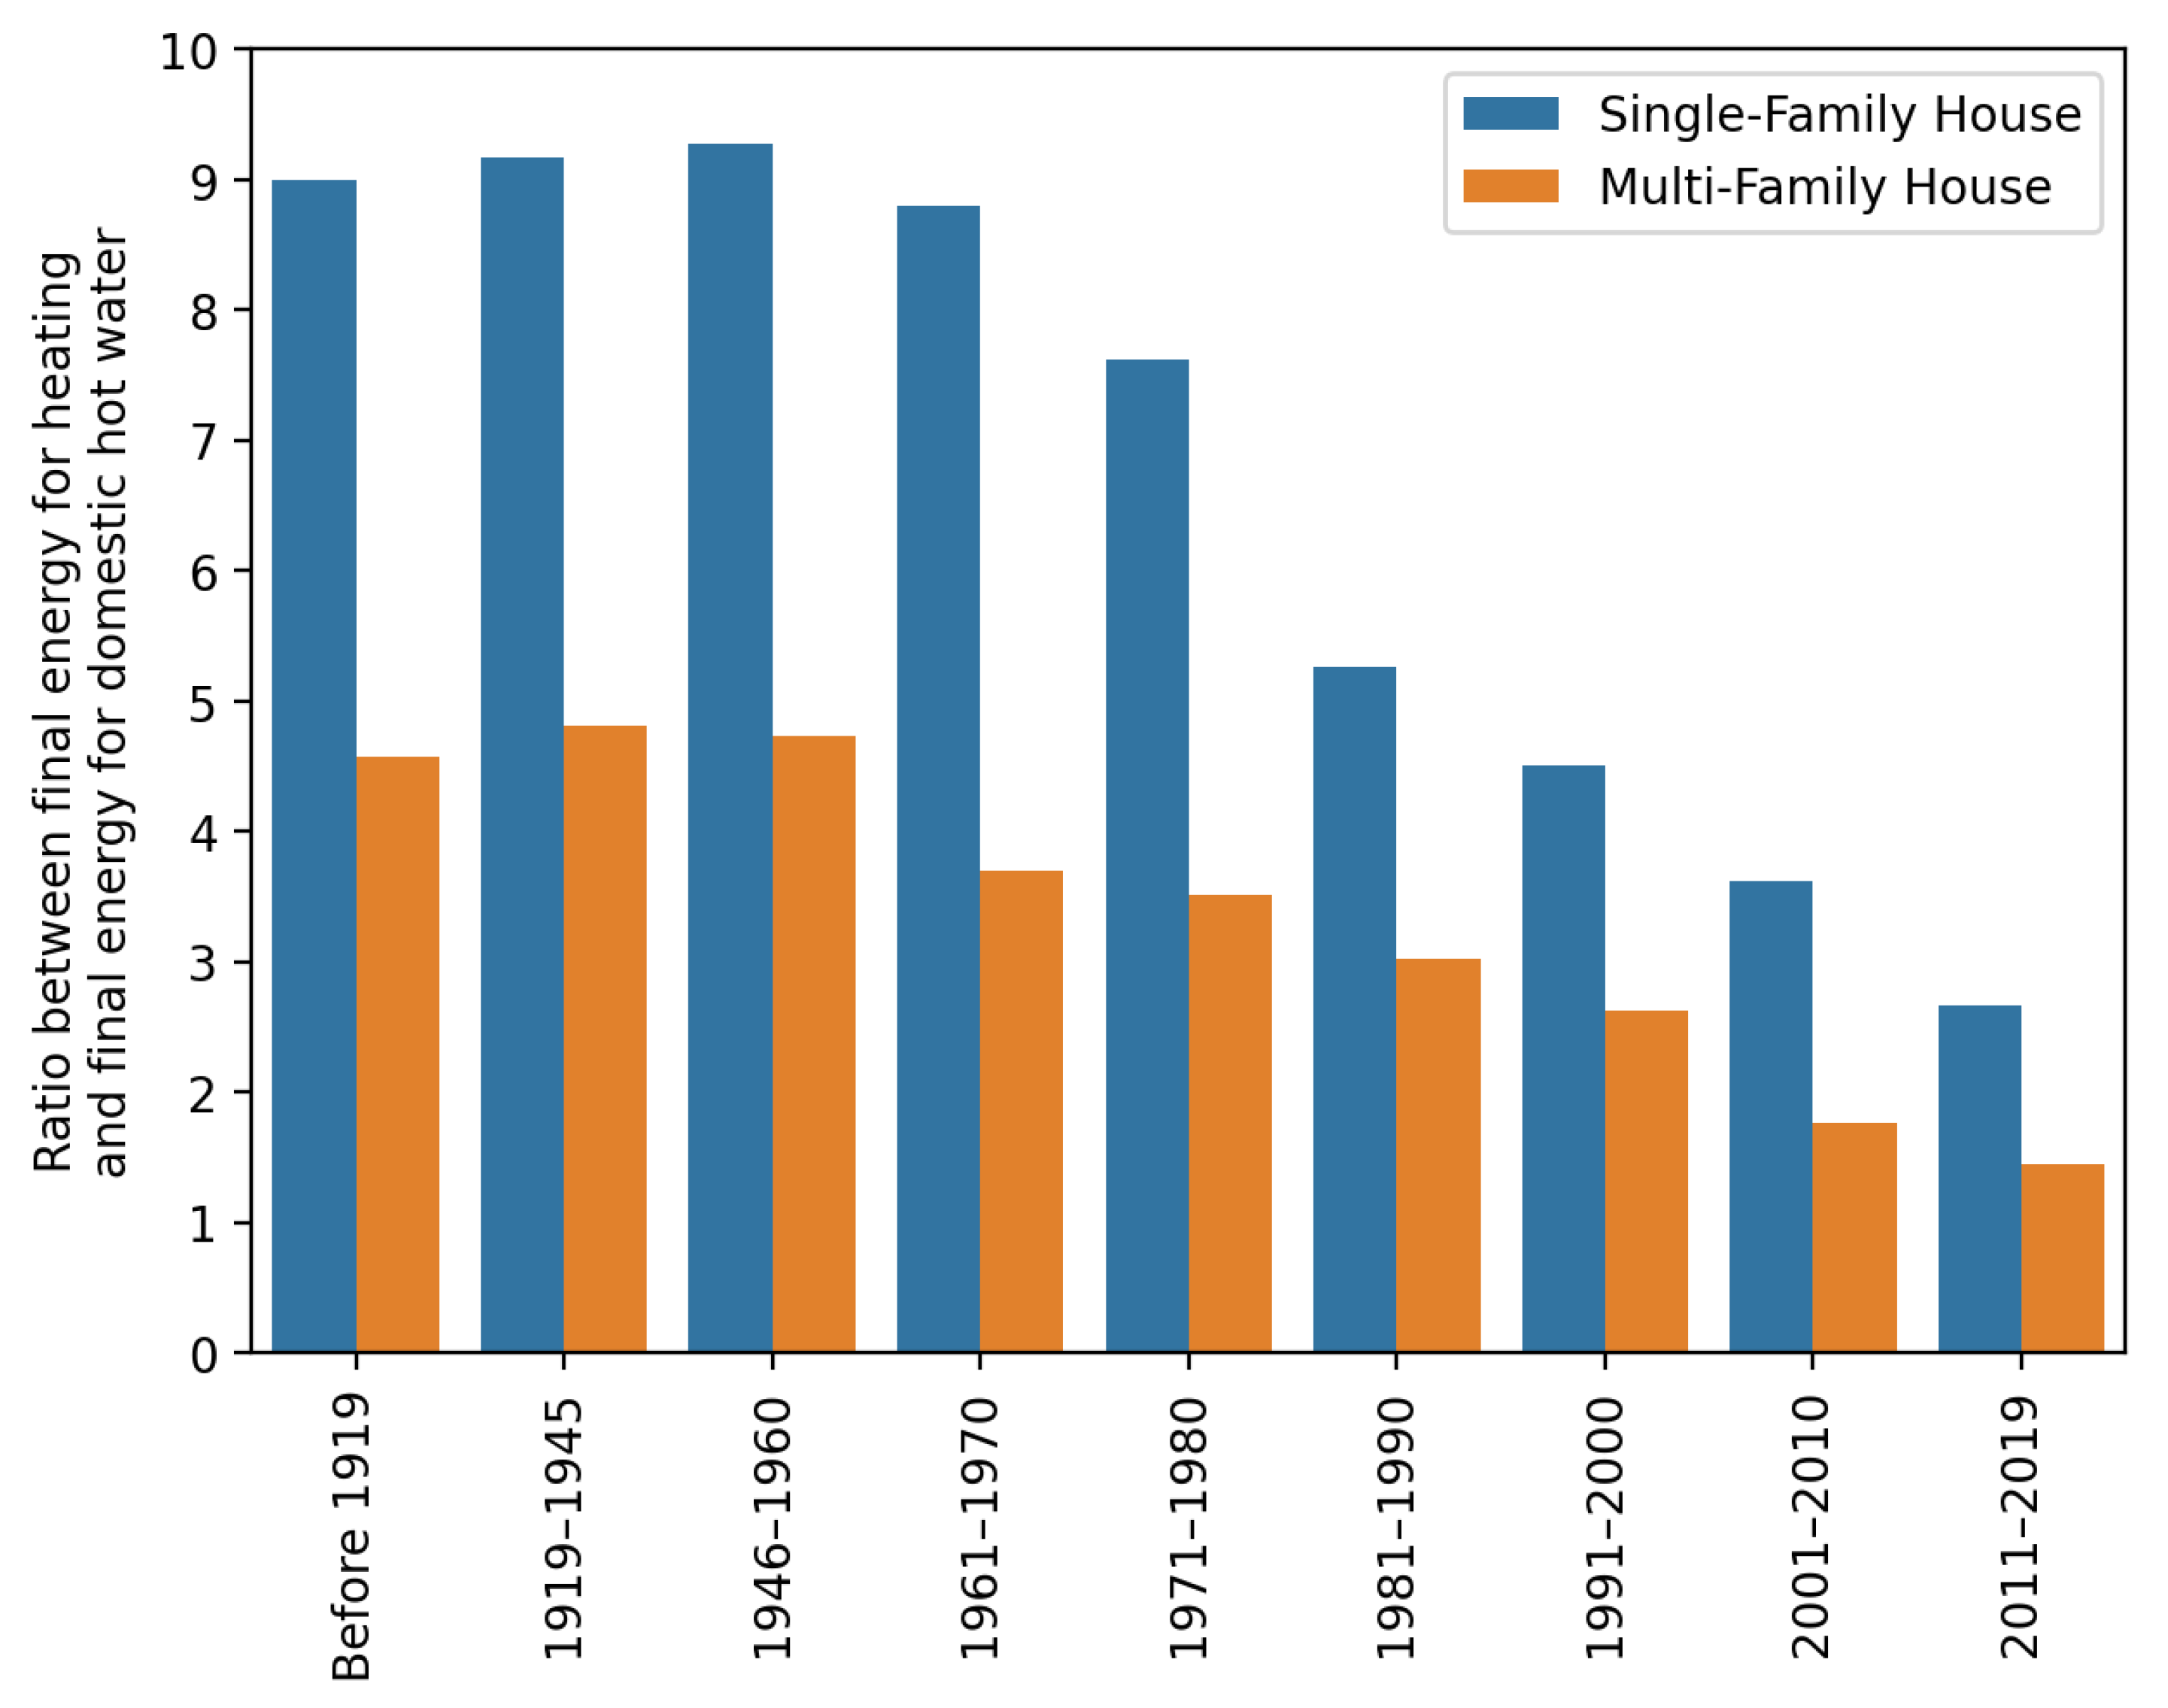
Another possibility is to show the evolution of the ratio between the median final energy for heating and the median final energy for domestic hot water, as shown in Figure 8.
These are just a few examples of the possible analysis that one can perform with the data provided here.
The raw data used for the work have specific limitations that are worth mentioning. The data compiled by the CECB experts in order to deliver the certification cannot always be retrieved by the existing building documentation and site visit. A wizard is provided by the CECB to suggest values when unknown (for example: U-values of building elements). For this reason, the values available in the datasheets are more reliable when easily measurable (surfaces, equipment, and demand). The extraction from the raw data was also limited to residential uses; this was due to unreliable or insufficient data for other building typologies. Furthermore, although the CECB certification is often used during a renovation process, the distinction of data entries between before and after renovation was unclear. Therefore, no archetype of renovation was built. Supposed renovated buildings are here included in the initial construction period. Finally, the data available in the CECB dataset lack further parameters needed for the compilation of an energy simulation model, such as ventilation settings and occupancy levels and schedules. The SIA 2024 technical document can, in this case, complement the missing data of the archetypes.
The further validation of the archetypes could be performed with real case studies, provided that enough data are available, as done by the TABULA project [22]. This could increase the reliability of the data presented and further consolidate the analysis of the existing stock.
Supplementary Materials
The following supporting information can be downloaded at: https://www.mdpi.com/article/10.3390/buildings13010040/s1, Figure S1: Archetype 1_before 1919; Figure S2: Archetype 2_1919–1945; Figure S3: Archetype 3_1946–1960; Figure S4: Archetype 4_1961–1970; Figure S5: Archetype 5_1971–1980; Figure S6: Archetype 6_1981–1990; Figure S7: Archetype 7_1991–2000; Figure S8: Archetype 8_2001–2010; Figure S9: Archetype 9_2011–2019.
Author Contributions
Conceptualization, A.P., Y.D.P., J.-P.B. and T.J.; methodology, J.-P.B. and T.J.; software, A.P.; validation, A.P., Y.D.P., J.-P.B. and T.J.; formal analysis, A.P.; investigation, A.P. and Y.D.P.; resources, J.-P.B. and T.J.; data curation, A.P.; writing—original draft preparation, Y.D.P.; writing—review and editing, A.P., Y.D.P., J.-P.B. and T.J.; visualization, A.P.; supervision, J.-P.B. and T.J.; project administration, J.-P.B. and T.J. All authors have read and agreed to the published version of the manuscript.
Funding
Financial support is gratefully acknowledged from the HEIA-FR Smart Living Lab research program.
Institutional Review Board Statement
Not applicable.
Informed Consent Statement
Not applicable.
Data Availability Statement
The data provided by the CECB are subject to a data protection agreement and are not publicly available. The results and processed data provided in this paper are compliant with the anonymity of the single buildings described and were approved by the CECB in respect to the data agreement.
Acknowledgments
The authors would like to thank Karine Wesselmann and the CECB association for providing the data and supporting this work with the necessary knowledge to understand the initial raw data.
Conflicts of Interest
The authors declare no conflict of interest.
Appendix A
Figure A1.
Archetype description sheet legend.

References
- Cozza, S.; Chambers, J.; Patel, M.K. Measuring the Thermal Energy Performance Gap of Labelled Residential Buildings in Switzerland. Energy Policy 2020, 137, 111085. [Google Scholar] [CrossRef]
- S. Suisse des Ingénieurs et des Architectes. SIA 380-1 Besoins de chaleur pour le chauffage. Swiss Norms. 2016. [Google Scholar]
- Hall, M. Normalisation du CECB, version CECB v5.1.1. In Proceedings of the Konferenz Kantonaler Energiedirektoren, Bern, Switzerland, 9 March 2020; p. 64. [Google Scholar]
- Federal office of Energy. In Proceedings of the Conférence des Directeurs Cantonaux de L’énergie, Facteurs de Pondération Nationaux Pour L’évaluation Des Bâtiments, Bern, Switzerland, 4 February 2016.
- CECB®, K. Manuel D’utilisateur de L’outil en Ligne CECB—Version 5.2; Centrale d’exploitation CECB®: Muttenz, Switzerland, 2021; p. 193. [Google Scholar]
- CECB. Certificat Énergétique Cantonal Des Bâtiments (GEAK—CECB—CECE)—Web Page. Available online: https://www.cecb.ch/ (accessed on 25 July 2022).
- Cozza, S.; Chambers, J.; Geissler, A.; Wesselmann, K.; Gambato, C.A.; Branca, G.; Cadonau, G.; Arnold, L.; Patel, M. GAPxPLORE: Energy Performance Gap in Existing, New, and Renovated Buildings Learning from Large-Scale Datasets; Technical Report Swiss Federal Office of Energy SFOE, CH-3003: Bern, Switzerland, 2019. [Google Scholar]
- Cozza, S.; Chambers, J.; Deb, C.; Scartezzini, J.-L.; Schlüter, A.; Patel, M.K. Do Energy Performance Certificates Allow Reliable Predictions of Actual Energy Consumption and Savings? Learning from the Swiss National Database. Energy Build. 2020, 224, 110235. [Google Scholar] [CrossRef]
- Streicher, K.N.; Padey, P.; Parra, D.; Bürer, M.C.; Patel, M.K. Assessment of the Current Thermal Performance Level of the Swiss Residential Building Stock: Statistical Analysis of Energy Performance Certificates. Energy Build. 2018, 178, 360–378. [Google Scholar] [CrossRef]
- Streicher, K.N.; Padey, P.; Parra, D.; Bürer, M.C.; Schneider, S.; Patel, M.K. Analysis of Space Heating Demand in the Swiss Residential Building Stock: Element-Based Bottom-up Model of Archetype Buildings. Energy Build. 2019, 184, 300–322. [Google Scholar] [CrossRef]
- Team, T. The pandas development team Pandas-Dev/Pandas: Pandas. Zenodo 2022, 21, 1–9. [Google Scholar]
- Harris, C.R.; Millman, K.J.; Van Der Walt, S.J.; Gommers, R.; Virtanen, P.; Cournapeau, D.; Wieser, E.; Taylor, J.; Berg, S.; Smith, N.J.; et al. Array Programming with NumPy. Nature 2020, 585, 357–362. [Google Scholar] [CrossRef] [PubMed]
- Hunter, J.D. Matplotlib: A 2D Graphics Environment. Comput. Sci. Eng. 2007, 9, 90–95. [Google Scholar] [CrossRef]
- ReportLab. ReportLab PDF Library User Guide, Version 3.6.12; ReportLab: London, UK, 2022. [Google Scholar]
- Goy, S.; Maréchal, F.; Finn, D. Data for Urban Scale Building Energy Modelling: Assessing Impacts and Overcoming Availability Challenges. Energies 2020, 13, 4244. [Google Scholar] [CrossRef]
- Alshehri, F.; Kenny, P.; Pinheiro, S.; Ali, U.; O’Donnell, J. Development of a Model View Definition (MVD) for Thermal Comfort Analyses in Commercial Buildings Using BIM and EnergyPlus. In Proceedings of the CitA BIM Gathering 2017, Dublin, Ireland, 23–24 November 2017; p. 9. [Google Scholar]
- Sinha, S.; Sawhney, A.; Borrmann, A.; Ritter, F. Extracting Information from Building Information Models for Energy Code Compliance of Building Envelope; Construction IT Allance of Ireland: Dublin, Ireland, 2013. [Google Scholar]
- Eggimann, S.; Vulic, N.; Rüdisüli, M.; Mutschler, R.; Orehounig, K.; Sulzer, M. Spatiotemporal Upscaling Errors of Building Stock Clustering for Energy Demand Simulation. Energy Build. 2022, 258, 111844. [Google Scholar] [CrossRef]
- De Jaeger, I.; Reynders, G.; Callebaut, C.; Saelens, D. A Building Clustering Approach for Urban Energy Simulations. Energy Build. 2020, 208, 109671. [Google Scholar] [CrossRef]
- Aksoezen, M.; Daniel, M.; Hassler, U.; Kohler, N. Building Age as an Indicator for Energy Consumption. Energy Build. 2015, 87, 74–86. [Google Scholar] [CrossRef]
- Office Fédéral de la Statistique—OFS. Construction et Logement 2020; Office Fédéral de la Statistique: Neuchatel, Switzerland, 2022. [Google Scholar]
- Loga, T.; Stein, B.; Diefenbach, N. TABULA Building Typologies in 20 European Countries—Making Energy-Related Features of Residential Building Stocks Comparable. Energy Build. 2016, 132, 4–12. [Google Scholar] [CrossRef]
- Ballarini, I.; Corgnati, S.P.; Corrado, V. Use of Reference Buildings to Assess the Energy Saving Potentials of the Residential Building Stock: The Experience of TABULA Project. Energy Policy 2014, 68, 273–284. [Google Scholar] [CrossRef]
Figure 1.
Primary energy source distribution by period of construction for single-family houses.

Figure 2.
Primary energy source distribution by period of construction for multi-family houses.

Figure 3.
Number of samples for each period of construction.

Figure 4.
Total energy reference area of single and multi-family houses per year cluster found in the dataset.
Figure 4.
Total energy reference area of single and multi-family houses per year cluster found in the dataset.

Figure 5.
Pie charts expressing the representative percentage of energy reference area of each period in relation to the total by building type.
Figure 5.
Pie charts expressing the representative percentage of energy reference area of each period in relation to the total by building type.

Figure 6.
Spread of the final energy for heating of single-family and multi-family houses for each period of construction.
Figure 6.
Spread of the final energy for heating of single-family and multi-family houses for each period of construction.

Figure 7.
Spread of the final energy for domestic hot water of single-family and multi-family houses for each period of construction.
Figure 7.
Spread of the final energy for domestic hot water of single-family and multi-family houses for each period of construction.

Figure 8.
Ratio between the median final energy for heating and the median final energy for domestic hot water.
Figure 8.
Ratio between the median final energy for heating and the median final energy for domestic hot water.


Table 1.
Definition of construction periods clustering.
| Construction Period | Reasoning |
|---|---|
| Before 1919 | Before war |
| 1919–1945 | In-between wars |
| 1946–1960 | After war |
| 1961–1970 | Effects of the energy crisis (1971–1973) and first energy regulations |
| 1971–1980 | 1980—change in energy laws |
| 1981–1990 | 1990—federal decree on rational and economic use of energy |
| 1991–2000 | 1998—Federal law on energy |
| 2001–2010 | 10 years span |
| 2011–2019 | 10 years span |
Disclaimer/Publisher’s Note: The statements, opinions and data contained in all publications are solely those of the individual author(s) and contributor(s) and not of MDPI and/or the editor(s). MDPI and/or the editor(s) disclaim responsibility for any injury to people or property resulting from any ideas, methods, instructions or products referred to in the content. |
© 2022 by the authors. Licensee MDPI, Basel, Switzerland. This article is an open access article distributed under the terms and conditions of the Creative Commons Attribution (CC BY) license (https://creativecommons.org/licenses/by/4.0/).
Share and Cite
MDPI and ACS Style
Pongelli, A.; Priore, Y.D.; Bacher, J.-P.; Jusselme, T. Definition of Building Archetypes Based on the Swiss Energy Performance Certificates Database. Buildings 2023, 13, 40. https://doi.org/10.3390/buildings13010040
AMA Style
Pongelli A, Priore YD, Bacher J-P, Jusselme T. Definition of Building Archetypes Based on the Swiss Energy Performance Certificates Database. Buildings. 2023; 13(1):40. https://doi.org/10.3390/buildings13010040
Chicago/Turabian StylePongelli, Alessandro, Yasmine Dominique Priore, Jean-Philippe Bacher, and Thomas Jusselme. 2023. "Definition of Building Archetypes Based on the Swiss Energy Performance Certificates Database" Buildings 13, no. 1: 40. https://doi.org/10.3390/buildings13010040
Note that from the first issue of 2016, this journal uses article numbers instead of page numbers. See further details here.