
Efficiency of VR-Based Safety Training for Construction Equipment: Hazard Recognition in Heavy Machinery Operations
 , ,
, ,
Abstract
:1. Introduction
2. Literature Review
2.1. Safety Training for Heavy Construction Machinery Operations
2.2. Multi-Criteria Decision Making for Assessing Effectiveness of VR Safety Trainings
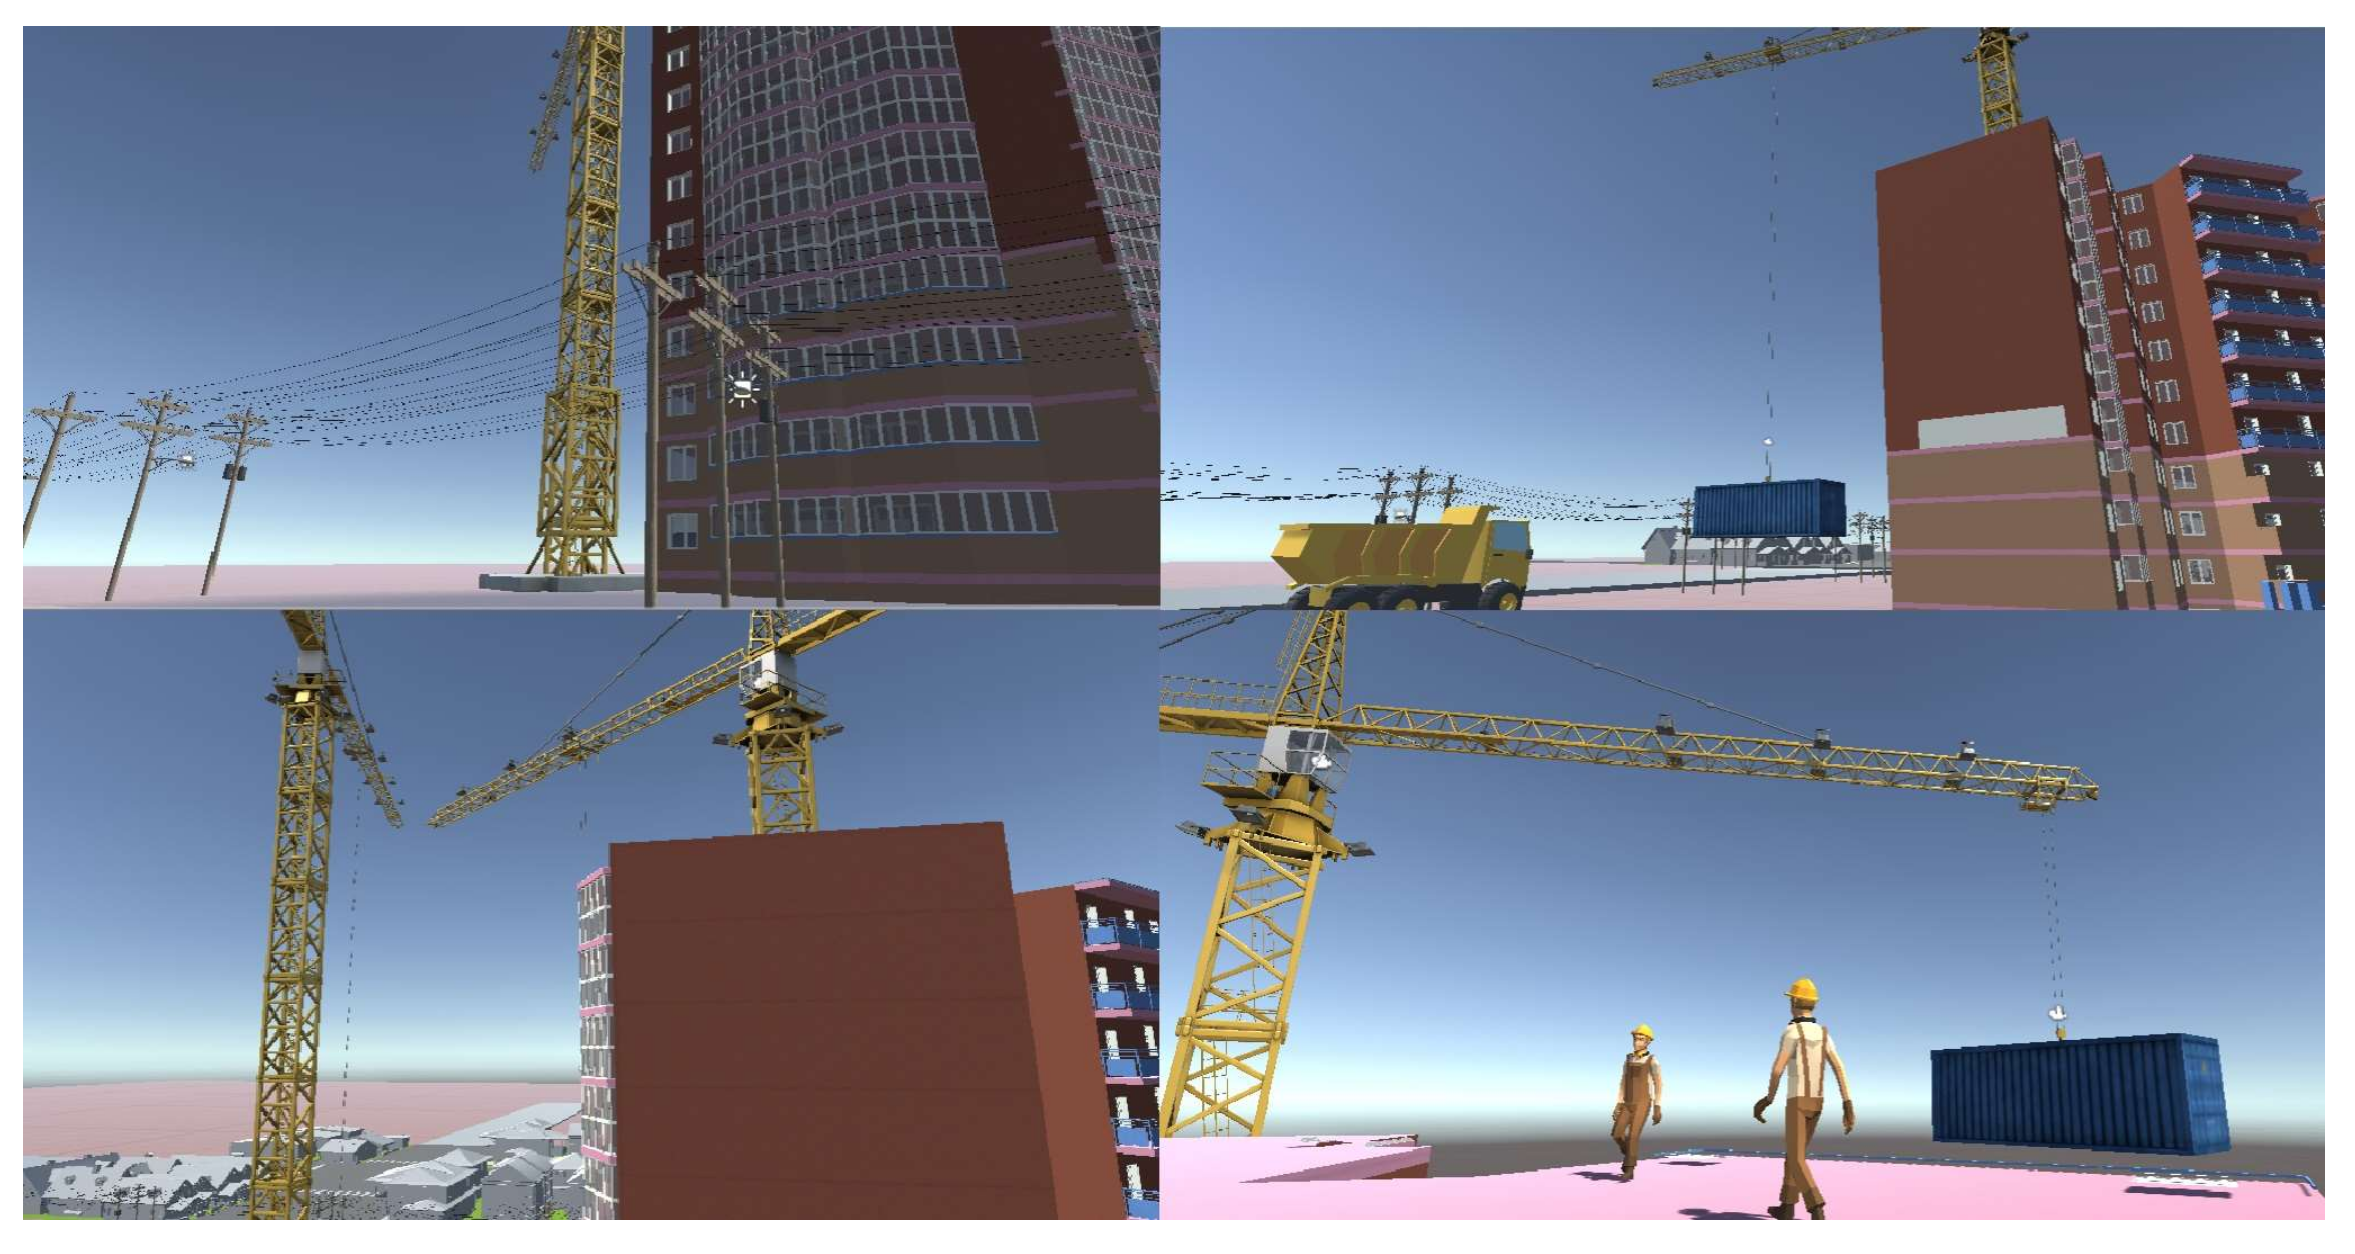
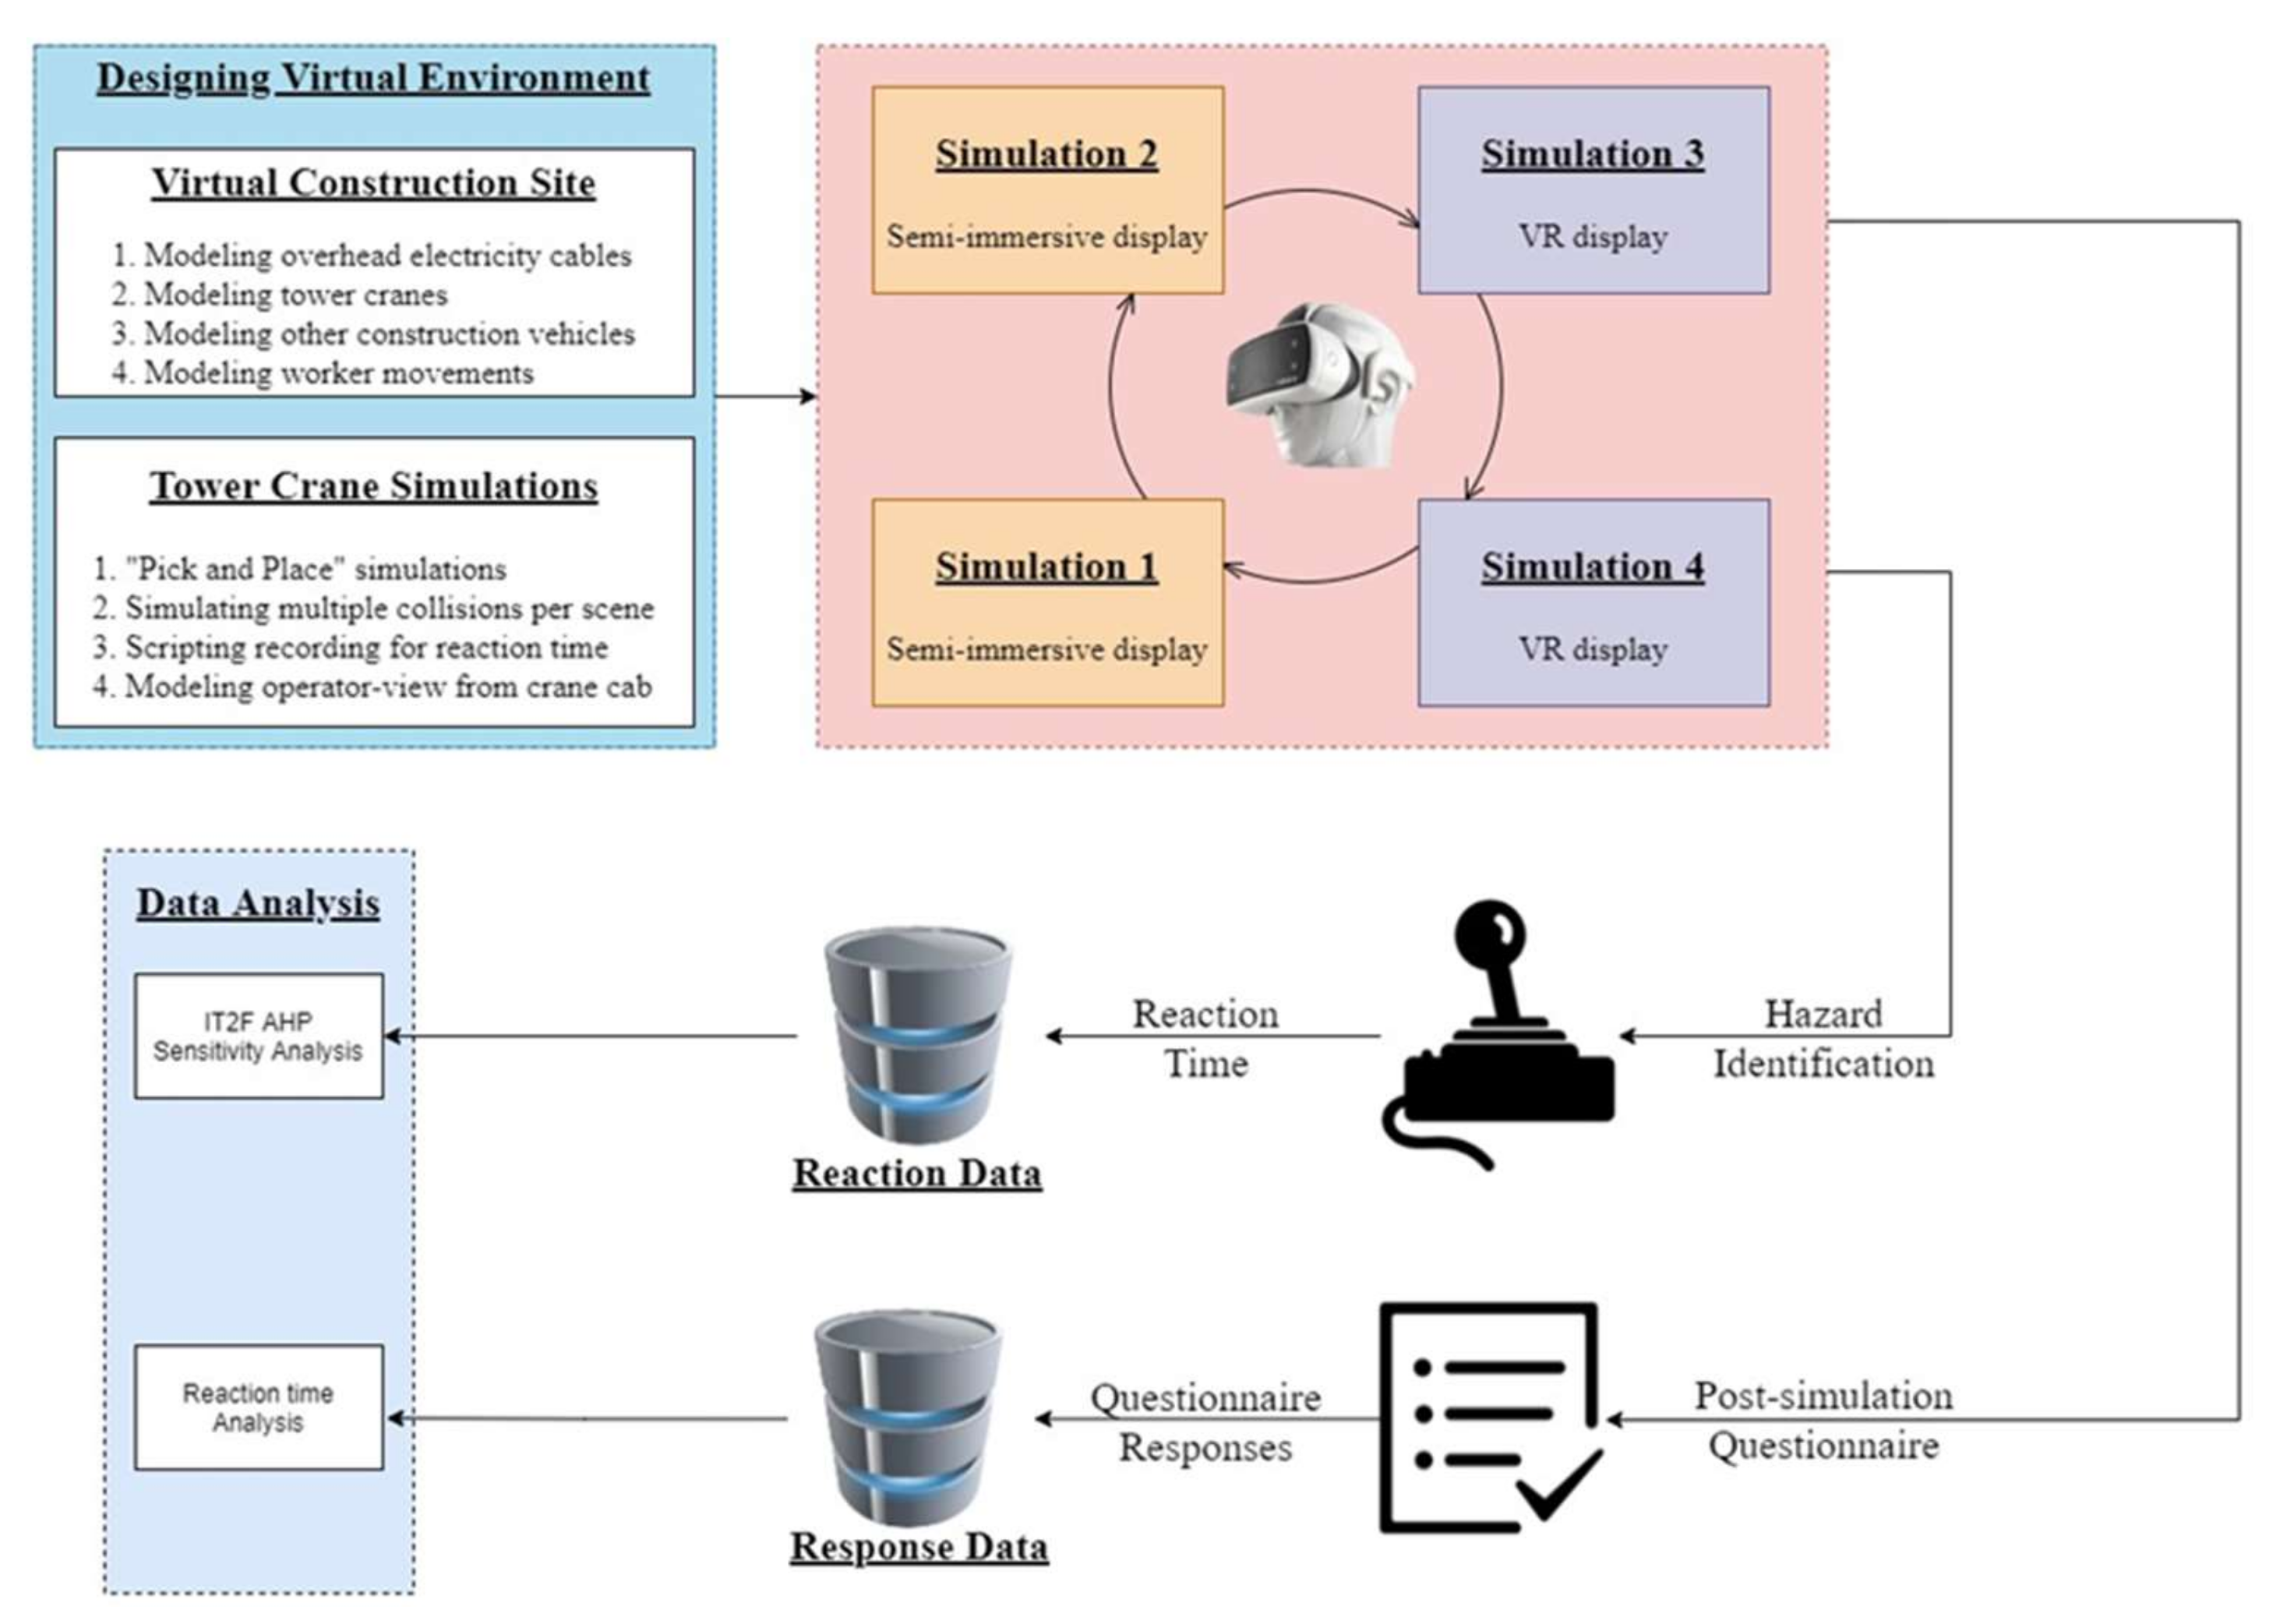
3. Methodology
- Participants are given a presentation on “pick and place” tower crane operations and potential hazards on construction sites.
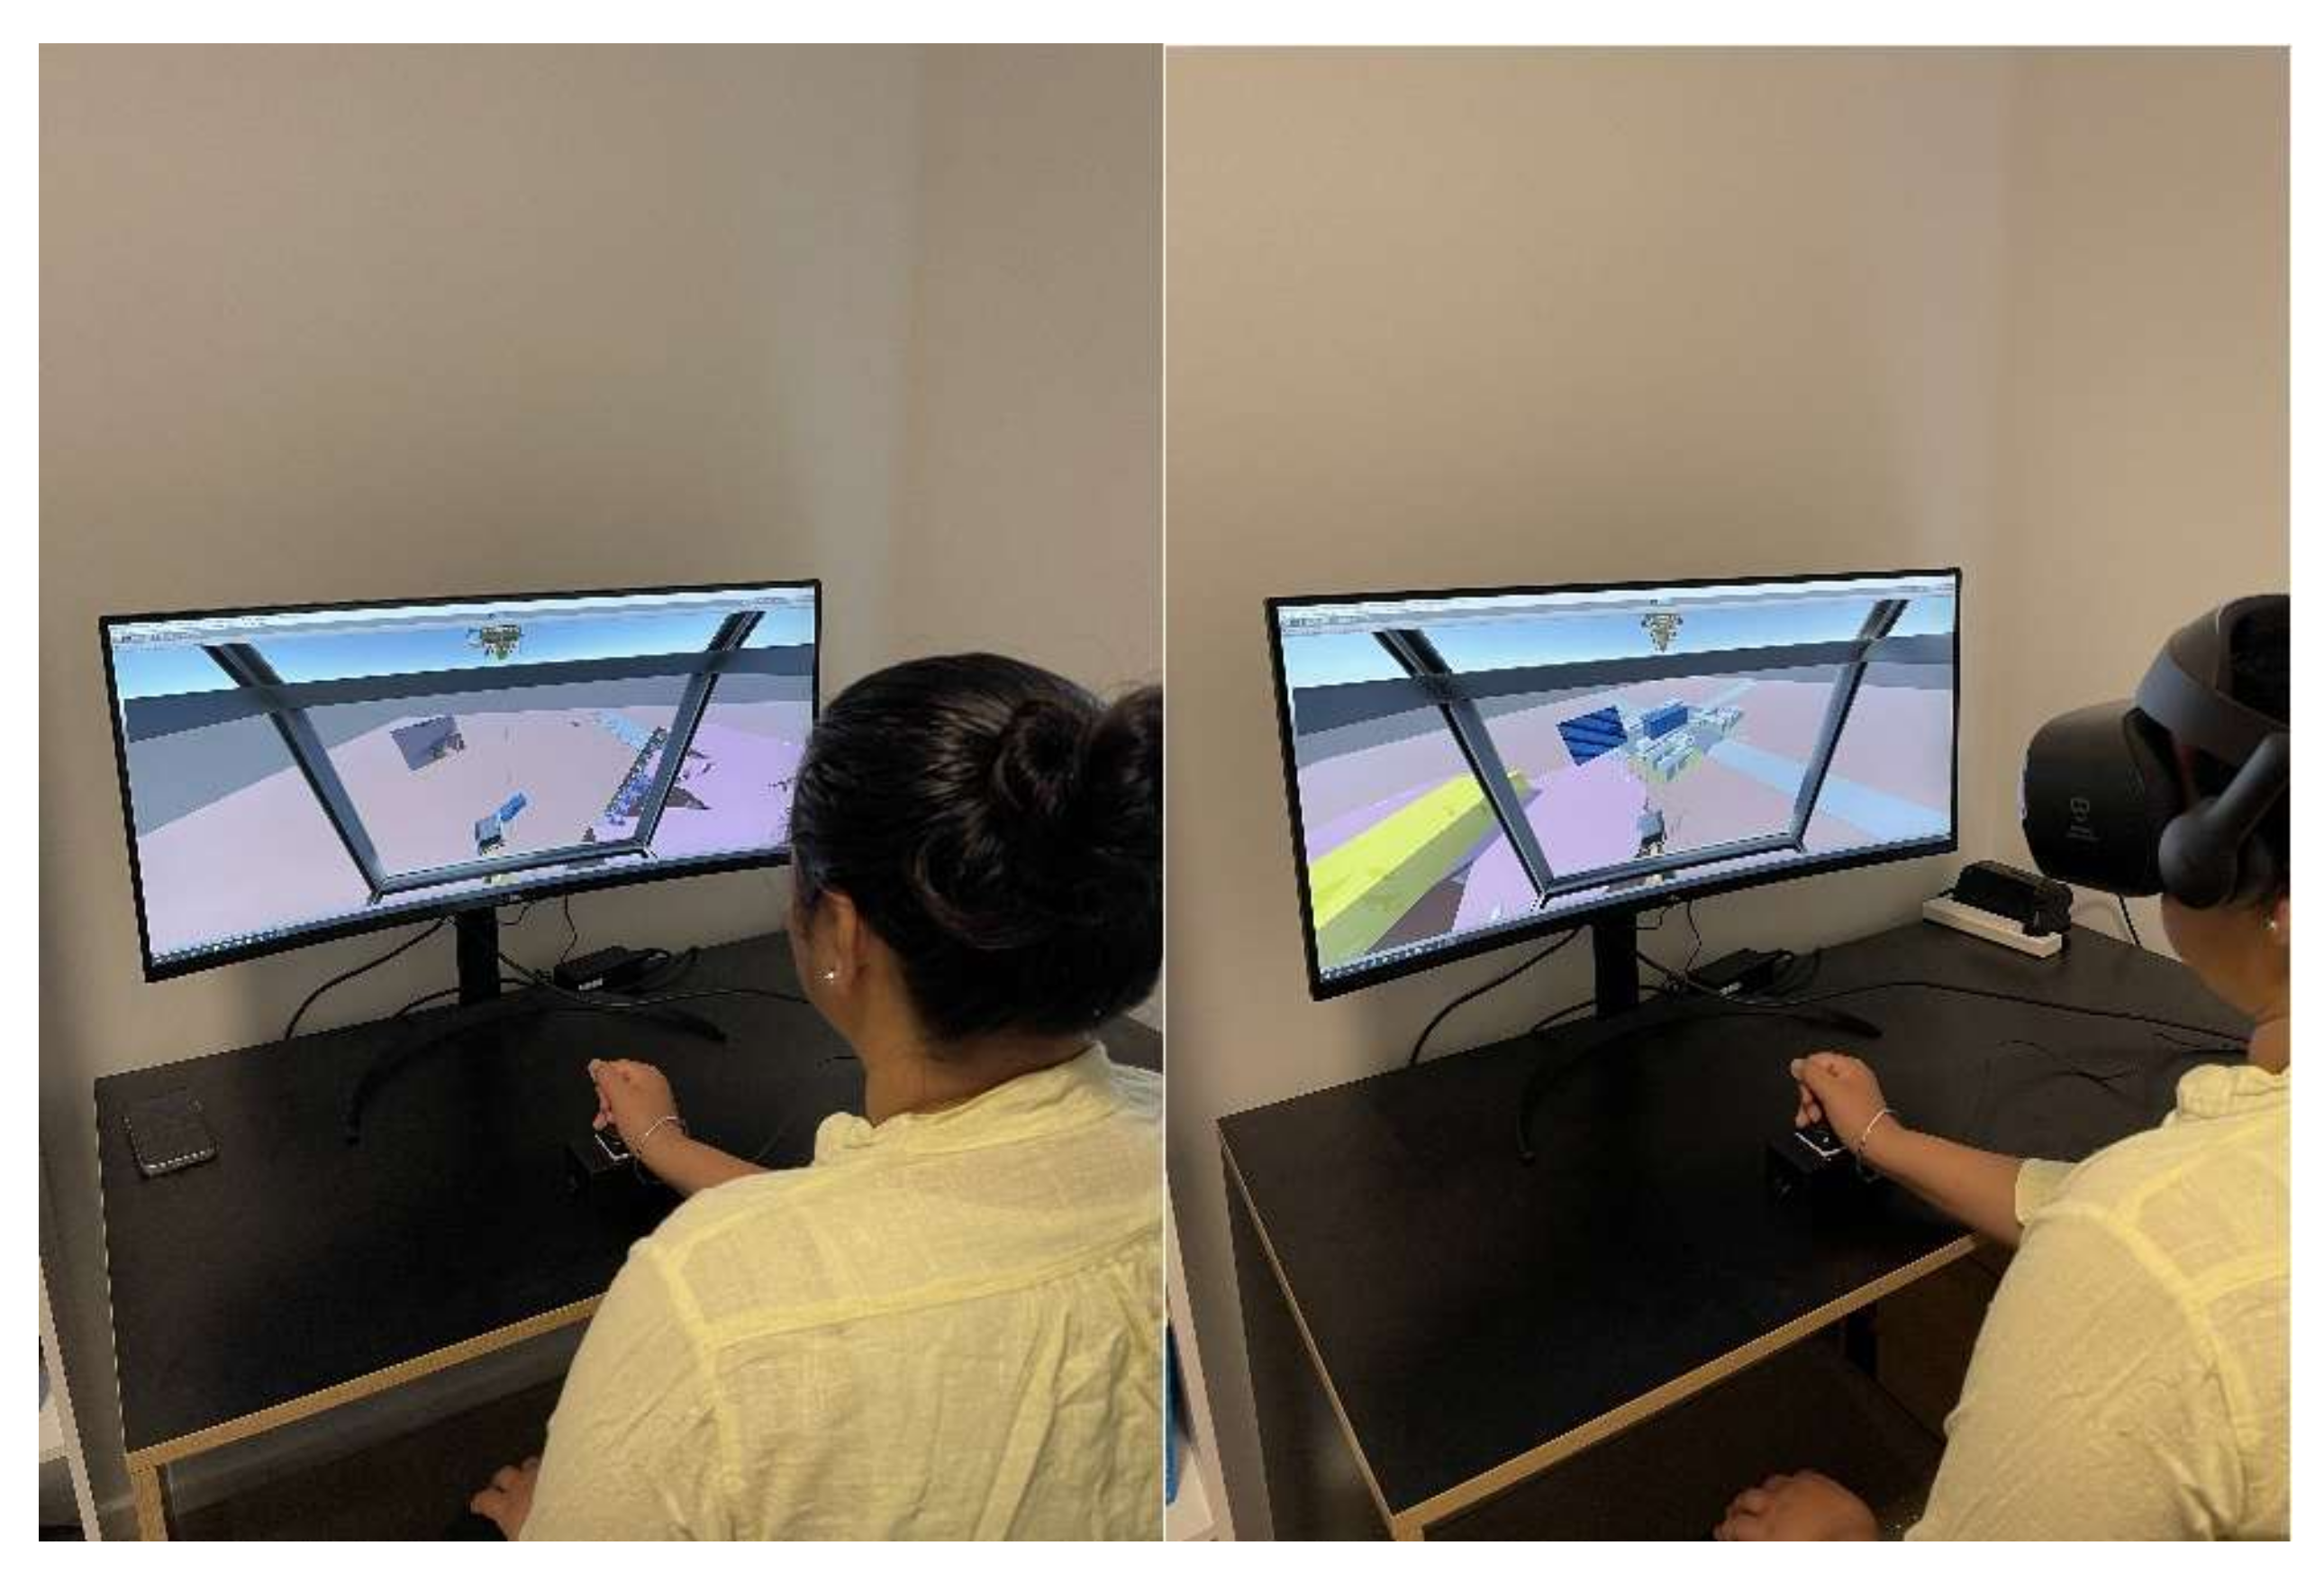
- Participants are familiarized with the VR environment and registration of inputs using the joystick in the VR environment.
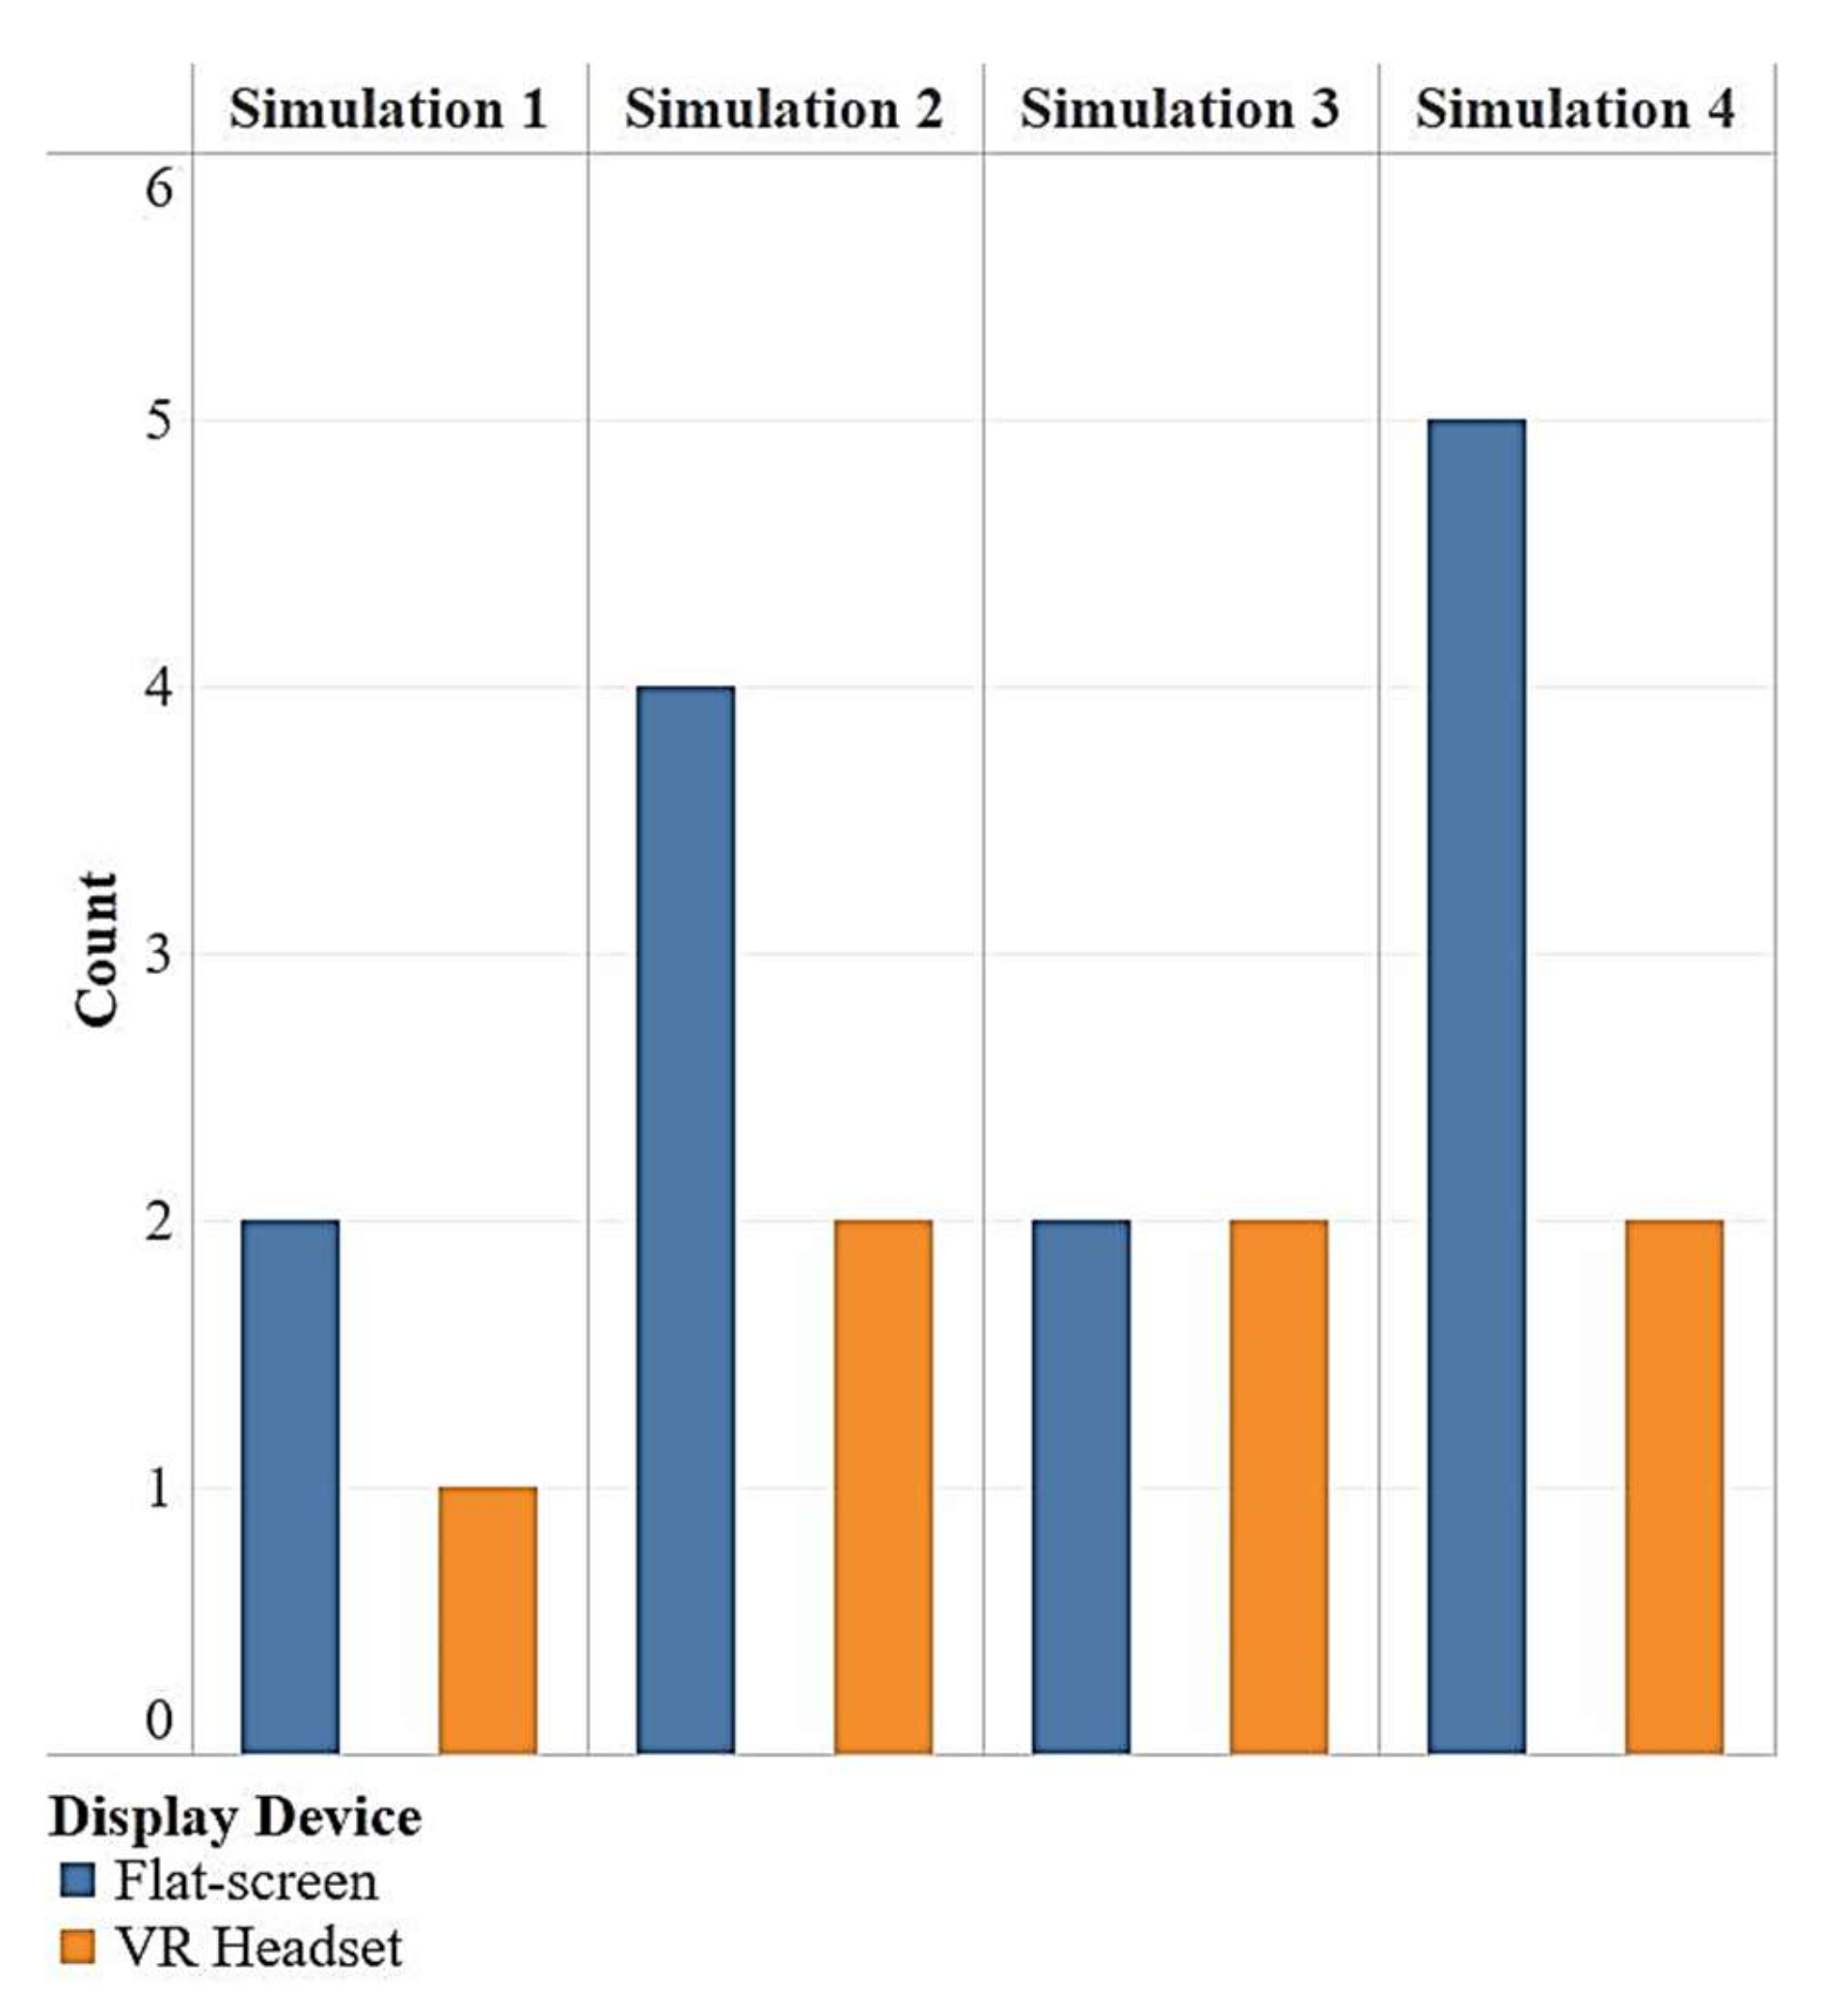
- Once the participants are familiar with the VR settings, they are shown two simulations on VR headset and two simulations on a semi-immersive flat-screen display. Their inputs to hazard identification are recorded in a database for further analysis.
- After the experiment, they are asked to provide feedback regarding various aspects of the simulations via a questionnaire survey.
- How much difference does a VR headset make to training efficiency for construction machinery operator safety training?
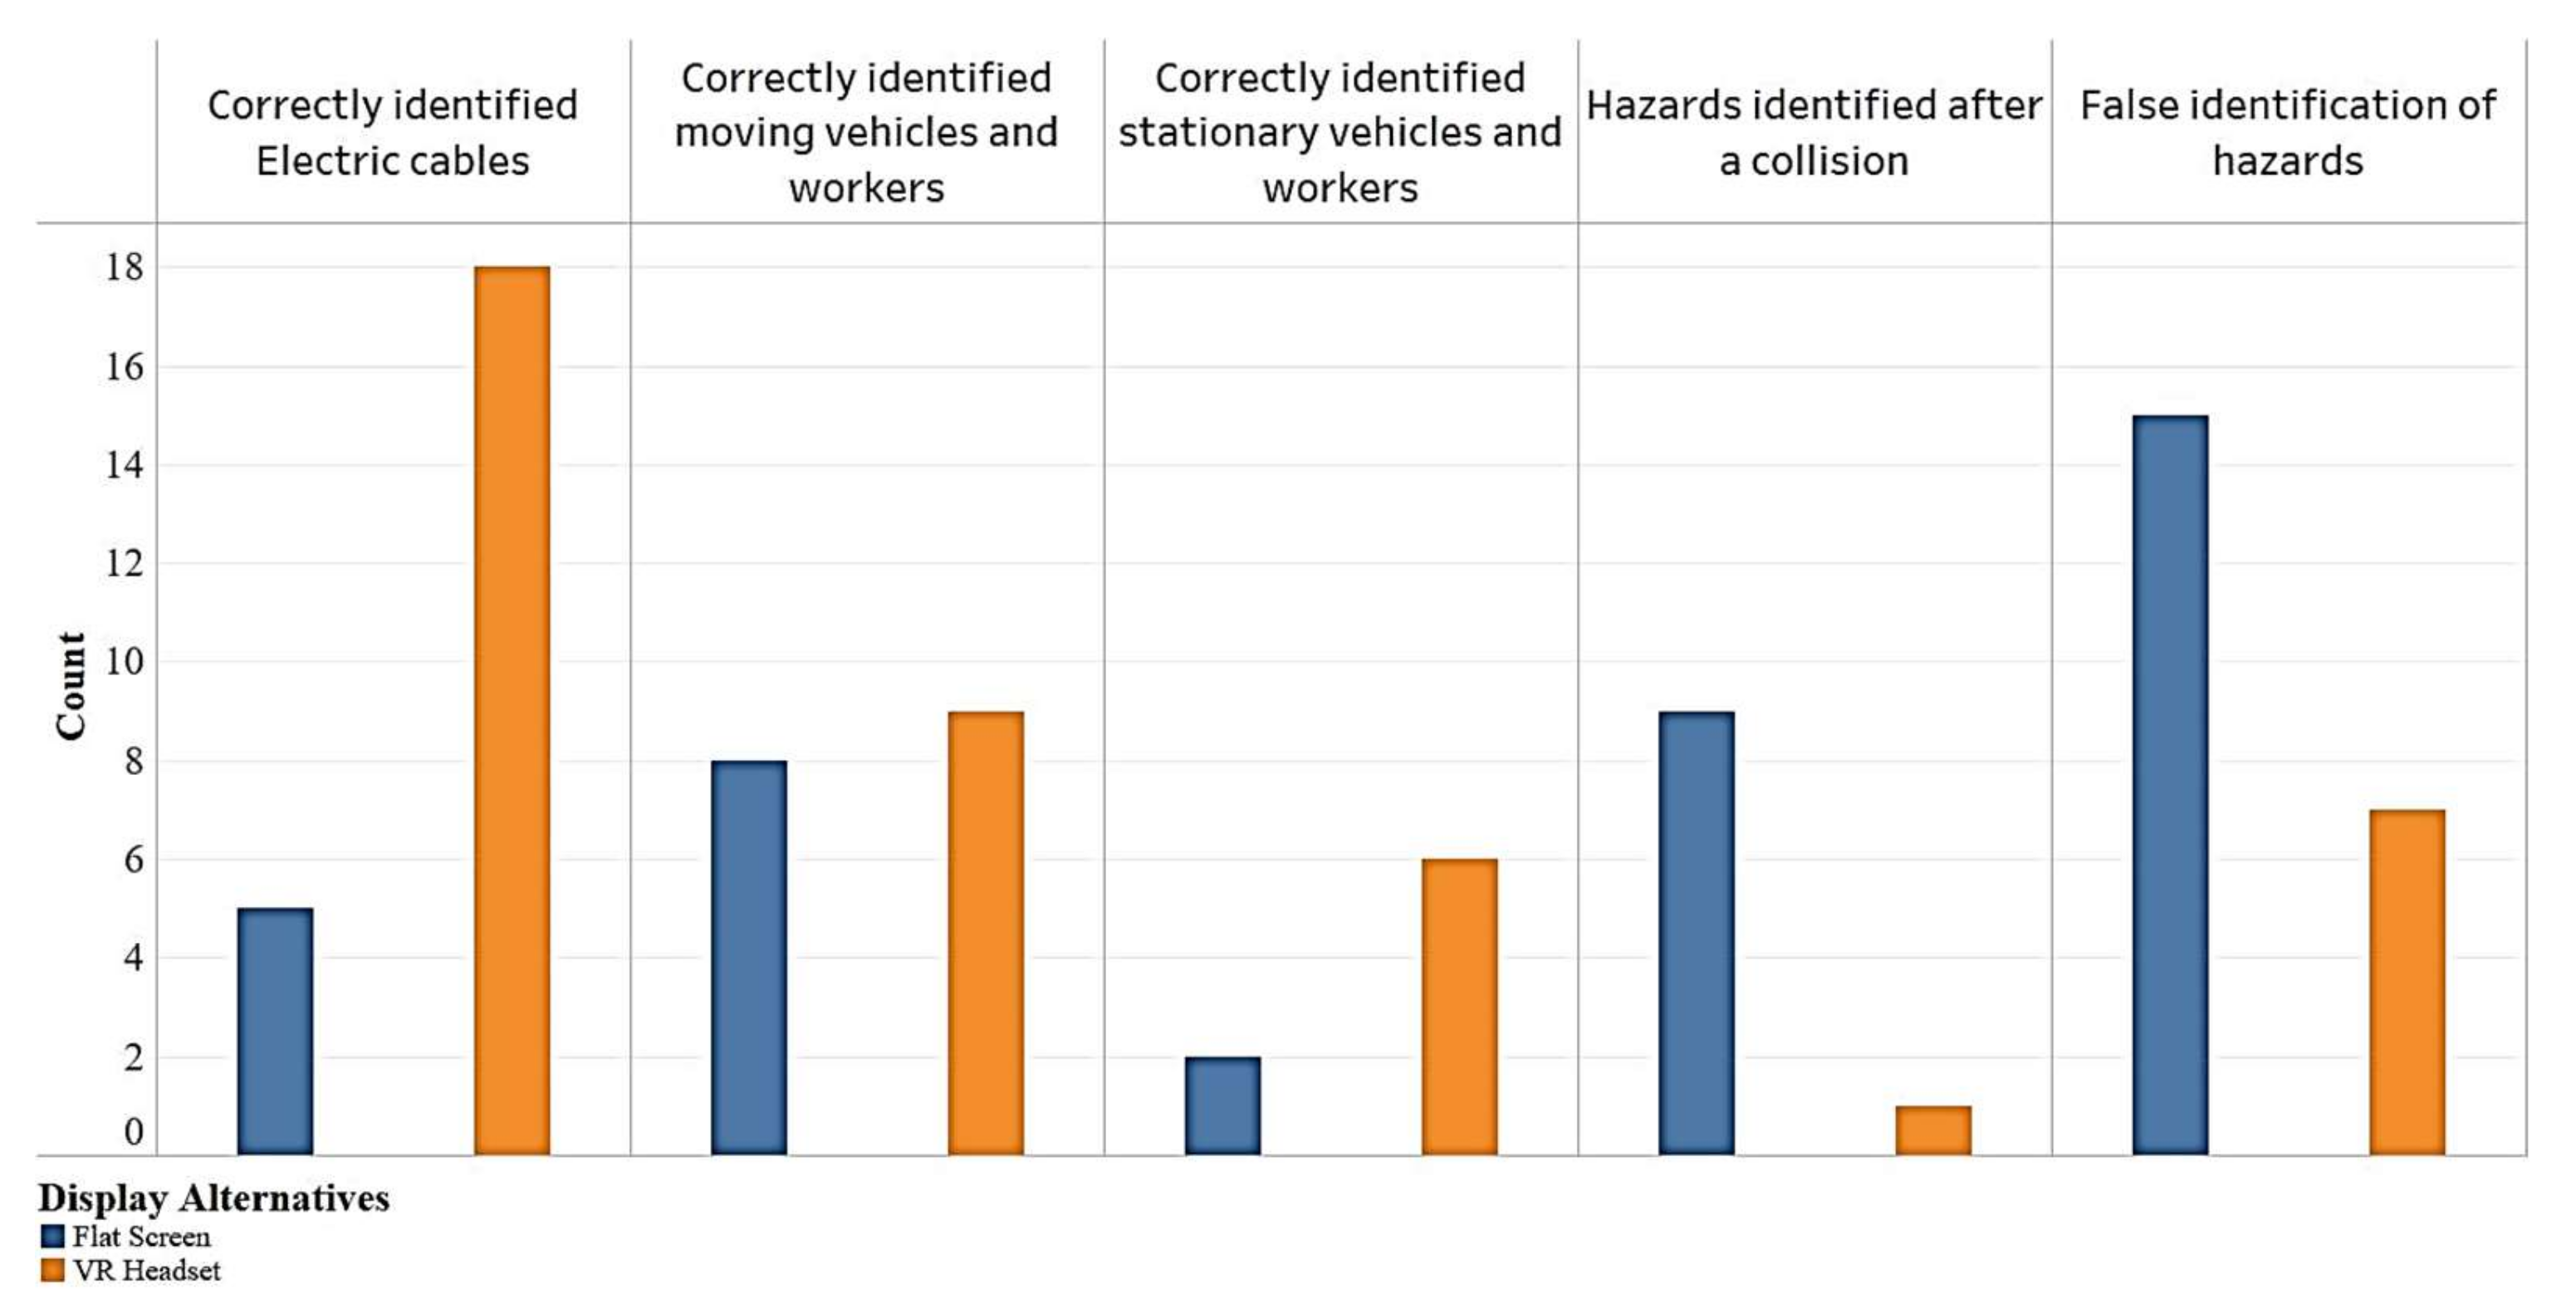
- What type of hazards are better perceived using VR?
- Which aspects of construction machinery operator safety training can be improved using VR?
3.1. Participants
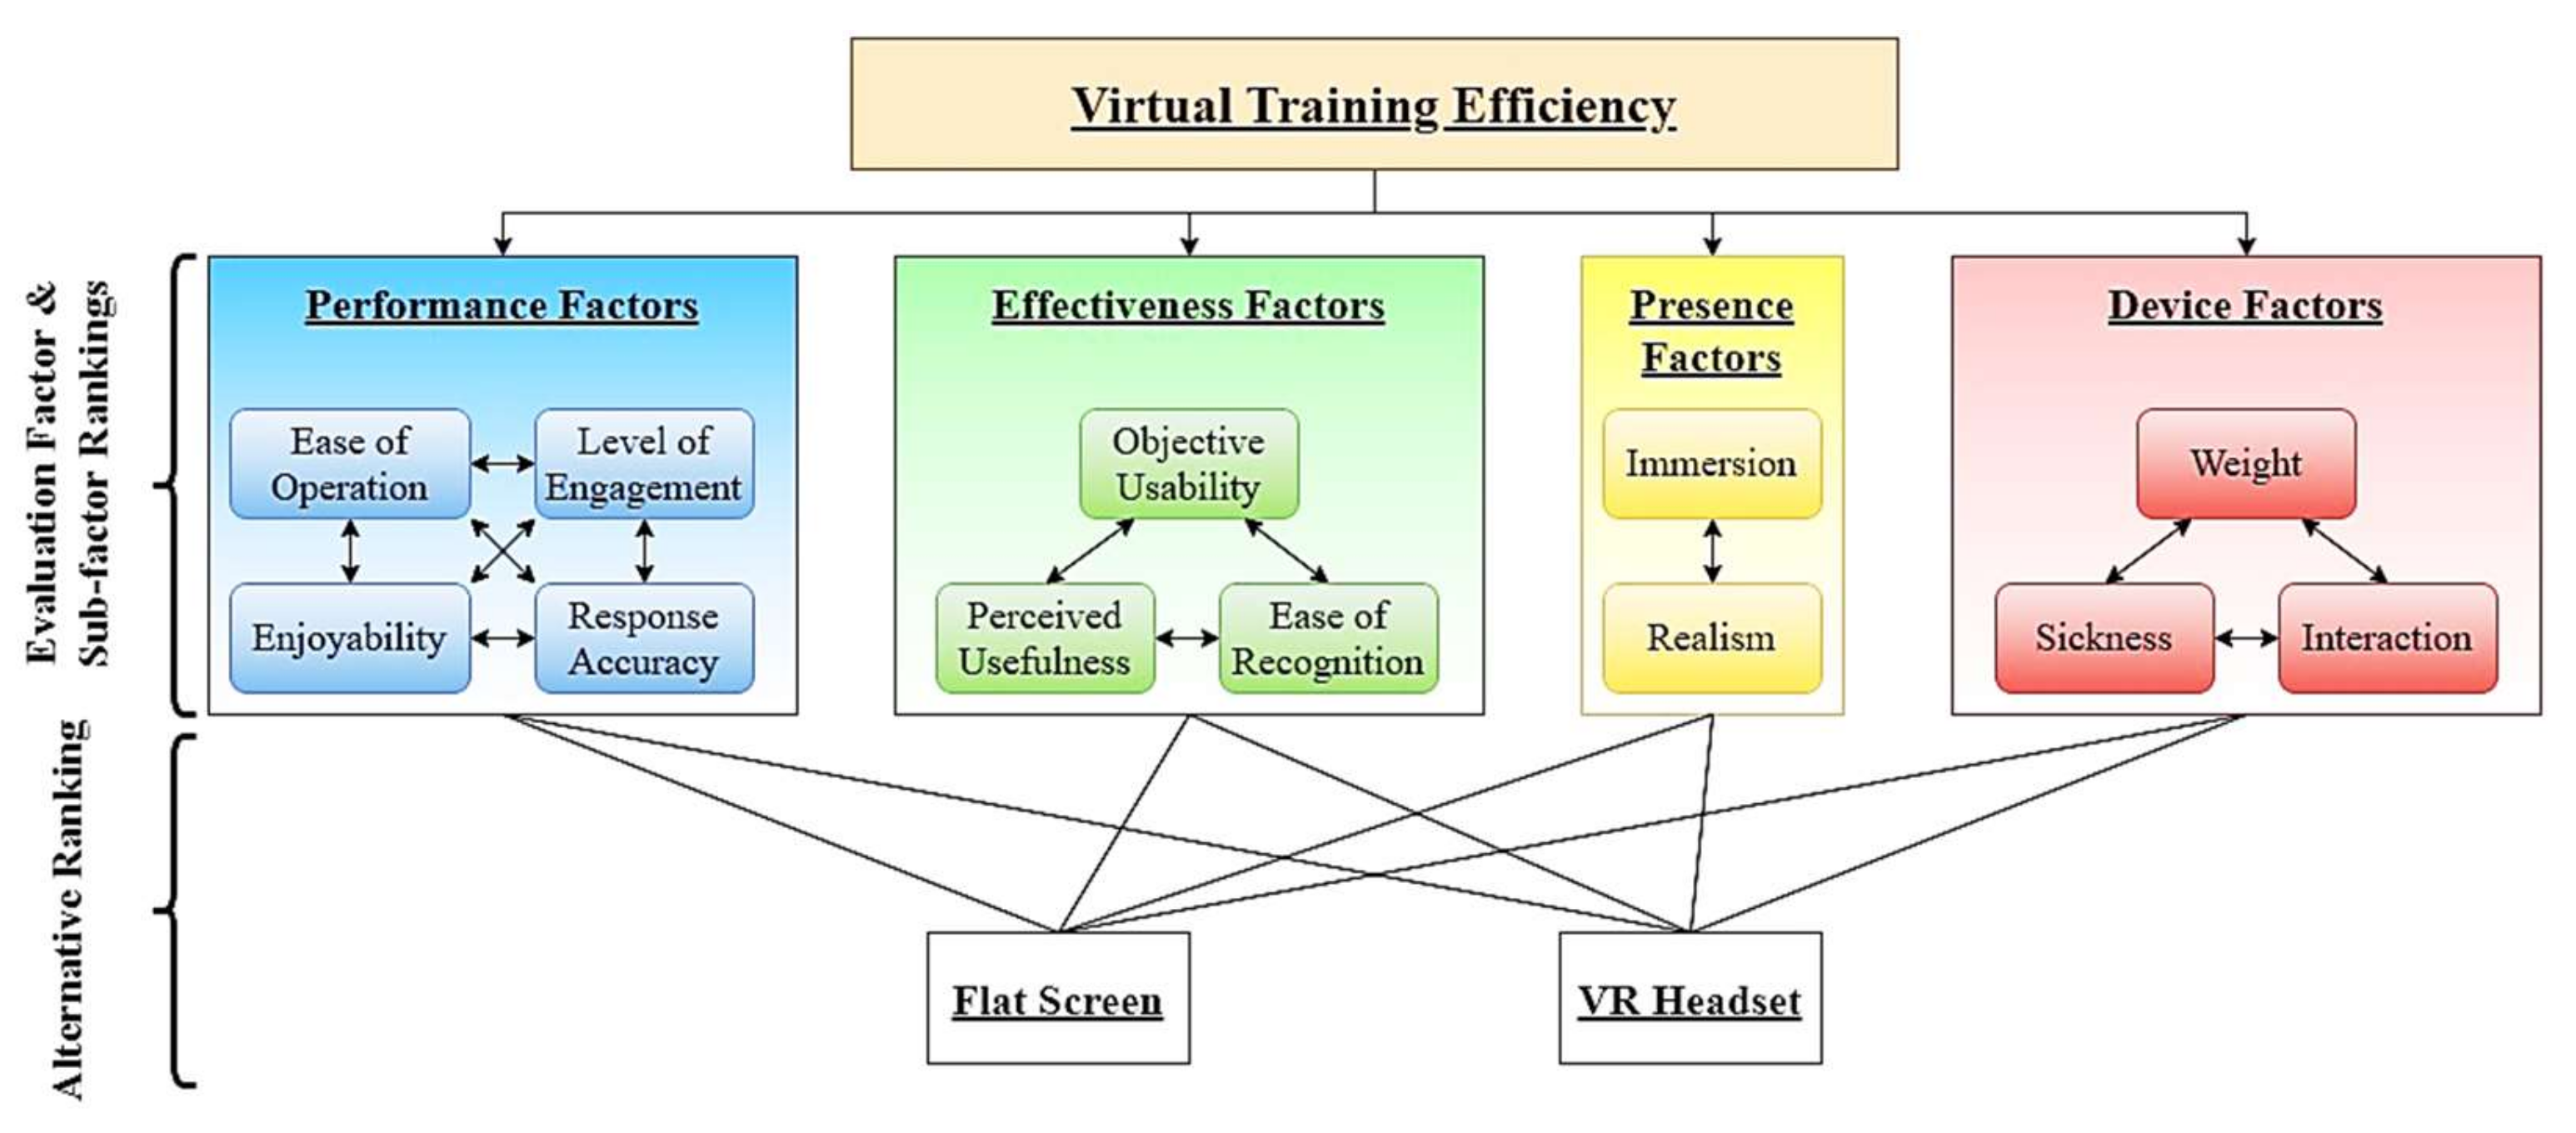
3.2. Determining the Set of Evaluation Factors
3.2.1. Performance Factors
- Ease of operations: This criterion measures the ease of conducting the given task in VR, including task complexity and problem-solving ability [43].
- Level of Engagement: The amount of learning absorbed from virtual training depends on the correlation to the actual task [46].
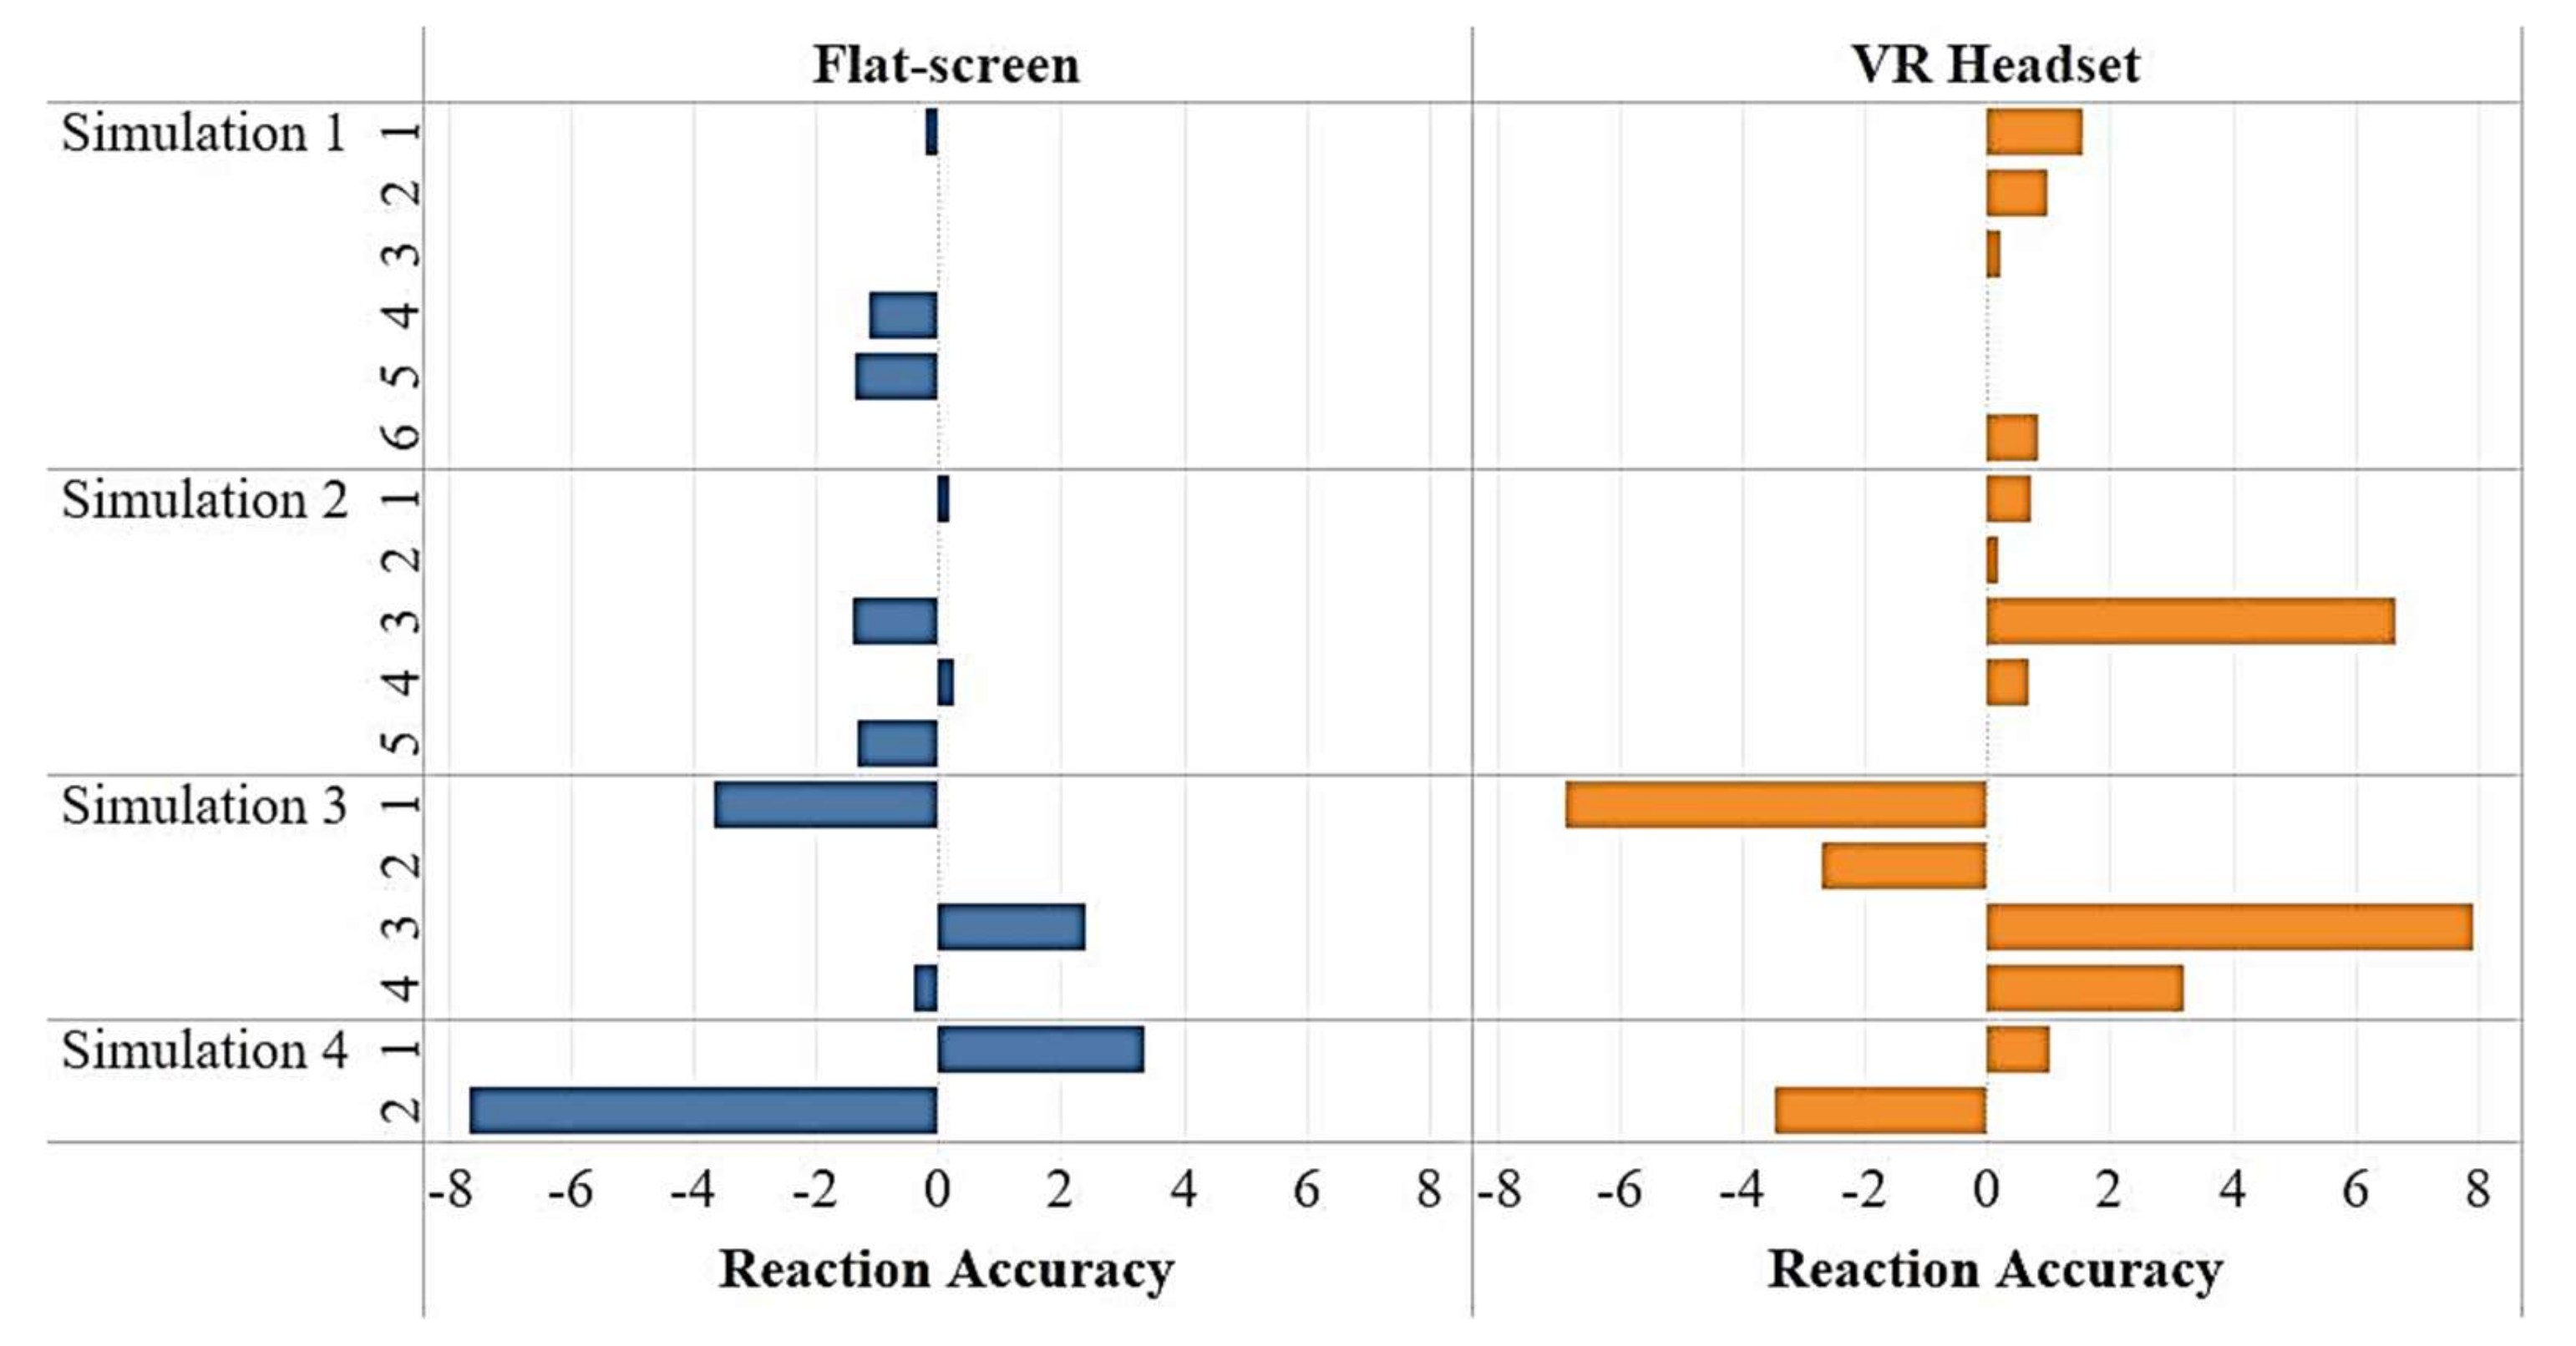
- Response Accuracy: Accuracy of response to hazard recognition task that can be measured in terms of time, i.e., how quickly a participant can recognize and react to a hazard during the operation [12].
3.2.2. Effectiveness Factors
- Objective usability: Previous studies have employed a comprehensive fuzzy evaluation of safety training systems to measure the effectiveness of the training in terms of cognitive load and decomposition of the task [12]. These terms have been captured by “objective usability” under effectiveness factors.
- Perceived usefulness: An important sub-factor that constitutes training efficiency is its “perceived usefulness”. This sub-factor focuses on the difference in learning and recognition when using virtual safety training for the enhancement of depth perception.
- Ease of recognition: Participants’ response to “ease of recognition” was also evaluated under effectiveness evaluation. The aim is to understand the effectiveness of visuals for recognizing hazards when using VR displays and flat screens [47].
3.2.3. Presence Factors
- Immersion: The level of involvement and the feeling of “being there”. This sub-factor measures the effect of immersion on the hazard perception of participants.
- Realism: This sub-factor aims to understand the effect of visual fidelity on depth perception and hazard recognition.
3.2.4. Device Factors
- Weight: Feedback from participants in understanding if the weight of the VR device caused any discomfort during the training
- Sickness: Investigating if the VR headset caused any nausea or disorientation during the training.
- Interaction: This factor aims to understand if training using VR and flat screen offered various levels of interactivity.
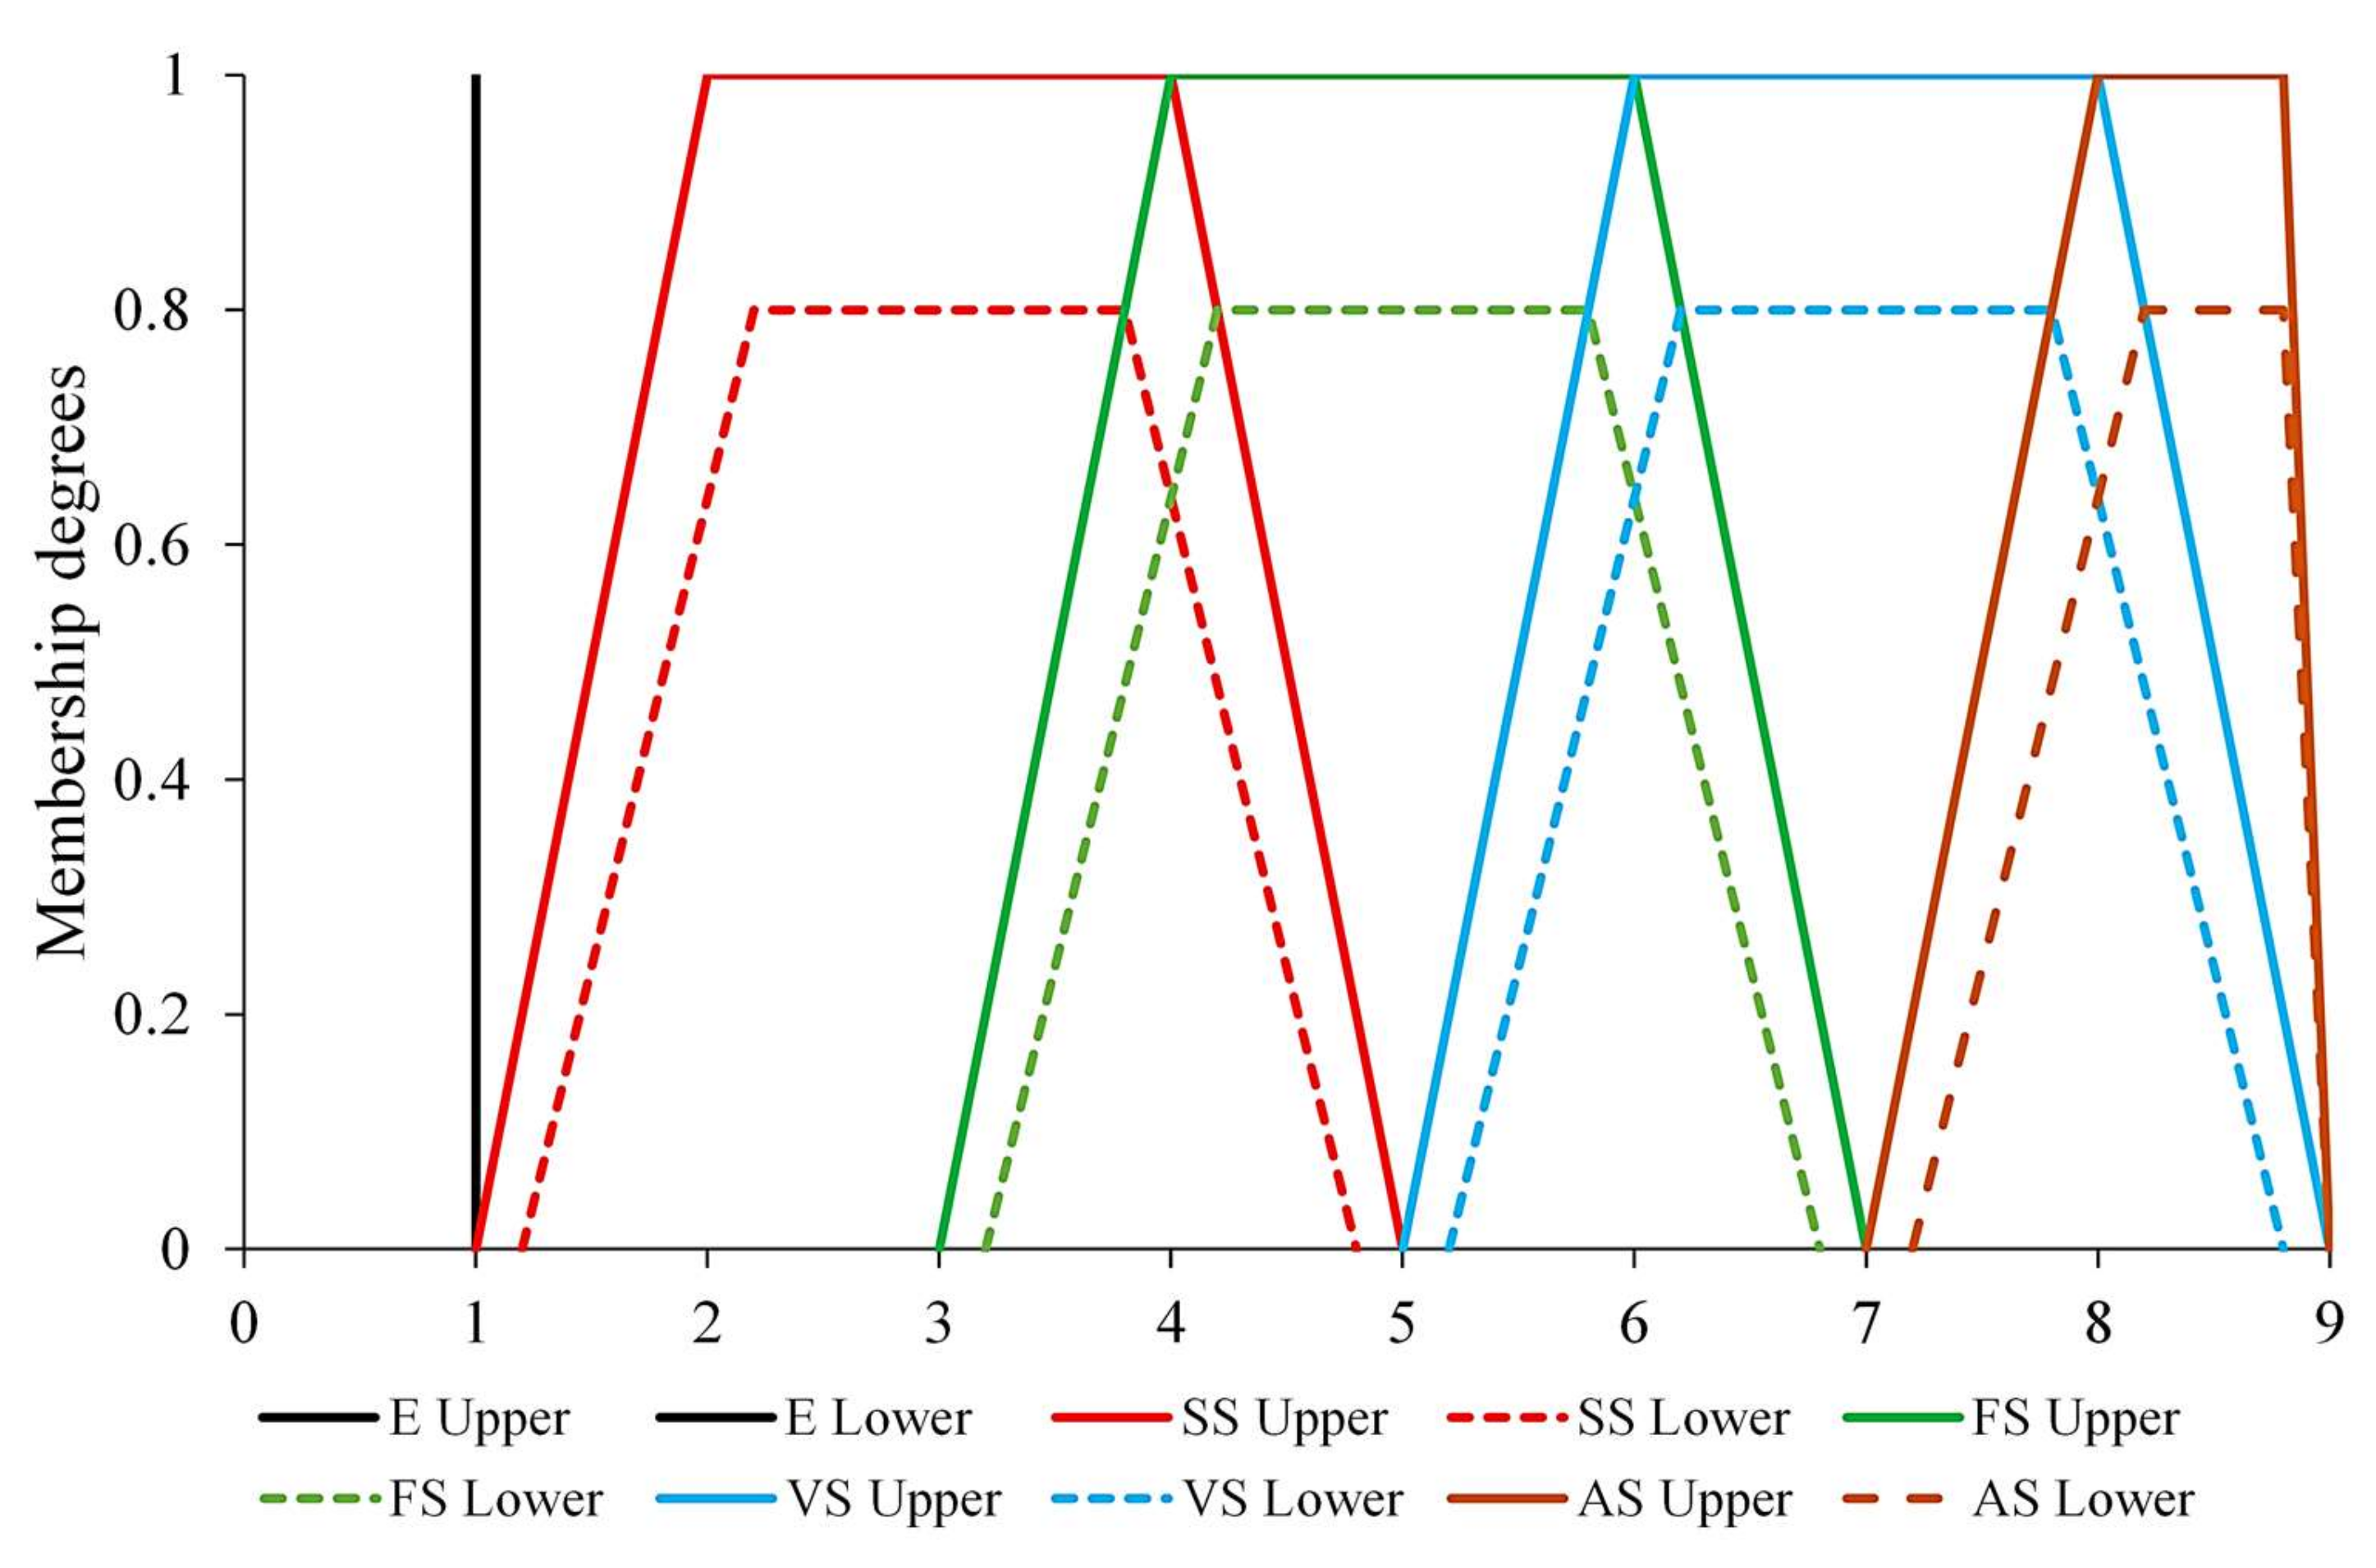
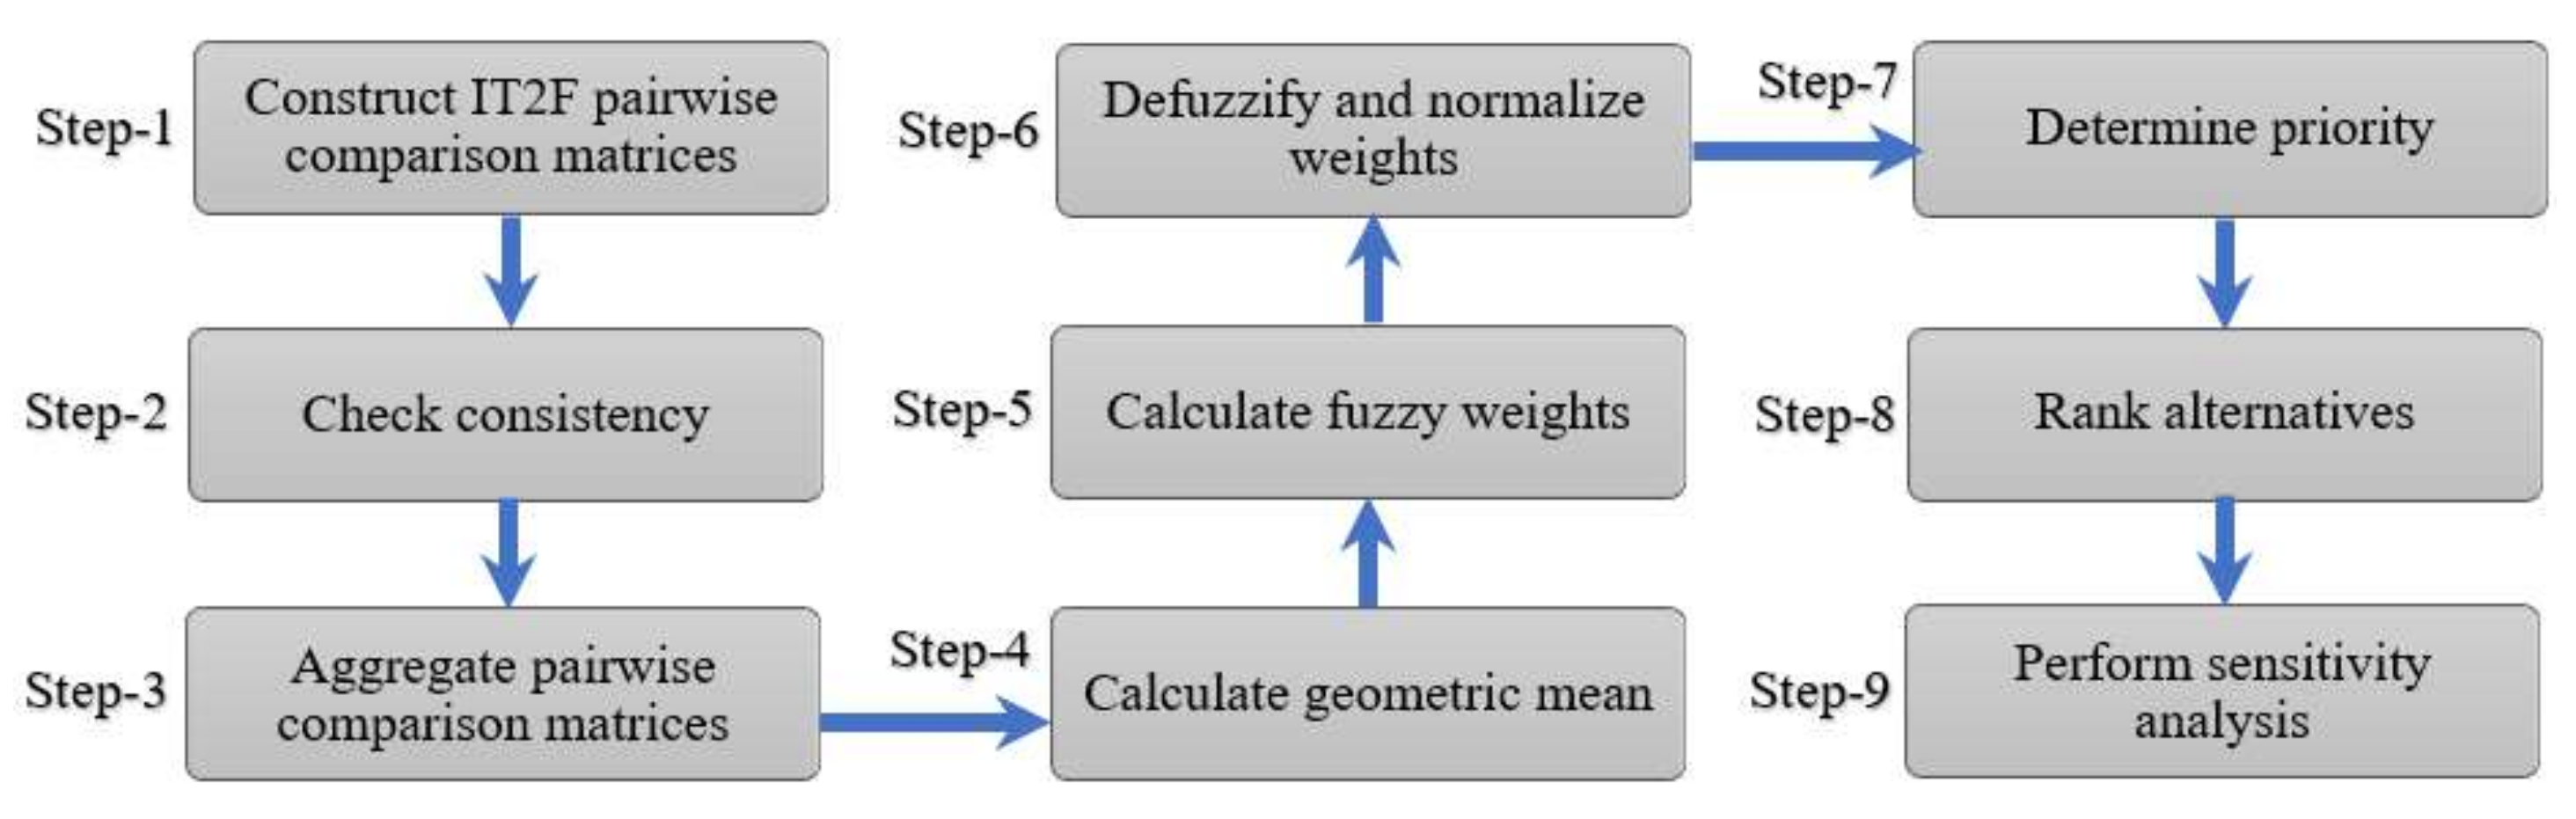
3.3. Interval Type-2 Fuzzy AHP Process
4. Results and Discussion
5. Conclusions
Author Contributions
Funding
Institutional Review Board Statement
Informed Consent Statement
Data Availability Statement
Acknowledgments
Conflicts of Interest
References
- Australia, S.W. Work-related Traumatic Injury Fatalities, Australia. 2020. Available online: https://www.safeworkaustralia.gov.au/sites/default/files/2021-11/Work-related%20traumatic%20injury%20fatalities%20Australia%202020.pdf (accessed on 5 September 2022).
- Gharaie, E.; Lingard, H.; Cooke, T. Causes of Fatal Accidents Involving Cranes in the Australian Construction Industry. Constr. Econ. Build. 2015, 15, 1–12. [Google Scholar] [CrossRef] [Green Version]
- Kazan, E.; Usmen, M.A. Worker safety and injury severity analysis of earthmoving equipment accidents. J. Saf. Res. 2018, 65, 73–81. [Google Scholar] [CrossRef] [PubMed]
- Beavers, J.E.; Moore, J.R.; Rinehart, R.; Schriver, W.R. Crane-Related Fatalities in the Construction Industry. J. Constr. Eng. Manag. 2006, 132, 901–910. [Google Scholar] [CrossRef]
- Raviv, G.; Fishbain, B.; Shapira, A. Analyzing risk factors in crane-related near-miss and accident reports. Saf. Sci. 2017, 91, 192–205. [Google Scholar] [CrossRef]
- Dong, X.S.; Largay, J.A.; Wang, X.; Cain, C.T.; Romano, N. The construction FACE database—Codifying the NIOSH FACE reports. J. Saf. Res. 2017, 62, 217–225. [Google Scholar] [CrossRef]
- Teizer, J.; Cheng, T.; Fang, Y. Location tracking and data visualization technology to advance construction ironworkers’ education and training in safety and productivity. Autom. Constr. 2013, 35, 53–68. [Google Scholar] [CrossRef]
- Dzeng, R.-J.; Lin, C.-T.; Fang, Y.-C. Using eye-tracker to compare search patterns between experienced and novice workers for site hazard identification. Saf. Sci. 2015, 82, 56–67. [Google Scholar] [CrossRef]
- Li, H.; Chan, G.; Skitmore, M. Multiuser Virtual Safety Training System for Tower Crane Dismantlement. J. Comput. Civ. Eng. 2012, 26, 638–647. [Google Scholar] [CrossRef] [Green Version]
- Goh, J.; Hu, S.; Fang, Y. Human-in-the-loop Simulation for Crane Lift Planning in Modular Construction on-site Assembly. In Proceedings of the ASCE International Conference on Computing in Civil Engineering 2019: Visualization, Information Modeling, and Simulation, Atlanta, GA, USA, 17–19 June 2019; pp. 71–78. [Google Scholar]
- Dhalmahapatra, K.; Maiti, J.; Krishna, O. Assessment of virtual reality based safety training simulator for electric overhead crane operations. Saf. Sci. 2021, 139, 105241. [Google Scholar] [CrossRef]
- Zhang, H.; He, X.; Mitri, H. Fuzzy comprehensive evaluation of virtual reality mine safety training system. Saf. Sci. 2019, 120, 341–351. [Google Scholar] [CrossRef]
- Juang, J.; Hung, W.; Kang, S. SimCrane 3D+: A crane simulator with kinesthetic and stereoscopic vision. Adv. Eng. Inform. 2013, 27, 506–518. [Google Scholar] [CrossRef]
- Arashpour, M.; Ngo, T.; Li, H. Scene understanding in construction and buildings using image processing methods: A comprehensive review and a case study. J. Build. Eng. 2020, 33, 101672. [Google Scholar] [CrossRef]
- Arashpour, M.; Kamat, V.; Heidarpour, A.; Hosseini, M.R.; Gill, P. Computer vision for anatomical analysis of equipment in civil infrastructure projects: Theorizing the development of regression-based deep neural networks. Autom. Constr. 2022, 137, 104193. [Google Scholar] [CrossRef]
- Zhang, F.; Fleyeh, H.; Wang, X.; Lu, M. Construction site accident analysis using text mining and natural language processing techniques. Autom. Constr. 2019, 99, 238–248. [Google Scholar] [CrossRef]
- Zhang, W.; Xue, N.; Zhang, J.; Zhang, X. Identification of Critical Causal Factors and Paths of Tower-Crane Accidents in China through System Thinking and Complex Networks. J. Constr. Eng. Manag. 2021, 147, 04021174. [Google Scholar] [CrossRef]
- Zhang, X.; Zhang, W.; Jiang, L.; Zhao, T. Identification of Critical Causes of Tower-Crane Accidents through System Thinking and Case Analysis. J. Constr. Eng. Manag. 2020, 146, 04020071. [Google Scholar] [CrossRef]
- Arashpour, M.; Heidarpour, A.; Nezhad, A.A.; Hosseinifard, Z.; Chileshe, N.; Hosseini, R. Performance-based control of variability and tolerance in off-site manufacture and assembly: Optimization of penalty on poor production quality. Constr. Manag. Econ. 2019, 38, 502–514. [Google Scholar] [CrossRef]
- Sacks, R.; Perlman, A.; Barak, R. Construction safety training using immersive virtual reality. Constr. Manag. Econ. 2013, 31, 1005–1017. [Google Scholar] [CrossRef]
- Buttussi, F.; Chittaro, L. Effects of Different Types of Virtual Reality Display on Presence and Learning in a Safety Training Scenario. IEEE Trans. Vis. Comput. Graph. 2018, 24, 1063–1076. [Google Scholar] [CrossRef]
- Patrão, B.; Menezes, P. A Virtual Reality System for Training Operators. Int. J. Online Biomed. Eng. 2013, 9, S8. [Google Scholar] [CrossRef]
- Arashpour, M.; Golafshani, E.M.; Parthiban, R.; Lamborn, J.; Kashani, A.; Li, H.; Farzanehfar, P. Predicting individual learning performance using machine-learning hybridized with the teaching-learning-based optimization. Comput. Appl. Eng. Educ. 2022. [Google Scholar] [CrossRef]
- Lin, Z.; Petzold, F.; Hsieh, S.H. 4D-BIM based real time augmented reality navigation system for tower crane operation. In Proceedings of the Construction Research Congress 2020: Computer Applications, Tempe, AZ, USA, 8–10 March 2020; pp. 828–836. [Google Scholar]
- He, F.; Ong, S.K.; Nee, A.Y.C. An Integrated Mobile Augmented Reality Digital Twin Monitoring System. Computers 2021, 10, 99. [Google Scholar] [CrossRef]
- Chen, Y.C.; Chi, H.-L.; Kangm, S.-C.; Hsieh, S.-H. A smart crane operations assistance system using augmented reality technology. In Proceedings of the 28th International Symposium on Automation and Robotics in Construction, ISARC 2011, Seoul, Korea, 29 June–2 July 2011. [Google Scholar]
- Zhang, Z.; Pan, W. Virtual reality (VR) supported lift planning for modular integrated construction (MiC) of high-rise buildings. HKIE Trans. 2019, 26, 136–143. [Google Scholar] [CrossRef]
- Zhang, Z.; Pan, W. Virtual reality supported interactive tower crane layout planning for high-rise modular integrated construction. Autom. Constr. 2021, 130, 103854. [Google Scholar] [CrossRef]
- Kayhani, N.; Taghaddos, H.; Noghabaee, M.; Hermann, U. Utilization of virtual reality visualizations on heavy mobile crane planning for modular construction. In Proceedings of the ISARC 2018—35th International Symposium on Automation and Robotics in Construction and International AEC/FM Hackathon: The Future of Building Things, Berlin, Germany, 20–25 July 2018; pp. 1226–1230. [Google Scholar]
- Perlman, A.; Sacks, R.; Barak, R. Hazard recognition and risk perception in construction. Saf. Sci. 2014, 64, 22–31. [Google Scholar] [CrossRef]
- Lee, H.; Kim, H.; Monteiro, D.V.; Goh, Y.; Han, D.; Liang, H.-N.; Yang, H.S.; Jung, J. Annotation vs. Virtual Tutor: Comparative Analysis on the Effectiveness of Visual Instructions in Immersive Virtual Reality. In Proceedings of the 2019 IEEE International Symposium on Mixed and Augmented Reality (ISMAR), Beijing, China, 14–18 October 2019; pp. 318–327. [Google Scholar] [CrossRef]
- Wang, Y.; Chardonnet, J.-R.; Merienne, F. Enhanced cognitive workload evaluation in 3D immersive environments with TOPSIS model. Int. J. Hum. Comput. Stud. 2021, 147, 102572. [Google Scholar] [CrossRef]
- Çolak, M.; Kaya, İ. Prioritization of renewable energy alternatives by using an integrated fuzzy MCDM model: A real case application for Turkey. Renew. Sust. Energy Rev. 2017, 80, 840–853. [Google Scholar] [CrossRef]
- Ayodele, T.; Ogunjuyigbe, A.; Odigie, O.; Munda, J. A multi-criteria GIS based model for wind farm site selection using interval type-2 fuzzy analytic hierarchy process: The case study of Nigeria. Appl. Energy 2018, 228, 1853–1869. [Google Scholar] [CrossRef]
- Bourhim, E.M.; Cherkaoui, A. Efficacy of Virtual Reality for Studying People’s Pre-evacuation Behavior under Fire. Int. J. Hum. Comput. Stud. 2020, 142, 102484. [Google Scholar] [CrossRef]
- Yazdani-Chamzini, A.; Yakhchali, S.H. Tunnel Boring Machine (TBM) selection using fuzzy multicriteria decision making methods. Tunn. Undergr. Space Technol. 2012, 30, 194–204. [Google Scholar] [CrossRef]
- Zhang, F.; Ju, Y.; Gonzalez, E.D.S.; Wang, A. SNA-based multi-criteria evaluation of multiple construction equipment: A case study of loaders selection. Adv. Eng. Inform. 2020, 44, 101056. [Google Scholar] [CrossRef]
- Ilbahar, E.; Karaşan, A.; Cebi, S.; Kahraman, C. A novel approach to risk assessment for occupational health and safety using Pythagorean fuzzy AHP & fuzzy inference system. Saf. Sci. 2018, 103, 124–136. [Google Scholar] [CrossRef]
- Taylan, O.; Bafail, A.O.; Abdulaal, R.M.; Kabli, M.R. Construction projects selection and risk assessment by fuzzy AHP and fuzzy TOPSIS methodologies. Appl. Soft Comput. 2014, 17, 105–116. [Google Scholar] [CrossRef]
- Ramanathan, R. Multicriteria Analysis of Energy. In Encyclopedia of Energy; Cleveland, C.J., Ed.; Elsevier: New York, NY, USA, 2004; pp. 77–88. [Google Scholar]
- Hopkins, L.D. Multi-attribute decision making in urban studies. In International Encyclopedia of the Social & Behavioral Sciences; Smelser, N.J., Baltes, P.B., Eds.; Pergamon: Oxford, UK, 2001; pp. 10157–10160. [Google Scholar]
- Unity—Game Engine Release 2020.3.2f1, Unity Technologies: San Fransico 2022. Available online: https://unity3d.com/get-unity/download/archive (accessed on 3 August 2021).
- Raimbaud, P.; Lou, R.; Danglade, F.; Figueroa, P.; Hernandez, J.; Merienne, F. A Task-Centred Methodology to Evaluate the Design of Virtual Reality User Interactions: A Case Study on Hazard Identification. Buildings 2021, 11, 277. [Google Scholar] [CrossRef]
- Kim, S.-Y. Effects of Military Training Based on the Virtual Reality of Army Using AHP Method. Turk. J. Comput. Math. Educ. 2021, 12, 551–556. [Google Scholar]
- Anderson, L.W.; Krathwohl, D.R.; Bloom, B.S. A taxonomy for learning teaching and assessing. In A Taxonomy for Learning, Teaching, and Assessing: A Revision of Bloom’s Taxonomy of Educational Objectives; Pearson Education Limited: London, UK, 2001. [Google Scholar]
- Afzal, M.; Shafiq, M. Evaluating 4D-BIM and VR for Effective Safety Communication and Training: A Case Study of Multilingual Construction Job-Site Crew. Buildings 2021, 11, 319. [Google Scholar] [CrossRef]
- Tan, Y.; Xu, W.; Li, S.; Chen, K. Augmented and Virtual Reality (AR/VR) for Education and Training in the AEC Industry: A Systematic Review of Research and Applications. Buildings 2022, 12, 1529. [Google Scholar] [CrossRef]
- Witmer, B.G.; Jerome, C.J.; Singer, M.J. The Factor Structure of the Presence Questionnaire. PRESENCE Teleoperators Virtual Augment. Real. 2005, 14, 298–312. [Google Scholar] [CrossRef]
- Perroud, B.; Régnier, S.; Kemeny, A.; Merienne, F. Model of realism score for immersive VR systems. Transp. Res. Part F Traffic Psychol. Behav. 2019, 61, 238–251. [Google Scholar] [CrossRef] [Green Version]
- Kurilovas, E.; Vinogradova, I. Improved fuzzy AHP methodology for evaluating quality of distance learning courses. Int. J. Eng. Educ. 2016, 32, 1618–1624. [Google Scholar]
- Try, S.; Panuwatwanich, K.; Tanapornraweekit, G.; Kaewmoracharoen, M. Virtual reality application to aid civil engineering laboratory course: A multicriteria comparative study. Comput. Appl. Eng. Educ. 2021, 29, 1771–1792. [Google Scholar] [CrossRef]
- Saaty, T.L. What is the analytic hierarchy process? In Mathematical Models for Decision Support; Springer: Berlin/Heidelberg, Germany, 1988; pp. 109–121. [Google Scholar]
- Zadeh, L.A. Fuzzy sets. Inform. Control 1965, 8, 338–353. [Google Scholar] [CrossRef] [Green Version]
- Zadeh, L.A. The concept of a linguistic variable and its application to approximate reasoning—I. Inf. Sci. 1975, 8, 199–249. [Google Scholar] [CrossRef]
- Mendel, J.M.; John, R.I.; Liu, F. Interval Type-2 Fuzzy Logic Systems Made Simple. IEEE Trans. Fuzzy Syst. 2006, 14, 808–821. [Google Scholar] [CrossRef] [Green Version]
- Kahraman, C.; Öztayşi, B.; Sarı, I.U.; Turanoğlu, E. Fuzzy analytic hierarchy process with interval type-2 fuzzy sets. Knowl. Based Syst. 2014, 59, 48–57. [Google Scholar] [CrossRef]
- Chen, S.-M.; Lee, L.-W. Fuzzy multiple attributes group decision-making based on the interval type-2 TOPSIS method. Expert Syst. Appl. 2010, 37, 2790–2798. [Google Scholar] [CrossRef]
- Chen, S.-M.; Chen, J.-H. Fuzzy risk analysis based on similarity measures between interval-valued fuzzy numbers and interval-valued fuzzy number arithmetic operators. Expert Syst. Appl. 2009, 36, 6309–6317. [Google Scholar] [CrossRef]
- Karnik, N.N.; Mendel, J.M. Operations on type-2 fuzzy sets. Fuzzy Sets Syst. 2001, 122, 327–348. [Google Scholar] [CrossRef]
- Niewiadomski, A.; Ochelska, J.; Szczepaniak, P.S. Interval-valued linguistic summaries of databases. Control Cybern. 2006, 35, 415–443. [Google Scholar]
- Chen, S.-M.; Lee, L.-W. Fuzzy multiple attributes group decision-making based on the ranking values and the arithmetic operations of interval type-2 fuzzy sets. Expert Syst. Appl. 2010, 37, 824–833. [Google Scholar] [CrossRef]
- Lee, L.-W.; Chen, S.-M. Fuzzy multiple attributes group decision-making based on the extension of TOPSIS method and interval type-2 fuzzy sets. In Proceedings of the 2008 International Conference on Machine Learning and Cybernetics, Kunming, China, 12–15 July 2008; pp. 3260–3265. [Google Scholar]
- Buckley, J.J. Fuzzy hierarchical analysis. Fuzzy Sets Syst. 1985, 17, 233–247. [Google Scholar] [CrossRef]


| Linguistic Variables | Trapezoidal IT2F Scales |
|---|---|
| Absolutely Strong (AS) | ((7, 8, 9, 9; 1, 1), (7.2, 8.2, 8.8, 9; 0.8, 0.8)) |
| Very Strong (VS) | ((5, 6, 8, 9; 1, 1), (5.2, 6.2, 7.8, 8.8; 0.8, 0.8)) |
| Fairly Strong (FS) | ((3, 4, 6, 7; 1, 1), (3.2, 4.2, 5.8, 6.8; 0.8, 0.8)) |
| Slightly Strong (SS) | ((1, 2, 4, 5; 1, 1), (1.2, 2.2, 3.8, 4.8; 0.8, 0.8)) |
| Exactly Equal (E) | ((1, 1, 1, 1; 1, 1), (1, 1, 1, 1; 1, 1)) |
| Performance | Effectiveness | Presence | Device | |
|---|---|---|---|---|
| P | ((1, 1, 1, 1; 1, 1), (1, 1, 1, 1; 1, 1)) | ((0.66, 0.75, 0.98, 1.15; 1, 1), (0.68, 0.77, 0.94, 1.11; 0.8, 0.8)) | ((0.56, 0.67, 0.91, 1.09; 1, 1), (0.58, 0.69, 0.88, 1.04; 0.8, 0.8)) | ((0.84, 1.19, 1.89, 2.39; 1, 1), (0.92, 1.24, 1.81, 2.27; 0.8, 0.8)) |
| E | ((0.86, 1.04, 1.34, 1.51; 1, 1), (0.9, 1.06, 1.3; 0.8, 0.8)) | ((1, 1, 1, 1; 1, 1), (1, 1, 1, 1; 1, 1)) | ((0.46, 0.56, 0.86, 1.18; 1, 1), (0.49, 0.58, 0.81, 1.09; 0.8, 0.8)) | ((0.94, 1.2, 1.7, 2.03; 1, 1), (1, 1.24, 1.63, 1.95; 0.8, 0.8)) |
| Pr | ((0.92, 1.11, 1.49, 1.77; 1, 1), (0.96, 1.13, 1.44; 0.8, 0.8)) | ((0.84, 1.18, 1.78, 2.14; 1, 1), (0.92, 1.22, 1.72, 2.06; 0.8, 0.8)) | ((1, 1, 1, 1; 1, 1), (1, 1, 1, 1; 1, 1)) | ((2.39, 3.07, 4.26, 4.82; 1, 1), (2.53, 3.19, 4.15, 4.71; 0.8, 0.8)) |
| D | ((0.42, 0.53, 0.85, 1.18; 1, 1), (0.44, 0.55, 0.8; 0.8, 0.8)) | ((0.49, 0.6, 0.84, 1.06; 1, 1), (0.51, 0.61, 0.8, 1; 0.8, 0.8)) | ((0.2, 0.24, 0.33, 0.42; 1, 1), (0.21, 0.24, 0.31, 0.39; 0.8, 0.8)) | ((1, 1, 1, 1; 1, 1), (1, 1, 1, 1; 1, 1)) |
| EO | EN | LE | RA | |
|---|---|---|---|---|
| EO | ((1, 1, 1, 1; 1, 1), (1, 1, 1, 1; 1, 1)) | ((1.37, 1.82, 2.74, 3.44; 1, 1), (1.46, 1.9, 2.61, 3.25; 0.8, 0.8)) | ((0.44, 0.61, 0.95, 1.25; 1, 1), (0.47, 0.63, 0.9, 1.16; 0.8, 0.8)) | ((0.37, 0.42, 0.54, 0.6; 1, 1), (0.38, 0.43, 0.51, 0.59; 0.8, 0.8)) |
| EN | ((0.29, 0.37, 0.56, 0.73; 1, 1), (0.31, 0.38, 0.52; 0.8, 0.8)) | ((1, 1, 1, 1; 1, 1), (1, 1, 1, 1; 1, 1)) | ((0.13, 0.15, 0.21, 0.27; 1, 1), (0.13, 0.15, 0.2, 0.25; 0.8, 0.8)) | ((0.33, 0.41, 0.61, 0.78; 1, 1), (0.35, 0.42, 0.57, 0.73; 0.8, 0.8)) |
| LE | ((0.8, 1.06, 1.68, 2.27; 1, 1), (0.85, 1.1, 1.58; 0.8, 0.8)) | ((3.71, 4.84, 6.81, 7.67; 1, 1), (3.95, 5.06, 6.61, 7.5; 0.8, 0.8)) | ((1, 1, 1, 1; 1, 1), (1, 1, 1, 1; 1, 1)) | ((0.99, 1.39, 2.09, 2.47; 1, 1), (1.07, 1.45, 2, 2.38; 0.8, 0.8)) |
| RA | ((1.65, 1.9, 2.39, 2.71; 1, 1), (1.69, 1.94, 2.3; 0.8, 0.8)) | ((1.27, 1.67, 2.46, 2.97; 1, 1), (1.36, 1.74, 2.35, 2.85; 0.8, 0.8)) | ((0.4, 0.48, 0.73, 1; 1, 1), (0.42, 0.5, 0.69, 0.93; 0.8, 0.8)) | ((1, 1, 1, 1; 1, 1), (1, 1, 1, 1; 1, 1)) |
| OU | PU | ER | |
|---|---|---|---|
| OU | ((1, 1, 1, 1; 1, 1), (1, 1, 1, 1; 1, 1)) | ((0.49, 0.61, 0.91, 1.18; 1, 1), (0.52, 0.63, 0.87, 1.11; 0.8, 0.8)) | ((0.18, 0.21, 0.28, 0.35; 1, 1), (0.18, 0.21, 0.27, 0.34; 0.8, 0.8)) |
| PU | ((0.84, 1.11, 1.64, 2.03; 1, 1), (0.9, 1.15, 1.58; 0.8, 0.8)) | ((1, 1, 1, 1; 1, 1), (1, 1, 1, 1; 1, 1)) | ((0.19, 0.23, 0.32, 0.39; 1, 1), (0.2, 0.23, 0.3, 0.37; 0.8, 0.8)) |
| ER | ((2.81, 3.58, 4.91, 5.52; 1, 1), (2.96, 3.72, 4.75; 0.8, 0.8)) | ((2.54, 3.19, 4.44, 5.2; 1, 1), (2.68, 3.32, 4.29, 5.02; 0.8, 0.8)) | ((1, 1, 1, 1; 1, 1), (1, 1, 1, 1; 1, 1)) |
| IM | RL | |
|---|---|---|
| IM | ((1, 1, 1, 1; 1, 1), (1, 1, 1, 1; 1, 1)) | ((0.48, 0.73, 1.37, 2.07; 1, 1), (0.54, 0.77, 1.28, 1.87; 0.8, 0.8)) |
| RL | ((0.48, 0.73, 1.37, 2.07; 1, 1), (0.54, 0.77, 1.28; 0.8, 0.8)) | ((1, 1, 1, 1; 1, 1), (1, 1, 1, 1; 1, 1)) |
| W | SK | IT | |
|---|---|---|---|
| W | ((1, 1, 1, 1; 1, 1), (1, 1, 1, 1; 1, 1)) | ((0.25, 0.31, 0.52, 0.85; 1, 1), (0.26, 0.31, 0.48, 0.75; 0.8, 0.8)) | ((0.92, 1.28, 1.97, 2.37; 1, 1), (0.99, 1.34, 1.89, 2.28; 0.8, 0.8)) |
| SK | ((1.17, 1.92, 3.3, 3.97; 1, 1), (1.33, 2.06, 3.15; 0.8, 0.8)) | ((1, 1, 1, 1; 1, 1), (1, 1, 1, 1; 1, 1)) | ((1.12, 1.6, 2.75, 3.81; 1, 1), (1.22, 1.69, 2.59, 3.52; 0.8, 0.8)) |
| IT | ((0.42, 0.51, 0.79, 1.08; 1, 1), (0.44, 0.52, 0.75; 0.8, 0.8)) | ((0.26, 0.37, 0.63, 0.9; 1, 1), (0.28, 0.38, 0.59, 0.82; 0.8, 0.8)) | ((1, 1, 1, 1; 1, 1), (1, 1, 1, 1; 1, 1)) |
| Factors | Fuzzy Weights | Crisp Weights | Normalized Weights |
|---|---|---|---|
| Performance Factors | ((0.14, 0.18, 0.32, 0.44; 1, 1), (0.14, 0.2, 0.3, 0.39; 0.8, 0.8)) | 0.2513 | 0.2621 |
| Efficiency Factors | ((0.13, 0.18, 0.31, 0.43; 1, 1), (0.15, 0.2, 0.3, 0.39; 0.8, 0.8)) | 0.2488 | 0.2595 |
| Presence Factors | ((0.12, 0.17, 0.29, 0.39; 1, 1), (0.13, 0.17, 0.27, 0.36; 0.8, 0.8)) | 0.2265 | 0.2362 |
| Device Factors | ((0.12, 0.17, 0.29, 0.4; 1, 1), (0.14, 0.18, 0.28, 0.37; 0.8, 0.8)) | 0.2323 | 0.2422 |
| Fuzzy Weights | Crisp Weights | Normalized Local Weights | |
|---|---|---|---|
| Weights of subfactors for Performance Factors | |||
| EO | ((0.11, 0.16, 0.28, 0.39; 1, 1), (0.12, 0.17, 0.26, 0.37; 0.8, 0.8)) | 0.2218 | 0.2534 |
| EN | ((0.12, 0.16, 0.27, 0.36; 1, 1), (0.13, 0.17, 0.25, 0.33; 0.8, 0.8)) | 0.2133 | 0.2437 |
| LE | ((0.09, 0.15, 0.27, 0.38; 1, 1), (0.11, 0.15, 0.26, 0.37; 0.8, 0.8)) | 0.2123 | 0.2426 |
| RA | ((0.12, 0.17, 0.29, 0.39; 1, 1), (0.14, 0.18, 0.26, 0.36; 0.8, 0.8)) | 0.2278 | 0.2603 |
| Weights of subfactors for Efficiency Factors | |||
| OU | ((0.18, 0.23, 0.35, 0.44; 1, 1), (0.18, 0.24, 0.33, 0.42; 0.8, 0.8)) | 0.2820 | 0.3316 |
| PU | ((0.16, 0.21, 0.35, 0.46; 1, 1), (0.17, 0.22, 0.33, 0.43; 0.8, 0.8)) | 0.2775 | 0.3263 |
| ER | ((0.17, 0.23, 0.36, 0.49; 1, 1), (0.18, 0.23, 0.33, 0.45; 0.8, 0.8)) | 0.2910 | 0.3422 |
| Weights of subfactors for Presence Factors | |||
| IM | ((0.23, 0.36, 0.68, 0.98; 1, 1), (0.26, 0.39, 0.63, 0.89; 0.8, 0.8)) | 0.5270 | 0.5000 |
| RL | ((0.23, 0.36, 0.68, 0.98; 1, 1), (0.26, 0.39, 0.63, 0.89; 0.8, 0.8)) | 0.5270 | 0.5000 |
| Weights of subfactors for Device Factors | |||
| W | ((0.15, 0.21, 0.39, 0.58; 1, 1), (0.16, 0.23, 0.37, 0.53; 0.8, 0.8)) | 0.3125 | 0.3125 |
| SK | ((0.12, 0.2, 0.46, 0.74; 1, 1), (0.14, 0.23, 0.42, 0.67; 0.8, 0.8)) | 0.3563 | 0.3563 |
| IT | ((0.16, 0.23, 0.42, 0.59; 1, 1), (0.18, 0.25, 0.4, 0.55; 0.8, 0.8)) | 0.3313 | 0.3313 |
| Ease of Operation | Fuzzy Weights | Crisp Weights | Normalized Weight |
|---|---|---|---|
| Ease of Operation | |||
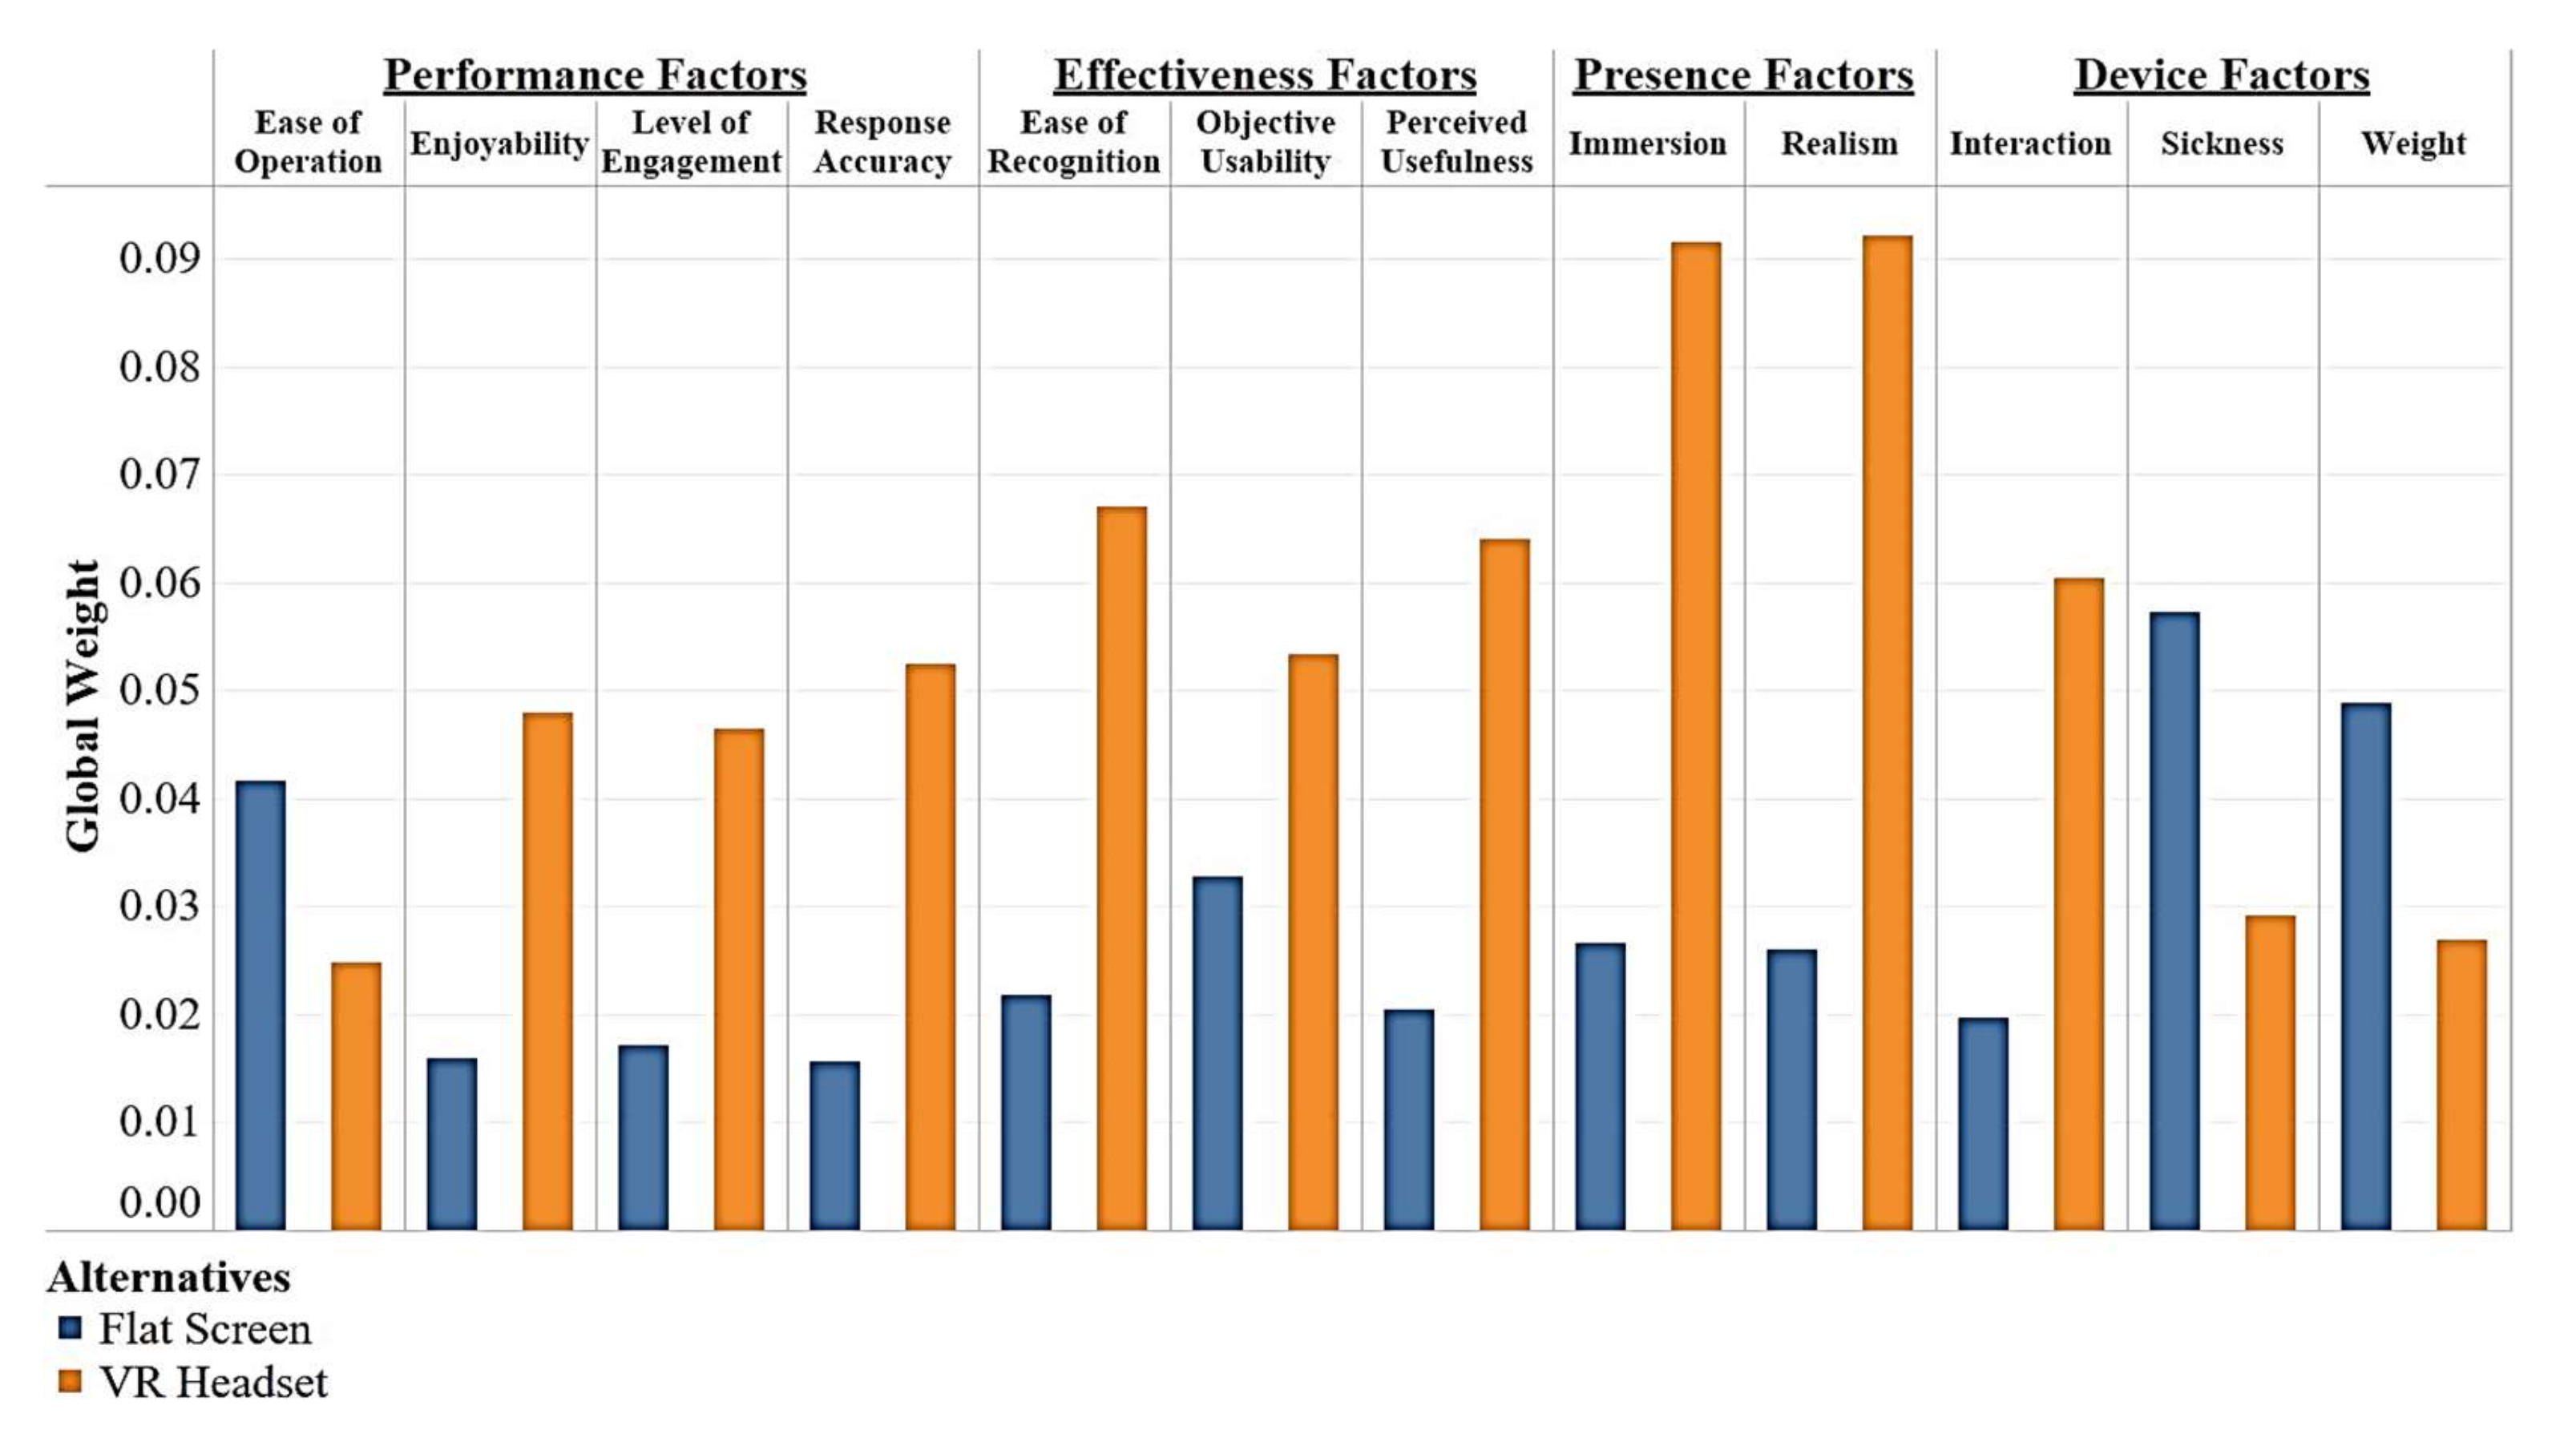
| Flat | ((2.09, 2.43, 3.06, 3.39; 1, 1), (2.14, 2.48, 2.97, 3.31; 0.8, 0.8)) | 2.5975 | 0.6270 |
| VR | ((1.41, 1.49, 1.71, 1.91; 1, 1), (1.44, 1.5, 1.68, 1.86; 0.8, 0.8)) | 1.5455 | 0.3730 |
| Enjoyability | |||
| Flat | ((0.31, 0.38, 0.5, 0.59; 1, 1), (0.33, 0.38, 0.48, 0.58; 0.8, 0.8)) | 1.2785 | 0.2483 |
| VR | ((0.26, 0.33, 0.56, 0.73; 1, 1), (0.27, 0.36, 0.53, 0.69; 0.8, 0.8)) | 3.8710 | 0.7517 |
| Level of Engagement | |||
| Flat | ((0.31, 0.38, 0.5, 0.59; 1, 1), (0.33, 0.38, 0.48, 0.58; 0.8, 0.8)) | 1.3203 | 0.2692 |
| VR | ((0.26, 0.33, 0.56, 0.73; 1, 1), (0.27, 0.36, 0.53, 0.69; 0.8, 0.8)) | 3.5843 | 0.7308 |
| Response Accuracy | |||
| Flat | ((0.37, 0.41, 0.48, 0.52; 1, 1), (0.39, 0.42, 0.47, 0.51; 0.8, 0.8)) | 1.2438 | 0.2297 |
| VR | ((0.34, 0.39, 0.5, 0.58; 1, 1), (0.36, 0.4, 0.48, 0.55; 0.8, 0.8)) | 4.1715 | 0.7703 |
| Objective Usability | |||
| Flat | ((0.31, 0.41, 0.61, 0.75; 1, 1), (0.33, 0.42, 0.58, 0.72; 0.8, 0.8)) | 1.5685 | 0.3809 |
| VR | ((0.3, 0.4, 0.62, 0.78; 1, 1), (0.32, 0.41, 0.6, 0.75; 0.8, 0.8)) | 2.5498 | 0.6191 |
| Perceived Usefulness | |||
| Flat | ((0.29, 0.38, 0.58, 0.74; 1, 1), (0.3, 0.4, 0.55, 0.71; 0.8, 0.8)) | 1.2643 | 0.2424 |
| VR | ((0.24, 0.35, 0.63, 0.88; 1, 1), (0.27, 0.38, 0.6, 0.82; 0.8, 0.8)) | 3.9505 | 0.7576 |
| Ease of Recognition | |||
| Flat | ((0.32, 0.4, 0.55, 0.67; 1, 1), (0.34, 0.41, 0.53, 0.64; 0.8, 0.8)) | 1.2810 | 0.2457 |
| VR | ((0.28, 0.37, 0.6, 0.78; 1, 1), (0.3, 0.38, 0.57, 0.73; 0.8, 0.8)) | 3.9323 | 0.7543 |
| Immersion | |||
| Flat | ((0.33, 0.36, 0.45, 0.51; 1, 1), (0.33, 0.37, 0.44, 0.5; 0.8, 0.8)) | 1.2320 | 0.2255 |
| VR | ((0.28, 0.33, 0.49, 0.6; 1, 1), (0.28, 0.35, 0.48, 0.58; 0.8, 0.8)) | 4.2315 | 0.7745 |
| Realism | |||
| Flat | ((0.3, 0.35, 0.45, 0.51; 1, 1), (0.31, 0.36, 0.43, 0.48; 0.8, 0.8)) | 1.2308 | 0.2198 |
| VR | ((0.24, 0.32, 0.49, 0.64; 1, 1), (0.26, 0.33, 0.46, 0.61; 0.8, 0.8)) | 4.3695 | 0.7802 |
| Weight | |||
| Flat | ((0.24, 0.35, 0.59, 0.83; 1, 1), (0.27, 0.36, 0.56, 0.76; 0.8, 0.8)) | 2.8550 | 0.6443 |
| VR | ((0.18, 0.31, 0.67, 1.06; 1, 1), (0.21, 0.33, 0.62, 0.95; 0.8, 0.8)) | 1.5765 | 0.3557 |
| Sickness | |||
| Flat | ((0.41, 0.45, 0.5, 0.55; 1, 1), (0.41, 0.45, 0.5, 0.54; 0.8, 0.8)) | 2.9223 | 0.6633 |
| VR | ((0.38, 0.43, 0.53, 0.58; 1, 1), (0.4, 0.44, 0.51, 0.57; 0.8, 0.8)) | 1.4833 | 0.3367 |
| Interaction | |||
| Flat | ((0.29, 0.38, 0.58, 0.74; 1, 1), (0.3, 0.4, 0.55, 0.71; 0.8, 0.8)) | 1.2810 | 0.2457 |
| VR | ((0.24, 0.35, 0.63, 0.88; 1, 1), (0.27, 0.38, 0.6, 0.82; 0.8, 0.8)) | 3.9323 | 0.7543 |
| Subfactors | Type-1 Fuzzy AHP | IT2F-AHP | ||
|---|---|---|---|---|
| Global Weights | Ranking | Global Weights | Ranking | |
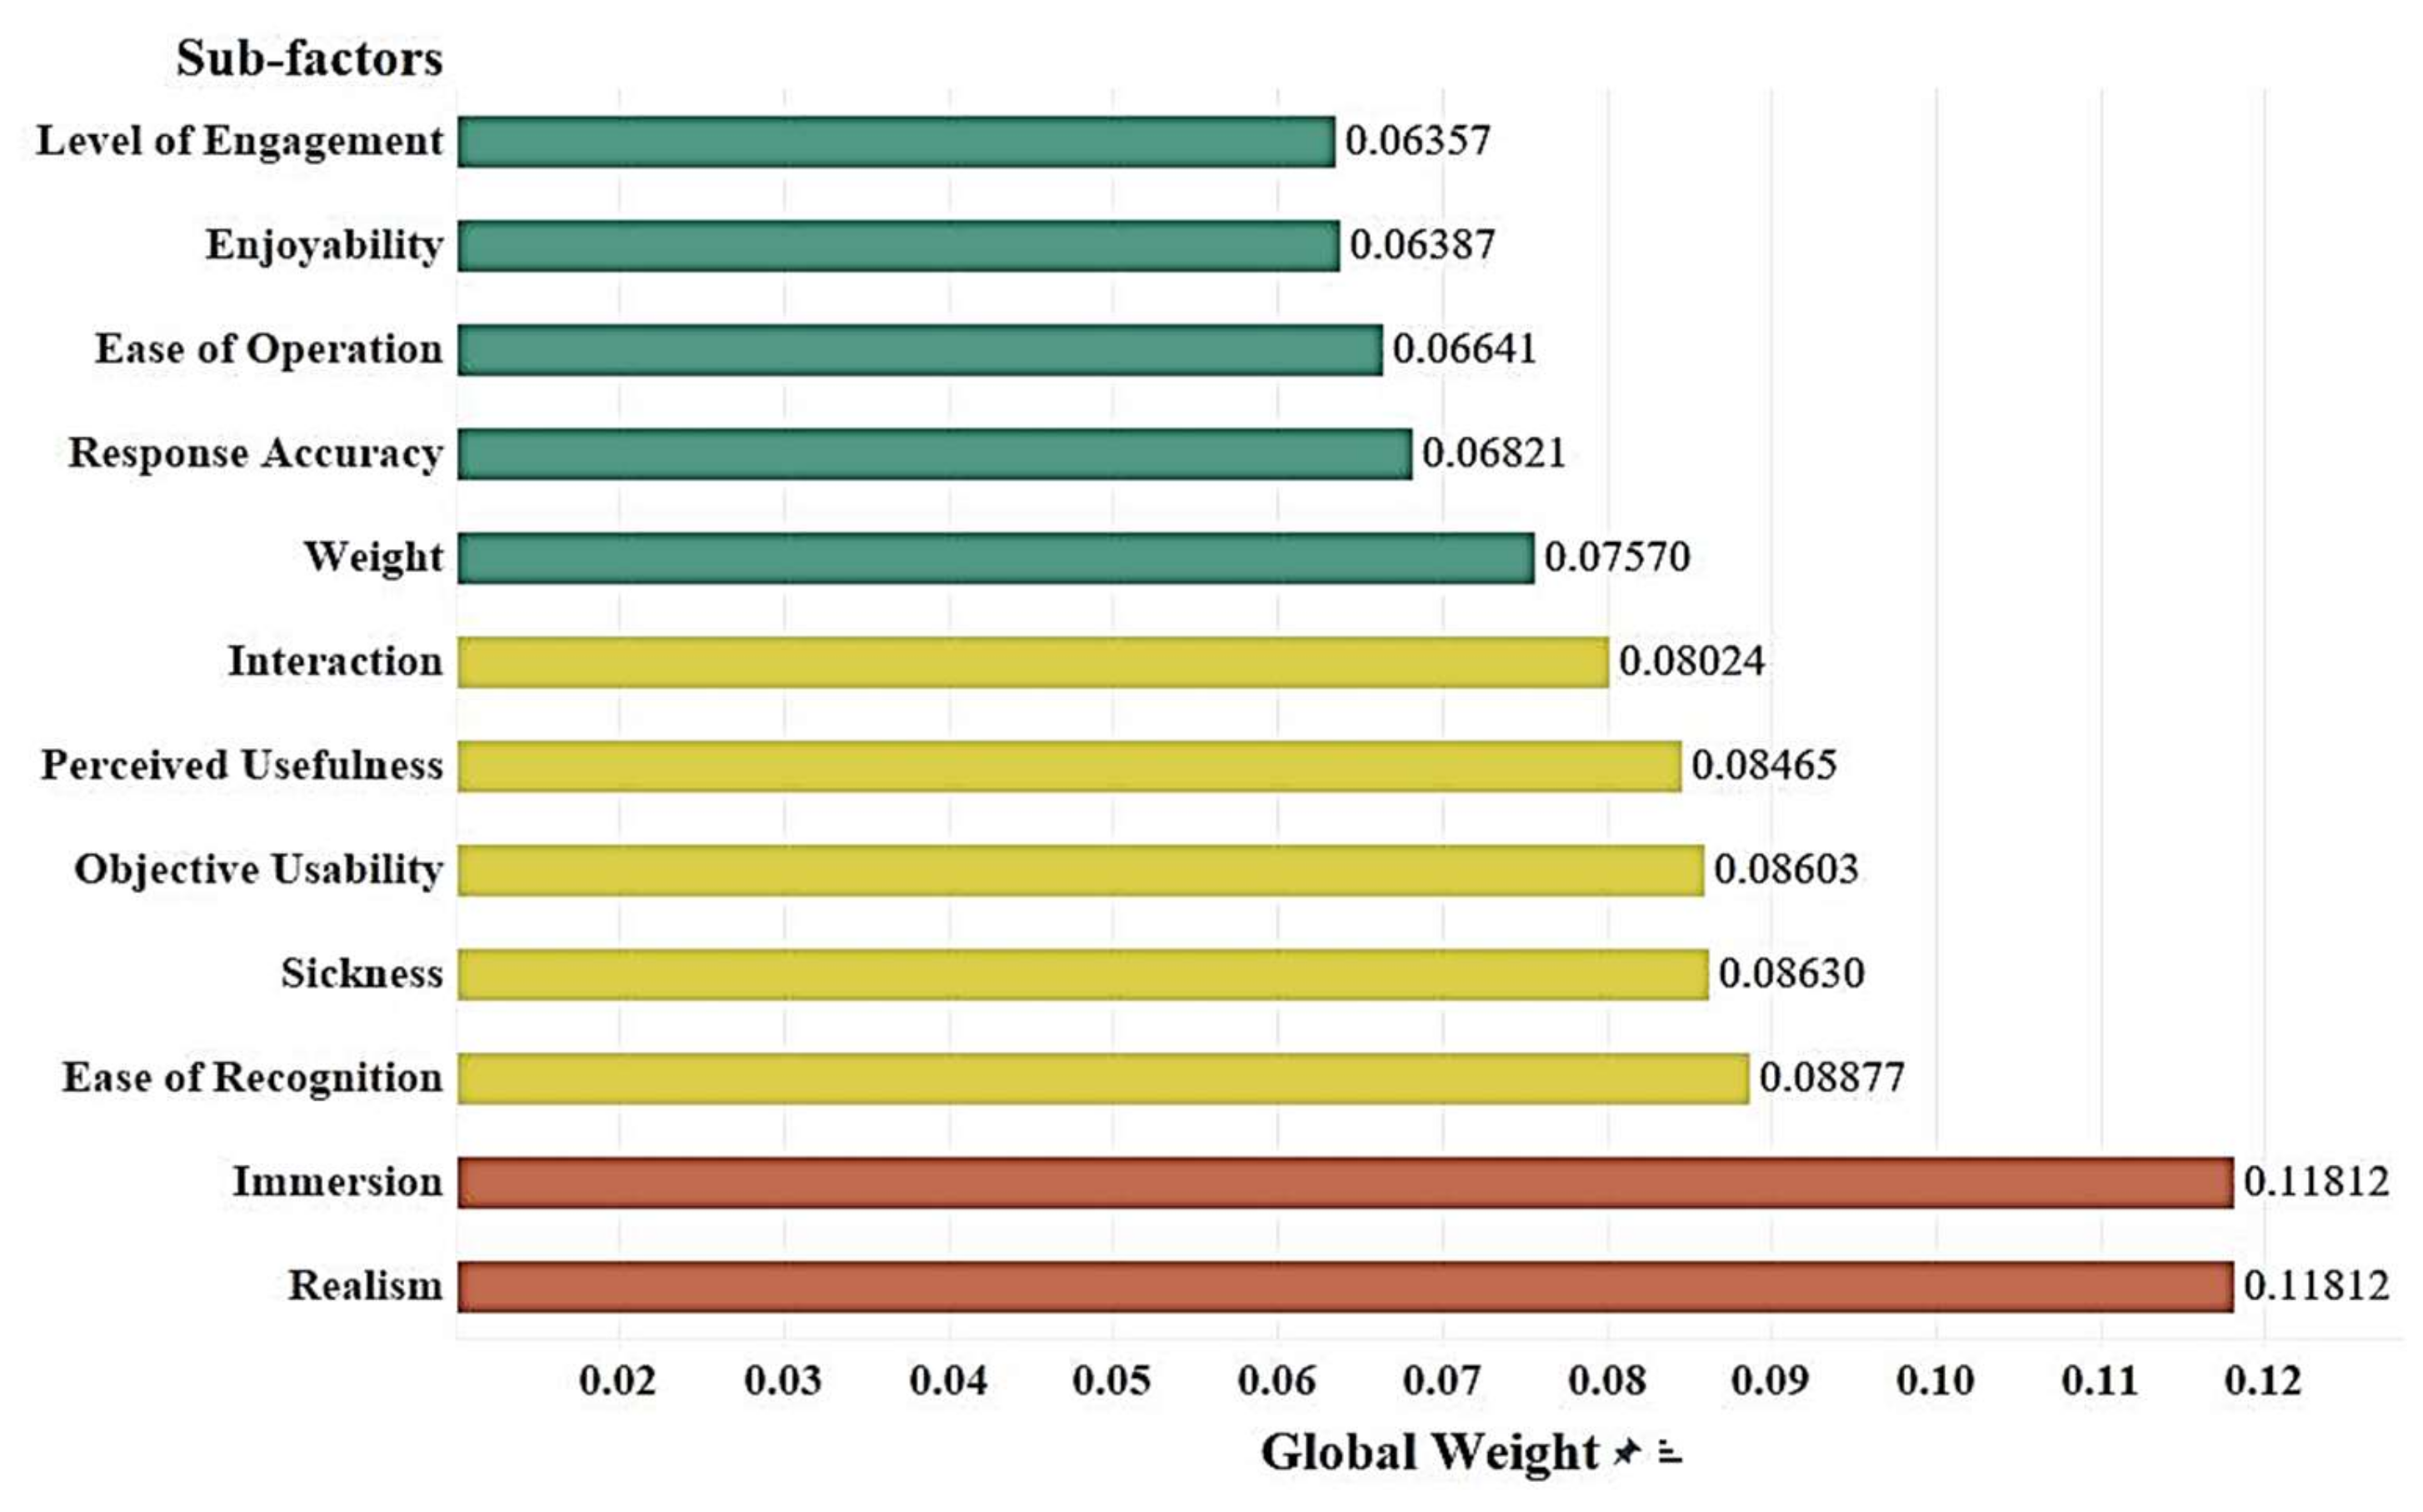
| Realism | 0.1187 | 1 | 0.1181 | 1 |
| Immersion | 0.1187 | 2 | 0.1181 | 2 |
| Ease of Recognition | 0.0888 | 3 | 0.0888 | 3 |
| Sickness | 0.0863 | 4 | 0.0863 | 4 |
| Objective Usability | 0.0850 | 5 | 0.0860 | 5 |
| Perceived Usefulness | 0.0837 | 6 | 0.0847 | 6 |
| Interaction | 0.0788 | 7 | 0.0802 | 7 |
| Weight | 0.0751 | 8 | 0.0757 | 8 |
| Response Accuracy | 0.0692 | 9 | 0.0682 | 9 |
| Ease of Operation | 0.0672 | 10 | 0.0664 | 10 |
| Enjoyability | 0.0649 | 11 | 0.0639 | 11 |
| Level of Engagement | 0.0636 | 12 | 0.0636 | 12 |
| Cases | Description |
|---|---|
| Case 1 | Current Case |
| Case 2 | Medium-high weight of Performance Factors, Low for other factors |
| Case 3 | High weight of Performance Factors, Low for other factors |
| Case 4 | Medium-high weight of Efficiency Factors, Low for other factors |
| Case 5 | High weight of Efficiency Factors, Low for other factors |
| Case 6 | Medium-high weight of Presence Factors, Low for other factors |
| Case 7 | High weight of Presence Factors, Low for other factors |
| Case 8 | Medium-high weight of Device Factors, Low for other factors |
| Case 9 | High weight of Performance Device, Low for other factors |
| Case 10 | High weight for Ease of Operation |
| Case 11 | High weight for Enjoyability |
| Case 12 | High weight for Level of Engagement |
| Case 13 | High weight for Response Accuracy |
| Case 14 | High weight for Objective Usability |
| Case 15 | High weight for Perceived Usefulness |
| Case 16 | High weight for Ease of Recognition |
| Case 17 | High weight for immersion |
| Case 18 | High weight for realism |
| Case 19 | High weight for weight |
| Case 20 | High weight for Sickness |
| Case 21 | High weight for interaction |
| Cases | Weightages | |||
|---|---|---|---|---|
| Performance Factors | Efficiency Factors | Presence Factors | Device Factors | |
| Case 1 | 0.26 | 0.26 | 0.24 | 0.24 |
| Case 2 | 0.51 | 0.18 | 0.15 | 0.16 |
| Case 3 | 0.76 | 0.09 | 0.07 | 0.08 |
| Case 4 | 0.18 | 0.51 | 0.14 | 0.15 |
| Case 5 | 0.10 | 0.76 | 0.06 | 0.07 |
| Case 6 | 0.18 | 0.18 | 0.49 | 0.16 |
| Case 7 | 0.10 | 0.09 | 0.74 | 0.08 |
| Case 8 | 0.18 | 0.18 | 0.15 | 0.49 |
| Case 9 | 0.10 | 0.09 | 0.07 | 0.74 |
| Ease of Operation | Enjoyability | Level of Engagement | Response Accuracy | |
| Case 10 | 0.95 | 0.01 | 0.01 | 0.03 |
| Case 11 | 0.02 | 0.94 | 0.01 | 0.03 |
| Case 12 | 0.02 | 0.01 | 0.94 | 0.03 |
| Case 13 | 0.02 | 0.01 | 0.01 | 0.96 |
| Objective Usability | Perceived Usefulness | Ease of Recognition | ||
| Case 14 | 0.93 | 0.03 | 0.04 | |
| Case 15 | 0.03 | 0.93 | 0.04 | |
| Case 16 | 0.03 | 0.03 | 0.94 | |
| Immersion | Realism | |||
| Case 17 | 0.9 | 0.1 | ||
| Case 18 | 0.1 | 0.9 | ||
| Weight | Sickness | Interaction | ||
| Case 19 | 0.91 | 0.06 | 0.03 | |
| Case 20 | 0.01 | 0.96 | 0.03 | |
| Case 21 | 0.01 | 0.06 | 0.93 | |
Publisher’s Note: MDPI stays neutral with regard to jurisdictional claims in published maps and institutional affiliations. |
© 2022 by the authors. Licensee MDPI, Basel, Switzerland. This article is an open access article distributed under the terms and conditions of the Creative Commons Attribution (CC BY) license (https://creativecommons.org/licenses/by/4.0/).
Share and Cite
Shringi, A.; Arashpour, M.; Golafshani, E.M.; Rajabifard, A.; Dwyer, T.; Li, H. Efficiency of VR-Based Safety Training for Construction Equipment: Hazard Recognition in Heavy Machinery Operations. Buildings 2022, 12, 2084. https://doi.org/10.3390/buildings12122084
Shringi A, Arashpour M, Golafshani EM, Rajabifard A, Dwyer T, Li H. Efficiency of VR-Based Safety Training for Construction Equipment: Hazard Recognition in Heavy Machinery Operations. Buildings. 2022; 12(12):2084. https://doi.org/10.3390/buildings12122084
Chicago/Turabian StyleShringi, Ankit, Mehrdad Arashpour, Emadaldin Mohammadi Golafshani, Abbas Rajabifard, Tim Dwyer, and Heng Li. 2022. "Efficiency of VR-Based Safety Training for Construction Equipment: Hazard Recognition in Heavy Machinery Operations" Buildings 12, no. 12: 2084. https://doi.org/10.3390/buildings12122084