Article

An Evaluation Model of Carbon Emission Reduction Effect of Prefabricated Buildings Based on Cloud Model from the Perspective of Construction Supply Chain

1
School of Water Conservancy, North China University of Water Resources and Electric Power, Zhengzhou 450046, China
2
Room 408, Chemistry Building, Science Avenue 100#, School of Management, Zhengzhou University, Zhengzhou 450001, China
*
Author to whom correspondence should be addressed.
Buildings 2022, 12(10), 1534; https://doi.org/10.3390/buildings12101534
Submission received: 12 August 2022 / Revised: 13 September 2022 / Accepted: 22 September 2022 / Published: 26 September 2022
(This article belongs to the Section Building Energy, Physics, Environment, and Systems)

Abstract

:
Prefabricated buildings are the future direction of the construction industry. The carbon reduction in prefabricated buildings has attracted increasing attention due to its importance to low-carbon and energy savings in the construction industry and achieving China’s “dual carbon” goal. Although research has been conducted on carbon reduction in prefabricated buildings, the use of cloud models for carbon reduction effect evaluation has not been explored. This study therefore aims to develop a cloud model-based evaluation of the carbon emission reduction effect for prefabricated buildings incorporating the characteristics of prefabricated buildings and the building supply chain. The developed model can support assessments of the whole life cycle phases of a prefabricated building. Firstly, carbon flow analysis is carried out from the perspective of the construction supply chain, and the carbon emission reduction effect evaluation index system of prefabricated buildings is established, which contains 5 guideline layers and 26 carbon emission reduction indicators. Secondly, the Continuous Ordered Weighted Averaging operator (C-OWA) is used to calculate the index weight calculation, and the cloud model is applied to conduct a comprehensive evaluation of the carbon emission reduction effect. Finally, this model is applied to evaluate the carbon emission reduction effect in the case of a building. The case study validated the efficiency of the developed model. This study extends the knowledge of carbon emission reduction by addressing specific characteristics of prefabrication and the construction supply chain. This validated model will enhance the willingness to apply prefabricated buildings to reduce carbon emissions and achieve the “dual carbon” goal.

1. Introduction

With the development of society, the climate problem has attracted global attention in recent years [1], which mainly originates from energy consumption and produces a large amount of carbon dioxide to cause climate warming, among which the carbon emissions from the construction industry account for 33% of global carbon emissions, its energy consumption accounts for about 36%, and raw material consumption accounts for about 40% of the world [2]. China’s construction industry accounts for 38% of global carbon emissions [3]. With China already committing to peak carbon dioxide emissions before 2030 and achieving carbon neutrality before 2060, the Central Economic Work Conference urged quicker steps to develop an action plan that enables the peaking of emissions. In order to reduce carbon emissions, many countries have begun to introduce relevant policies. On 22 September 2020, President Xi Jinping solemnly announced at the 75th session of the United Nations General Assembly that China will scale up its Intended Nationally Determined Contributions by adopting more vigorous policies and measures and aim to have CO2 emissions peak before 2030 and achieve carbon neutrality before 2060, namely the dual carbon goal of “carbon neutral and peak carbon” [4,5,6,7,8,9]. The construction industry is still in the stage of rapid development, and carbon emissions still account for a large proportion of all industries, so carbon reduction in the construction industry has become a top priority. The development of prefabricated buildings and other green buildings is to control carbon emissions in the construction industry. The factory-based production mode of prefabricated buildings facilitates the rational allocation of resources to achieve the dual carbon goal, and the component production process of prefabricated buildings can reduce 15.6% of implied carbon emissions and 3.2% of carbon emissions in the operation phase compared to traditional cast-in-place buildings [10,11,12], reducing energy consumption by 20.49% [13,14,15]. During the development of the construction industry, prefabricated buildings have gradually replaced traditional cast-in-place construction solutions and developed into a new form of construction [16]. Compared with the traditional cast-in-place building, fabricated buildings could find cost savings, shorten the duration, reduce noise, lessen construction, and so on; the development of fabricated buildings has become the main trend in the development of the modern construction industry in China. The State Council of the Central Committee of the Communist Party of China (CPC) put forward “Several Opinions on Further Strengthening Urban Planning and Construction Management”, which made clear provisions for prefabricated buildings and required that the proportion of prefabricated buildings in new buildings should reach 30% in about 10 years [17]. Data from China’s the Ministry of Housing and Urban–Rural show that a total of 630 million m2 of new prefabricated buildings will be started nationwide in 2020, an increase of 50% over 2019 [18]. To improve the carbon reduction effect in the construction industry, the integration idea is applied to the construction industry, it takes advantage of the characteristics of the supply chain to improve the degree of resource integration among the various parties involved in construction, in order to play an important role in carbon emission reduction in the construction supply chain and reduce the impact on the environment. This construction supply chain model is the future of the construction industry.
With the development of prefabricated buildings, corresponding studies have been carried out. Under the double carbon goal, prefabricated buildings are advocated and developed with a standardized design, factory production, prefabricated construction, integrated decoration, information management, and intelligent application. The construction characteristics are different from traditional buildings, mainly in the materialization phase using the factory production components and on-site assembly construction, and industrialized production methods can make reasonable use of resources and labor [19], In terms of resource and energy use, industrial production methods have significant effects on resource conservation and energy recycling compared to traditional cast-in-place [20]. In addition to the research in energy design, scholars promote the development of prefabricated buildings by studying the influencing factors of carbon emission reduction in prefabricated buildings [21].
In developing prefabricated buildings, scholars have conducted much research. The development of prefabricated buildings was first proposed in China in the 1950s and then implemented gradually. Its research focuses on five areas: assembly building technology, supply chain management, construction costs, building market acceptance, and policy regulation. In order to develop prefabricated buildings, prefabricated buildings are studied as research objects, the unfavorable factors in their development process are also studied, their promotion strategy is proposed [22,23], and the prefabricated buildings’ green value system from ecological, social, and economic aspects is established. As early as 2012, foreign countries have researched the greenness of buildings. Many countries have constructed evaluation systems, these include the Leadership in Energy and Environmental Design (LEED), which was built by the U.S. Green Building Council, “Comprehensive Assessment System for Building Environmental Efficiency” (CASBEE) by the Japan Sustainability Assessment Association, the British Institute of Building Research Establishment Environmental Assessment Method (BREEAM), and Green Star, an evaluation system established in Canada and other countries. It has also been studied by some scholars since then, mainly from the perspective of productivity, resources, and environmental sustainability, to research and analyze the factors for achieving green and low carbon in the construction industry [24]. Compared with developed countries, China’s evaluation standards and system of green buildings are not perfect; there is less relevant research, and no complete evaluation system has been formed. Some scholars referred to the relevant green construction regulations and green building evaluation standards to build a green construction evaluation standard system and methods applicable to China. The methods used in the research process are the catastrophe progression method [25], fuzzy comprehensive evaluation [26], and other methods. Some scholars analyzed the emission reduction capacity of prefabricated buildings [27], and studied the energy-saving benefits of prefabricated buildings [28] and green benefits [29]. Energy conservation and emission reduction in prefabricated buildings can be achieved by reducing the generation of construction waste, saving water and materials, and reducing carbon emissions from prefabricated building activities [30]. The green value of prefabricated buildings is mainly in terms of increasing the utilization rate of materials, reducing the number of materials used, and reducing environmental pollution [31]. On the other hand, based on the development of BIM technology building informatization, research on the integrated multi-professional integration application of prefabricated buildings provides a strong guarantee for the smooth implementation of prefabricated buildings [32,33].
As a result of global warming in recent years, countries have begun to develop a low-carbon economy. The concept of a low-carbon economy was formally introduced in the Energy White Paper in 2003. Many scholars have conducted studies on carbon emissions, mainly focusing on the measurement methods, influencing factors, carbon emissions of various industries, and emission reduction strategies. Carbon emissions are determined by studying the measurement methods and coefficients of carbon emissions, mainly measured by the actual measurement method, material balance method, input–output method, and emission coefficient method. Some scholars have studied the energy consumption and carbon emissions of buildings in the Irish region using input–output and found that facilities produce about 11.7% of carbon emissions [34]. A carbon emission calculation model was constructed based on the whole life cycle of prefabricated buildings for carbon emission calculation [35,36,37,38]. Regarding the carbon emission situation in the construction industry, some scholars have conducted carbon emission analysis based on actual construction activities and obtained the factors generating carbon emissions originate from construction materials, construction site electricity use, and personnel activities [39], and the energy consumption generated during the construction operation in all phases of the whole life cycle of the prefabricated buildings; the most energy-consuming phase was found to be the operation phase [40]. Regarding the impact of energy on prefabricated buildings, improving energy efficiency can effectively reduce building carbon emissions [41,42]. In the process of China’s economic development, optimizing and diversifying China’s energy mix will help promote China’s transition to low-carbon development [43,44].
In summary, there is not enough emphasis on the carbon emission reduction effect evaluation for prefabricated buildings in China. Only a few studies have focused on the issue. Moreover, previous studies have not found an appropriate method for the carbon emission reduction effect evaluation from the perspective of the construction supply chain. Therefore, based on construction supply chain theory and relevant literature, this paper proposes a carbon emission reduction effect evaluation for the prefabricated buildings model. First, establish an evaluation index system and then construct an assessment model based on the cloud model. Lastly, the model’s validity and applicability are verified through case studies.

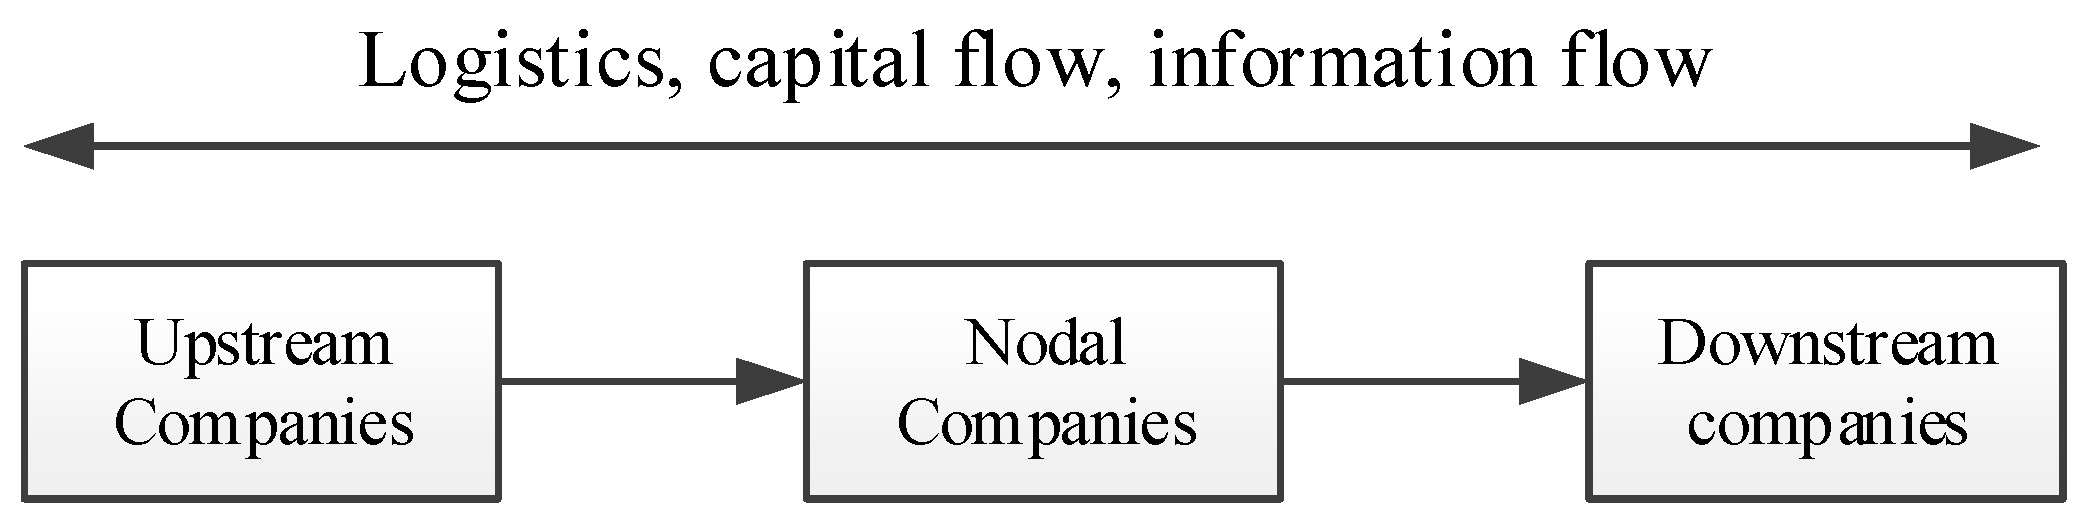
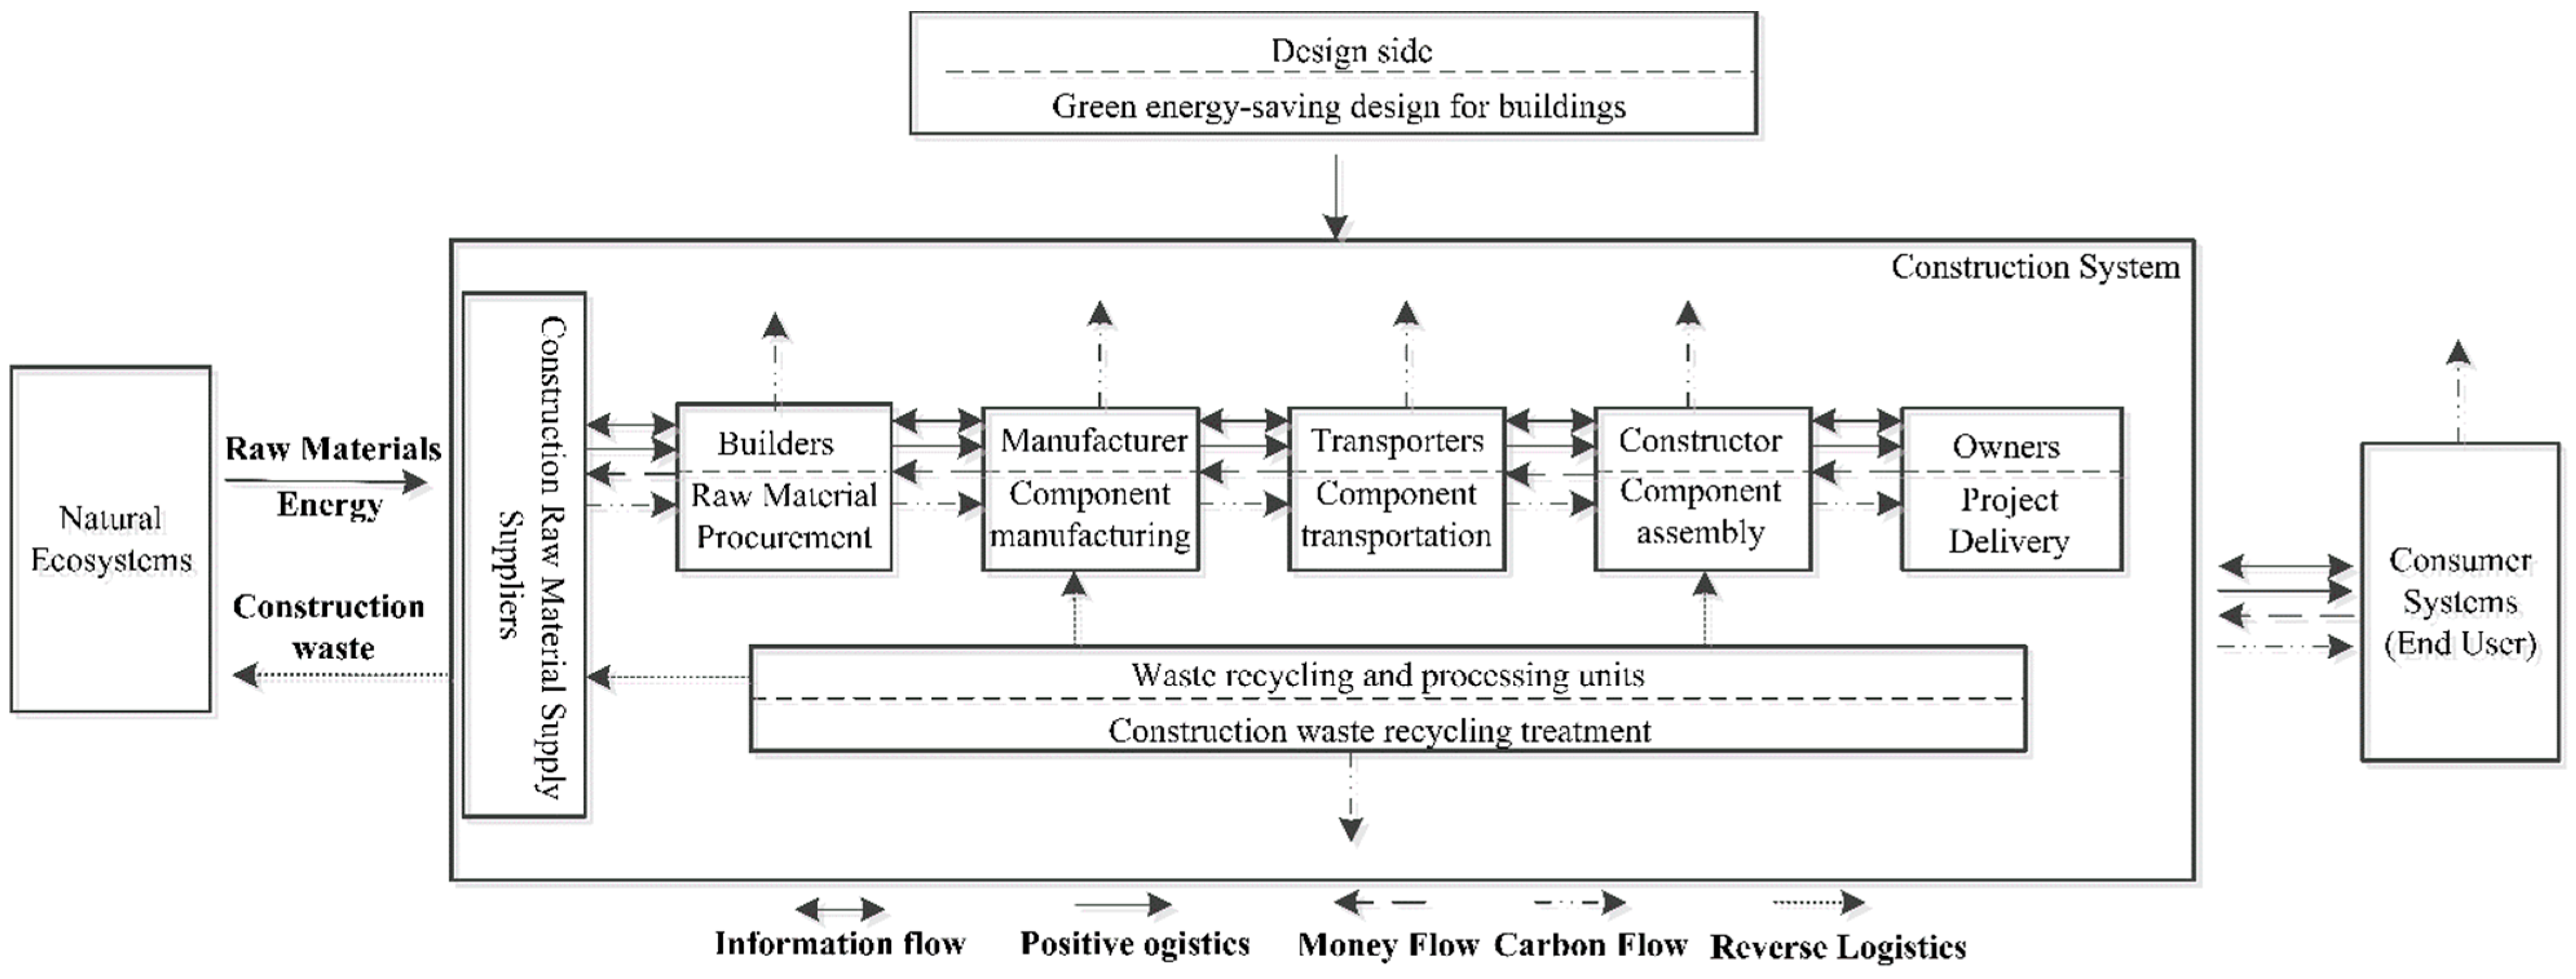
2. Supply Chain for Prefabricated Building

The concept of supply chain first originated from the value chain and economic chain. Peter F. Drucker, the father of modern management, first proposed the economic chain. Then in the 1980s, Michael E. Porter, a professor at Harvard Business School, summarized the concept of the value chain [45,46]. The supply chain is a network chain structure that runs through the whole process of the product from “0 to 1”, whereby raw materials flow from one link to the next, around the core enterprise, and the upstream enterprises supply raw materials and product components, which flow to each node enterprise; finally, the downstream enterprises make the products and distribute them to consumers through the sales network; this chain perfectly connects suppliers, manufacturers, distributors, retailers, and end-users into a whole [47,48,49].
The supply chain has been developed more maturely in the manufacturing industry. Furthermore, in the late 1980s, it was introduced to the construction industry. Subsequently, the construction supply chain suitable for construction products was proposed according to the characteristics of industry-specific industrial activities. The construction supply chain is the combination of the supply chain and construction production process. Koskela first proposed the application of manufacturing supply chain management to the construction industry; Bertelsen, O’Brien, and Fischer formally put forward the management thought in relation to the construction supply chain in 1998 [50]. The construction supply chain is also a web, chain-like structure with integration and coordination [51,52]. Designers, contractors, and material and equipment suppliers participate in the structure together [53], control the flow of information, logistics, and capital in the chain [54], and ensure the regular operation of the supply chain. The conceptual model of the construction supply chain is shown in Figure 1.
At present, some scholars have put forward a prefabricated building supply chain based on the traditional construction supply chain by combining the industrial production characteristics of prefabricated buildings and the structural characteristics of the supply chain. The prefabricated building supply chain includes all business processes in all phases of planning, design, production, transportation, prefabrication, and operation and maintenance, covering the entire life cycle of a prefabricated building. The prefabricated building supply chain is a typical make-to-order supply chain compared with the construction supply chain. The components are produced according to the owner’s demand. Each node’s enterprise information is connected through the core enterprise general contractor. Thus, a chain system integrating information flow, logistics, and capital flow is formed. The prefabricated building supply chain adds prefabricated component producers and supply-side-related node enterprises, where the supplier assumes the role of third-party logistics. The production method is mainly factory production. Instead of centralized construction of building products as traditional construction, it is divided into factory production and on-site assembly. The prefabricated components produced in the factory are transported to the construction site for assembly. Nodal companies add component manufacturers. This study applies the prefabricated building supply chain to the whole project life cycle. The prominent participating companies are design units whose task is to develop master planning and design solutions, such as traffic planning, technical planning, green space planning, and other tasks. The natural ecosystem, construction system, and consumption system are the main supply chain structure. Its main participants are suppliers, raw material buyers, transporters, constructors, owners, and end-users. Enterprises control information flow, logistics, and capital flow in the supply chain of prefabricated buildings. Carbon flow is the distribution of carbon emissions generated by prefabricated buildings in the whole life cycle. Carbon flow analysis is carried out based on the supply chain of prefabricated buildings. The main cause of carbon emissions in the supply chain of prefabricated buildings is the production and manufacture of building raw materials. The flow of material streams generates carbon flow. The carbon flow analysis diagram of the supply chain of prefabricated buildings is shown in Figure 2. Carbon emissions are generated mainly in raw material procurement, component manufacturing, construction and transportation, component assembly, and construction waste recycling. The source analysis of full life cycle carbon emissions is shown in Table 1.

3. Methodology

3.1. C-OWA Operator

The Ordered Weighted Averaging (OWA) operator was first proposed by Professor Yager in 1988 [55]. Subsequently, the Continuous Ordered Weighted Averaging (C-OWA) operator has been studied based on the number of combinations after many scholars’ improvement studies [56]. This study uses the C-OWA operator to calculate the index weights, and its calculation process is more scientific. According to the theory of the C-OWA algorithm, many experts in prefabricated buildings and researchers on building carbon emissions were invited to score the importance of indicators in the same evaluation layer in a 10-point scoring system. The decision matrix E = e 1 , e 2 , , e m is constituted by the obtained results. The results of matrix E are ranked from the largest to the smallest to obtain the new evaluation data A = {a1, a2, …, am} [57,58,59,60,61]. The calculation steps are as follows.
Step 1: Determine the weighting vector. Determine the weighting vector α j + 1 of the evaluation data A for the new ranked combination, α j + 1 is determined by the combination number C m 1 j , which is calculated as follows:
α j + 1 = C m 1 j / k = 0 m 1 C m 1 k = C m 1 j / 2 m 1
where C m 1 j is the number of combinations of j data selected from the m 1 data, j is taken as 0 , m 1 , and m is the number of invited experts.
A m o n g   t h e m j = 0 m 1 α j + 1 = 1  
Step 2: Calculate the absolute weight ω i ¯ of the evaluation data A, which is calculated from the weighted vector α j + 1 of the evaluation data A in step 2, with the following formula:
ω i ¯ = i = 1 n α j + 1 · a j   i   i s   t h e   n u m b e r   o f   e v a l u a t i o n   i n d i c a t o r s , i = 1 , 2 , n
Step 3: Normalization process. The absolute weight value ω i ¯ is normalized to obtain the relative weight ω i of the evaluation index with the following formula:
ω i = ω i ¯ / i = 1 n ω i ¯

3.2. Cloud Model Basic Theory

3.2.1. Definition of Cloud Model

Cloud model theory is a theory proposed by academician Deyi Li in 1995 based on probability theory and fuzzy mathematics [62]. The cloud model can reflect the fuzziness and randomness of things and realize the interconversion of qualitative concepts and quantitative indicators. Set a theoretical domain as U, and C is a qualitative concept on U. If for any quantitative value x and x ϵ U, μ(x) is the affiliation of x to the qualitative concept C. μ(x) is a random number within [0,1], and the affiliation cloud is the distribution of the affiliation μ(x) over the thesis domain U [63]. That is, the mathematical representation is μ(x):U→[0,1], ∀x ϵ U, xμ(x). An affiliated cloud is composed of multiple cloud droplets that react to the overall characteristics of the qualitative concept C [64]. The cloud droplets (x, μ(x)), whose generation process represents an uncertainty mapping between qualitative concepts and quantitative values.

3.2.2. Digital Features

The cloud model considers the vagueness, randomness, and discrete nature of the judged objects, which is mainly portrayed by these three numerical features (Ex, En, He) [65]. The expected value Ex denotes the center of the distribution of the theoretical domain; the entropy En reflects the ambiguity degree of the judged object boundary, and the dispersion degree of the cloud drops in the theoretical domain U; the super entropy He reflects the uncertainty of the entropy En, namely, the thickness of the cloud, and also the degree of dispersion of the cloud, namely, the randomness of the judged object [66].

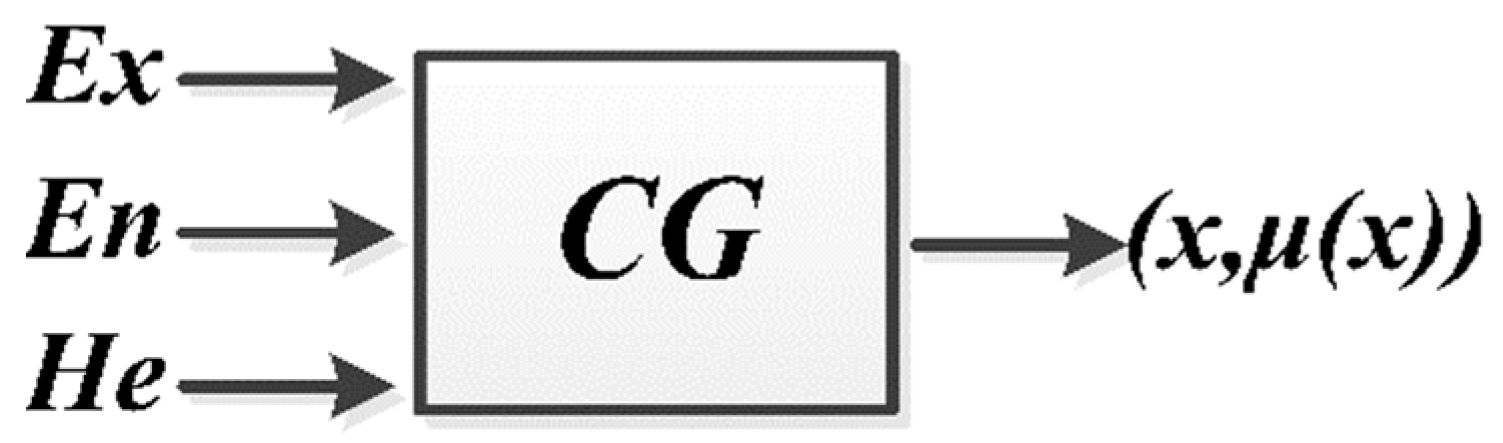
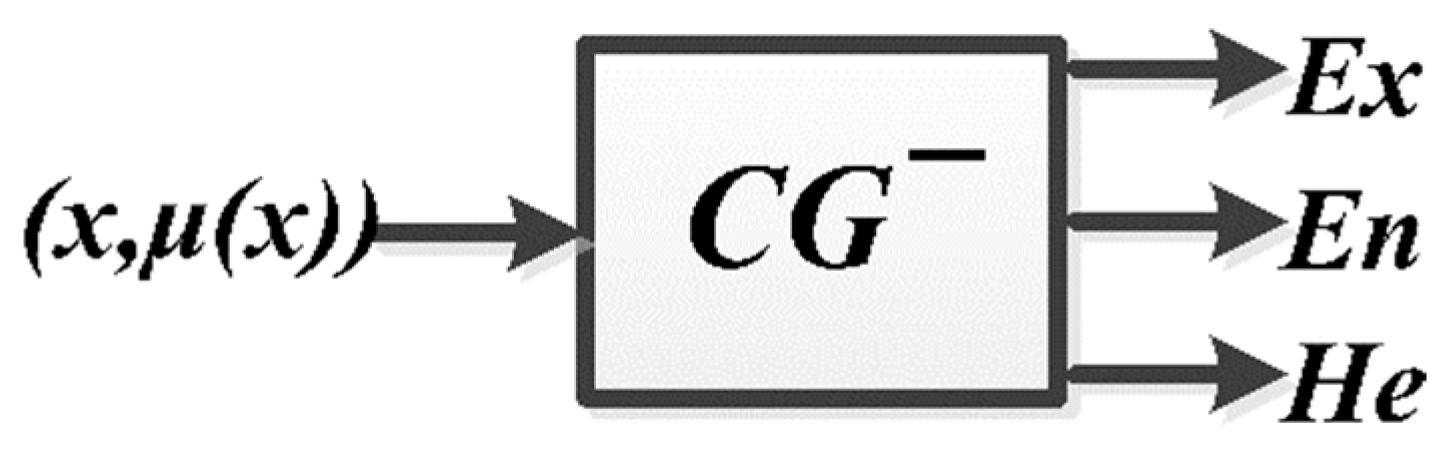
3.2.3. Cloud Generator

A cloud generator is a cloud model generation algorithm that realizes the interconversion of qualitative and quantitative evaluation metrics, which can be implemented with solidified hardware and modular software, and is mainly divided into forward cloud generator and inverse cloud generator [67].
The forward cloud generator (CG) is a mapping process that converts qualitative evaluation metrics into quantitative ones [68], which outputs the numerical input features (Ex, En, He), and the number of clouds drops n as the position and affiliation μ(x) of n cloud drops in the theoretical domain U, (Ex, En, He)→(x, μ(x)), as shown in Figure 3. First, generate the normal random number E n ~ n E n , H e with expectation E n and variance H e 2 . Again, generate normal random numbers x ~ n E x , E n with the expectation Ex and variance σ 2 E n 2 , And, finally, the affiliation degree is obtained by Equation (4).
μ x = e x p x E x 2 2 E n 2  
where the affiliation degree μ(x) is a cloud droplet, and the above process can be repeated several times to obtain the positions of n cloud droplets in the domain of the theory and their affiliation degrees.
The inverse cloud generator is a mapping process from quantitative metrics to qualitative [69,70]. The n sample points are input in the argument space, the numerical features (Ex, En, He) are output, and the mathematical representation (x, μ(x))→(Ex, En, He) is shown in Figure 4.
The expected value of n cloud drops Ex is calculated from Equation (5).
E x = 1 n i = 1 n x i    
The sample variance S 2 of n cloud drops is calculated from Equation (6).
S 2 = 1 n 1 i = 1 n x i x ¯ 2  
The calculation of cloud drops En is shown in Equation (7).
E n = π 2 × 1 n i = 1 n x i E x  
The hyperentropy H e can be obtained by Equation (8).
H e = S 2 E n 2

3.2.4. Standard Evaluation Cloud

The standard evaluation cloud is to represent the evaluation level of each index through the cloud diagram, and perform a numerical transformation to quantify the fuzzy evaluation set, and represent the evaluation set numerically through the evaluation value theory domain; firstly, the evaluation value theory domain U is divided into n standard evaluation intervals according to the evaluation set, and the qth subinterval is determined as   x q m i n , x q m a x , whose standard evaluation cloud corresponds to the numerical characteristics of E x q , E n q , H e q [71], and the standard evaluation cloud is calculated from Equation (9):
E x q = x q m a x + x q m i n 2 E n q = x q m a x x q m i n 2 2 ln 2 H e q = k

3.2.5. Indicator Evaluation Cloud

After determining the index weights and the standard evaluation cloud, the indexes are evaluated for each index factor with s experts and t evaluation indexes, where x p denotes the scoring value of the pth expert, and the data are obtained according to the scoring of each index expert. The digital characteristics of the indicator cloud are calculated by Equation (10).
E x j = 1 s p = 1 s x p E n j = π 2 × 1 s p = 1 s x p E x j H e j = S j 2 E n j 2  
The index evaluation cloud can be obtained by Equation (11), where x p denotes the evaluation data of the pth indicator of a certain indicator factor.
S j 2 = 1 s 1 p = 1 s x p X ¯ 2  

3.2.6. Comprehensive Evaluation Cloud

The calculated index evaluation cloud is integrated using the fusion algorithm of the cloud model. The composite evaluation cloud is calculated by using Equation (12).
E x = j = 1 n ω c j E x j E n = j = 1 n ω c j E n j 2 H e = j = 1 n ω c j H e j
Using numerical characteristics for rank evaluation is not intuitive and straightforward enough. Therefore, MATLAB can generate the cloud map of comprehensive evaluation cloud and standard evaluation cloud in the same coordinate system, and the evaluation rank of the index system can be judged intuitively through the cloud map observation and comparison.

4. Evaluation Model

4.1. Indicator System Construction

At present, many scholars have conducted research on green prefabricated buildings, and the research related to green prefabricated buildings has been relatively mature. From the perspective of the construction supply chain, this paper draws on the research results on green prefabricated buildings, and refers to the mature green building evaluation system and the literature search on keywords such as “ prefabricated buildings and green buildings” at home and abroad, and combines the relevant literature and the newly implemented GB/T 50378-2019 “Green Building Evaluation Standard” to build an evaluation system of carbon emission reduction impact factors of prefabricated buildings from five aspects: design planning, building materials, energy use, building environment, and construction organization, as shown in Table 2.

4.2. Division of Carbon Emission Reduction Effect Levels

Referring to the Green Building Evaluation Standard, the evaluation level of the carbon emission reduction effect of prefabricated buildings is divided into five levels: very poor, poor, acceptable, good, and very good, as its evaluation level, where very good indicates that the carbon emission reduction effect of prefabricated buildings has reached a very good degree, and in order to avoid the fuzziness and randomness of the evaluation results, based on the relevant theory of the standard evaluation cloud, the evaluation index rubric set is established, and its scoring value interval is set to [0,10], and the five levels are expressed qualitatively in the scoring interval, and the numerical characteristics corresponding to the standard evaluation level of the cloud model can be obtained, as shown in Table 3, and its generated standard evaluation cloud diagram is shown in Figure 5.

4.3. Evaluation Process

Step 1: Construct a decision matrix
Experts score the carbon emission reduction influencing factors in the evaluation system based on the control of carbon emission emissions in prefabricated buildings’ whole life cycle process. This expert group has some research in prefabricated buildings and carbon emission research and constructs a decision matrix E based on the scoring results.
Step 2: Calculate the indicator weights by use of the C-OWA operator
The new matrix A is obtained by sorting the results of the expert scoring in the decision matrix E from smallest to largest. The weighted vector of the data in descending order is calculated by applying the combinatorial number principle from Equation (1), then the weighted value α j + 1 of a j is obtained. The criterion layer’s absolute weight value ω i ¯ is calculated from Equation (2) based on the weighted value calculated from the number of combinations. The absolute weights of the criterion layer are normalized by Equation (3), then the relative weight values are obtained.
Step 3: Generate metrics evaluation cloud
Combining the relative weights obtained by using the C-OWA operator in step 2, the cloud numerical characteristics of the indicators are calculated by Equation (10) and Equation (11). MATLAB code is used to generate index evaluation clouds to evaluate the carbon reduction effect of prefabricated buildings.
Step 4: Generate a comprehensive evaluation cloud
Equation (12) is applied to calculate the cloud digital feature values of the target layer. The obtained numerical features are combined with the MATLAB code to generate the indicator cloud map. The evaluation level of the carbon reduction effect of prefabricated buildings can be intuitively derived from the cloud chart.

5. Case Study

This study takes an apartment in Zhengzhou City, Henan Province, China, as the case. The apartment is an assembly building structure with a total project investment of 510 million yuan, and the project took 3 years from the beginning to completion, covering an area of 15,000 square meters with a total construction area of about 73,000 square meters. Since its completion, the apartment has been put into use for 2 years. Based on this, the carbon emission reduction effect of the project is evaluated from design to operation, maintenance, dismantling, and recycling over the whole life cycle, using the established index system evaluation model.

5.1. Evaluation Process

Step 1: Construct the decision matrix E
Ten experts were invited to evaluate the evaluation system of carbon emission reduction in prefabricated buildings. Scores are scored using integers in the (0,10) interval. These ten experts have achievements in researching prefabricated buildings and carbon emissions and have been engaged in the construction industry for many years, with rich theoretical and practical experience. The initial decision matrix E is obtained based on the expert scoring of the indicator layer indicators.
E = 8 8 7 8 7 6 7 5 7 3 6 7 4 5 8 5 8 6 6 3 8 9 6 7 7 4 7 6 5 2 8 10 7 8 7 4 5 9 9 9 8 9 6 7 6 8 5 8 7 3 7 8 5 6 5 7 9 9 7 5 9 8 7 8 5 8 6 5 6 8 8 6 5 7 5 6 5 6 8 8 8 9 6 5 3 5 6 8 6 7 7 8 7 5 6 5 3 6 7 8 7 6 4 7 6 5 5 6 9 3 6 7 5 6 5 3 6 5 4 7 5 6 7 2 5 8 3 6 5 4 5 6 5 4 2 3 8 5 5 3 5 7 3 6 5 4 8 5 3 5 8 5 6 8 7 4 6 6 9 3 9 7 5 6 8 6 5 6 7 9 6 8 5 9 6 7 6 4 5 6 7 9 8 7 6 5 6 7 7 4 9 8 3 9 5 6 8 5 7 8 6 6 4 5 8 7 3 5 4 7 8 9 5 6 6 4 5 6 8 6 7 6 5 7 4 5 6 8 7 6 6 8 6 3 6 5 7 8 7 9 9 7 8 6 4 10 9 7 8 5 9 8 6 9 8 5 5 8 6 7
Step 2: Calculate the weight using the C-OWA operator
The data obtained based on the expert scoring method are processed, the scoring cases are arranged in descending order, and the weighting vector of the data arranged in descending order is calculated by applying the principle of the combinatorial number, and the weight value α j + 1 of a j can be obtained, and the results are shown in Table 4.
According to Equation (2), the absolute weight of the index is calculated. The relative weights of the index are calculated by applying Equation (3). The final calculation is to obtain the index system weight of carbon emission reduction factors of prefabricated buildings. The results are shown in Table 5.

5.2. Comprehensive Evaluation of Cloud Models

Step 1: Generate metrics evaluation cloud
The weights of the index are calculated according to the C-OWA operator. The cloud number characteristics of each index were calculated by Equation (11), and the results are shown in Table 6. Based on the calculated cloud digital features of each indicator in the indicator layer, the digital features of the guideline layer corresponding to each indicator are calculated, as shown in Table 7. According to the numerical characteristics of the criterion layer, a cloud generator is used to generate the evaluation cloud map of the criterion layer, as shown in Figure 6.
The numerical characteristics of the target layer are calculated by Equation (12), according to the numerical characteristics of the criterion-level indicators in Table 7, and the indicator weights. The results are E x = 6.360 , E n = 1.611 , and H e = 0.470 . The numerical characteristics of the target layer obtained are used to generate a comprehensive evaluation cloud of the carbon emission reduction effect of prefabricated buildings using MATLAB, as shown in Figure 7. It can be clearly seen from the cloud that the carbon emission reduction effect level of the prefabricated buildings is between level III and level IV, which is at an acceptable level.

5.3. Results and Discussion

5.3.1. Case Discussion

In this section, the results obtained regarding the carbon emission reduction effect of prefabricated buildings will be presented.
(1) According to the comprehensive evaluation cloud in Figure 7 and the weight values of the indicators in Table 5, the result is that the factors that significantly impact carbon emission reduction in prefabricated buildings are the primary indicators of building materials. Among the secondary index, the use of combination steel formwork A 21 , the reduction in construction solid waste A 24 , and the improvement in the material utilization rate A 22 have an essential impact on the evaluation of the indicator system. Using the cloud model to evaluate the carbon reduction effect of the first-level indicators, the following weighting relationships can be obtained: A 2 > A 5 > A 4 > A 1 > A 3 .
(2) The future carbon emission reduction in prefabricated buildings can start with building materials. Improving the utilization rate of building raw materials and reducing material waste can improve the carbon emission reduction effect. According to the production characteristics of prefabricated buildings, the construction formwork adopts combined steel formwork; this way can reduce wood waste and control the carbon emissions of prefabricated buildings, thus promoting carbon emission reduction.
(3) Using the cloud model to evaluate the carbon reduction effect of prefabricated buildings, a comprehensive evaluation cloud diagram can be obtained, as shown in Figure 7. The carbon emission reduction effect of the prefabricated apartment building can be intuitively observed in Figure 7 to be at an acceptable level. The carbon reduction effect level of the apartment was obtained from the evaluation model at an acceptable level, and this result is consistent with the assessment results of the carbon reduction effect of the apartment by the Henan Province prefabricated building industry. Its evaluation results have a certain significance in promoting the evaluation of the carbon emission reduction effect of prefabricated buildings, which is more conducive to promoting the sustainable development of prefabricated buildings.

5.3.2. Model Discussion

In relation to the method, the cloud model, combined with the building supply chain, was applied in the analysis of the carbon emission reduction effect of prefabricated buildings, with which it was possible to assign weights to each of the indexes, which allows us to establish the model of the whole life cycle carbon emission reduction effect evaluation of prefabricated buildings. The building supply chain can help us analyze carbon flow and establish a corresponding indicator system.
Firstly, based on the supply chain of prefabricated buildings, the carbon flow for its whole life cycle is analyzed by using literature analysis and the expert interview method to establish an evaluation index system. The established index system can well reflect the relevant factors affecting carbon emission reduction in the whole life cycle of prefabricated buildings, and it provides a reference system for the study of carbon emission reduction influencing factors of prefabricated buildings.
Secondly, the cloud model is used to conduct a comprehensive evaluation of the index system. The cloud model recognizes the uncertainty transformation between qualitative concepts and quantitative values, which effectively makes up for the lack of some traditional evaluation models in dealing with uncertainty. Moreover, the evaluation results can be analyzed visually and clearly through the cloud diagram to show the degree of influence of the evaluation indexes on the carbon emission reduction effect, which is a more scientific evaluation method.
Finally, the case was analyzed and verified using C-OWA to calculate the weights of each index and the cloud model to generate the evaluation cloud map. The cloud analysis shows that the comprehensive evaluation of the carbon emission reduction effect of prefabricated buildings in this case is at an acceptable level.
The cloud model is a model to study the relationship between fuzziness and randomness, which is more responsive to the fuzziness and randomness of variables than the traditional affiliation function, and can better deal with natural language, multi-attribute decision making, and so on. The evaluation results are reflected in the mapping relationship between qualitative and quantitative, and its processing results are more intuitive and clear, and the evaluation process is more scientific. The evaluation model based on the cloud model from the perspective of the construction supply chain provides a new evaluation idea for the comprehensive evaluation of the carbon emission reduction effect of prefabricated buildings.
It should be noted that in this work, we invited ten experts to rate the level of 26 indexes of the case according to a ten-point system and established the normalized matrix starting from the use of the cloud method; however, it is necessary to establish an in-depth evaluation of the value corresponding more precisely to each index.

6. Conclusions

The development of prefabricated buildings is the main direction of future building development, and its carbon emission reduction effect evaluation is an important measure to promote the development of prefabricated buildings. This study developed a model based on a cloud model from the building supply chain perspective to evaluate the carbon emission reduction effect of prefabricated buildings. This model is based on a more standardized level of assessments and has a broader scope of lifecycle phases. The unique characteristics of prefabricated buildings including transportation and building materials have also been considered. The evaluation system of the carbon emission reduction effect of prefabricated buildings under the perspective of a construction supply chain was constructed. The method has been successfully tested on a typical prefabricated high-rise building in Zhengzhou and has proven to produce accurate results. The developed model can be applied to other regions and special prefabricated building types by changing the weight of the index. Moreover, the assessment levels can be easily manipulated to reflect the carbon emission reduction in prefabrication buildings. The study is particularly useful for building practitioners to swiftly evaluate the carbon emission reduction in prefabricated buildings with deep insights. Moreover, the research findings can guide the construction of low-carbon buildings.
The cloud model converts qualitative and quantitative data and can objectively and comprehensively evaluate the carbon reduction factors of prefabricated buildings. The C-OWA weighting method can well compensate for the influence of too many index factors and subjective evaluation in weight calculation. Cloud models have been used in many fields, but only some of the literature studying carbon reduction in prefabricated buildings has applied cloud models. Therefore, as a reference, this method can be used in the evaluation system of carbon emission reduction in prefabricated buildings.
However, the limitations of this study should also be noted. This study is based on the construction supply chain perspective on the whole life cycle of prefabricated buildings. There are many factors influencing its carbon emission, and only 26 influencing factors indicators were extracted in this study. The factors influencing carbon emissions of prefabricated buildings should be analyzed more comprehensively in future research. Second, the sample size studied in this study is relatively small and has certain limitations. Case studies can be added in future studies to verify the feasibility of the model. Experts were invited to score and evaluate the indicator factors when the weights were calculated. However, the influence of experts’ preferences and experience levels on the weighting results was ignored in the weight calculation. In addition, the results of the case in this study are consistent with the actual results, which indicate that the model is operational. In future research, we will try other methods to further verify the accuracy and effectiveness of this model. BIM technology can simulate and analyze carbon emissions with the help of information technology in the future research process. If these factors are taken into account, the evaluation results about carbon emission reduction will be more scientific and practical. These are the directions that need to be studied in the future.

Author Contributions

S.S. proposed innovation points, provided research platforms and research funds, and guided and modified the manuscript. Y.C. conducted the data collection and analysis, and wrote the manuscript. A.W. guided and modified the manuscript. X.L. provided the case information. All authors have read and agreed to the published version of the manuscript.

Funding

This work was supported by the National Natural Science Foundation of China under Grant (No. 51709115); and Key R & D and promotion Special Projects of Henan Province (scientific and technological research) (No. 182102210066).

Institutional Review Board Statement

Not applicable.

Informed Consent Statement

Informed consent was obtained from all authors participating in the study.

Data Availability Statement

Not applicable.

Acknowledgments

The authors would like to extend our sincere gratitude to our teacher, for instructive advice and useful suggestions on our thesis and express our appreciation to the experts for providing useful data, valuable information, and helpful comments during our research. The authors would like to acknowledge the National Natural Science Foundations of China and Key R&D and promotion Special Projects of Henan Province, China, for financially supporting this work.

Conflicts of Interest

No potential conflict of interest was reported by the authors.

References

  1. Zhang, S.; Li, Z.; Ning, X.; Li, L. Gauging the impacts of urbanization on CO2 emissions from the construction industry: Evidence from China. J. Environ. Manag. 2021, 288, 112440. [Google Scholar] [CrossRef] [PubMed]
  2. Peng, W.; Song, Y.; Zhu, J.; Chang, R. Analyzing the influence factors of the carbon emissions from China’s building and construction industry from 2000 to 2015. J. Clean. Prod. 2019, 221, 552–566. [Google Scholar] [CrossRef]
  3. Li, D.; Huang, G.; Zhu, S.; Chen, L.; Wang, J. How to peak carbon emissions of provincial construction industry? Scenario analysis of Jiangsu Province. Renew. Sustain. Energy Rev. 2021, 144, 110953. [Google Scholar] [CrossRef]
  4. Li, B.; Han, S.; Wang, Y.; Li, J.; Wang, Y. Feasibility assessment of the carbon emissions peak in China’s construction industry: Factor decomposition and peak forecast. Sci. Total Environ. 2020, 706, 135716. [Google Scholar] [CrossRef] [PubMed]
  5. Mi, Z.; Wei, Y.M.; Wang, B.; Meng, J.; Liu, Z.; Shan, Y.; Liu, J.; Guan, D. Socioeconomic impact assessment of China’s CO2 emissions peak prior to 2030. J. Clean. Prod. 2017, 142, 2227–2236. [Google Scholar] [CrossRef]
  6. Li, L.; Lei, Y.; He, C.; Wu, S.; Chen, J. Prediction on the Peak of the CO2 Emissions in China Using the STIRPAT Model. Adv. Meteorol. 2016, 2016, 5213623. [Google Scholar] [CrossRef]
  7. Teng, F.; Su, X.; Wang, X. Can China Peak Its Non-CO2 GHG Emissions before 2030 by Implementing Its Nationally Determined Contribution? Environ. Sci. Technol. 2019, 53, 12168–12176. [Google Scholar] [CrossRef] [PubMed]
  8. Xu, G.; Schwarz, P.; Yang, H. Adjusting energy consumption structure to achieve China’s CO2 emissions peak. Renew. Sustain. Energy Rev. 2020, 122, 109737. [Google Scholar] [CrossRef]
  9. Jiang, Y.; Zhang, H.; Zhao, R.; Wang, Y.; Liu, M.; You, S.; Wu, Z.; Liu, Z.; Wei, S. Energy, exergy, economic and environmental assessment of the triangular solar collector assisted heat pump. Sol. Energy 2022, 236, 280–293. [Google Scholar] [CrossRef]
  10. Teng, Y.; Li, K.; Pan, W.; Ng, T. Reducing building life cycle carbon emissions through prefabrication: Evidence from and gaps in empirical studies. Build. Environ. 2018, 132, 125–136. [Google Scholar] [CrossRef]
  11. Li, X.J.; Lai, J.Y.; Ma, C.Y.; Wang, C. Using BIM to Research Carbon Footprint during the Materialization Phase of Prefabricated Concrete Buildings: A China Study. J. Clean. Prod. 2021, 279, 123454. [Google Scholar] [CrossRef]
  12. Fang, Y.; Dan, H.; Zhang, H.; Guo, Z.; Zhao, Y.; Wang, B.; Yuan, Y. Carbon emissions in the life cycle of urban building system in China—A case study of residential buildings. Ecol. Complex. 2011, 8, 201–212. [Google Scholar] [CrossRef]
  13. Cao, X.; Li, X.; Zhu, Y.; Zhang, Z. A comparative study of environmental performance between prefabricated and traditional residential buildings in China. J. Clean. Prod. 2015, 109, 131–143. [Google Scholar] [CrossRef]
  14. Sebaibi, N.; Boutouil, M. Reducing energy consumption of prefabricated building elements and lowering the environmental impact of concrete. Eng. Struct. 2020, 213, 110594. [Google Scholar] [CrossRef]
  15. Yin, X.; Dong, Q.; Zhou, S.; Yu, J.; Huang, L.; Sun, C. Energy-Saving Potential of Applying Prefabricated Straw Bale Construction (PSBC) in Domestic Buildings in Northern China. Sustainability 2020, 12, 3464. [Google Scholar] [CrossRef]
  16. Xue, H.; Wu, Z.; Sun, Z.; Jiao, S. Effects of policy on developer’s implementation of off-site construction: The mediating role of the market environment. Energy Policy 2021, 155, 112342. [Google Scholar] [CrossRef]
  17. Li, X.J.; Xie, W.J.; Xu, L.; Li, L.L.; Jim, C.Y.; Wei, T.B. Holistic Life-Cycle Accounting of Carbon Emissions of Prefabricated Buildings Using LCA and BIM. Energy Build 2022, 266, 112136. [Google Scholar] [CrossRef]
  18. Gan, X.; Liu, L.; Wen, T.; Webber, R. Modelling Interrelationships between Barriers to Adopting Green Building Technologies in China’s Rural Housing via Grey-DEMATEL. Technol. Soc. 2022, 70, 102042. [Google Scholar] [CrossRef]
  19. Arditi, D.; Ergin, U.; Günhan, S. Factors Affecting the Use of Precast Concrete Systems. J. Arch. Eng. 2000, 6, 79–86. [Google Scholar] [CrossRef]
  20. Zhao, C.; Liu, M.; Wang, K. Monetary Valuation of the Environmental Benefits of Green Building: A Case Study of China. J. Clean. Prod. 2022, 365, 132704. [Google Scholar] [CrossRef]
  21. Shi, Q.; Yu, T.; Zuo, J. What leads to low-carbon buildings? A China study. Renew. Sustain. Energy Rev. 2015, 50, 726–734. [Google Scholar] [CrossRef]
  22. Jiang, W.; Huang, Z.; Peng, Y.; Fang, Y.; Cao, Y. Factors affecting prefabricated construction promotion in China: A structural equation modeling approach. PLoS ONE 2020, 15, e0227787. [Google Scholar] [CrossRef] [PubMed]
  23. Luo, T.; Xue, X.; Wang, Y.; Xue, W.; Tan, Y. A Systematic Overview of Prefabricated Construction Policies in China. J. Clean. Prod. 2021, 280, 124371. [Google Scholar] [CrossRef]
  24. Chang, Y.; Li, X.; Masanet, E.; Zhang, L.; Huang, Z.; Ries, R. Unlocking the green opportunity for prefabricated buildings and construction in China. Resour. Conserv. Recycl. 2018, 139, 259–261. [Google Scholar] [CrossRef]
  25. Chen, L.; Gao, X.; Gong, S.; Li, Z. Regionalization of Green Building Development in China: A Comprehensive Evaluation Model Based on the Catastrophe Progression Method. Sustainability 2020, 12, 5988. [Google Scholar] [CrossRef]
  26. Hu, W.; Yao, W.; Zhou, M. Comprehensive Evaluation on Performance of Existing Residential Buildings Based on Fuzzy and Analytic Hierarchy Process. Tongji Daxue Xuebao/J. Tongji Univ. 2011, 39, 785–790. [Google Scholar] [CrossRef]
  27. Yu, S.; Liu, Y.; Wang, D.; Bahaj, A.B.S.; Wu, Y.; Liu, J. Review of thermal and environmental performance of prefabricated buildings: Implications to emission reductions in China. Renew. Sustain. Energy Rev. 2021, 137, 110472. [Google Scholar] [CrossRef]
  28. Xu, M.; Liu, Y. Environmental Impact Assessment of Materialization Stage of Prefabricated Buildings Based on LCA and WTP. IOP Conf. Ser. Earth Environ. Sci. 2021, 634, 012020. [Google Scholar] [CrossRef]
  29. Wang, H.; Zhang, Y.; Gao, W.; Kuroki, S. Life Cycle Environmental and Cost Performance of Prefabricated Buildings. Sustainability 2020, 12, 2609. [Google Scholar] [CrossRef]
  30. Wong, P.; Kanellopoulos, M.P.; Edmondson, L. An empirical analysis of the effect of prefabrication on fostering sustainable construction. In Proceedings of the 21st International Conference on Advancement of Construction Management and Real Estate (CRIOCM); Springer: Berlin, Germany, 2018; pp. 185–195. [Google Scholar] [CrossRef]
  31. Tumminia, G.; Guarino, F.; Longo, S.; Ferraro, M.; Cellura, M.; Antonucci, V. Life cycle energy performances and environmental impacts of a prefabricated building module. Renew. Sustain. Energy Rev. 2018, 92, 272–283. [Google Scholar] [CrossRef]
  32. Ji, Y.; Qi, K.; Qi, Y.; Li, Y.; Li, H.X.; Lei, Z.; Liu, Y. BIM-based life-cycle environmental assessment of prefabricated buildings. Engineering 2020, 27, 1703–1725. [Google Scholar] [CrossRef]
  33. Lee, S.; Tae, S.; Roh, S.; Kim, T. Green Template for Life Cycle Assessment of Buildings Based on Building Information Modeling: Focus on Embodied Environmental Impact. Sustainability 2015, 7, 16498–16512. [Google Scholar] [CrossRef]
  34. Acquaye, A.A.; Duffy, A.P. Input–output analysis of Irish construction sector greenhouse gas emissions. Build. Environ. 2010, 45, 784–791. [Google Scholar] [CrossRef]
  35. Zhang, Y.; Yan, D.; Hu, S.; Guo, S. Modelling of energy consumption and carbon emission from the building construction sector in China, a process-based LCA approach. Energy Policy 2019, 134, 110949. [Google Scholar] [CrossRef]
  36. Li, X.J.; Lai, J.Y.; Zheng, Y.D. Using LCA to research carbon footprint for precast concrete piles during the building construction stage: A China study. J. Clean. Prod. 2019, 245, 118754. [Google Scholar] [CrossRef]
  37. Zhang, Y.; Zheng, X.; Zhang, H.; Chen, G.; Wang, X. Carbon emission analysis of a residential building in China through life cycle assessment. Front. Environ. Sci. Eng. 2016, 10, 150–158. [Google Scholar] [CrossRef]
  38. Wu, H.J.; Yuan, Z.W.; Zhang, L.; Bi, J. Life cycle energy consumption and CO2 emission of an office building in China. Int. J. Life Cycle Assess. 2012, 17, 105–118. [Google Scholar] [CrossRef]
  39. Hong, J.; Shen, G.Q.; Feng, Y.; Lau, W.S.T.; Mao, C. Greenhouse gas emissions during the construction phase of a building: A case study in China. J. Clean. Prod. 2015, 103, 249–259. [Google Scholar] [CrossRef]
  40. Ramesh, T.; Prakash, R.; Shukla, K.K. Life cycle energy analysis of buildings: An overview. Energy Build. 2010, 42, 1592–1600. [Google Scholar] [CrossRef]
  41. Garrone, P.; Grilli, L. Is there a relationship between public expenditures in energy R & D and carbon emissions per GDP? An empirical investigation—ScienceDirect. Energy Policy 2010, 38, 5600–5613. [Google Scholar] [CrossRef]
  42. Fedorczak-Cisak, M.; Bomberg, M.; Yarbrough, D.W.; Lingo, L.E.; Romanska-Zapala, A. Position Paper Introducing a Sustainable, Universal Approach to Retrofitting Residential Buildings. Buildings 2022, 12, 846. [Google Scholar] [CrossRef]
  43. Kais, S.S.; Sami, H. An econometric study of the impact of economic growth and energy use on carbon emissions: Panel data evidence from fifty eight countries. Renew. Sustain. Energy Rev. 2016, 59, 1101–1110. [Google Scholar] [CrossRef]
  44. Guo, M.; Hu, Y. The Impact of Financial Development on Carbon Emission: Evidence from China. Sustainability 2020, 12, 6959. [Google Scholar] [CrossRef]
  45. Hermundsdottir, F.; Aspelund, A. Competitive Sustainable Manufacturing—Sustainability Strategies, Environmental and Social Innovations, and Their Effects on Firm Performance. J. Clean. Prod. 2022, 370, 133474. [Google Scholar] [CrossRef]
  46. Chen, X.; Liu, Z.; Zhu, Q. Reprint of “Performance Evaluation of China’s High-Tech Innovation Process: Analysis Based on the Innovation Value Chain”. Technovation 2020, 94–95, 102094. [Google Scholar] [CrossRef]
  47. Seuring, S.; Sarkis, J.; Müller, M.; Rao, P. Sustainability and Supply Chain Management—An Introduction to the Special Issue. J. Clean. Prod. 2008, 16, 1545–1551. [Google Scholar] [CrossRef]
  48. Kshetri, N. Food and Beverage Industry Supply Chains: Blockchain in Supply Chain Management; Elsevier: Amsterdam, The Netherlands, 2021; ISBN 9780323899345. [Google Scholar]
  49. Krichen, S.; Jouida, S. ben Introduction to Supply Chain Management. In Supply Chain Management and Its Applications in Computer Science; John Wiley & Sons, Inc.: Hoboken, NJ, USA, 2015; pp. 13–23. [Google Scholar] [CrossRef]
  50. Wang, Z.; Hu, H.; Gong, J.; Ma, X.; Xiong, W. Precast Supply Chain Management in Off-Site Construction: A Critical Literature Review. J. Clean. Prod. 2019, 232, 1204–1217. [Google Scholar] [CrossRef]
  51. Geissdoerfer, M.; Morioka, S.N.; Monteiro de Carvalho, M.; Evans, S. Business models and supply chains for the circular economy. J. Clean. Prod. 2018, 190, 712–721. [Google Scholar] [CrossRef]
  52. Du, Q.; Pang, Q.; Bao, T.; Guo, X.; Deng, Y. Critical factors influencing carbon emissions of prefabricated building supply chains in China. J. Clean. Prod. 2021, 280, 124398. [Google Scholar] [CrossRef]
  53. O’Brien, M.J.; Al-Soufi, A. Electronic data interchange and the structure of the UK construction industry. Constr. Manag. Econ. 1993, 11, 443–453. [Google Scholar] [CrossRef]
  54. Koskela, L.; Vrijhoef, R.; Broft, R.D. Construction Supply Chain Management through a Lean Lens. In Successful Construction Supply Chain Management: Concepts and Case Studies, 2nd ed.; John Wiley & Sons, Inc.: Hoboken, NJ, USA, 2019; pp. 109–125. [Google Scholar] [CrossRef]
  55. Yager, R.R. Families of OWA operators. Fuzzy Sets Syst. 1993, 59, 125–148. [Google Scholar] [CrossRef]
  56. Xu, Z. Dependent OWA Operators. In International Conference on Modeling Decisions for Artificial Intelligence; Springer: Berlin/Heidelberg, Germany, 2006; Volume 3885 LNAI, pp. 172–178. [Google Scholar] [CrossRef]
  57. Merigó, J.M.; Palacios-Marqués, D.; Soto-Acosta, P. Distance Measures, Weighted Averages, OWA Operators and Bonferroni Means. Appl. Soft Comput. 2017, 50, 356–366. [Google Scholar] [CrossRef]
  58. Cheng, C.H.; Wang, J.W.; Wu, M.C. OWA-weighted based clustering method for classification problem. Expert Syst. Appl. 2009, 36, 4988–4995. [Google Scholar] [CrossRef]
  59. Merigó, J.M. A Unified Model between the Weighted Average and the Induced OWA Operator. Expert Syst. Appl. 2011, 38, 11560–11572. [Google Scholar] [CrossRef]
  60. Xu, Z. An overview of methods for determining OWA weights. Int. J. Intell. Syst. 2005, 20, 843–865. [Google Scholar] [CrossRef]
  61. Nasibov, E.; Kandemir-Cavas, C. OWA-based linkage method in hierarchical clustering: Application on phylogenetic trees. Expert Syst. Appl. 2011, 38, 12684–12690. [Google Scholar] [CrossRef]
  62. Li, D.; Du, Y. About the Authors. In Artificial Intelligence with Uncertainty; CRC Press: Boca Raton, FL, USA, 2007. [Google Scholar] [CrossRef]
  63. Liu, J.; Gong, E.; Wang, D.; Teng, Y. Cloud Model-Based Safety Performance Evaluation of Prefabricated Building Project in China. Wirel. Pers. Commun. 2018, 102, 3021–3039. [Google Scholar] [CrossRef]
  64. Zhang, S.; Xiang, M.; Xu, Z.; Wang, L.; Zhang, C. Evaluation of water cycle health status based on a cloud model. J. Clean. Prod. 2020, 245, 118850. [Google Scholar] [CrossRef]
  65. Lee, P.C.; Zhao, Y.; Lo, T.P.; Long, D. A multi-period comprehensive evaluation method of construction safety risk based on cloud model. J. Intell. Fuzzy Syst. 2019, 37, 5203–5215. [Google Scholar] [CrossRef]
  66. Lin, C.J.; Zhang, M.; Li, L.P.; Zhou, Z.Q.; Liu, S.; Liu, C.; Li, T. Risk Assessment of Tunnel Construction Based on Improved Cloud Model. J. Perform. Constr. Facil. 2020, 34, 04020028. [Google Scholar] [CrossRef]
  67. Petri, I.; Li, H.; Rezgui, Y.; Chunfeng, Y.; Yuce, B.; Jayan, B. A HPC based cloud model for real-time energy optimisation. Enterp. Inf. Syst. 2016, 10, 108–128. [Google Scholar] [CrossRef]
  68. Laskey, K.B.; Levitt, T.S. Artificial Intelligence: Uncertainty. In International Encyclopedia of the Social & Behavioral Sciences; Elsevier: Amsterdam, The Netherlands, 2001; pp. 799–805. [Google Scholar] [CrossRef]
  69. Xiahou, J.L.; Lin, F.; Huang, Q.H.; Zeng, W. Multi-datacenter cloud storage service selection strategy based on AHP and backward cloud generator model. Neural Comput. Appl. 2018, 29, 71–85. [Google Scholar] [CrossRef]
  70. Lv, P.; Yuan, L.; Zhang, J. Cloud theory-based simulated annealing algorithm and application—ScienceDirect. Eng. Appl. Artif. Intell. 2009, 22, 742–749. [Google Scholar] [CrossRef]
  71. Gao, Z.; Ma, D.; Guo, X.; Wang, W.; Wang, Z. The Comprehensive Assessment Method of Concrete Damage after Disastrous Fire Based on Game Theory-Normal Cloud Model. Math. Probl. Eng. 2019, 2019, 5159497. [Google Scholar] [CrossRef] [Green Version]
Figure 1. General conceptual model of construction supply chain.
Buildings 12 01534 g001
Figure 2. Carbon flow analysis of the supply chain of prefabricated building.
Buildings 12 01534 g002
Figure 3. Schematic diagram of forward cloud generator operation.
Buildings 12 01534 g003
Figure 4. Schematic diagram of inverse cloud generator operation.
Buildings 12 01534 g004
Figure 5. Standard evaluation cloud.
Buildings 12 01534 g005
Figure 6. Guideline layer index evaluation cloud.
Buildings 12 01534 g006
Figure 7. Comprehensive evaluation cloud chart of carbon emission reduction effect of prefabricated buildings.
Buildings 12 01534 g007
Table 1. Full life cycle carbon emission source.
Full Life Cycle of Prefabricated BuildingsFull Life Cycle Phase of Prefabricated BuildingsMain Sources of Carbon Emissions
Raw Material ProcurementRaw material production and transportation
Component manufacturingComponent production and unrecovered waste raw materials
Component transportationEnergy consumption
Component assemblyEnergy consumption and unrecycled construction waste
Construction waste recyclingConstruction waste recycling and reprocessing
Table 2. Carbon emission reduction impact factors of prefabricated buildings.
Target LayerGuideline LayerIndicator LayerExplanation of Indicators
Evaluation
of carbon
emission
reduction
effect of
prefabricated
buildings
Design
Planning A 1
Construction material selection A 11 Make good planning for the use of building materials,
choose green materials, and reduce carbon emissions
Transportation Planning A 12 Develop transportation plans to reduce energy consumption
Energy efficient design A 13 Whole life cycle energy use planning for prefabricated buildings
Construction
Materials A 2
Combined steel formwork usage A 21 Combined steel formwork is used in the production of
members to increase the efficiency of formwork use and
reduce the consumption of wooden formwork
Improved material utilization A 22 Factory production of components for prefabricated buildings to
improve material utilization
Green Material Utilization A 23 More use of low-carbon, new materials to help reduce carbon
emissions
Construction solid waste reduction A 24 Prefabricated buildings can reduce the amount of solid waste
Material transportation distance A 25 Planning the transportation distance of materials to control
carbon emissions
Component storage A 26 Good storage of prefabricated components to avoid damage to
components and loss of materials
Energy use A 3 Use of new energy A 31 Use of renewable and new energy sources can increase energy
usage
Energy saving A 32 Use of coal, oil, and other energy sources
Effective use of water resources A 33 Reduce the waste of water resources, can reduce the energy
consumption in the process of water use
Use of water-saving equipment A 34 Water-saving equipment for building configuration
Energy consumption A 35 Use of energy in the whole process of prefabricated building
Equipment energy saving management A 36 Energy-saving management of lighting and heating equipment
Architectural Environment A 4 Dust Control A 41 Handling of dust during building construction
Reduce exhaust emissions A 42 Exhaust gases from energy use throughout the building
process
Solid waste disposal A 43 Building material use, construction, maintenance, and
building demolition of solid construction waste generated
Construction waste recycling A 44 Construction waste recycling and reuse
Green Space Planning A 45 Planning the green area of the building can make carbon sink
to reduce carbon emission
Wastewater treatment A 46 Energy consumption for building water and wastewater
treatment
Construction
Organization A 5
New Construction Process A 51 The use of new construction technology and construction
process can reduce the carbon emission during the construction process
Construction Design A 52 Good construction design and construction planning
The use of new equipment A 53 Use of new energy-saving equipment
Assembly rate A 54 Prefabricated buildings can reduce construction waste and
carbon emissions
Standardized design and production A 55 Standardized production of components in the factory
Table 3. Evaluation interval and standard evaluation cloud digital features.
Evaluation IntervalExEnHe
Level 110.1670.25
Level 230.1670.25
Level 350.1670.25
Level 470.1670.25
Level 590.1670.25
Table 4. Weight value α j + 1 of a j .
j Value0123456789
α j + 1 0.0020.0180.0700.1640.2460.2460.1640.0700.0180.002
Table 5. Indicator weights.
Target
Layer
Guideline
Layer
Absolute WeightRelative WeightsIndicator
Layer
Absolute WeightRelative Weights
Evaluation
of carbon
emission
reduction
effect of prefabricated buildings
Design
Planning A 1
8.1620.204Construction material selection A 11 6.9760.363
Transportation Planning A 12 5.8340.304
Energy-effi design A 13 6.4080.333
Construction Materials A 2 8.9980.225Combined steel formwork usage A 21 7.960.192
Improved material utilization A 22 6.9780.168
Green Material Utilization A 23 6.7660.163
Construction solid waste reduction A 24 7.2280.174
Material transportation distance A 25 6.2540.151
Component storage A 26 6.2520.151
Energy
Use A 3
6.1520.154Use of new energy A 31 6.4260.197
Energy saving A 32 5.8180.179
Effective use of water resources A 33 5.4980.169
Use of water-saving equipment A 34 5.1640.158
Energy consumption A 35 4.6780.144
Equipment energy saving management A 36 5.0020.154
Architectural Environment A 4 7.8100.195Dust Control A 41 6.2340.163
Reduce exhaust emissions A 42 6.590.172
Solid waste disposal A 43 6.020.157
Construction waste recycling A 44 6.7460.176
Green Space Planning A 45 7.1720.187
Wastewater treatment A 46 5.50.144
Construction Organization A 5 8.8320.221New Construction Process A 51 6.090.183
Construction Design A 52 6.1640.185
The use of new equipment A 53 6.2520.188
Assembly rate A 54 7.480.225
Standardized design and production A 55 7.2460.218
Table 6. Numerical characteristics of the indicator layer.
IndicatorsExEnHe
Construction material selection A 11 6.61.4540.613
Transportation Planning A 12 5.81.5540.455
Energy-efficient design A 13 6.11.880.752
Combined steel formwork usage A 21 7.61.8550.399
Improved material utilization A 22 6.71.7050.466
Green Material Utilization A 23 6.81.5540.124
Construction solid waste reduction A 24 71.5040.512
Material transportation distance A 25 6.41.3540.482
Component storage A 26 6.31.7050.466
Use of new energy A 31 6.21.5040.372
Energy saving A 32 5.81.5540.655
Effective use of water resources A 33 5.41.2530.171
Use of water-saving equipment A 34 5.11.6540.689
Energy consumption A 35 4.61.6040.6
Equipment energy saving management A 36 5.11.4290.709
Dust Control A 41 6.21.8050.504
Reduce exhaust emissions A 42 6.81.5040.29
Solid waste disposal A 43 6.21.3540.588
Construction waste recycling A 44 6.61.3540.461
Green Space Planning A 45 6.82.0550.519
Wastewater treatment A 46 5.51.6290.393
New Construction Process A 51 6.31.5290.343
Construction Design A 52 6.11.1530.322
The use of new equipment A 53 6.31.7050.466
Assembly rate A 54 7.31.880.18
Standardized design and production A 55 7.11.6290.577
Table 7. Numerical characteristics of guideline level indicators.
IndicatorsExEnHe
Design Planning A 1 6.1901.6370.611
Construction Materials A 2 6.8361.6290.408
Energy use A 3 5.4211.5030.523
Architectural Environment A 4 6.3861.6450.46
Construction Organization A 5 6.6621.6110.376
Publisher’s Note: MDPI stays neutral with regard to jurisdictional claims in published maps and institutional affiliations.

