
Evaluation of the Low-Temperature Cracking Performance of Recycled Asphalt Mixture: A Development of Equivalent Fracture Temperature

School of Transportation, Southeast University, Dongnandaxue Road 2#, Jiangning District, Nanjing 211189, China
*
Author to whom correspondence should be addressed.
Buildings 2022, 12(9), 1366; https://doi.org/10.3390/buildings12091366
Submission received: 29 July 2022
/
Revised: 30 August 2022
/
Accepted: 30 August 2022
/
Published: 2 September 2022
(This article belongs to the Section Building Materials, and Repair & Renovation)
Abstract
:This study aims to develop a new index to evaluate the low-temperature cracking performance (LTCP) of recycled asphalt mixtures. To achieve this, the assumption that fracture energy has limitation in evaluating the LTCP of mixtures was put forward firstly. To reveal this limitation theoretically, a concept of energy absorption rate that characterized the fracture energy of the mixtures was then given. Thirdly, an equivalent fracture temperature (EFT) corresponding to the critical cracking temperature in a thermal stress restrained specimen test (TSRST) was proposed to evaluate the LTCP of mixtures based on a three-point bending beam (3PBB) test. Finally, some data derived from previous work were collected to verify the proposed assumption, and the 3PBB test and TSRST were conducted to investigate the LTCP of five recycled mixtures with different reclaimed asphalt pavement (RAP) material contents and to verify the rationality of the proposed EFT. The results confirmed that fracture energy had some limitations in predicting the LTCP of mixtures. The EFT was as accurate as the critical cracking temperature in evaluating the LTCP of mixtures. Compared to fracture energy and critical cracking temperature, EFT had bigger absolute change and relative change between different mixtures, meaning it was better to differentiate the LTCP of mixtures. Compared to failure strain, EFT was also more definite and less variable when processed by different data analysts, meaning it was more objective.
1. Introduction
Environmental awareness and sustainable development are obtaining increasing concern in the world. The paving industry annually consumes a great deal of raw materials and energy in road construction, rehabilitation, and maintenance, causing a large number of available resources to be exploited and greenhouse gas emissions. Replacing virgin materials with reclaimed asphalt pavement (RAP) materials in the production of asphalt mixtures is a practical approach to reduce the available resource and energy consumption [1,2]. Road agencies have a strong interest in recycled mixture technologies. However, the average RAP percentage used in hot-mix asphalt (HMA) mixtures is about 21.1% in the United States and is approximately 19% in Europe [3,4]; there is still great potential to increase the RAP percentage. One of the limitations of increasing RAP content in HMA is that the introduction of RAP deteriorates the low-temperature cracking performance (LTCP) [5,6,7,8,9,10]. Some research has revealed that recycled asphalt pavement in the field has more transverse cracking, most of which is low-temperature cracking, than conventional pavement [11,12,13]. Therefore, it is necessary to investigate well and improve the LTCP of recycled HMA, whereas evaluating the LTCP of mixtures accurately is an important premise.
Low-temperature cracking is caused by significantly changes in temperature. As the temperature drops, thermal stress is induced inside the mixture because the pavement cannot contract freely. When the thermal-induced stress exceeds the ultimate tensile strength of the mixture, low-temperature cracks develop [14,15]. These cracks further induce spalling, pumping, and frost heave and reduce the bearing capacity of pavement under water invasion [16,17]. Consequently, various maintenance activities are required to maintain pavement performance at an acceptable level, consuming a huge budget and much energy. Therefore, the accurate description of the LTCP of HMA for the purpose of choosing a mixture with a better LTCP at the construction stage can also make a significant contribution to asphalt pavement sustainability.
Among the various test methods in evaluating the LTCP of mixtures, the thermal stress restrained specimen test (TSRST) is the extensively used. The TSRST was first presented by Monismith et al. [14]. Then, this method was adopted by other researchers, such as Stock et al. [18], Vinson et al. [19], Sebaaly et al. [20], and Velásquez et al. [21], to evaluate the LTCP of mixtures. In the TSRST, the specimen is restrained, and thermal stress is induced inside the specimen when the temperature decreases at a constant rate, which is close to the low-temperature cracking mechanism of asphalt pavement in the field [14,22]. The critical cracking temperature (CCT) determined from the TSRST is commonly used as the evaluation index, which is defined as the temperature at which a specimen fractures. Zubeck et al. [23] confirmed that the CCT was correlated with the field cracking temperature and crack frequency. Tan et al. [24] and Tapsoba et al. [25] each showed the CCT had good repeatability and a relatively low coefficient of variation. Due to its appropriate test principle and accurate test results, the TSRST currently is specified in European standard EN 12697-46, and the CCT has become a reference to judge the rationality of other evaluation indices [26,27,28]. Some countries also have proposed the TSRST as the standard method for evaluating the LTCP of mixtures. For example, Germany limits a maximal CCT of −20 °C, Latvia limits a maximal CCT of −22.5 °C for the surface layer and −20 °C for the binder and base layers, and Austria proposes a CCT of −30 °C to −22.5 °C for the surface layer, depending on the type of mixture [29].
However, Pszczola et al. [30] showed that the cooling rate of the TSRST had a great impact on CCT, and Velásquez et al. [21] showed that the rotation of the platens due to poor specimen alignment and material heterogeneity led to incorrect experimental measurement. Therefore, rigorous testing conditioning is needed when conducting the TSRST, such that sophisticated and complex experimental equipment is essential. Consequently, the TSRST needs expensive equipment and components, thus limiting the widespread use of this test method [29]. In addition, the TSRST is time-consuming and troublesome to conduct because it needs specimen cutting, gluing, and conditioning before the testing. Zaumanis and Valters [31] estimated that the testing time, including sample preparation and conditioning, was about 4~5 days for the TSRST, while fracture-mechanics-based tests, such as the semi-circular bending test (SCB) and disk-shaped compact tension test (DCT), only need 2.5 days. It would be perfect if an accurate index, such as CCT, could be obtained from the fracture-mechanics-based tests.
In addition to the TSRST, some fracture-mechanics-based tests, such as the SCB [32], DCT [33], three-point bending beam test (3PBB) [26], and indirect tensile test (IDT) [34,35], are also employed to evaluate the LTCP of mixtures. Compared to the TSRST, the SCB, DCT, 3PBB, and IDT are easier in specimen preparation and operation, as well as having quicker testing times, more availability, and lower costs of test equipment, which is more convenient and efficient for testing. Many agencies and researchers have proposed the SCB, DCT, 3PBB, or IDT as a standard method for evaluating the LTCP of mixtures. For example, the Minnesota, Iowa, and Illinois DOTs in the USA specify the DCT as the standard method [36], China specifies the 3PBB as the standard method [37], and Marasteanu et al. [38] recommended the SCB as the test method. Among these fracture-mechanics-based tests, fracture energy (FE) is a commonly used index for evaluating the LTCP of mixtures. The Minnesota and Wisconsin DOTs limit a minimum FE of 450 J/m2 and 400 J/m2, respectively, while Marasteanu et al. [38] suggested a minimum FE of 350 J/m2.
Although some research has shown that FE is correlated with field low-temperature cracking [38,39,40], there are still researchers who have reported that low-temperature FE fails to accurately predict the cracking behavior of mixtures in the field [41,42]. Through analysis, this phenomenon may be not caused by test error and has theoretical possibility. As we know, low-temperature cracking is caused by abrupt temperature decrease, while thermal-induced stress performs work in the mixture during this process, and the FE is calculated by the total work. A mixture with higher stiffness is prone to induce higher thermal stress when cooling, and then it is possible that thermal stress performs more work in mixtures with higher stiffness than in mixtures with lower stiffness, even if mixtures with higher stiffness have higher (warmer) fracture temperatures [42]. Therefore, it is necessary to further investigate whether this phenomenon has practical possibility and to confirm whether FE is an accurate evaluation of the LTCP of mixtures.
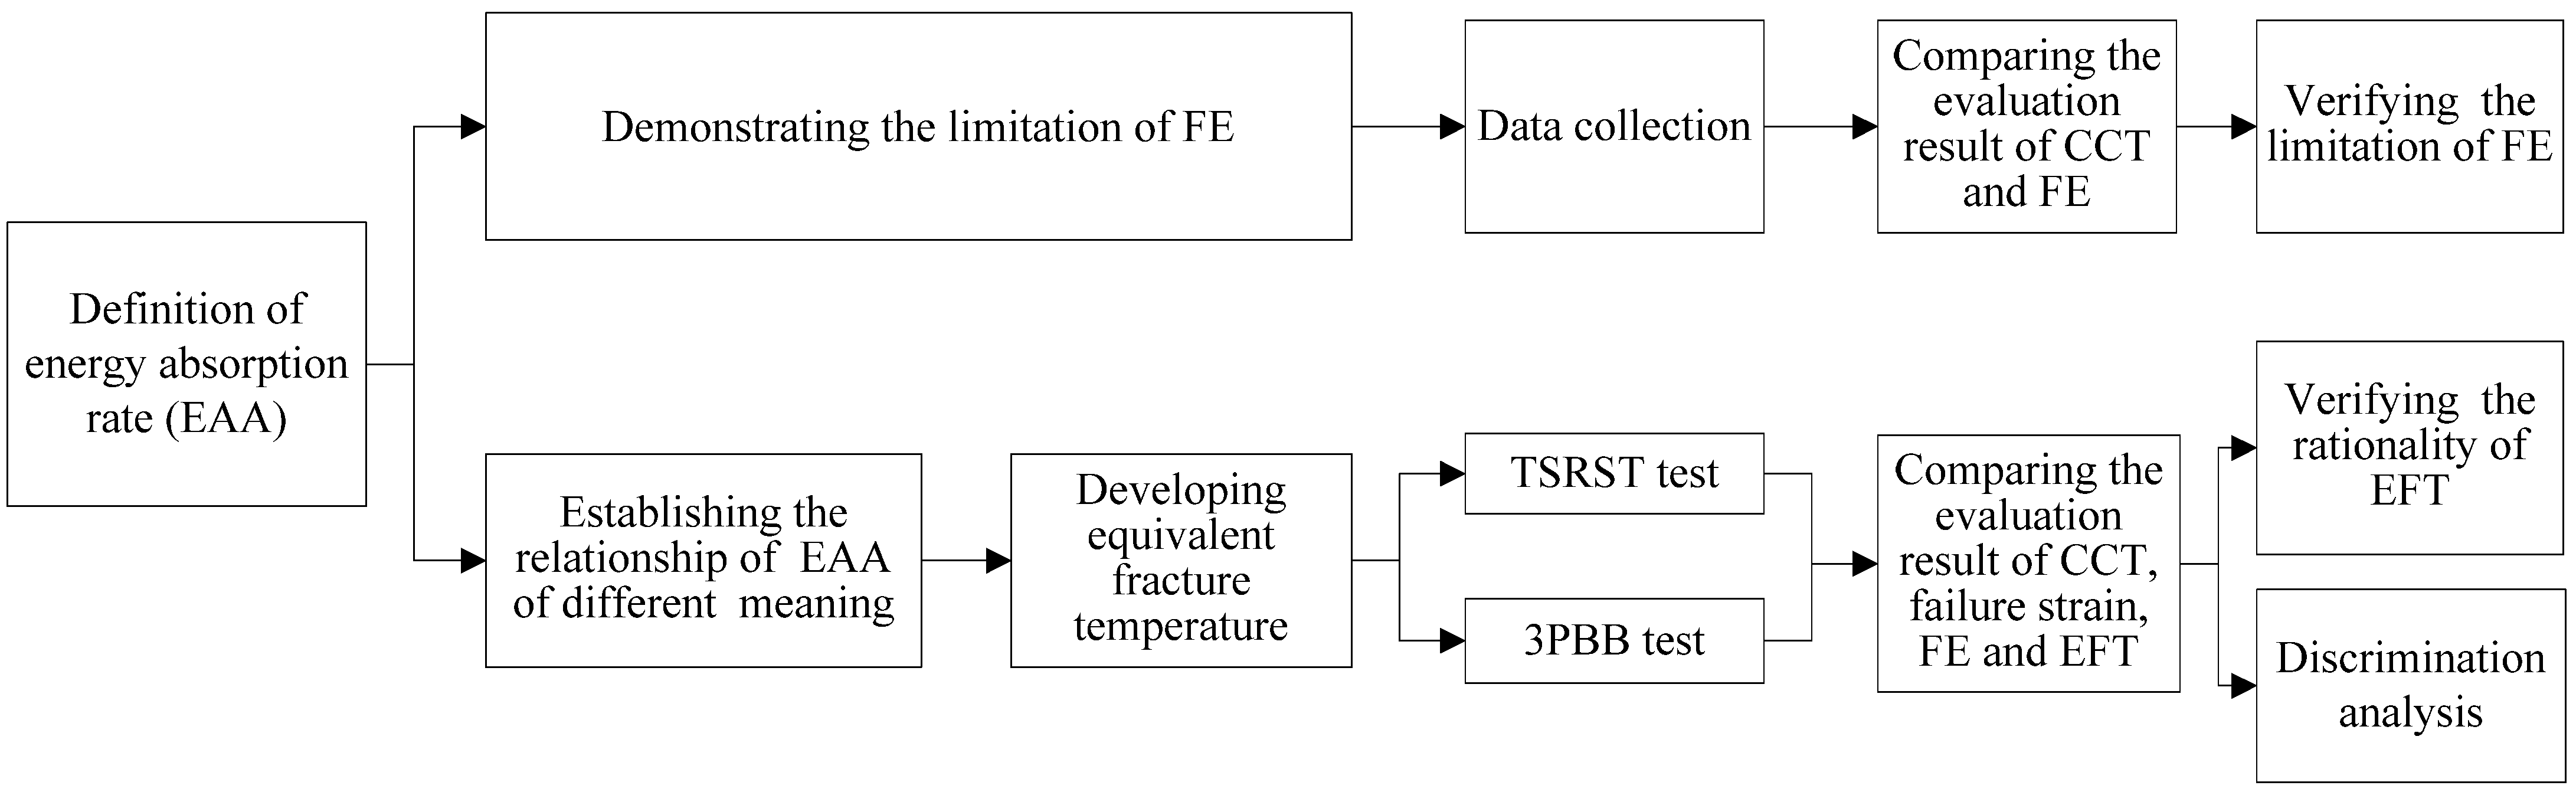
As demonstrated above, the TSRST is time-consuming and troublesome to conduct, and the FE in fracture-mechanics-based testing may be inaccuracy in evaluating the LTCP of mixtures. The objective of this study is to develop an index as accurate as the CCT based on fracture mechanics testing. To achieve this goal, a concept—the energy absorption rate—is firstly defined to characterize the FE of mixtures and to demonstrate the limitations of FE; then, an index—the equivalent fracture temperature—is developed based on the 3PBB test; finally, five mixtures with different RAP contents are designed to verify the rationality of the equivalent fracture temperature. The framework of this study is shown in Figure 1.
2. Development of Evaluation Index for Low-Temperature Performance
2.1. Definition of Energy Absorption Rate
2.1.1. Energy Absorption Rate with Respect to Temperature
Low-temperature cracking occurs when the thermal-induced stress exceeds the ultimate tensile strength of an asphalt mixture. From the viewpoint of energy, in this process, the external load, i.e., the thermal load, performs work on the asphalt mixture, and the mixture simultaneously absorbs the energy provided by the external load [43]. When the work performed by the external load (or the total amount of energy absorbed) exceeds a critical value, the asphalt mixture fractures. FE is a parameter that characterizes the critical energy, which is equal to the area under the load–deflection curve divided by the fracture surface area [44,45]. In this study, the work performed by the thermal load (or absorbed energy) per unit area at a unit temperature of cooling in an asphalt mixture was set as the energy absorption rate (EAA). Then, the FE in this process can be calculated by Equation (1):
where denotes the FE in J/m2; denotes the EAA with respect to temperature in J J/(m2·°C); denotes the average EAA with respect to temperature; denotes the temperature in °C; denotes the CCT in °C; and denotes the temperature decrease in °C.
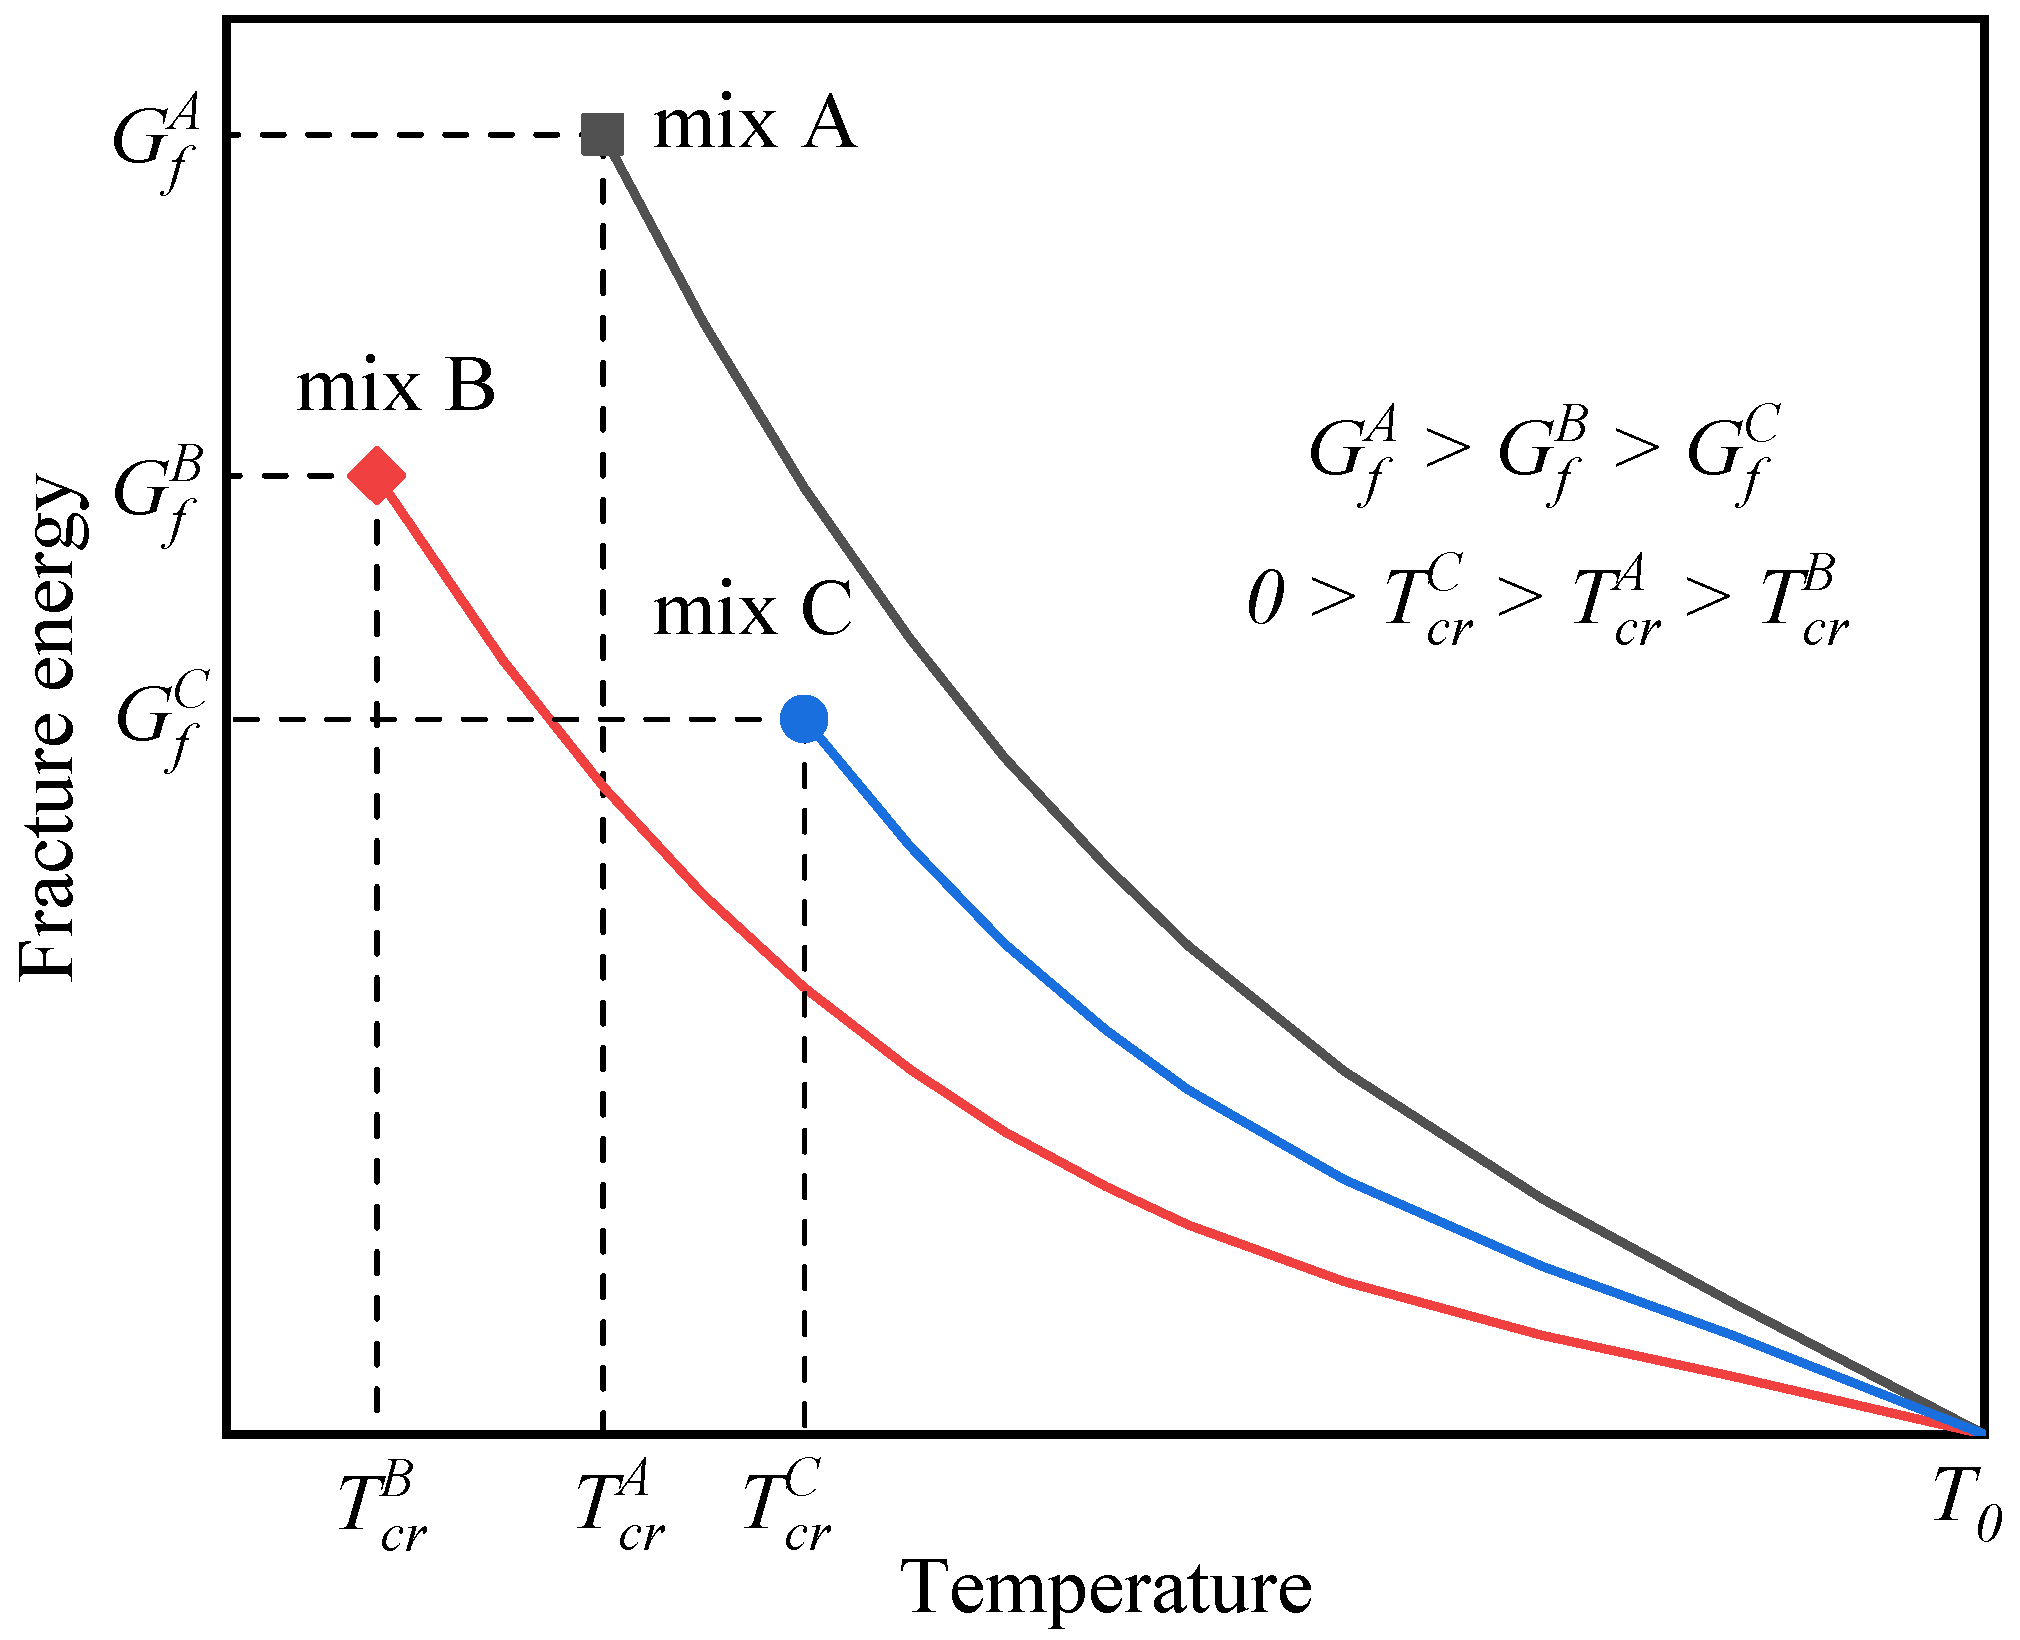
Using Equation (1) to express the FE of different mixtures, a likely scenario of the FE and CCT relationships between different mixtures is shown in Figure 2, from which it can be seen that a mixture with a higher FE is prone to have a colder CCT, regardless of whether its average EAA is bigger or lower, such as mix A (or mix B) and mix C show, respectively. These scenarios are common occurrences in previous test results and are also consistent with the consensus of the paving community. Figure 2 also shows that a mixture with a higher FE may have a warmer CCT if its average EAA is bigger, such as mix A and mix B. These demonstrate that characterizing FE in terms of is feasible and can show the limitation of FE in evaluating the LTCP of mixtures in theory.
2.1.2. Energy Absorption Rate with Respect to Strain
The FE determined from the SCB, DCT, 3PBB, or IDT test originally evaluated the dissipated energy when an asphalt mixture fractured at a low temperature. In the SCB, DCT, 3PBB, and IDT tests, the mechanical load performs work on the asphalt mixture, and the asphalt mixture simultaneously absorbs the energy provided by the external load [43]. When the work performed by the load (or the total amount of energy absorbed) reaches a limit, the asphalt mixture fractures. FE is a parameter that characterizes the critical energy, which represents the energy required to create a unit surface area and is equal to the area under the load–deflection curve divided by the ligament area [44,45]. In this study, the work performed by the mechanical load (or absorbed energy) per unit area at a unit strain increment in an asphalt mixture was also set as EAA. Then, the FE in the SCB, DCT, 3PBB, or IDT test can be calculated by Equation (2):
where denotes the EAA with respect to strain in J/m2; denotes the average EAA with respect to strain; denotes the strain; and denotes the strain failure.
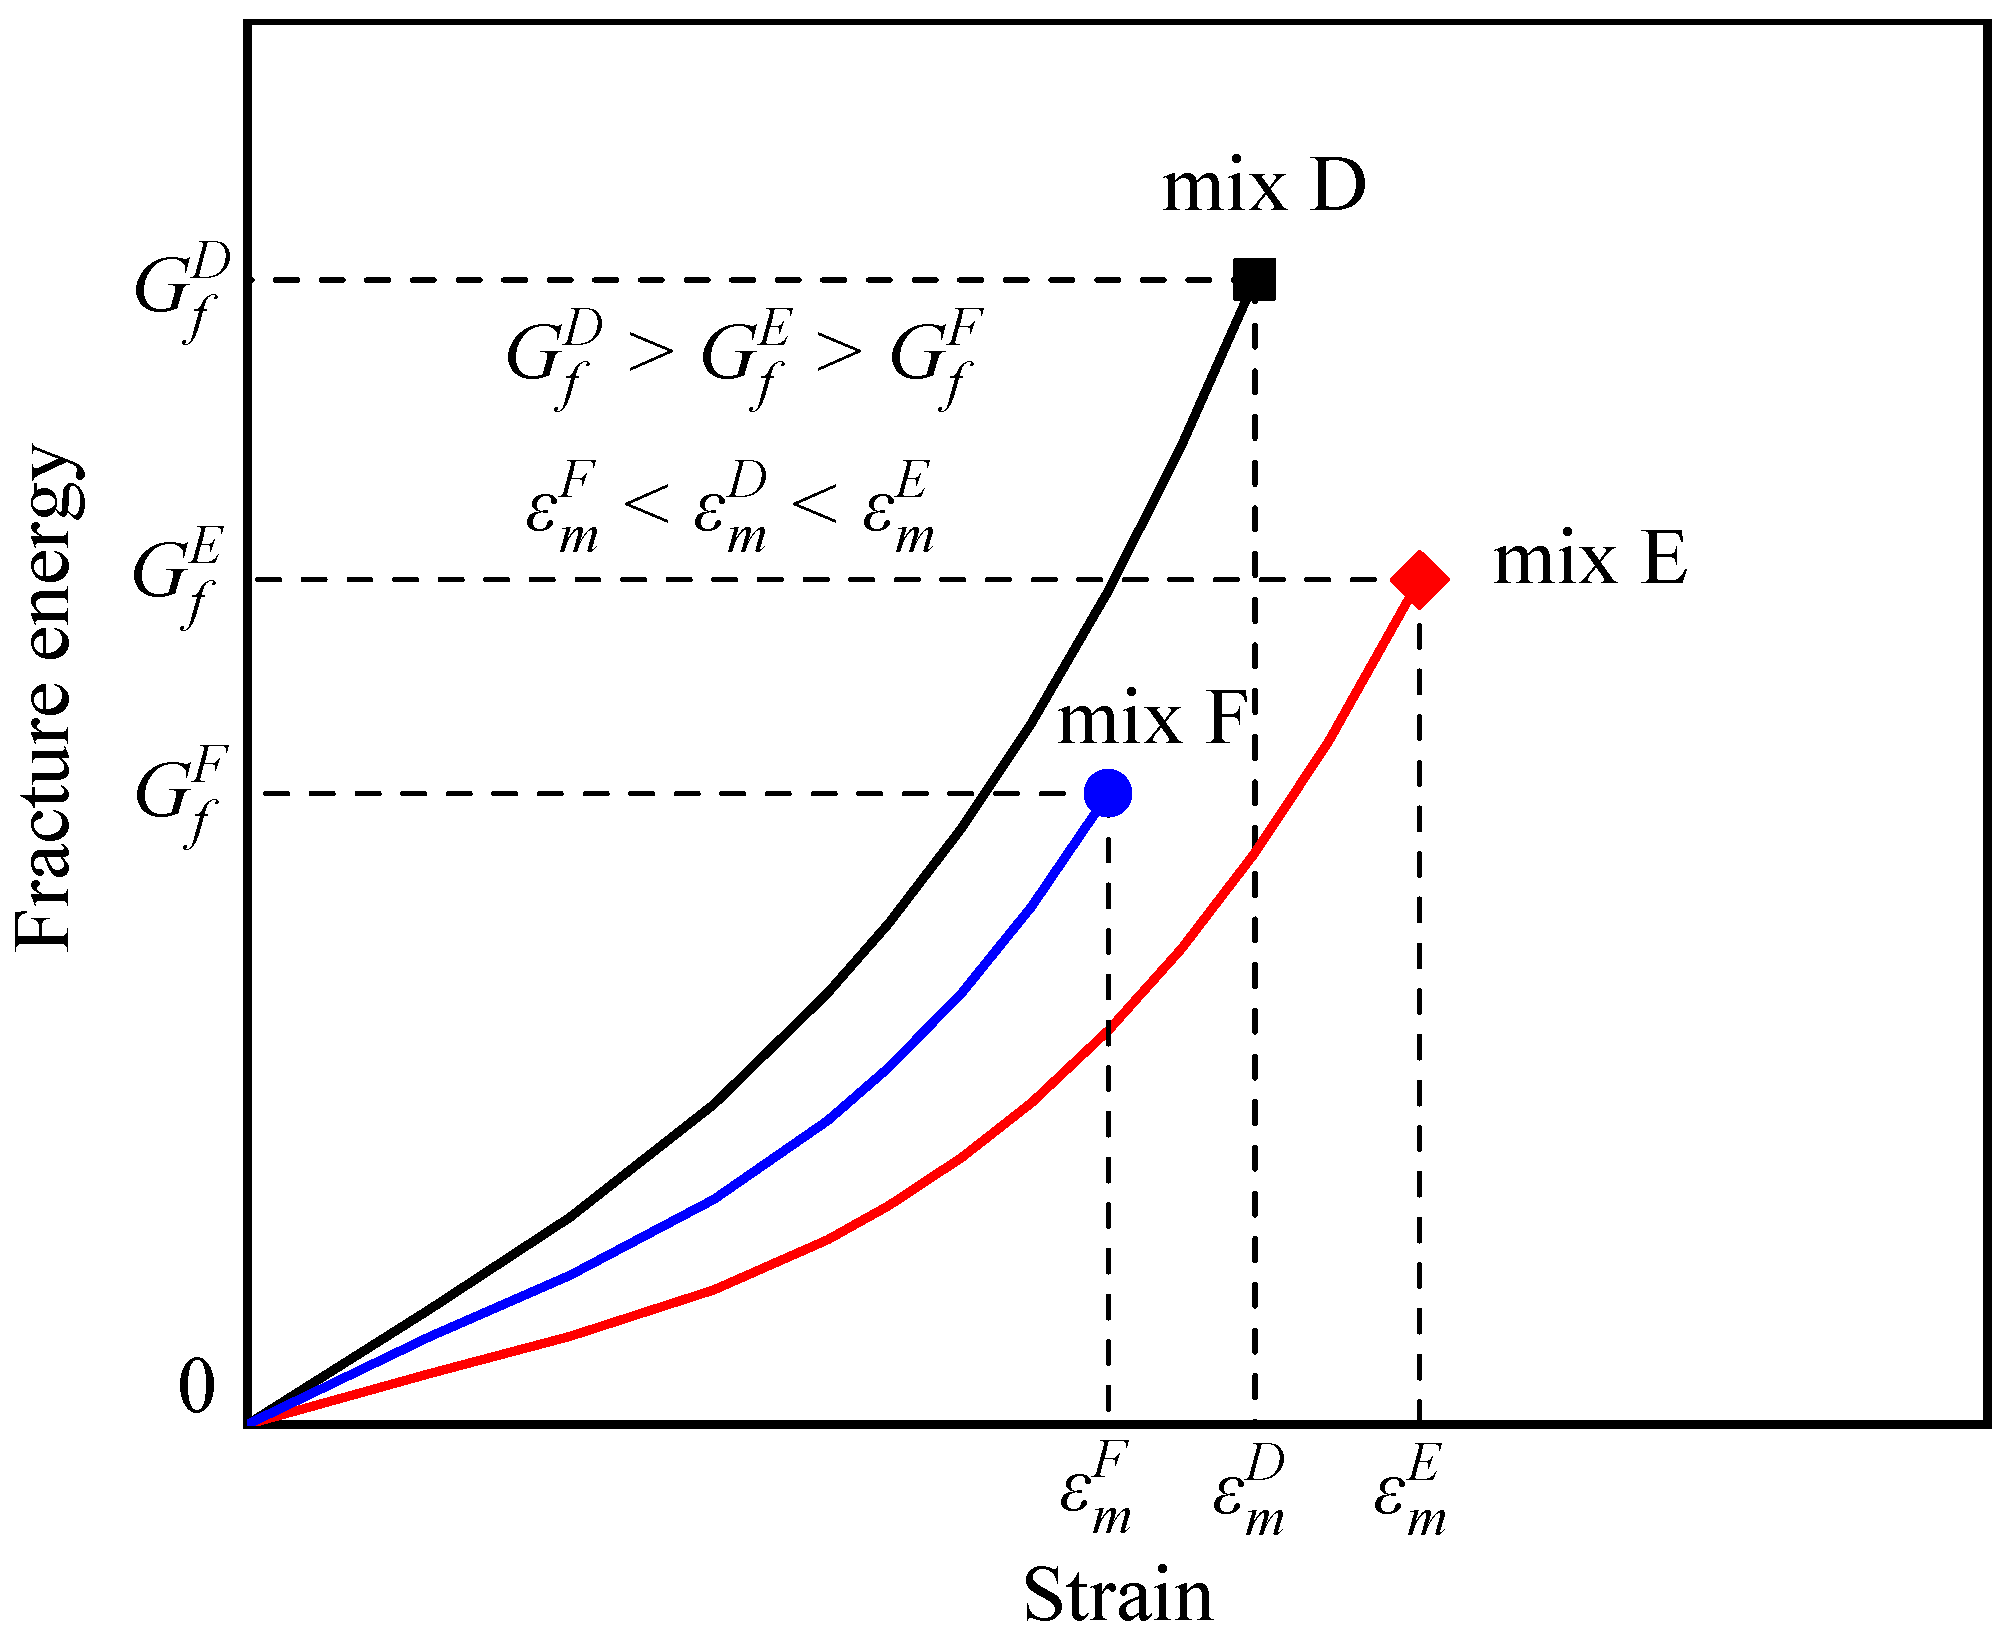
Using Equation (2) to express the FE of different mixtures, a likely scenario of the FE and failure strain relationships between different mixtures is shown in Figure 3, from which it can be seen that a mixture with a higher toughness is prone to have a bigger FE, regardless of whether its is bigger or lower, such as mix D (or mix E) and mix F show, respectively. These scenarios are common occurrences in previous test results and are also consistent with the consensus of the paving community. Figure 3 also shows that a mixture with a higher toughness may have a lower FE if its is lower, such as mix D and mix E. This scenario is unexpected, as a mixture with a higher toughness and a colder CCT is the consensus of the paving community. However, Figure 3 shows that a mixture with a lower FE may also have a colder CCT. These demonstrate that characterizing FE in terms of is also feasible and can also show the limitation of FE in evaluating the LTCP of mixtures in theory.
2.1.3. Relationship between and
In the TSRST test, a specimen is restrained that cannot be constrained freely. Thus, the thermal strain is zero, and the FE is calculated by Equation (1). If there is an identical unrestrained specimen in a TSRST environmental chamber and the thermal deformation with respect to temperature is recorded, such as that in a uniaxial thermal stress (or thermal strain) and strain tester (UTSST) as in ASTM D8303-20, the FE can also be calculated by Equation (2). Regardless of the energy calculated by Equations (1) or (2), when the temperature drops from to in the TSRST, the calculated FE should be equal, which can be expressed as Equation (3):
where denotes the thermal strain at .
In the TSRST, the thermal strain can also be calculated by multiplying the coefficient of thermal contraction (CTC) by the temperature decrease range, as Equation (4) shows:
where denotes the CTC of the mixture in 1/°C.
Substituting Equation (4) into Equation (3) yields Equation (5):
Equation (5) can be rewritten as Equation (6):
which yields the following:
Then, Equation (6) can be rewritten as Equation (8):
Equation (8) shows the relationship of the EAA between different definitions, in which essentially denotes the average coefficient of thermal contraction with respect to temperature.
2.2. Formulation of Equivalent Fracture Temperature
The purpose of this section is to develop an index corresponding to the CCT (determined from the TSRST test) based on one of the test methods among the SCB, DCT, 3PBB, or IDT tests from the viewpoint of energy. To achieve this goal, firstly, a test method possessing the same fracture characteristics and geometry as the TSRST test should be selected, as the FE derived from different fracture tests may have different physical meanings, and FE has a size effect [46,47]. In the TSRST test, the specimen fractures abruptly, and the crack propagation can hardly be measured; therefore, the TSRST test can be regarded as a crack initiation experiment. Among the SCB, DCT, 3PBB, and IDT tests, the 3PBB test uses a not-notched specimen; therefore, the 3PBB test can also be regarded as a crack initiation experiment. Meanwhile, the specimen in the 3PBB test is prismatic, and the failure of the specimen is because of tensile stress, which is the same as that of the TSRST test. Therefore, the 3PBB test was finally selected as the candidate test method to develop the new index.
In the TSRST test, the thermal load performs work on the asphalt mixture, and in the 3PBB test, the mechanical load performs work on the asphalt mixture. The asphalt mixture fractures when the total amount of energy absorbed reaches its limit, regardless of the work performed by the thermal load or mechanical load. Therefore, it was speculated that the results of the mechanical fracture test could be converted to those of a thermal fracture test. For the same specimen geometry, the FE of an asphalt mixture in the 3PBB test corresponds to the FE of the TSRST test at a certain initial temperature and cooling rate, and inversely, the FE of the TSRST test corresponds to the FE of the 3PBB test at a certain loading rate and test temperature. As demonstrated above, the FE values of the TSRST test and the 3PBB test were calculated by Equations (1) and (2), respectively. When the FE values of these two tests are equal at a certain condition, then Equation (9) can be obtained:
where denotes the temperature drop that the asphalt mixture can withstand in °C.
Equation (9) can be rewritten as Equation (10), in which denotes the FE from the 3PBB test, while and come from the TSRST test. Equation (10) shows that the results of the 3PBB test can be converted to those of the TSRST test:
In the 3PBB test, the average EAA after an asphalt mixture fractures can be expressed as follows:
where is the displacement in m; is the load force in n; and is the area of the fracture surface in m2.
The 3PBB test is generally conducted at −10 °C. According to Ref. [48], when the temperature is lower than 30 °C, the tensile stress and strain at the bottom of the beam in the 3PBB test can be derived from force and displacement, which can be rewritten as Equations (12) and (13), as shown:
where is the width of the specimen in m; is the height of the specimen in m; and is the span of the specimen in m.
Substituting Equations (12) and (13) into Equation (11) can be rewritten as follows:
When the 3PBB test is conducted at a low temperature, there is a large part of the load–displacement curve that is close to a straight line [49], especially for recycled asphalt mixtures. Therefore, in this study, it was assumed that the whole stress–strain curve in the 3PBB test was linear at low temperature. Then, Equation (14) can be rewritten as follows:
where is the failure stress in Pa.
Substituting Equation (15) into Equation (8) obtained the following:
Then, substituting Equation (16) into Equation (10) obtained the following:
Equation (17) illustrates that the results of the 3PBB test can be converted to those of the TSRST test. The parameter was set as the equivalent fracture temperature (EFT) in this study.
3. Data Preparation and Experimental Program
To confirm whether the limitation of FE is universal in practice, some data about FE and CCT were collected from previous work and then further investigated. Meanwhile, to verify the EFT, a conventional asphalt mixture and four recycled asphalt mixtures with different RAP contents were designed to investigate their LTCP.
3.1. Data Sources
There were three data groups collected, containing the FE and CCT values of 19 types of asphalt mixtures conducted at different test conditions and with different test methods. For the first data group, the FE and CCT data of six mixtures with different binder grades and RAP contents were derived from Sanchez et al. [5,50]. These six mixtures were marked as 0-58-28, 40-58-28, 20-58-34, 0-52-34, 20-52-40, and 40-52-40. Among the mixture labels, the first number denoted the RAP content, and the last two numbers denoted the binder PG grade. For the second data group, the FE and CCT data of six mixtures with different additives were derived from Stienss et al. [51]. These six mixtures were marked as 50/70, Sasobit, LicoBS100, RedWMX, CecaBio, and CecaLQ, denoting that the mixtures were fabricated by binder 50/70 penetration and modified with the warm-mix asphalt additives of Sasobit, Licomont BS 100, Rediset WMX, Ceca Base Bio, and Ceca Base LQ, respectively. For the third data group, the FE and CCT data of seven mixtures with different gradations were derived from Mandal et al. [52]. These seven mixtures were marked as WI64-22C1, WI64-22F, OH64-28, OH76-22, ID64-34, ID70-28, and KS64-28. Among the mixture labels, the first two letters denoted whether the gradation was commonly used in Ohio, Wisconsin, Idaho, or Kansas; the middle two numbers denoted the binder grade; and for the last letter, C denoted coarse gradation, and F denoted fine gradation. The details on the testing and test materials can be found elsewhere [5,50,51,52].
3.2. Experimental Program
3.2.1. Materials
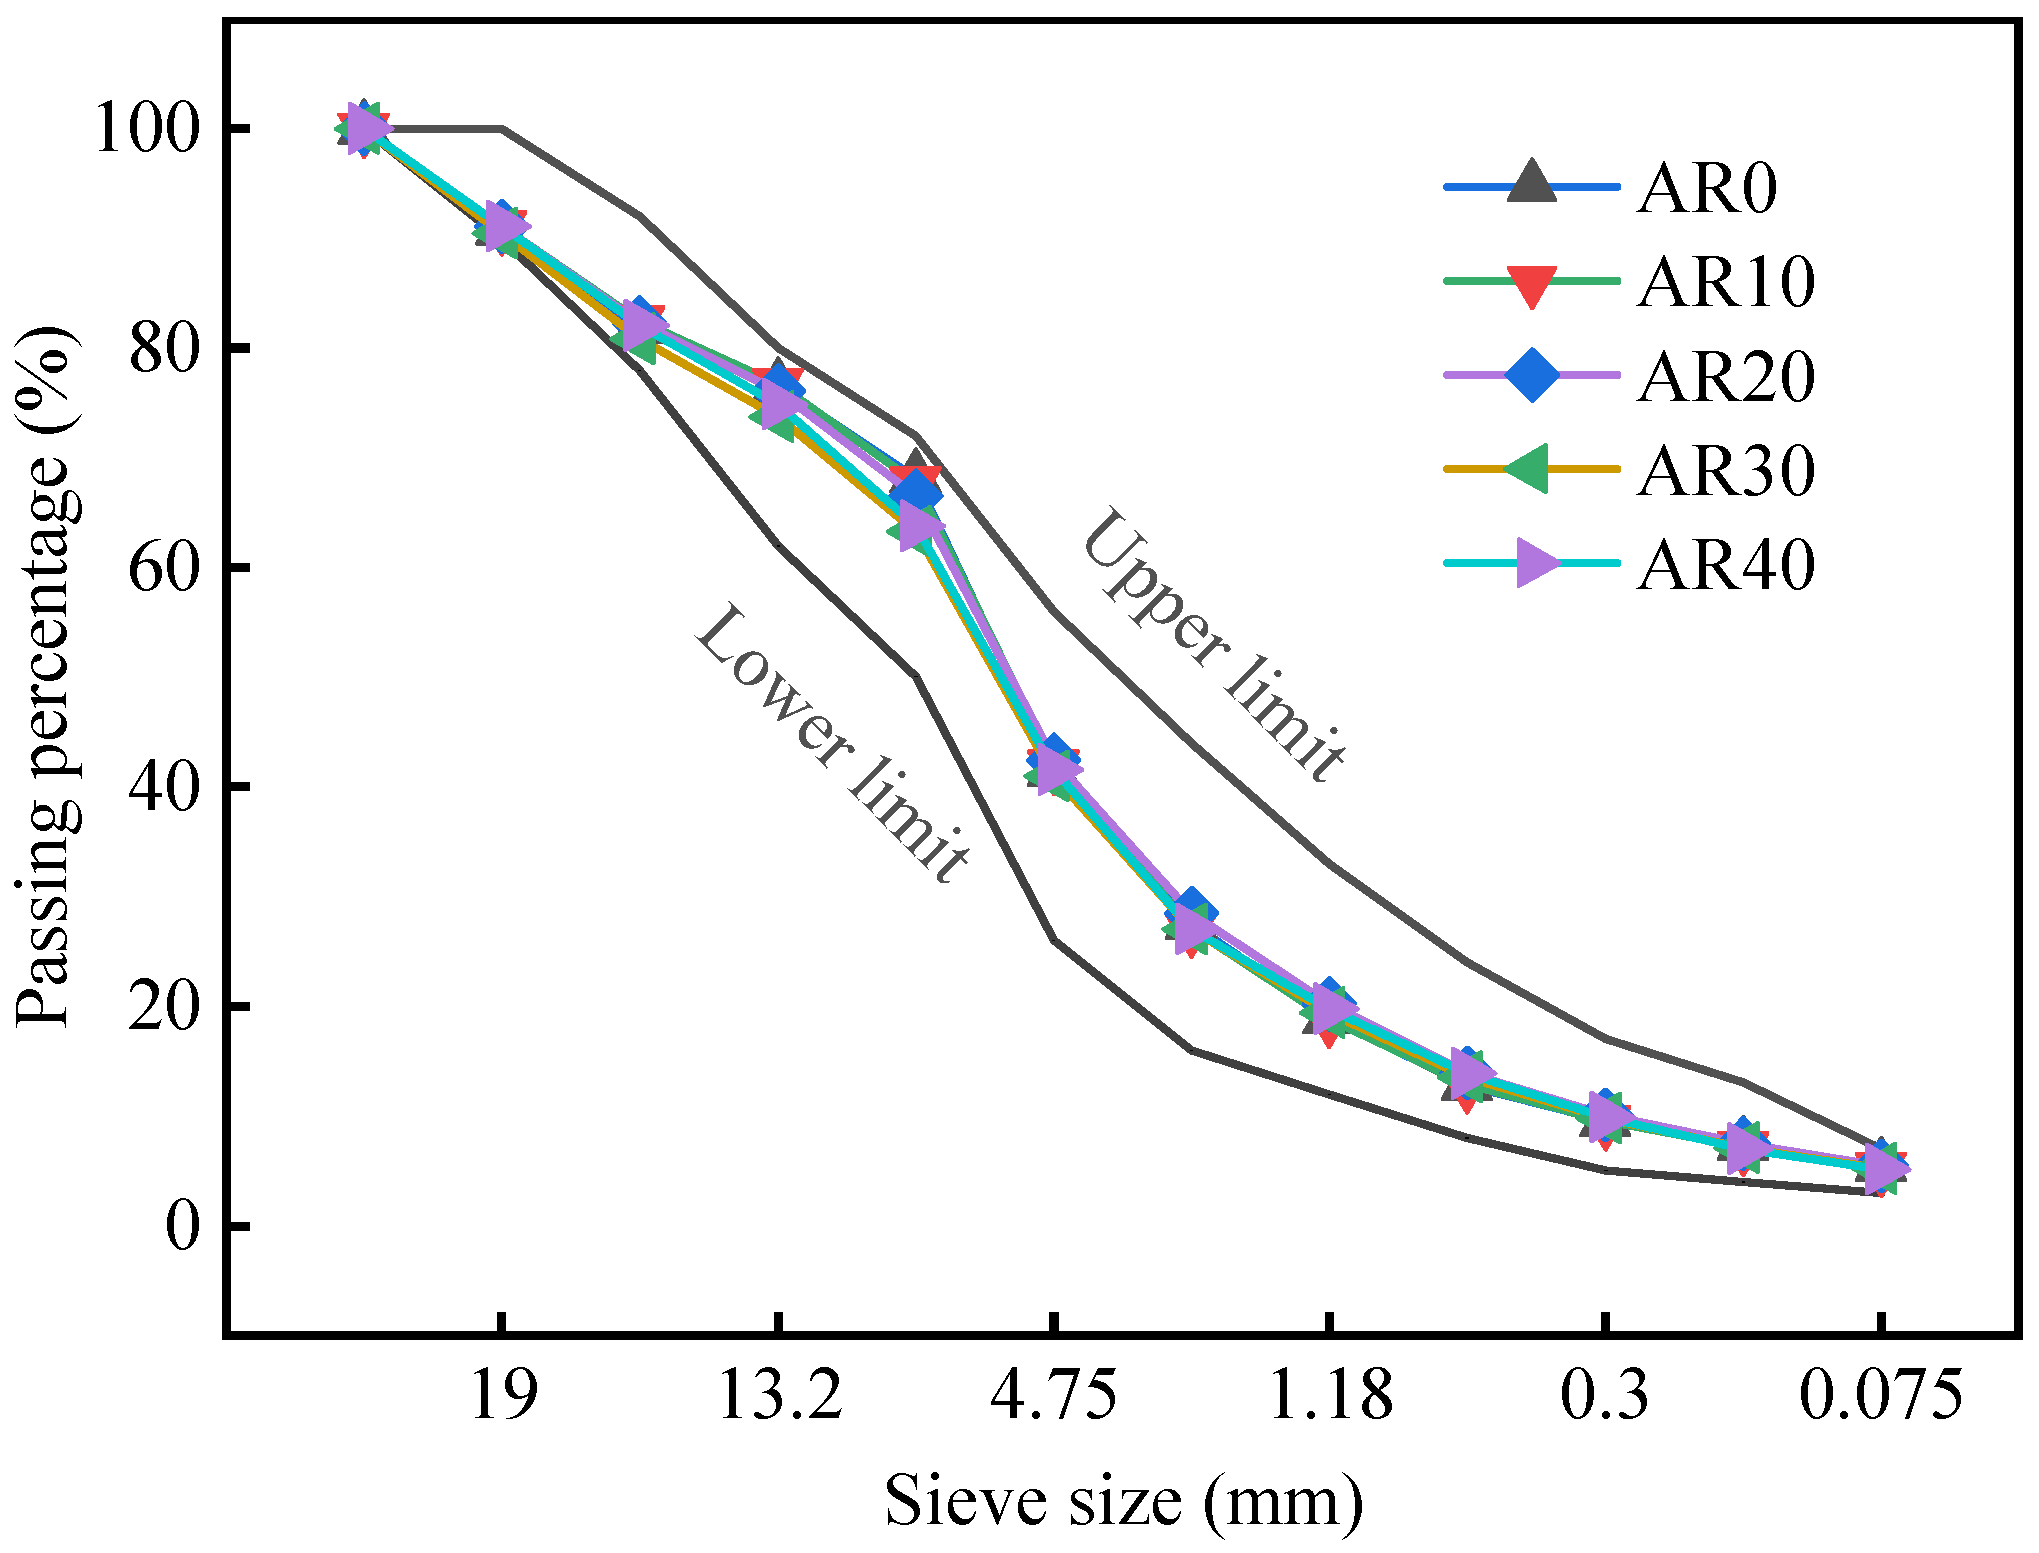
Virgin asphalt is penetration grade 70# in China. The properties of the virgin asphalt and the reclaimed asphalt in the RAPs are shown in Table 1. To reduce the effect of RAP variability on the test results of the recycled asphalt mixtures, the RAPs were divided into three fractions based on particle size (denoted as R1#, R2#, and R3#). The gradation of R1#, R2#, and R3# after extraction is shown in Table 2. The asphalt-aggregate ratios of the RAPs are shown in Table 3. When designing the recycled asphalt mixtures, a matrix-recycled mixture with the RAP proportions of R1#: R2#: R3# of 2:1:1 was firstly prepared. Then, the composition of the recycled asphalt mixtures was determined by adjusting the proportions of virgin aggregate and the matrix-recycled mixture based on the RAP contents. The virgin aggregate was limestone. The RAP contents of the four recycled mixtures were 10%, 20%, 30%, and 40% by total aggregate weight, and a conventional asphalt mixture was also designed. The codes of these five mixtures were AR0, AR10, AR20, AR30, and AR40. The number in the codes represented the RAP content. The objective gradation of these five mixtures was AC-20 (dense-graded asphalt concrete-20), with a median gradation of JTG F40-2004 in China, and the actual gradation is shown in Figure 4.
When preparing the recycled asphalt mixture, first, the RAP was preheated at 120 °C for 2 h, and the virgin aggregate was preheated at 200 °C for 4 h; then, the RAP and virgin aggregate were stirred at 160 °C for 90 s; finally, the virgin asphalt was added and stirred for another 90 s. The processes of preparing the conventional asphalt mixture (AR0) were the same as the recycled asphalt mixture, except that the preheated temperature of the virgin aggregate was selected as 180 °C. The Marshall mix design method was employed to determine the optimum asphalt–aggregate ratios of these five mixtures. When obtaining the optimum asphalt–aggregate ratio, five asphalt–aggregate ratios (3.5%, 4.0%, 4.5%, 5.0%, and 5.5%) were used to manufacture the Marshall samples of each type of mixture. The bulk specific gravity, void of volume, void in mineral aggregate (VMA), and voids filled with asphalt (VFA) were tested, and the optimum asphalt–aggregate ratios were determined in accordance with the specification of JTG E20-2011 for China. The optimum asphalt–aggregate ratios of AR0, AR10, AR20, AR30, and AR40 were 4.0%, 4.0%, 4.1%, 4.1%, and 4.3%, respectively. At the optimum asphalt–aggregate ratio, a slab sample with a size of 300 mm × 300 mm × 50 mm was firstly fabricated through the roll compaction method and then cut into a test specimen with a size of 250 mm × 35 mm × 30 mm.
3.2.2. Test Methods
To investigate the LTCP of the asphalt mixtures and verify the rationality of the proposed evaluation index, the 3PBB test and TSRST were conducted in this study.
The 3PBB test was conducted using a universal test machine (UTM). The specimen geometry was 30 mm × 35 mm × 250 mm. Before the testing, the specimen was conditioned at −10 °C for 4 h. When testing, the test temperature was −10 °C, the span of specimen was 200 mm, and the loading rate was 50 mm/min. Three duplicates of samples were employed. More details of this test are specified in JTG E20-2011 [48]. The TSRST test was conducted using a thermal stress restrained specimen tester. The specimen geometry was the same as that of the 3PBB test. Before the testing, the specimen was conditioned at 5 °C for 4 h. When testing, the cooling rate was 10 °C/h, and the initial temperature was 5 °C. Three duplicates of samples were employed. More details of this test are specified in AASTHO TP10.
According to Equation (17), when calculating the EFT, the average CTC of the mixture is needed. Since these five mixtures were fabricated by the same materials, their CTC values had similar performances. Therefore, a CTC at the same condition could reflect the difference in the average CTC values of these five mixtures. For the convenience of testing, this study employed the prediction method to determine the CTC values of the mixtures and to represent the average CTC of the mixtures. The predictive model was proposed by Nam et al. [53], as Equation (18) shows. According to the test results in Alavi et al. [54] and in the laboratory, the influence of aging levels on the CTC of asphalt mixtures is small, and the bulk specific gravities of the aggregate in the RAP and the virgin aggregate are very close; therefore, it is assumed that the CTC values of asphalt and aggregate in the RAP are the same as those of virgin asphalt and virgin aggregate, respectively:
where is the predictive coefficient of thermal contraction in 1/°C; is the volume of voids in the mineral aggregate in % and measured according to JTG E20-2011 [48]; is the volume of aggregate in the asphalt mixture in %; is the CTC of the asphalt binder, which is equal to 3.45 × 10⁻⁴ (1/°C); and is the CTC of the aggregate, which is equal to 5.1 × 10⁻⁶ (1/°C) for the limestone aggregate and 11.3 × 10⁻⁶ (1/°C) for the gravel aggregate.
4. Results and Discussion
4.1. Discussion about the Limitation of Fracture Energy
4.1.1. Comparisons of Fracture Energy and Critical Cracking Temperature
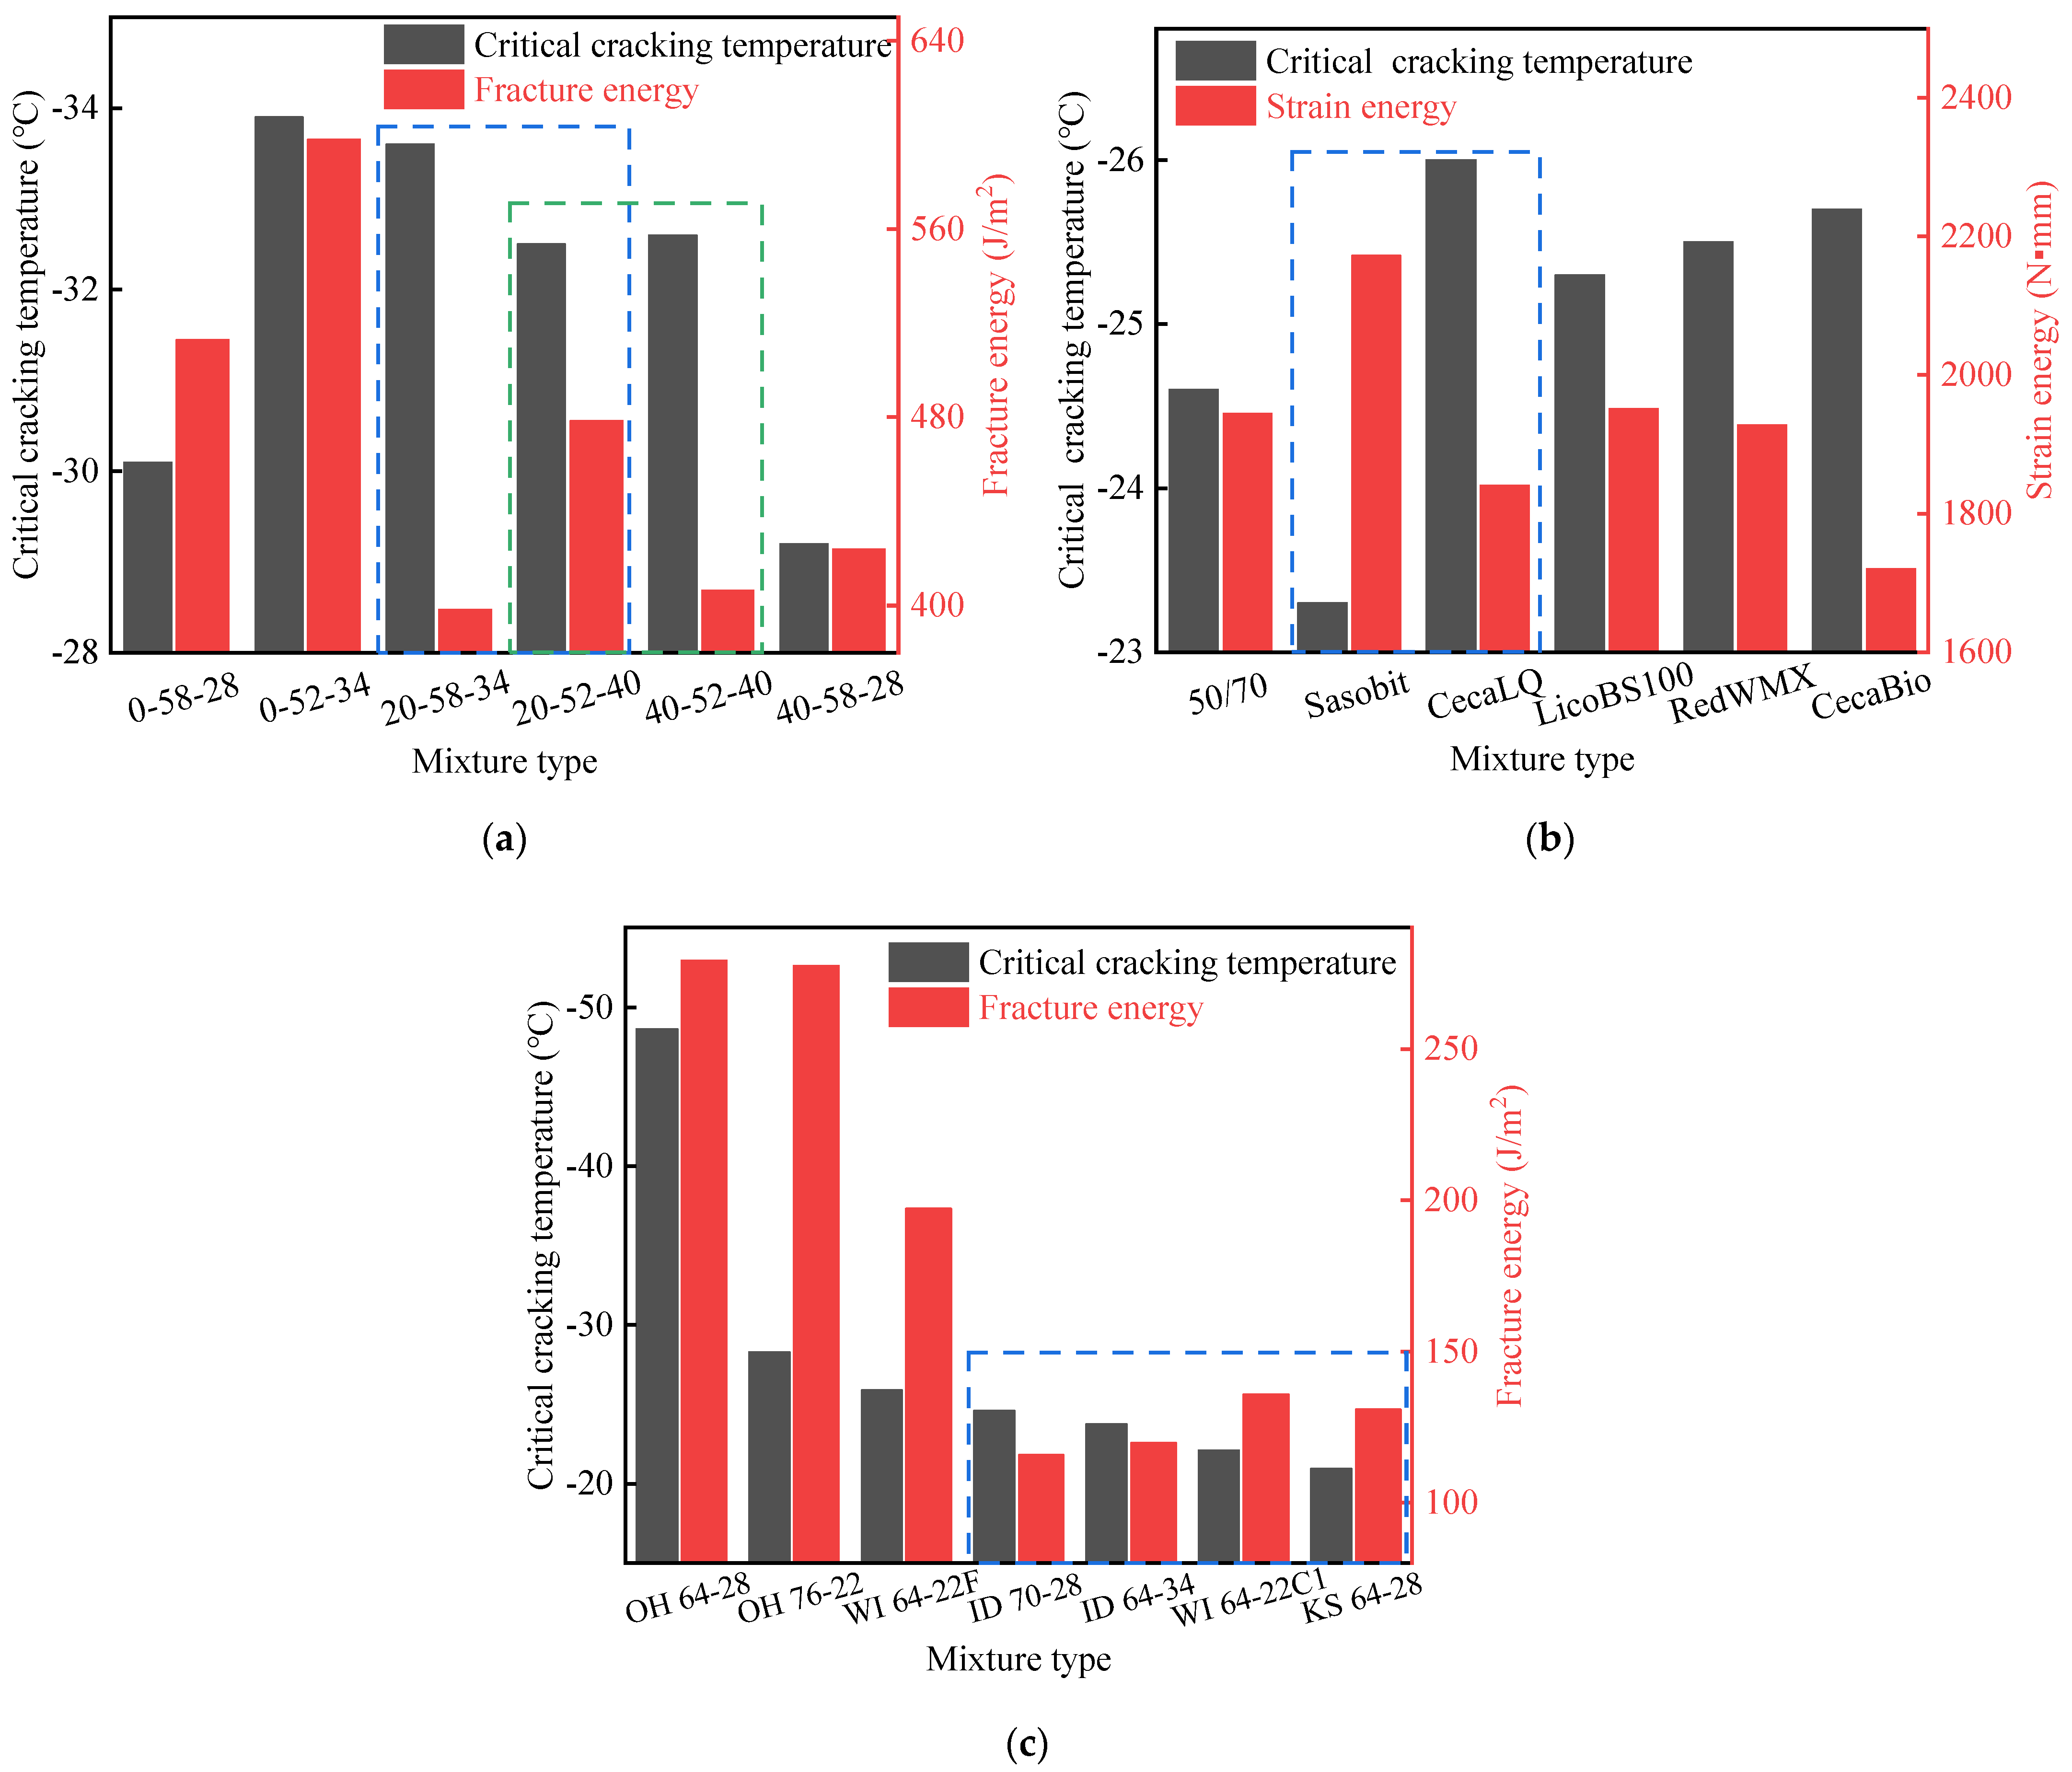
For the first data group, the FE and CCT values of six mixtures with different binder grades and RAP contents are shown in Figure 5a, from which it can be seen that the evaluation results of the CCT and FE were sometimes inconsistent. For example, the difference between mixtures 20-58-34 and 20-52-40 (the blue rectangle in Figure 5a) was the binder grade of the virgin asphalt, and mixture 20-58-34 possessed a better LTCP than mixture 20-52-40 from the perspective of CCT but was poorer than mixture 20-52-40 from the perspective of FE. The difference between mixtures 20-52-40 and 40-52-40 (the green rectangle in Figure 5a) was the RAP content, and mixture 40-52-40 possessed a better LTCP than mixture 20-52-40 from the perspective of CCT but was poorer than mixture 20-52-40 from the perspective of FE. When comparing mixture 40-58-28 with mixture 20-52-40, as well as mixture 40-58-28 with mixture 20-58-34, the evaluation results for FE were also inconsistent with those of CCT.
For the second data group, the strain energy and CCT values of six mixtures with different additives are shown in Figure 5b. Since the FE was the yield of strain energy divided by the fracture surface area and the fracture surface area was equal for all the test specimens, the evaluation results of strain energy were same as those of FE. Figure 5b illustrates that the ranking of the LTCP evaluated by CCT and strain energy was also sometimes inconsistent. For example, the CecaLQ mixture possessed a better LTCP than the Sasobit mixture from the perspective of CCT (the blue rectangle in Figure 5b) but was poorer than the Sasobit mixture from the perspective of strain energy. When comparing the CecaLQ mixture with the LicoBS100 mixture or the RedWMX mixture, as well as the LicoBS100 mixture with the RedWMX mixture, the evaluation results for strain energy were also inconsistent with those of CCT.
For the third data group, the FE and CCT values of seven mixtures with different gradations are shown in Figure 5c, from which it can be seen that the ranking of the LTCP evaluated by CCT and FE was also sometimes inconsistent. For example, the LTCP of the ID 70-28 mixture was better than those of the ID 64-34, WI 64-22C1, and KS 64-28 mixtures from the perspective of CCT (the blue rectangle in Figure 5c) but was worse than those of the ID 64-34, WI 64-22C1, and KS 64-28 mixtures from the perspective of FE. When comparing mixture ID 64-34 with mixtures WI 64-22C1 or KS 64-28, the evaluation results for CCT and FE were also contradictory.
In addition to the data discussed above, test results from Velasquez et al. [55] and Das et al. [16] also have shown that the evaluation results for CCT and FE are sometimes contradictory. Therefore, it could be concluded that mixtures with higher FE values but warmer CCT values have practical possibility. In addition, among the above comparisons, a broad range of asphalt mixture types in terms of aggregates types, binder grades, additives, RAP contents, and gradations were contained, which demonstrates that the resultant findings were not biased and representative.
4.1.2. Statistic Analysis of the Comparison Results
To make the finding more convincing and to exclude test errors of the TSRST, an independent sample t-test was employed to analyze the difference in CCT values among the asphalt mixtures. The independent sample t-test was conducted using SPSSAU, an online statistical analysis software (SPSSAU21.0, Beijing Qingsi Technology Co., Ltd., Beijing, China, https://spssau.com/, accessed on 21 September 2021) that only needs the mean, standard deviation (SD), and sample size. The standard deviation of the CCT for part of the asphalt mixtures is shown in Table 4. The sample size was set at three, as three duplicates are needed in AASTHO TP10 and EN 12697-46.
The statistical results for the CCT values among the mixtures are shown in Table 4, from which it can be seen that the CCT values between mixture 20-58-34 and mixture 40-58-28 had statistical difference with a confidence level of 90%; the CCT values between mixture 0-58-28 and mixture 20-58-34, mixture 0-58-28 and mixture 40-52-40, and the CecaRT mixture and the Sasobit mixture had statistical differences with confidence levels of 95%. In other words, the CCT value of mixture 20-58-34 was significantly lower (colder) than that of mixture 40-58-28, and the same was true when comparing the CecaRT mixture to the Sasobit mixture or when comparing mixtures 40-52-40 or 40-52-40 to mixture 0-58-28. However, the above discussion indicates that, in these five pairs of mixtures, the phenomenon occurred where mixtures with lower (colder) CCT values did not possess higher FE. Therefore, it demonstrates that the inconsistent phenomenon was not caused by a test error in CCT but by the inaccuracy of FE. In other words, FE was not as accurate as CCT in evaluating the LTCP of mixtures.
4.2. Discussion about the Low-Temperature Performance of Recycled Mixtures
4.2.1. Low-Temperature Performance Evaluated by TSRST
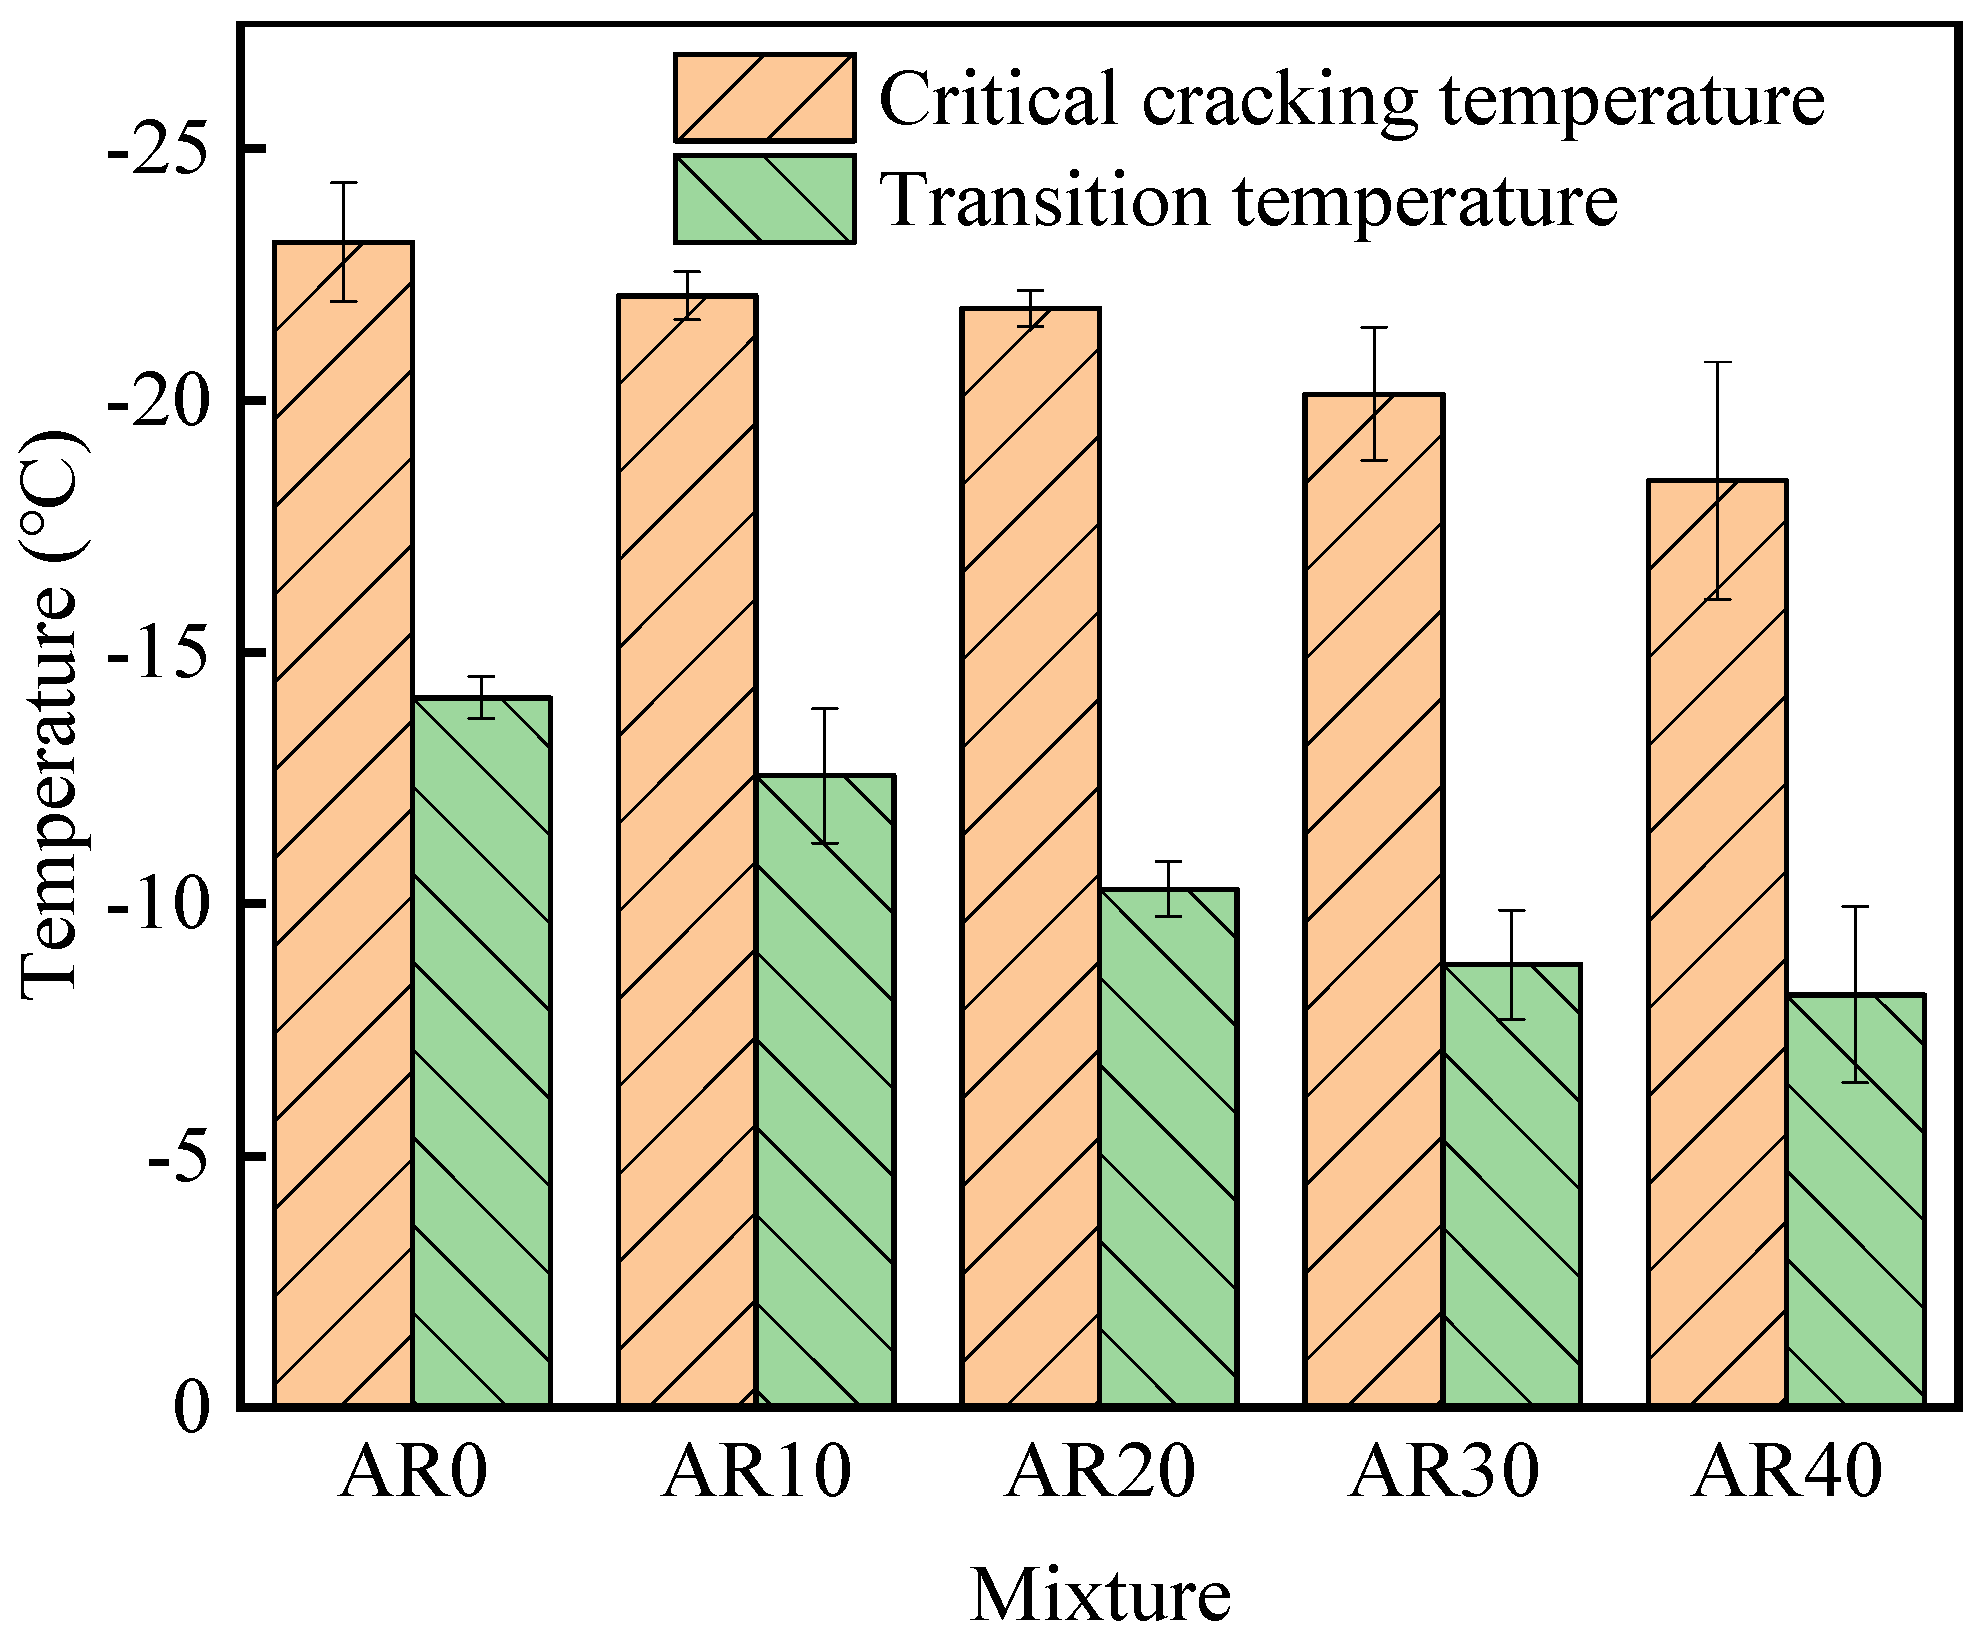
The LTCP values of five designed mixtures evaluated by the TSRST are shown in Figure 6. The transition temperature and CCT in the TSRST were used to evaluate the LTCP values of the five designed mixtures. The transition temperature represented the temperature at which the mixture changed from elastic to visco-elastic behavior, characterizing the rheological behavior of the mixture at cold temperature [56]. Figure 6 illustrates that the transition temperature increased with the inclusion of RAP, meaning the capacity of relaxing thermal stress was reduced with the inclusion of RAP, which is detrimental to the LTCP of a mixture. CCT is the temperature where a specimen failed and is the major index in the TSRST test because of its explicit meaning [26]. Figure 6 shows that the introduction of RAP increased the CCT of a mixture, meaning the LTCP of the mixture was reduced. This phenomenon is consistent with those found in previous work [57,58]. Figure 6 also shows that, the larger the RAP content introduced, the warmer the CCT. The reason for this phenomenon was that the aged asphalt binder in the RAP was stiffer and more brittle than the virgin binder and that a mixture with a larger RAP content (more aged binder) was prone to be more inhomogeneous and have a higher modulus and a lower relaxation ability [59,60], as the transition temperature showed. Consequently, a mixture with a larger RAP content was prone to induce higher thermal stress during cooling and, ultimately, fractured at a warmer CCT.
4.2.2. Low-Temperature Performance Evaluated by 3PBB
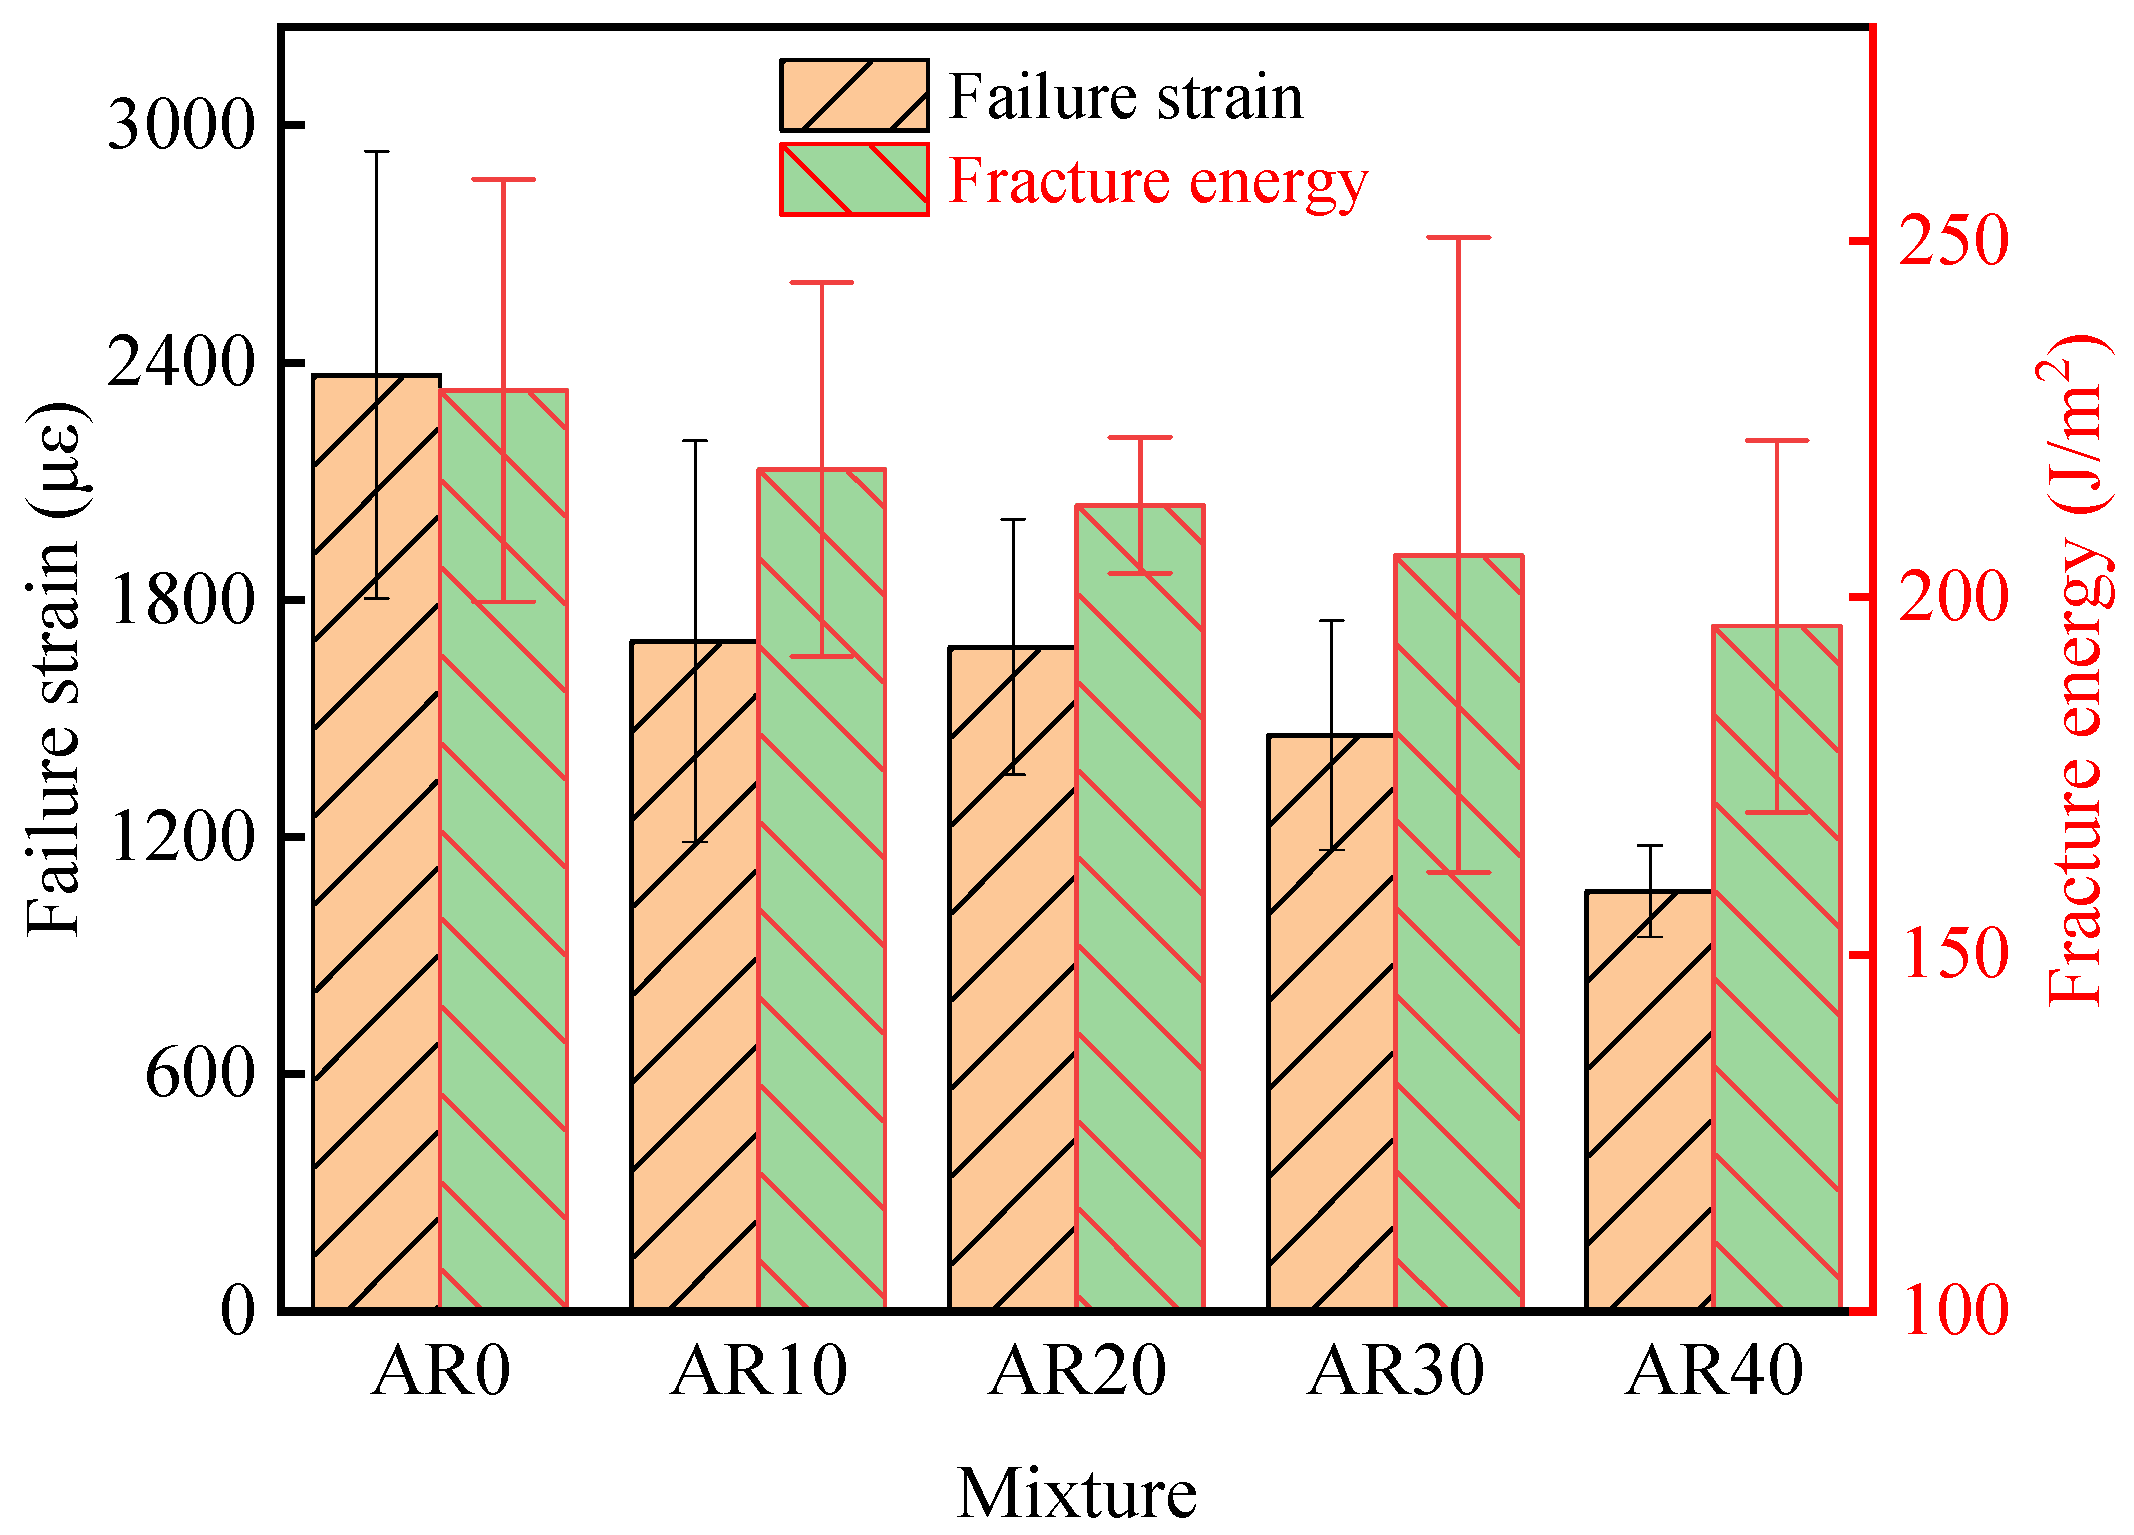
The LTCP values of five designed mixtures evaluated by 3PBB are shown in Figure 7. The failure strain and FE were used to evaluate the LTCP values of the five designed mixtures. The failure strain is the standard index for evaluating the LTCP of asphalt mixtures in China. Figure 7 illustrates that the failure strain decreased with the inclusion of RAP. The failure strain varied 1307 με from AR40 to AR0, implying that the LTCP decreased significantly when 40% RAP was added. FE is a function of strength and ductility, eliminating the bias of failure strength or failure strain alone in evaluating the LTCP of asphalt mixtures. Figure 7 shows that the FE also decreased with the inclusion of RAP. The FE varied 33 J/m2 from AR40 to AR0, implying that the LTCP only slightly decreased when 40% RAP was added. It demonstrated that FE is insensitive to RAP content when used as an evaluation index of the LTCP of mixtures. This point has also been demonstrated in Refs. [36,61]. When comparing failure strain with FE, the results showed that, even though FE was more comprehensive than failure strain in evaluating the LTCP of mixtures, it was poorer than failure strain for differentiating mixture with different RAP contents. If FE is used to evaluate the LTCP of recycled mixtures, it is possible to obtain a misleading result because of the experimental error.
4.3. Discussion about Low-Temperature Performance Evaluated by EFT
4.3.1. Low-Temperature Performance Evaluated by EFT
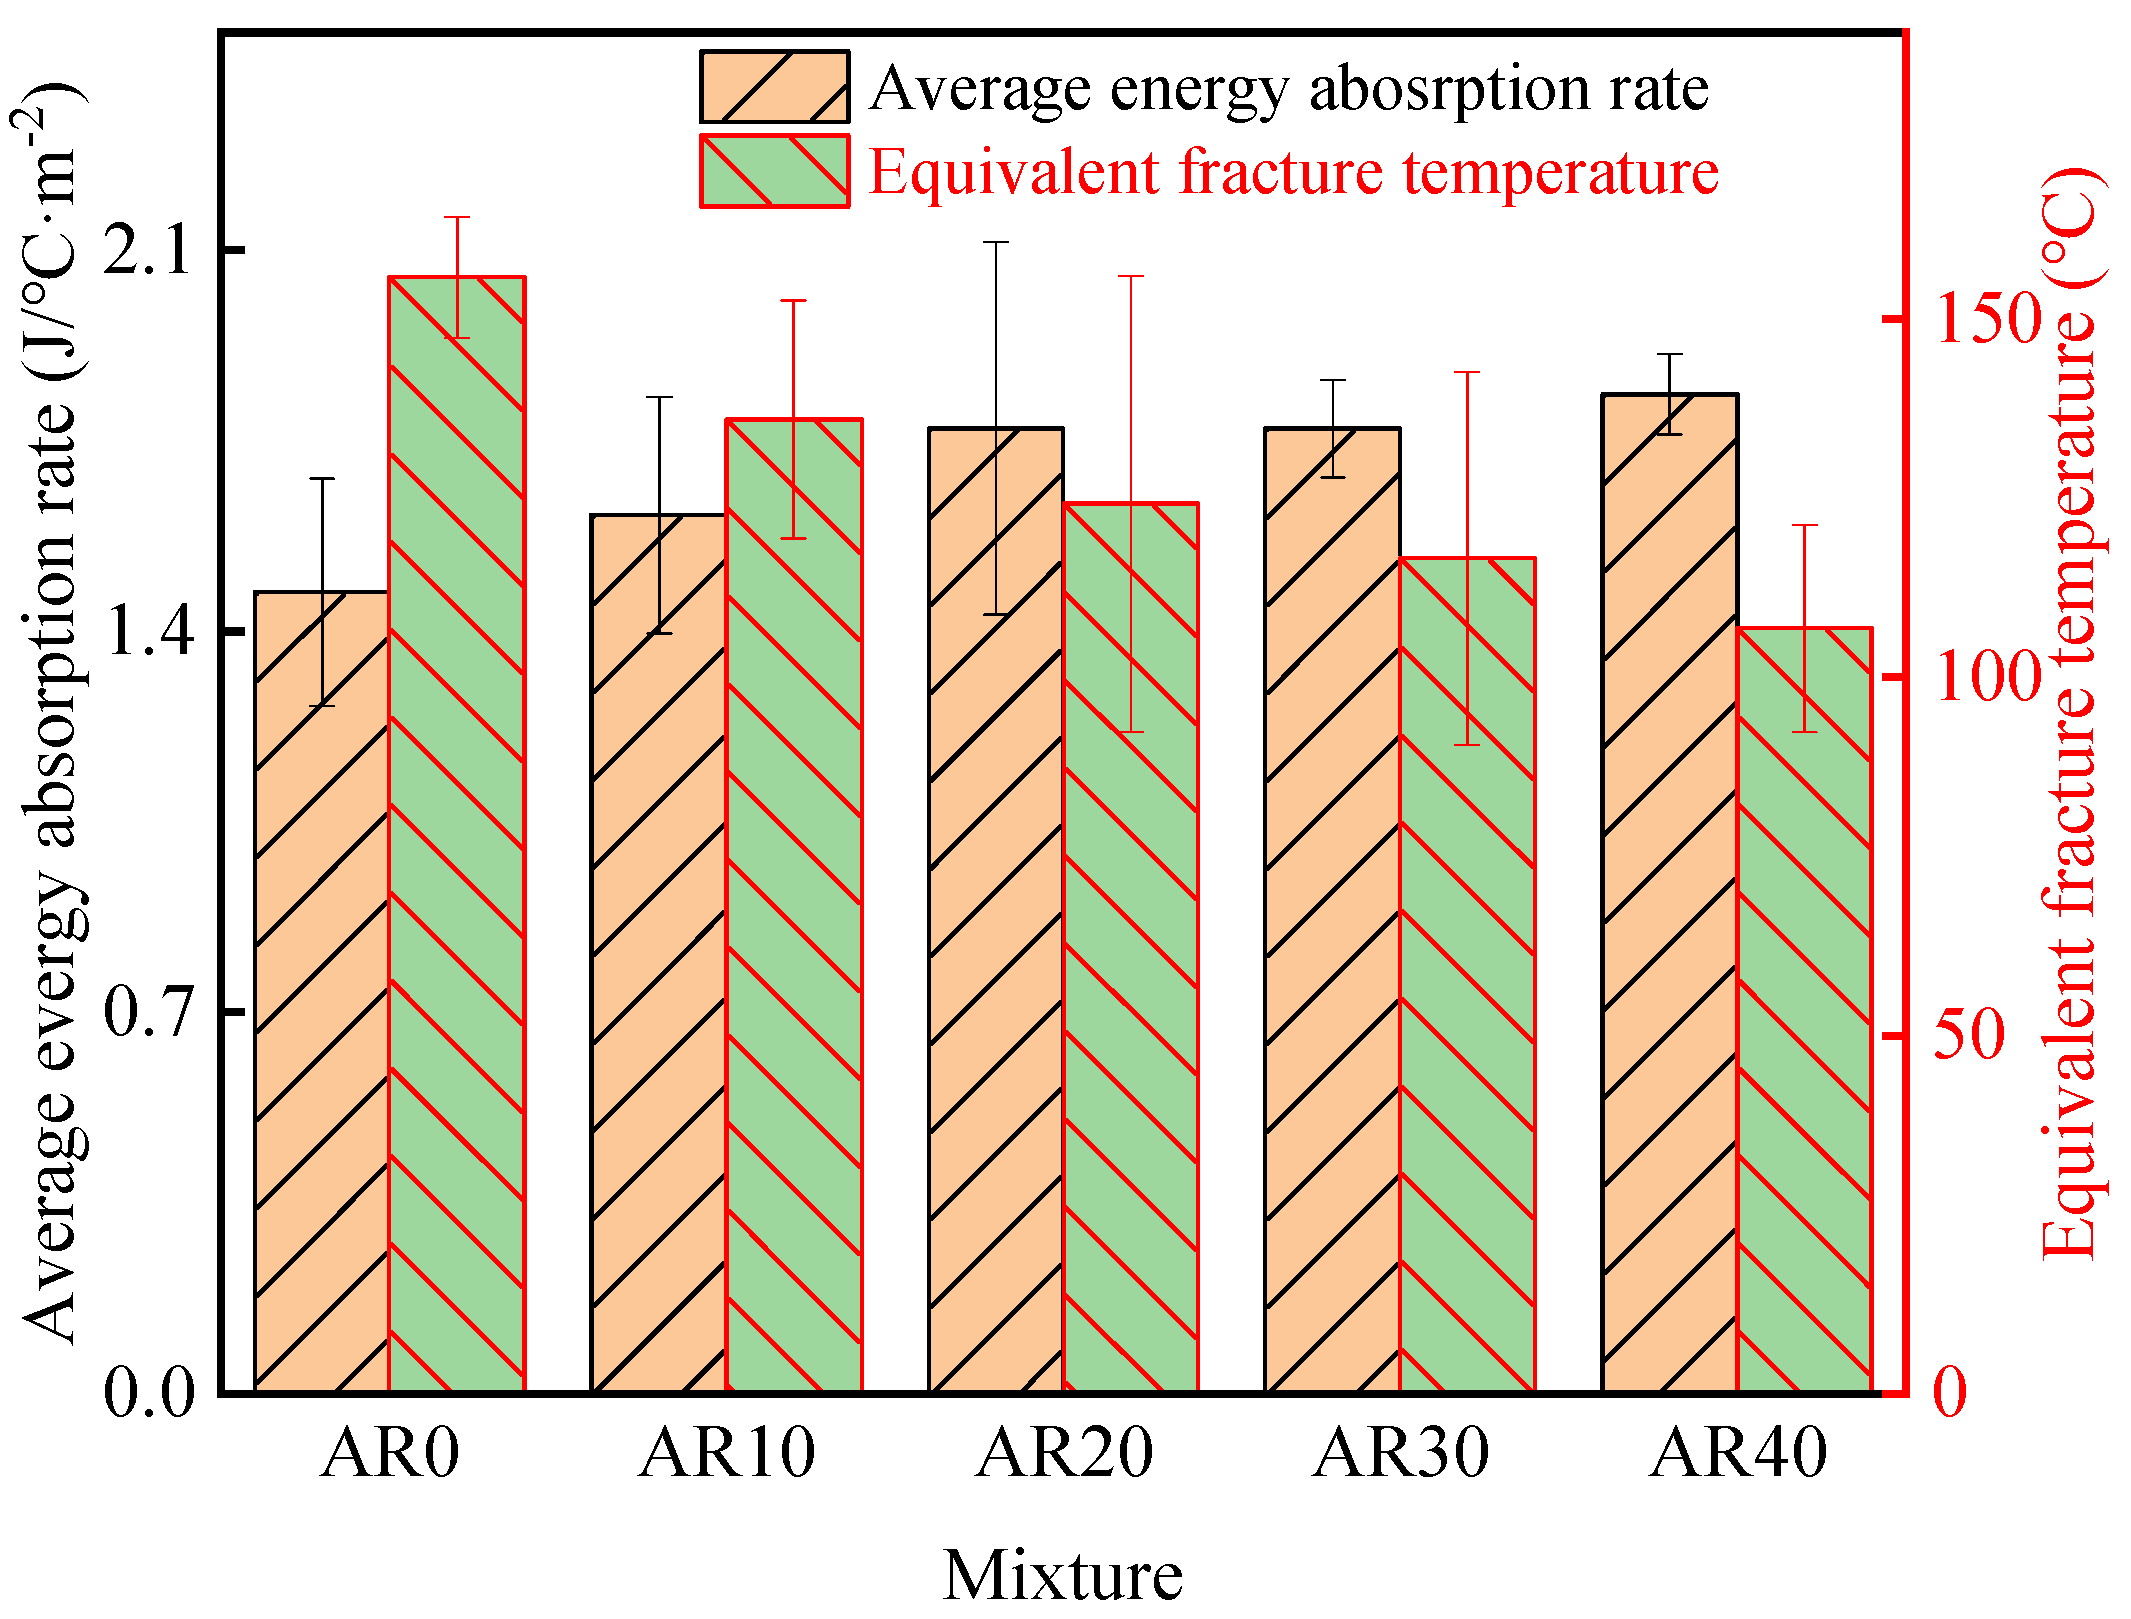
According to Equation (18) and the measured VMA, the of AR0, AR10, AR20, AR30, and AR40 were 1.84 × 10⁻⁵, 1.84 × 10⁻⁵, 1.86 × 10⁻⁵, 1.85 × 10⁻⁵, and 1.83 × 10⁻⁵, respectively. Then, based on Equations (16) and (17), the average EAA values with respect to temperature and EFT were calculated, respectively, as shown in Figure 8.
Figure 8 shows that the average EAA with respect to temperature increased with the inclusion of RAP, meaning the thermal load needed to perform more work at a unit temperature of cooling for mixtures with the inclusion of RAP. This could cause mixtures with larger RAP contents to have bigger or similar FE values than mixtures with lower RAP contents, even if their CCT values were warmer, as shown in the results in Figure 5a and the FE in Figure 7.
Since EFT represents the temperature drop that an asphalt mixture can withstand, its value is positive. The bigger the EFT, the better the LTCP of a mixture. Figure 8 shows that AR0 had the biggest EFT, followed by AR10, AR20, AR30, and AR40, demonstrating that AR0 had the best low-temperature cracking resistance, followed by AR10, AR20, AR30, and AR40, which was consistent with the evaluation results of the CCT. Figure 8 also shows that the EFT varied 49 °C from AR0 to AR40, which was a value bigger than FE and CCT, implying that EFT may be more sensitive to RAP and is better for differentiating the LTCP of mixtures with different RAP contents. Therefore, these test results verified that EAA was capable of characterizing the FE of mixtures, and the EFT determined from the 3PBB test was as accurate as the CCT determined from the TSRST test.
4.3.2. Comparison of Different Indices
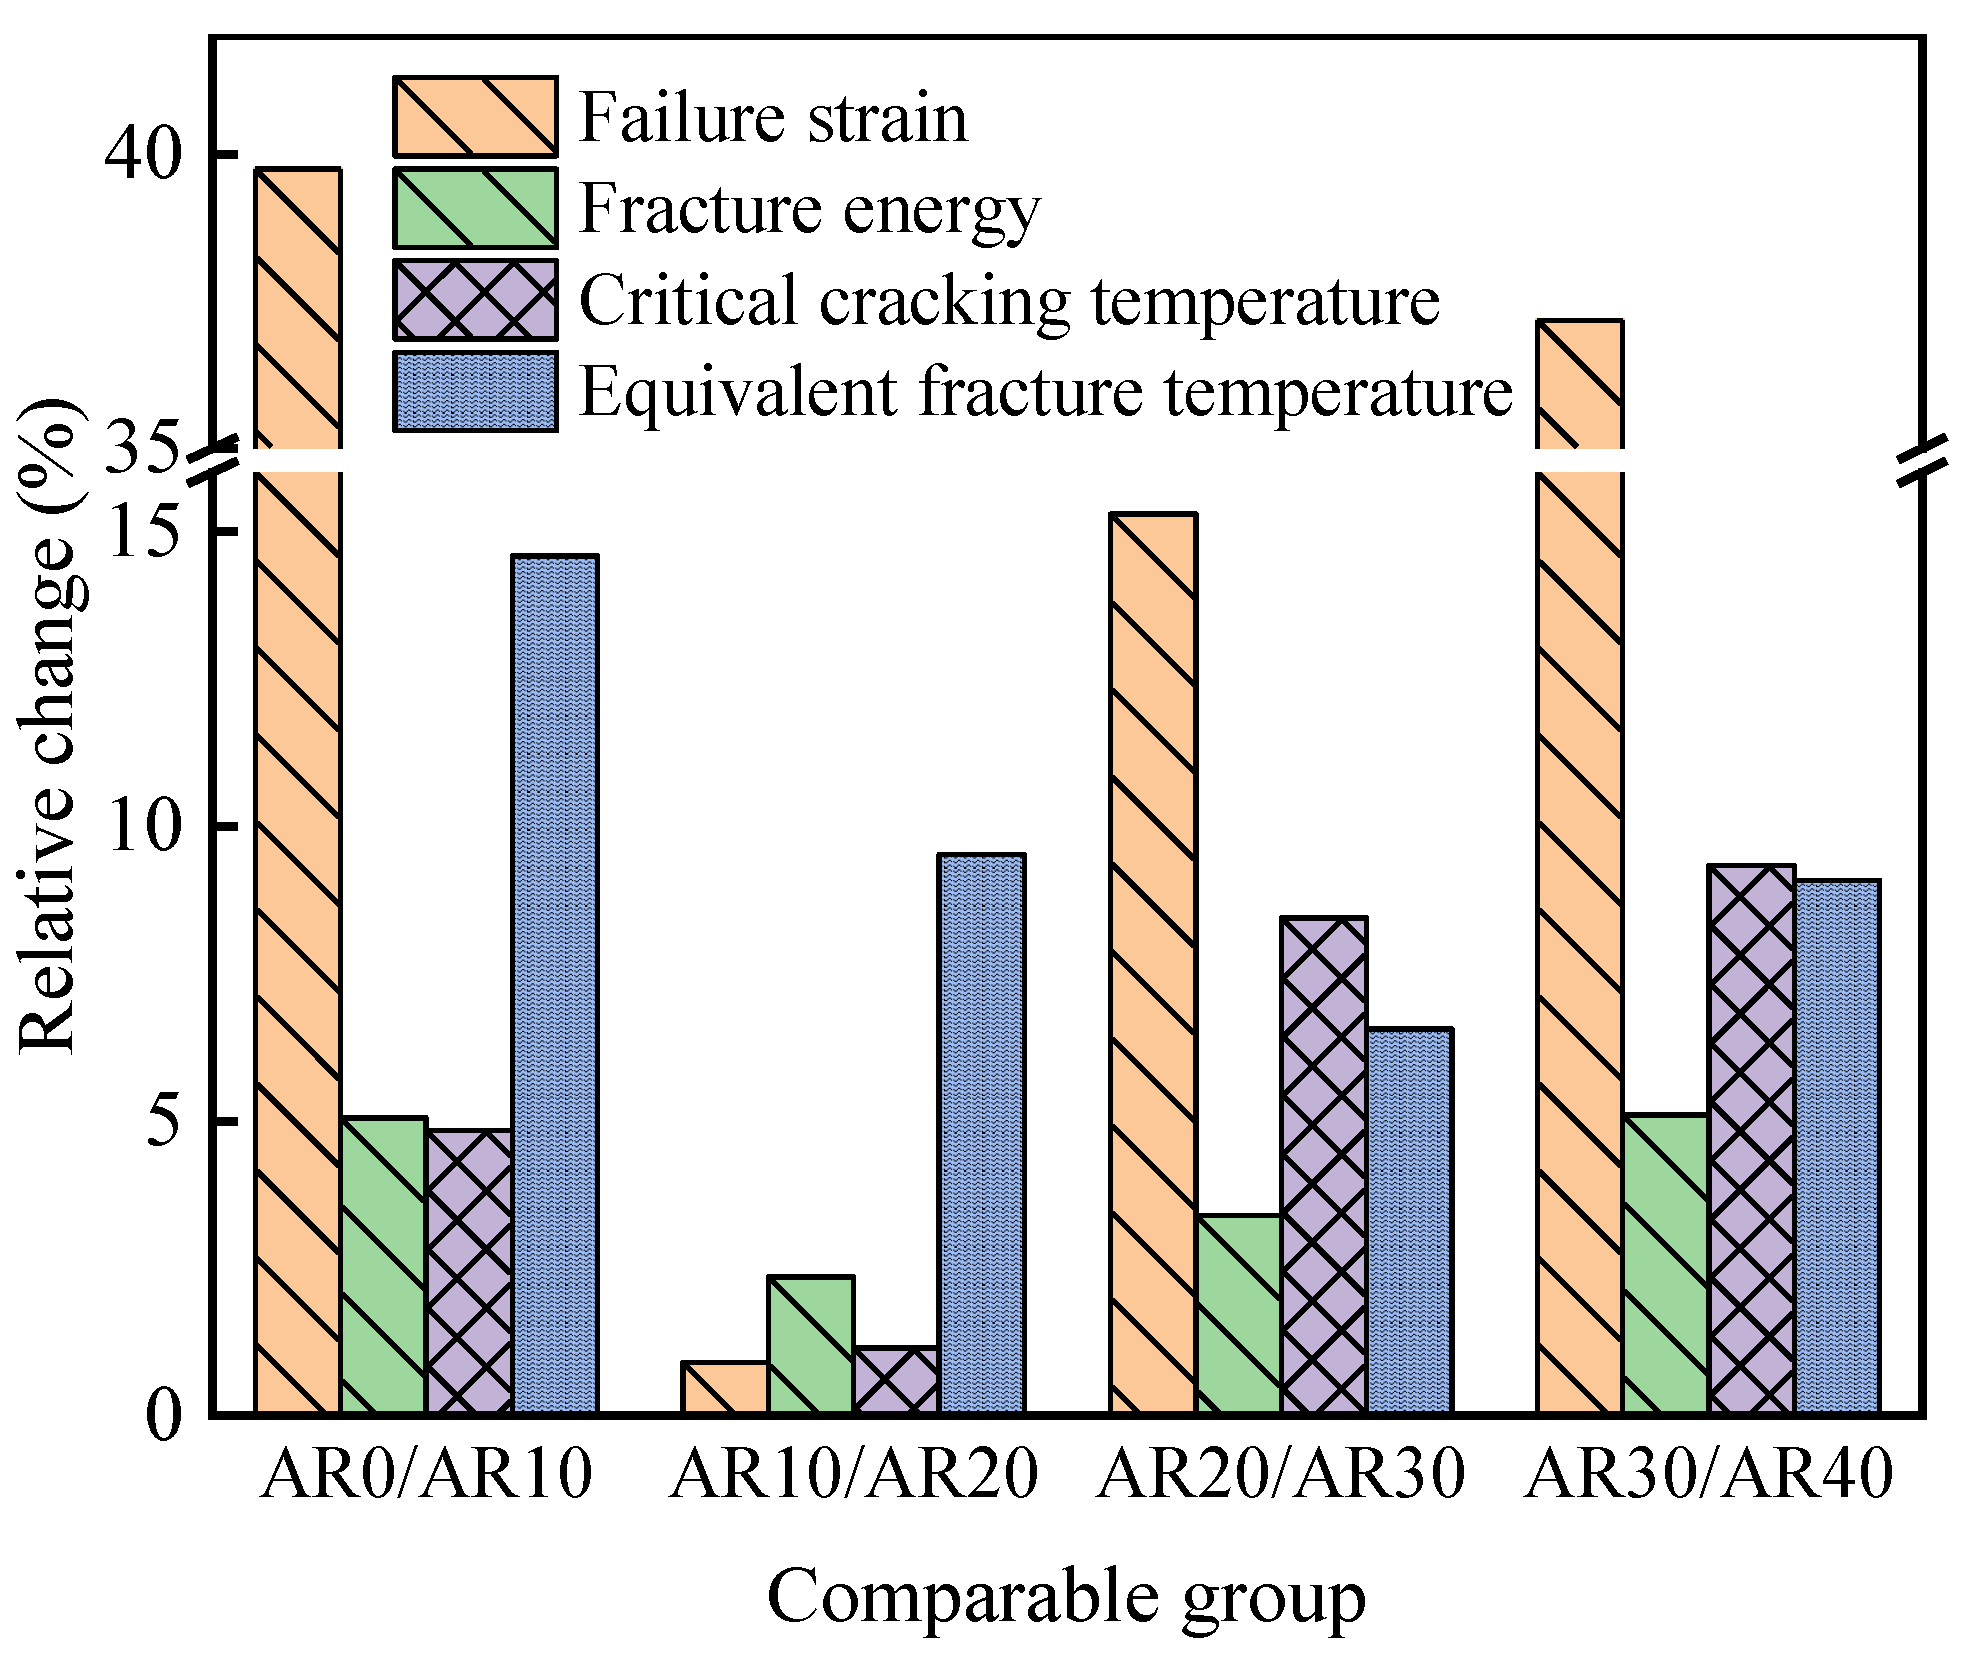
In practice, mixtures with similar LTCP values are also likely to obtain misleading evaluation results because of test error, as their values are very close. Therefore, an ideal index should not only accurately evaluate the LTCP of mixtures but should also be good at differentiating various mixtures. In the above discussion, the absolute changes in failure strain, FE, CCT, and EFT were compared, but we could not evaluate the discrimination appropriately, as different indices had various ranges, and a bigger index value may have bigger absolute change between different mixtures. Therefore, in this study, the relative change was used to investigate the ability of an index in differentiating various mixtures. The relative change (RC) was defined with Equation (19). The relative changes in failure strain, FE, CCT, and EFT between mixtures with similar LTCP values are shown in Figure 9. Note that the character string AR0/AR10 means that mixture AR0 was the comparative mixture and mixture AR10 was the reference mixture; AR10/AR20, AR20/AR30, and AR30/AR40 are analogous to this meaning.
where denotes the index value of the comparative mixture i; and denotes the index value of the reference mixture.
Figure 9 shows that the relative variation in failure strain was the biggest in most comparable groups, implying that failure strain was the best in differentiating the LTCP values of various mixtures. The relative variation in FE was almost the smallest, implying that FE was the worst in differentiating the LTCP values of various mixtures. Thus, it was possible to obtain misleading results because of the experimental error.
Figure 9 also shows that EFT had a comparative or larger relative change than CCT, illustrating that EFT not only was as accurate as CCT but was better than CCT in differentiating the LTCP values of various mixtures. When comparing EFT with FE, it shows that the relative change in EFT was always larger than that of FE, demonstrating that EFT was more sensitive to RAP content compared to FE and, thus, was more appropriate for differentiating the LTCP of recycled mixtures. When comparing EFT with failure strain, it can be found that the relative change in EFT was lower than that of failure strain, demonstrating that EFT was worse than failure strain in differentiating the LTCP of mixtures. Even so, the EFT may still be more appropriate because failure strain had greater variability than EFT when processed by different data analysts.
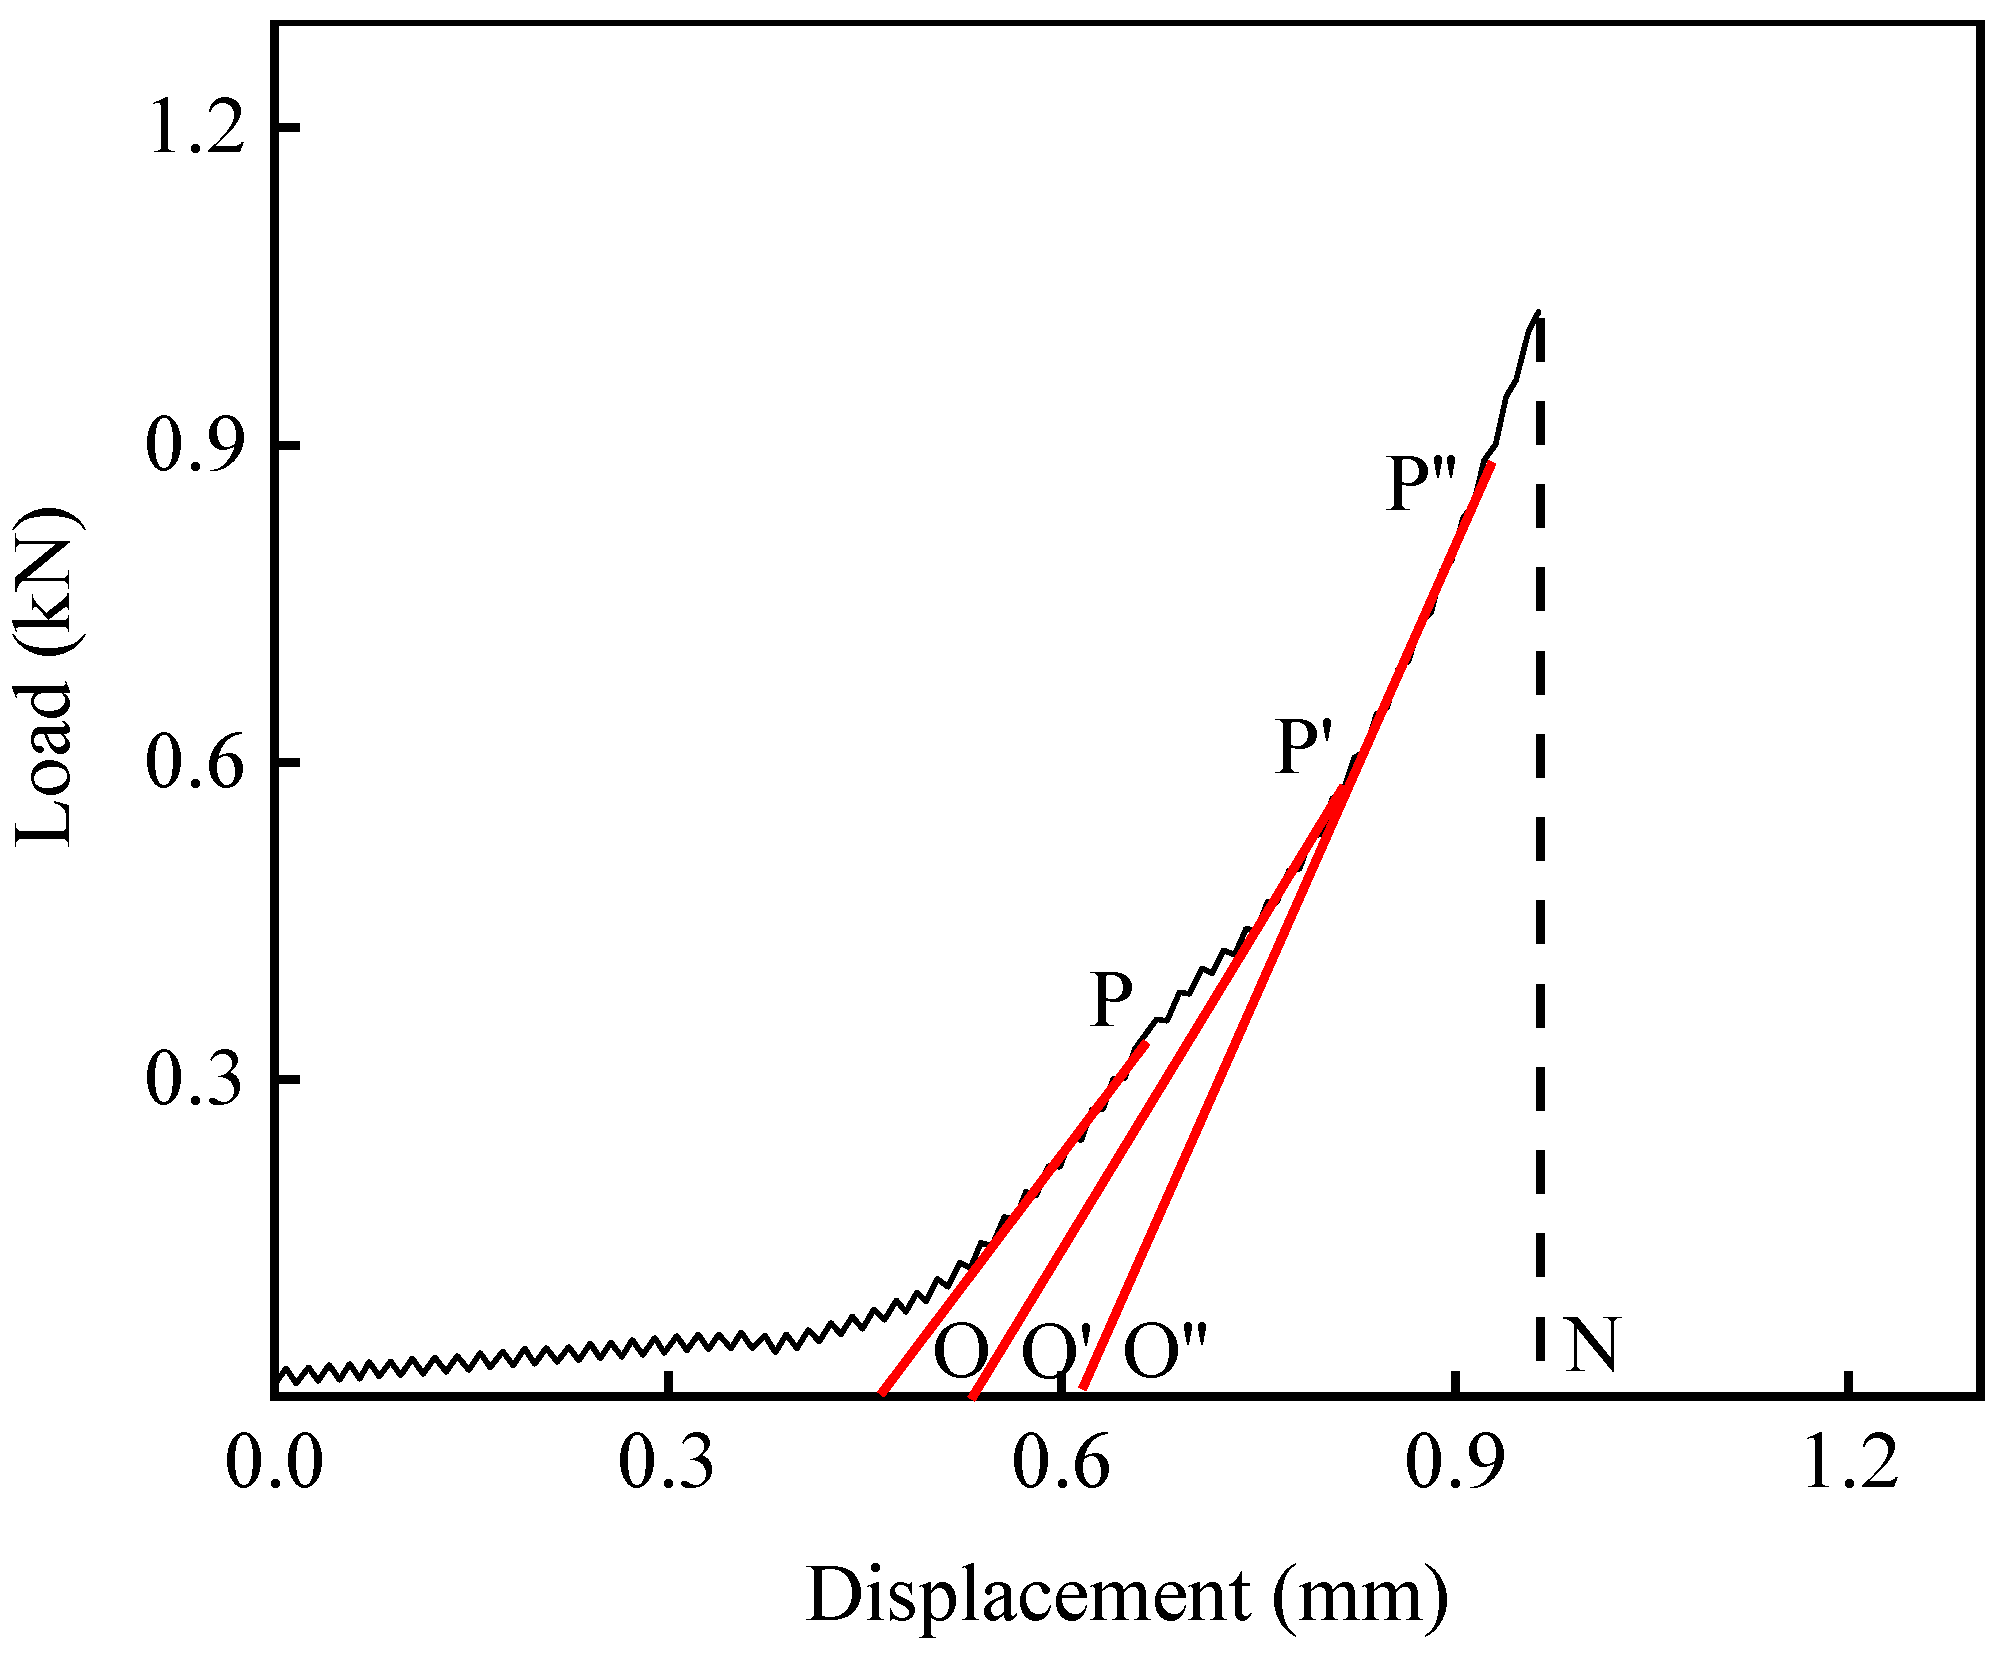
In the process of obtaining the failure strain, firstly, an asymptote of the load–displacement curve was made (the line OP shown in Figure 10) for the purpose of eliminating the compaction deformation of a mixture around the support and indenter. Then, the intersection of the asymptote and with the x-axis was obtained as point O, as shown in Figure 10. Finally, the failure strain was calculated by the distance from the intersection (point O) to the abscissa of the failure point (point n) as the line ON, which is shown in Figure 9. It was found that this data process was subjective, as different data analysts may make various asymptotes, such as the lines OP, O′P′, and O″P″ in Figure 10 show, which result in the calculated failure strain varying a lot. For example, the calculated failure strain varied from 2571 με to 1726 με from line OP to O″P″, which changed about 33% and, thus, increased the variability and uncertainty of the test results. On the contrary, the calculated EFT was more objective, as the FE divided the area under the load–displacement curve by the fracture surface area, and the fracture strength was calculated from peak load, which was more definite, and the calculated results were nearly the same from different data analysts. In addition, the relative change in EFT was big enough to differentiate the LTCP of mixtures; therefore, the EFT was more appropriate than failure strain.
5. Conclusions
Accurately evaluating the LTCP values of asphalt mixtures, especially recycled asphalt mixtures, has great significance for the paving industry in cold regions. This study focused on investigating the test methods and evaluation indices of asphalt mixtures regarding low-temperature cracking performance. The following conclusions could be obtained:
- (1)
- The EAA was capable of characterizing the FE of asphalt mixtures. FE may be not accurate in evaluating the LTCP values of mixtures, and this could be confirmed in the laboratory and field, as well as in theory.
- (2)
- An index—the EFT—was proposed based on the 3PBB test to evaluate the LTCP values of asphalt mixtures. The test results of the 3PBB test and the TSRST showed that the EFT was as accurate as the CCT of the TSRST.
- (3)
- Compared with FE and CCT, EFT had bigger absolute change and relative change between different mixtures, meaning that it was better for differentiating the LTCP values of mixtures. Compared with failure strain, EFT was more definite and less variable when processed by different data analysts, meaning that it was more objective.
In this study, only mixtures with different RAP contents were designed and tested. More mixtures, such as mixture with different types, aggregates, and volumetric characteristics, are recommended to further verify the rationality of EFT.
Author Contributions
Conceptualization, T.Y. and Y.J.; methodology, T.Y. and Y.J.; validation, T.Y.; formal analysis, T.Y. and Y.P.; investigation, T.Y.; data curation, T.Y. and Y.P.; writing—original draft preparation, T.Y. and Y.J.; writing—review and editing, T.Y. and Y.J.; supervision, Y.Z.; project administration, Y.Z.; resources, Y.Z; funding acquisition, Y.Z. All authors have read and agreed to the published version of the manuscript.
Funding
This research was funded by the Postgraduate Research and Practice Innovation Program of Jiangsu Province of China (Grant No. KYCX18_0142), the Transportation Science and Technology Project of Jilin Province of China (Grant No. 8521008388), and the National Key Research and Development Program of China (Grant No. 2021YFB2600600).
Institutional Review Board Statement
Not applicable.
Informed Consent Statement
Not applicable.
Data Availability Statement
Not applicable.
Conflicts of Interest
The authors declare no conflict of interest.
Nomenclature
| Abbreviations | Meanings |
| LTCP | low-temperature cracking performance |
| EFT | equivalent fracture temperature |
| TSRST | thermal stress restrained specimen test |
| 3PBB | three-point bending beam |
| RAP | reclaimed asphalt pavement |
| HMA | hot-mix asphalt |
| CCT | critical cracking temperature |
| SCB | semi-circular bending |
| DCT | disk-shaped compact tension |
| IDT | indirect tensile |
| EAA | energy absorption rate |
| FE | fracture energy |
| UTSST | uniaxial thermal stress and strain tester |
| 0-58-28, 40-58-28, 20-58-34, 0-52-34, 20-52-40, and 40-52-40 | the first number denotes the RAP content; the last two numbers denote the binder PG grade |
| 50/70, Sasobit, LicoBS100, RedWMX, CecaBio, and CecaLQ | the mixtures are fabricated by binder 50/70 penetration and modified with warm-mix asphalt additives of Sasobit, Licomont BS 100, Rediset WMX, Ceca Base Bio, and Ceca Base LQ, respectively |
| WI64-22C1, WI64-22F, OH64-28, OH76-22, ID64-34, ID70-28 and KS64-28 | the first two letters denote the gradation commonly used in Ohio, Wisconsin, Idaho, or Kansas; the middle two numbers denote the binder grade; for the last letter, C denotes coarse gradation, and F denote fine gradation |
| CTC | coefficient of thermal contraction |
| VMA | the volume of voids in the mineral aggregate |
| RC | relative change |
| fracture energy | |
| EAA with respect to temperature | |
| average EAA with respect to temperature | |
| temperature | |
| critical cracking temperature | |
| temperature decrease | |
| EAA with respect to strain | |
| average EAA with respect to strain | |
| strain | |
| failure strain | |
| coefficient of thermal contraction with respect to temperature | |
| average coefficient of thermal contraction with respect to temperature | |
| temperature drop that an asphalt mixture can withstand | |
| displacement | |
| load force | |
| area of fracture surface | |
| width of the specimen | |
| height of the specimen | |
| span of the specimen | |
| failure stress | |
| volume of aggregate in the asphalt mixture | |
| CTC of the asphalt binder | |
| CTC of the aggregate | |
| index value of comparative mixture i | |
| index value of the reference mixture |
References
- Hou, X.; Hettiarachchi, C.; Xiao, F.; Zhao, Z.; Xiang, Q.; Yong, D. Blending Efficiency Improvement and Energy Investigation of Recycled Asphalt Mixture Involved Warm Mix Technology. J. Clean. Prod. 2021, 279, 123732. [Google Scholar]
- Li, Q.; Meng, Y.; Li, N.; Li, G.; Wang, J. Characterization of Fatigue Performance of the Warm-Mix Recycled Asphalt Mixture Using Different Models. Fatigue Fract. Eng. Mater. Struct. 2022, 45, 770–782. [Google Scholar]
- Williams, BA.; Willis, JR.; Shacat, J. Asphalt Pavement Industry Survey On Recycled Materials and Warm-Mix Asphalt Usage: 2019; National Asphalt Pavement Association: Greenbelt, MD, USA, 2020. [Google Scholar]
- European Asphalt Pavement Association (EAPA). Asphalt in Figures 2020; EAPA: Brussels, Belgium, 2022. [Google Scholar]
- Sanchez, X.; Tighe, S.L. Steps Towards the Detection of Reclaimed Asphalt Pavement in Superpave Mixtures. Road Mater. Pavement Des. 2019, 20, 1201–1214. [Google Scholar]
- Tran, N.; Taylor, A.; Turner, P.; Holmes, C.; Porot, L. Effect of Rejuvenator On Performance Characteristics of High RAP Mixture. Road Mater. Pavement Des. 2017, 18 (Suppl. S1), 183–208. [Google Scholar]
- Li, Q.; Zeng, X.; Wang, J.; Luo, S.; Meng, Y.; Gao, L.; Wang, X. Aging Performance of High Viscosity Modified Asphalt Under Complex Heat-Light-Water Coupled Conditions. Constr. Build. Mater. 2022, 325, 126314. [Google Scholar]
- Obaid, A.; Nazzal, M.D.; Abu Qtaish, L.; Kim, S.S.; Abbas, A.; Arefin, M.; Quasem, T. Effect of RAP Source On Cracking Resistance of Asphalt Mixtures with High RAP Contents. J. Mater. Civ. Eng. 2019, 31, 4019213. [Google Scholar]
- Ghabchi, R.; Barman, M.; Singh, D.; Zaman, M.; Mubaraki, M.A. Comparison of Laboratory Performance of Asphalt Mixes Containing Different Proportions of RAS and RAP. Constr. Build. Mater. 2016, 124, 343–351. [Google Scholar]
- Zhou, J.; Li, J.; Liu, G.; Yang, T.; Zhao, Y. Recycling Aged Asphalt Using Hard Asphalt Binder for Hot-Mixing Recycled Asphalt Mixture. Appl. Sci. 2021, 11, 5698. [Google Scholar]
- Hong, F.; Chen, D.; Mikhail, M.M. Long-term Performance Evaluation of Recycled Asphalt Pavement Results from Texas: Pavement Studies Category 5 Sections from The Long-Term Pavement Performance Program. Transp. Res. Rec. J. Transp. Res. Board 2010, 2180, 58–66. [Google Scholar]
- West, R.; Michael, J.; Turochy, R.; Maghsoodloo, S. Use of Data from Specific Pavement Studies Experiment 5 in The Long-Term Pavement Performance Program to Compare Virgin and Recycled Asphalt Pavements. Transp. Res. Rec. J. Transp. Res. Board 2011, 2208, 82–89. [Google Scholar]
- West, R.C.; Willis, J.R.; Marasteanu, M.O. Improved Mix Design, Evaluation, And Materials Management Practices for Hot Mix Asphalt with High Reclaimed Asphalt Pavement Content; Transportation Research Board: Washington, DC, USA, 2013; Volume 752, p. 1. [Google Scholar]
- Monismith, C.L.; Secor, G.A.; Secor, K.E. Temperature Induced Stresses and Deformations in Asphalt Concrete. J. Assoc. Asph. Paving Technol. 1965, 34, 248–285. [Google Scholar]
- Tan, Y.; Sun, Z.; Gong, X.; Xu, H.; Zhang, L.; Bi, Y. Design Parameter of Low-Temperature Performance for Asphalt Mixtures in Cold Regions. Constr. Build. Mater. 2017, 155, 1179–1187. [Google Scholar]
- Das, P.K.; Tasdemir, Y.; Birgisson, B. Low Temperature Cracking Performance of WMA with the Use of the Superpave Indirect Tensile Test. Constr. Build. Mater. 2012, 30, 643–649. [Google Scholar]
- Jia, Y.; Yang, Y.; Liu, G.; Gao, Y.; Yang, T.; Hu, D. Reliability Assessment of Flexural Fatigue Failure of Asphalt Mixture: A New Perspective. Constr. Build. Mater. 2020, 257, 119553. [Google Scholar]
- Stock, A.F.; Arand, W. Low Temperature Cracking in Polymer Modified Binders. J. Assoc. Asph. Paving Technol. 1993, 62, 23–53. [Google Scholar]
- Vinson, T.S.; Kanerva, H.K.; Zeng, H. Low Temperature Cracking: Field Validation of the Thermal Stress Restrained Specimen Test (TSRST); SHRP-A-401; Strategic Highway Research Program: Washington, DC, USA, 1994. [Google Scholar]
- Sebaaly, P.E.; Lake, A.; Epps, J. Evaluation of Low-Temperature Properties of HMA Mixtures. J. Transp. Eng. 2002, 128, 578–586. [Google Scholar]
- Velásquez, R.A.; Labuz, J.F.; Marasteanu, M.O.; Zofka, A.M. Revising Thermal Stresses in the TSRST for Low-Temperature Cracking Prediction. J. Mater. Civ. Eng. 2009, 21, 680–687. [Google Scholar]
- AASTHO TP10; Standard Test Method for Thermal Stress Restrained Specimen Tensile Strength (TSRST). American Association of State Highway and Transportation Officials: Washington, DC, USA, 2012.
- Zubeck, H.K.; Zeng, H.; Vinson, T.S.; Janoo, V.C. Field Validation of Thermal Stress Restrained Specimen Test: Six Case Histories. Transp. Res. Rec. J. Transp. Res. Board 1996, 1545, 67–74. [Google Scholar]
- Tan, Y.; Zhang, L.; Jiang, L. Analysis of the Evaluation Indices from TSRST. J. Mater. Civ. Eng. 2012, 24, 1310–1316. [Google Scholar]
- Tapsoba, N.; Baaj, H.; Sauzéat, C.; Di Benedetto, H.; Ech, M. 3D Analysis and Modelling of Thermal Stress Restrained Specimen Test (TSRST) on asphalt mixes with RAP and roofing shingles. Constr. Build. Mater. 2016, 120, 393–402. [Google Scholar]
- Tan, Y.; Zhang, L.; Xu, H. Evaluation of Low-temperature Performance of Asphalt Paving Mixtures. Cold Reg. Sci. Technol. 2012, 70, 107–112. [Google Scholar]
- Zaumanis, M.; Poulikakos, L.D.; Partl, M.N. Performance-Based Design of Asphalt Mixtures and Review of Key Parameters. Mater. Des. 2018, 141, 185–201. [Google Scholar]
- Das, P.K.; Jelagin, D.; Birgisson, B. Evaluation of the Low Temperature Cracking Performance of Asphalt Mixtures Utilizing HMA Fracture Mechanics. Constr. Build. Mater. 2013, 47, 594–600. [Google Scholar]
- Baumanis, J.; Riekstins, A.; Balodis, A. Investigation of Comparability of TSRST and SCB Cracking Tests for Evaluation of Low-Temperature Properties in Asphalt Mixtures and Use in Quality Control. In IOP Conference Series: Materials Science and Engineering, Proceedings of the 30th International Baltic Road Conference, Riga, Latvia, 23–24 August 2021; IOP Publishing: Bristol, UK, 2021; p. 012022. [Google Scholar]
- Pszczola, M.; Szydlowski, C.; Jaczewski, M. Influence of Cooling Rate and Additives On Low-Temperature Properties of Asphalt Mixtures in the TSRST. Constr. Build. Mater. 2019, 204, 399–409. [Google Scholar]
- Zaumanis, M.; Valters, A. Comparison of Two Low-Temperature Cracking Tests for Use in Performance-Based Asphalt Mixture Design. Int. J. Pavement Eng. 2020, 21, 1461–1469. [Google Scholar]
- Al-Qudsi, A.; Cannone Falchetto, A.; Wang, D.; Büchler, S.; Kim, Y.S.; Wistuba, M.P. Finite Element Cohesive Fracture Modeling of Asphalt Mixture Based On the Semi-Circular Bending (SCB) Test and Self-Affine Fractal Cracks at Low Temperatures. Cold Reg. Sci. Technol. 2020, 169, 102916. [Google Scholar]
- Wagoner, M.P.; Buttlar, W.G.; Paulino, G.H.; Blankenship, P. Investigation of the Fracture Resistance of Hot-Mix Asphalt Concrete Using a Disk-Shaped Compact Tension Test. Transp. Res. Rec. J. Transp. Res. Board 2005, 1929, 183–192. [Google Scholar]
- Radeef, H.R.; Hassan, N.A.; Abidin, A.R.Z.; Mahmud, M.Z.H.; Mohd Satar, M.K.I.; Mohd Warid, M.N.; Al Saffar, Z.H. Determining Fracture Energy in Asphalt Mixture: A Review. In IOP Conference Series: Earth and Environmental Science, Proceedings of the 4th National Conference on Wind & Earthquake Engineering, Putrajaya, Malaysia, 16–17 October 2020; IOP Publishing: Bristol, UK, 2021; Volume 682, p. 012069. [Google Scholar]
- Yan, K.; Li, Y.; Long, Z.; You, L.; Wang, M.; Zhang, M.; Diab, A. Mechanical Behaviors of Asphalt Mixtures Modified with European Rock Bitumen and Waste Cooking Oil. Constr. Build. Mater. 2022, 319, 125909. [Google Scholar]
- Mandal, T.; Hanz, A.J.; Bahia, H.U. Challenges in Using the Disc-Shaped Compact Tension (DCT) Test to Determine Role of Asphalt Mix Design Variables in Cracking Resistance at Low Temperatures. Int. J. Pavement Eng. 2019, 20, 1275–1284. [Google Scholar]
- GB/T 38948-2020; Evaluation Method for The Cracking Resistance of Asphalt Mixture at Low Temperature. Standards Press of China: Beijing, China, 2020.
- Marasteanu, M.; Buttlar, W.; Bahia, H.; Williams, C.; Moon, K.H.; Teshale, E.Z.; Falchetto, A.C.; Turos, M.; Dave, E.; Paulino, G.; et al. Investigation of Low Temperature Cracking in Asphalt Pavements National Pooled Fund Study—Phase II; Minnesota Department of Transportation: Saint Paul, MN, USA, 2012; pp. 126–128. [Google Scholar]
- Buttlar, W.; Rath, P.; Dave, E.V.; Wang, H. Relationship Between Laboratory Cracking Tests and Field Performance of Asphalt Mixtures (TRR E-Circular Number E-C251); Transportation Research Board: Washington, DC, USA, 2019; pp. 51–71. [Google Scholar]
- Dave, E.V.; Hoplin, C. Flexible Pavement Thermal Cracking Performance Sensitivity to Fracture Energy Variation of Asphalt Mixtures. Road Mater. Pavement Des. 2015, 16 (Suppl. S1), 423–441. [Google Scholar]
- Son, S.; Said, I.M.; Al-Qadi, I.L. Fracture Properties of Asphalt Concrete Under Various Displacement Conditions and Temperatures. Constr. Build. Mater. 2019, 222, 332–341. [Google Scholar]
- Yang, T.; Chen, S.; Pan, Y.; Zhao, Y. Investigation of the Accuracy of Fracture Energy in Evaluating the Low-Temperature Cracking Performance of Asphalt Mixture. J. Mater. Civ. Eng. 2022, 34, 04022201. [Google Scholar]
- Hillerborg, A. The Theoretical Basis of a Method to Determine the Fracture Energy Gf of Concrete. Mater. Struct. 1985, 18, 291–296. [Google Scholar]
- Khalilpour, S.; BaniAsad, E.; Dehestani, M. A Review On Concrete Fracture Energy and Effective Parameters. Cem. Concr. Res. 2019, 120, 294–321. [Google Scholar]
- Bažant, Z.P. Analysis of Work-Of-Fracture Method for Measuring Fracture Energy of Concrete. J. Eng. Mech. 1996, 122, 138–144. [Google Scholar]
- Bažant, Z.P. Size Effect in Blunt Fracture: Concrete, Rock, Metal. J. Eng. Mech. 1984, 110, 518–535. [Google Scholar]
- Hu, X.; Wittmann, F. Size Effect On Toughness Induced by Crack Close to Free Surface. Eng. Fract. Mech. 2000, 65, 209–221. [Google Scholar]
- JTG E20; Standard Test Methods of Bitumen and Bituminous Mixtures for Highway Engineering. China Communication Press: Beijing, China, 2011.
- Zhao, Y.; Jiang, J.; Zhou, L.; Dai, Y.; Ni, F. Meso-structure Image Pre-Selection Method for Two-Dimensional Finite Element Modeling in Beam Bending Simulation of Asphalt Mixture. Constr. Build. Mater. 2021, 268, 121129. [Google Scholar]
- Sanchez, X.; Ambaiowei, D.C.; Tighe, S.L. Low Temperature Performance of Superpave Recycled Hot Mixtures in Ontario. In Proceedings of the Airfield and Highway Pavements 2015, Miami, FL, USA, 4–10 June 2015; Harvey, J., Chou, K.F., Eds.; American Society of Civil Engineers: Reston, VA, USA, 2015. [Google Scholar]
- Stienss, M.; Szydlowski, C. Influence of Selected Warm Mix Asphalt Additives on Cracking Susceptibility of Asphalt Mixtures. Materials 2020, 13, 202. [Google Scholar]
- Mandal, T.; Bahia, H.U. Measuring Cracking Propagation of Asphalt Mixtures Using Notched Samples in the TSRST. In Proceedings of the 62nd Annual Canadian Technical Asphalt Association Conference, Halifax, NS, Canada, 16 November 2017; Canadian Technical Asphalt Association: West Kelowna, BC, Canada, 2017. [Google Scholar]
- Nam, K.; Bahia, H.U. Effect of Binder and Mixture Variables On Glass Transition Behavior of Asphalt Mixtures. J. Assoc. Asph. Paving Technol. 2004, 73, 89–120. [Google Scholar]
- Alavi, M.; Hajj, E.Y.; Sebaaly, P.E. A Comprehensive Model for Predicting Thermal Cracking Events in Asphalt Pavements. Int. J. Pavement Eng. 2017, 18, 871–885. [Google Scholar]
- Velasquez, R.; Turos, M.; Moon, K.H.; Zanko, L.; Marasteanu, M. Using Recycled Taconite as Alternative Aggregate in Asphalt Pavements. Constr. Build. Mater. 2009, 23, 3070–3078. [Google Scholar]
- Isacsson, U.; Zeng, H. Low-temperature Cracking of Polymer-Modified Asphalt. Mater. Struct. 1998, 31, 58–63. [Google Scholar]
- Mensching, D.J.; Daniel, J.S.; Bennert, T.; Medeiros, M.S.; Elwardany, M.D.; Mogawer, W.; Hajj, E.Y.; Alavi, M.Z. Low-temperature Properties of Plant-produced RAP Mixtures in the Northeast. Road Mater. Pavement Des. 2014, 15, 1–27. [Google Scholar]
- Cooper, S.B.; Mohammad, L.; Elseifi, M.A. Laboratory Performance of Asphalt Mixtures Containing Recycled Asphalt Shingles, Reclaimed Asphalt Pavement, and Recycling Agents. J. Mater. Civ. Eng. 2017, 29, D4016001. [Google Scholar]
- Hettiarachchi, C.; Hou, X.; Xiang, Q.; Yong, D.; Xiao, F. A Blending Efficiency Model for Virgin and Aged Binders in Recycled Asphalt Mixtures Based on Blending Temperature and Duration. Resour. Conserv. Recycl. 2020, 161, 104957. [Google Scholar]
- Wang, D.; Cannone Falchetto, A.; Riccardi, C.; Westerhoff, J.; Wistuba, M.P. Investigation On the Effect of Physical Hardening and Aging Temperature On Low-Temperature Rheological Properties of Asphalt Binder. Road Mater. Pavement Des. 2021, 22, 1117–1139. [Google Scholar]
- Al-Qadi, I.L.; Ozer, H.; Lambros, J.; El Khatib, A.; Singhvi, P.; Khan, T.; Rivera-Perez, J.; Doll, B. Testing Protocols to Ensure Performance of High. Asphalt Binder Replacement Mixes Using RAP and RAS; Report No. FHWA-ICT-15-017; Illinois Center for Transportation: Rantoul, IL, USA, 2015. [Google Scholar]
Figure 1.
The framework of this study.

Figure 2.
Schematic of FE and CCT.

Figure 3.
Schematic of FE and failure strain.

Figure 4.
Gradation of designed mixtures.

Figure 5.
FE and CCT values of different mixtures: (a) mixtures with different binder grades and RAP contents derived from Sanchez et al. [5,50]; (b) mixtures with different additives derived from Stienss et al. [51]; (c) mixtures with different gradations derived from Mandal et al. [52].

Figure 6.
CCT and transition temperatures of various mixtures.

Figure 7.
Failure strain and FE of various mixtures.

Figure 8.
EAA and EFT of various mixtures.

Figure 9.
Relative change in different indices.

Figure 10.
Load displacement curve of mixture.


Table 1.
The properties of asphalt binder.
| Penetration (25 °C, 100 g, 5 s, 0.1 mm) | Ductility (15 °C, 5 cm/min, cm) | Softening Point TR and B (°C) | |
|---|---|---|---|
| Virgin asphalt | 63 | >100 | 48 |
| Reclaimed asphalt | 34 | brittle failure | 64 |
Table 2.
The gradation of RAPs after extraction.
| Size (mm) | 26.5 | 19 | 16 | 13.2 | 9.5 | 4.75 | 2.36 | 1.18 | 0.6 | 0.3 | 0.15 | 0.075 | |
|---|---|---|---|---|---|---|---|---|---|---|---|---|---|
| Passing (%) | R1# | 100.0 | 94.5 | 87.8 | 75.9 | 59.1 | 33.0 | 20.8 | 15.5 | 12.0 | 9.7 | 8.1 | 6.6 |
| R2# | 100.0 | 100.0 | 98.8 | 94.4 | 76.4 | 33.0 | 21.2 | 17.0 | 13.5 | 10.2 | 8.2 | 6.1 | |
| R3# | 100.0 | 100.0 | 100.0 | 100.0 | 100.0 | 100.0 | 71.2 | 50.6 | 36.2 | 25.1 | 19.5 | 14.5 | |
Table 3.
Asphalt–aggregate ratios of RAPs.
| Fractions | Asphalt–Aggregate Ratio (%) |
|---|---|
| R1# | 2.97 |
| R2# | 3.46 |
| R3# | 6.39 |
Table 4.
Statistical results of CCT between asphalt mixtures.
| Mixture | Sample Size | Mean | SD | t-Value | p |
|---|---|---|---|---|---|
| 20-58-34 | 3 | −33.6 | 0.8 | −2.533 | 0.064 ** |
| 40-58-28 | 3 | −29.2 | 2.9 | ||
| 20-58-34 | 3 | −33.6 | 0.8 | 5.463 | 0.005 * |
| 0-58-28 | 3 | −30.1 | 0.5 | ||
| 40-52-40 | 3 | −32.6 | 0.8 | −4.59 | 0.01 * |
| 0-58-28 | 3 | −30.1 | 0.5 | ||
| CecaRT | 3 | −26.0 | 1.2 | 3.884 | 0.018 * |
| Sasobit | 3 | −23.3 | 0.1 |
* indicates significant with a confidence level of 95%; ** indicates significant with a confidence level of 90%.
Publisher’s Note: MDPI stays neutral with regard to jurisdictional claims in published maps and institutional affiliations. |
© 2022 by the authors. Licensee MDPI, Basel, Switzerland. This article is an open access article distributed under the terms and conditions of the Creative Commons Attribution (CC BY) license (https://creativecommons.org/licenses/by/4.0/).
Share and Cite
MDPI and ACS Style
Yang, T.; Jia, Y.; Pan, Y.; Zhao, Y. Evaluation of the Low-Temperature Cracking Performance of Recycled Asphalt Mixture: A Development of Equivalent Fracture Temperature. Buildings 2022, 12, 1366. https://doi.org/10.3390/buildings12091366
AMA Style
Yang T, Jia Y, Pan Y, Zhao Y. Evaluation of the Low-Temperature Cracking Performance of Recycled Asphalt Mixture: A Development of Equivalent Fracture Temperature. Buildings. 2022; 12(9):1366. https://doi.org/10.3390/buildings12091366
Chicago/Turabian StyleYang, Tao, Yanshun Jia, Yuanyuan Pan, and Yongli Zhao. 2022. "Evaluation of the Low-Temperature Cracking Performance of Recycled Asphalt Mixture: A Development of Equivalent Fracture Temperature" Buildings 12, no. 9: 1366. https://doi.org/10.3390/buildings12091366
Note that from the first issue of 2016, this journal uses article numbers instead of page numbers. See further details here.