
Effect of Filling Phosphogypsum on the Axial Compression Behavior of Cold-Formed Thin-Walled Steel Walls

1
College of Architecture and Urban Planning, Guizhou University, Guiyang 550025, China
2
Intelligent and Green Mountain Residence Engineering Research Center of Guizhou Province, Guiyang 550018, China
*
Author to whom correspondence should be addressed.
Buildings 2022, 12(9), 1325; https://doi.org/10.3390/buildings12091325
Submission received: 20 July 2022
/
Revised: 20 August 2022
/
Accepted: 25 August 2022
/
Published: 29 August 2022
(This article belongs to the Section Building Structures)
Abstract
:Highlights
What are the main findings?
- The effect of filling phosphogypsum on the axial compression behavior of CFS walls.
- The axial compression performance of CFS walls with different cross-sections.
- The failure mechanism of CFS walls filled with phosphogypsum under axial compression.
What is the implication of the main finding?
- Filling phosphogypsum can effectively improve the axial compression behavior of CFS walls.
- The bearing capacity of the wall filled with phosphogypsum in and between the studs was significantly increased.
- The components affecting the bearing capacity of the wall are steel tubes, phosphogypsum, and wall sheathings.
Abstract
To study the effect of filling phosphogypsum (PG) on the axial compression behavior of cold-formed thin-walled steel (CFS) walls, four full-scale test specimens were designed and fabricated, in consideration of the filling regions of PG as well as measures with or without wall sheathings. The fabricated specimens were tested under monotonic vertical loads, and the failure processes and failure modes of specimens were elaborated. Each specimen’s axial load-displacement curve, bearing capacity, strain curve, and energy dissipation capacity were investigated in detail. Furthermore, the internal force distributions of wall components and failure mechanisms were revealed. The test results indicated that the failure characteristics of specimens include the buckling of the steel tubes, cracking of wall sheathings, crushing of PG, and distorting of tracks. Compared with the cavity wall specimen, the axial bearing capacity of the specimen filled with PG in the studs only increased by 37.4%, and the bearing capacity of the specimen filled with PG in and between the studs increased by 115.7%. This indicates that filling PG can effectively improve the axial bearing capacity of CFS walls. The bearing capacity of the specimen without wall sheathings is lower than that of the specimen with wall sheathings, indicating that the wall sheathing has a beneficial effect on the bearing capacity of the specimen. In addition, the internal forces of components during the loading process were analyzed. It found that the steel tube and PG made a great contribution to the bearing capacity of the wall. Specifically, the steel tube played a leading role in the early loading stage, while the PG played a leading role in the later loading stage.
1. Introduction
Cold-formed steel (CFS) structures have the advantages of low cost, lightweight, rapid installation, and high industrialization. In the past few decades, CFS structures have been widely applied in low-rise buildings, especially in North America, Europe, Australia, Japan, China, and other countries and regions [1,2]. In CFS structures, the CFS shear wall plays an important role in suffering loads, including vertical loads and horizontal loads. However, due to the poor compressive performance of C-shaped studs under vertical loads, the axial bearing capacity of the entire wall is insufficient. In addition, the construction industry is preparing to apply CFS structures to medium and high-rise buildings. Based on the above analysis, it can be seen that the CFS wall needs to have a higher bearing capacity.
To improve the axial compression performance of the CFS shear wall, many researchers have conducted a great deal of studies on the axial compression of CFS walls. Miller and Pekoz [3,4] conducted axial compression tests on CFS walls, and the measures of steel plates and channel steels were studied. The test results showed that both measures are effective for improving the bearing capacity of the CFS wall. Telue, Mahendran [5,6] and Tian [7,8,9] carried out a battery of full-scale tests on CFS walls under axial loading. The influence of walls with or without sheathings, the sheathing types, and sheathing layers on the axial compression bearing capacity was investigated in detail. The shear walls without sheathings showed bending or bending-torsional buckling failure, and the bearing capacity is relatively low. The ultimate bearing capacity of the wall covered with OSB is 20% higher than that of the wall covered with CPB and 70% higher than that of the wall covered with CSB. The ultimate bearing capacity of the wall with double-sided sheathings is higher than that of the wall with single-sided sheathing. Khan [10], Lawson [11], Hou [12] and Zhang [13] conducted axial compression tests on composite walls composed of multiple steel tubular studs. The results showed that continuous supports with multiple tubular studs improved the lateral and axial stabilization by increasing the in-plane and out-of-plane rigidities. Moreover, this measure also overcomes the problems of easy buckling and insufficient stability of traditional C-shaped studs.
In recent years, to further improve the bearing capacity of the wall, researchers have proposed to add infill materials to the CFS walls. The filling materials mainly included lightweight concrete [14,15,16], desulfurization gypsum [17,18], lightweight mortar [19], lightweight foamed concrete (LFC) [20] and so on. The results showed that the filling materials can improve the stability and stiffness of the wall, restrain premature buckling of studs, and increase the axial load-bearing capacity of the structure.
In conclusion, the filling material is an effective measure that can significantly improve the axial compression performance of the wall. PG is an industrial by-product that is generated by the phosphorus fertilizer industry, and the low utilization of PG has become a growing problem for many countries [21,22]. To further improve the mechanical performance of CFS walls and promote the utilization of PG, a new type of CFS composite wall filled with PG was proposed in this study, and square steel tubes were adopted as the wall studs. The main advantages of the proposed wall are as follows: (1) The bearing capacity of the proposed wall will be further improved due to the load-bearing contribution of the infill PG. (2) The buckling behavior of thin-walled steel tube studs will be significantly improved due to the filling effect of PG. (3) The thermal insulation performance, sound insulation performance, and fire prevention performance of the wall will be greatly improved due to the physical properties of PG.
In this study, four full-scale wall specimens were fabricated and tested under monotonic vertical loads, and the failure processes and failure modes of specimens were elaborated. Each specimen’s axial load-displacement curve, strain curve, bearing capacity, and energy dissipation capacity were analyzed in detail. Furthermore, the internal force distributions of wall components and failure mechanisms were revealed. The research results can contribute to academic studies and engineering applications.
2. Test Program
2.1. Description of Specimens
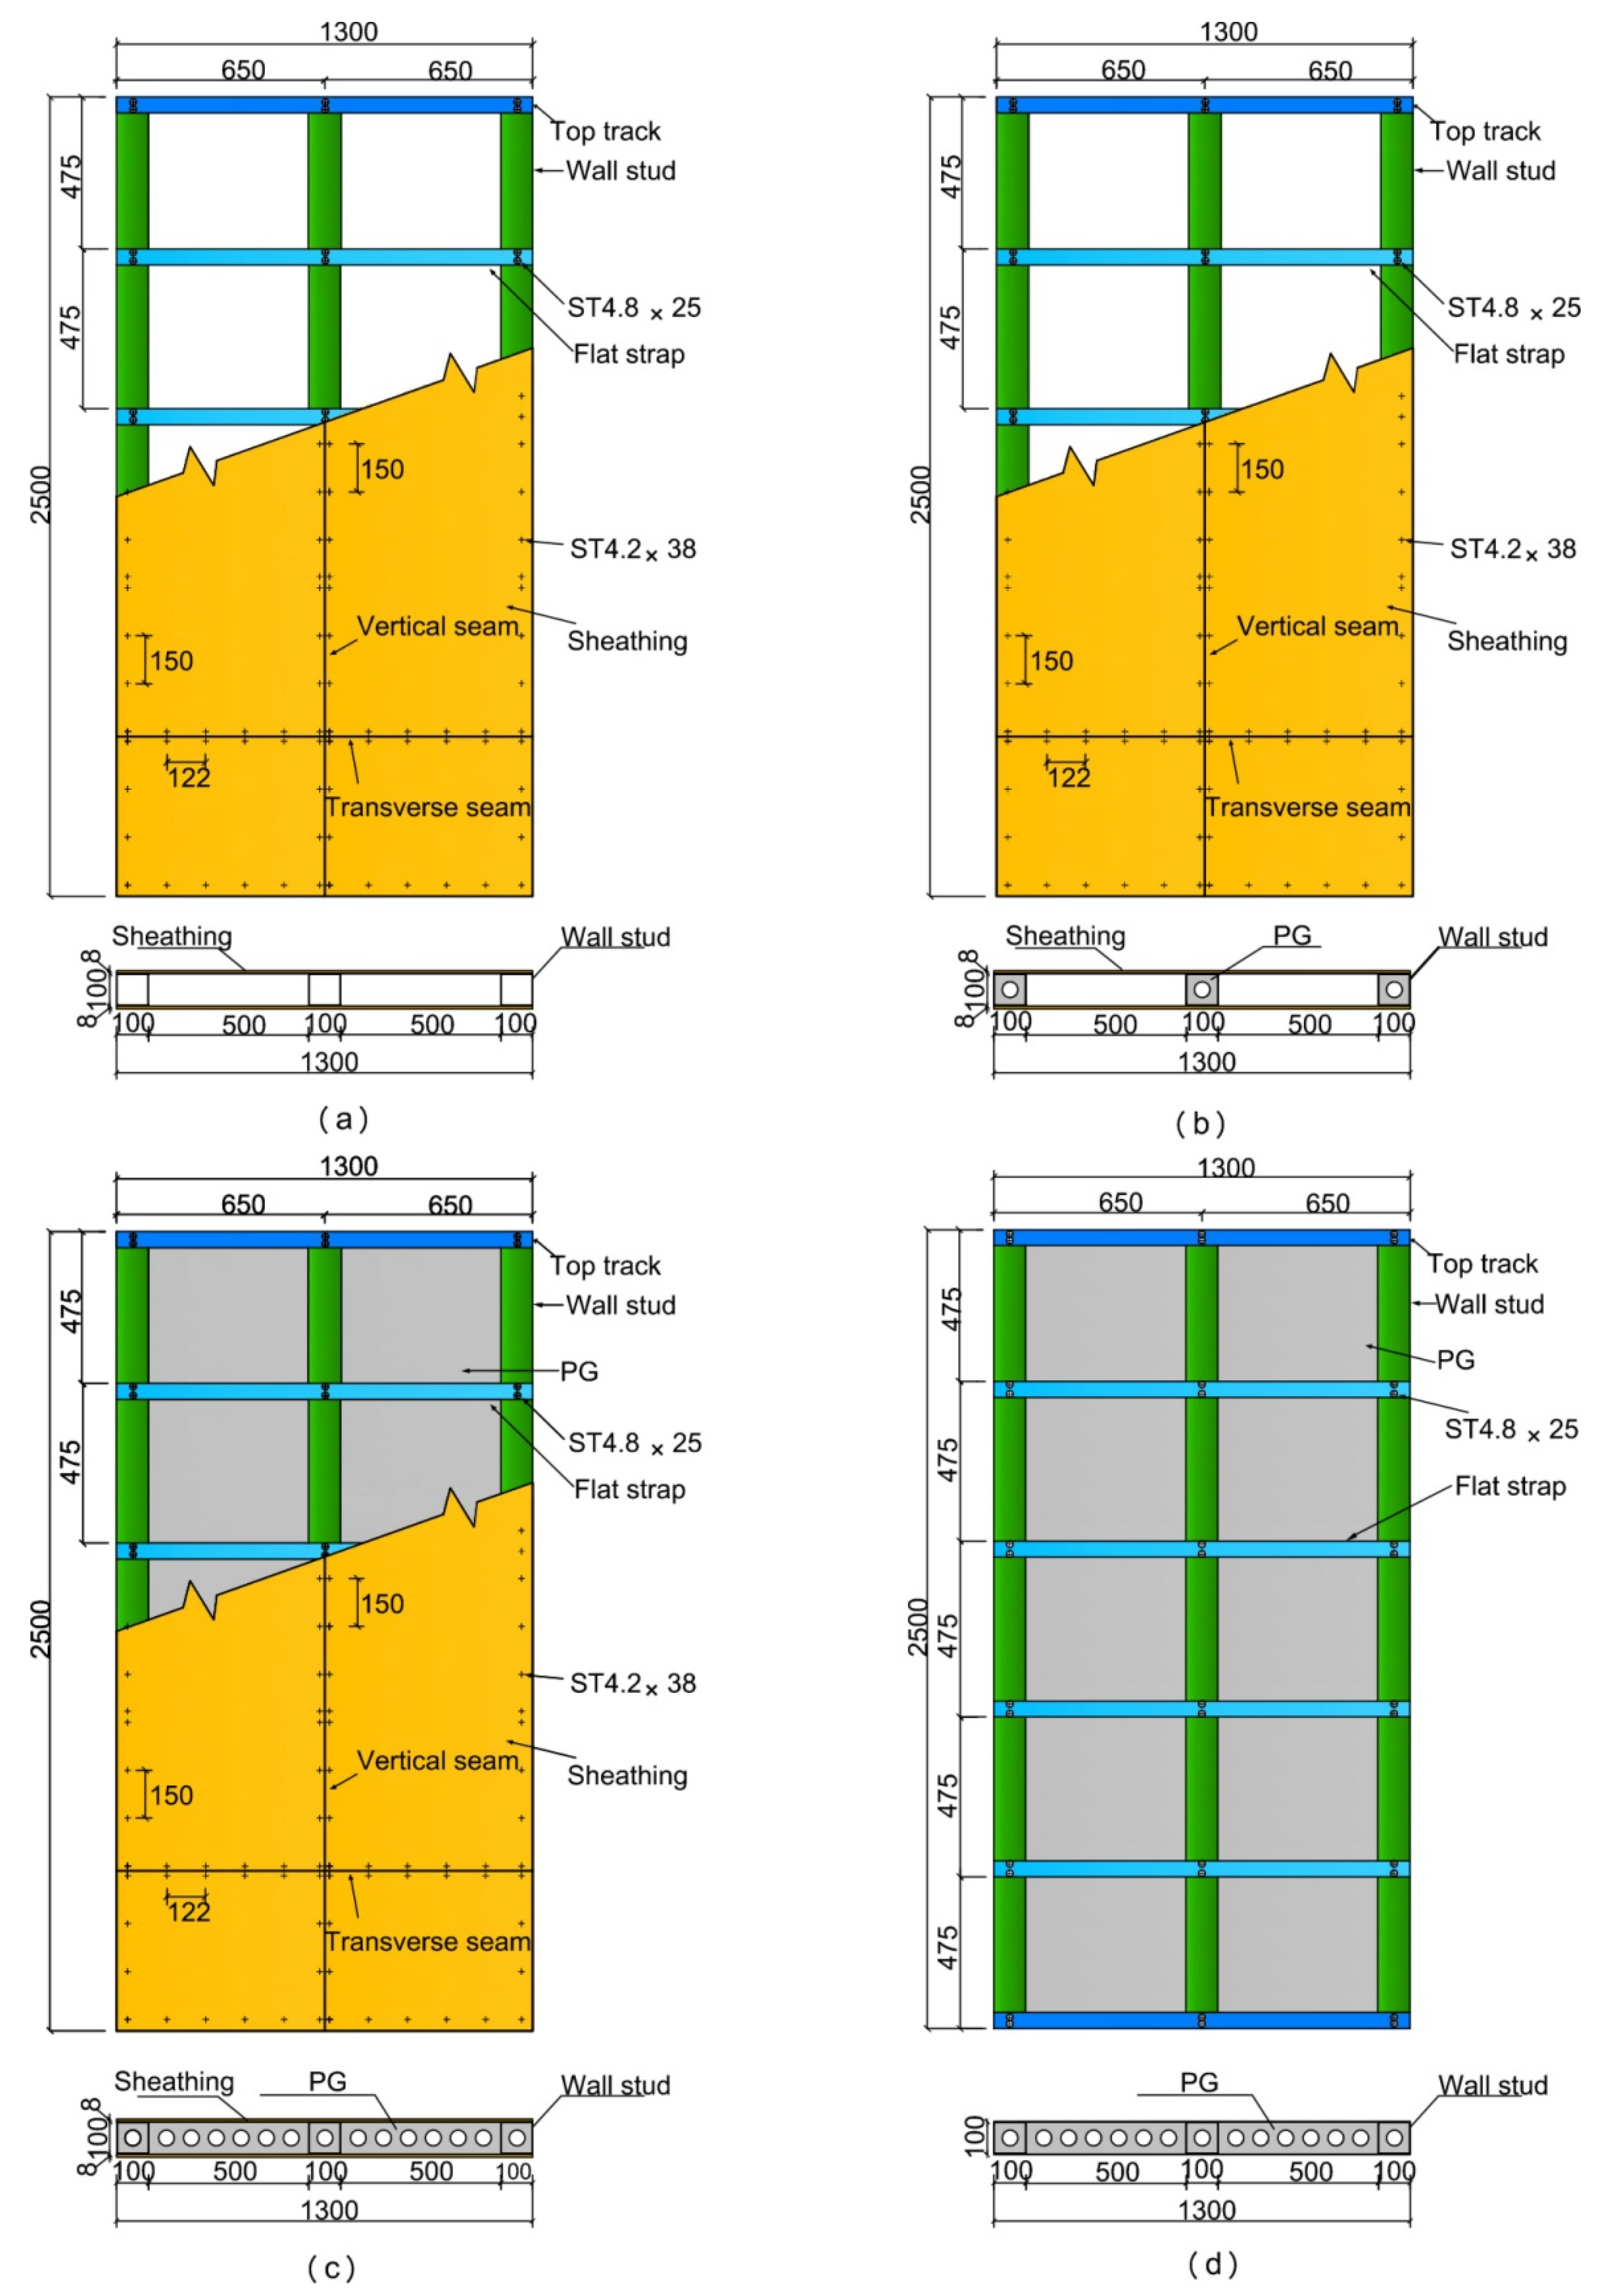
In the test program, four full-scale CFS wall specimens were designed according to the technical specification JGJ 227–2011 [23]. The main difference between the test specimens lies in the difference in sections, and the design information of specimens is listed in Table 1. Specimen W1 is a wall with a hollow section, specimen W2 was covered with wall sheathings and filled with PG in the studs only, and specimen W3 was covered with wall sheathings and filled with PG in the studs and between studs. The only difference between specimens W3 and W4 is that specimen W3 was covered with wall sheathings, while specimen W4 was not. All specimens were assembled with a width of 1300 mm and a height of 2500 mm. The wall studs were fabricated from cold-formed thin-walled square steel tubes with a dimension of 100 × 100 × 1.48 mm, and the spacing of wall studs is 500 mm. The top and bottom tracks were made into a U-shaped section with a dimension of 106 × 50 × 1.94 mm. To fully dissipate the water of PG and achieve the strength of PG, pre-punched circular holes spaced at 50 mm were opened along the length of the top and bottom tracks. The steel strips spaced at 500 mm were arranged along the height of the wall, and the dimension of the strip is 1300 × 60 × 1.94 mm. Wall sheathings were manufactured with 8 mm thick fiber cement boards (FCB), fixed on the CFS frames using ST4.2 × 35 mm bugle-head self-drilling screws. The FCBs were cut into different sizes according to the installation requirements. Finally, a vertical seam and a horizontal seam were formed between the installed FCBs. The installation spacing of the screws in horizontal and vertical directions is 122 mm and 150 mm, respectively. The configurations and dimensions of all specimens are illustrated in Figure 1.
2.2. Material Properties
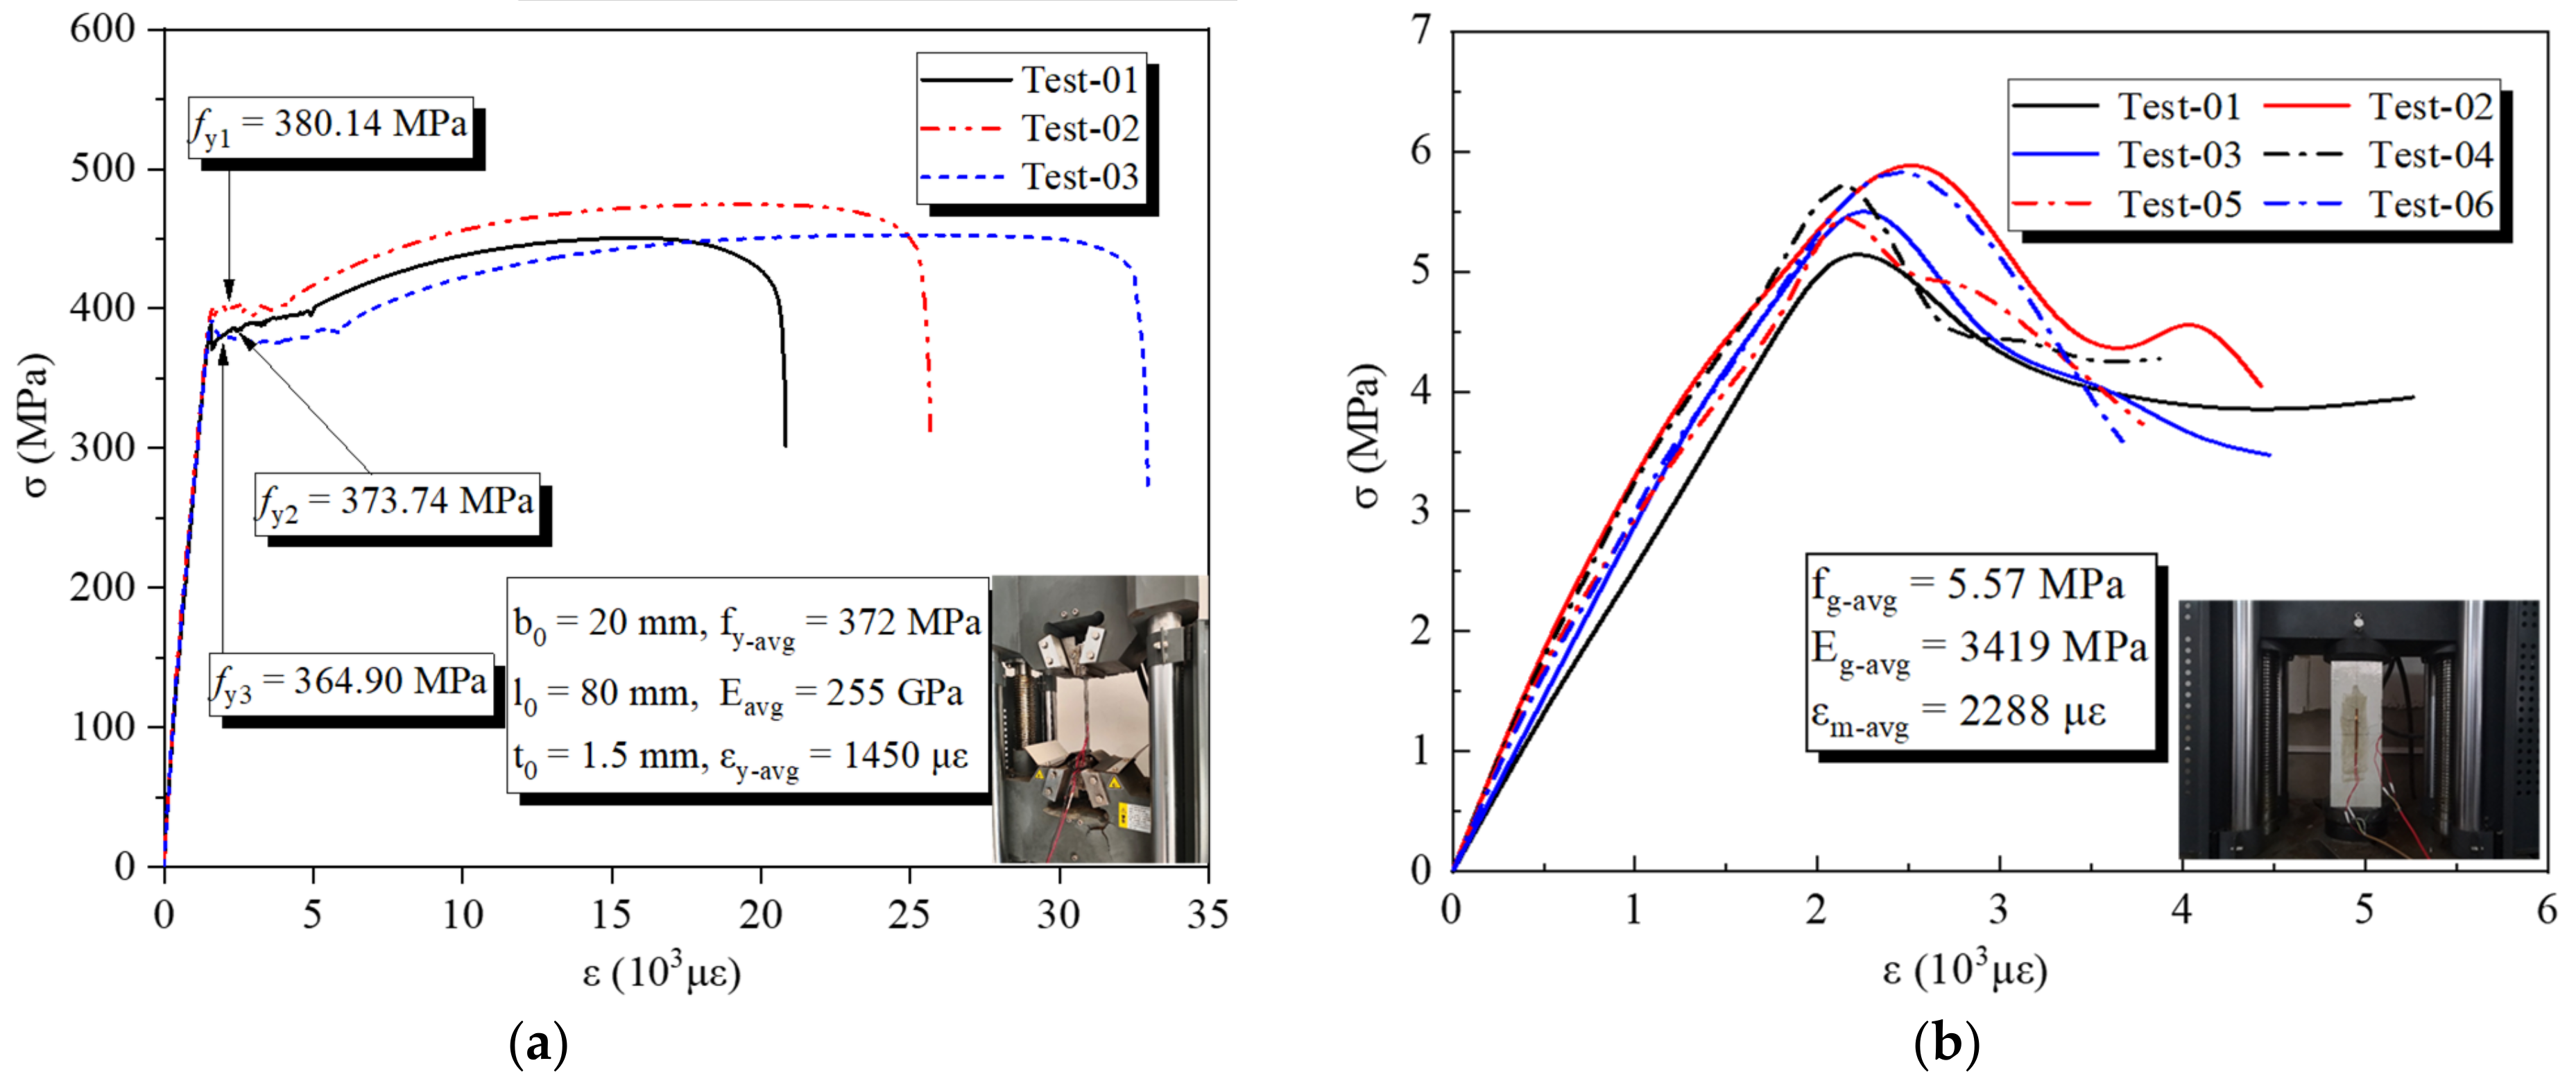
The material properties were obtained by tensile tests conforming to Chinese Standard GB/T 228.1–2010 [24]. Table 2 and Figure 2a summarize the material properties of the steel. The properties of PG were studied according to Chinese Standard GB/T 50081-2019 [25]. Table 3 and Figure 2b summarize the measured material properties of the PG. The material properties of the sheathings were determined according to Chinese Standard GB/T17657-1999) [26]. The results are presented in Table 4.
2.3. Test Setup and Loading Scheme
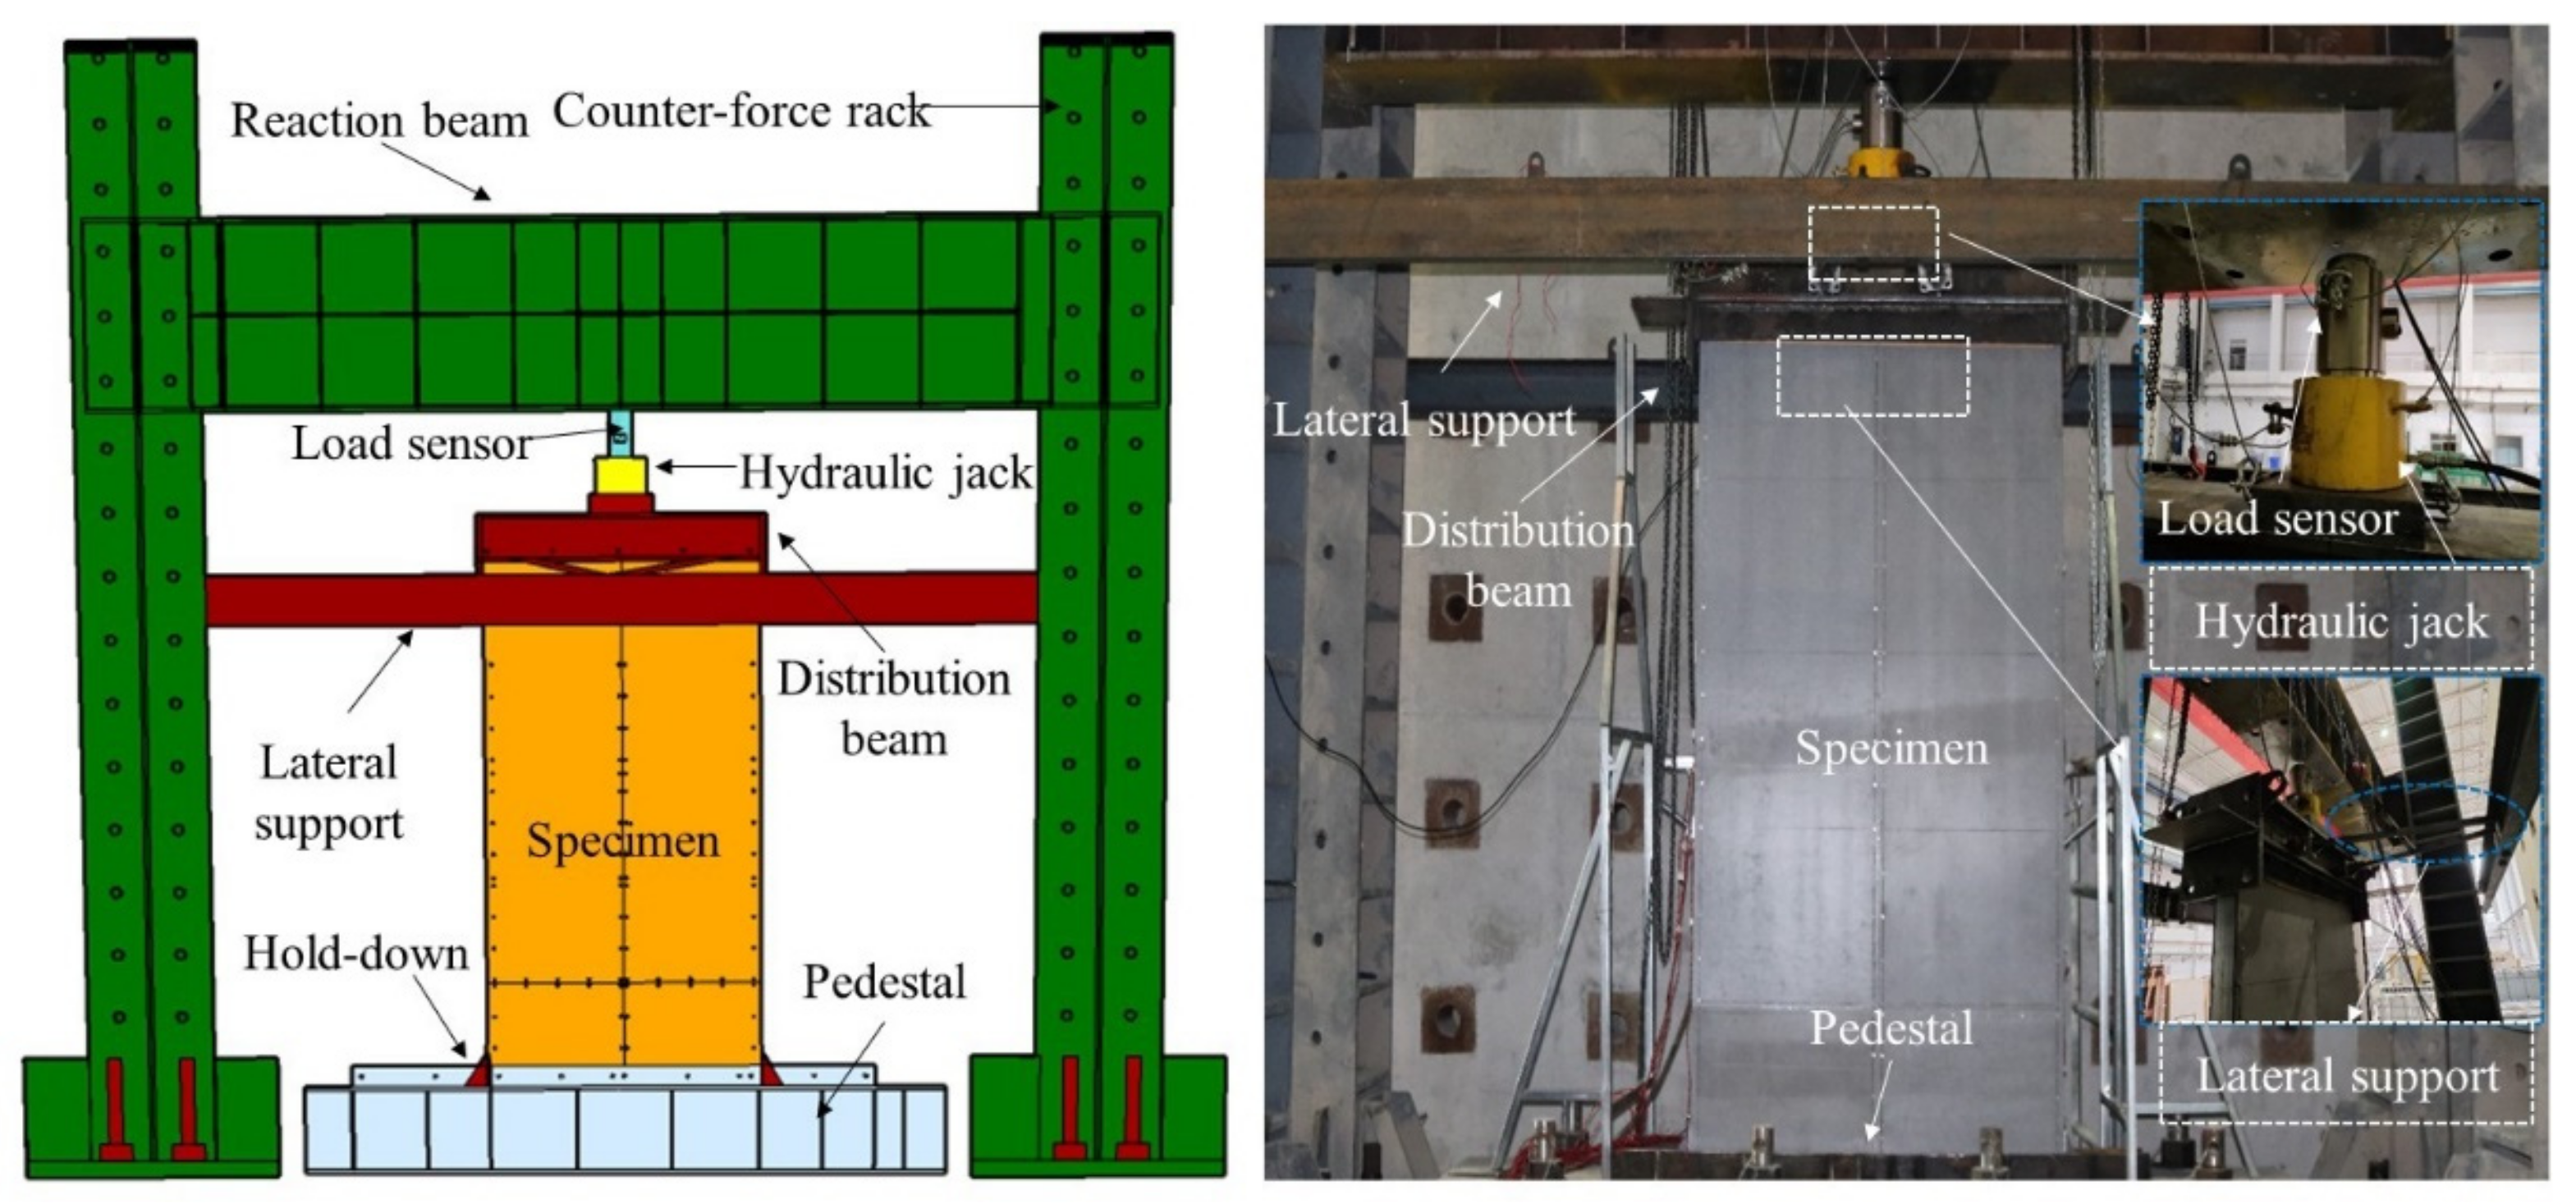
Before the formal test, the specimen was placed on the pedestal, and the bottom of the specimen was fixed to the pedestal using fasteners. On the left and right sides of the specimen, two hold-downs were also used to fix the specimen. Then, a distribution beam was arranged on the top of the specimen. Subsequently, a jack and a load sensor were arranged between the distribution beam and the reaction beam. Lateral supports were located on both sides of the distribution beam to prevent out-of-plane deformations of the specimens during the tests. The test setup is shown in Figure 3. According to the previous finite element analysis, the ultimate bearing capacity of each specimen was estimated. Before the formal test, the specimen should be preloaded to eliminate the gap between the testing machine and the specimen. The applied load was approximately 10% of the predicted value. After unloading the preloaded loads, the axial compression tests were officially started. The loading value of each loading step was 10 kN, and each loading step lasted for 1 min. When the applied load approached the predicted peak load, the load applied in each loading step was changed to 5 kN. When the applied load was reduced to 85% of the peak load or the specimen could not continue to bear the applied load, the testing machine would be turned off, and the test would be ended.
2.4. Arrangement of Measurement Points
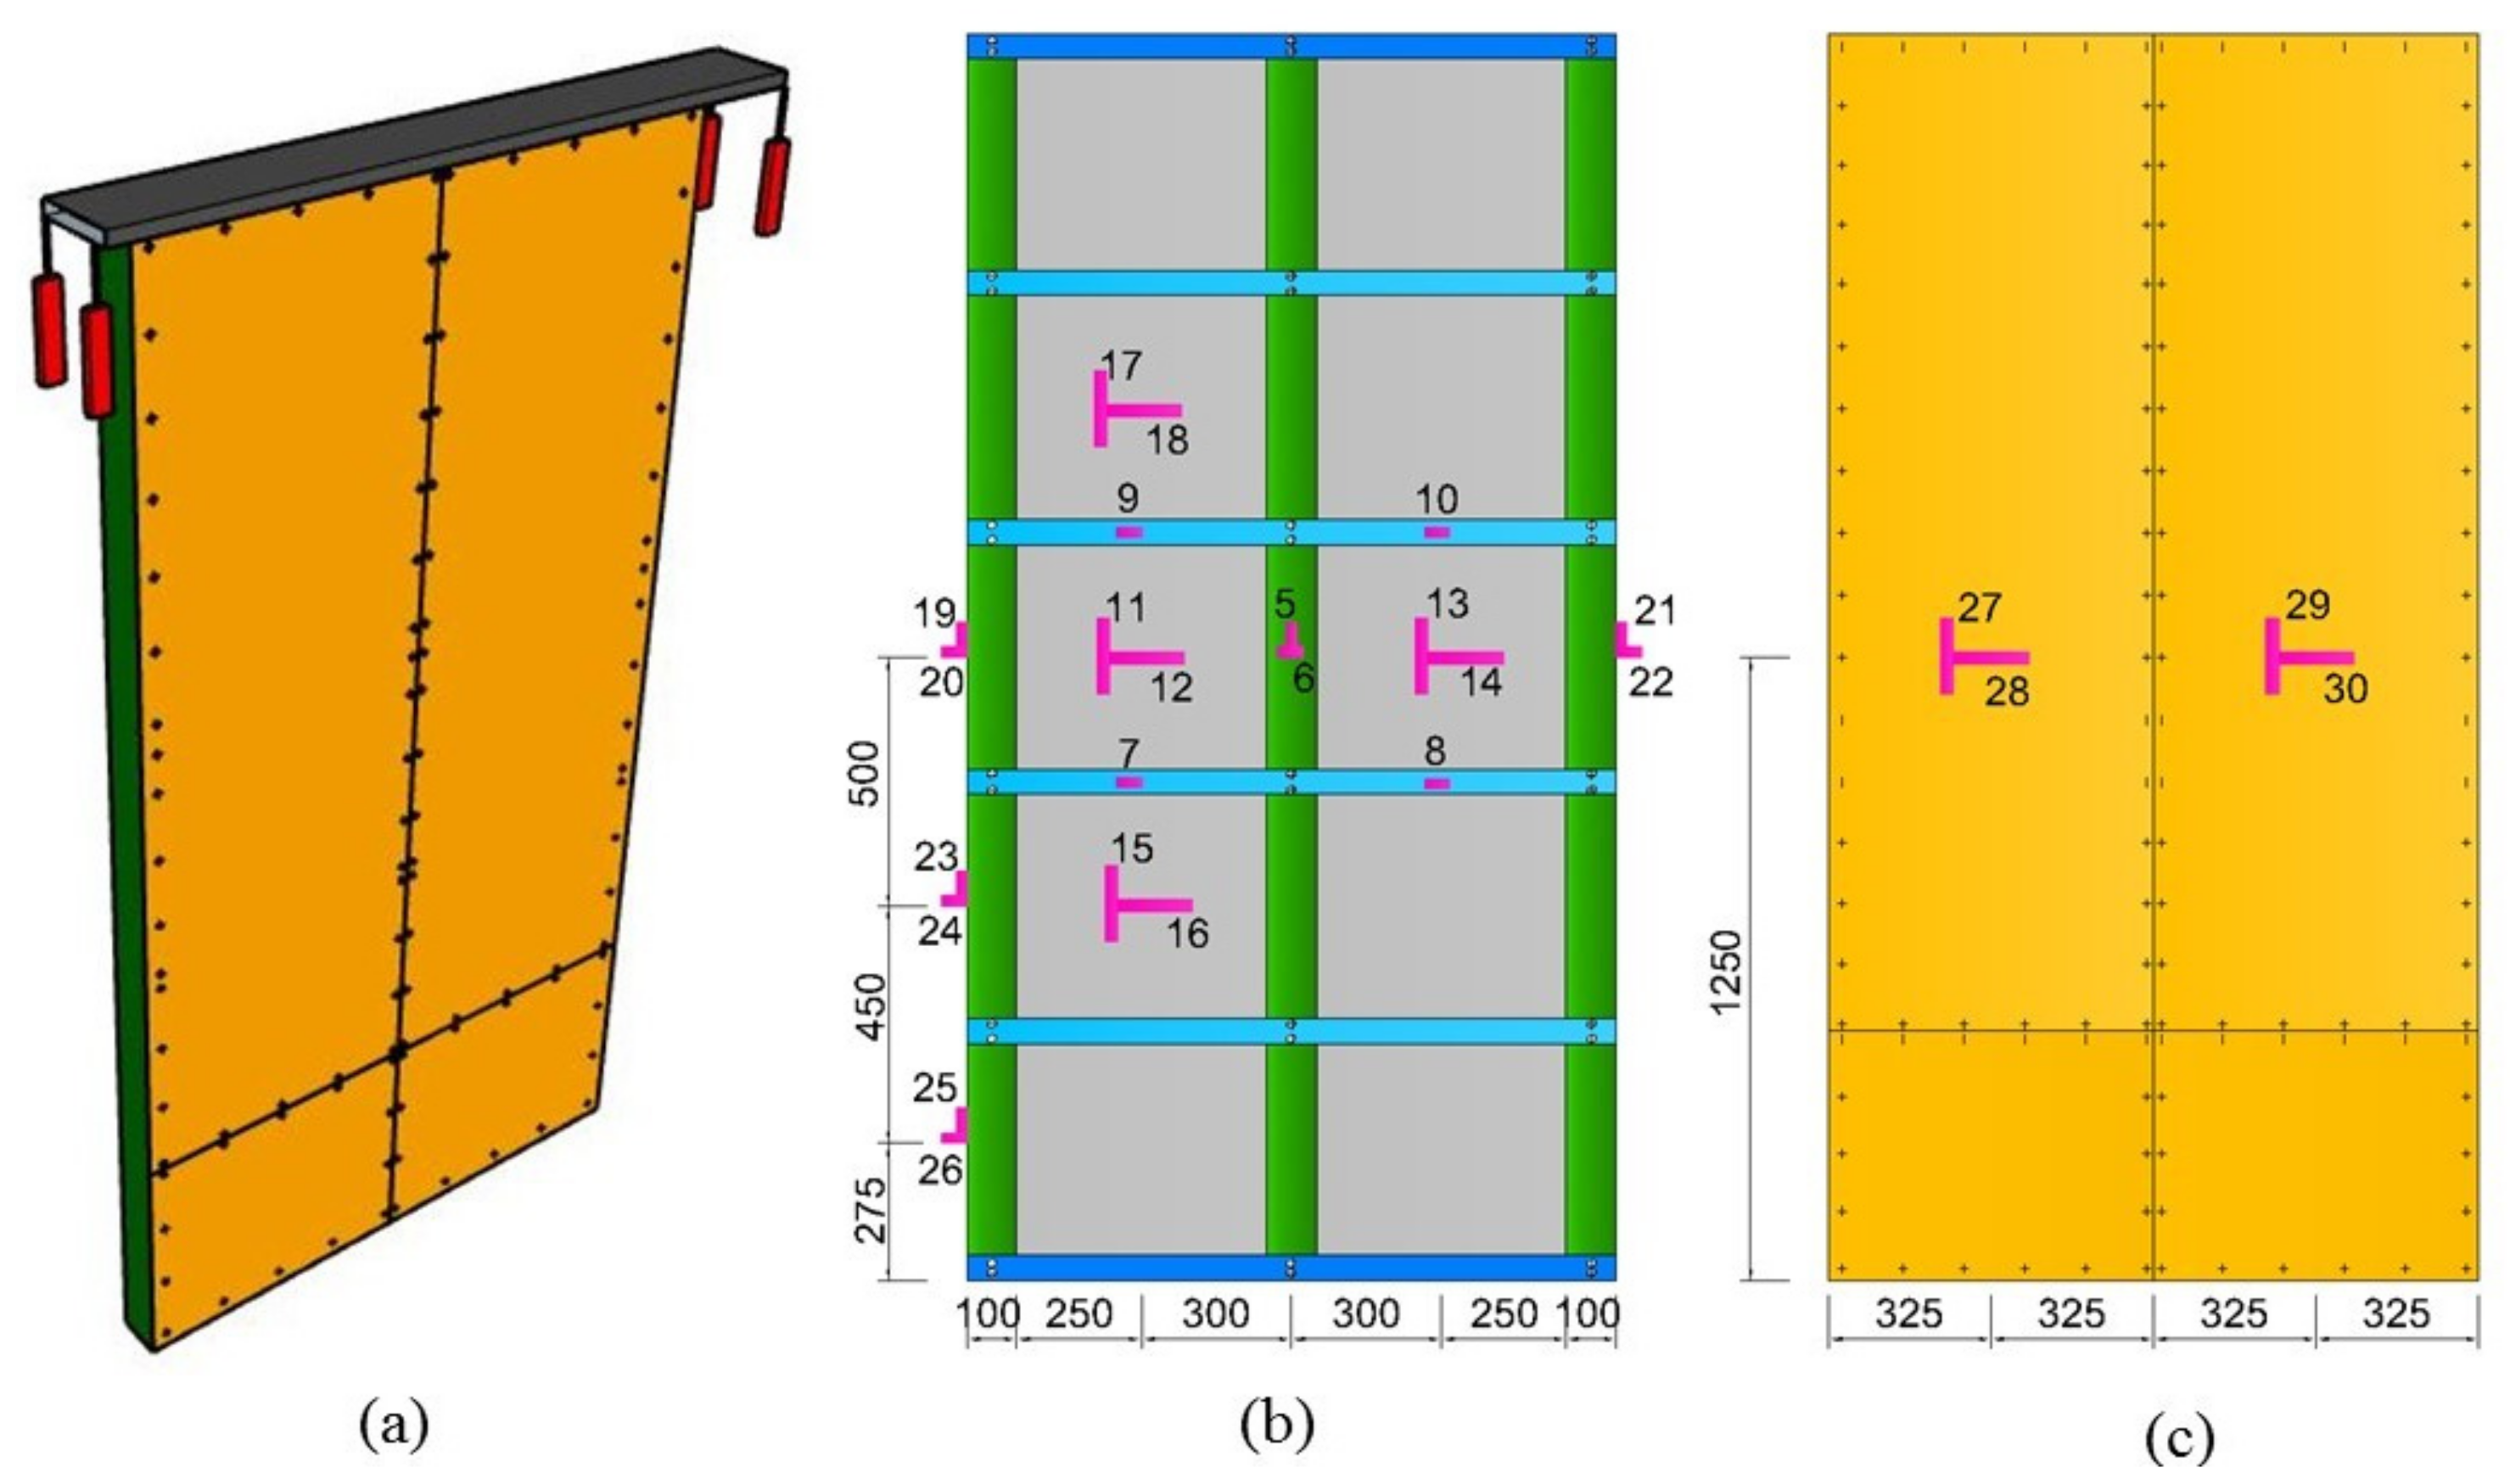
To measure the axial deformation of the specimens, four LVDTs were arranged at the four corners of the top of the wall, and the average value was used to represent the vertical displacement of the specimen, as illustrated in Figure 4a. In addition, a total of 26 strain gauges were used to measure the strain values of the steel studs, PG, and sheathings, as illustrated in Figure 4b,c.
3. General Observation and Failure Modes
3.1. Test Specimen W1
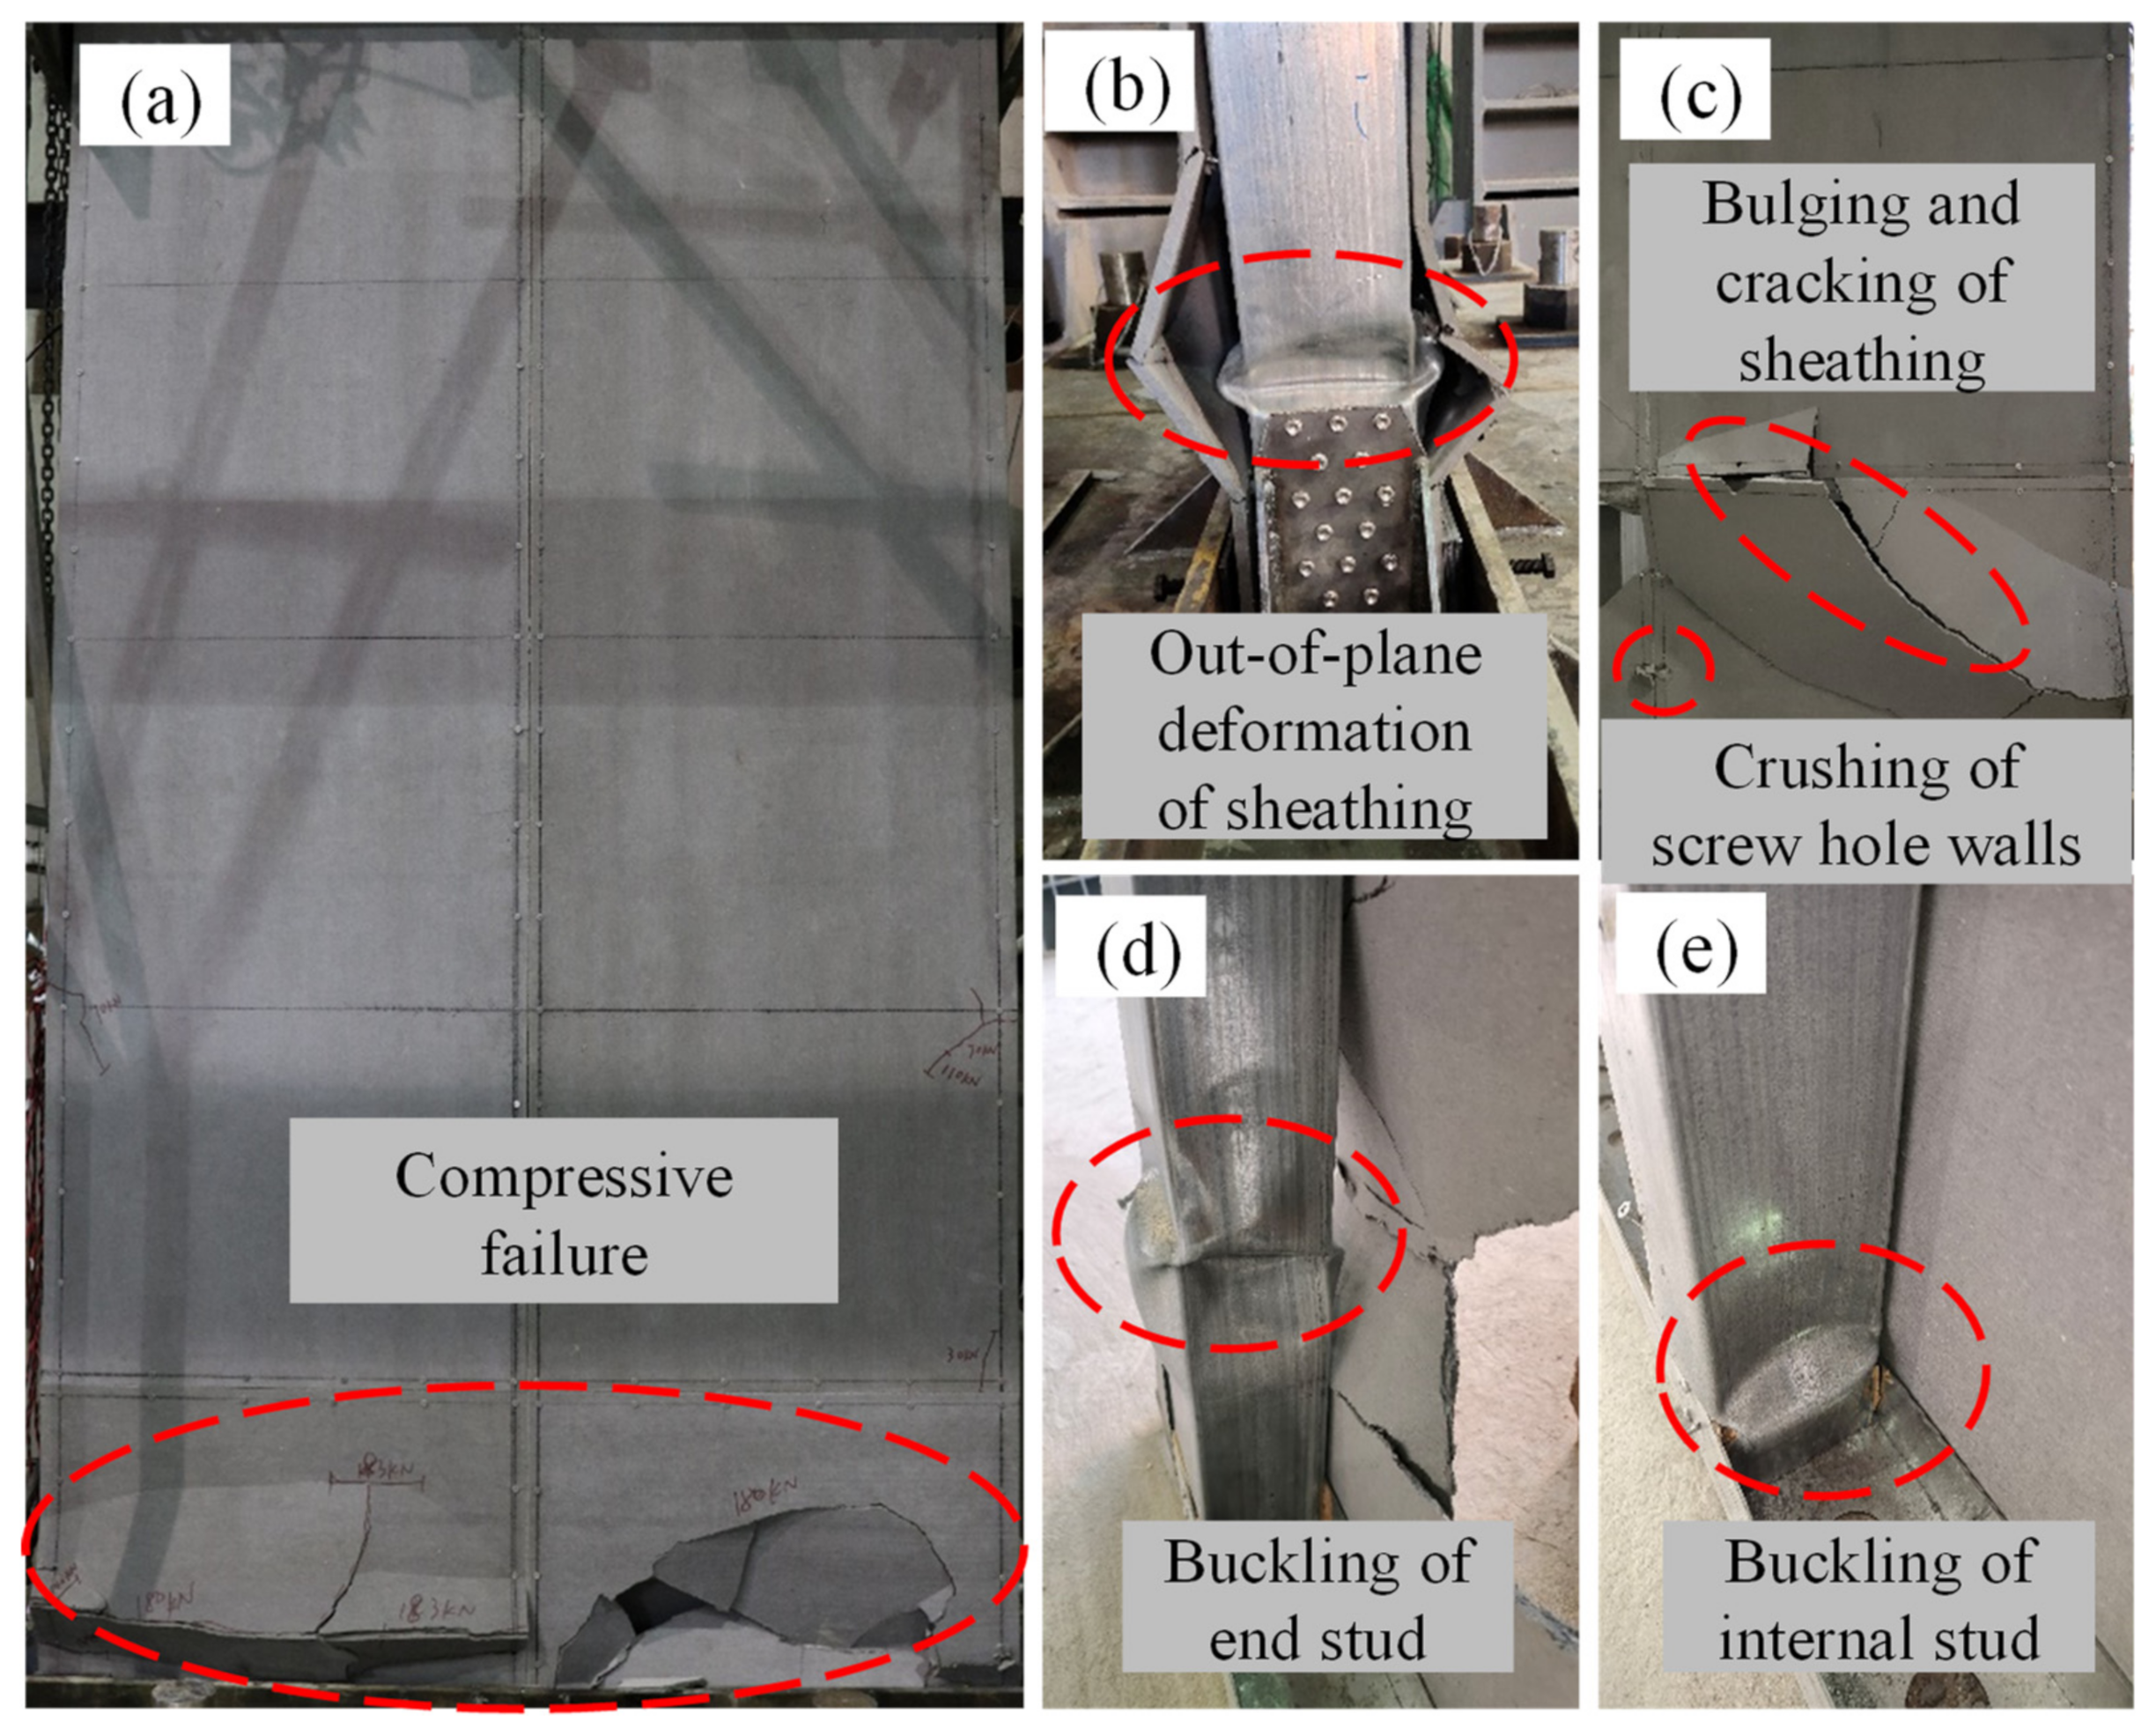
In the initial stage of loading (from 0 kN to 100 kN), no obvious damage phenomenon was observed. With the increase in the applied vertical load, a compressive tendency was presented at the seams of the wall sheathings, accompanied by slight noises. When the applied load reached 110 kN, the first diagonal crack appeared at the seam of the wall sheathing. When the load reached 140 kN, a slight local buckling on the stud surface was observed, which was located approximately 150 mm from the bottom of the wall. Moreover, cracks at the wall sheathing seams kept propagating with the increase in the applied load, and some new cracks were observed on the wall sheathings at the bottom of the wall. When the load reached the peak load of the specimen, the bottom wall sheathing fell off in blocks and was accompanied by sharp noises. The failure characteristics of the wall after the test are shown in Figure 5. The bulging deformation of the end stud was approximately 20 mm and a huge out-of-plane deformation of the wall sheathing was observed, as shown in Figure 5b. Serious bulging and cracking at the bottom of the wall sheathings and the crushing of screw hole walls at the seams were presented, as shown in Figure 5c. After removing the sheathings, the significant buckling phenomena of the end and internal studs were observed, as illustrated in Figure 5d,e.
3.2. Test Specimen W2
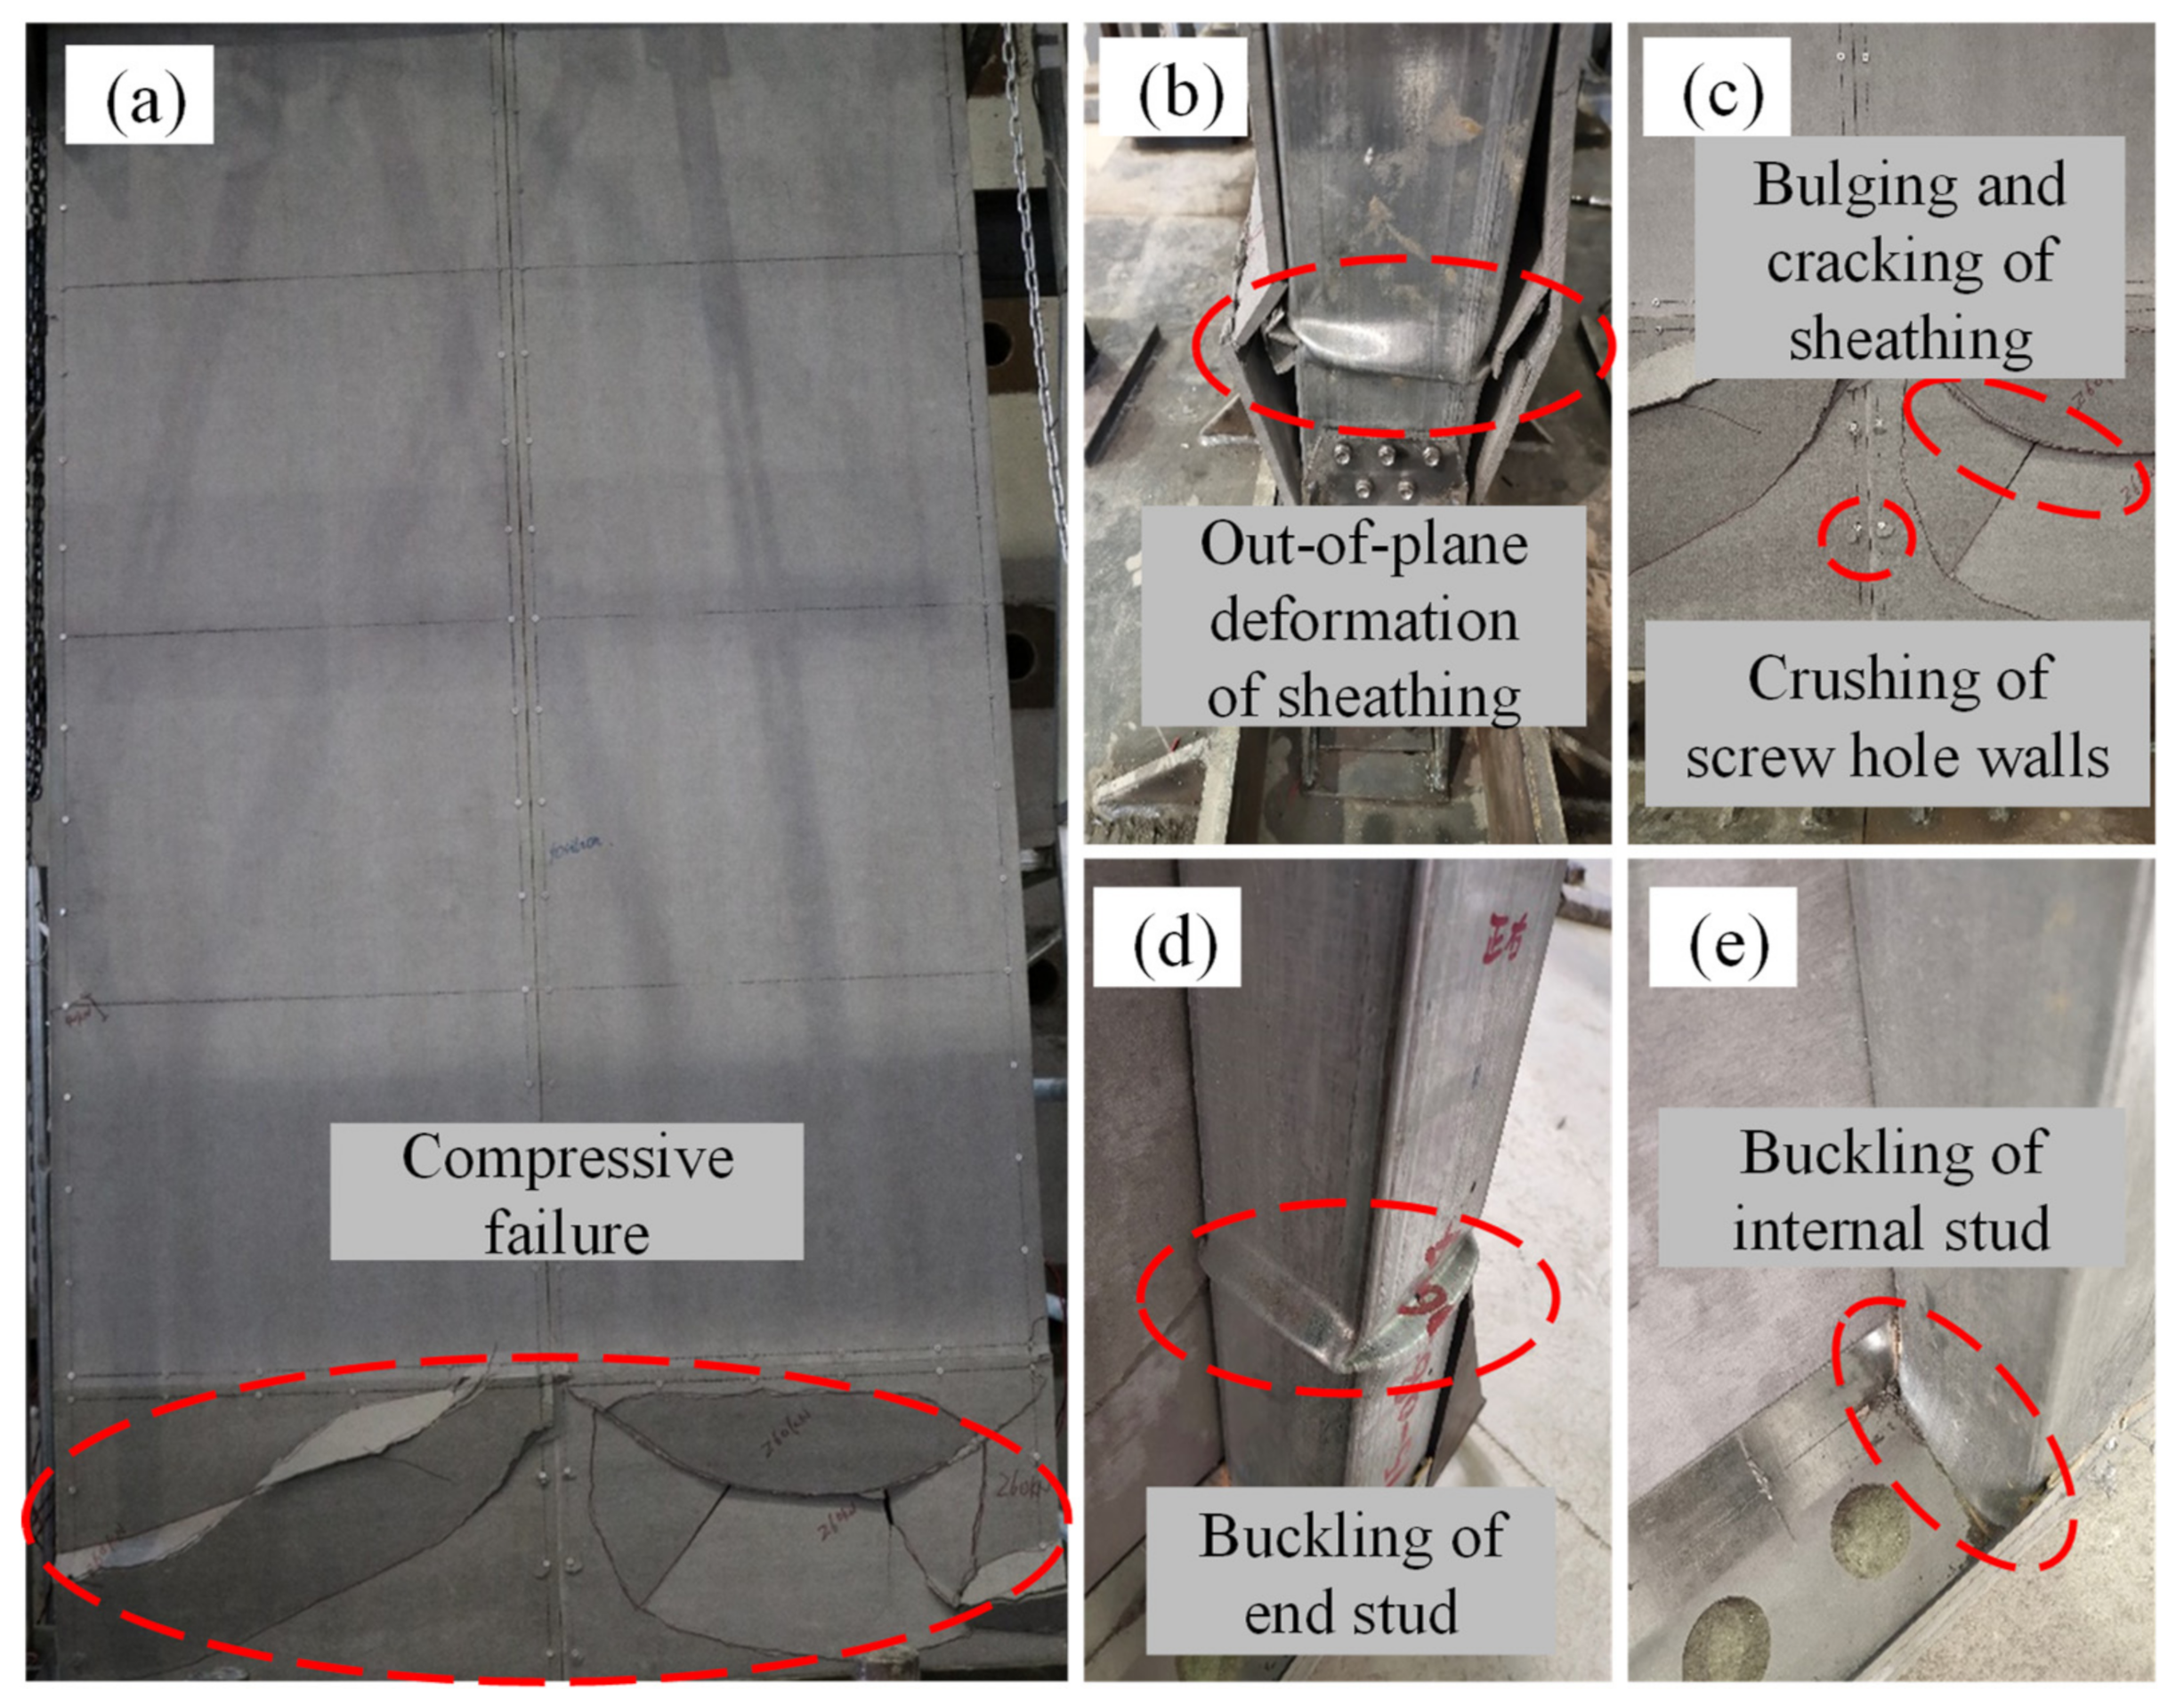
The test phenomena of specimen W2 were essentially similar to those of specimen W1. In the initial stage of loading (from 0 kN to 160 kN), no notable damage phenomenon was observed. When the applied load reached 170 kN, a slight local buckling on the stud surface was observed, which was located approximately 180 mm from the bottom of the wall. Meanwhile, no significant damage phenomenon was observed on the wall sheathings. With the increase in the applied load, the buckling degree of the studs increased. When the applied load reached the ultimate bearing capacity of the specimen, the bottom wall sheathing fell off in blocks and was accompanied by sharp noises. The failure characteristics of the wall after the test are illustrated in Figure 6. Compared with specimen W1, the end stud of specimen W2 formed a ring-shaped bulge, and the degree of bulging deformation was relatively small, the measured value of the bulging deformation was approximately 10 mm. Moreover, the wall sheathing showed a relatively large out-of-plane deformation, as shown in Figure 6b. Serious bulging and cracking at the bottom of the wall sheathings and the crushing of screw hole walls near the seams were presented, as shown in Figure 6c. After removing the wall sheathings, the significant buckling phenomena of the end and internal studs were observed, as illustrated in Figure 6d,e.
3.3. Test Specimen W3
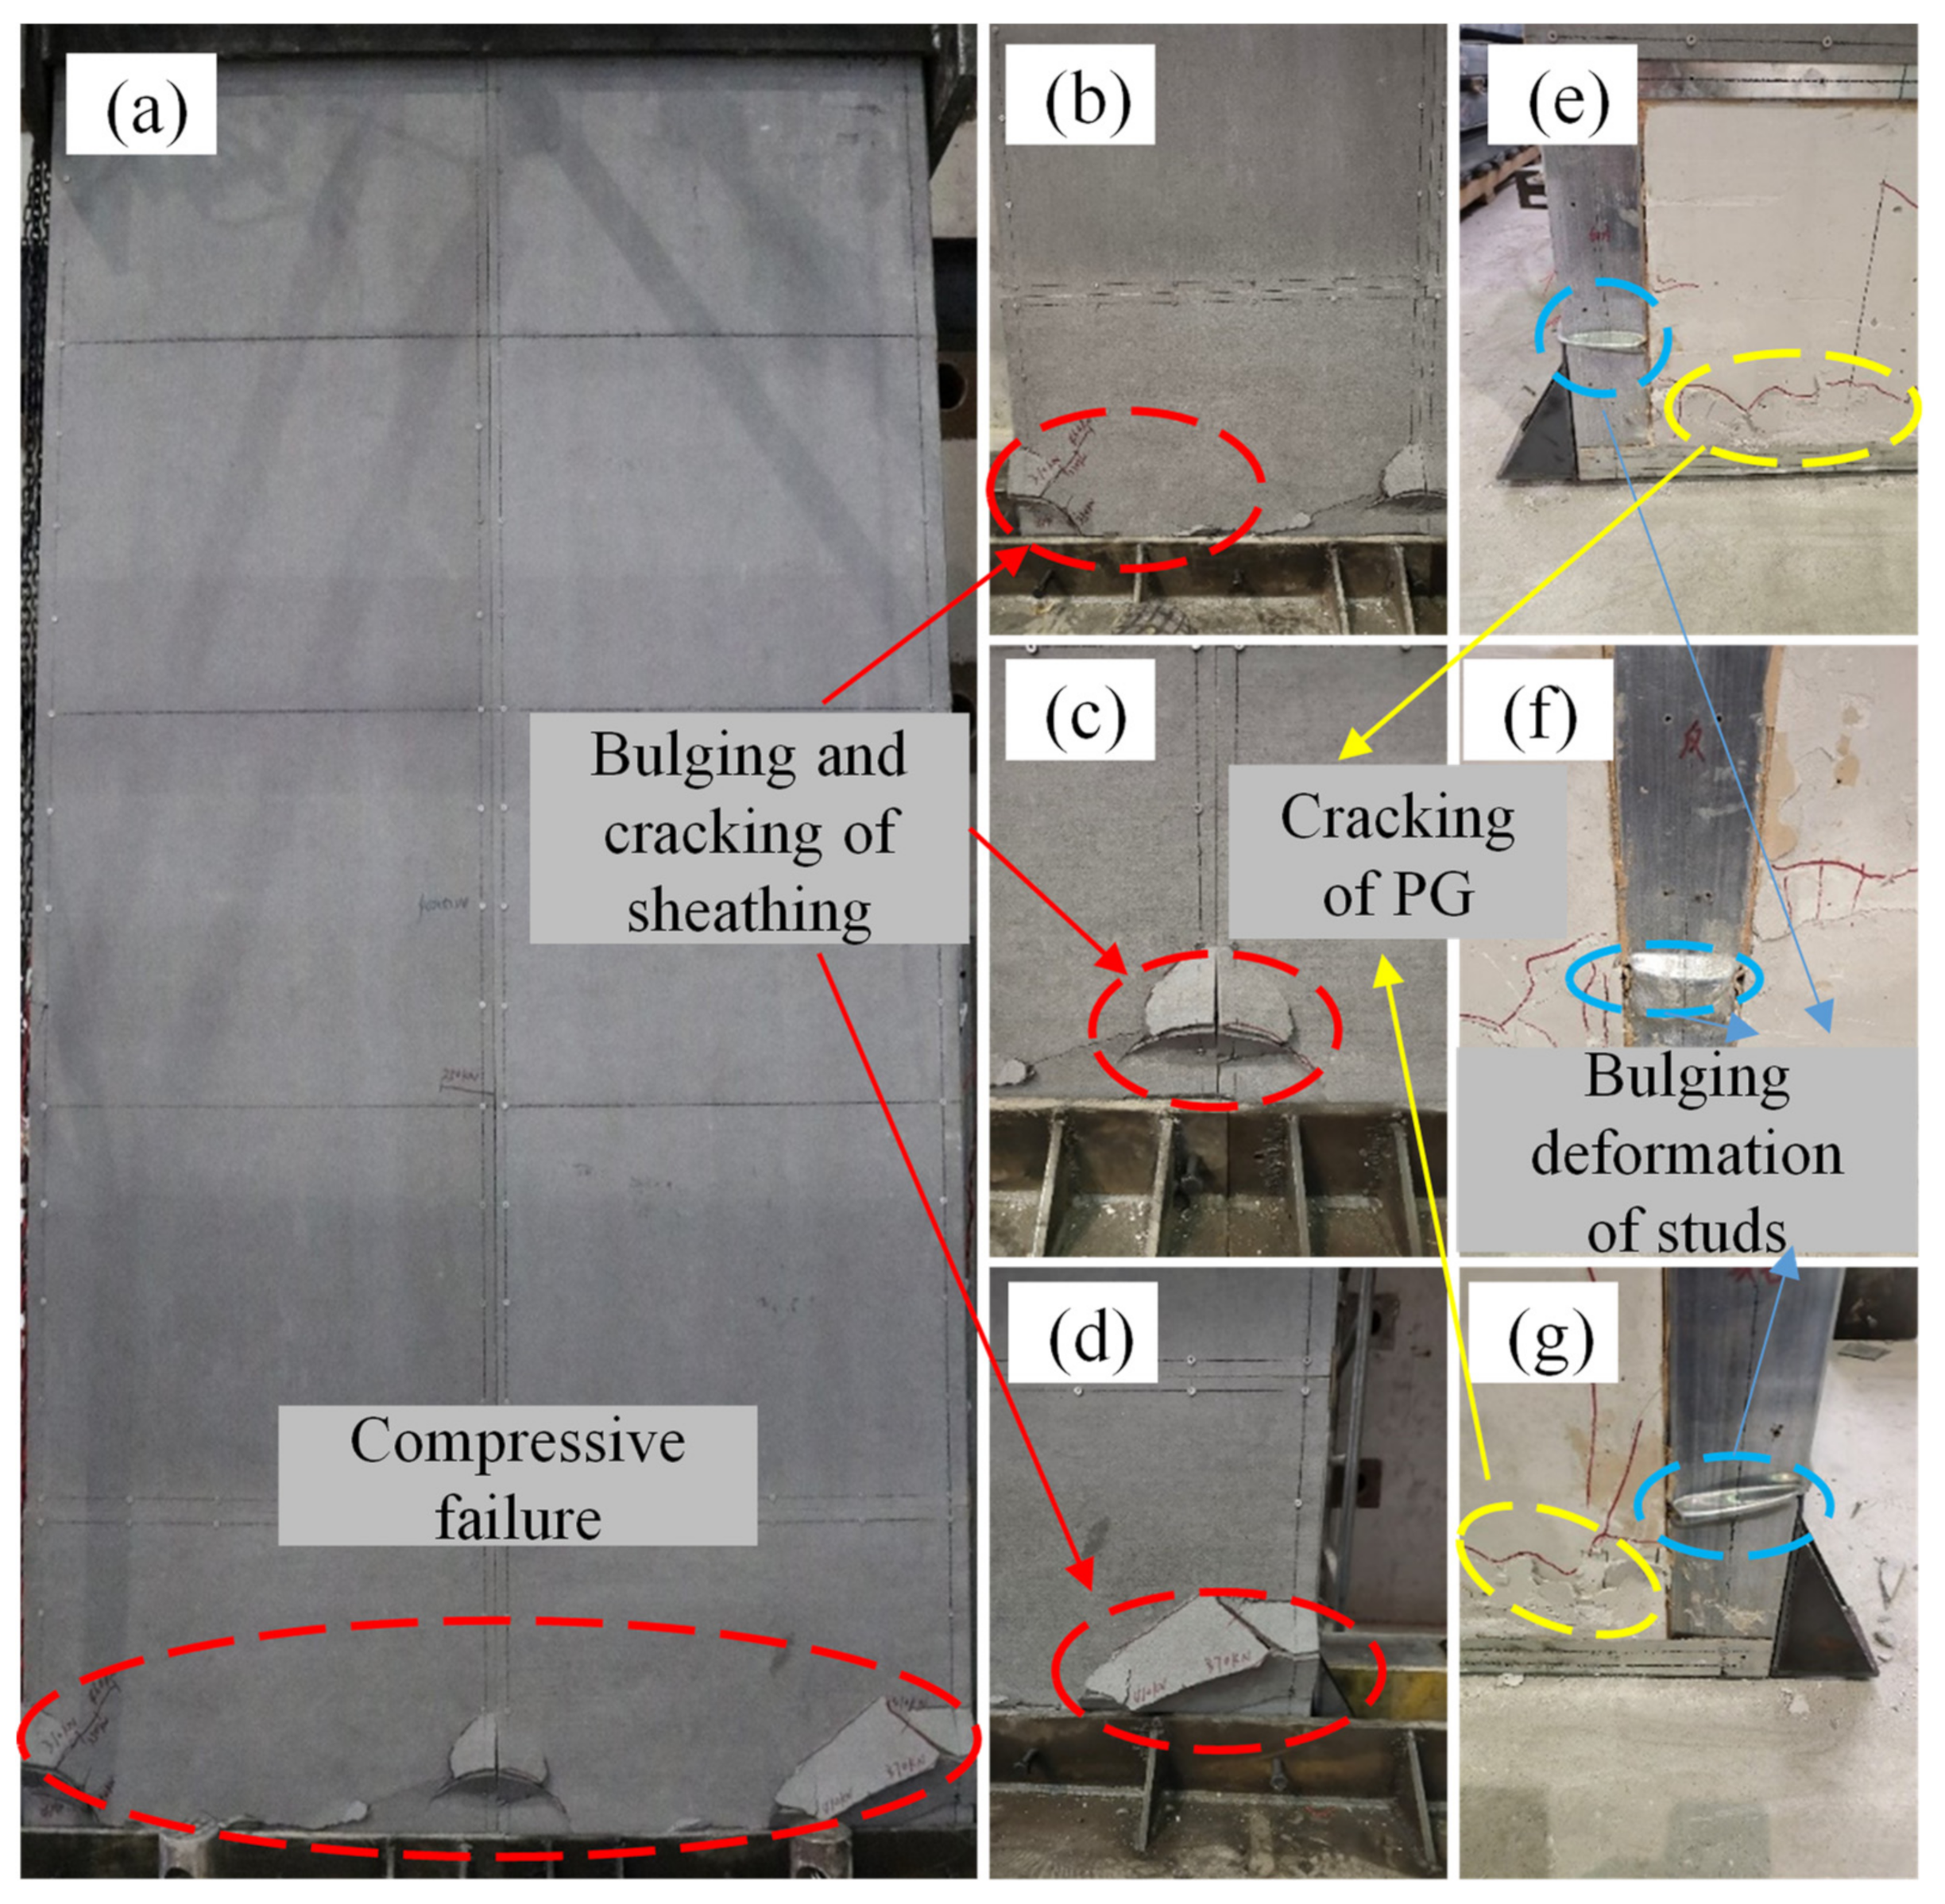
During the initial loading stage (from 0 kN to 240 kN), no apparent phenomena apart from the noise emitted by the wall sheathings were observed in specimen W3. When the applied load reached 250 kN, a slight bulging deformation with an approximate size of 5 mm at the bottom of the end studs was observed. When the applied vertical load reached 330 kN, some diagonal cracks were observed at the bottom of the wall sheathings, and the bulge of the end studs increased to 10 mm. When the applied load reached the ultimate bearing capacity of the specimen, the bottom wall sheathings presented a relatively dispersed cracking phenomenon. Compared with specimens W1 and W2, the cracking regions of specimen W3 are relatively small. A crisp crushing sound was heard as the wall sheathings were cracked into several pieces. The failure characteristics of specimen W3 after the test are shown in Figure 7. The serious bulging and cracking of the wall sheathings at the bottom of the left and right ends of the wall were observed. Meanwhile, slight bulging damage to the wall sheathing at the position of the internal stud was also observed, as illustrated in Figure 7b–d. After removing the wall sheathings, the bulging deformation of the end and internal stud were approximately 15 mm and 10 mm, respectively, as shown in Figure 7e–g. The PG at the bottom of the wall showed diagonal cracks in varying degrees, and some parts of the PG were crushed and fell off in blocks, as shown in Figure 7e–g.
3.4. Test Specimen W4
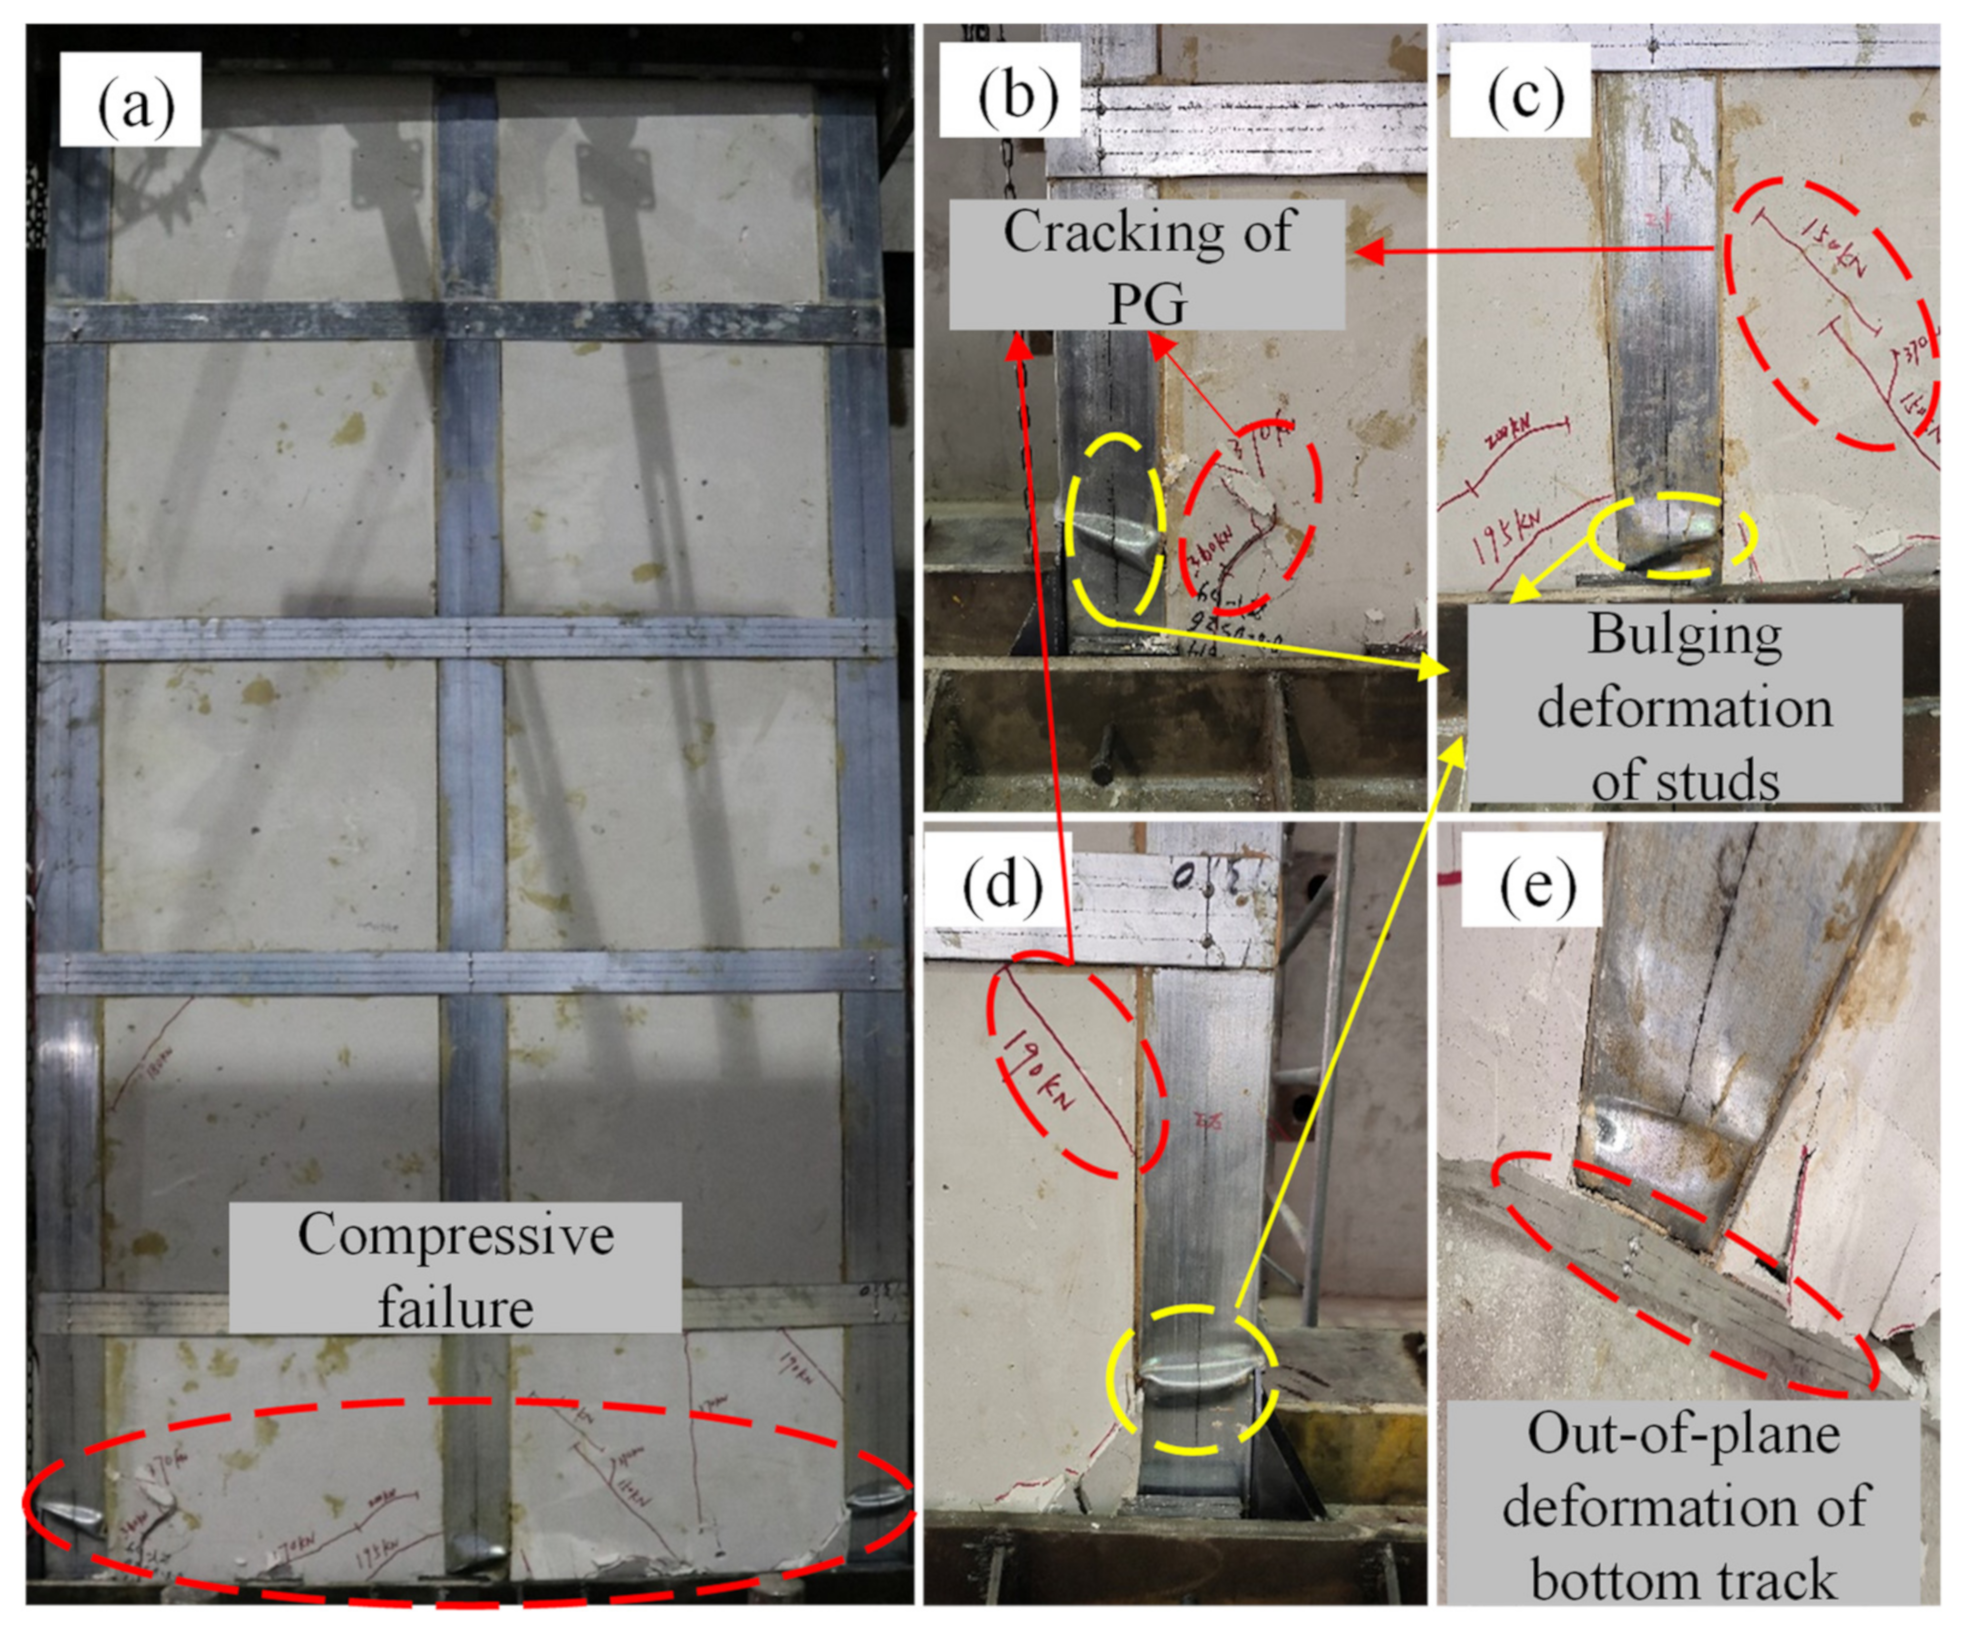
In the initial loading stage of specimen W4 (from 0 kN to 140 kN), no obvious damage phenomenon was observed. When the applied load reached 150 kN, the first diagonal crack appeared on the surface of the PG at the bottom of the wall. When the applied load reached 190 kN, some new cracks were observed in the middle region of the wall bottom, and the existing cracks kept propagating with the increase in the applied vertical load. When the load reached 220 kN, a slight bulging deformation with an approximate size of 6 mm was observed on the stud surface at the bottom of the stud. When the applied load reached 300 kN, bulging deformation was also observed on the surface of the internal stud. Subsequently, the specimen entered the peak loading stage, the PG at the bottom of the wall presented the crushing phenomenon. The failure characteristics of specimen W4 after the loading are shown in Figure 8. The bulging deformation of the end and internal stud were approximately 18 mm and 12 mm, respectively. The deformations presented are shown in Figure 8b–d. Figure 8b–d also showed the damages of PG. Compared with specimen W3, the damage degree of PG of specimen W4 is more serious. Out-of-plane deformation of the bottom track caused by the extrusion effect was also observed, as illustrated in Figure 8e.
Based on the test observations of all specimens, it can be seen that specimens W1 and W2 showed similar failure modes. However, the bulging deformations of the studs of specimen W2 are significantly smaller than those of the studs of specimen W1. The reason is that the buckling behavior of the studs is effectively improved due to the filling effect of PG. Compared with specimens W1 and W2, the cracking regions of specimen W3 are relatively small, and the bulging deformations of the studs of specimen W3 are also smaller than those of the studs of specimen W1. All these changes are due to the measures of filling PG in and between the studs. When the specimen suffered a vertical load, the load-bearing contribution of PG reduced the burden on other components, resulting in lower damage to other components. Compared with specimen W3, the bulging degree of studs of specimen W4 seems more serious, and the same is true of the cracking of PG. The possible reason is that the restraint effect and load-bearing effect of wall sheathings reduced the damage to internal components.
4. Discussion of the Test Results
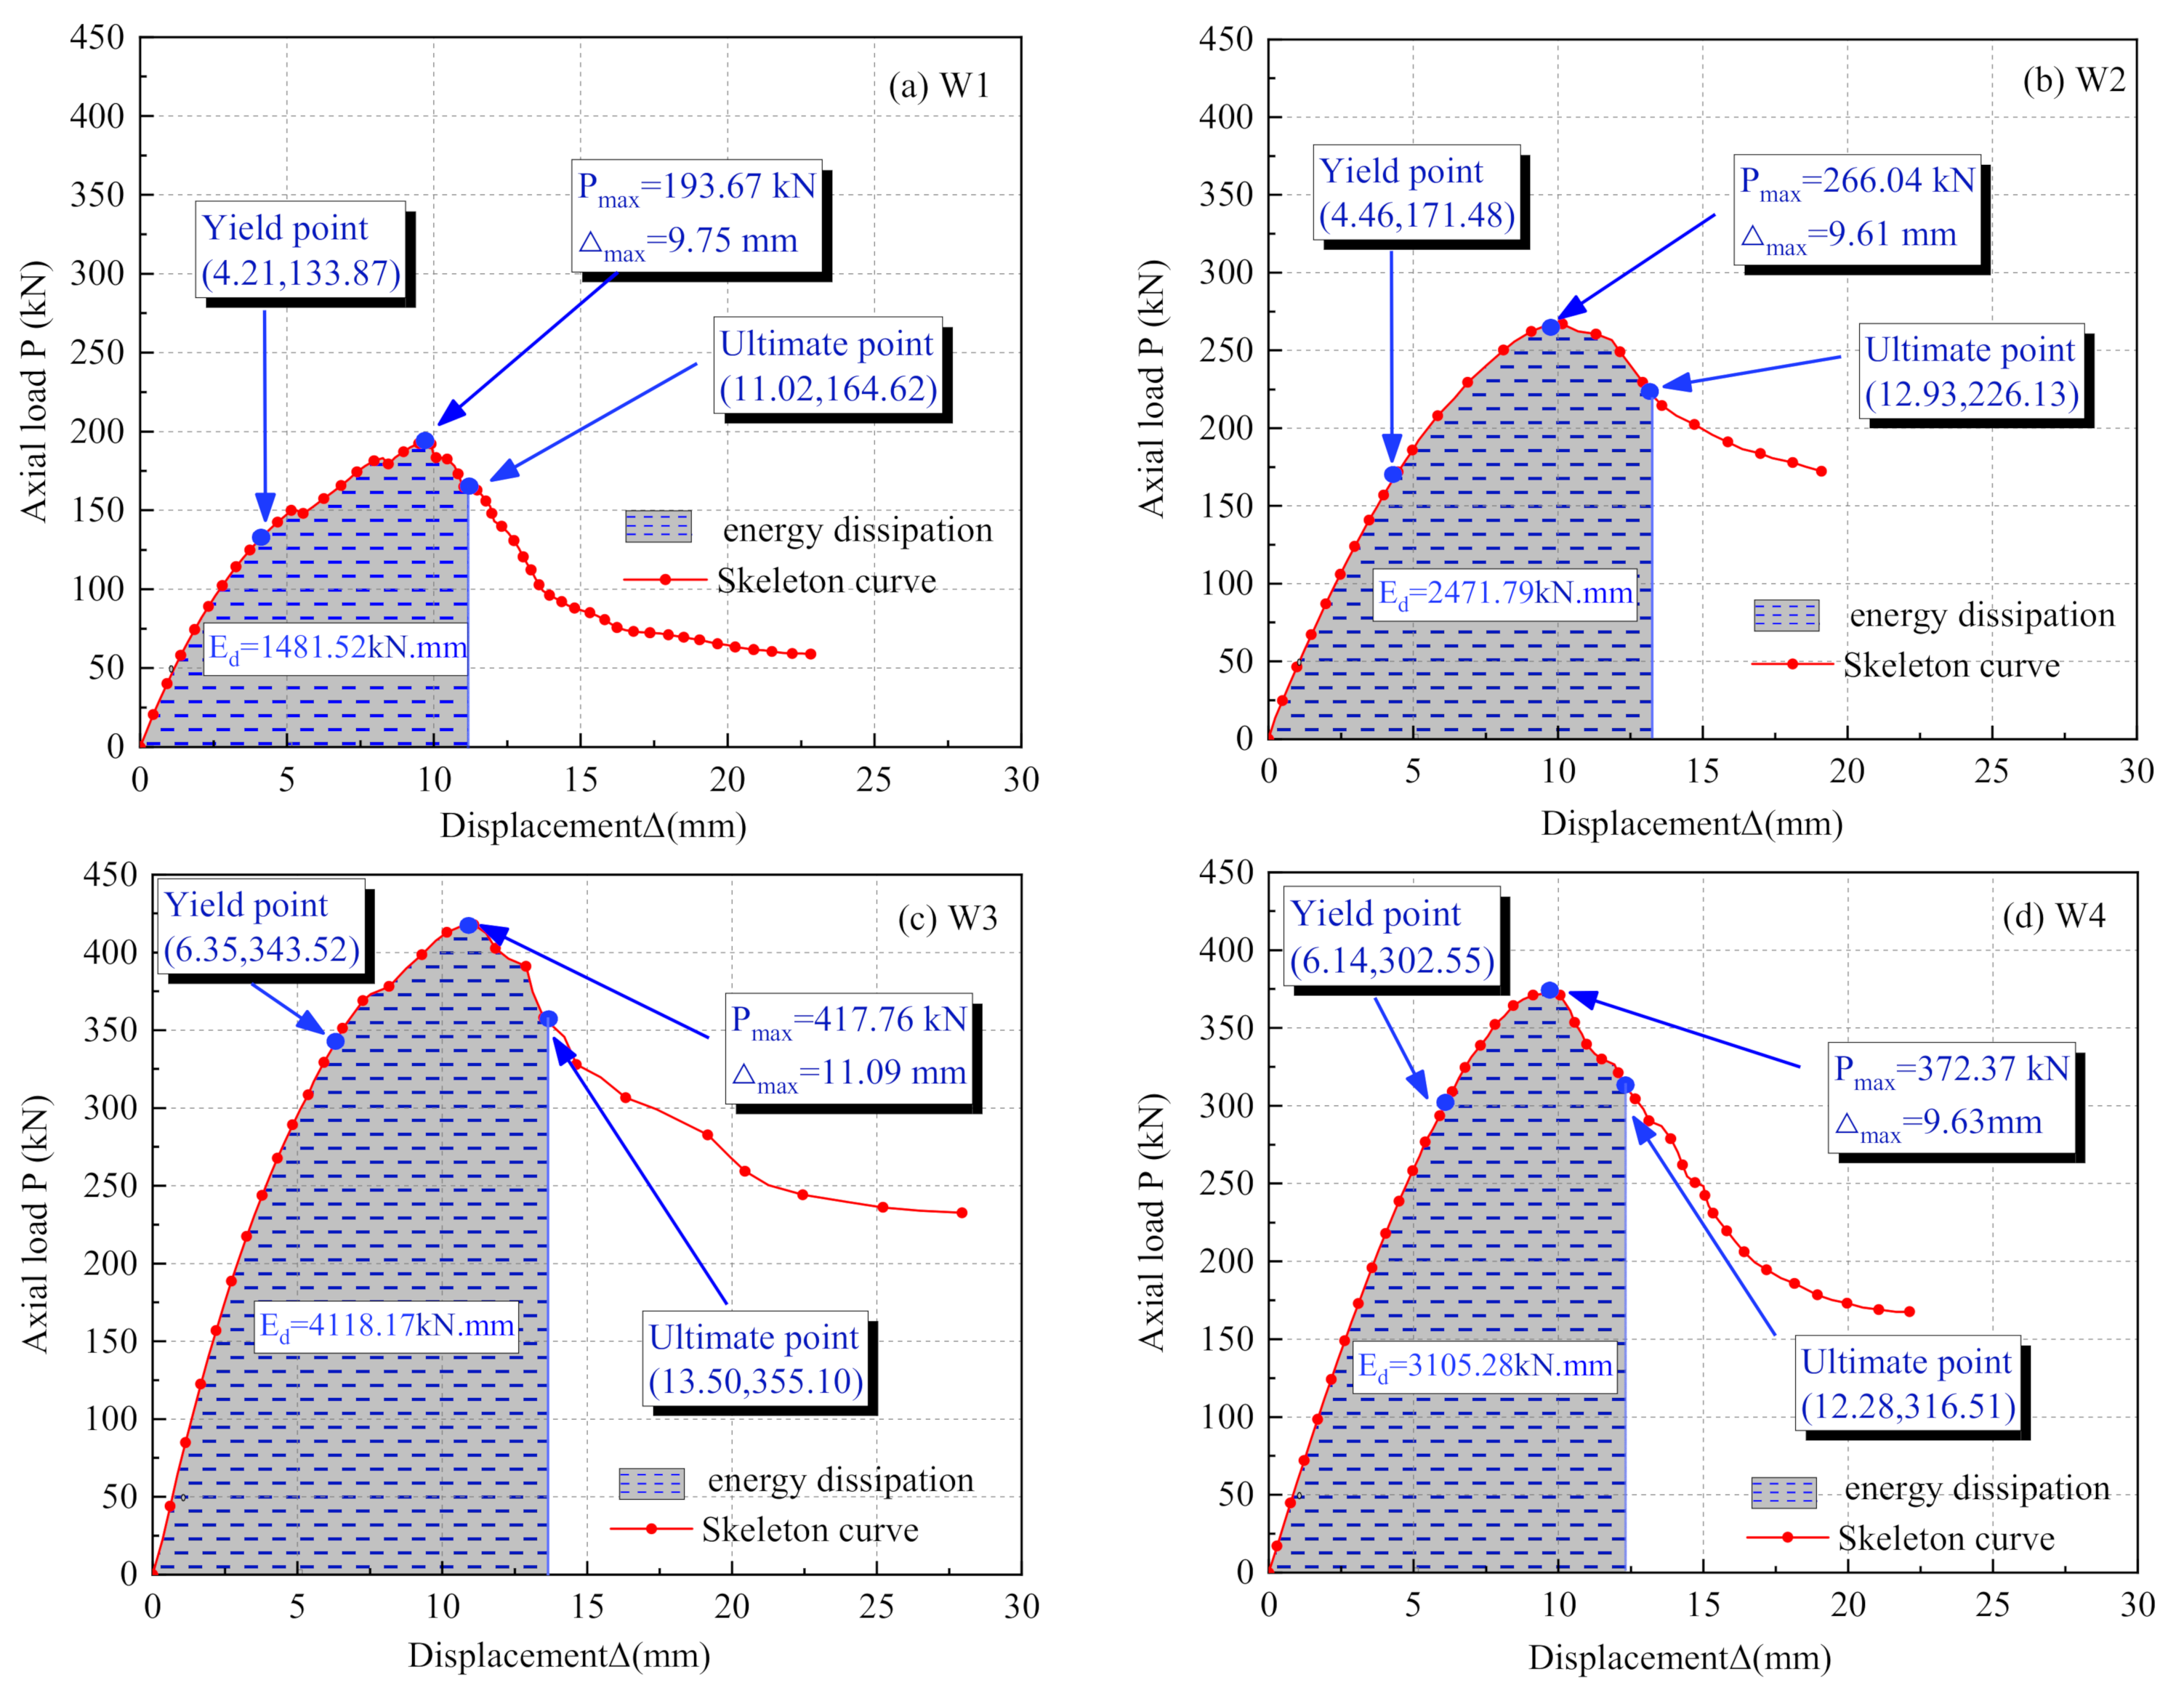
4.1. Vertical Load-Displacement Curve
The measured vertical load-displacement curves of all specimens are illustrated in Figure 9. On the whole, the presented curves are composed of three stages, the elastic stage, the elastic-plastic stage, and the failure stage. In the initial loading stage, four specimens were in the elastic range. The curves remained linear and no obvious damage phenomenon was observed, indicating that the components of the specimen can work together well in the initial stage. For specimen W1, the slope of the curve decreased rapidly as the applied load reached 150 kN, this is due to the fact that local buckling was formed on the end studs. Before the peak state, the curve of specimen W2 is steeper than that of specimen W1, the reason is that the measure of filling PG in the studs increased the axial compression stiffness of the wall. After the peak state, the curve of specimen W2 dropped slowly due to the filling effect of the PG in studs, which displayed an excellent performance of the axial deformation. Compared with specimen W2, the peak load of specimen W3 was significantly improved. This is largely due to two reasons: the first one is that a certain amount of vertical load was borne by the infill PG between the studs, and the second one is that the filling effect of PG between the studs restricted the buckling deformation of the studs. Comparison between specimens W3 and W4 showed that the bearing capacity of specimen W4 is lower than that of specimen W3, this indicates that the constraint effect of wall sheathings can effectively improve the bearing capacity of the specimen.
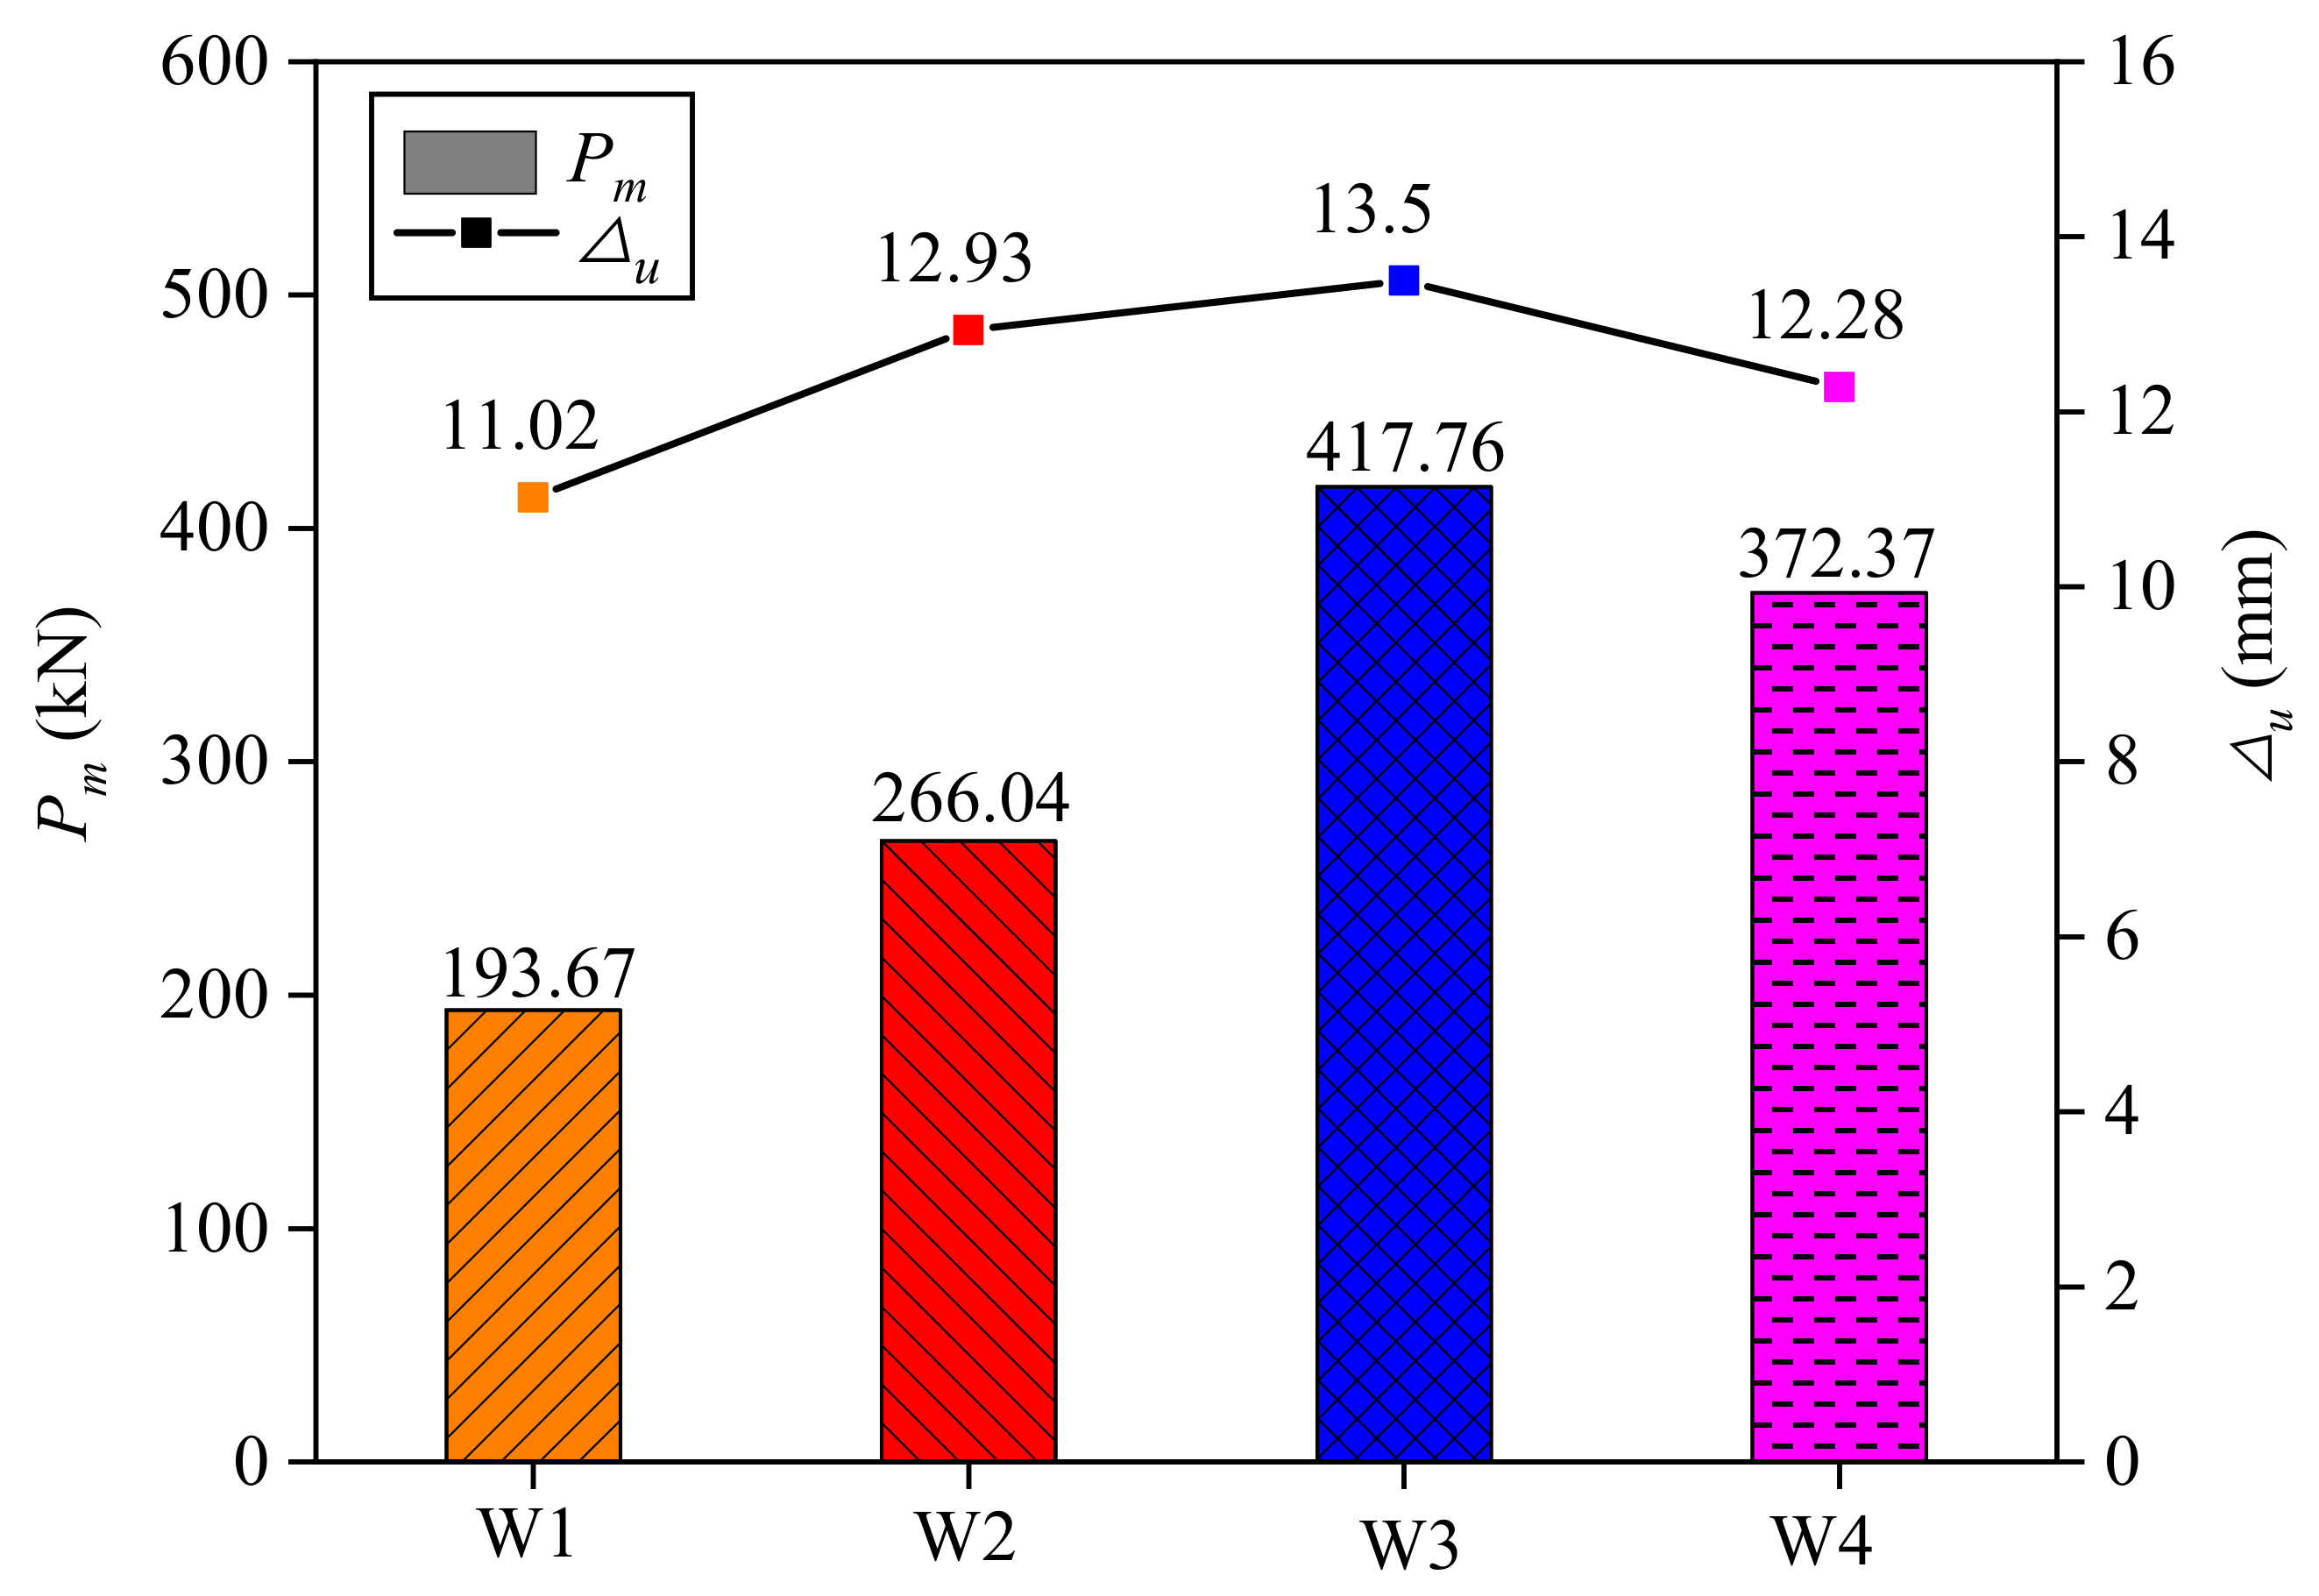
4.2. Analysis of the Axial Bearing Capacity
The peak load and ultimate displacement of each specimen are presented in Figure 10. Compared with specimen W1, the peak load and ultimate displacement of specimen W2 are improved by 37.4% and 17.3%, respectively. The reason for those changes is that filling PG in the studs increased the buckling stability of the steel tube studs and improved the axial bearing capacity of the studs. Moreover, the infill PG can also contribute to the axial bearing capacity of the specimen. Compared with specimen W2, the peak load and ultimate displacement of specimen W3 are increased by 57% and 4.4%, respectively, indicating that filling PG between the studs can significantly improve the axial bearing capacity of the wall, but it has a slight impact on the deformation capacity of the wall. The reasons are as follows: the PG filled between the studs shared part of the vertical load, which leads to the increase in the bearing capacity. Owing to the filling effect of the PG in the studs, the PG filled between the studs has little effect on the buckling performance of the studs. Hence, the deformation capacity of the specimen will not be significantly improved. Compared with specimen W4, the peak load and ultimate displacement of specimen W3 are increased by 12.2% and 9.9%, respectively. This proves that the wall sheathing has a beneficial effect on the bearing capacity and the deformation ability of the wall. In essence, those improvements are due to the constraint effect of the wall sheathing.
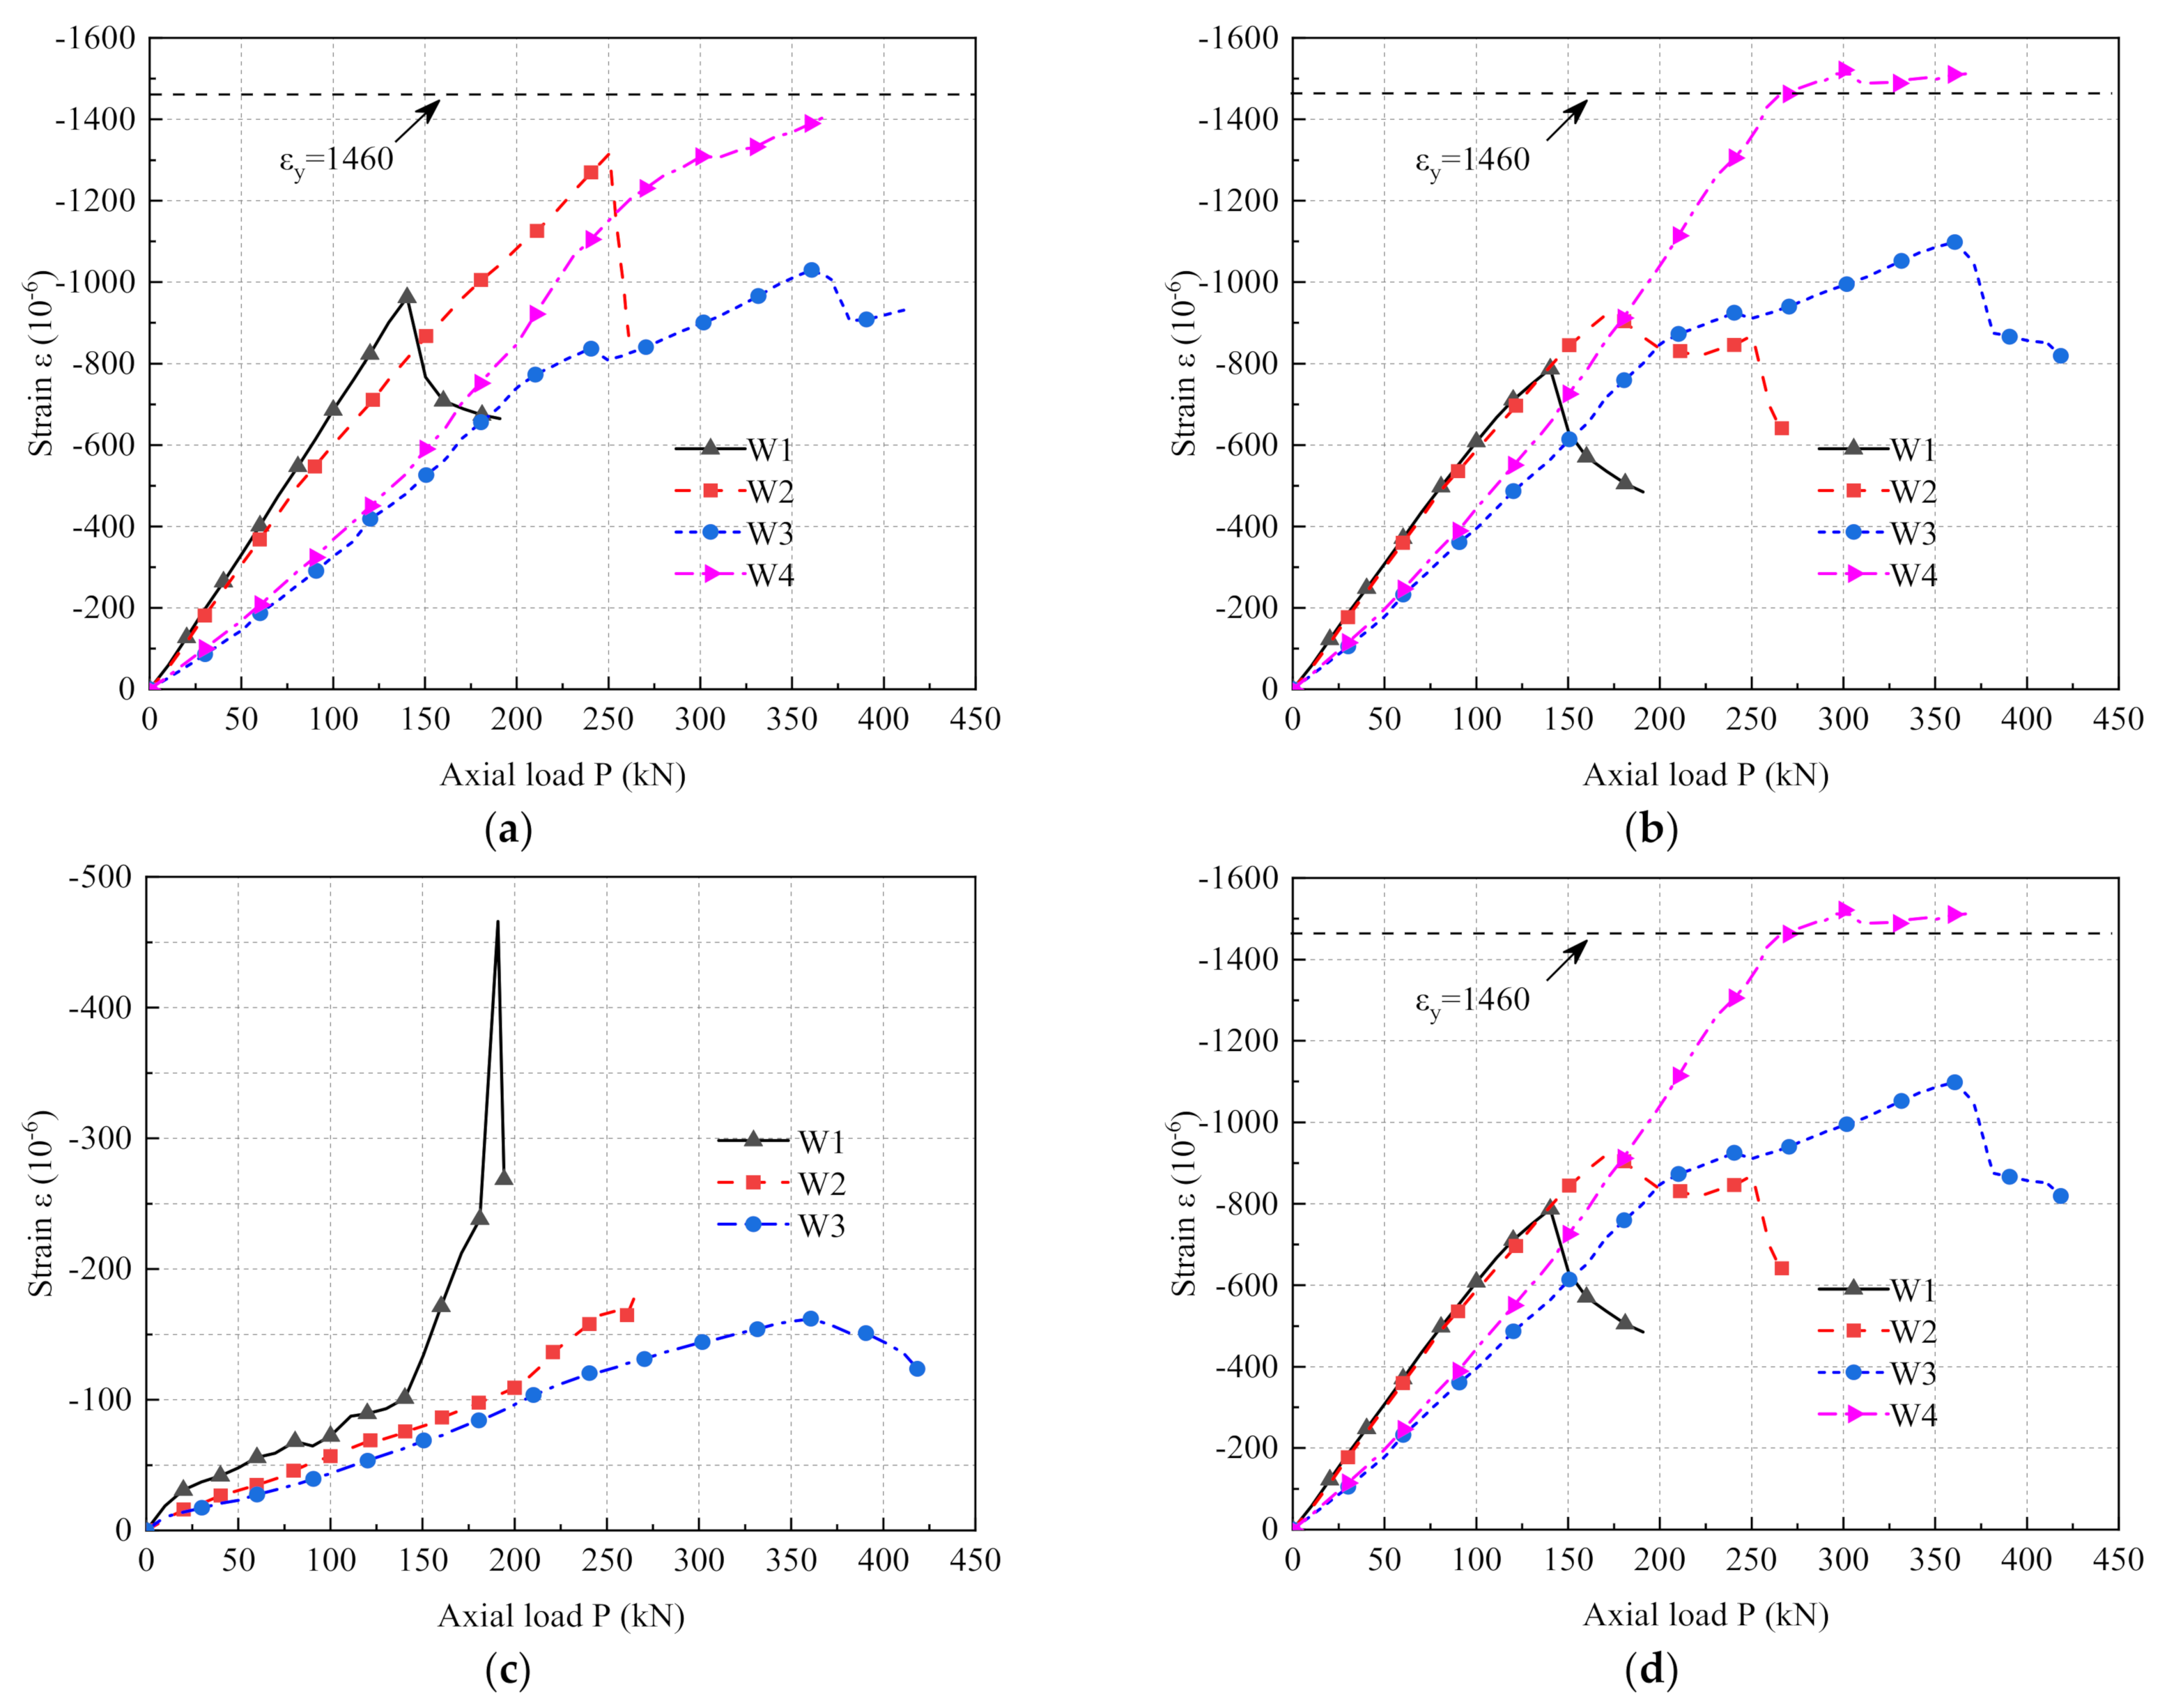
4.3. Strain Analysis
The longitudinal strains of the middle and bottom sections of the end studs are shown in Figure 11a,b, which were obtained from strain gauges 19 and 23, respectively. It can be seen from the figures that the strain curves of specimen W1 dropped rapidly as the specimen entered the yield state, and the strain values of specimen W1 are significantly lower than those of other specimens. This is because the studs of specimen W1 are composed of hollow steel tubes only, the strength of the steel tube is not fully developed due to the buckling distortion of the studs. For specimens W2 and W3, the comparison of the strain curves showed that the strain values of specimen W3 are much higher than those of specimen W2, indicating that the constraint effect of the infill PG between the studs is more beneficial to developing the strength of the steel tubes. The strain values of specimen W3 are also higher than those of specimen W4. It proved that the wall sheathing provided an effective lateral restraint for the CFS frame, which lead to an increase in the axial bearing capacity of the wall.
Figure 11c shows the strain variations of wall sheathings of different specimens, the curves were plotted according to the measured strains of strain gauges 27 and 29. As can be seen from the figure, for the measured maximum strains of wall sheathings, the value of specimen W1 is much higher than those of specimens W2 and W3. This is due to the fact that the buckling distortion of the studs of specimen W1 resulted in load transfer from the studs to the wall sheathings, which led to an increase in stress of the wall sheathings. This is consistent with the failure characteristics of specimens. Moreover, the maximum strain of specimen W3 is similar to that of specimen W2, but the strain curve of specimen W3 has a descending section, indicating that the damage to the wall sheathings can be reduced due to the filling effect of PG filled between the studs.
Figure 11d shows the strain variations of the infill PG of specimens W3 and W4, the strain curves were plotted according to the measured values of strain gauges 11 and 13. It can be seen from the figure that the strains of specimen W3 are lower than those of specimen W4 during the loading process. In general, there are two main reasons for this difference, one is that specimen W4 was not covered with wall sheathings, and most of the load was directly borne by the infill PG, which led to the increase in stress of the PG. The other is that the lateral restraint and load-bearing contribution can be provided by the wall sheathings, which can reduce the burden on PG, resulting in a decrease in the strain of PG.
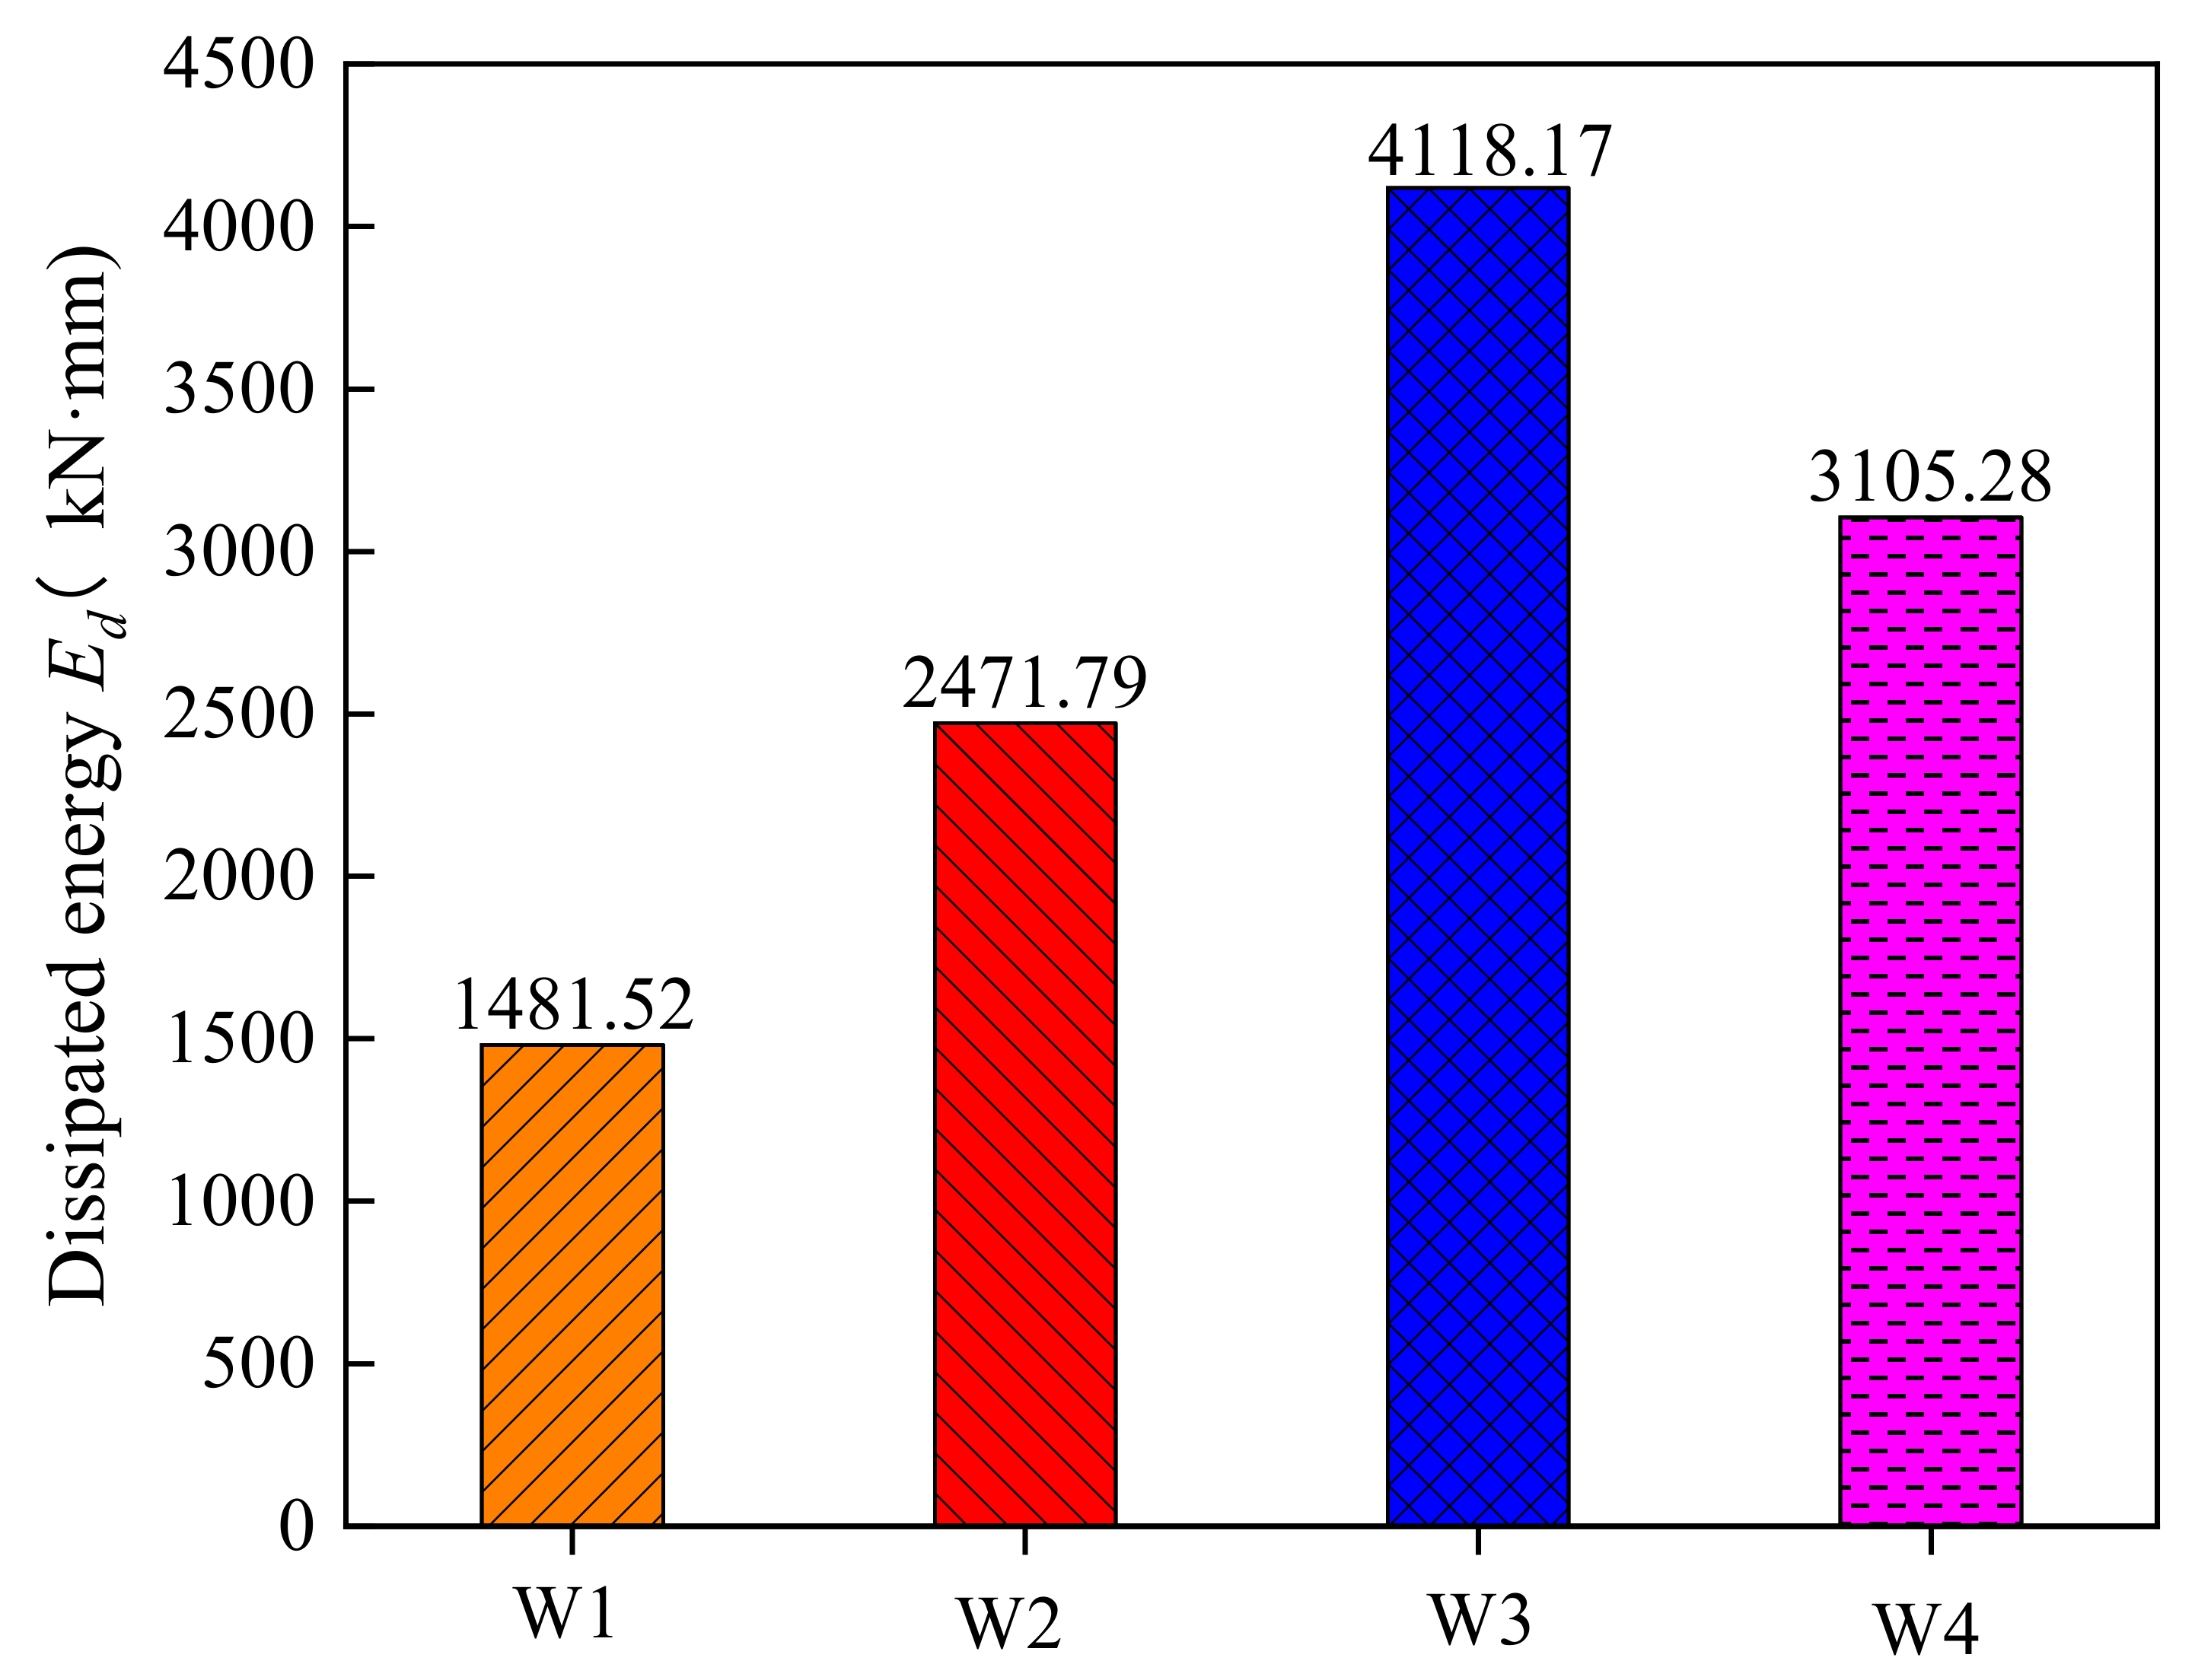
4.4. Energy Dissipation
The energy dissipation capacity can be used to evaluate the axial compression performance of specimens. To quantify the energy dissipation capacity of each specimen, the area enclosed by the load-displacement curve before failure and the horizontal axis can be defined as the dissipated energy of specimens, as shown in Figure 9. After careful calculation, the dissipated energy Ed of all specimens is illustrated in Figure 12. It can be seen from the comparisons that the dissipated energy of specimen W1 is the lowest by comparison with those of other specimens. This is because of the buckling distortion failure of studs, which led to a low-stress level of the steel tubes and reduced the energy dissipation capacity of the specimen. The dissipated energy of specimens W2 and W3 are 2471.79 and 4118.17 kN·mm, respectively, which are 66.8% and 177.9% higher than that of specimen W1. This indicates that filling PG in and between the studs can improve the energy dissipation capacity of CFS walls. In essence, the improvement of the energy dissipation capacity benefits from the load-bearing contribution of PG and the delay of the buckling failure of the steel tube studs. The dissipated energy of specimen W3 is 32.6% higher than that of specimen W4, indicating that the wall sheathing has a certain restraint effect on the CFS frame as well as the infill PG, which can effectively improve the energy dissipation capacity of the specimen.
5. Failure Mechanism
5.1. Analysis of Whole-Process Stress
To study the mechanical behavior of CFS walls filled with PG, the reference specimen W3 was selected for analysis. For this kind of specimen, the main load-bearing components include the studs, the infill PG and wall sheathings, and the studs can also be divided into two parts: the steel tube and the PG filled in the tube. It should be noted that the load-bearing contribution of wall sheathings can be ignored according to Chinese Standard JGJ 227–2011 [23]. Hence, the load-bearing contribution of wall sheathings will be ignored in this study. After simplification, the total bearing capacity (N) of the specimen consists of three parts: the load-bearing contribution of the steel tubes (Ns), the load-bearing contribution of PG filled in the studs (Nd), and the load-bearing contribution of PG filled between the studs (Ng). Ns, Ng, and Nd can be calculated by Equations (1)–(3), respectively. The calculation equations are as follows:
where ε is the measured longitudinal strain of the steel tube, E is the elastic modulus of the steel tube, As and Ag are the section areas of the steel tubes and infill PG, respectively. σg was determined according to the measured strains of PG in the specimen as well as the stress–strain curves of the PG material.
Ns = εEAs
Ng = σgAg
Nd = N − Ns − Ng
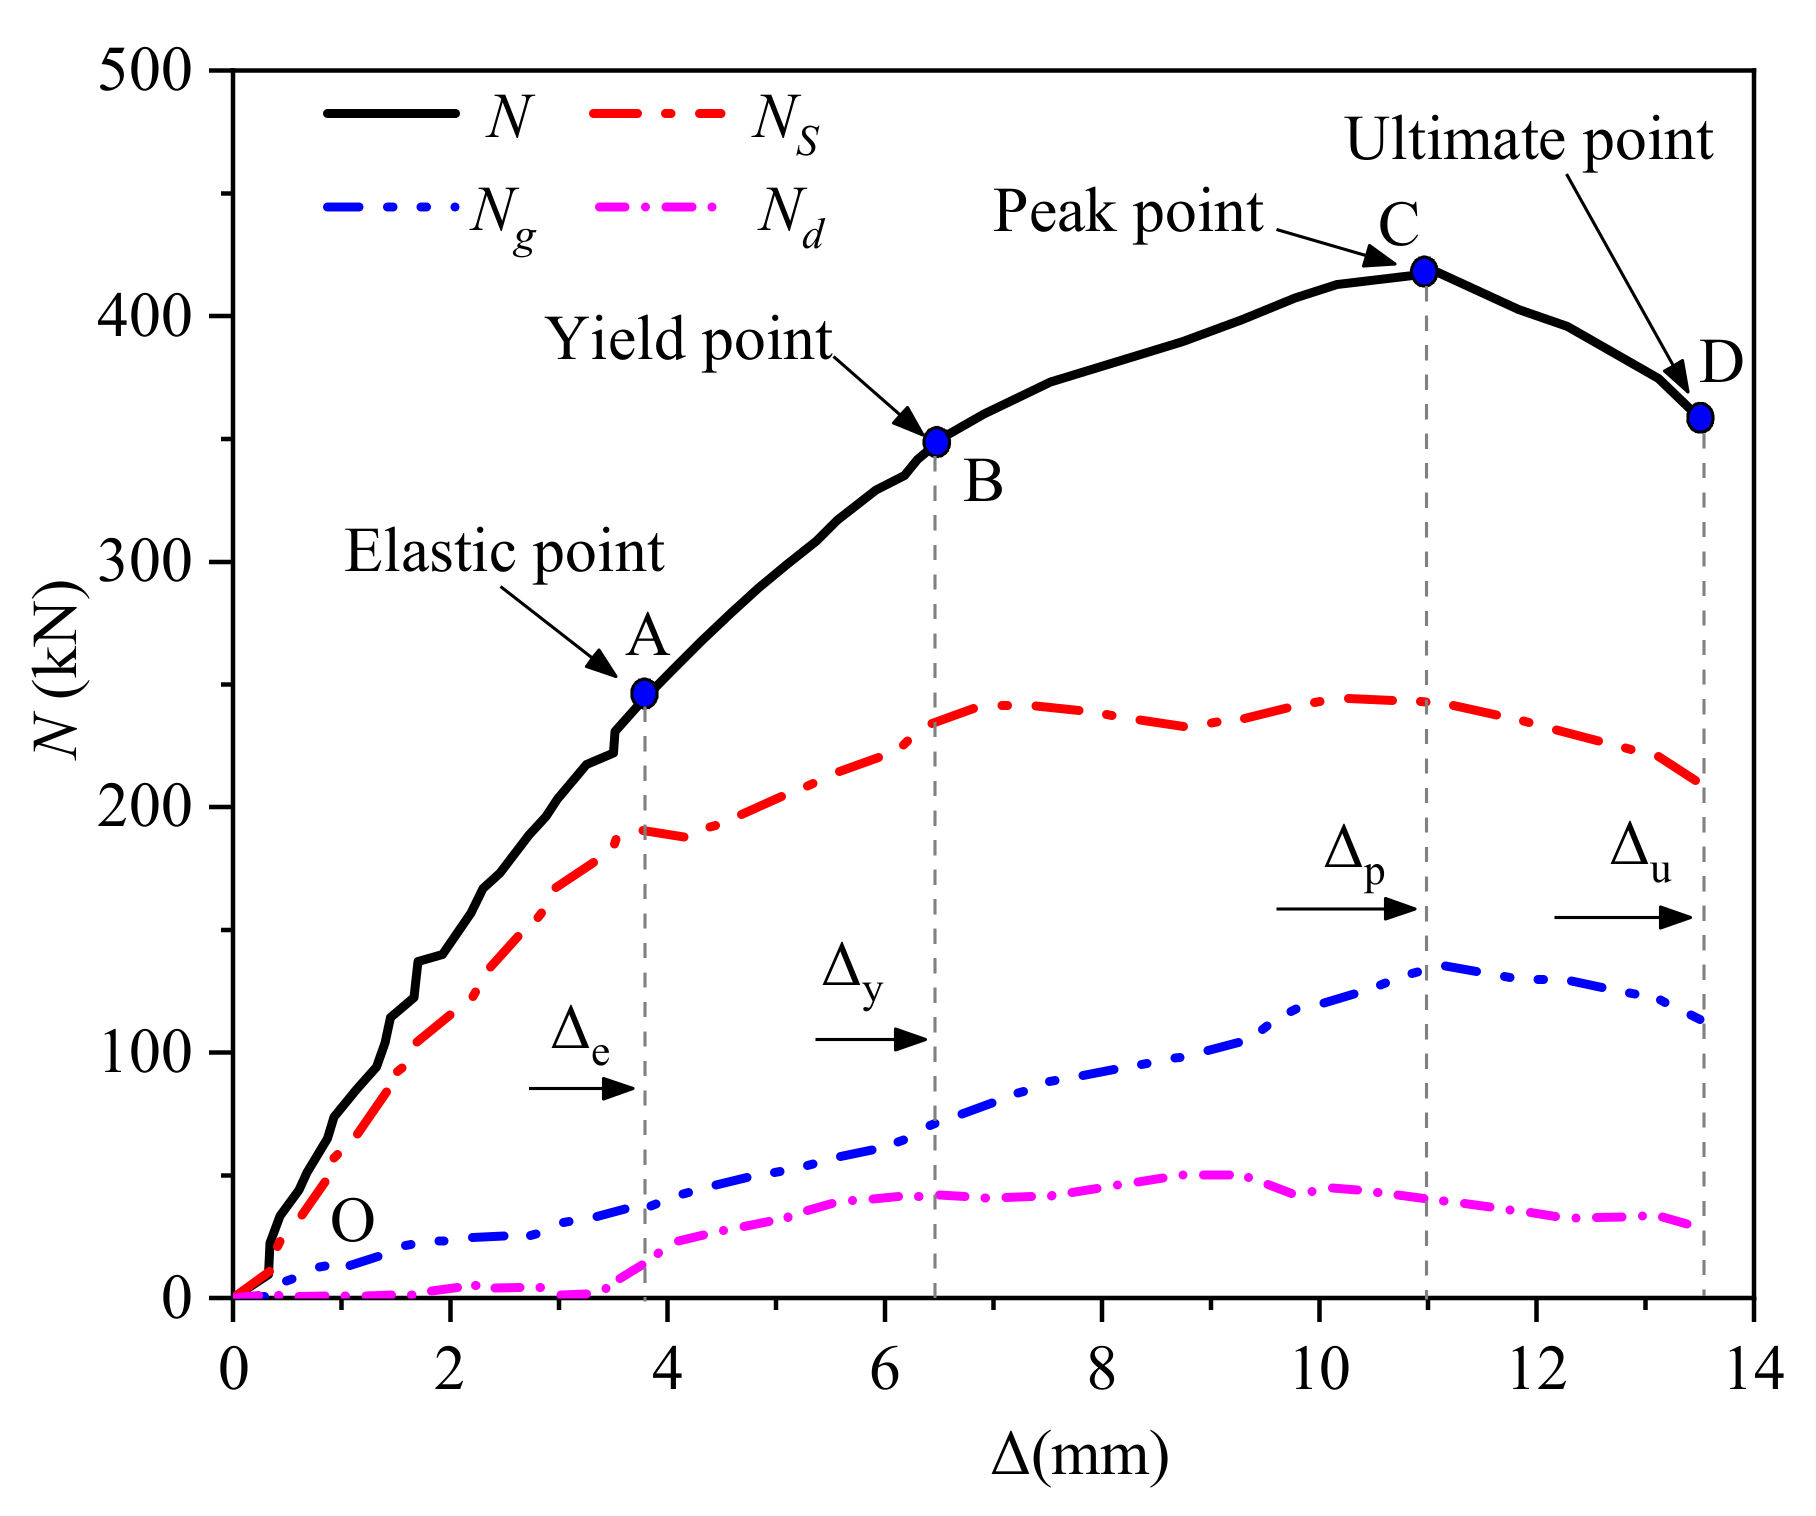
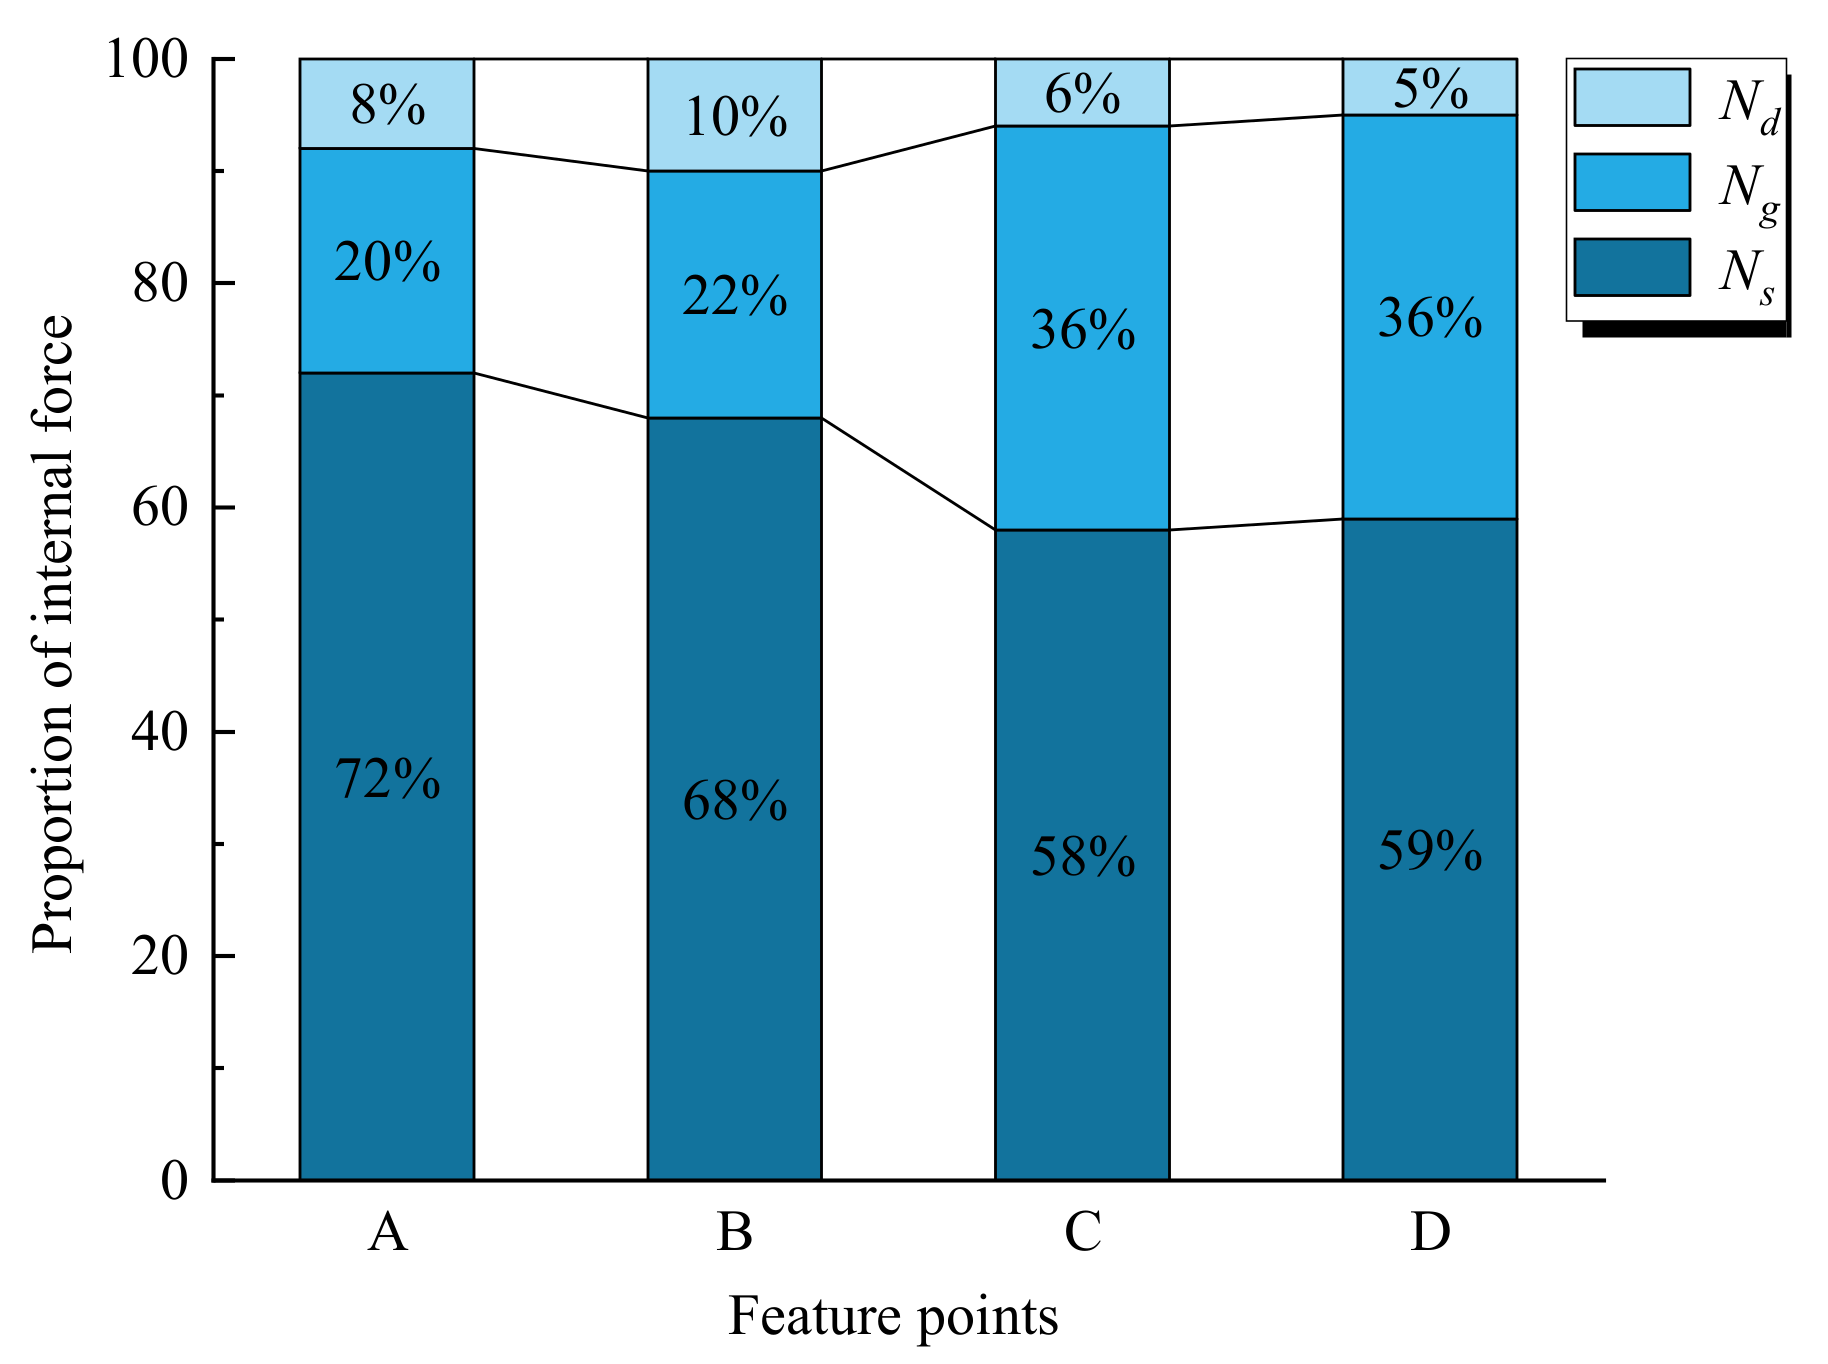
During the loading process of specimen W3, the development of the internal force of different components is shown in Figure 13. The proportion of the internal force at key loading points is shown in Figure 14. It can be found from the figures that the variations of the internal forces can be divided into four segments, as described below.
Segment OA: In this segment, the variations of the internal forces are almost linear, which indicates that the specimen is in an elastic state. Steel tubes shared the most vertical load, followed by PG between the studs and PG in the tubes, the reason is that the vertical load was assigned according to the elastic modulus of materials, while the elastic modulus of steel is much higher than that of PG. When the loading approached point A, obvious turnings were observed on the curves labeled as Ns and Nd. The vertical load borne by PG in the steel tubes increased rapidly, while the vertical load borne by the steel tubes decreased a little, this is caused by the buckling of the steel tubes.
Segment AB: With the increase in the applied vertical load, the bulge of the steel tubes gradually increased. Thus, it can be seen that the load borne by the steel tubes increased slowly, while the load borne by PG increased rapidly. When the loading was implemented from point A to point B, the internal force proportion of the steel tubes decreased from 72% to 68%, while the internal force proportions of PG in and between the studs increased from 8% and 20% to 10% and 22%, respectively.
Segment BC: When the loading exceeded point B, the vertical load borne by the steel tubes was hardly increased. The internal force of PG in the steel tubes also changed little during this loading stage. An interesting phenomenon was also observed, that is, the internal force trend of the steel tubes is opposite to that of the PG in the tubes. However, it should be noted that the vertical load borne by PG between the studs continued to increase during this loading stage. That is to say, the bearing capacity increment of the specimen was contributed by PG between the studs during this loading stage. When the loading was implemented from point B to point C, the internal force proportion of the studs, including the steel tubes and PG in the tubes, was decreased. However, the internal force proportion of the PG between the studs increased from 22% to 36%.
Segment CD: When the loading approached point C, a serious buckling failure occurred at the bottom of the studs, and the PG between the studs was also crushed. Subsequently, the bearing capacity of all components gradually decreased. It should be noted that the decline in internal forces is relatively slow during this stage, which indicates that the specimen has good ductility performance. Moreover, the proportion of the internal force among different components was almost unchanged.
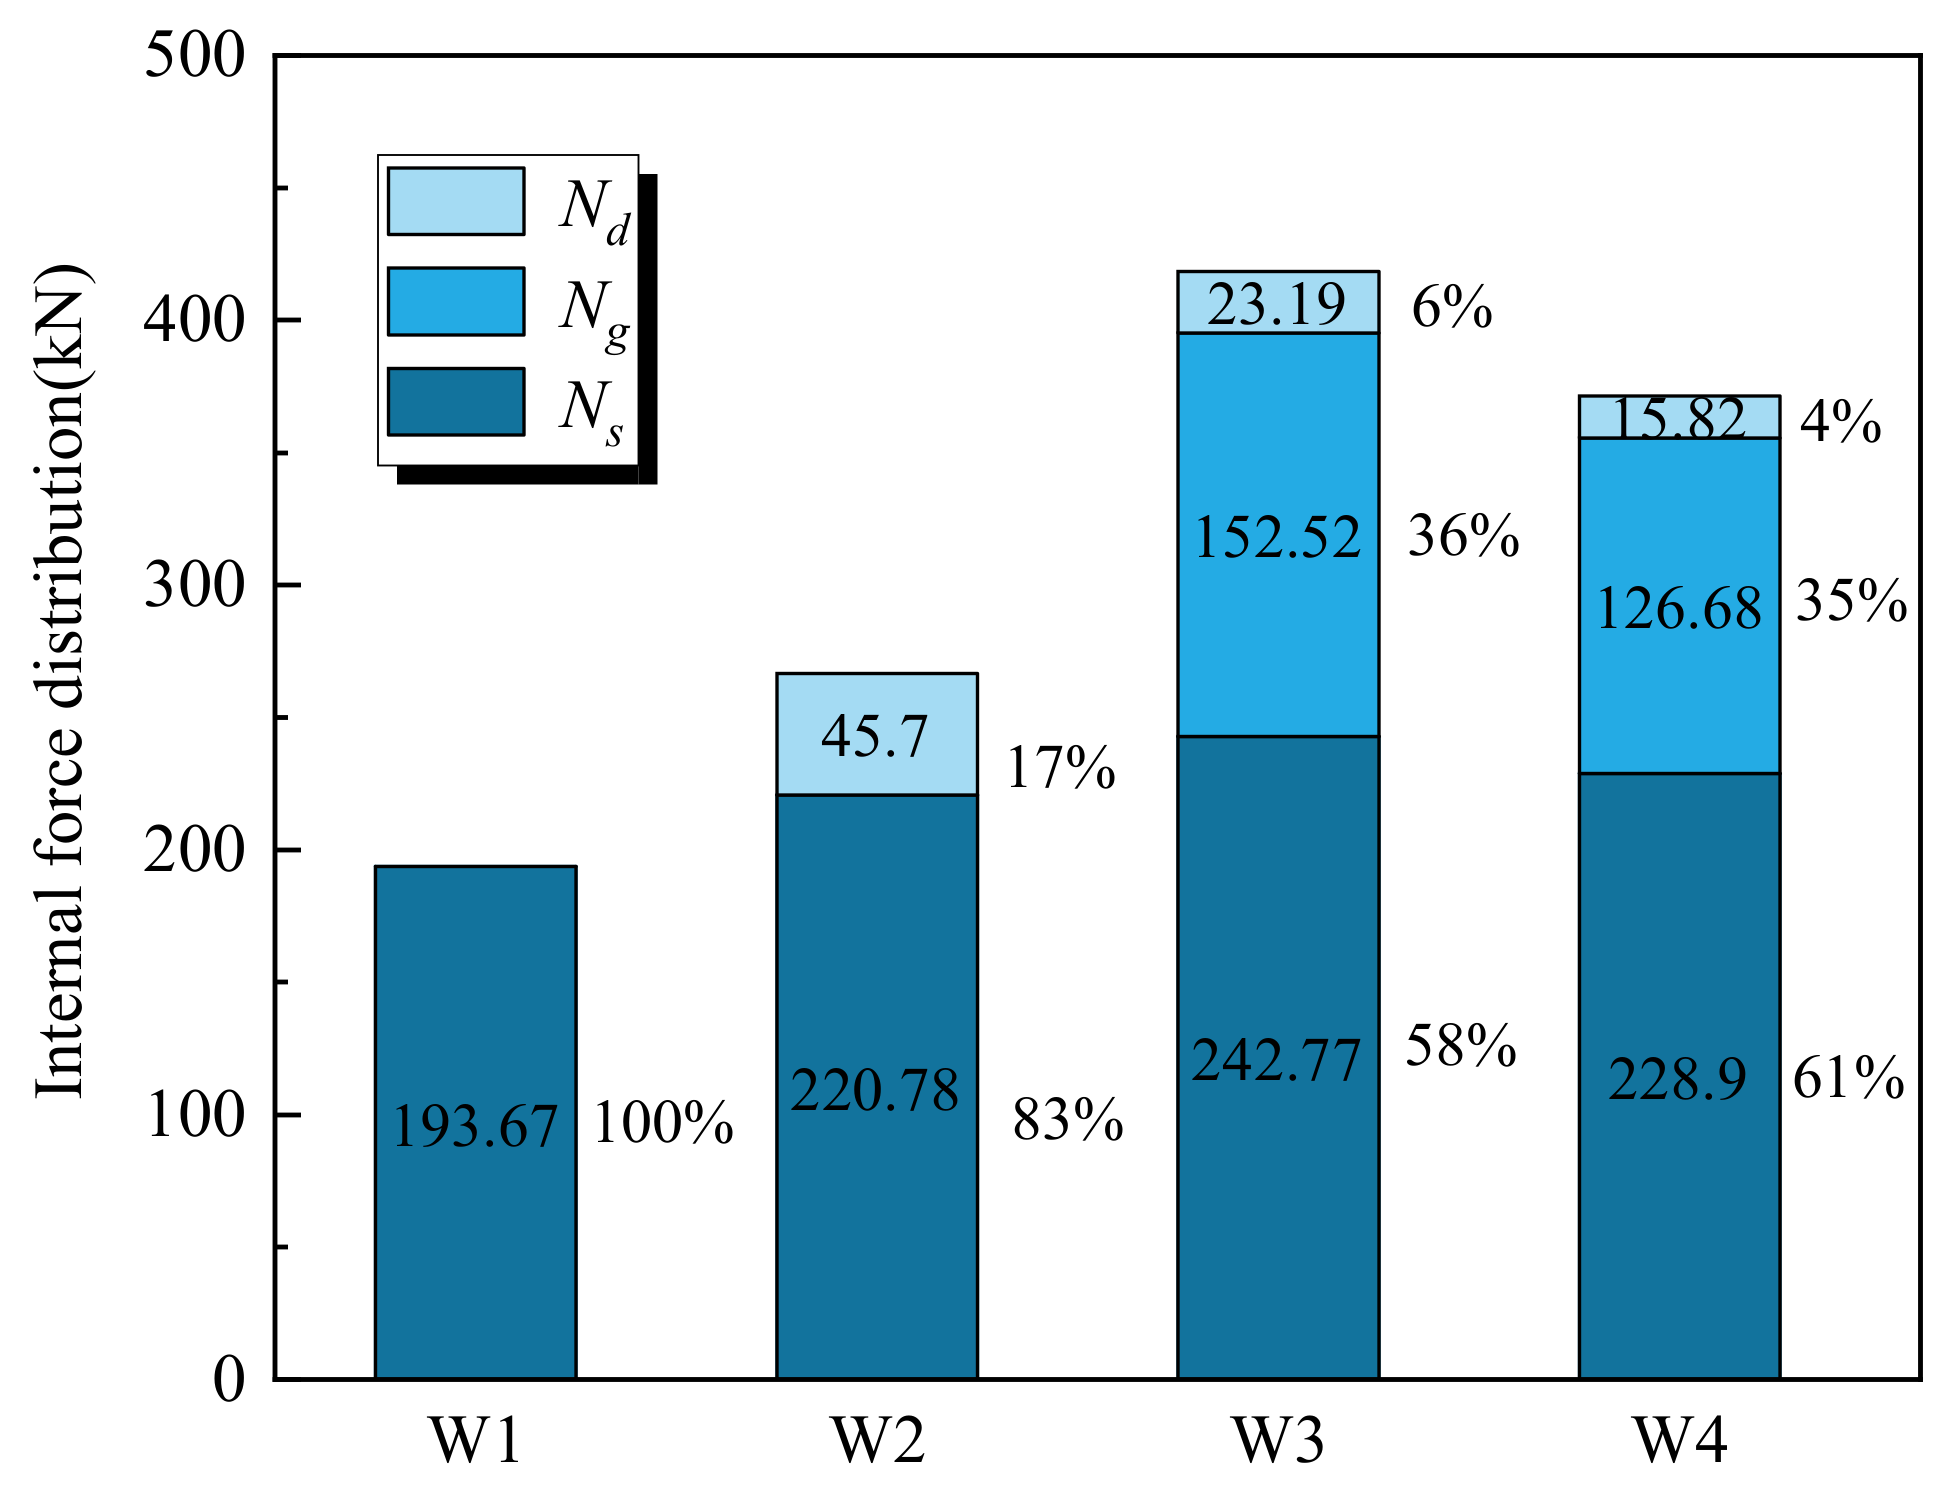
5.2. Contribution Proportions of Components at Peak Point
Based on the above analysis, the contribution of each component to the bearing capacity of the specimen can be obtained. Figure 15 shows the contribution proportions of all components of the four specimens. The bearing capacity of specimen W1 is only contributed by the steel tubes, and the bearing capacity is 193.67 kN. The bearing capacity of specimen W2 is contributed by the steel tubes and PG in the tubes. Compared with specimen W1, the bearing capacity of the steel tubes of specimen W2 is improved by 14%, the reason is that the filled PG in the tubes can effectively improve the buckling behavior of the steel tubes. The bearing capacity of specimen W3 is contributed by the steel tubes, PG in the tubes, and PG between studs. It can be seen from the figure that the contribution of PG between the studs to the bearing capacity exceeded 1/3 of the total bearing capacity. The bearing capacity of the steel tubes of specimen W3 is further improved by comparing it with that of the steel tubes of specimen W2. This is due to the fact that PG between the studs can inhibit the deformation of the steel tubes to a certain extent. The bearing capacity of specimen W4 is also contributed by the steel tubes, PG in the tubes, and PG between the studs. The contribution proportion of each component of specimen W4 is similar to that of specimen W3. However, the bearing capacities of the components of specimen W4 are lower than those of the components of specimen W3. This is because the restraining effect of the wall sheathing on the deformation of the CFS frame can improve the bearing capacity of the wall.
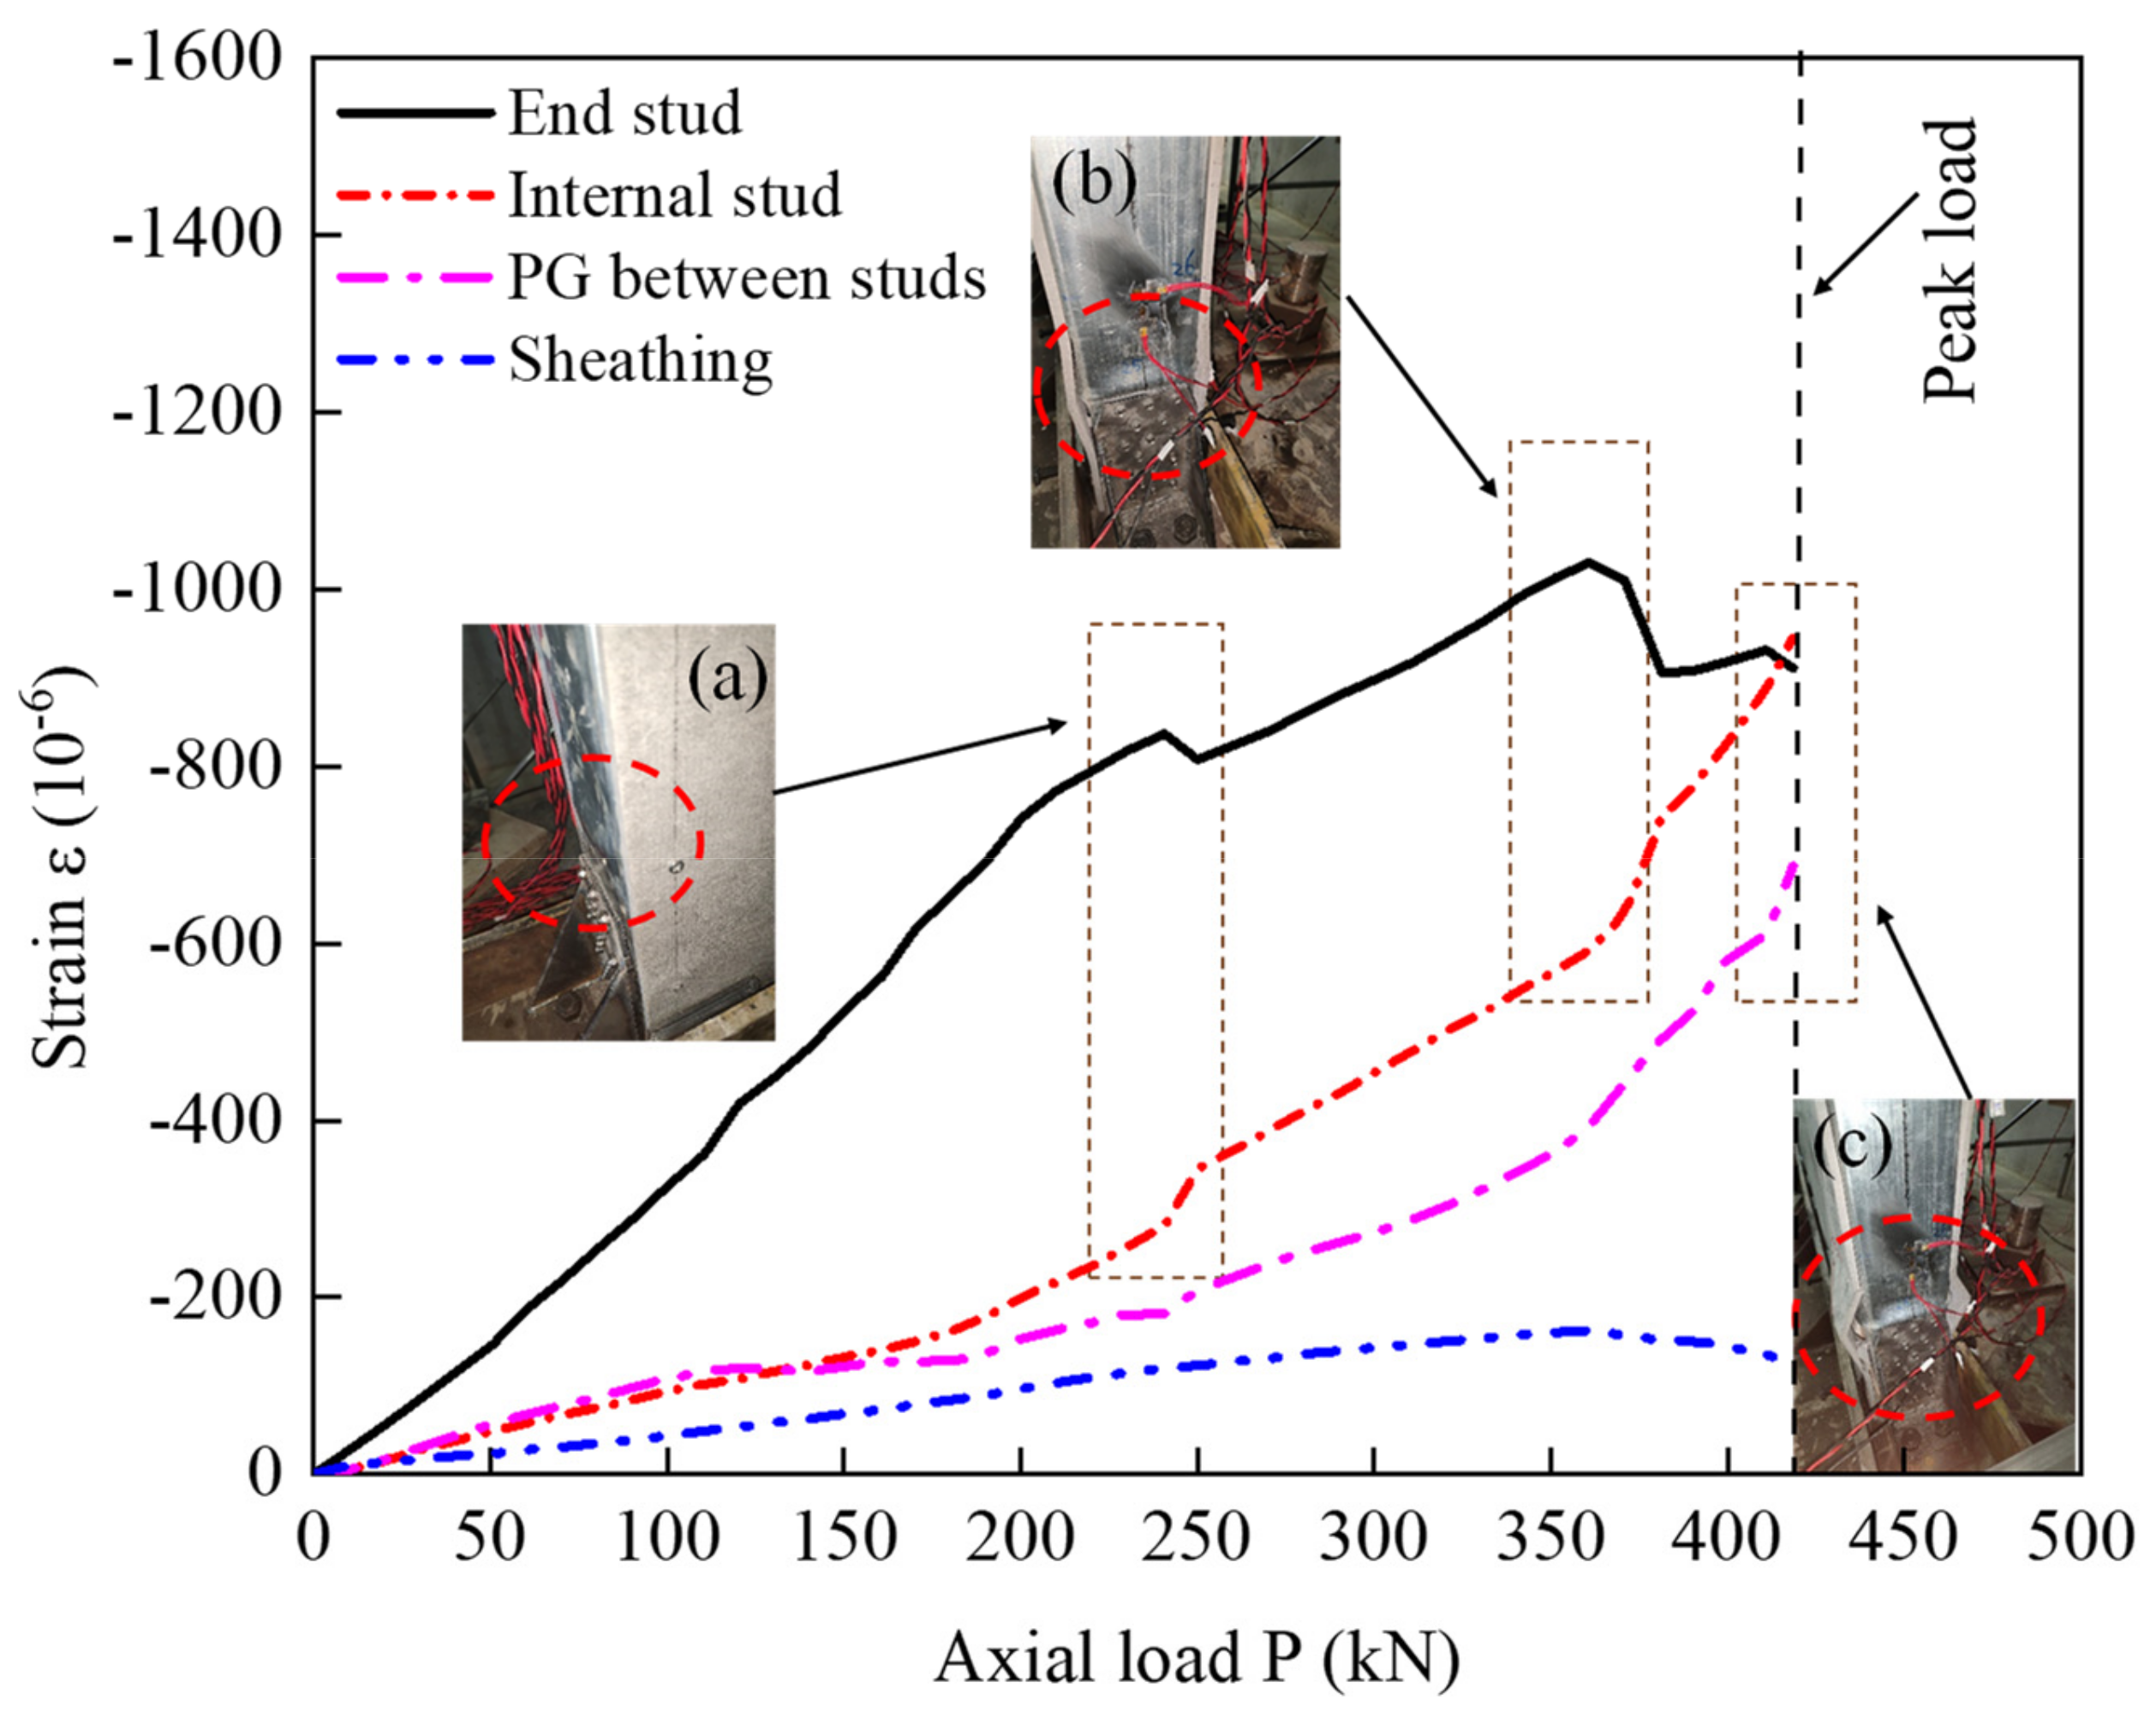
5.3. Analysis of Failure Mechanism
The failure mechanism of specimen W3 was analyzed in combination with Figure 7 and Figure 16. As can be seen from Figure 16, the strain values of PG in and between the studs are small during the initial loading stage. This is because the axial compression stiffness of the steel tubes was much higher than that of PG, most of the applied vertical load was transmitted to the steel tubes, and only a small part of the load was borne by PG.As the applied load increased to 250 kN, that is the demarcation point of the specimen entered from the elastic state to the elastic-plastic state. An obvious turning was found on the strain curve of the end steel tube, this is due to the buckling of the end stud, as shown in Figure 16a. The comparison between the strains of the end and internal studs shows that the strain value of the internal stud is lower than that of the end stud. This is because the internal stud of the wall was constrained by PG on the left and right sides, and the deformation is relatively small. While the end stud was subjected to axial pressure as well as the extrusion pressure of PG, so the measured strain value is relatively large. In addition, it is also found that the trend of the strain of the internal stud is almost opposite to that of the strain of the end stud. This is because the buckling of the end stud resulted in a part of the applied load transferred from the end stud to the internal stud. Subsequently, the strain of PG between the studs increased rapidly, indicating that most of the newly applied vertical load was transferred to PG between studs, and several diagonal cracks were observed on the surface of PG between studs, as illustrated in Figure 7. The occurrence of diagonal cracks is the result of the combination of the axial compression and the transversal expansion. When the applied load reached 355 kN (the yield point of the specimen), sudden changes in the strain curves of the end and internal studs were observed, this is due to the serious buckling of the end studs. Since the increase in the out-of-plane bulge of the wall sheathing, which was caused by the excessive buckling of the studs, the strain curve of the wall sheathing began to fall. The constraint effect of the wall sheathing gradually decreased, as shown in Figure 16b.When the applied load reached the bearing capacity of the specimen, the serious buckling of the end studs led to the reduction in the strain, as shown in Figure 16c. Despite the internal stud and the PG between the studs still having a certain bearing capacity, the overall load-bearing capacity of the specimen began to decline.
6. Summary and Conclusions
This study examined the possibility of utilizing PG as a filling material in CFS walls, four full-scale specimens were tested to investigate the axial compression performance of the walls. The load-displacement curve, bearing capacity, strain, and energy dissipation capacity of each specimen were analyzed in detail. In addition, the failure mechanism of the specimens was also investigated. Based on the experimental and analytical results, the following conclusions can be drawn:
(1) Filling PG in CFS walls can effectively reduce the damage to the wall components. It can be found from the failure characteristics that filling PG in the studs improved the buckling behavior of the steel tubes, and filling PG between the studs reduced the damage to wall sheathings.
(2) Filling PG in CFS walls can effectively increase the bearing capacity of the wall. Compared with the cavity wall specimen, the bearing capacity of the wall filled with PG in the studs is increased by 37.4%, and the bearing capacity of the specimen filled with PG in and between the studs is increased by 115.7%. The wall sheathing also contributed to the bearing capacity of the wall.
(3) The wall specimens filled with PG have an obvious higher energy dissipation capacity than the cavity wall specimen. The dissipated energy of the specimen filled with PG in and between the studs is 177.9% higher than that of the cavity wall specimen. This indicates that filling PG has a great impact on the energy dissipation of the wall.
(4) The internal force analysis of components during the loading process shows that the steel tubes and PG play an important role in the load-bearing capacity of the wall. In the early loading stage, the load-bearing contribution of the steel tubes is obvious. However, the load-bearing contribution of PG to the wall is prominent in the later loading stage.
(5) For specimens filled with PG in and between studs, the trend of the strain of the end stud is almost opposite to that of the strain of the internal stud. The reason is that the buckling of the end stud led to the internal force redistribution among the components. The buckling of the stud led to the out-of-plane bulge of the wall sheathing, which decreased the constraint effect of the wall sheathing.
Author Contributions
Investigation, Data curation, Writing—original draft preparation, C.Y.; Conceptualization, Resources, Writing—review and editing, Supervision, Funding acquisition, Project administration, L.Z.; Investigation, Data curation, Q.Z.; Investigation, Data curation, Y.X. All authors have read and agreed to the published version of the manuscript.
Funding
This research work was financially supported by the National Natural Science Foundation of China (Grant No. 52068007), the Science and Technology Foundation of Guizhou Province (Grant No. QKHJC [2020]1Y417) and the Research Project of Introducing Talents in Guizhou University (Grant No. GDRJHZ [2019]08).
Institutional Review Board Statement
Not applicable.
Informed Consent Statement
Not applicable.
Data Availability Statement
No data are included.
Conflicts of Interest
The authors declare that they have no known competing financial interest or personal relationship that could have appeared to influence the work reported in this paper.
References
- Iuorio, O.; Fiorino, L.; Landolfo, R. Testing CFS structures: The new school BFS in Naples. Thin-Walled Struct. 2014, 84, 275–288. [Google Scholar] [CrossRef]
- Kaleeswaran, C.; Saravanakumar, R.; Vivek, D.; Elango, K.S.; Gopi, R.; Balaji, D. A study on cold-formed steel compression member-a review. Mater. Today 2021, 37, 1767–1771. [Google Scholar] [CrossRef]
- Miller, T.H.; Pekoz, T. Behavior of cold-formed steel wall stud assemblies. J. Struct.Eng. 1993, 119, 641–651. [Google Scholar] [CrossRef]
- Miller, T.H.; Pekoz, T. Behavior of gypsum-sheathed cold-formed steel wall studs. J. Struct. Eng. 1994, 120, 1644–1650. [Google Scholar] [CrossRef]
- Telue, Y.; Mahendran, M. Behavior of cold-formed steel wall frames lined with plasterboard. J. Constr. Steel Res. 2001, 57, 435–452. [Google Scholar] [CrossRef]
- Telue, Y.; Mahendran, M. Behavior and design of cold-formed steel wall frames lined with plasterboard on both sides. Eng. Struct. 2004, 26, 567–579. [Google Scholar] [CrossRef]
- Tian, Y.S.; Wang, J.; Lu, T.J. An experimental study on the axial behavior of cold-formed steel wall studs and panels. Thin-Walled Struct. 2004, 42, 557–573. [Google Scholar] [CrossRef]
- Wang, J.; Tian, Y.S.; Lu, T.J. The role of frame members and sheathing in partition wall panels subjected to compression. Thin-Walled Struct. 2005, 43, 983–1002. [Google Scholar] [CrossRef]
- Tian, Y.S.; Wang, J.; Lu, T.J. Axial load capacity of cold-formed steel wall stud with sheathing. Thin-Walled Struct. 2007, 45, 537–551. [Google Scholar] [CrossRef]
- Kashan, K.H.; Chen, Z.H.; Liu, J.D.; Arsalan, K.H.; Khadija, J. Axial compression behaviours of tubular sectioned C-shape continuous-supported steel walls in MSB. J. Constr. Steel Res. 2022, 188, 107009. [Google Scholar]
- Lawson, R. Light steel modular construction high-rise modular building, London three storey modular office building modular residential building four sided modules form of construction. SCI Steel Knowl. 2016, 1, 1–8. [Google Scholar]
- Hou, J.; Wang, X.; Liu, J.; Chen, Z.; Zhong, X. Study on the stability bearing capacity of multi-column wall in modular steel building. Eng. Struct. 2020, 214, 110648. [Google Scholar] [CrossRef]
- Zhang, X.H.; Zhang, E.Y.; Yu, H. Axial compression performance of cold-formed thin-walled square steel stud-straw board composite wall. Sci. Tech. Eng. 2021, 21, 283–289. (In Chinese) [Google Scholar]
- Hegyi, P.; Dunai, L. Experimental study on ultra-lightweight-concrete encased cold-formed steel structures Part I: Stability behaviour of elements subjected to bending. Thin-Walled Struct. 2016, 101, 75–84. [Google Scholar] [CrossRef]
- Hegyi, P.; Dunai, L. Experimental investigations on ultra-lightweight-concrete en-cased cold-formed steel structures Part II: Stability behaviour of elements subjected to compression. Thin-Walled Struct. 2016, 101, 100–108. [Google Scholar] [CrossRef]
- Prabha, P.; Marimuthu, V.; Saravanan, M.; Palani, G.S.; Lakshmanan, N.; Senthil, R. Effect of confinement on steel-concrete composite light-weight load-bearing wall panels under compression. J. Constr. Steel Res. 2013, 81, 11–19. [Google Scholar] [CrossRef]
- Chao, H.W.; Zhou, T. Cold-formed steel framing walls with infilled lightweight FGD gypsum Part II: Axial compression tests. Thin-Walled Struct. 2018, 32, 771–782. [Google Scholar]
- Chen, J.W.; Gao, K.F. Experimental study on axial compression performance of cold-formed steel framing walls with infilled gypsum based material. Build. Sci. 2018, 34, 48–53. (In Chinese) [Google Scholar]
- Wang, J.F.; Wang, R.Z.Q. Experiments and calculation methods on performance of prefabricated clad-formed steel (CFS)composite walls filled with light mortar under axial compression. Indus. Constr. 2021, 51, 99–105. (In Chinese) [Google Scholar]
- Li, H.X.; Liu, D.Z.; Wu, S.Y. Bearing characteristic research of composite foam-concrete wall reinforced with cold-formed thin-wall section steel. Indus. Constr. 2020, 50, 160–169. (In Chinese) [Google Scholar]
- Bianca, R.S.; Calderón, M.; Antonio, G.M.; Paloma, P.; Rafael, G.T. Valorization of phosphogypsum in cement-based materials: Limits and potential in eco-efficient construction. J. Build. Eng. 2021, 44, 102506. [Google Scholar]
- Pereira, M.V.; Geraldo, R.H.; Cruz, A.M.; Gladis, C. Valorization of industrial by-product: Phosphogypsum recycling as green binding material. Cleaner Eng. Tech. 2021, 5, 100310. [Google Scholar] [CrossRef]
- JGJ 227-2011; Technical Specification for Low-Rise Cold-Formed Thin-Walled Steel Buildings. Architecture Industrial Press of China: Beijing, China, 2011.
- GB/T 228.1-2010; Metallic Materials-Tensile Testing-Part 1: Method of Test at Room Temperature. China Standard Press: Beijing, China, 2010.
- GB/T 50081-2019; Standard for Test Methods of Concrete Physical and Mechanical Properties. Architecture Industrial Press of China: Beijing, China, 2019.
- GB/T17657-1999; Test Method for Physical and Chemical Properties of Wood-Based Panels and Veneer Panels. Architecture Industrial Press of China: Beijing, China, 1999.
Figure 1.
Dimensions and details of specimens. (a) Specimen W1; (b) specimen W2; (c) specimen W3; (d) specimen W4.
Figure 1.
Dimensions and details of specimens. (a) Specimen W1; (b) specimen W2; (c) specimen W3; (d) specimen W4.

Figure 2.
Mechanical properties of steel and PG between studs. (a) Stress–strain curves of steel; (b) stress–strain curves of PG between studs.
Figure 2.
Mechanical properties of steel and PG between studs. (a) Stress–strain curves of steel; (b) stress–strain curves of PG between studs.

Figure 3.
Test loading device.

Figure 4.
Arrangement of measuring instruments. (a) Locations of LVDTs; (b) locations of the studs and PG gauges; (c) locations of sheathing gauges.
Figure 4.
Arrangement of measuring instruments. (a) Locations of LVDTs; (b) locations of the studs and PG gauges; (c) locations of sheathing gauges.

Figure 5.
Failure of specimen W1.

Figure 6.
Failure of specimen W2.

Figure 7.
Failure of specimen W3.

Figure 8.
Failure of specimen W4.

Figure 9.
Vertical load–displacement curves.

Figure 10.
Bearing capacity and ultimate displacement.

Figure 11.
Axial load–strain curves. (a) Strains of the middle section of the end stud; (b) strains of the bottom section of the end stud; (c) strains of wall sheathings; (d) strains of the infill PG.
Figure 11.
Axial load–strain curves. (a) Strains of the middle section of the end stud; (b) strains of the bottom section of the end stud; (c) strains of wall sheathings; (d) strains of the infill PG.

Figure 12.
Energy dissipation of specimens.

Figure 13.
Internal force analysis during loading.

Figure 14.
Proportion of internal force at key loading points.

Figure 15.
Contribution proportions of components.

Figure 16.
Strain analysis of components.


Table 1.
Design parameters of specimens.
| Specimen | Track Size (mm) | Stud Size (mm) | Stud Spacing (mm) | PG in Studs | PG between Studs | FCB |
|---|---|---|---|---|---|---|
| W1 | U106 × 50 × 1.94 | 100 × 100 × 1.48 | 500 | No | No | Yes |
| W2 | U106 × 50 × 1.94 | 100 × 100 × 1.48 | 500 | Yes | No | Yes |
| W3 | U106 × 50 × 1.94 | 100 × 100 × 1.48 | 500 | Yes | Yes | Yes |
| W4 | U106 × 50 × 1.94 | 100 × 100 × 1.48 | 500 | Yes | Yes | No |
Table 2.
Mechanical properties of steel.
| Thickness (mm) | Yield Stress (MPa) | Ultimate Stress (MPa) | Elastic Modulus (MPa) | Poisson’s Ratio |
|---|---|---|---|---|
| 1.5 | 372.32 | 451.75 | 2.55 × 10⁵ | 0.31 |
| 2.0 | 270.35 | 372.85 | 2.00 × 10⁵ | 0.34 |
Table 3.
Mechanical properties of PG.
| Name | Compressive Strength (MPa) | Elastic Modulus (MPa) | Poisson’s Ratio |
|---|---|---|---|
| PG in studs | 6.01 | 3829 | 0.21 |
| PG between studs | 5.57 | 3419 | 0.21 |
Table 4.
Mechanical properties of FCB.
| Name | Compressive Strength (MPa) | Elastic Modulus (MPa) | Poisson’s Ratio |
|---|---|---|---|
| FCB | 23.32 | 1.42 × 10⁴ | 0.26 |
Publisher’s Note: MDPI stays neutral with regard to jurisdictional claims in published maps and institutional affiliations. |
© 2022 by the authors. Licensee MDPI, Basel, Switzerland. This article is an open access article distributed under the terms and conditions of the Creative Commons Attribution (CC BY) license (https://creativecommons.org/licenses/by/4.0/).
Share and Cite
MDPI and ACS Style
Yin, C.; Zhou, L.; Zou, Q.; Xu, Y. Effect of Filling Phosphogypsum on the Axial Compression Behavior of Cold-Formed Thin-Walled Steel Walls. Buildings 2022, 12, 1325. https://doi.org/10.3390/buildings12091325
AMA Style
Yin C, Zhou L, Zou Q, Xu Y. Effect of Filling Phosphogypsum on the Axial Compression Behavior of Cold-Formed Thin-Walled Steel Walls. Buildings. 2022; 12(9):1325. https://doi.org/10.3390/buildings12091325
Chicago/Turabian StyleYin, Chao, Li Zhou, Qingyu Zou, and Yifeng Xu. 2022. "Effect of Filling Phosphogypsum on the Axial Compression Behavior of Cold-Formed Thin-Walled Steel Walls" Buildings 12, no. 9: 1325. https://doi.org/10.3390/buildings12091325
Note that from the first issue of 2016, this journal uses article numbers instead of page numbers. See further details here.