
A Kano–IS Model for the Sustainable Renovation of Living Environments in Rural Settlements in China

1
School of Architectural Science and Engineering, Yangzhou University, Yangzhou 225127, China
2
Department of Architecture, National Taiwan University of Science and Technology, #43, Sec.4, Keelung Rd., Taipei 106, Taiwan
*
Author to whom correspondence should be addressed.
Buildings 2022, 12(8), 1230; https://doi.org/10.3390/buildings12081230
Submission received: 8 July 2022
/
Revised: 9 August 2022
/
Accepted: 12 August 2022
/
Published: 13 August 2022
(This article belongs to the Special Issue Digital and Intelligent Approaches for Sustainable Architectural Design)
Abstract
:By 2020, there will be 2.36 million natural villages in China, with more than 500 million people living in them. Although China’s 2018 “National Rural Revitalization Strategy” has clarified the importance of the rural environment, the sustainability of living environments in rural settlements is generally ignored. However, current renovation work is implemented as per the same set of standards and is not sufficient to reach the highest satisfaction levels and sustainable development because the optimal renovation indicators are not selected according to local conditions. To address these issues, this work carried out a series of literature reviews and expert interviews to propose indicators applicable to the sustainable renovation of living environments in rural settlements in China. The questionnaire survey was conducted in a typical Chinese village in order to verify the feasibility of this decision model. Furthermore, the Kano model was organically combined with the importance–satisfaction (IS) model from the villagers’ point of view to establish a model analyzing the optimal indicators of the sustainable renovation. The results show that this model determines the priority of elements that need to be improved or maintained, based on which village administrators can make better management decisions and which government managers can invest limited government resources in key sectors, thus creating sustainable living environments in rural settlements and enhancing the satisfaction of villagers. It is suggested that the opinions of village administrators and planners be considered to optimize this model further.
1. Introduction
The United Nations Human Settlements Program emphasizes the sustainable development of human settlements at different levels, such as in cities, towns, and villages [1,2]. Sustainable design is a philosophy adopted by people concerned with the health of society and the natural environment [3]. Sustainable rural development is essential for conserving and improving resources, while economic growth contributes to a better standard of living [4]. By 2020, there will be 2.36 million natural villages in China, with more than 500 million people living in them. Although China’s 2018 “National Rural Revitalization Strategy” has clarified the importance of the rural environment, the sustainability of living environments in rural settlements is generally ignored [5,6]. In recent years, China has continued updating and renovating the rural environment under the rural vitalization strategy [7]. However, the current renovation effect is unsatisfactory for the following reasons. First, since villages are mainly renovated based on the government’s top-down decisions, the real demands of villagers cannot be fully understood to maximize their satisfaction. Second, the expected results cannot be achieved with existing renovation indicators that are selected by uniform standards. This is because the demands of villagers will change with the natural geographical environments in different villages, and accordingly, their living environments should be renovated according to different local conditions. All in all, it is difficult for the government to determine which renovation indicators will achieve maximum satisfaction.
Village administrators and scholars have evaluated and studied the livability level of rural settlements in China using various methods to create a healthier environment and have obtained good results [8,9,10]. Given China’s vast territory, the western and eastern regions differ greatly in economic culture, while the southern and northern regions differ significantly in climate. Therefore, the Five-Year Action Plan for Managing and Improving the Rural Living Environment (2021–2025) issued by the Chinese government explicitly stipulates that the policies for renovation will be adjusted based on the degree of economic development in different rural areas, and classified guidance will be provided according to local conditions [11]. In addition to the difference in economic and social development, which is considered in setting renovation tasks and criteria for different villages in various districts, counties, and cities, the will of the villagers will also be fully respected during the environmental renewal, thus building a mechanism of co-construction, co-administration, joint evaluation, and sharing among the government, village collectives, villagers, and local respected persons [12,13]. This is also an important measure to promote the sustainable development of living environments in rural settlements.
Recent research shows that the living environments in rural settlements are mainly studied from the viewpoints of renovation and design, along with evaluation methods. Among these, the use of an artificial intelligence algorithm or geographic information science method to construct the evaluation model of rural environmental space has been used by many scholars [14,15,16]. In addition, some studies have mentioned indicators of the social dimension of sustainable development in rural areas [17] and constructed an index system of rural environmental suitability in terms of plant landscape, activity space, and humanistic care [16]. However, the results of the study still fall within the evaluation system suitable for rural ageing. There is no complete system regulating renovation indicators for sustainable rural living environments. The desire to successfully promote rural renovation depends not only on the physical properties of the living environment, but also on the psychological environmental variables of its inhabitants [18]. Resident satisfaction has been consistently recognized as one of the most influential factors for achieving residential quality of life [19,20,21]. These statements justify the establishment of a decision-making agreement that takes into account the renovation of the habitat and personal factors. Therefore, rural renovation should be a combination of “top-up” and “bottom-up” [9], and all villagers should be encouraged to participate. While resident participation is important for renovation effectiveness, this factor is often overlooked in top-down policy implementation in places such as China [8]. However, the existing research does not take into account the various psychological needs and the improvement of satisfaction among residents of rural settlements [22]. Often, the sustainable renovation of rural settlements cannot take into account all aspects, particularly the priority of renovation strategies limited by economic costs.
This study proposes an analytical model based on the Kano–IS method that is suitable for determining the priority of indicators of the sustainable renovation in rural human settlements in China. There were three main research objectives: (1) establishing a set of sustainable renovation indicators for living environments in rural settlements in China; (2) taking Fengxiang Village in China as an example, starting with the needs of the villagers, using the Kano–IS model to find the key and priority indicators that need to be maintained or improved; and (3) discussing the application of the Kano–IS model for management decision makers in sustainable rural environmental renovation projects.
The contribution of this study is to apply a Kano–IS integration model to guide the planners and designers of rural settlements and rural government managers to make more scientific decisions in the early stages of sustainable transformation projects for human settlements and focus on the actual needs of villagers to improve their satisfaction and happiness with their lives. Different villages have various living environments and perceptions. Therefore, the priorities of the reconstruction indicators obtained using the Kano–IS model will vary in different rural communities. This study only takes Fengxiang Village as an example for an empirical demonstration. The model can be applied to the designing and planning of rural environments and the decision making of the government in other parts of China, meaning that it has far-reaching application prospects. Meanwhile, under the strategy of rural revitalization in China, the model can be applied to improve the sustainable development of rural areas.
2. Literature Review
2.1. Living Environments in Rural Settlements
Rural settlements are the spatial carriers of rural people’s living, production, cultural inheritance, and other socio-economic activities [22]. Living environments in rural settlements refer to the totality of various natural and artificially transformed natural factors within the scope of rural areas centered on rural residents. It includes the land, atmosphere, water, flora and fauna, traffic, roads, loops, structures, et cetera, within the area. Protecting the rural environment is conducive to the sustainable, stable, and coordinated development of the rural economy and society. At the same time, there is also a need to protect the physical and mental health of rural residents. In recent years, the Chinese government has promoted rural environmental renovation projects on an unprecedented scale from top to bottom, eager to improve the life satisfaction and well-being of villagers [23].
2.2. Sustainable Renovation for Living Environments
In September 2015, the United Nations jointly adopted the 2030 Agenda for Sustainable Development. Among the priorities, “Sustainable Urban Development and Livable Garden Community (SUC)” is included in the 11th goal, aiming to build inclusive, safe, resilient, and sustainable cities and human settlements. The future goal is to further build sustainable rural settlements [24]. Rural sustainable development is a strategic design activity that constructs and develops sustainable solutions, including environmental and resource sustainability [20,25,26]. Currently, relevant studies on the sustainable renovation of living environments mainly focus on evaluation dimensions, frameworks, and evaluation methods. In terms of evaluation, many scholars focus on evaluating multiple objective material aspects, such as society, culture, system, economy, technology, and ecological environments [20,25,27]. How to transform rural settlements to achieve sustainable development has been the goal of various scholars in recent years. In the practice of rural development, each village has different resource endowments and different socio-economic and cultural backgrounds and will form different experiences during development. These diverse experiences provide multiple possibilities for rural revitalization. Due to the great differences in rural areas, China does not have a unified rural revitalization model that can be imitated. Therefore, rural revitalization needs to be maximally inclusive and allow various forms of experimentation [11]. However, the indicators for the sustainability of rural settlements are still being explored. Human survival and development are the dominant factors in the sustainable development of the living environments of rural settlements. Studies have found that the knowledge, ability, and willingness of residents determine whether the community can continue to prosper [28,29], and community members need to actively participate. Community governance contributes to the sustainable renovation of rural settlements [30].
2.3. Analysis Models for Sustainable Renovation
To promote the sustainable development of living environments in rural settlements, government departments and scholars from different disciplines are constantly exploring the mode and path for sustainable development. How the renovation measures can meet the needs of occupants in an all-around manner has attracted public attention. Previous studies have applied regression analyses to identify environmental correlations and assess their importance in influencing residence satisfaction [31,32]. However, residents living in different urban communities have varying needs and differing satisfaction levels [33]. There are many studies on decision support systems that combine built environments and resident psychology to facilitate and simplify overall decision making by collecting residents’ responses to participatory surveys [34,35]. However, research on sustainable environmental renovation in rural areas is still lacking. This is because the residential density and natural environment in rural settlements in China are quite different from urban communities. Gao [36] explored an ideal approach to constructing a traditional rural revitalization model based on sustainable tourism. The model proposes an effective way of successfully achieving rural revitalization on three levels (material, social, and spiritual). In essence, the optimization and reconstruction model of sustainable rural reconstruction, combined with residents’ satisfaction, is still an important link in the current rural revitalization plan [37].
3. Methods
3.1. Delphi Method
The Delphi method was originally developed during the cold war by the RAND Corporation in Santa Monica, California, during the 1950s and 1960s [38]. It was designed for use with complex or ambiguous problems that exceed the capabilities of a single person [39]. The Delphi method is characterized by anonymous group interactions and responses, multiple rounds of questioning, and group feedback between rounds [40]. Through multiple rounds of questionnaires, expert consensus will be gradually obtained, thereby removing low-impact items [41].
3.2. The Kano Model
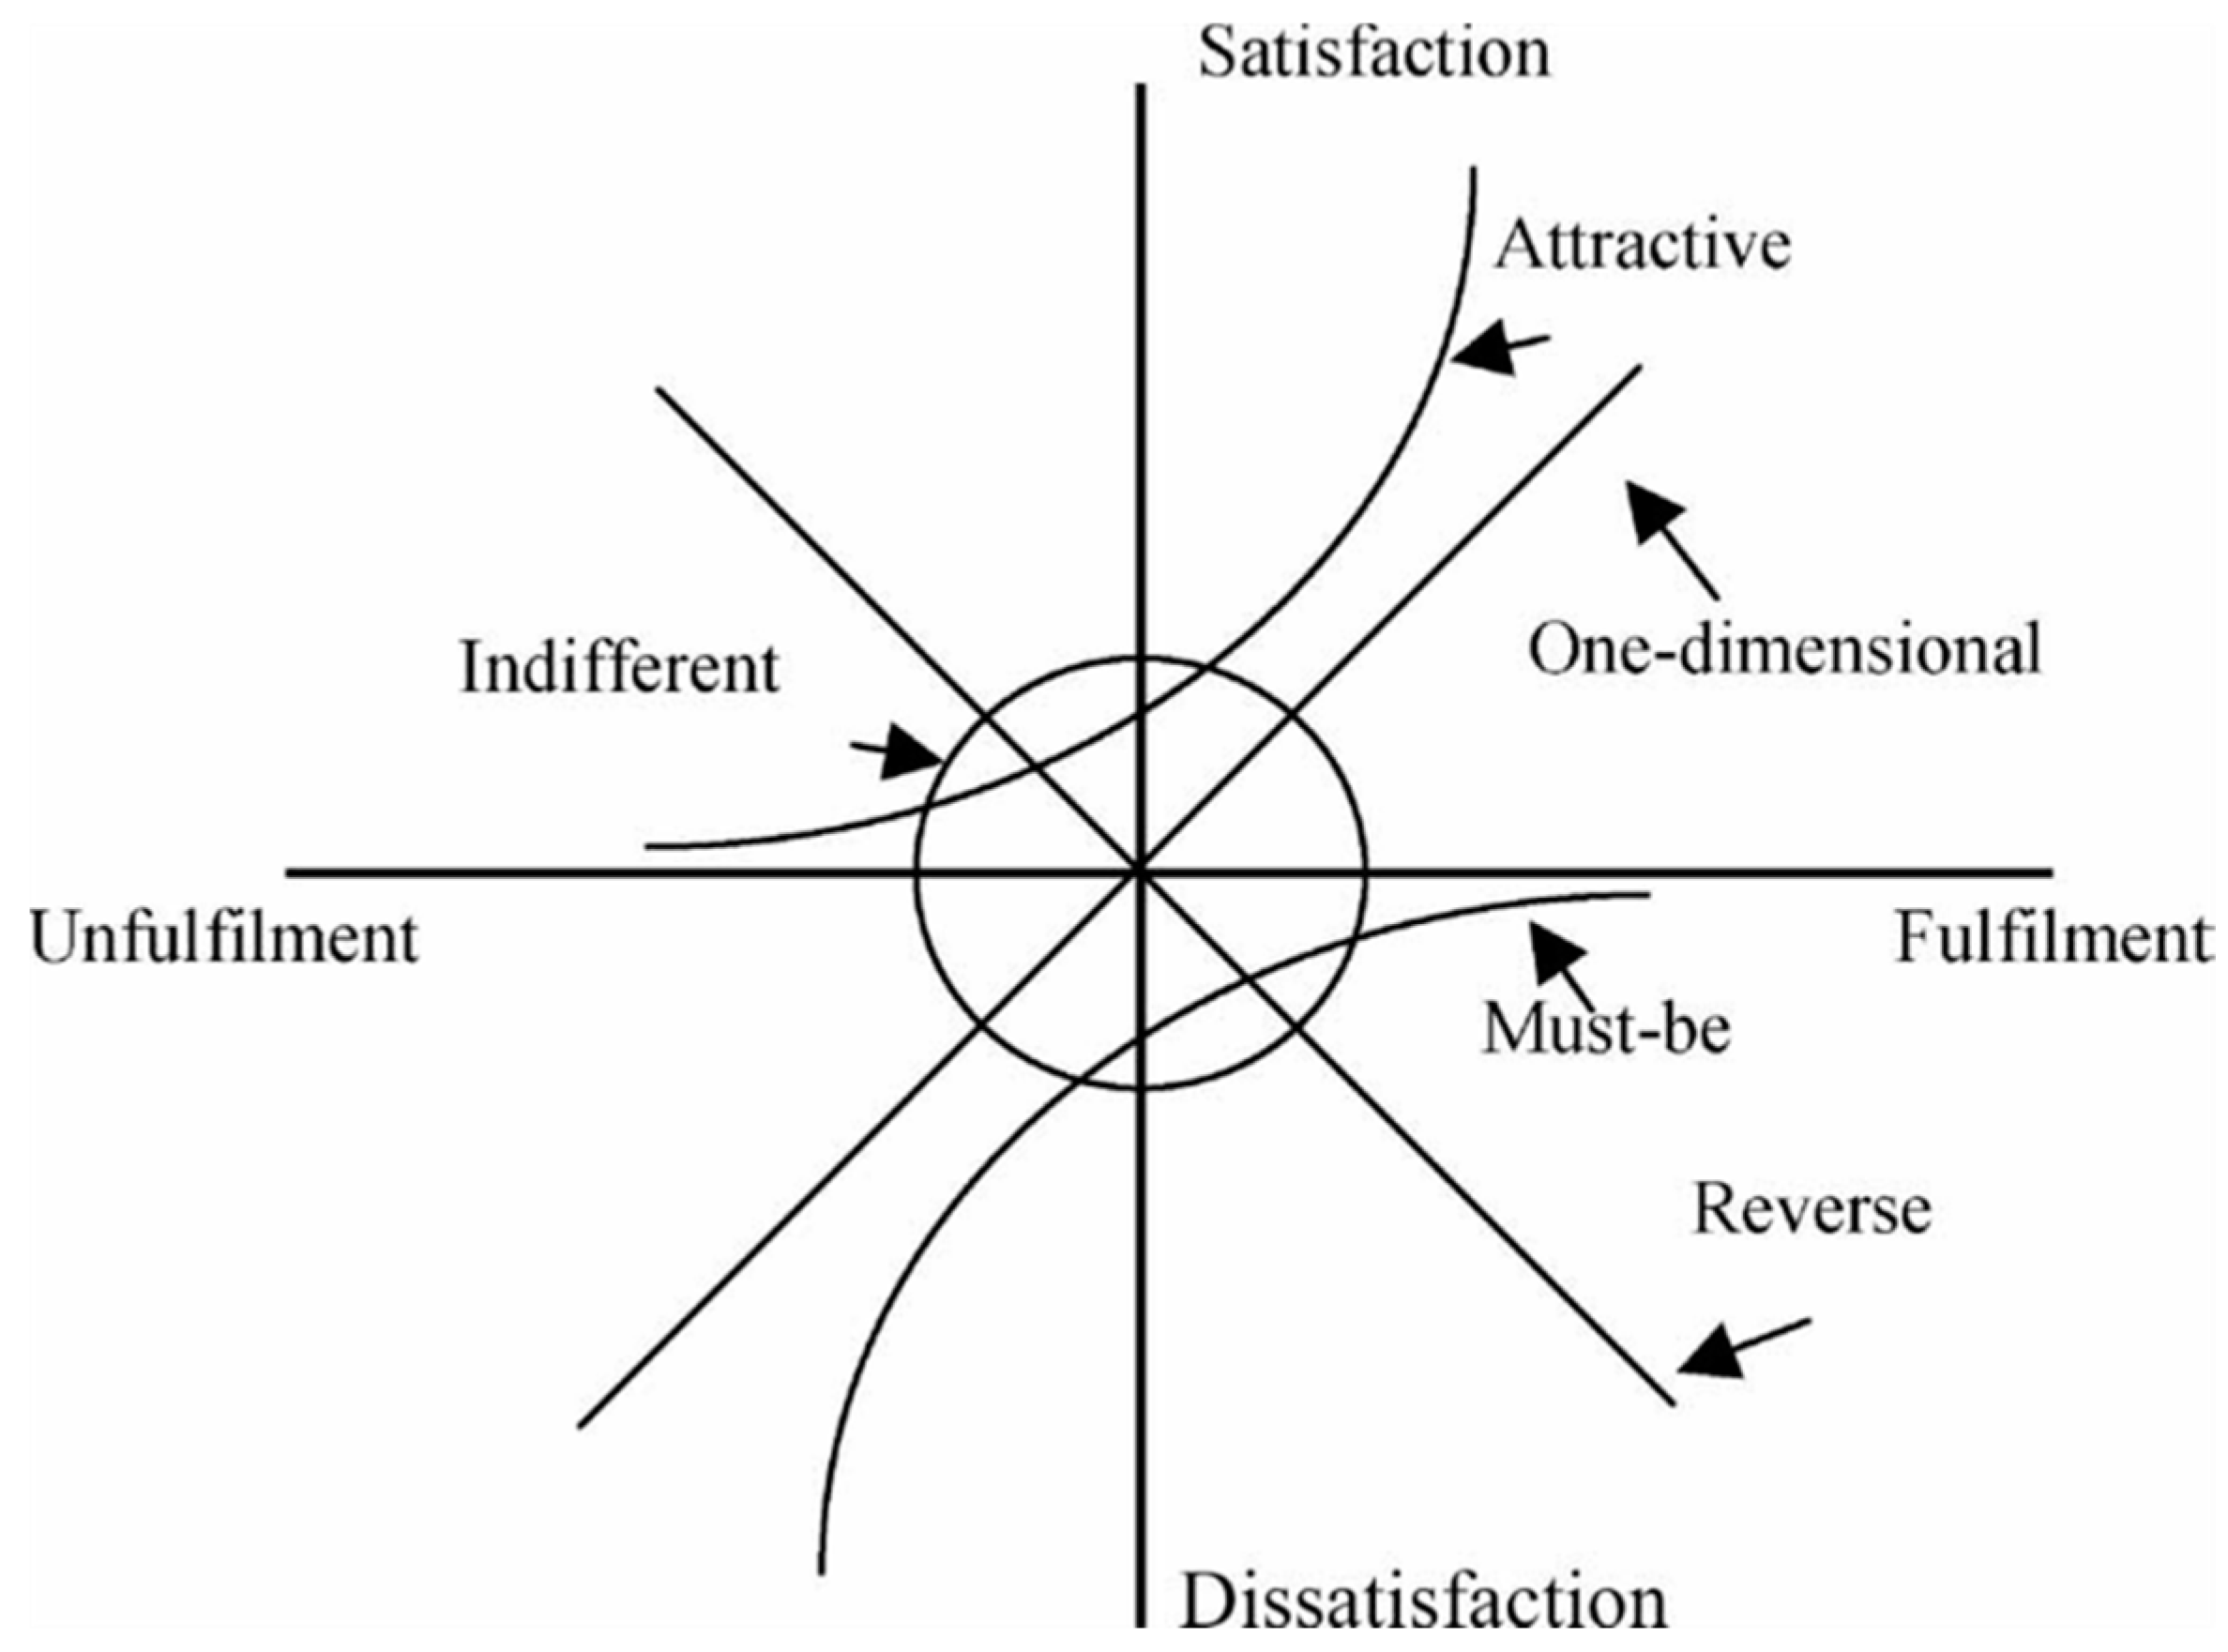
The Kano two-dimensional quality model (Kano model), proposed by Japanese professor Noriaki Kano, is a commonly used method in the product and service design process [42,43]. The Kano model, as shown in Figure 1, classifies quality attributes into five categories: (1) Attractive quality: when the quality elements are sufficient, customers will be satisfied; conversely, when the quality elements are insufficient, customers will be dissatisfied; (2) One-dimensional quality: the customer satisfaction and quality elements have a one-dimensional linear relationship; the more quality elements are provided, the more satisfied the customer will be; (3) Must-be quality: when the quality elements are sufficient, customers will not be greatly satisfied, but, when they are insufficient, customers will be extremely dissatisfied; (4) Indifferent quality: customers will not be satisfied or dissatisfied regardless of whether the quality elements are sufficient or not; and (5) Reverse quality: when the quality elements are sufficient, the customer will be dissatisfied; on the contrary, when the quality elements are insufficient, the customer will be satisfied.
The operation of the Kano model must be conducted through a questionnaire consisting of a pair of positive and negative questions. Positive questions usually refer to the customer’s evaluation of the quality element when it is adequately provided, while negative questions usually refer to the customer’s evaluation of the quality element when it is insufficiently provided. Therefore, for each quality attribute of a product (or service), the respondents can answer a pair of questions in one of five different ways: “Like”, “Must be”, “Neutral”, “Live with”, and “Dislike”. Then, according to the Kano evaluation table (see Table 1), by comparing the response results of the positive and negative questions, the quality attribute for the question item can be judged [44,45]. For example, if a respondent answers “I like it that way” to the positive questions and “I am neutral” on the negative questions, the quality attributes of these question items for this respondent will be in the “A” category, indicating that this attribute is attractive to the respondent’s requirements [46].
Berger [47] proposed the improvement quality index based on the Kano model, namely the customer satisfaction coefficient, which is divided into the increasing customer satisfaction coefficient (SII) and the reducing customer dissatisfaction coefficient (DDI) (Formulas (1) and (2)). The value of SII ranges from 0 to 1, and, the closer it is to 1, the greater the impact of the satisfaction of this factor on increasing customer satisfaction. The value of DDI is between −1 and 0, and the closer it is to −1, the greater the impact of the dissatisfaction of this factor on reducing customer dissatisfaction. It should be noted that the Kano model is a qualitative analysis method in essence that can identify different attributes of service-quality elements, but the principle of classification is more subjective. In addition, over time, the attributes of features will also undergo a dynamic transformation.
In the above formula, A is the attractive quality, O represents the desired quality, M stands for the basic quality, and I denotes the unnecessary quality. The closer the SII value is to −1, the greater the contribution of this quality factor to an improvement in customer satisfaction. If the DDI value is closer to −1, this means that the lack of this quality factor contributes more to reducing customer satisfaction. This method can be applied to extract key service-quality elements, but the priority among the key service-quality elements is not considered. The Kano model is a classic approach to describing the relationship between product or service design and user satisfaction. As different indicators of living environments in rural settlements have different expectations for users, the Kano model is suitable for describing the asymmetric nonlinear relationship between design features and user satisfaction.
3.3. The Importance–Satisfaction Model (IS Model)
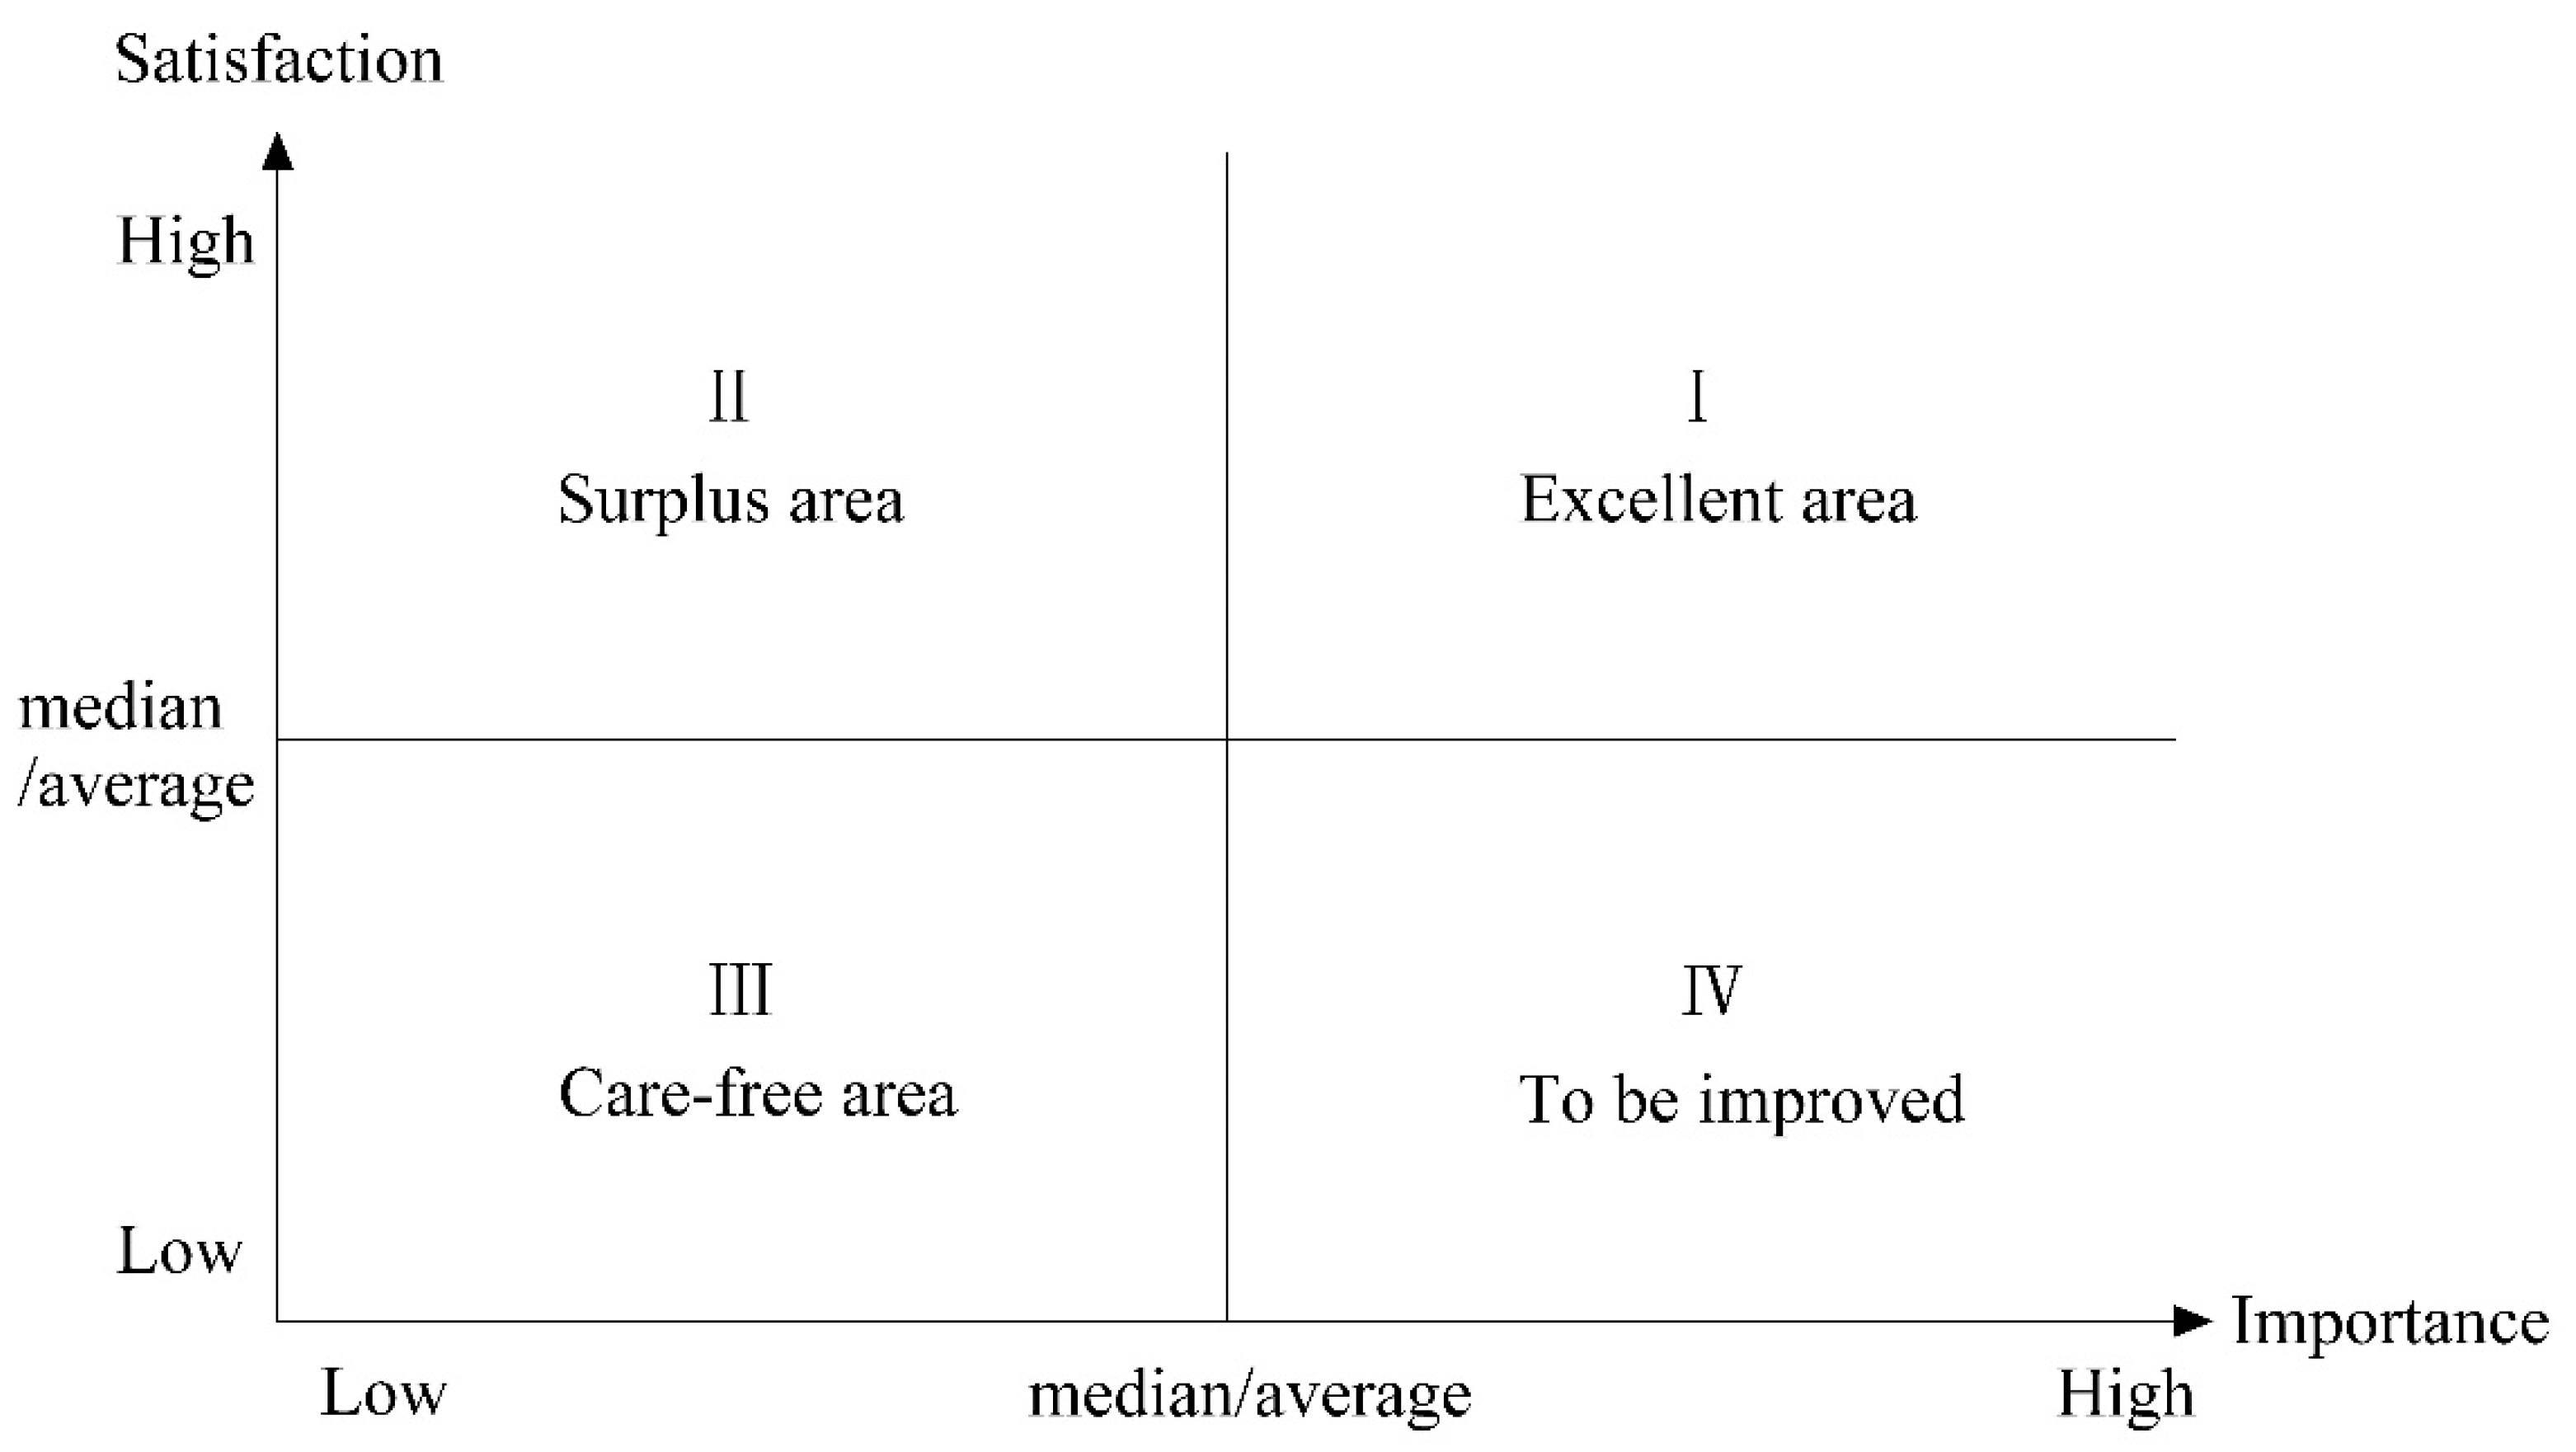
Martilla and James proposed the theory of importance–performance analysis (IPA) in 1977 [48], while Yang [49] presented the concept of an “importance–satisfaction model” (IS model) based on IPA to evaluate satisfaction and the importance of customers’ requirements. In the IS model, the horizontal X-axis represents the importance level of customers’ requirements, and the vertical Y-axis represents the satisfaction level of the customers’ requirements. The coordinates can be divided into four areas according to the evaluation values of importance and satisfaction, as shown in Figure 2. The origin of the coordinates is the average of all customers’ requirements in terms of importance and satisfaction.
- Quadrant I (excellent area): requirements located in this area are considered important and satisfactory by customers. These requirements should be retained and valued in the future.
- Quadrant II (surplus area): customers are satisfied with the requirements located in this area, but these requirements are not important to them. In other words, if the cost of providing these requirements is limited, the level of provision can be lowered.
- Quadrant III (carefree area): requirements located in this area are less important and less satisfactory to customers. These requirements can be ignored because they have less value to customers.
- Quadrant IV (to-be-improved area): requirements located in this area are those considered important to customers, but which do not currently meet their expected level of satisfaction. These requirements for improvement should be met immediately.
3.4. Case Study Method
The case study method is a type of qualitative research design that is often used in the social sciences, because it involves observing subjects, or cases, in their natural setting, with minimal interference from the researcher [50]. In the case study method, researchers pose a specific question about an individual or group to test their theories or hypotheses. Through case study methods, a researcher is able to go beyond the quantitative statistical results and understand the behavioral conditions from the actor’s perspective. By including both quantitative and qualitative data, a case study helps explain both the process and outcome of a phenomenon through complete observation, reconstruction, and analysis of the cases under investigation [51]. Past literature reveals the application of the case study method in many areas and disciplines, including natural examples in the fields of sociology [52], planning [37], and medicine [53]. In addition, other fields have used case study methods extensively, particularly government, management, and education. When it comes to the case study method, two major approaches can be used to collect data: document review and fieldwork. The case study facilitates the exploration of a real issue within a defined context, using a variety of data sources [54]. The present study used a relatively representative rural settlement case for fieldwork and in-depth analysis.
4. Kano–IS Integrated Analysis Model
Currently, the sustainable development of living environments in rural settlements, which comprise various complex dimensions and elements, figures prominently in the promotion of the rural revitalization strategy. In order to expedite an improvement in rural living conditions, key indicators must be identified from the many dimensions and elements as the basis of decision making in the rural reconstruction process. Specifically, the key renovation indicators in the dominant dimensions are to be maintained continuously, and those in the weak dimensions are to be refined accordingly, so that limited resources can be applied critically to improve rural living environments and reconstruction measures can be implemented in a targeted manner. Only in this way can rural living conditions be enhanced to the degree that the villagers are completely satisfied.
Moreover, in the evaluation of China’s rural settlements, the points to be enhanced may be identified based on the importance–satisfaction matrix if only the IS model is adopted, but this fails to consider the two-dimensional attributes of service quality. Using only the Kano model to evaluate service elements, the two-dimensional attributes of service quality are fully considered, but the classification of the attributes of quality elements is not rigorous enough; thus, it is not possible to distinguish the relative importance of different service-quality elements. In this sense, this study, taking advantage of the strengths of both the Kano model and the IS model to compensate for their respective disadvantages, aims to evaluate service-quality elements more effectively and identify the key elements from the evaluation indicators of living environments in rural settlements. Only in this way can resource investment priorities be determined.
The literature on the application of the Kano model or the IS model in design and research is substantial [55,56]. For instance, Chen [57] proposed the application of the Kano–SIPA ensemble model to compare the performance of the quality attributes of fast-food restaurants. Wu [58] used an integrated form of the Kano model and the IPA method to conduct 120 surveys of outpatients in 175 military hospitals to prioritize improvement measures. However, research on the sustainable renovation of living environments in rural settlements using the two models is rare. Therefore, a more accurate analysis model to better serve rural construction has great development prospects.
4.1. Research Framework
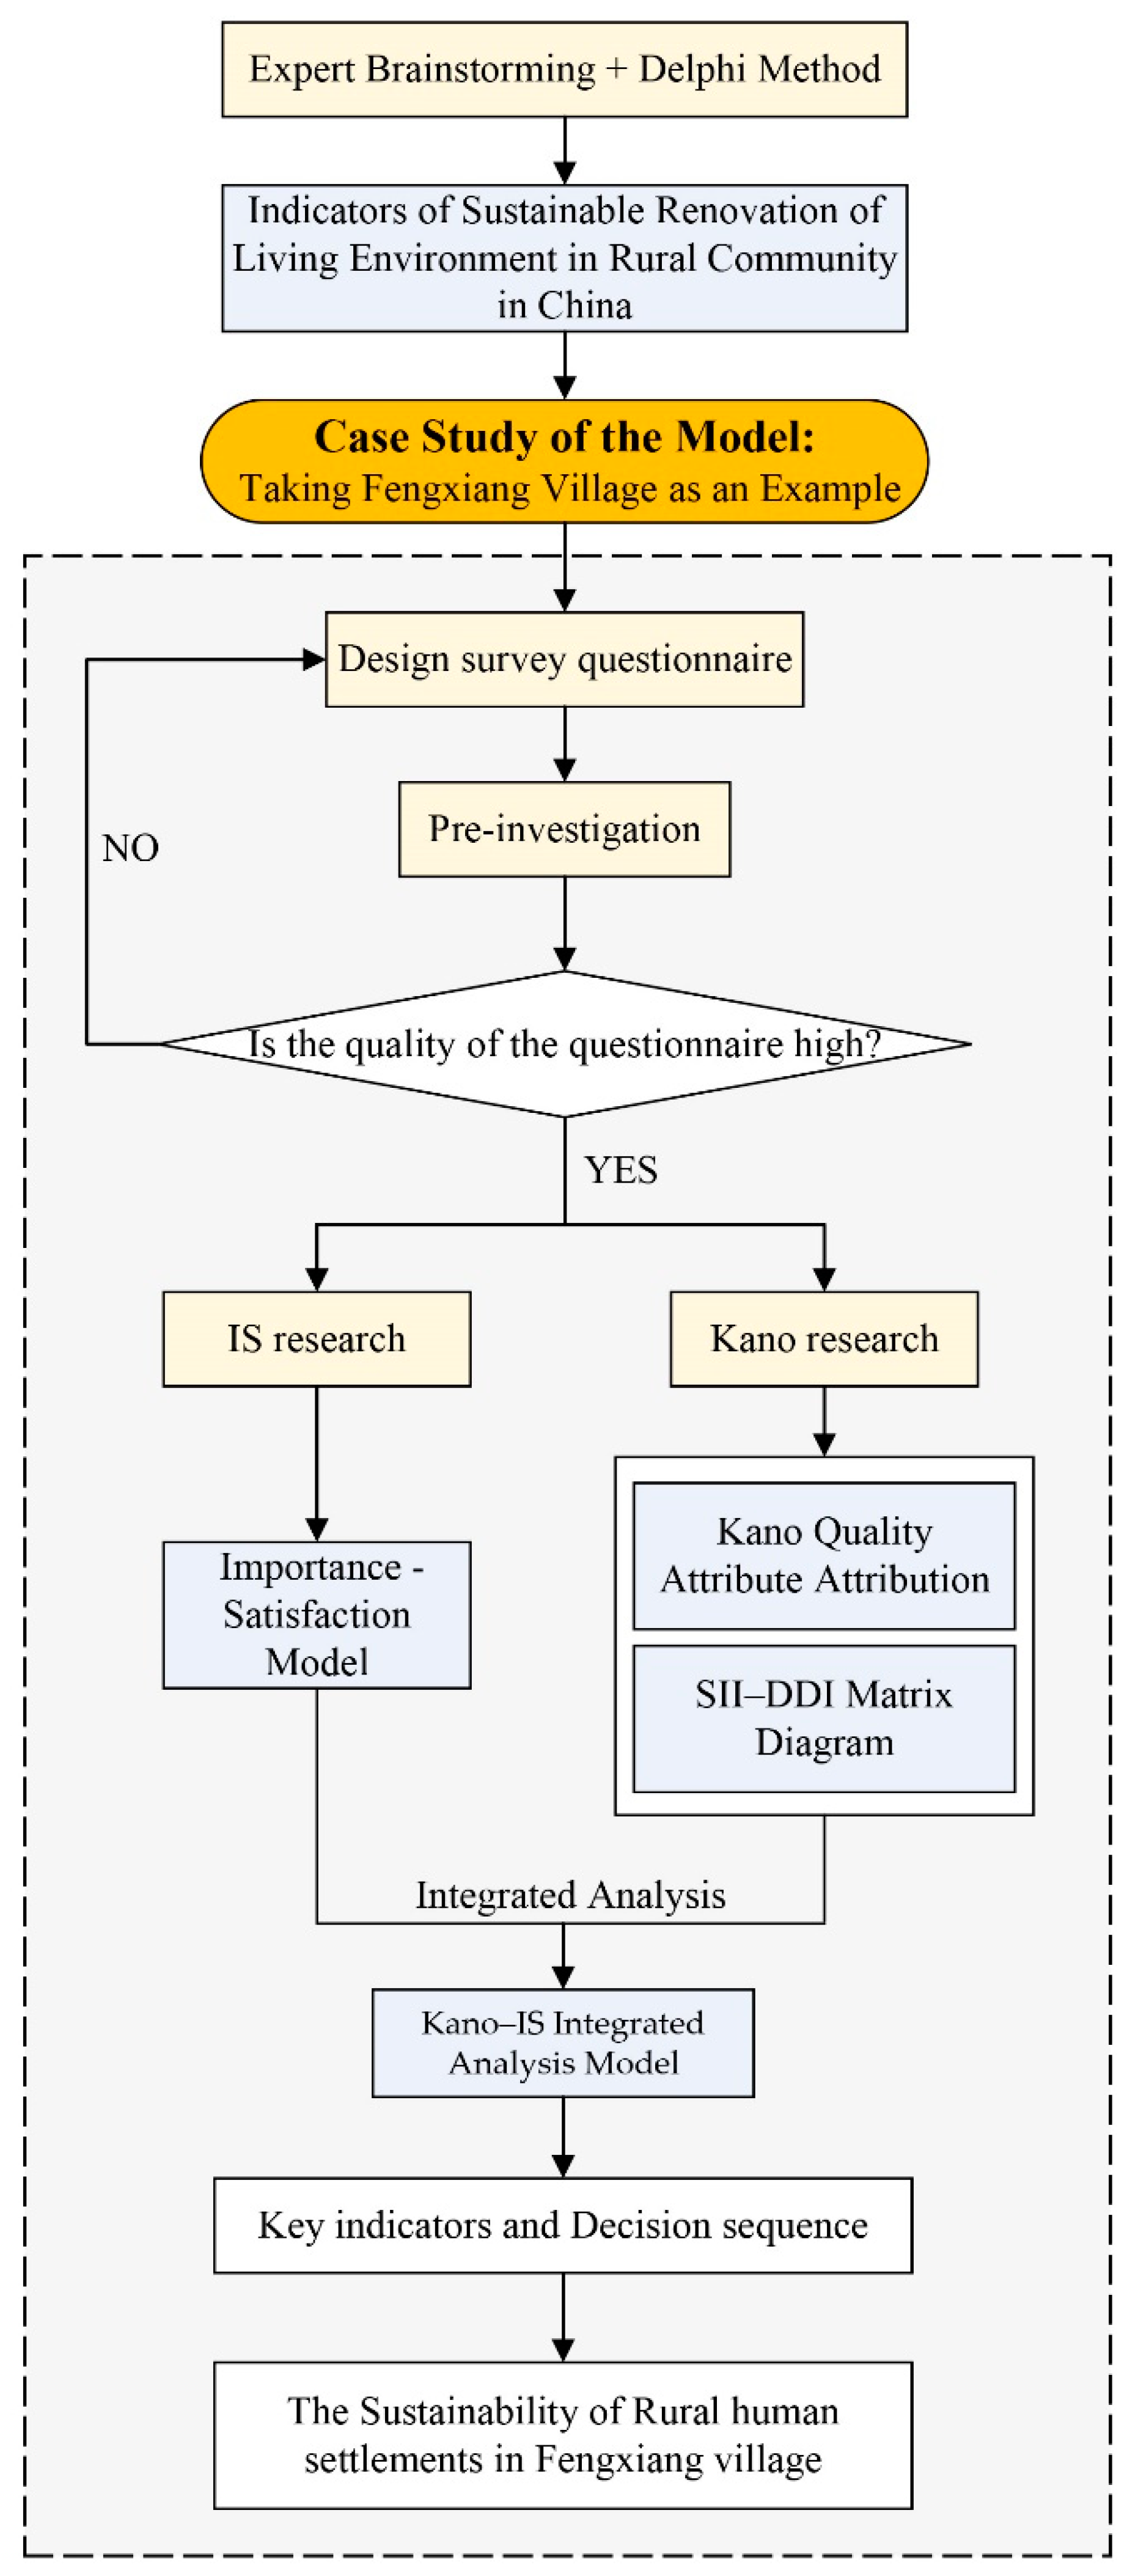
This study, in combination with the Kano model and the IS model, further determines the evaluation process of the key renovation elements based on an integrated analysis of the two models to ensure that the strengths of the two models can compensate for their drawbacks (Figure 3). The specific methods are as follows.
First, according to the characteristics of the existing villages in China, the evaluation indicators of sustainable living environments in rural settlements are obtained using the brainstorming method, among experts, as well as the Delphi method. Based on these elements and indicators, taking Fengxiang village as an example, Kano–IS questionnaires are designed, preliminary survey work is carried out, and the recovered data are statistically summarized to further analyze the quality of the questionnaires. Second, based on the data recovered from the formal survey, the Kano two-dimensional quality model is used to classify the attributes of the quality elements to evaluate living environments in rural settlements in China. In addition, better coefficients after an increase and worse coefficients after a decrease in each indicator are measured to construct a better–worse coefficient matrix. Furthermore, renovation indicators with a great influence on the better and worse coefficients are also proposed. Third, based on the degree of satisfaction feedback from the villagers, the IS model is used to calculate the priorities of the many renovation indicators and the average degree of satisfaction. On this basis, the importance–satisfaction matrix is constructed. With the characteristics of each quadrant in the IS matrix, the strategies of the elements in each quadrant and the priority quadrants for improvement and maintenance are determined. Fourth, based on the above analyses, the SII–DDI matrix and the IS model are combined to integrate and analyze the extracted renovation indicators, and those with relatively high SII, DDI, and importance are abstracted, representing the integration of the better–worse coefficient matrix and the IS matrix. Thus, the priority key renovation indicators of rural environment reconstruction are obtained. Finally, according to the Kano attributes and the IS quadrants of the renovation indicators, an integrated analysis is conducted to determine the priority of the improvement or maintenance of each indicator. In this way, rural managers can make optimum management decisions and critically invest limited government resources, so that the quality of living environments in rural settlements in Fengxiang village is enhanced to such a degree that rural residents are completely satisfied.
4.2. The Sustainable Renovation Indicators of Living Environment in Rural Settlements
The Delphi method was adopted in this study by seven experts, including four university professors from the Department of Architecture and Planning and three designers from the architectural planning and design industry in the age range of 35–55, who have more than five years of experience in scientific research on rural renewal and related fields. Finally, the Delphi method was implemented for two rounds to obtain the optimal indicators, including 4 dimensions (i.e., natural environment, infrastructure, public service, and rural architecture) and 30 indicators, as shown in Table 2.
The sustainable renovation indicators of living environments in rural settlements developed in this study will provide references for the formulation of rural policies, thus guiding and promoting the generation of a rural revitalization strategy. Furthermore, the materials and experience obtained herein can also be used for research in this field.
4.3. Model Establishment
Different indicators correspond to different Kano attribute classifications, and different attributes indicate different levels of need for villagers. Specifically, the basic features are the primary requirements of the villagers, the absence of which is likely to lead to high dissatisfaction among the villagers; therefore, the basic features should be given top priority in terms of resource distribution. Compared with the basic features, the expected features belong to a higher level of need, so resources should be distributed to the desired features after the basic ones, followed, in order, by attractiveness features and indifferent features.
The same Kano quality attributes in different quadrants of the IS matrix should Apply different strategies. As for the elements in quadrants I and II in the IS matrix, maintenance strategies should be adopted. Both quadrants have high satisfaction levels, and quadrant I has a higher importance level than quadrant II, so the elements in quadrant I should be given top priority for maintenance, and those in quadrant II should be properly maintained or just let go. Concerning the elements in quadrants III and IV, improvement strategies should be employed. Both quadrants III and IV have low satisfaction levels, and quadrant IV has a higher importance level than quadrant III, so the elements in quadrant IV should be given top priority for improvement, and those in quadrant III should be properly improved or ignored. For the elements that share the same Kano attributes and are in the same IS quadrants, the policy priority is determined by the ratio of importance to satisfaction (I/S). A larger ratio indicates relatively greater importance and a lower satisfaction level with the elements and is, therefore, a higher policy priority.
The SII–DDI coefficient matrix and the IS matrix are integrated to determine the key service-quality elements, the Kano model quality attribute classifications, and the IS matrix, so that the corresponding priority for improvement or maintenance are determined. Details are shown in Table 3. The numbers 1–12 represent the priority of strategies. Indifferent qualities and reverse qualities are strategically ignored or removed in most cases and are, therefore, not mentioned.
This research first conducted a questionnaire survey on the studied villages, and, after recovering the valid questionnaires, SPSS 23.0 statistical software was utilized to organize and analyze the survey data In detail, a descriptive statistical analysis of the samples was carried out to determine the characteristics of the demographic variables; the reliability and validity of the questionnaire were analyzed to examine the consistency and stability of the results obtained from multiple measurements; the validity was tested using the Kaiser–Meyer–Olkin (KMO) test to evaluate the accuracy of the questionnaire; based on the Kano two-dimensional quality model and the IS analysis method, the sustainable renovation indicators of living environments were determined and classified; and finally, an integrated analysis Kano–IS model was constructed to determine the key service-quality elements and the corresponding strategic priorities.
5. A Case Study of Fengxiang Village in China
5.1. Introduction to Fengxiang Village in China
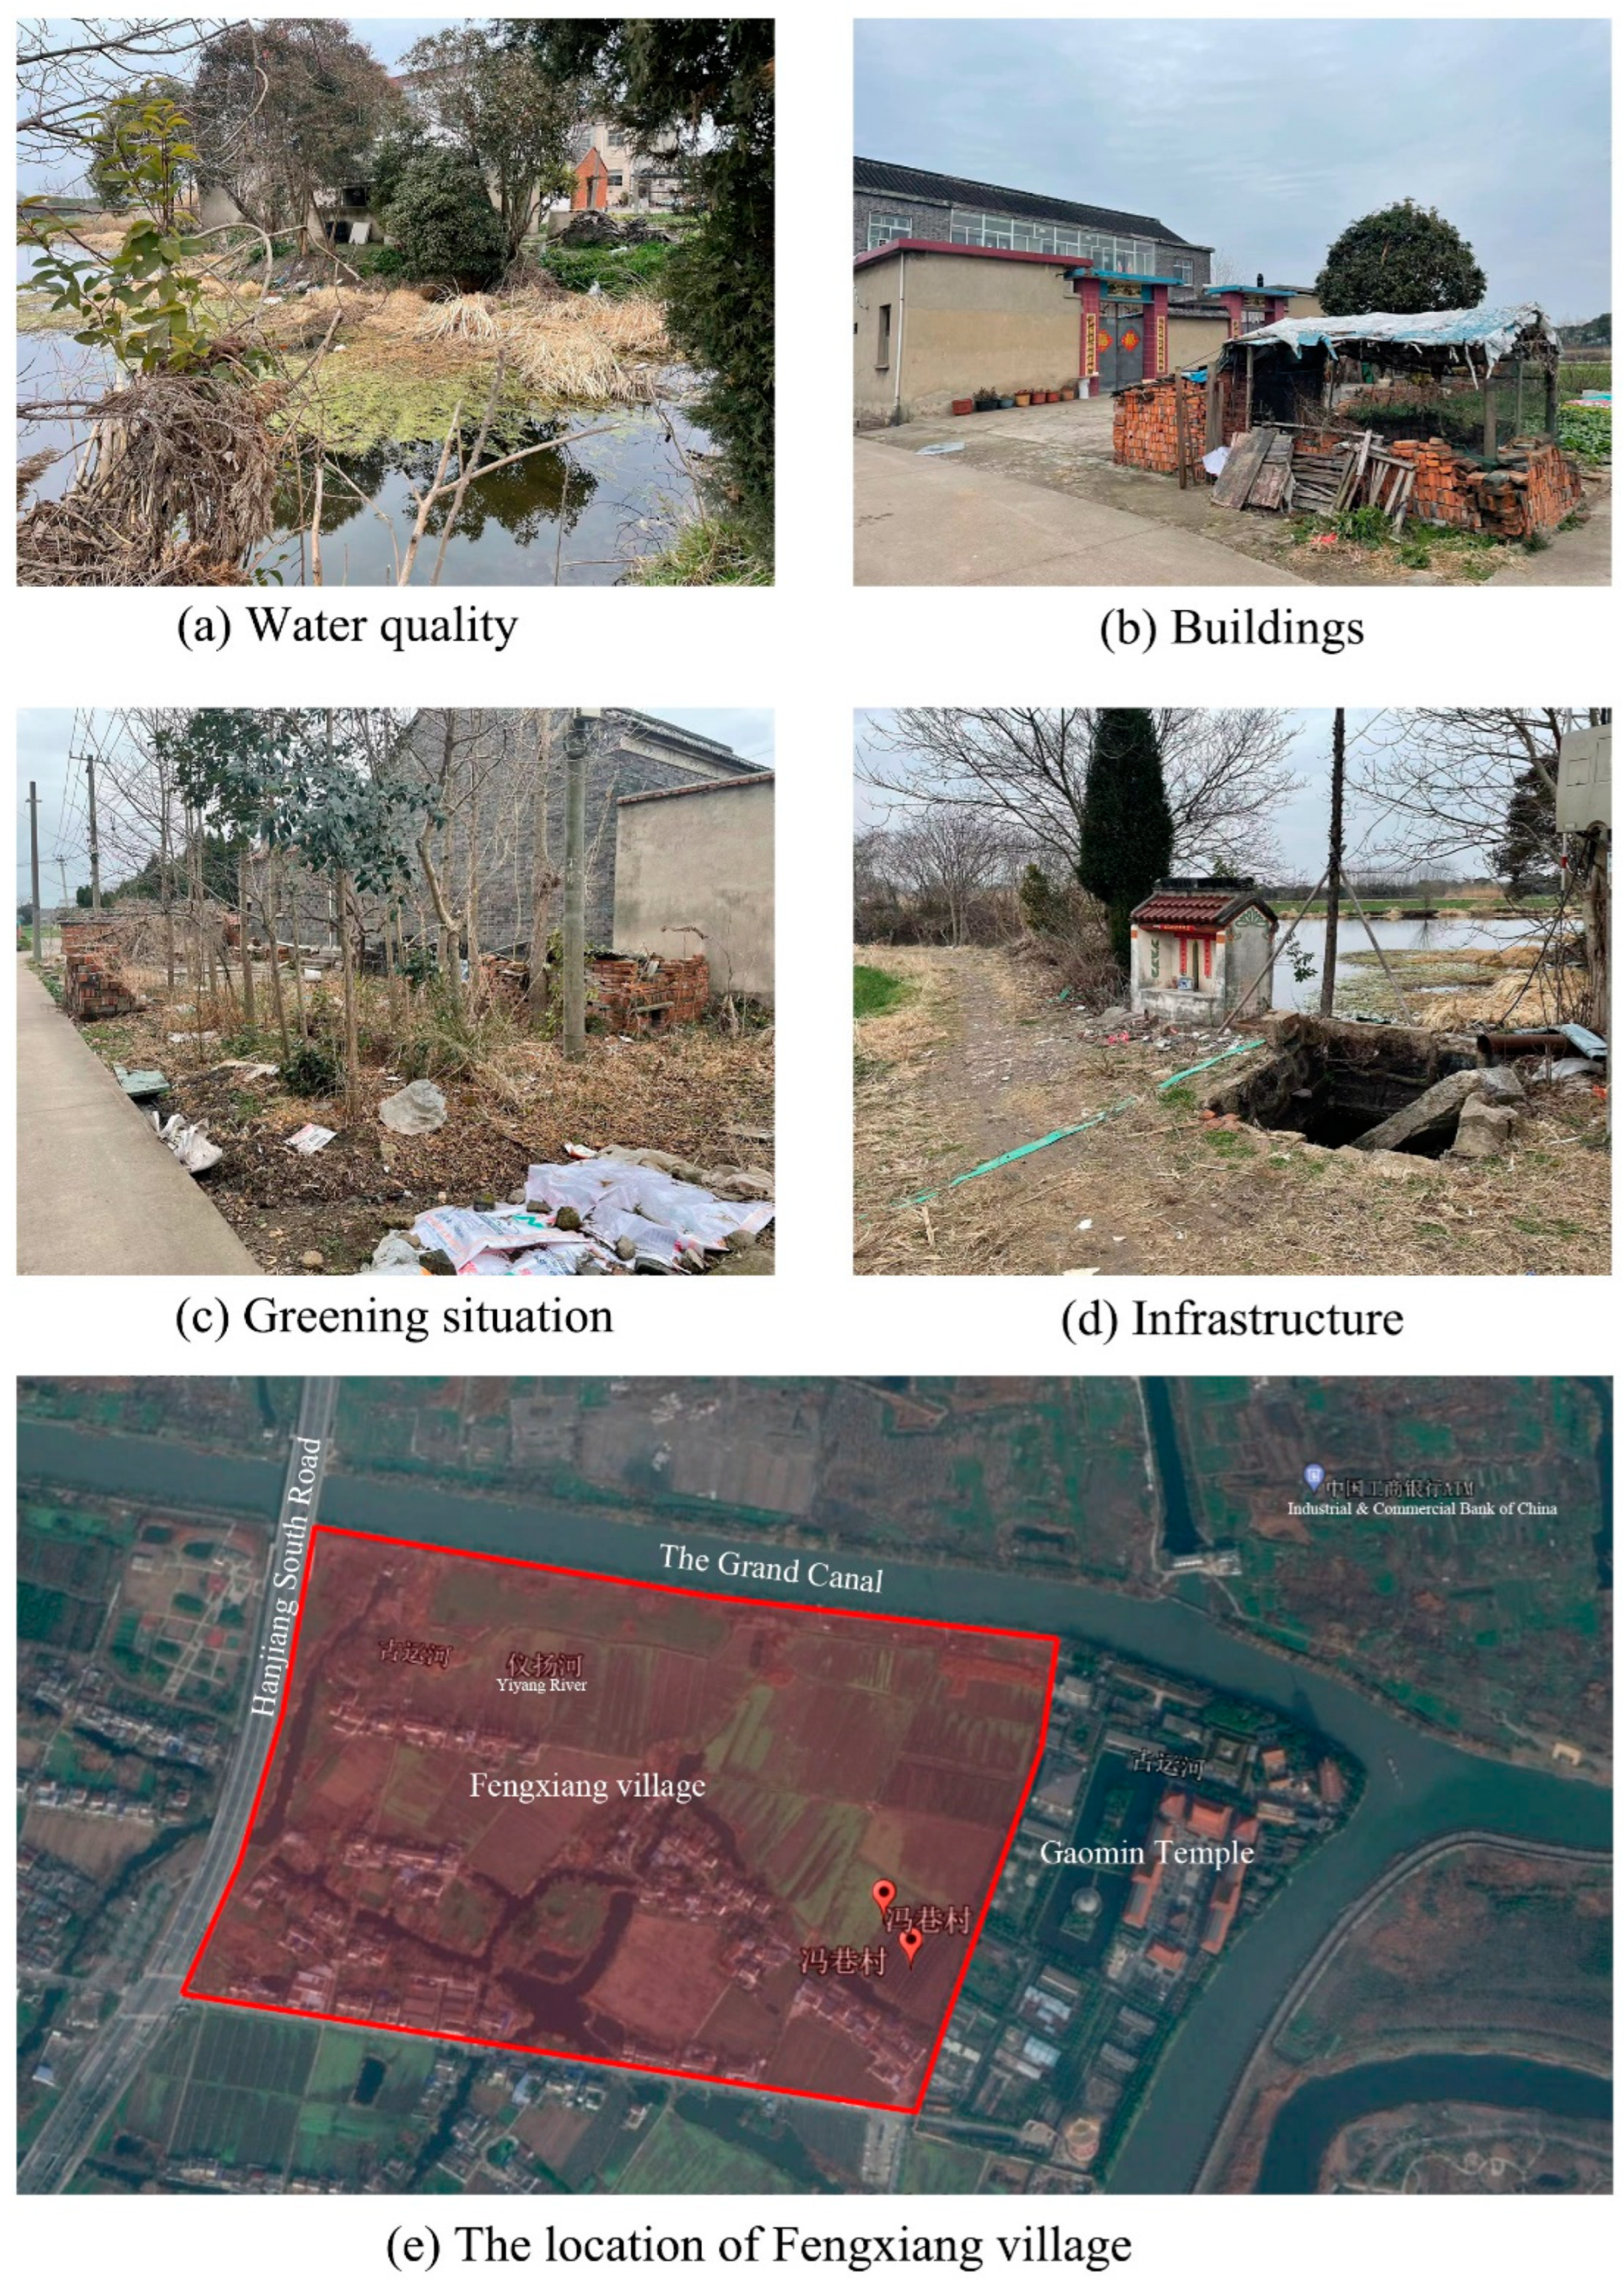
Located in the Hanjiang District, in the south of Yangzhou City, Jiangsu Province, China, Fengxiang Village in the town of Guazhou consists of 12 groups with a total of more than 3000 villagers. The well-known Gaomin Temple, built in the Sui Dynasty, is located within the village, and the Grand Canal is to the east and north of it. However, the internal living environment of this village is less desirable. As shown in Figure 4, the village has the following problems: its natural environment, such as water quality and green vegetation, is unsatisfactory; the basic living facilities are inadequate; most of the houses are dilapidated and therefore require renovation; and the facades of the houses are not uniform, so the planning and construction of the whole village seem chaotic. In that sense, the living environment of Fengxiang Village urgently needs further transformation to better meet the living requirements of the people.
5.2. Basic Situation in the Samples
In February 2021, the research team randomly sampled the rural residents in Chahe Street in Fengxiang Village, Hanjiang District, Yangzhou City, Jiangsu Province, China. The survey methods included offline self-administered questionnaires, online questionnaires conducted through WeChat and wjx (https://www.wjx.cn/, accessed on 18 February 2022), and face-to-face interviews with villagers.
A total of 150 questionnaires were distributed, and 139 questionnaires were collected. After excluding 18 invalid questionnaires, there were 121 valid questionnaires in total. Of the 150 questionnaires that were distributed, 66 were offline paper questionnaires, and 84 were online questionnaires. Of the 121 questionnaires that were completed, 55 were offline paper questionnaires (with a recovery rate of 83.33%), and 66 were online questionnaires (with a recovery rate of 78.57%). In terms of gender distribution, male respondents accounted for approximately 43.80%, and 56.20% were female respondents. Regarding age, 25.62% of the respondents were 18 to 40 years old, 40.50% were 41 to 60 years old, and 33.88% were over 61 years old. With respect to occupation, agricultural workers, including those who were retired or unemployed, accounted for 32.23%, and 67.77% were employees in enterprises or public institutions. In terms of income, most of the respondents had a monthly income of CNY 3000–8000, the proportion of which was approximately 71.90%, and those who earned less than CNY 3000 or more than CNY 8000 per month comprised approximately 23.97% and 4.13%, respectively.
6. Results and Discussion
Using SPSS 23.0 statistical software, the research results showed that the forwards and backwards coefficients of Cronbach’s α for Kano question types were 0.856 and 0.827, respectively, and the coefficients of Cronbach’s α for the degree of importance and satisfaction were 0.841 and 0.909, respectively. The results are thus highly reliable and are suitable for further analysis.
6.1. Results of the Kano Model
The renovation indicators of sustainable living environments in rural settlements are classified by attributes based on the survey results in this study, as shown in Table 4. A total of 30 indicator items are incorporated into the frequency summary of each region. It can be seen that the Kano questionnaire survey achieves good results, with the following specific manifestations: (1) the statistical results of the elements in each item are basically distributed in four regions: A, O, M, and I; (2) the distribution values are different in these regions, which helps classify the elements by attributes; and (3) the samples are of high quality, because there are no reverse or invalid qualities.
Considering a large amount of data and information, one indicator is taken as an example for analysis. By substituting the survey results of “N1 water quality” into the Kano evaluation form, four regions display the statistical results, namely “A”: attractive quality (23 persons), “O”: one-dimensional quality (29 persons), “M”: must-be quality (52 persons), and “I”: indifferent quality (17 persons). According to the attribute classification of elements based on the “maximum” principle, “N1” is categorized as a must-be quality; that is, villagers will not feel more satisfied with better water quality, but a reduction in quality will lead to a significant decline in satisfaction.
Therein, nine indicators were categorized as must-be qualities; the one-dimensional and attractive qualities included 10 indicators, respectively; and the P4 educational facilities element was an indifferent quality. In this survey, no elements were classified as problematic or reverse quality.
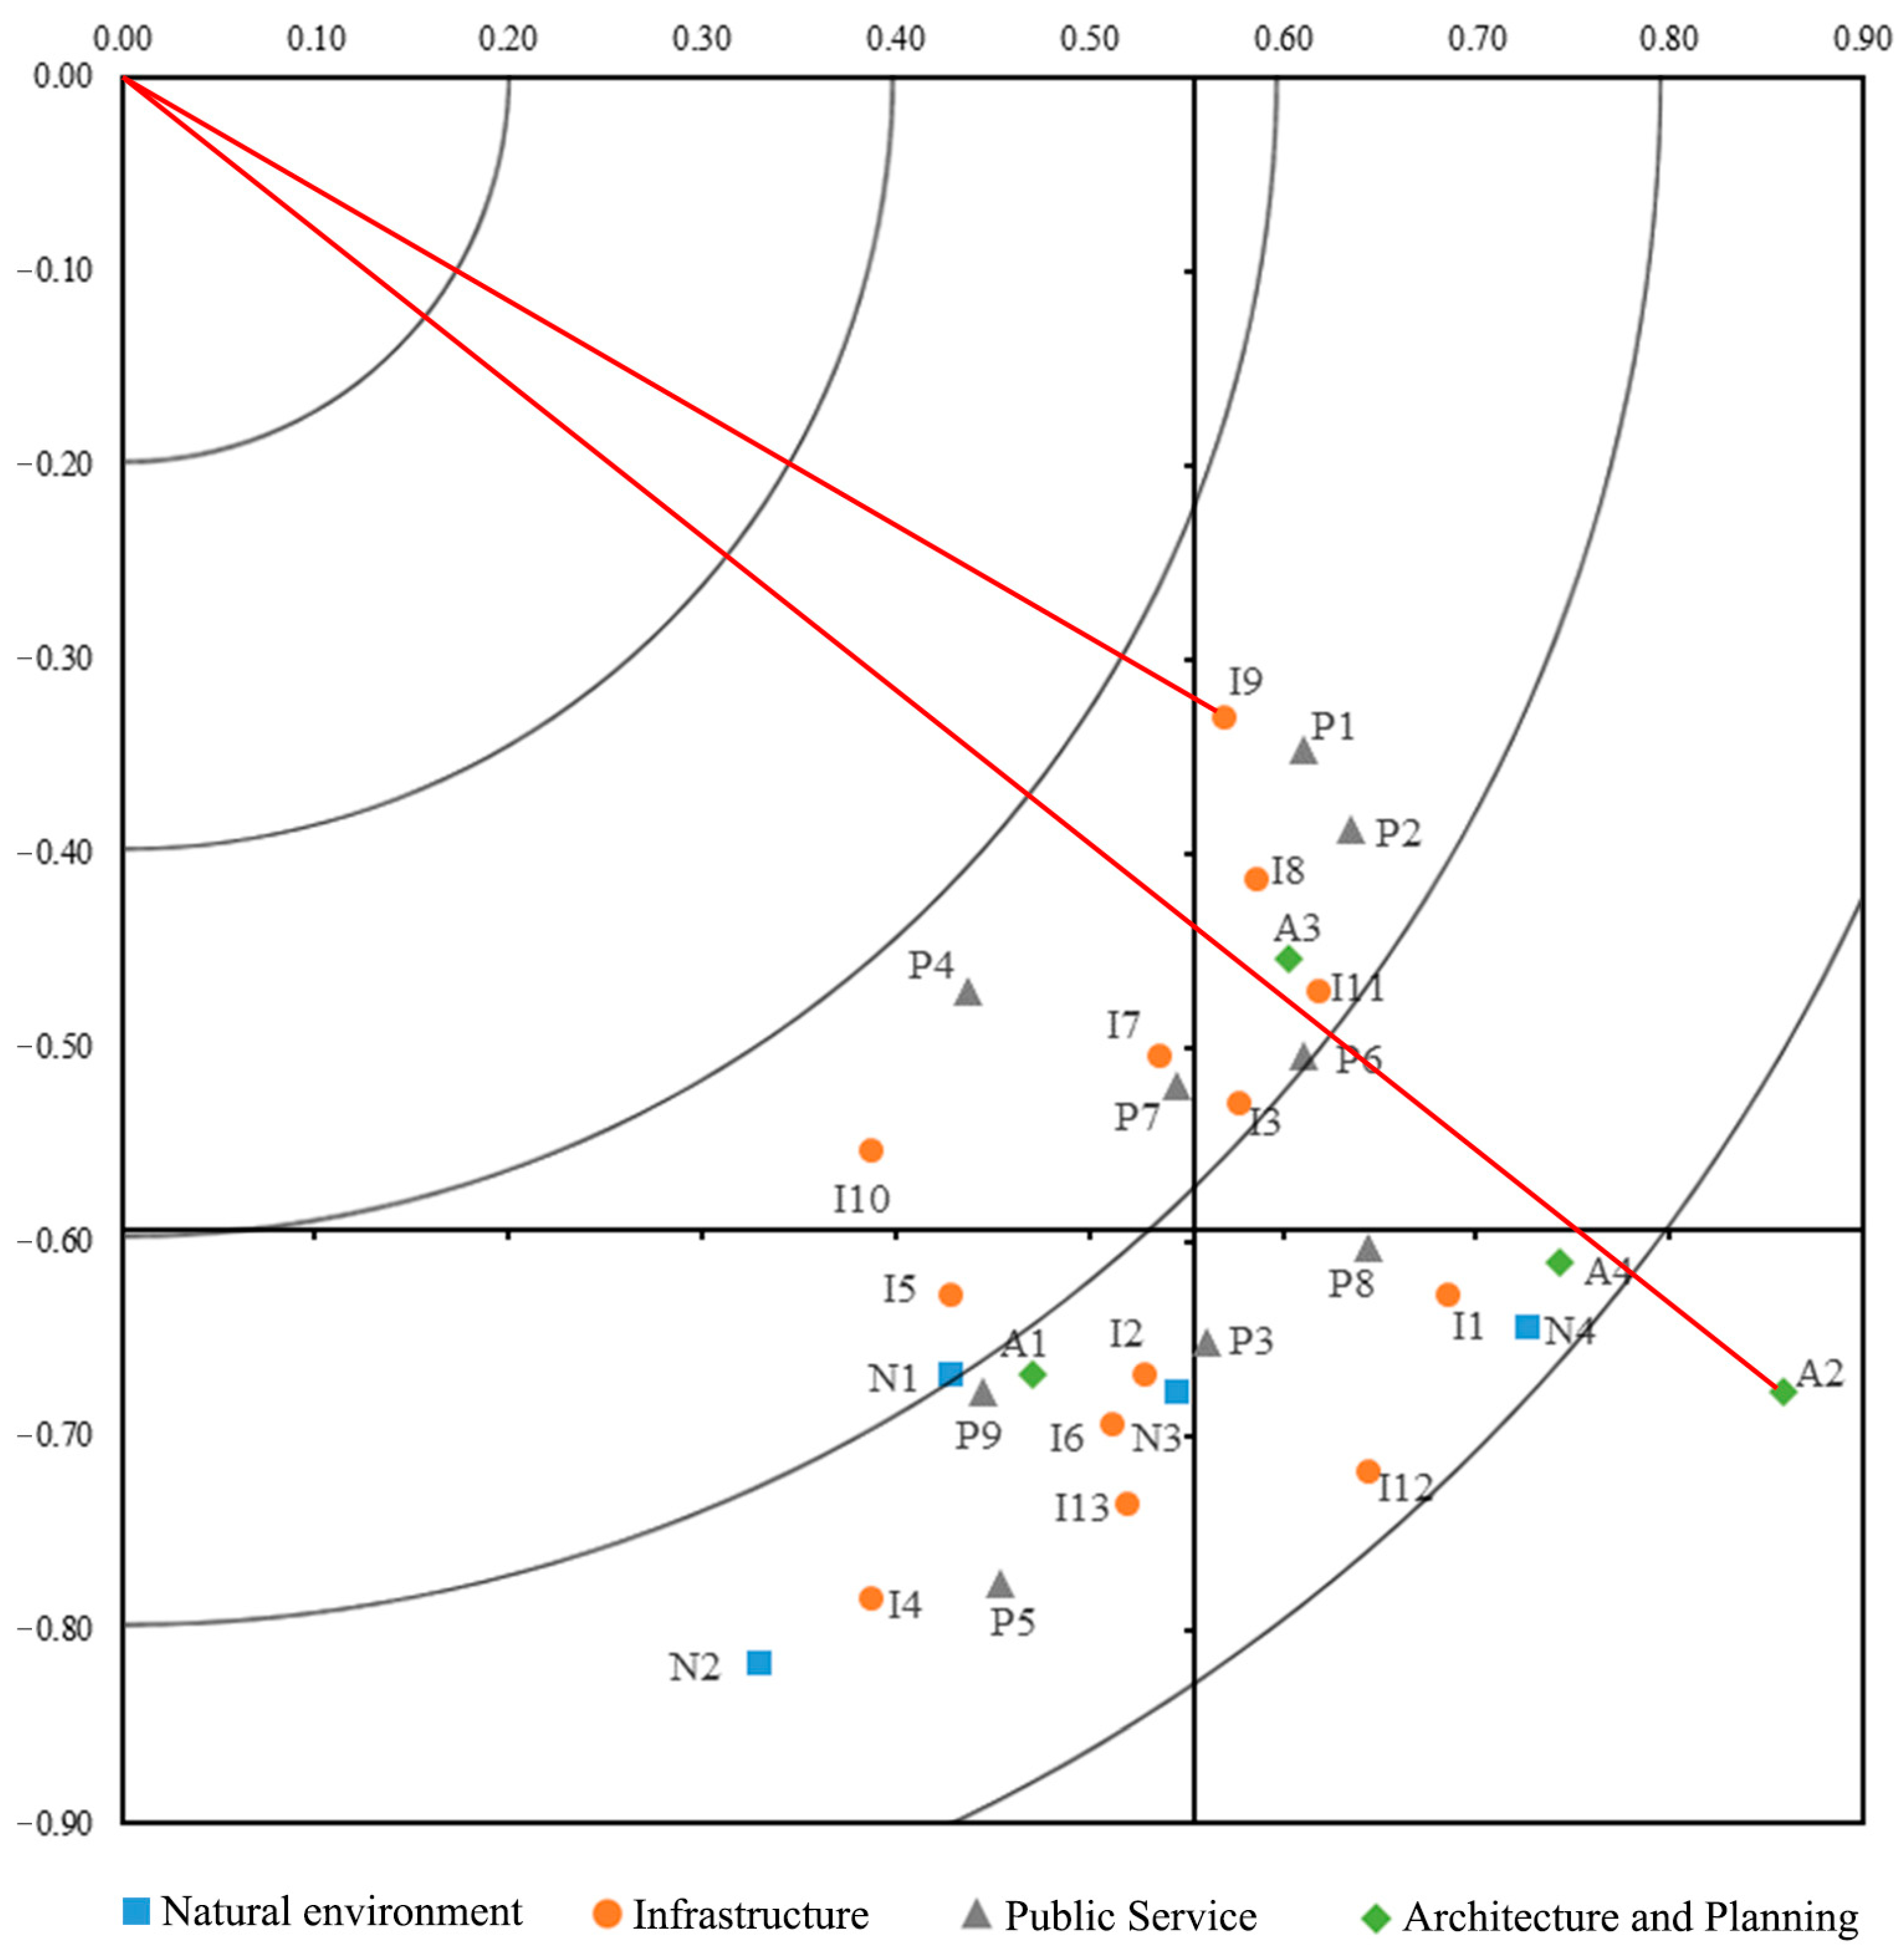
In accordance with Formulas (1) and (2) (based on the data in Table 5), the values of SII were positioned on the X-axis to extract those within the range of 0 and 1, with the influence increasing rightwards; meanwhile, with the values of DDI on the Y-axis, those within the range of −1 and 0 were extracted and the influence increased downwards. In addition, the mean values of SII (0.555) and DDI (−0.594), as well as the origin of the coordinate axis, were taken as the center of a circle, respectively, to draw arcs, which were used as auxiliary lines to form an SII–DDI analysis matrix (as shown in Figure 5).
In Figure 5, the longer the distance from the index point to the origin means a greater combined influence of satisfaction increment and dissatisfaction decrement. Therein, I9 and P4 are closest to the origin, indicating the smaller combined influence of these two elements, thus they are less prioritized as factors affecting decision making. By contrast, the element farthest from the origin is A2, followed by I12 and N4, indicating that these three elements should be highlighted during the decision-making process.
6.2. Results of the IS Model
In Table 5, the degree of importance and satisfaction from the questionnaire results demonstrated that, on the whole, the respondents were not satisfied with the existing conditions in Fengxiang Village, which was supported by the average value of 2.65 in terms of their degree of satisfaction with the village. According to their evaluation ranking of each indicator, they were less satisfied with A4 (thermal and sound insulation of buildings), I10 (garbage disposal), and A2 (quality and restoration of buildings), among which A4 (thermal and sound insulation of buildings) had the lowest satisfaction level at only 2.05, on average. On average, N2 (air), I5 (facilities for supplying electricity and gas), N3 (noise), and P1 (cultural and recreational facilities) enjoyed the highest satisfaction levels. The average value of the overall importance level was 3.59, of which the most important were A2 (quality and restoration of buildings), N2 (air), I12 (security-monitoring facilities), and others, while the least important were I3 (drinking water facilities), I7 (cultural and sports facilities), and I8 (banks and post offices), among others.
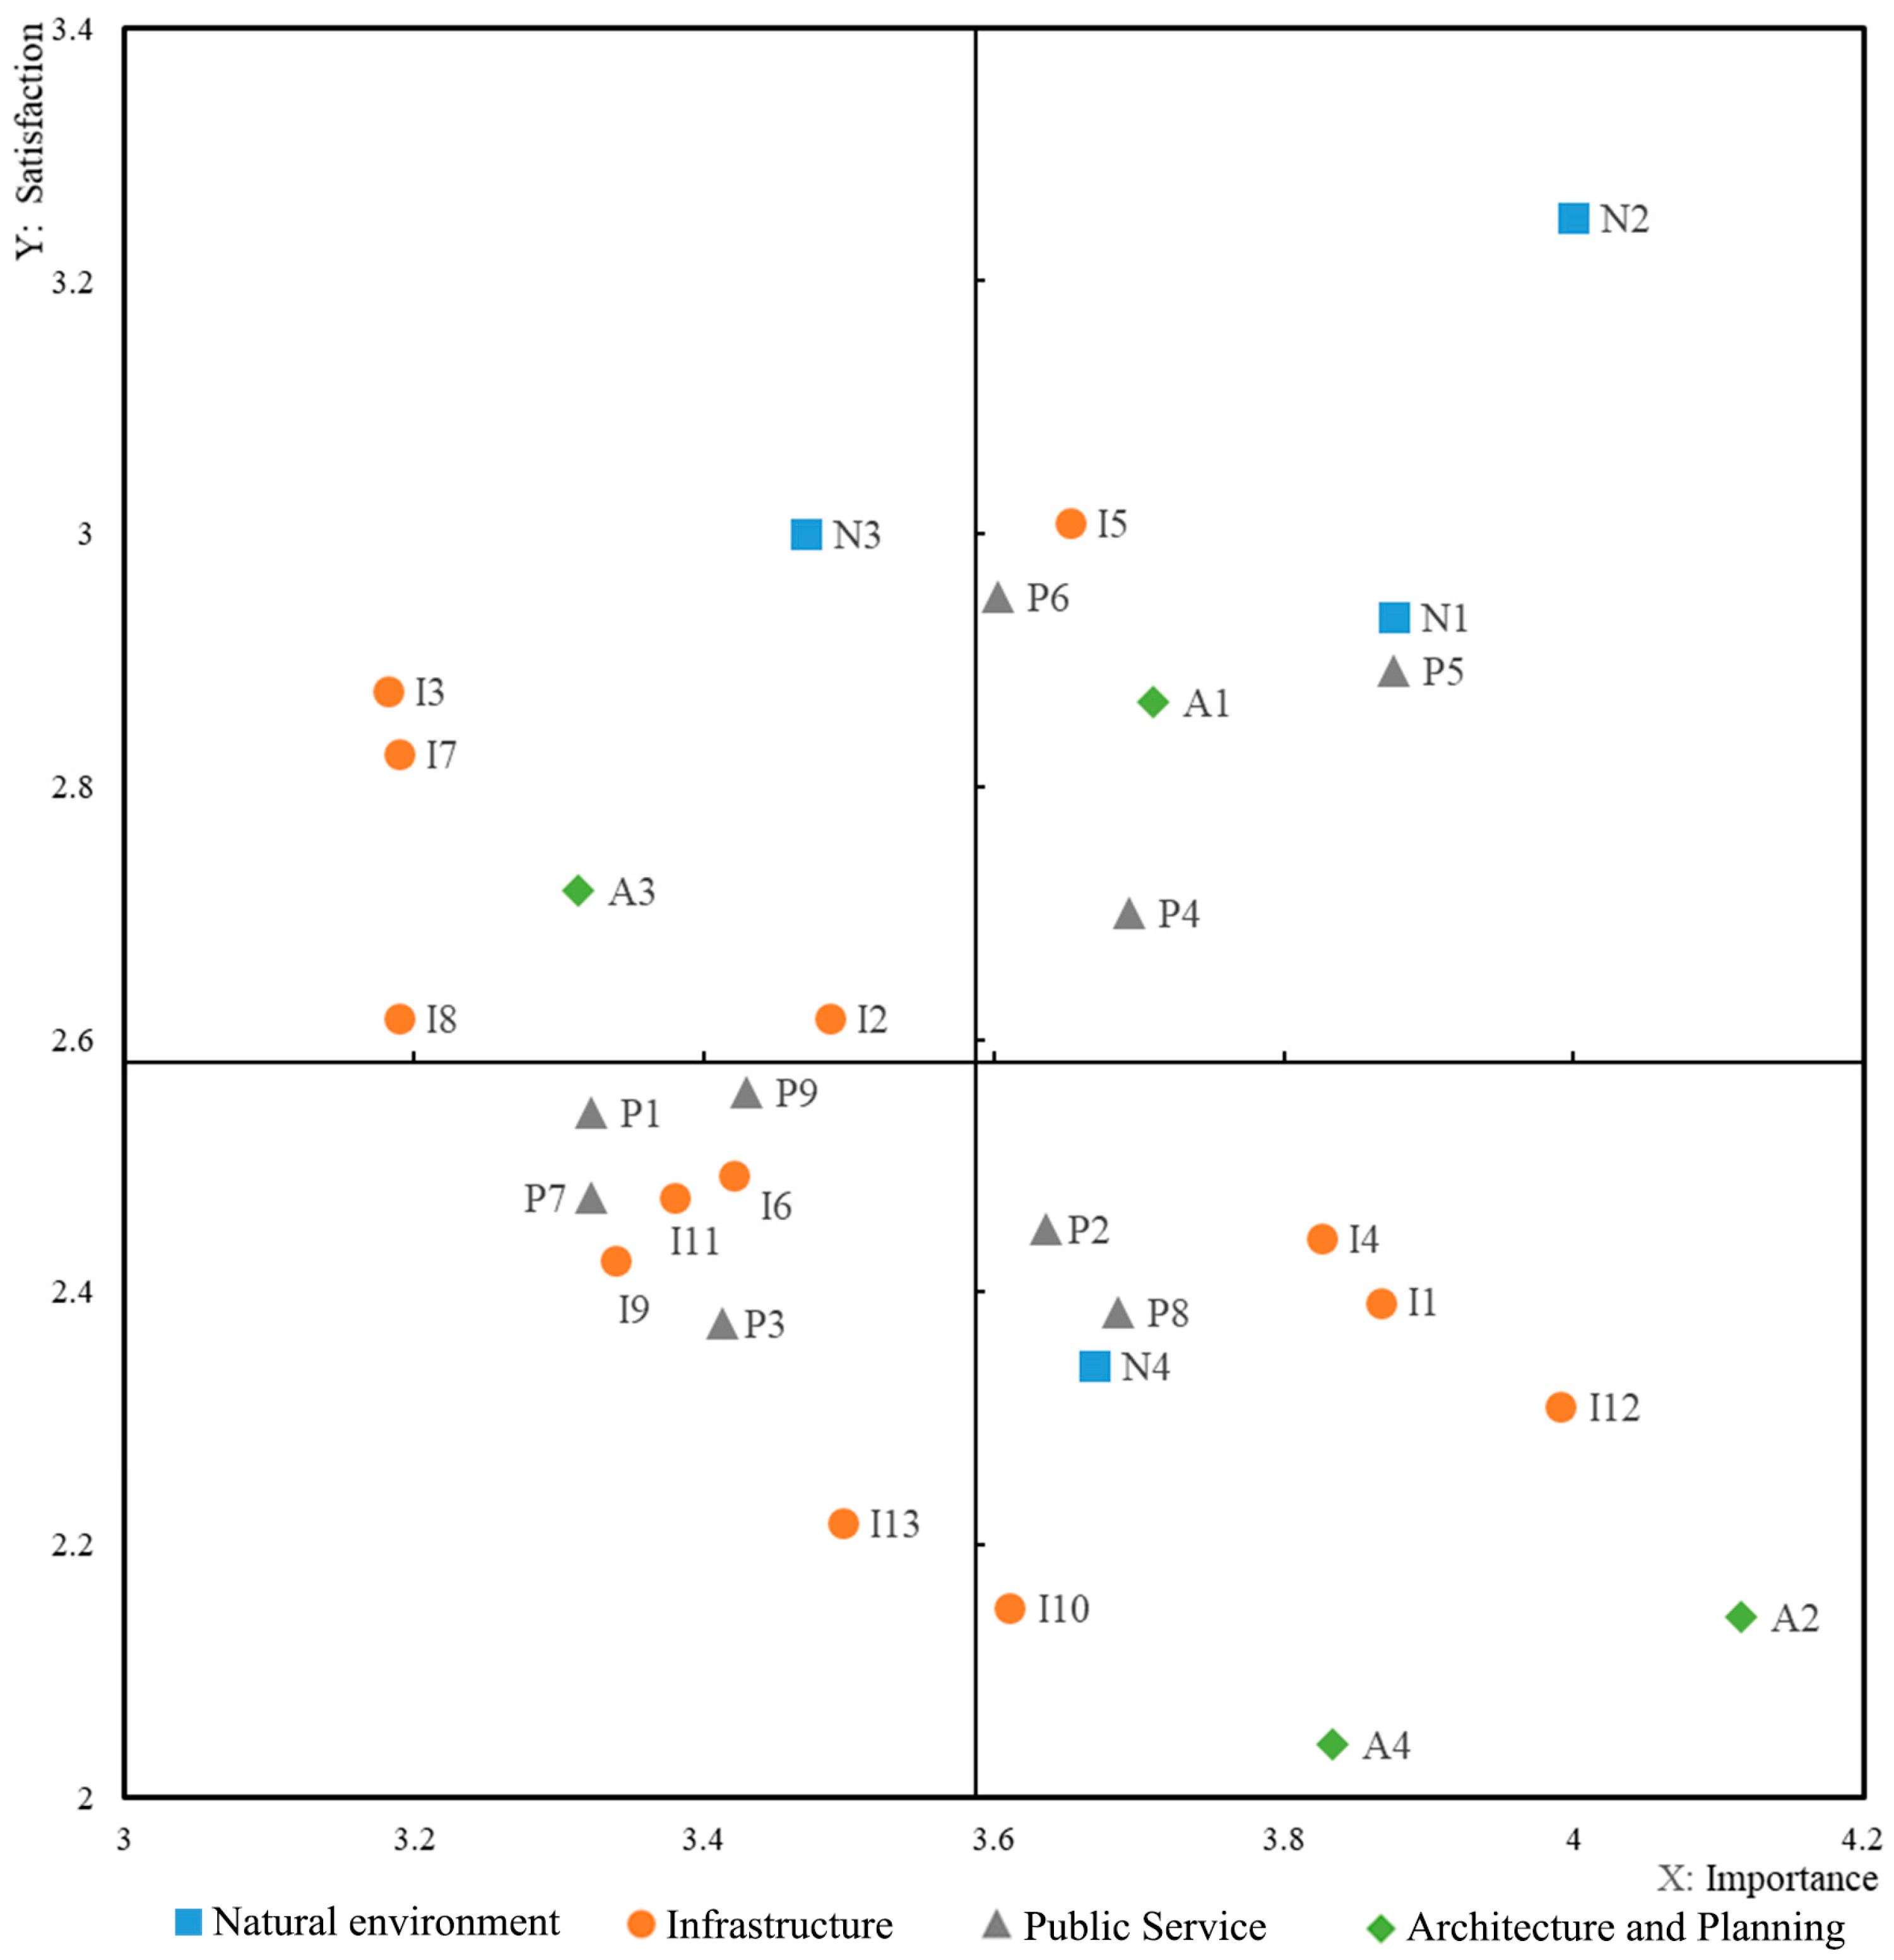
After calculating and analyzing the data in Table 5, it was found that the average value P, which represents the villagers’ degree of satisfaction with the 30 indicators, is approximately 3.59, and the average value I of importance level is approximately 2.64. Based on the intersection point (0.058, 3.76) of the P-axis and I-axis, the I-axis and S-axis perpendicular to the P-axis and I-axis are drawn, so that a two-dimensional graph consisting of four intervals is formed. The importance value (I) and satisfaction level (S) of the 30 indicators are, respectively, marked on the figure to obtain the IS matrix diagram (Figure 6).
6.3. Results of Kano–IS Integrated Analysis and Discussions
Given that the Kano model ignores the performance of attributes and importance, and that the IS model only considers one-dimensional quality attributes, the use of either of the above-mentioned methods has its shortcomings. Therefore, by combining the Kano model and the IS model, this study aims to study the classification of the renovation indicators of living environments in rural settlements in China, along with the relevant improvement strategies.
By integrating the 20 indicators extracted above, which have a great impact on satisfaction and dissatisfaction levels, with the 20 indicators that have a higher importance value, the common 14 indicators (A2, N2, I12, N1, P5, I1, A4, I4, P8, N4, P2, P6, I13, P9) can be obtained. According to the integration results of the SII–DDI matrix and the IS model, the 14 indicators will be key to improving the living environments in rural settlements of Fengxiang Village, and, consequently, officials can refer to these indicators to better renovate the village and to improve the satisfaction level of the villagers.
According to Figure 6, it can be concluded that the renovation indicators located in the first and second quadrants should continue to adopt maintenance strategies to maintain a high satisfaction level, as the villagers are relatively satisfied with these elements. As the importance level of the indicators in the first quadrant is more significant than that in the second quadrant, the elements in the first quadrant should accordingly be maintained before those in the second quadrant. The service-quality elements located in the third and fourth quadrants should continue to adopt improvement strategies to better their actual performance, as the villagers are not satisfied with these elements. As the importance level of the elements in the fourth quadrant is greater than that in the third quadrant, the elements in the fourth quadrant should accordingly be improved before those in the third quadrant.
In addition, different Kano attributes have different priorities. Among them, the must-be quality is a top priority, followed by the one-dimensional quality, the attractive quality, and the indifferent quality, in sequence. For the service-quality elements that share the same Kano attributes and are in the same IS quadrants, the policy priority is determined by the ratio of importance to satisfaction (I/S). A larger ratio indicates relatively greater importance and a lower satisfaction level of the elements, and therefore, a higher policy priority or vice versa. Therefore, the following rules of decision making can be further obtained.
- (1)
- Maintenance strategy priorities—the must-be quality element M enjoys the top priority, and quadrant I in the IS model covers the following elements: P5 medical and health facilities (1.34), N1 water quality (1.32), A1 planning and layout (1.29), N2 air (1.23), and I5 facilities for supplying electricity and gas (1.21); the one-dimensional quality element O has second priority, and quadrant II in the IS model covers the following elements: I2 parking facilities (1.33), N3 noise (1.16), and I3 drinking water facilities (1.11); the next order of priority is the attractive quality element, and P6 business service facilities located in the quadrant is higher than I8 banks and post offices (1.22), A3 building façade renovation (1.22), and I7 cultural and sports facilities (1.13) in quadrant II; and to follow is the indifferent quality element, P4 educational facilities. For the elements with the same Kano attributes in the same quadrant, the priority is determined by the ratio of importance to satisfaction (Table 5). Hence, the final maintenance strategy priorities from top to bottom are as follows: P5 > N1 > A1 > N2 > I5 > I2 > N3 > I3 > P6 > I8 > A3 > I7 > P4.
- (2)
- Improvement strategy priorities—the must-be quality element M is the top priority, and I10 garbage disposal (1.68) and I4 drainage facilities (1.57) in the IV quadrant of the IS matrix are better than the I13 entrances and exits to the village (1.58) and I6 public transportation facilities in the III quadrant (1.37), which therefore require prior improvement; the one-dimensional quality element O is the second priority, and quadrant IV in the IS matrix covers the following elements: A2 quality and restoration of buildings (1.92), A4 thermal and sound insulation of buildings (1.88), I12 security-monitoring facilities (1.73), I1 road (1.62), N4 public green space (1.57), and P8 outdoor lighting (1.55). P3 activity facilities is in the III quadrant (1.44); the attractive quality element is to be improved in the wake of other elements, and the sequence is P2 public activity areas in quadrant IV and I9 public washrooms (1.38), I11 road signs (1.37), P7 facilities for rest (1.34), P9 police stations (1.34), and P1 cultural and recreational activity facilities (1.31) in quadrant III. For the elements with the same Kano attributes and in the same quadrant, the priority is determined by the ratio of importance to satisfaction. Hence, the final improvement strategy priorities are as follows: I10 > I4 > I13 > I6 > A2 > A4 > I12 > I1 > N4 > P8 > P3 > P2 > I9 > I11 > P7 > P9 > P1.
Based on the above analysis and the renovation indicators extracted from the integrated analysis of the SII–DDI matrix and the IS model, it can be concluded that, for Fengxiang Village, these elements are the top five primary concerns for improvement: I10 garbage disposal, I4 drainage facilities, I13 safety gate, I6 public transport, and A2 quality and restoration of buildings. The villagers are currently dissatisfied with those elements that greatly impact their overall satisfaction with the village, meaning that more effort must be made to improve the status quo. Elements such as P5 medical and health facilities, N1 water quality, A1 layout, and N2 air are the top five indicators to be maintained first, in order, for they, on one hand, are directly related to the villagers’ satisfaction with the village and, on the other hand, currently enjoy a high satisfaction level. As shown from this perspective, the high quality of those elements should be maintained in a targeted manner. In order to produce a higher degree of satisfaction from the villagers, corresponding maintenance and management methods for each indicator should be implemented according to the investigation and diagnosis results, and resources should be distributed appropriately to maintain the strong ones and strengthen the weak ones. In that sense, resource-use efficiency will be maximized. Therefore, the Kano–IS decision analysis model proposed in this study can produce different decision results when applied in different rural areas, and accordingly, the goal of the bottom-up renovation is achieved.
7. Conclusions
The strategic planning of rural development is focused on both economic growth and sustainable development [4,59]. People have set higher demands for living in comfort in the post-pandemic era [60,61], which means that the sustainable renovation and reconstruction of living environments in rural settlements is urgently needed, with the ultimate goal being the contentment of villagers. Therefore, the sustainable improvement of living environments in rural settlements is of great significance for enhancing the living satisfaction of villagers and stimulating rural economic vitality. On this basis, this study proposed a new analytical model and pinpointed the focus of the renovation required. Based on a questionnaire survey conducted in Fengxiang Village, renovation indicators of sustainable living environment in rural settlements and maintenance strategy priorities were obtained with the aid of an integrated Kano–IS model. More specifically, based on the analysis of the questionnaire data collected from the case-based empirical research, this study determines the priorities for improvement and maintenance strategies based on the sustainable renovation indicators of living environments in rural settlements in China. Among them, the top five priorities for maintenance strategies are P5, N1, A1, N2, and I5, which should be maintained by rural managers when formulating policies. The top five priorities for improvement strategies are I10, I4, I13, I6, and A2, and their current statuses have the greatest impact on residents’ satisfaction. Rural managers should give priority to making improvements in the formulation of renovation policies to greatly improve the well-being of villagers. Targeted at issues that were revealed by the analysis, improvement suggestions to maintain the strong and strengthen the weak were also proposed to optimize the benefits of the government’s human and financial investment.
In this research, the Kano model and the IS analysis method were employed to create a model for the analysis of renovation indicators in order to improve rural human settlements in China, highlighting its theoretical significance, in terms of decision making, to reconstruct sustainable living environments in rural areas. This research practically explores the relationship between villagers’ degrees of satisfaction and the village’s performance after renewal and offers decision-making strategies for maintenance or improvement that are practically significant for guiding the renewal projects of living environments in rural settlements in China, as well as guiding the relevant government construction work.
Furthermore, this study integrates the Kano model with the IS analysis method and builds a decision-making model for the sustainable renovation of living environments in rural settlements after further optimization and innovation, making up for the shortcomings of ignoring the two-dimensional attributes of indicators when applying IS analysis alone, as well as avoiding insufficient consideration of the status quo of human settlements when applying the Kano model alone. Specifically, the decision-making model has the following strengths: (1) the Kano–IS integration model for identifying the indicators of the living environments in rural settlements is proposed from a two-dimensional perspective; (2) an evaluation process for sustainable living environments in rural settlements is constructed, and the Kano–IS scale of rural human conditions is designed; and (3) the key renovation indicators of sustainable living environments in rural settlements and the priorities of the corresponding maintenance or improvement strategies are discussed empirically.
This study thoroughly explored the Kano–IS integration model in a scientific manner. However, as time and resources are limited, this study did not carry out a more detailed cross-analysis and discussion of the personal attributes of the respondents (for example, gender, age, education, etc.). On the other hand, the model of this study was only applied in one practical case, and there may be some uncertainties in the future due to differences between villages with different climates in different regions of China. Therefore, it is recommended that the views of rural administrators and planners, who embody “top-down” and “bottom-up” decision making, should be added to the Kano–IS integration model. Furthermore, this model could be further optimized by applying it to living environments in rural settlements in other regions of China in the future.
Author Contributions
Conceptualization, Y.X.; methodology, Y.-K.J.; conceived and designed the field surveys, Y.X., S.L. and H.G.; performed the evaluations, Y.X.; analyzed the data, Y.X. and S.L. and Y.-K.J.; writing—original draft preparation, Y.X.; writing—review and editing, Y.X. and Y.-K.J.; visualization, Y.X. and H.L.; supervision, Y.X. All authors have read and agreed to the published version of the manuscript.
Funding
This research was funded by the Humanities and Social Sciences Program of the Ministry of Education of the People’s Republic of China, grant number 21YJEZH001 and the Sci-tech program of the Housing and Construction Bureau of Yangzhou, grant number 201904.
Data Availability Statement
The data that support the findings of this study are available from the first author, Y.X., upon reasonable request.
Acknowledgments
This work was supported by the innovative sci-tech platform cooperation project of Yangzhou City and Yangzhou University (Grant No. YZ2020262) and the Yangzhou University High-level Talent Research Start-up Fund (Grant No. 137012789). The authors would like to express their sincere gratitude to the anonymous reviewers and editors for their kind suggestions on manuscript proofreading. Appreciation is also due to all members of the research team for their invaluable contributions.
Conflicts of Interest
The authors declare no conflict of interest.
References
- Tosics, I. Habitat II Conference on Human Settlements, Istanbul, June 1996. Int. J. Urban Reg. Res. 1997, 21, 366–372. [Google Scholar] [CrossRef]
- Rollnick, R. World habitat day. Cities-engines of rural development. Habitat Debate 2004, 10, 4–19. [Google Scholar]
- Zande, R.V. Creating the Urban Village: Teaching Pre-Service Teachers about Sustainable Design in Architecture and Community Planning. Int. J. Art Des. Educ. 2010, 29, 321–329. [Google Scholar] [CrossRef]
- Ćurčić, N.; Mirković Svitlica, A.; Brankov, J.; Bjeljac, Ž.; Pavlović, S.; Jandžiković, B. The role of rural tourism in strengthening the sustainability of rural areas: The case of Zlakusa village. Sustainability 2021, 13, 6747. [Google Scholar] [CrossRef]
- Pitts, A.; Gao, Y.; Tien Le, V. Opportunities to Improve Sustainable Environmental Design of Dwellings in Rural Southwest China. Sustainability 2019, 11, 5515. [Google Scholar] [CrossRef]
- Central Committee of the Communist Party of China and the State Council. Strategic Plan for Rural Revitalization (2018–2022). Available online: http://www.moa.gov.cn/ztzl/xczx/xczxzlgh/201811/t20181129_6163953.htm (accessed on 13 April 2022).
- Pitts, A. Establishing priorities for sustainable environmental design in the rural villages of Yunnan, China. Buildings 2016, 6, 32. [Google Scholar] [CrossRef]
- Liu, C.; Wang, F.; MacKillop, F. A critical discussion of the BREEAM Communities method as applied to Chinese eco-village assessment. Sustain. Cities Soc. 2020, 59, 102172. [Google Scholar] [CrossRef]
- Dumreicher, H. Chinese villages and their sustainable future: The European Union-China-Research Project “SUCCESS”. J. Environ. Manag. 2008, 87, 204–215. [Google Scholar] [CrossRef]
- Smith, N.R. Beyond top-down/bottom-up: Village transformation on China’s urban edge. Cities 2014, 41, 209–220. [Google Scholar] [CrossRef]
- People’s Government of the People’s Republic of China. Five-Year Action Plan for Improvement of Rural Living Environment (2021–2025). Available online: http://www.gov.cn/xinwen/2021-12/05/content_5655984.htm (accessed on 29 March 2022).
- Fekete, A.; Herczeg, Á.; Ge, N.D.; Sárospataki, M. Participatory Landscape Design and Water Management—A Sustainable Strategy for Renovation of Vernacular Baths and Landscape Protection in Szeklerland, Romania. Land 2022, 11, 95. [Google Scholar] [CrossRef]
- Ministry of Housing and Urban-Rural Development of China. The Ministry of Housing and Urban-Rural Development Held a Meeting to Mobilize and Deploy the Three-Year Action for Rural Living Environment Improvement. 2018. Available online: http://www.gov.cn/xinwen/2018-04/12/content_5281914.htm (accessed on 21 March 2022).
- Rosin, Z.M.; Hiron, M.; Żmihorski, M.; Szymański, P.; Tobolka, M.; Pärt, T. Reduced biodiversity in modernized villages: A conflict between sustainable development goals. J. Appl. Ecol. 2020, 57, 467–475. [Google Scholar] [CrossRef]
- Ding, J.; Zhou, L. Research on Micro-renewal of Tourism Rural Public Space Based on Social Network Model: Taking the Mingyuewan Village in Suzhou as an Example (in Chinese version). Mod. Urban Res. 2021, 12, 48–52. [Google Scholar]
- Wan, L.; Ng, E. Evaluation of the social dimension of sustainability in the built environment in poor rural areas of China. Archit. Sci. Rev. 2018, 61, 319–326. [Google Scholar] [CrossRef]
- Zhu, H.; Li, J. Evaluation of Rural Environmental Suitability Based on SVR Model: Taking Tianmu Village in Lin’an District as an Example (in Chinese version). J. Southwest China Nor. Univ. 2022, 47, 72–81. [Google Scholar]
- Gilleard, C.; Hyde, M.; Higgs, P. The impact of age, place, aging in place, and attachment to place on the well-being of the over 50s in England. Res. Aging 2007, 29, 590–605. [Google Scholar] [CrossRef]
- Aragonés, J.I.; Amérigo, M.; Pérez-López, R. Residential satisfaction and quality of life. In Handbook of Environmental Psychology and Quality of Life Research; Springer: New York, NY, USA, 2017; pp. 311–328. [Google Scholar]
- Nguyen, P.T.; Wells, S.; Nguyen, N. A systemic indicators framework for sustainable rural community development. Syst. Pract. Act. Res. 2019, 32, 335–352. [Google Scholar] [CrossRef]
- Xu, Y.; Juan, Y.K. Optimal decision-making model for outdoor environment renovation of old residential communities based on WELL Community Standards in China. Archit. Eng. Des. Manag. 2021, 1–22. [Google Scholar] [CrossRef]
- Liu, Y.; Ke, X.; Wu, W.; Zhang, M.; Fu, X.; Li, J.; Jiang, J.; He, Y.; Zhou, C.; Li, W.; et al. Geospatial characterization of rural settlements and potential targets for revitalization by geoinformation technology. Sci. Rep. 2022, 12, 8399. [Google Scholar] [CrossRef] [PubMed]
- Wang, W.; Watanabe, M.; Ono, K.; Zhou, D. Exploring Visualisation Methodology of Landscape Design on Rural Tourism in China. Buildings 2022, 12, 64. [Google Scholar] [CrossRef]
- United Nations. SUC Guidelines and Local Pilot Actions: Help Cities and Communities in China and Developing Countries Realize SDG11 by 2030. Available online: https://sdgs.un.org/partnerships/suc-guidelines-and-local-pilot-actions-help-cities-and-communities-china-and (accessed on 4 August 2022).
- Amar, K.; Naya, K. Transition Strategies for Sustainable Community Systems; Springer: New York, NY, USA, 2019. [Google Scholar]
- ALP, S.Ç.; Bilgin, E.A. Understanding impacts of cultural tourism on sustainability of rural architecture in three villages of Bursa. J. Multidiscip. Acad. Tour. 2019, 4, 87–107. [Google Scholar]
- Kates, R.W. From the unity of nature to sustainability science: Ideas and practice. In Sustainability Science; Springer: New York, NY, USA, 2012; pp. 3–19. [Google Scholar]
- Woods, M. Rural; Routledge: London, The United Kingdom of Great Britain and Northern Ireland, 2011. [Google Scholar]
- Li, Y.; Westlund, H.; Liu, Y. Why some rural areas decline while some others not: An overview of rural evolution in the world. J. Rural Stud. 2019, 68, 135–143. [Google Scholar] [CrossRef]
- Roche, M. Rural geography: Searching rural geographies. Prog. Hum. Geogr. 2022, 26, 823–829. [Google Scholar] [CrossRef]
- Lovejoy, K.; Handy, S.; Mokhtarian, P. Neighborhood satisfaction in suburban versus traditional environments: An evaluation of contributing characteristics in eight California neighborhoods. Landsc. Urban Plan. 2010, 97, 37e48. [Google Scholar] [CrossRef]
- Yang, Y. A tale of two cities: Physical form and neighborhood satisfaction in metropolitan Portland and Charlotte. J. Am. Plann. Assoc. 2008, 74, 307–323. [Google Scholar] [CrossRef]
- Yin, J.; Cao, X.J.; Huang, X.; Cao, X. Applying the IPA–Kano model to examine environmental correlates of residential satisfaction: A case study of Xi’an. Habitat Int. 2016, 53, 461–472. [Google Scholar] [CrossRef]
- Serrano-Jiménez, A.; Lima, M.L.; Molina-Huelva, M.; Barrios-Padura, Á. Promoting urban regeneration and aging in place: APRAM–An interdisciplinary method to support decision-making in building renovation. Sustain. Cities Soc. 2019, 47, 101505. [Google Scholar] [CrossRef]
- Serrano-Jiménez, A.; Barrios-Padura, Á.; Molina-Huelva, M. Sustainable building renovation for an ageing population: Decision support system through an integral assessment method of architectural interventions. Sustain. Cities Soc. 2018, 39, 144–154. [Google Scholar] [CrossRef]
- Gao, J.; Wu, B. Revitalizing traditional villages through rural tourism: A case study of Yuanjia Village, Shaanxi Province, China. Tour. Manag. 2017, 63, 223–233. [Google Scholar] [CrossRef]
- Shen, Y.; Wang, C. Optimisation of garbage bin layout in rural infrastructure for promoting the renovation of rural living environmentss: Case study of Yuding village in China. Int. J. Environ. Res. Public Health 2021, 18, 11633. [Google Scholar] [CrossRef]
- Ciałkowska, M.; Adamowski, T.; Piotrowski, P.; Kiejna, A. What is the Delphi method? Strengths and shortcomings. Psychiatr. Pol. 2008, 42, 5–15. [Google Scholar]
- Chalmers, J.; Armour, M. The delphi technique. In Handbook of Research Methods in Health Social Sciences; Springer: New York, NY, USA, 2019. [Google Scholar]
- Saaty, T.L. How to Make a Decision: The Analytic Hierarchy Process. Interfaces 1994, 24, 19–43. [Google Scholar] [CrossRef]
- Rayens, M.K.; Hahn, E.J. Building Consensus Using the Policy Delphi Method. Policy Polit. Nurs. Pract. 2000, 1, 308–315. [Google Scholar] [CrossRef]
- Kano, N. Attractive quality and must-be quality. J. Jpn. Soc. Qual. Control 1984, 14, 39–48. [Google Scholar]
- Baier, D.; Rese, A. How to increase multichannel shopping satisfaction? An adapted Kano based stage-gate approach to select new technologies. J. Retail. Consum. Serv. 2020, 56, 102172. [Google Scholar] [CrossRef]
- Xu, Q.; Jiao, R.J.; Yang, X.; Helander, M.; Khalid, H.M.; Opperud, A. An analytical Kano model for customer need analysis. Des. Stud. 2009, 30, 87–110. [Google Scholar] [CrossRef]
- Lin, S.P.; Yang, C.L.; Chan, Y.H.; Sheu, C. Refining Kano’s ‘quality attributes–satisfaction’model: A moderated regression approach. Int. J. Prod. Econ. 2010, 126, 255–263. [Google Scholar] [CrossRef]
- Juan, Y.K.; Huang, S.J.H.; Chen, H.T. Applying a Kano quality model for intelligent green building design strategies in Taiwan. Int. J. Strateg. Prop. Manag. 2014, 18, 125–137. [Google Scholar] [CrossRef]
- Berger, A.N.; Hunter, W.C.; Timme, S.G. The efficiency of financial institutions: A review and preview of research past, present and future. J. Bank. Financ. 1993, 17, 221–249. [Google Scholar] [CrossRef]
- Martilla, J.A.; James, J.C. Importance-performance analysis. J. Mark. 1977, 41, 77–79. [Google Scholar] [CrossRef]
- Yang, C.C. Improvement actions based on the customers’ satisfaction survey. Total Qual. Manag. Bus. 2003, 14, 919–930. [Google Scholar] [CrossRef]
- Fidel, R. The case study method: A case study. Libr. Inf. Sci. Res. 1984, 6, 273–288. [Google Scholar]
- Tellis, W. Introduction to case study. Qual. Rep. 1997, 3, 1–14. [Google Scholar] [CrossRef]
- Grässel, E.; Schirmer, B. The use of volunteers to support family carers of dementia patients: Results of a prospective longitudinal study investigating expectations towards and experience with training and professional support. Z. Gerontol. Geriatr. 2006, 39, 217–226. [Google Scholar] [PubMed]
- Taylor, S.; Berridge, V. Medicinal plants and malaria: An historical case study of research at the London School of Hygiene and Tropical Medicine in the twentieth century. Trans. R. Soc. Trop. Med. Hyg. 2006, 100, 707–714. [Google Scholar] [CrossRef]
- Herrera, S.; Cruz, C.; Ramírez, Y.; Cisternas, L. Conceptual process design for Boric Acid: A case study for engineering education. Comput. Aided Chem. Eng. 2016, 38, 1437–1442. [Google Scholar]
- Xu, Y.; Juan, Y.K. Design strategies for multi-unit residential buildings during the post-pandemic era in China. Front. Public Health 2021, 9, 761614. [Google Scholar] [CrossRef]
- Chen, Y.; Zhong, Y.; Yu, S.; Xiao, Y.; Chen, S. Exploring Bidirectional Performance of Hotel Attributes through Online Reviews Based on Sentiment Analysis and Kano-IPA Model. Appl. Sci. 2022, 12, 692. [Google Scholar] [CrossRef]
- Chen, H.T.; Chen, B.T. Integrating Kano model and SIPA grid to identify key service attributes of fast food restaurants. J. Qual. Assur. Hosp. Tour. 2015, 16, 141–163. [Google Scholar] [CrossRef]
- Wu, H.-H.; Tang, Y.-T.; Shyu, J.-W. An integrated approach of Kanos model and importance-performance analysis in identifying key success factors. S. Afr. J. Bus. Manag. 2010, 4, 3238–3250. [Google Scholar]
- Pellegrini, P.; Chen, J. Sustainable Urban Renewal and Densification in China: The Case of Suzhou in the Yangtze River Delta Region. Preprints 2021, 2021040735. [Google Scholar] [CrossRef]
- Ma, M.; Adeney, M.; Long, H. Functional Settings of Hospital Outdoor Spaces and the Perceptions from Public and Hospital Occupant during COVID-19. Healthcare 2021, 9, 1534. [Google Scholar] [CrossRef] [PubMed]
- Ma, M.; Adeney, M.; Chen, W.; Deng, D.; Tan, S. To create a safe and healthy place for children: The associations of green open space characteristics with children’s use. Front. Public Health 2022, 9, 813976. [Google Scholar] [CrossRef] [PubMed]
Figure 1.
Kano model of quality attributes.

Figure 2.
Importance–satisfaction model (IS model).

Figure 3.
Research framework.

Figure 4.
Current living environment situation in Fengxiang village.

Figure 5.
SII–DDI matrix diagram.

Figure 6.
IS matrix diagram.


Table 1.
Kano evaluation table.
| Customer Requirements | Dysfunctional | |||||
|---|---|---|---|---|---|---|
| 1. Like | 2. Must be | 3. Neutral | 4. Live with | 5. Dislike | ||
| Functional | 1. Like | Q | A | A | A | O |
| 2. Must be | R | I | I | I | M | |
| 3. Neutral | R | I | I | I | M | |
| 4. Live with | R | I | I | I | M | |
| 5. Dislike | R | R | R | R | O | |
Table 2.
The sustainable renovation indicators of living environment in rural settlements.
| Dimension | Indicators | |
|---|---|---|
| No. | Name | |
| Natural Environment (N) | N1 | Water quality |
| N2 | Air | |
| N3 | Noise | |
| N4 | Public lawn | |
| Infrastructure (I) | I1 | Road |
| I2 | Parking facilities | |
| I3 | Drinking water facilities | |
| I4 | Drainage facilities | |
| I5 | Facilities for supplying electricity and gas | |
| I6 | Public transport | |
| I7 | Cultural and sports facilities | |
| I8 | Banks and post offices | |
| I9 | Public toilet | |
| I10 | Garbage disposal | |
| I11 | Wayfinding signs | |
| I12 | Security-monitoring facilities | |
| I13 | Safety gate | |
| Public Service (P) | P1 | Cultural and recreational facilities |
| P2 | Public event space | |
| P3 | Activity facilities | |
| P4 | Educational facilities | |
| P5 | Medical and health facilities | |
| P6 | Business service facilities | |
| P7 | Recreation facilities | |
| P8 | Outdoor lighting | |
| P9 | Police station | |
| Architecture and Planning (A) | A1 | Layout |
| A2 | Quality and restoration of buildings | |
| A3 | Building facade renovation | |
| A4 | Thermal and sound insulation of buildings | |
Table 3.
Decision sequence of quality factors.
| Kano Attribute | IS Quadrant | I/S Ratio | Importance | Satisfaction | Improvement Order | Maintained Order |
|---|---|---|---|---|---|---|
| Must-be quality | Ⅰ | Large | High | High | - | 1 |
| Small | High | High | - | 2 | ||
| Ⅱ | Large | Low | High | - | 3 | |
| Small | Low | High | - | 4 | ||
| Ⅲ | Large | Low | Low | 3 | - | |
| Small | Low | Low | 4 | - | ||
| Ⅳ | Large | High | Low | 1 | - | |
| Small | High | Low | 2 | - | ||
| One-dimension quality | Ⅰ | Large | High | High | - | 5 |
| Small | High | High | - | 6 | ||
| Ⅱ | Large | Low | High | - | 7 | |
| Small | Low | High | - | 8 | ||
| Ⅲ | Large | Low | Low | 7 | - | |
| Small | Low | Low | 8 | - | ||
| Ⅳ | Large | High | Low | 5 | - | |
| Small | High | Low | 6 | - | ||
| Attractive quality | Ⅰ | Large | High | High | - | 9 |
| Small | High | High | - | 10 | ||
| Ⅱ | Large | Low | High | - | 11 | |
| Small | Low | High | - | 12 | ||
| Ⅲ | Large | Low | Low | 11 | - | |
| Small | Low | Low | 12 | - | ||
| Ⅳ | Large | High | Low | 9 | - | |
| Small | High | Low | 10 | - |
Table 4.
Attribute classification of Kano indicators and calculated values of SII and DDI for each quality.
Table 4.
Attribute classification of Kano indicators and calculated values of SII and DDI for each quality.
| Secondary Indicators | A | O | M | I | Kano Quality | SII | DDI |
|---|---|---|---|---|---|---|---|
| N1 | 23 | 29 | 52 | 17 | M | 0.43 | −0.67 |
| N2 | 14 | 26 | 73 | 8 | M | 0.33 | −0.82 |
| N3 | 20 | 46 | 36 | 19 | O | 0.55 | −0.68 |
| N4 | 35 | 53 | 25 | 8 | O | 0.73 | −0.64 |
| I1 | 39 | 44 | 32 | 6 | O | 0.69 | −0.63 |
| I2 | 17 | 47 | 34 | 23 | O | 0.53 | −0.67 |
| I3 | 31 | 39 | 25 | 26 | O | 0.58 | −0.53 |
| I4 | 16 | 31 | 64 | 10 | M | 0.39 | −0.79 |
| I5 | 29 | 23 | 53 | 16 | M | 0.43 | −0.63 |
| I6 | 23 | 39 | 45 | 14 | M | 0.51 | −0.69 |
| I7 | 38 | 27 | 34 | 22 | A | 0.54 | −0.50 |
| I8 | 51 | 20 | 30 | 20 | A | 0.59 | −0.41 |
| I9 | 52 | 17 | 23 | 29 | A | 0.57 | −0.33 |
| I10 | 24 | 23 | 44 | 30 | M | 0.39 | −0.55 |
| I11 | 48 | 27 | 30 | 16 | A | 0.62 | −0.47 |
| I12 | 22 | 56 | 31 | 12 | O | 0.64 | −0.72 |
| I13 | 26 | 37 | 52 | 6 | M | 0.52 | −0.74 |
| P1 | 56 | 18 | 24 | 23 | A | 0.61 | −0.35 |
| P2 | 51 | 26 | 21 | 23 | A | 0.64 | −0.39 |
| P3 | 27 | 41 | 38 | 15 | O | 0.56 | −0.65 |
| P4 | 22 | 31 | 26 | 42 | I | 0.44 | −0.47 |
| P5 | 20 | 35 | 59 | 7 | M | 0.45 | −0.78 |
| P6 | 49 | 25 | 36 | 11 | A | 0.61 | −0.50 |
| P7 | 35 | 31 | 32 | 23 | A | 0.55 | −0.52 |
| P8 | 38 | 40 | 33 | 10 | O | 0.64 | −0.60 |
| P9 | 29 | 25 | 57 | 10 | A | 0.45 | −0.68 |
| A1 | 29 | 28 | 53 | 11 | M | 0.47 | −0.67 |
| A2 | 37 | 67 | 15 | 2 | O | 0.86 | −0.68 |
| I11 | 52 | 21 | 34 | 14 | A | 0.60 | −0.45 |
| I12 | 39 | 51 | 23 | 8 | O | 0.74 | −0.61 |
| Average value | 0.555 | −0.594 |
Table 5.
Decision sequence of quality factors.
| Indicators | Mean Value of Importance | Mean Value of Satisfaction | I/S |
|---|---|---|---|
| N1 | 3.88 | 2.93 | 1.32 |
| N2 | 4.00 | 3.25 | 1.23 |
| N3 | 3.47 | 3.00 | 1.16 |
| N4 | 3.67 | 2.34 | 1.57 |
| I1 | 3.87 | 2.39 | 1.62 |
| I2 | 3.49 | 2.62 | 1.33 |
| I3 | 3.18 | 2.88 | 1.11 |
| I4 | 3.83 | 2.44 | 1.57 |
| I5 | 3.65 | 3.01 | 1.21 |
| I6 | 3.42 | 2.49 | 1.37 |
| I7 | 3.19 | 2.83 | 1.13 |
| I8 | 3.19 | 2.62 | 1.22 |
| I9 | 3.34 | 2.43 | 1.38 |
| I10 | 3.61 | 2.15 | 1.68 |
| I11 | 3.38 | 2.48 | 1.37 |
| I12 | 3.99 | 2.31 | 1.73 |
| I13 | 3.50 | 2.22 | 1.58 |
| P1 | 3.32 | 2.54 | 1.31 |
| P2 | 3.64 | 2.45 | 1.48 |
| P3 | 3.41 | 2.38 | 1.44 |
| P4 | 3.69 | 2.70 | 1.37 |
| P5 | 3.88 | 2.89 | 1.34 |
| P6 | 3.60 | 2.95 | 1.22 |
| P7 | 3.32 | 2.48 | 1.34 |
| P8 | 3.69 | 2.38 | 1.55 |
| P9 | 3.43 | 2.56 | 1.34 |
| A1 | 3.71 | 2.87 | 1.29 |
| A2 | 4.12 | 2.14 | 1.92 |
| A3 | 3.31 | 2.72 | 1.22 |
| A4 | 3.83 | 2.04 | 1.88 |
Publisher’s Note: MDPI stays neutral with regard to jurisdictional claims in published maps and institutional affiliations. |
© 2022 by the authors. Licensee MDPI, Basel, Switzerland. This article is an open access article distributed under the terms and conditions of the Creative Commons Attribution (CC BY) license (https://creativecommons.org/licenses/by/4.0/).
Share and Cite
MDPI and ACS Style
Xu, Y.; Li, S.; Juan, Y.-K.; Guo, H.; Lin, H. A Kano–IS Model for the Sustainable Renovation of Living Environments in Rural Settlements in China. Buildings 2022, 12, 1230. https://doi.org/10.3390/buildings12081230
AMA Style
Xu Y, Li S, Juan Y-K, Guo H, Lin H. A Kano–IS Model for the Sustainable Renovation of Living Environments in Rural Settlements in China. Buildings. 2022; 12(8):1230. https://doi.org/10.3390/buildings12081230
Chicago/Turabian StyleXu, Yanqing, Shengcai Li, Yi-Kai Juan, Hongxia Guo, and Hanfei Lin. 2022. "A Kano–IS Model for the Sustainable Renovation of Living Environments in Rural Settlements in China" Buildings 12, no. 8: 1230. https://doi.org/10.3390/buildings12081230
Note that from the first issue of 2016, this journal uses article numbers instead of page numbers. See further details here.