
Spatial Differences in Outdoor Thermal Comfort during the Transition Season in Cold Regions of China
by
 , , and
Fei Guo
1 ,
,
Zuoxing Wang
1,
Jing Dong
1,*,
Hongchi Zhang
1,
Xiaodong Lu
1,
Stephen Siu Yu Lau
2 and
and
Yijia Miao
3 1
School of Architecture and Fine Art, Dalian University of Technology, Dalian 116023, China
2
Department of Architecture, Shenzhen University, Shenzhen 518060, China
3
Faculty of Architecture, The University of Hong Kong, Hong Kong 999077, China
*
Author to whom correspondence should be addressed.
Buildings 2022, 12(6), 720; https://doi.org/10.3390/buildings12060720
Submission received: 7 May 2022
/
Revised: 24 May 2022
/
Accepted: 24 May 2022
/
Published: 26 May 2022
(This article belongs to the Special Issue Thermal Comfort in Built Environment)
Abstract
:This study investigates the differences in outdoor thermal comfort in different spatial types over long-term observations during the transition season in a cold region. Using the Universal Thermal Climate Index (UTCI) as an evaluation index, subjective questionnaires and field surveys were conducted on thermal comfort in three different typical outdoor environments (sunlight, tree shade and building shade) in Dalian (Northeast China). The results demonstrated the following: (1) Air temperature and mean radiant temperature were the dominant meteorological factors affecting outdoor thermal comfort in Dalian. (2) The main thermal sensation recorded in the transition season was “slightly cool”. Over time, the human thermal sensation experienced a gradual transition from “hot” to “cold”. (3) Compared with direct sunlight, the average UTCI decreased by 6.6 and 3.5 °C for building shade and tree shade environments, and the neutral UTCI in Dalian was found to be 18.8 °C. Subjects were most sensitive to the thermal environment in building shade, then in tree shade and the least in sunlight. (4) When UTCI ≥ 21.9 °C, the thermal acceptability rate in building shade remained the highest; when 10.2 °C ≤ UTCI < 21.9 °C, it was highest in tree shade; and when the UTCI < 10.2 °C, it was highest in sunlight. This study verifies the UTCI applicability in the transition season in cold regions and analyzes the spatial differences in human thermal comfort. These differences play a positive role in developing optimization strategies for outdoor thermal environments, improving environmental satisfaction and facilitating pedestrian outdoor activities.
1. Introduction
Rapid urbanization and global warming have led to a series of urban issues related to the environment, such as the urban heat island effect, air quality deterioration and increases in building energy consumption [1,2]. These environmental problems not only affect indoor and outdoor thermal environmental qualities, but also lead to a significant increase in the human discomfort index, which in turn affects people’s lifestyles, causes health risk problems and has caused huge social and economic losses [3,4]. Outdoor public spaces are important places in which people gather, communicate and participate in activities, and thermal comfort is the most important environmental factor affecting people’s participation in outdoor activities [2,5]. Knez and Thorsson [6] showed that when thermal comfort level was within the acceptable range, people tended to stay outdoors for about 19–21 min longer; when thermal comfort level was not within the acceptable range, they stayed about 11 min shorter. In addition, increased outdoor activity time can significantly improve life satisfaction and health [7] and effectively reduce building energy consumption for air conditioning and artificial lighting [8]. Therefore, understanding outdoor thermal comfort is essential for designing livable public spaces and enhancing urban vitality.
In recent years, outdoor thermal comfort research has garnered extensive attention worldwide [9,10,11]. However, compared to a great number of indoor thermal environment studies, the thermal comfort of outdoor spaces is still relatively unknown [12,13]. This is partly due to the fact that people exhibit rich and variable thermal experiences and thermal expectations in outdoor spaces in different seasons compared to stable indoor thermal environments [14,15]. Table 1 summarizes various research on outdoor thermal comfort under different climatic conditions over the last decade [9,15,16,17,18,19,20,21,22,23,24,25,26,27,28]. Currently, most investigations have focused on summer (stable high temperatures) and winter (stable low temperatures) when the changes in weather are relatively smooth, or on all seasons. For example, Jin et al. [15] conducted a one-year on-site survey in Harbin (1 day for each season) and found that people’s preference for thermal comfort varied seasonally. However, limited targeted research has focused on the transitional seasons, which have the greatest variability in weather during the year. During the transition seasons in areas with distinct seasons, people tend to spend more time in outdoor public spaces due to mild weather conditions. In addition, the transition seasons are at a critical turning juncture in the seasons. People acclimatize to heat in the summer and cold in winter and readjust through acclimatization during the transition seasons between winter and summer [29] when outdoor thermal comfort is usually between acceptable and unacceptable. Compared with other seasons, climate parameters fluctuate more during different times of the transition seasons and people’s feelings of warm and cold change dramatically and are more sensitive to temperature changes [29,30,31]. Therefore, the transition seasons are seasons where the outdoor thermal environment is dynamically changing and more elastic, and it is necessary to conduct long-term investigations into outdoor thermal comfort in the transition seasons to improve thermal comfort and extend outdoor activity times.
Thermal comfort in outdoor spaces is impacted by many factors. Of these, meteorological factors (e.g., temperature, humidity, solar radiation and wind speed) are the most influential affecting factors [28,32], and people’s thermal sensations in different regions are affected by meteorological parameters to different degrees [4]. For example, Lai et al. [33] found that air temperature was the main factor affecting thermal sensation in Tianjin (cold region), followed by solar radiation and relative humidity. In severely cold regions, Yin et al. [4] found that outdoor thermal sensation votes positively correlated with air temperature and globe temperature and negatively correlated with wind speed. Air temperature and solar radiation were the primary factors affecting thermal sensation, while the results of Jin et al. [32] indicated that only air temperature had an effect on thermal comfort during the cold season in severely cold regions. In the transition seasons, air temperature and solar radiation affected thermal comfort; Zeng et al. [34] discovered the strongest positive correlation between thermal perception votes of visitors and air temperature in hot and humid regions. Therefore, determining the relative importance of different meteorological parameters is particularly important for urban space design.
In addition, outdoor thermal comfort is also affected by some non-meteorological factors, including perspiration rate, thermal experience, thermal preference, culture, gender, age and space type [15,35,36]. From the perspective of controllability of environmental improvements, space type is relatively important. Meanwhile, mitigation strategies are usually more homogeneous in summer and winter, with people preferring to be in shady and windy environments in summer and in the sun in winter. In contrast, during the more sensitive transition seasons, people’s active adaptation and environmental mitigation strategies are usually diverse, which means that different space types need to be provided to meet people’s thermal comfort needs. Spatial heterogeneity in built-up urban areas creates local-scale and micro-scale climates that vary widely across space and time [37]. Several studies have investigated the effects of space types on outdoor thermal comfort, demonstrating that spaces such as building shade and tree shade can reduce direct short-wave radiation and lower surface temperatures. In addition, different shading levels change different degrees of radiation penetration and cooling effects [38,39]. Air temperatures in tree-shaded areas in Singapore [40], Bangalore [41] and Melbourne [42] were reported to be 1.1, 5.6 and 0.9 °C lower than those in non-shaded areas, respectively. Middel et al. [37] found that shade reduced thermal sensation votes by approximately 1 unit, increasing thermal comfort in all seasons except winter, and the effects of photovoltaic canopies and tree shade were similar. Colter et al. [43] showed that tree shade and artificial shading were not similarly effective at improving outdoor thermal comfort. Watanabe et al. [44] found pavilion and pergola shade can reduce the universal effective temperature by 18.4 and 16.2 °C, respectively. Tree shade can reduce daytime air temperature, Physiological Equivalent Temperature and Universal Thermal Climate Index (UTCI) by 0.4, 0.1 and 0.5 °C (respectively) more than building shade [35]. Jamei et al. [45] summarized the effects of the sky view factors (SVFs) and street orientation on outdoor thermal comfort and found that most studies were conducted in hot and humid climates, hot and dry climates, Mediterranean climates and subtropical climates, with little research conducted in cold regions [28]. Therefore, more studies are needed to understand the differences in outdoor thermal comfort in different spatial types in cold regions during the transition seasons.
This review shows that current studies have primarily focused on the thermal comfort differences under hot (summer), cold (winter) or all-season climate conditions and lack long-term targeted investigations on the transition seasons with the largest range of weather changes when people are most sensitive to weather changes and spend the longest time on outdoor activities. In addition, since thermal comfort results are quite sensitive to area and time [9,39], it is necessary to conduct detailed in situ and long-term investigations on thermal perception in cold regions during the transition seasons, clarify the distribution of thermal comfort over time in different space types and further verify the accuracy and applicability of thermal comfort indexes to improve outdoor space utilization and provide information for optimizing their designs.
Combining meteorological measurements and subjective thermal sensation questionnaires, the UTCI, which has been proven accurate in many studies, was selected to study outdoor thermal comfort in cold regions during the transition season. This paper selected three typical outdoor environments (sunlight, tree shade and building shade) under five different spatial types on a campus in Dalian, a cold region of China, and investigated the differences in outdoor thermal comfort in different spatial types over long-term observations in the transition season, with three specific objectives: (1) to analyze the relationship between meteorological parameters and people’s thermal perceptions and propose important meteorological factors affecting thermal comfort; (2) to compare thermal comfort differences among different spatial types, including thermal perceptions and thermal preferences; and (3) to verify UTCI applicability under long-term observations of the transition season in cold regions, to propose an outdoor thermal comfort benchmark for the transition season in Dalian, China, and to elucidate the spatial differences in neutral temperature and acceptable temperature range. The findings could provide a theoretical basis and technical guidance for spatial optimization to create a comfortable thermal environment in different open spaces.
2. Study Area
Dalian is an important port and scenic tourist city in the southernmost part of the Liaodong Peninsula in China (38.9° N, 121.6° E). According to the Köppen–Geiger climate classification system, the city has a temperate monsoon climate (Dwa). In the Thermal Design Code for Civil Buildings (GB 50176–2016), Dalian is divided into cold zone B. Coupled with its geographical environment as a peninsula hemmed in by mountains, its climate is characterized by four distinct seasons and a mild climate. According to the statistical yearbook, the annual average temperature in the central area of Dalian city is about 10.5 °C, with a significant upward trend and an increase rate of 3.45 °C/100 years; the annual extreme maximum temperature is about 35 °C; the annual extreme minimum temperature is −28 to −18 °C; and the annual average relative air humidity is 64–70%.
Field trials were conducted on the campus of the Dalian University of Technology, located in central Dalian. As it is an open area for college students to communicate and gather, creating a thermally comfortable campus environment helps relieve stress and improve physical and psychological health [2]. Five typical open spaces in the research area were selected according to the space types. These spaces are the most active outdoor public spaces on campus with rich landscape elements and complete outdoor facilities and are ideal for studying outdoor thermal comfort. The open spaces were designated A to E. Three different outdoor environments (sunlight, tree shade and building shade) were selected as survey points for each space, numbered 1, 2 and 3, respectively, and fish-eye photographs were taken to determine the SVF for each survey point (Table 2). The SVF values differed among the survey points, proving that the selected points were significantly different and could represent spatial types with different characteristics in the study area. In addition, due to the lack of trees, only two environmental experiments (sunlight and building shade) were conducted at point B.
3. Materials and Methods
Figure 1 shows a flowchart of the methodology used in this study. Firstly, the transitional season for this study was determined. Secondly, a field survey of three different outdoor environments in five typical open spaces was conducted using a combination of objective measurements and subjective questionnaires. Finally, the differences in outdoor thermal comfort in different spatial types were investigated.
3.1. Determination of the Transition Season
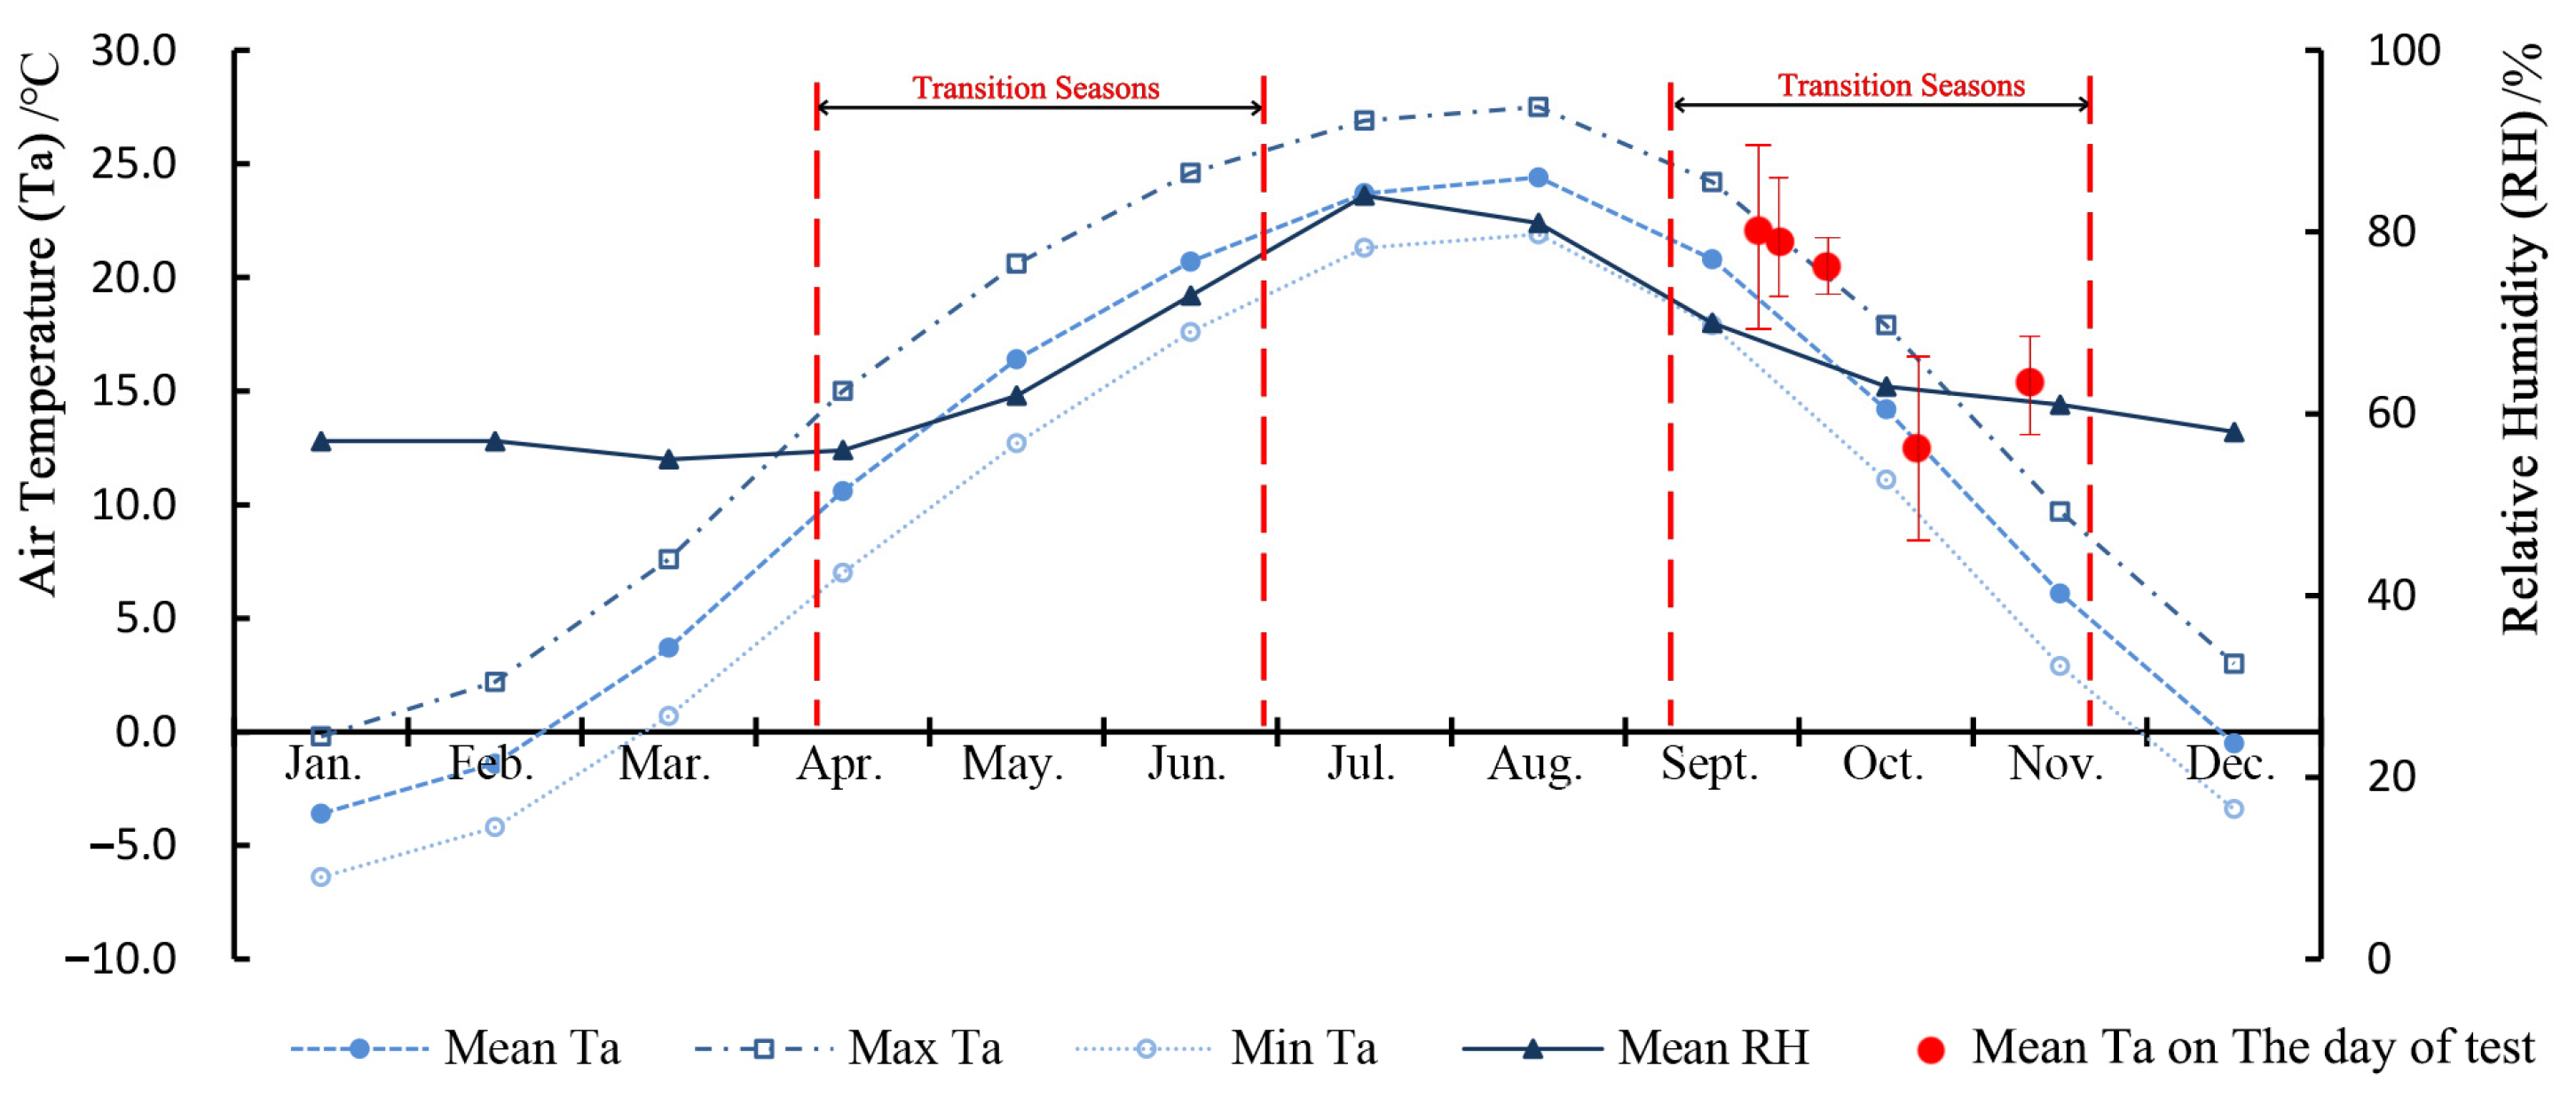
In cold region cities, Culjat [46] proposed the concept of an “outdoor season” suggesting that people can be comfortable by wearing more or less clothing layers in natural conditions from late spring to early autumn. On this basis, Li [30] proposed the concept of transitional seasons, suggesting that there is a transitional season between winter and the outdoor season in cold region cities, and showed through numerous studies that when the temperature was lower than 4.4 °C, fewer residents would participate in outdoor activities. In addition, in the QX/T 152–2012 division of climate season standard issued by the China Meteorological Administration, 22 °C is the critical temperature for summer and autumn [15]. Based on this, 4.4 and 22 °C were taken as the critical temperatures for the transitional season in Dalian. Combined with the daily average temperature statistics from the Dalian Meteorological Station from 1988 to 2010 (http://data.cma.cn/ (accessed on 7 May 2022)), the date ranges of the transition seasons in Dalian were March 19 to June 28 and September 7 to November 20, respectively (as shown in Figure 2).
3.2. Objective Measurement
The field survey consisted of meteorological parameter measurements and subjective questionnaires, and the survey time was set from 11:00 to 13:00, when the campus was most active outdoors. While measuring the thermal environment, meteorological parameters were recorded every minute, including air temperature (Ta), relative humidity (RH), globe temperature (Tg) and wind velocity (Va). Ta and RH were recorded using a HOBO H21-002 recorder placed in a solar radiation shield (Onset, Bourne, MA, USA), Va was measured with a Kestrel 5500 (Nielsen-Kellerman, Boothwyn, PA, USA) and Tg was recorded using a JTR10 WBGT recorder (Table 3). All measuring devices were installed in accordance with ISO 7726 requirements [47] and fixed on tripods at a height of about 1.5 m above the ground [5,23,36,39].
3.3. Subjective Assessment
As shown in Table 4, the thermal comfort questionnaire consisted of basic information about the subjects and outdoor thermal sensing information. The basic information included gender, age, clothing and residence time. In the thermal sensing section, subjects were asked to describe their thermal sensation, overall thermal comfort and expectations of meteorological parameters. There are no generally confirmed standards for a thermal sensation vote (TSV) scale in outdoor thermal comfort studies, which is selected according to local climate characteristics and previous scales. The modified American Society of Heating, Refrigerating and Air-Conditioning Engineers (ASHRAE) seven-point scale (−3, cold; −2, cool; −1, slightly cool; 0, neutral; 1, slightly warm; 2, warm; 3, hot) was used in the survey. For the overall comfort vote (OCV), a three-point scale was adopted (−1, uncomfortable; 0, neutral; 1, comfortable). For voting meteorological parameter preferences, including preferences for air temperature, relative humidity, wind speed and solar radiation, a three-point scale was used (1, stronger/higher; 0, unchanged; −1, weaker/lower).
3.4. Thermal Comfort Indexes
Thermal comfort indexes are widely used in outdoor thermal comfort evaluations, including Temperature and Humidity Index (THI), Wet Bulb Globe Temperature (WBGT), Operating Temperature (Top), Standard Effective Temperature (SET *), OUT_SET *, UTCI and Physiologically Equivalent Temperature (PET) [4]. Among them, UTCI, PET and OUT-SET * are primarily used in unstable outdoor environments. This paper used UTCI as the thermal comfort index to assess thermal environments. Based on the multi-node Fiala human physiology and thermal comfort model [48], this index takes into account the impact of clothing and activities on thermal comfort and can show the real environment in which people generate the same physiological reaction as in an equivalent environmental temperature [49], which has been widely applied worldwide.
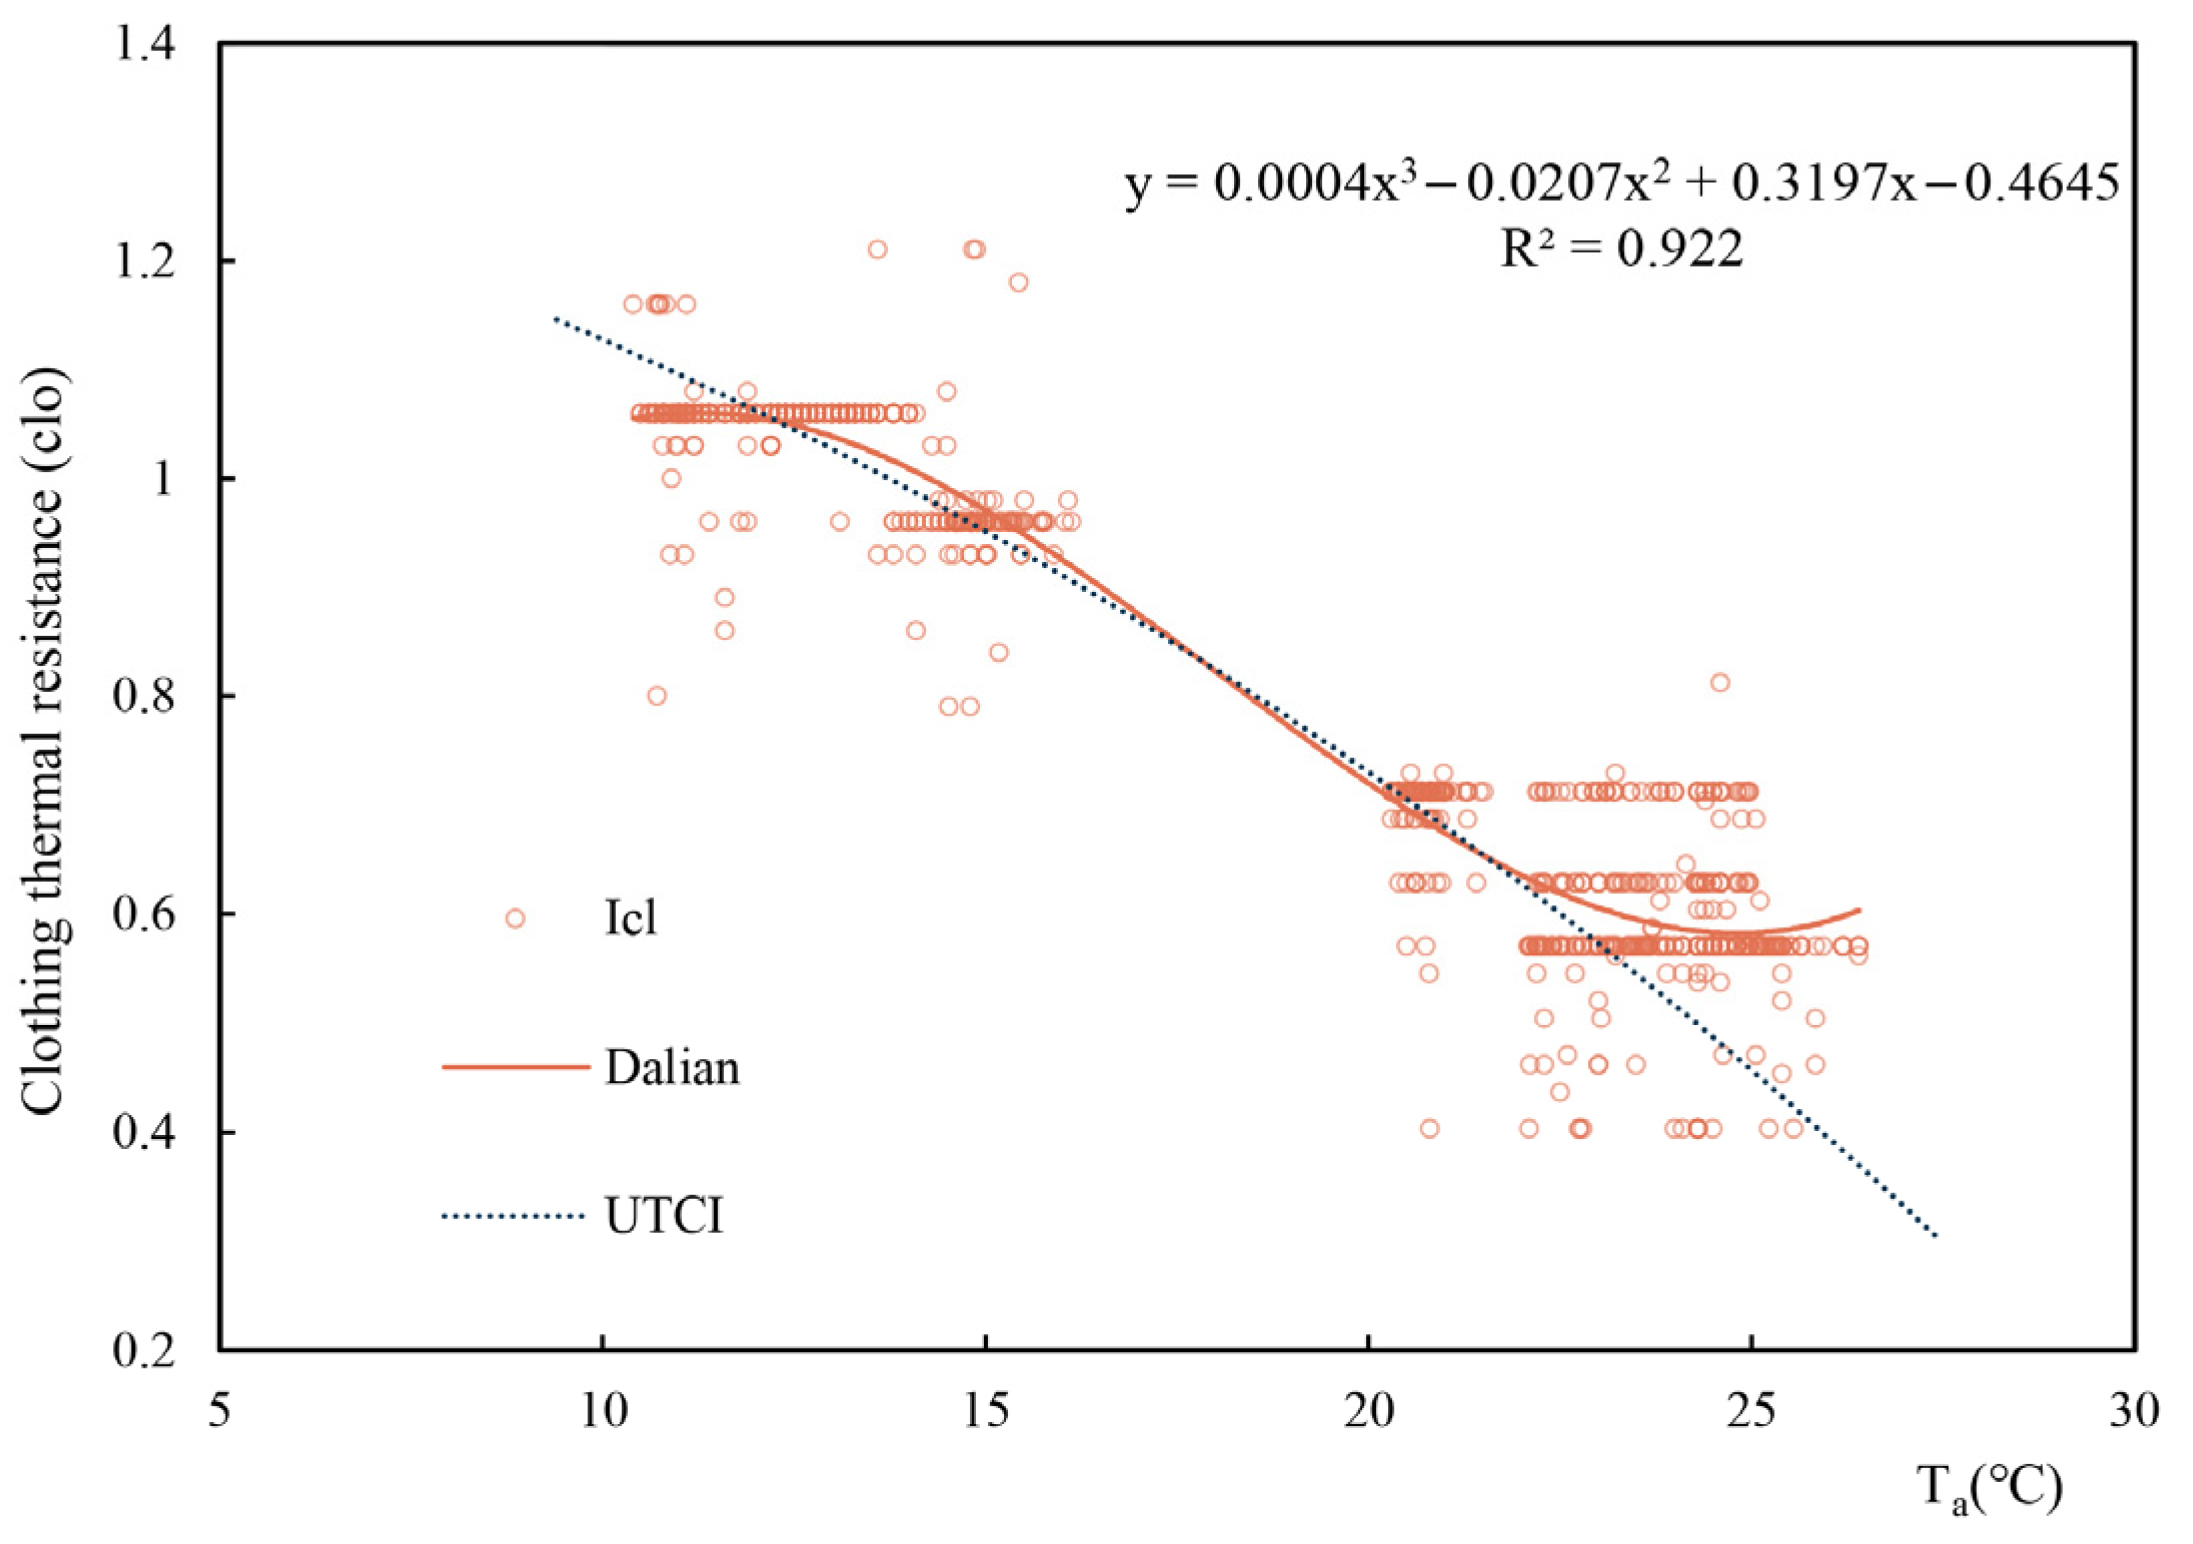
The consistency of clothing models between the UTCI and Dalian was verified. In the UTCI clothing model, the overall clothing thermal resistance (Icl) was estimated using the empirical formula recommended by ISO 9920, as shown in Equation (1), and regression analysis of the average clothing thermal resistance was performed at every 1 °C air temperature. The same method was used to calculate the Dalian clothing model. As shown in Figure 3, the UTCI clothing model and Dalian clothing model are very consistent in the range of 10–22 °C. As the air temperature increases in Dalian, the thermal resistance is infinitely near a certain value (0.6 clo), rather than infinitely decreasing as in the UTCI clothing model, which is consistent with the results obtained in the severe cold region [15] and the Mediterranean region [17]. In general, the UTCI and Dalian clothing models are similar, indicating the applicability of the UTCI in Dalian.
where is the intrinsic insulation (m2 K W−1) and is the effective insulation (m2 K W−1).
where is the air temperature (°C).
UTCI was calculated using the calculator provided by the UTCI official website (http://www.utci.org (accessed on 7 May 2022)). The meteorological parameter inputs included Ta, RH, mean radiant temperature (Tmrt) and wind speed at a height of 10 m above the ground. The wind speed at 10 m height could be obtained from the wind speed at 1.5 m height using Equation (3).
where is the wind speed at a height of 10 m from the ground (m/s), is the wind speed at a height of 1.5 m from the ground (m/s), is 10 m, is 1.5 m, is the wind speed correction index with terrain variation and in this study is 0.33 [50].
The calculation for Tmrt used in the UTCI calculation is performed according to the ISO 7726 standards [47] and expressed as follows:
where is globe diameter ( = 0.15 m in this study) and is emissivity ( = 0.95 for a black globe).
3.5. Field Survey Procedures
Due to Dalian’s characteristic mild oceanic climate, the use of air conditioning is not as widespread in summer compared to the necessary heating needs in winter. In other words, outdoor thermal comfort in autumn is less influenced by the artificial environment than in the spring. Therefore, autumn was chosen as the transition season for this study, and the measurement days covered the entire transition season. In addition, the cooling rate in the study area during the transition season was relatively slow due to the constraints of peninsula topography. To ensure that the measurement days were representative (with significant changes in temperature) throughout the transition season, the interval was approximately half a month. Therefore, the study was conducted on clear days, which occurred on 25 and 27 September, 9 and 23 October and 13 November 2020.
Throughout the field survey, the average Ta on the measurement day was 18.6 °C, with the lowest Ta being 10.2 °C at point D2 and the highest being 27.3 °C at point B2. The average RH was 48.8%; the lowest RH was 26.7% at point E2, and the highest was 74.2% at point C2. The average Tg was 23.4 °C, with Tg varying between 12.2 °C and 40.5 °C. The average Va at 1.5 m was 1.02 m/s, with Va values ranging from 0.00 m/s to 7.23 m/s. The highest Tg was 40.5 °C at point B1, and the lowest was 12.2 °C at point D2. To ensure that the measuring devices could accurately record meteorological parameters of the subjects’ surroundings, the questionnaire was required to be completed within a 3 m radius centered on the devices. In addition, subjects were randomly selected by investigators to complete the questionnaires, and subjects who had lived in the area for less than 6 months were excluded. A total of 865 valid questionnaires were collected during the survey, 65% being male and 35% female.
4. Results and Discussion
4.1. Spatial Differences in Thermal Sensation Survey
4.1.1. Thermal Sensation Vote and Overall Comfort Vote
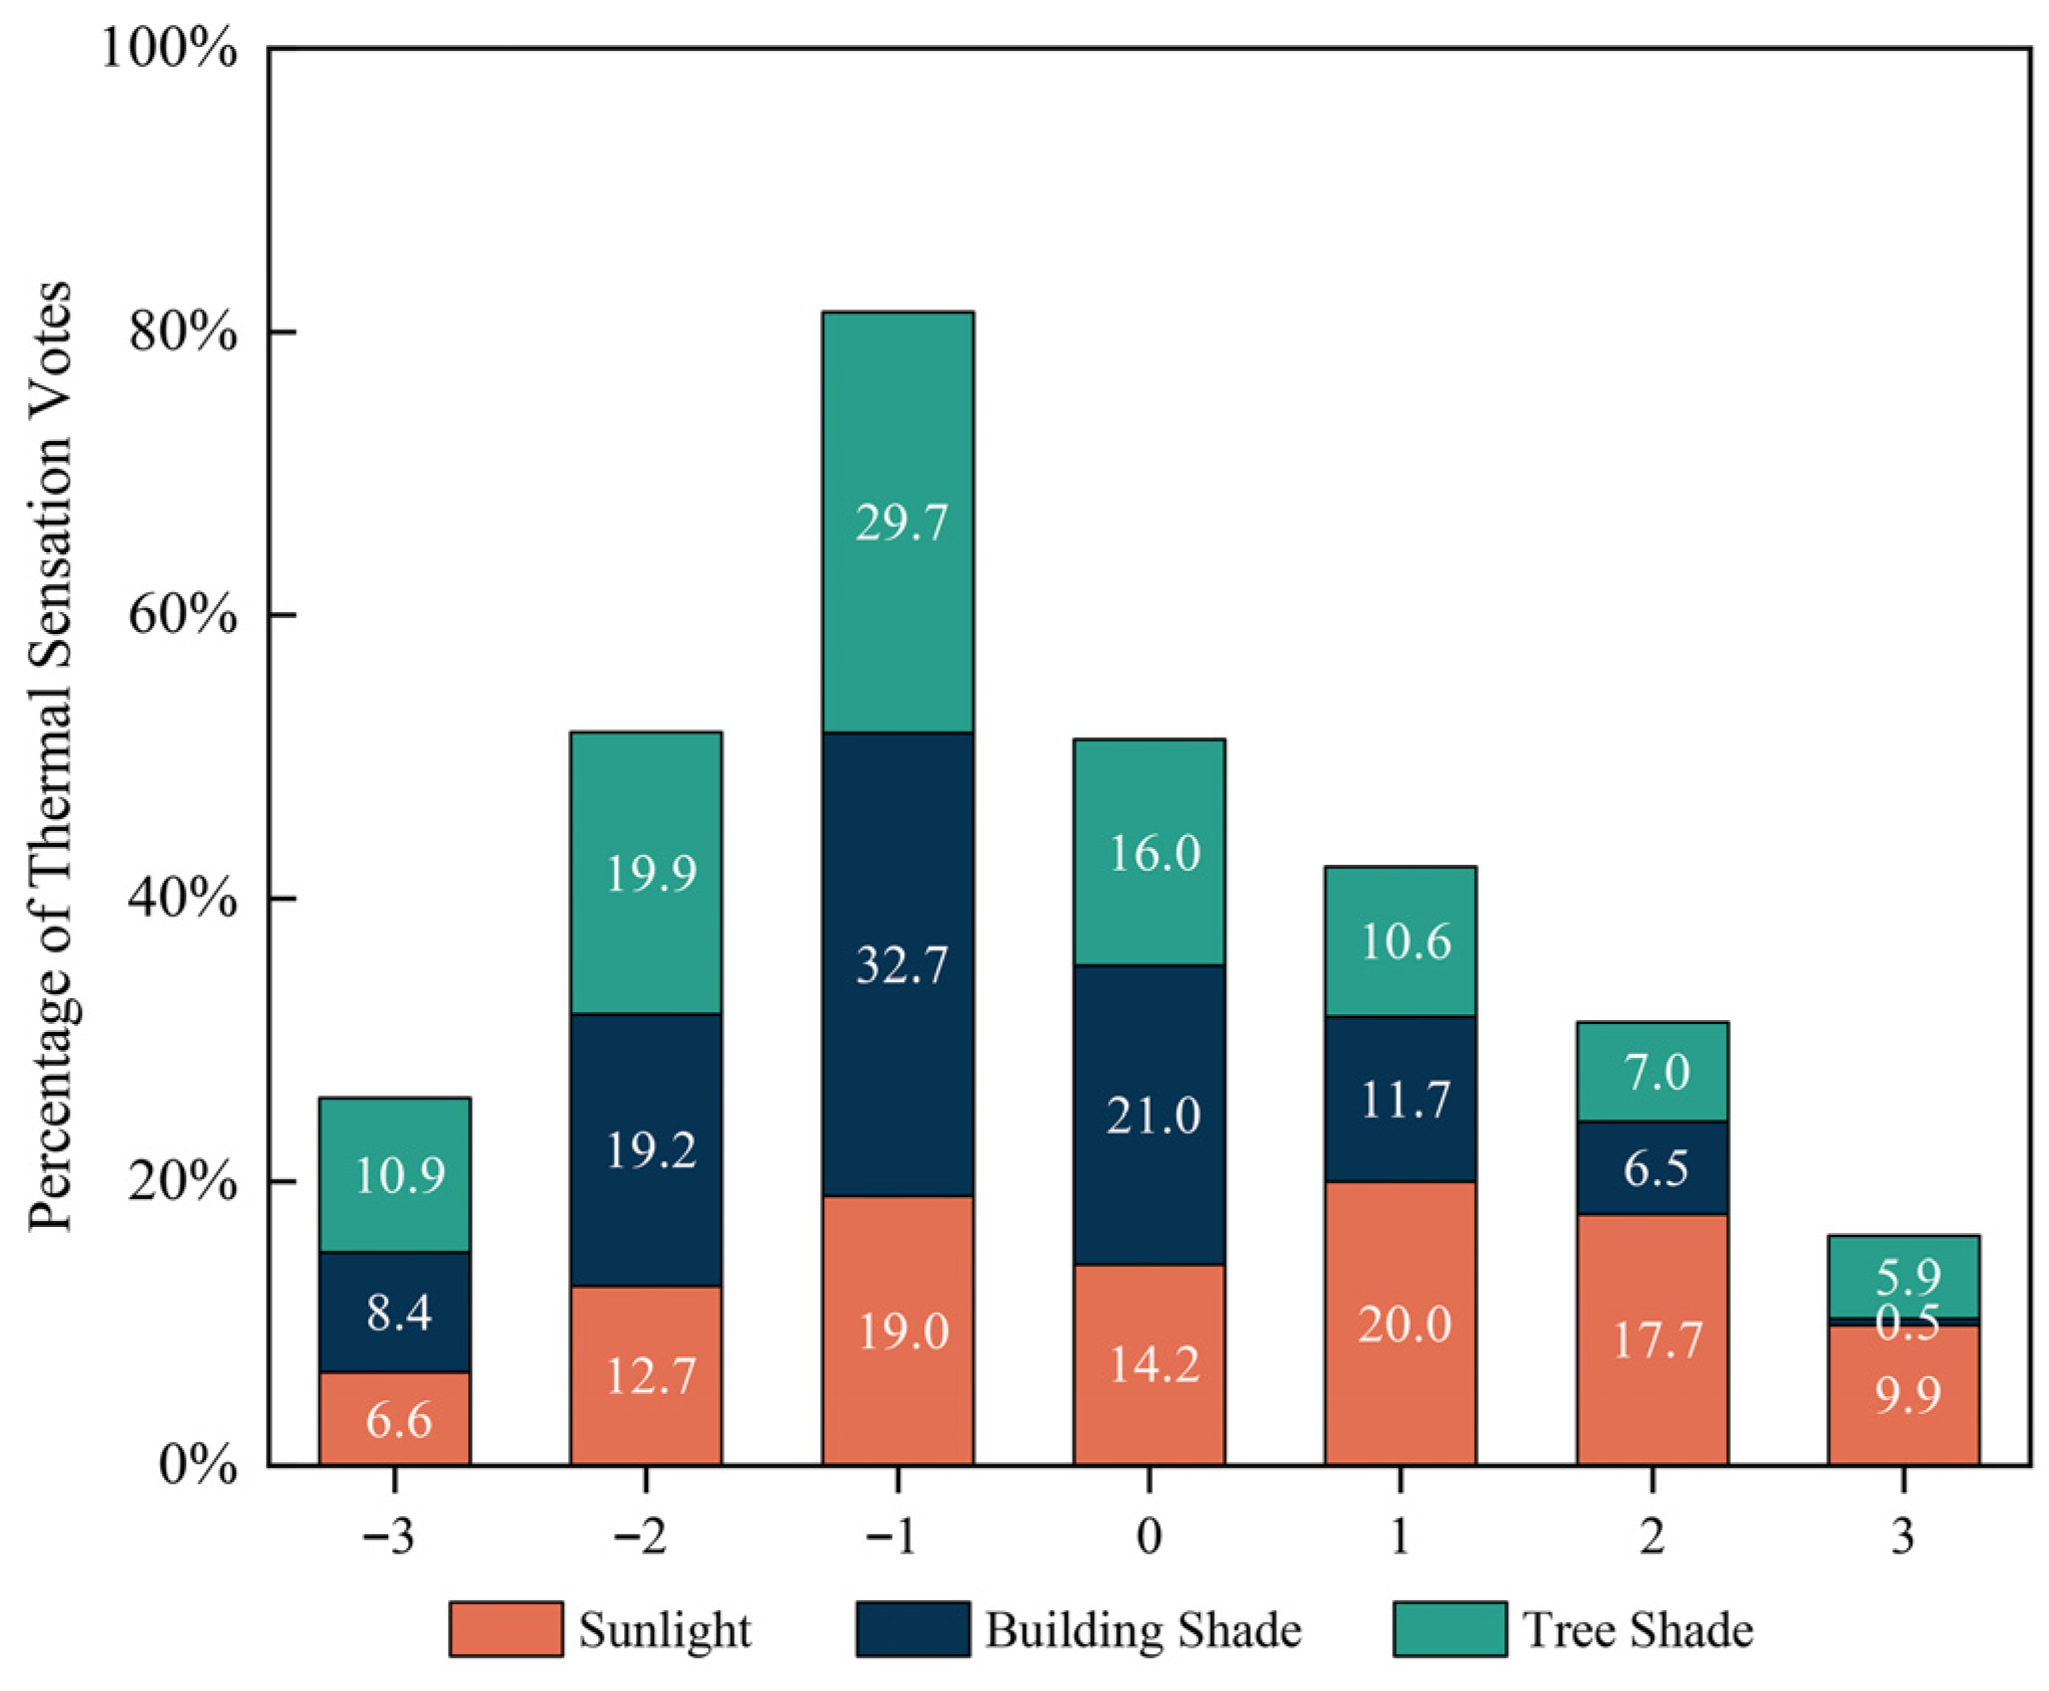
TSV is the most intuitive measure to describe the human body in terms of hot and cold. Figure 4 shows the TSV distribution during the survey period, and people’s thermal sensations vary greatly in different spatial environments. Overall, the main thermal sensation recorded in the transition season is “slightly cool” (25.5%), followed by “neutral” and “cool” (16.4%). The human thermal sensation experienced a gradual transformation from “hot” to “cold” over time. In terms of thermal sensation span, the TSV range is [−3,3] in sunlight and tree shade and [−3,2] in building shade. In sunlight, more than 47.6% of subjects’ thermal sensation is higher than 0. Among them, “slightly warm (TSV = 1)” accounts for the largest proportion (20.0%) and is the main type of thermal sensation in sunlight, followed by “slightly cool (TSV = −1)” and “hot (TSV = 2)”, which account for 19.0% and 17.7%, respectively. The main TSV range in tree shade is [−2,0], lower than that in sunlight, with the largest proportion of “slightly cool (TSV = −1)” (29.7%). In building shade, TSV is primarily distributed in [−2,0] with a percentage of 72.9%. Compared with tree shade, building shade provides a cooler thermal sensation. In addition, TSV in sunlight is found to be more dispersed than in building shade and tree shade. This is because the SVF in sunlight is larger than that in other spatial environments, and when SVF is larger, air circulation capacity increases, but acquired solar radiation also increases, leading to a polarized trend in thermal sensation. In other words, open spaces sometimes tend to produce a hot sensation due to higher radiation and sometimes a cold sensation due to higher wind speed.
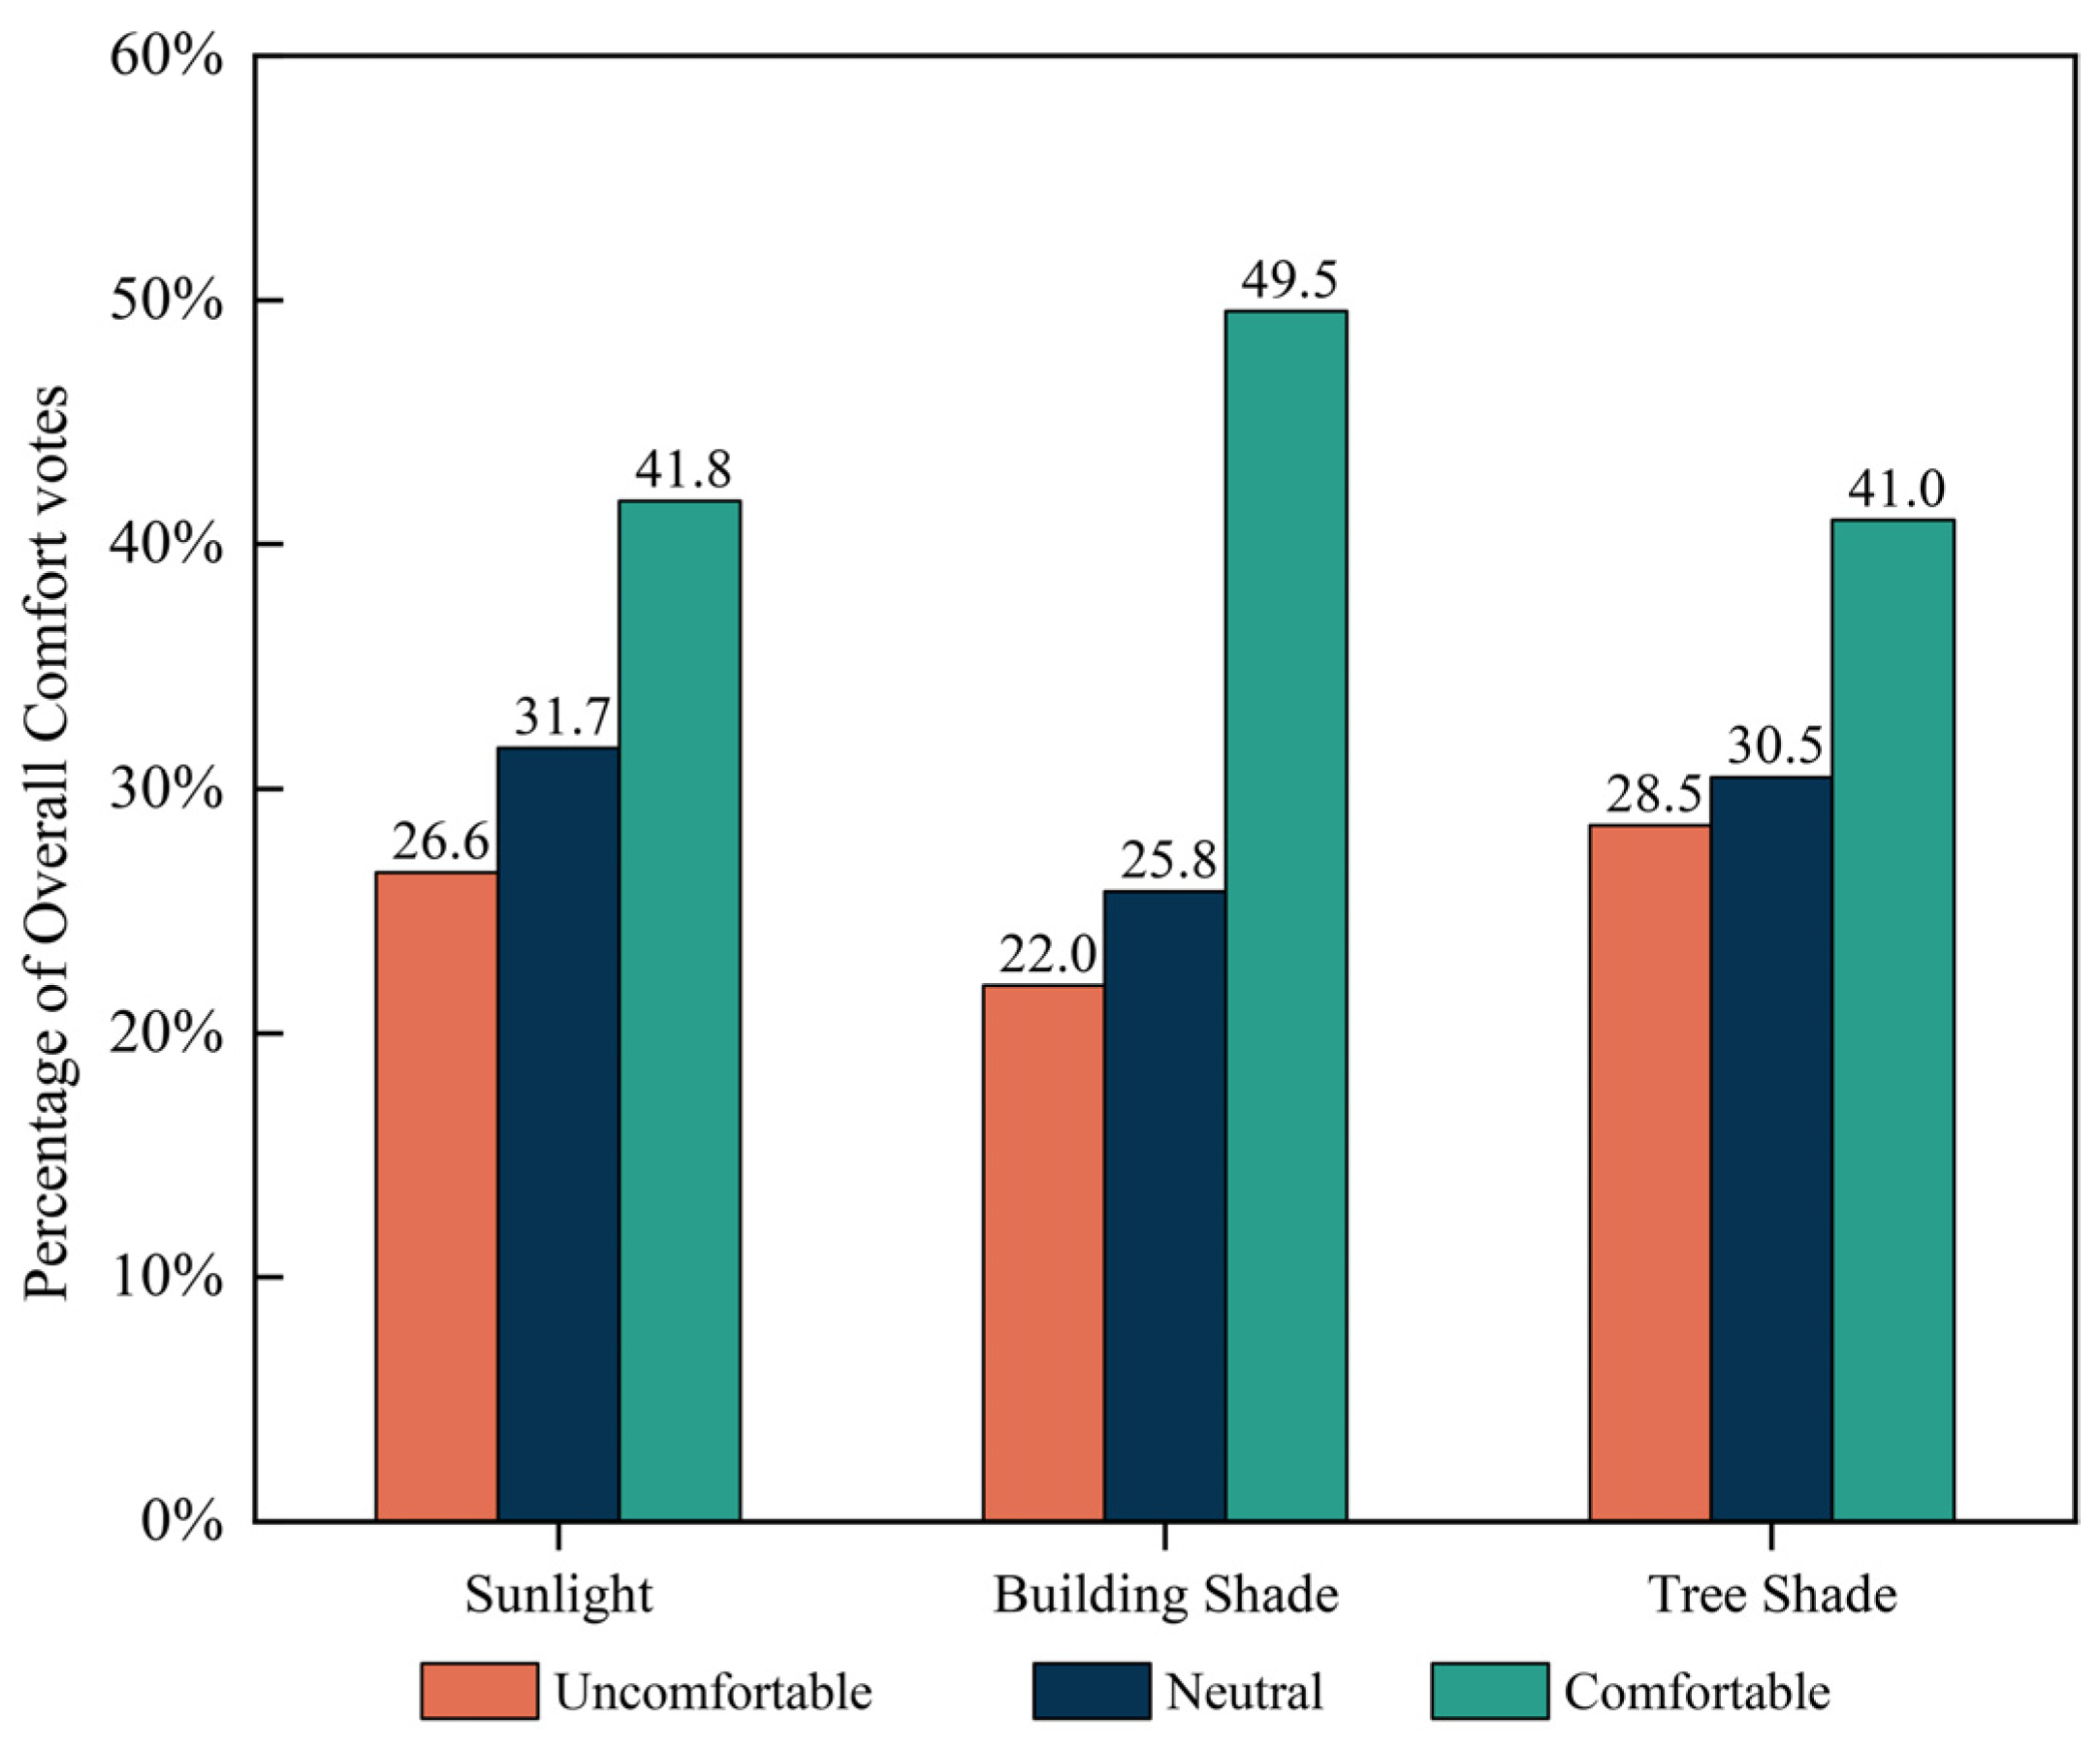
Figure 5 shows the overall comfort at each measurement point during the transition season in the cold region, reflecting the significant influence of different spatial environments on human thermal comfort. In general, as the weather becomes colder, the discomfort proportion in the three environments gradually increases, which is the same as the change pattern for TSV. Among the respondents, the proportion that voted “comfortable” in building shade is the largest (49.5%), followed by sunlight (41.8%). However, the proportion that voted “uncomfortable” in tree shade is as high as 28.5%. When the air temperature is high, buildings intercept most of the solar radiation, causing lower temperatures and higher OCV. When the air temperature is low, sunlit spaces with the highest SVF receive the most radiation heat and cause the highest proportion of comfortable thermal sensation votes (39.7%). These findings are consistent with previous studies in different climates that had fewer open spaces in which decreased SVF improved thermal comfort at higher temperatures but decreased comfort at lower temperatures [37,51]. Comparatively, OCV fluctuates less in sunlight and tree shade. Tree shade is a relatively neutral shaded space with 30.5% neutral thermal sensation votes, indicating that this is an optimal way to improve OCV in cold regions [39]. Trees can improve outdoor human thermal discomfort by attenuating direct solar radiation and can also modify microclimate latent and sensible heat fluxes through water transpiration [43]. Some studies have shown that relatively closed spaces due to dense planting can lead to poor thermal sensation. Therefore, plant landscaping should avoid closed space designs and create semi-open spaces [39].
4.1.2. Meteorological Parameter Effects
To quantify the relationship between outdoor thermal sensations and meteorological parameters in the transition season, the Spearman correlation analysis of meteorological parameters (Ta, RH, V1.5 m, Tmrt) and TSV was conducted to explore the weighting of each meteorological parameter on thermal sensation. The results showed that TSV and each meteorological parameter were significantly correlated (Table 5), positively correlated with Ta, RH and Tmrt and negatively correlated with V1.5 m. Ta and Tmrt are most strongly correlated with TSV, indicating that Ta and solar radiation are the main factors affecting outdoor thermal sensation during the transition seasons in this region, which is consistent with the results from some studies showing that temperature is the most important meteorological influence on TSV [4,34,39]. Therefore, in the design stage, designers can prioritize air temperature and solar radiation to improve people’s evaluation of thermal comfort during the transition season in cold regions. The relatively small effect of wind speed can be explained by the seasonality of its effect. Wind speed is higher in the spring and winter in Dalian and lower in summer and autumn [52]. People are affected by the long-term windy climate in spring and winter, resulting in psychological adaptation behavior, and have a strong tolerance for wind speed changes in autumn.
4.1.3. Meteorological Parameter Preference
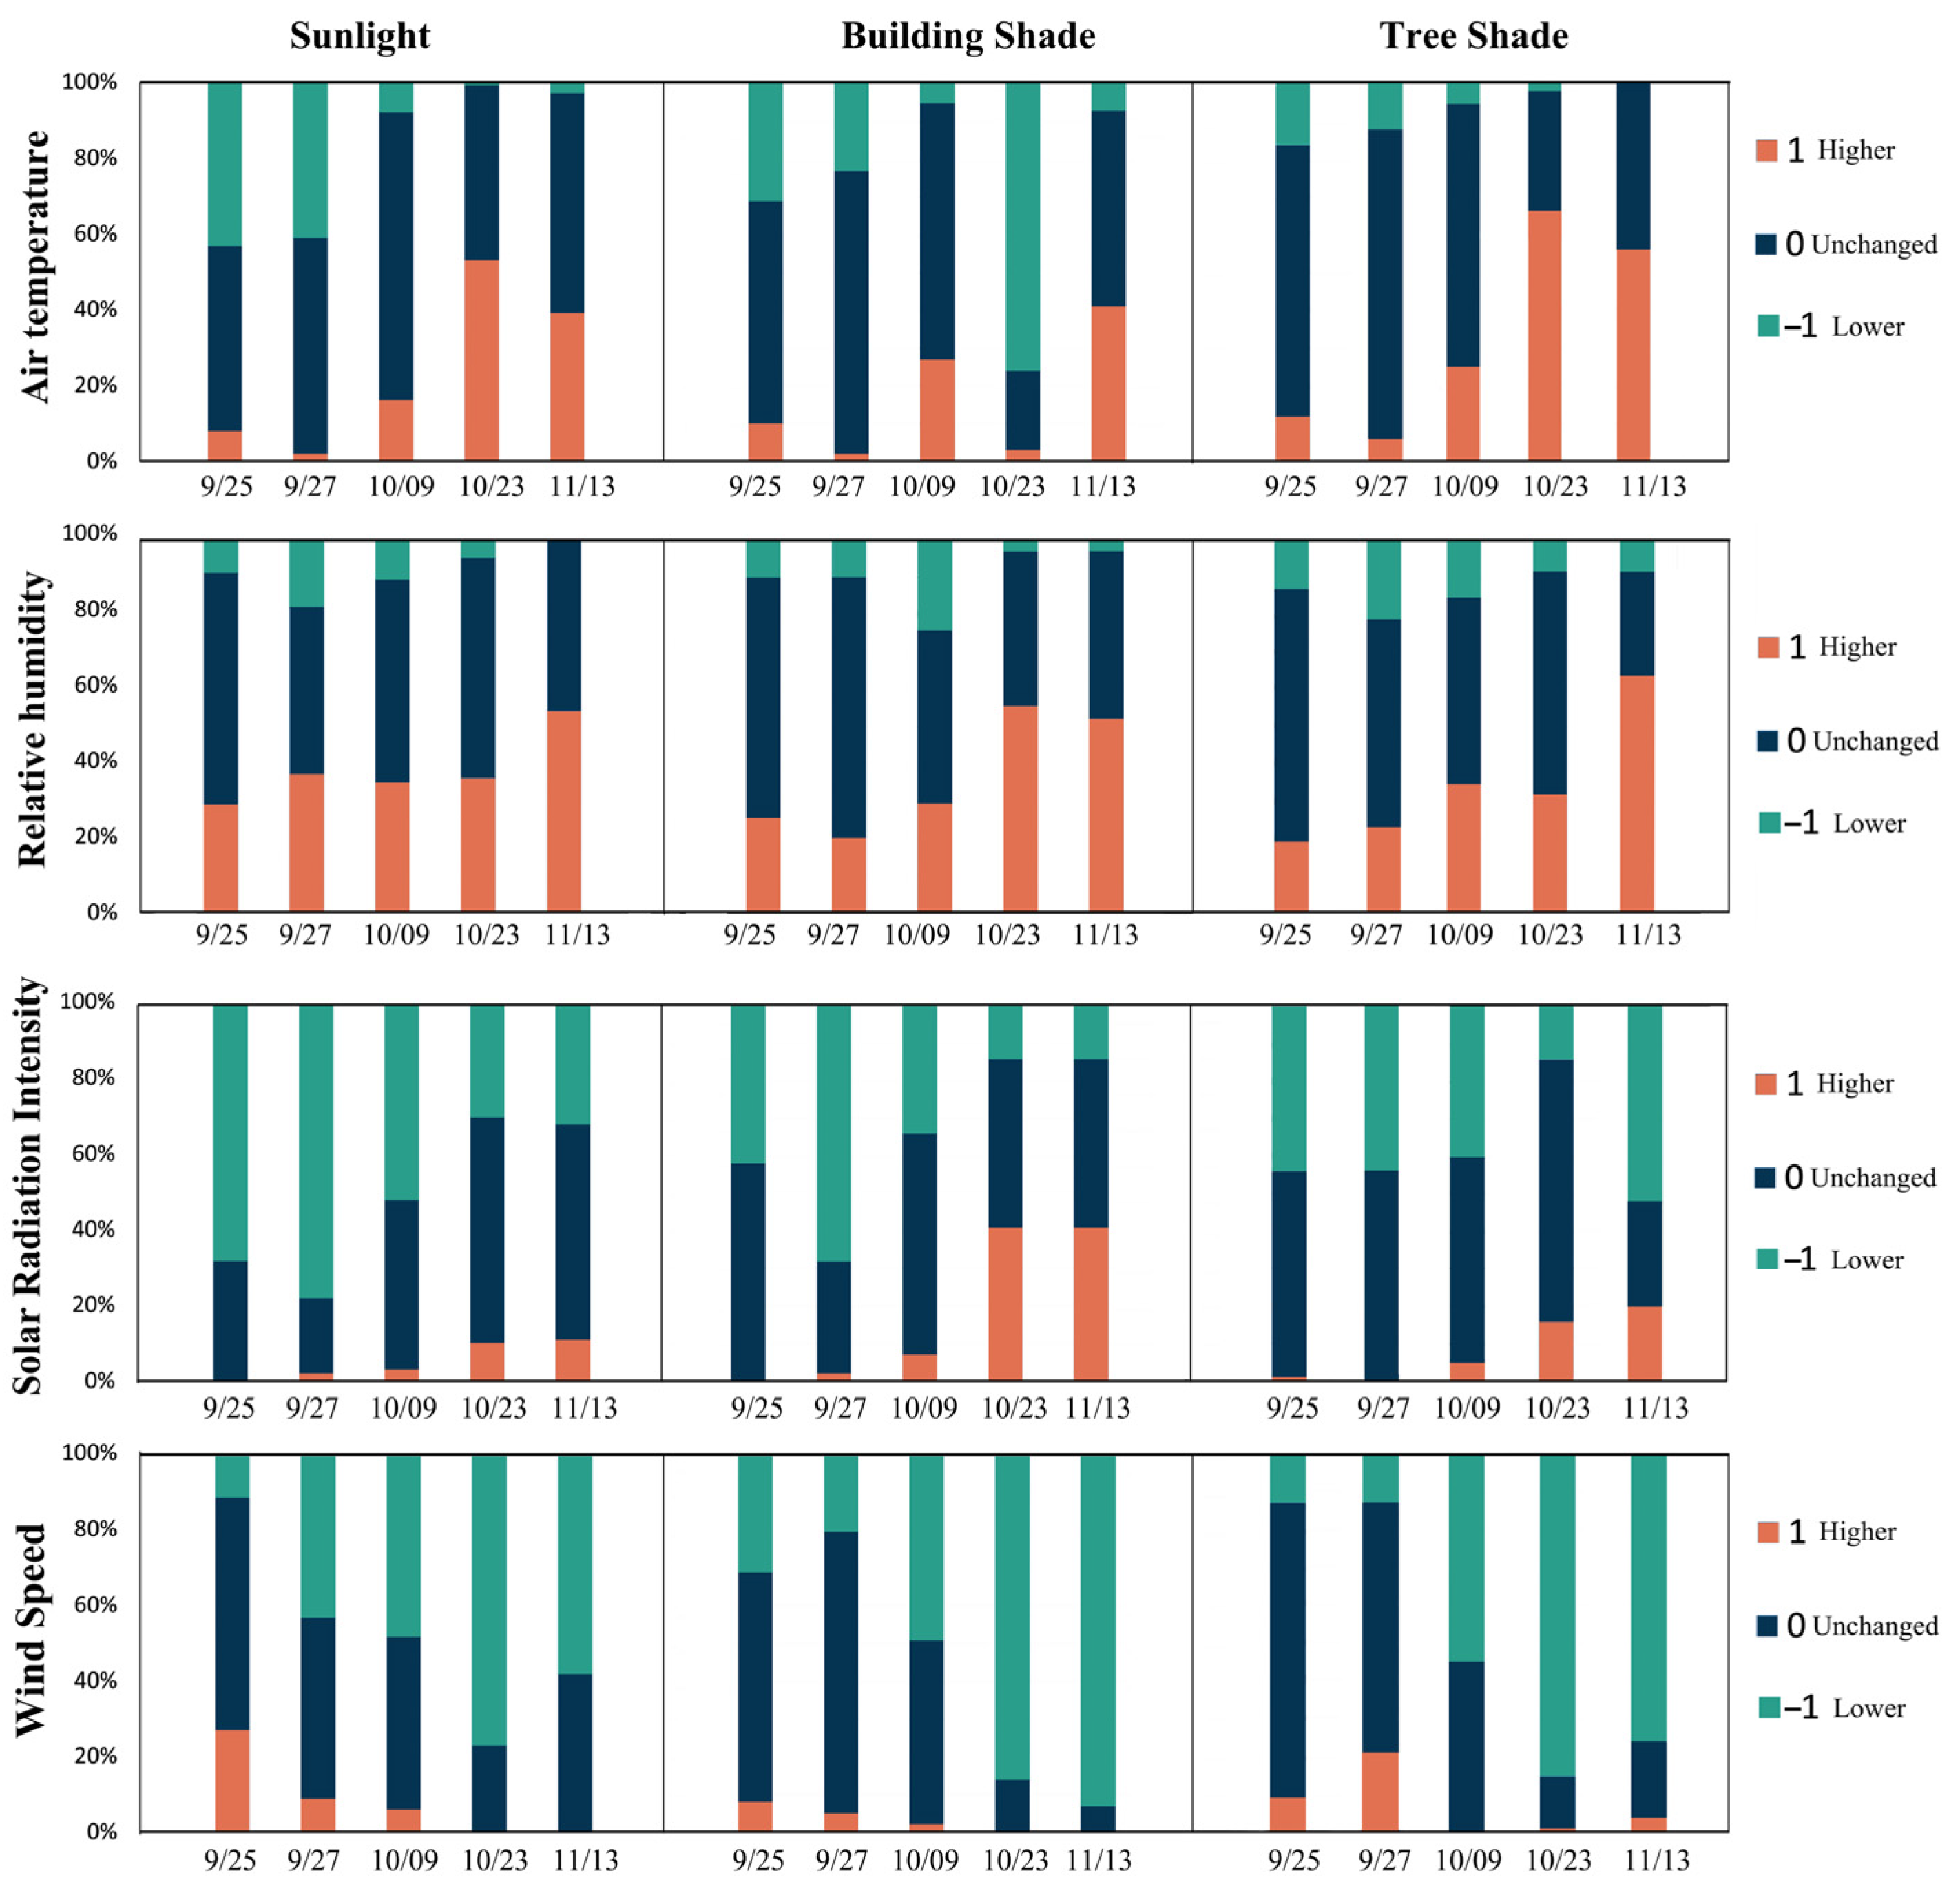
As shown in Figure 6, subjects in different spatial environments have different preferences for various meteorological parameters. In sunlight and tree shade, the expectation of a higher Ta and solar radiation gradually increases over time, which is consistent with the correlation between Ta, Tmrt and TSV. For example, the percentage of people who prefer higher Ta increases from 8% to 53% in sunlight. However, the change under building shade undergoes a greater fluctuation. On 13 November, 41.0% of people preferred a higher Ta, while only 27% preferred a higher Ta on 9 October and less than 10% preferred a higher Ta on 25 and 27 September and 23 October. This may be due to the fact that buildings can block more solar radiation, leading to a significant change in the thermal environment. In terms of RH preference, each environment has similar trends overall, with an increasing trend over time. This suggests that in the transition season, the outdoor climate in the cold region is relatively dry and subjects desire higher air humidity. In all three spatial environments, subjects generally prefer lower Va. The aforementioned results indicate that preferences for meteorological parameters under sunlight and tree shade have the same pattern of variation in the transition seasons. However, thermal preferences under building shade fluctuate more, indicating that the thermal environment under building shade should be optimized in the designs for outdoor environments according to local conditions, thus enhancing the overall thermal comfort in cold regions.
4.2. Spatial Differences in Thermal Comfort Level
4.2.1. Correlation Analysis between UTCI and MTSV
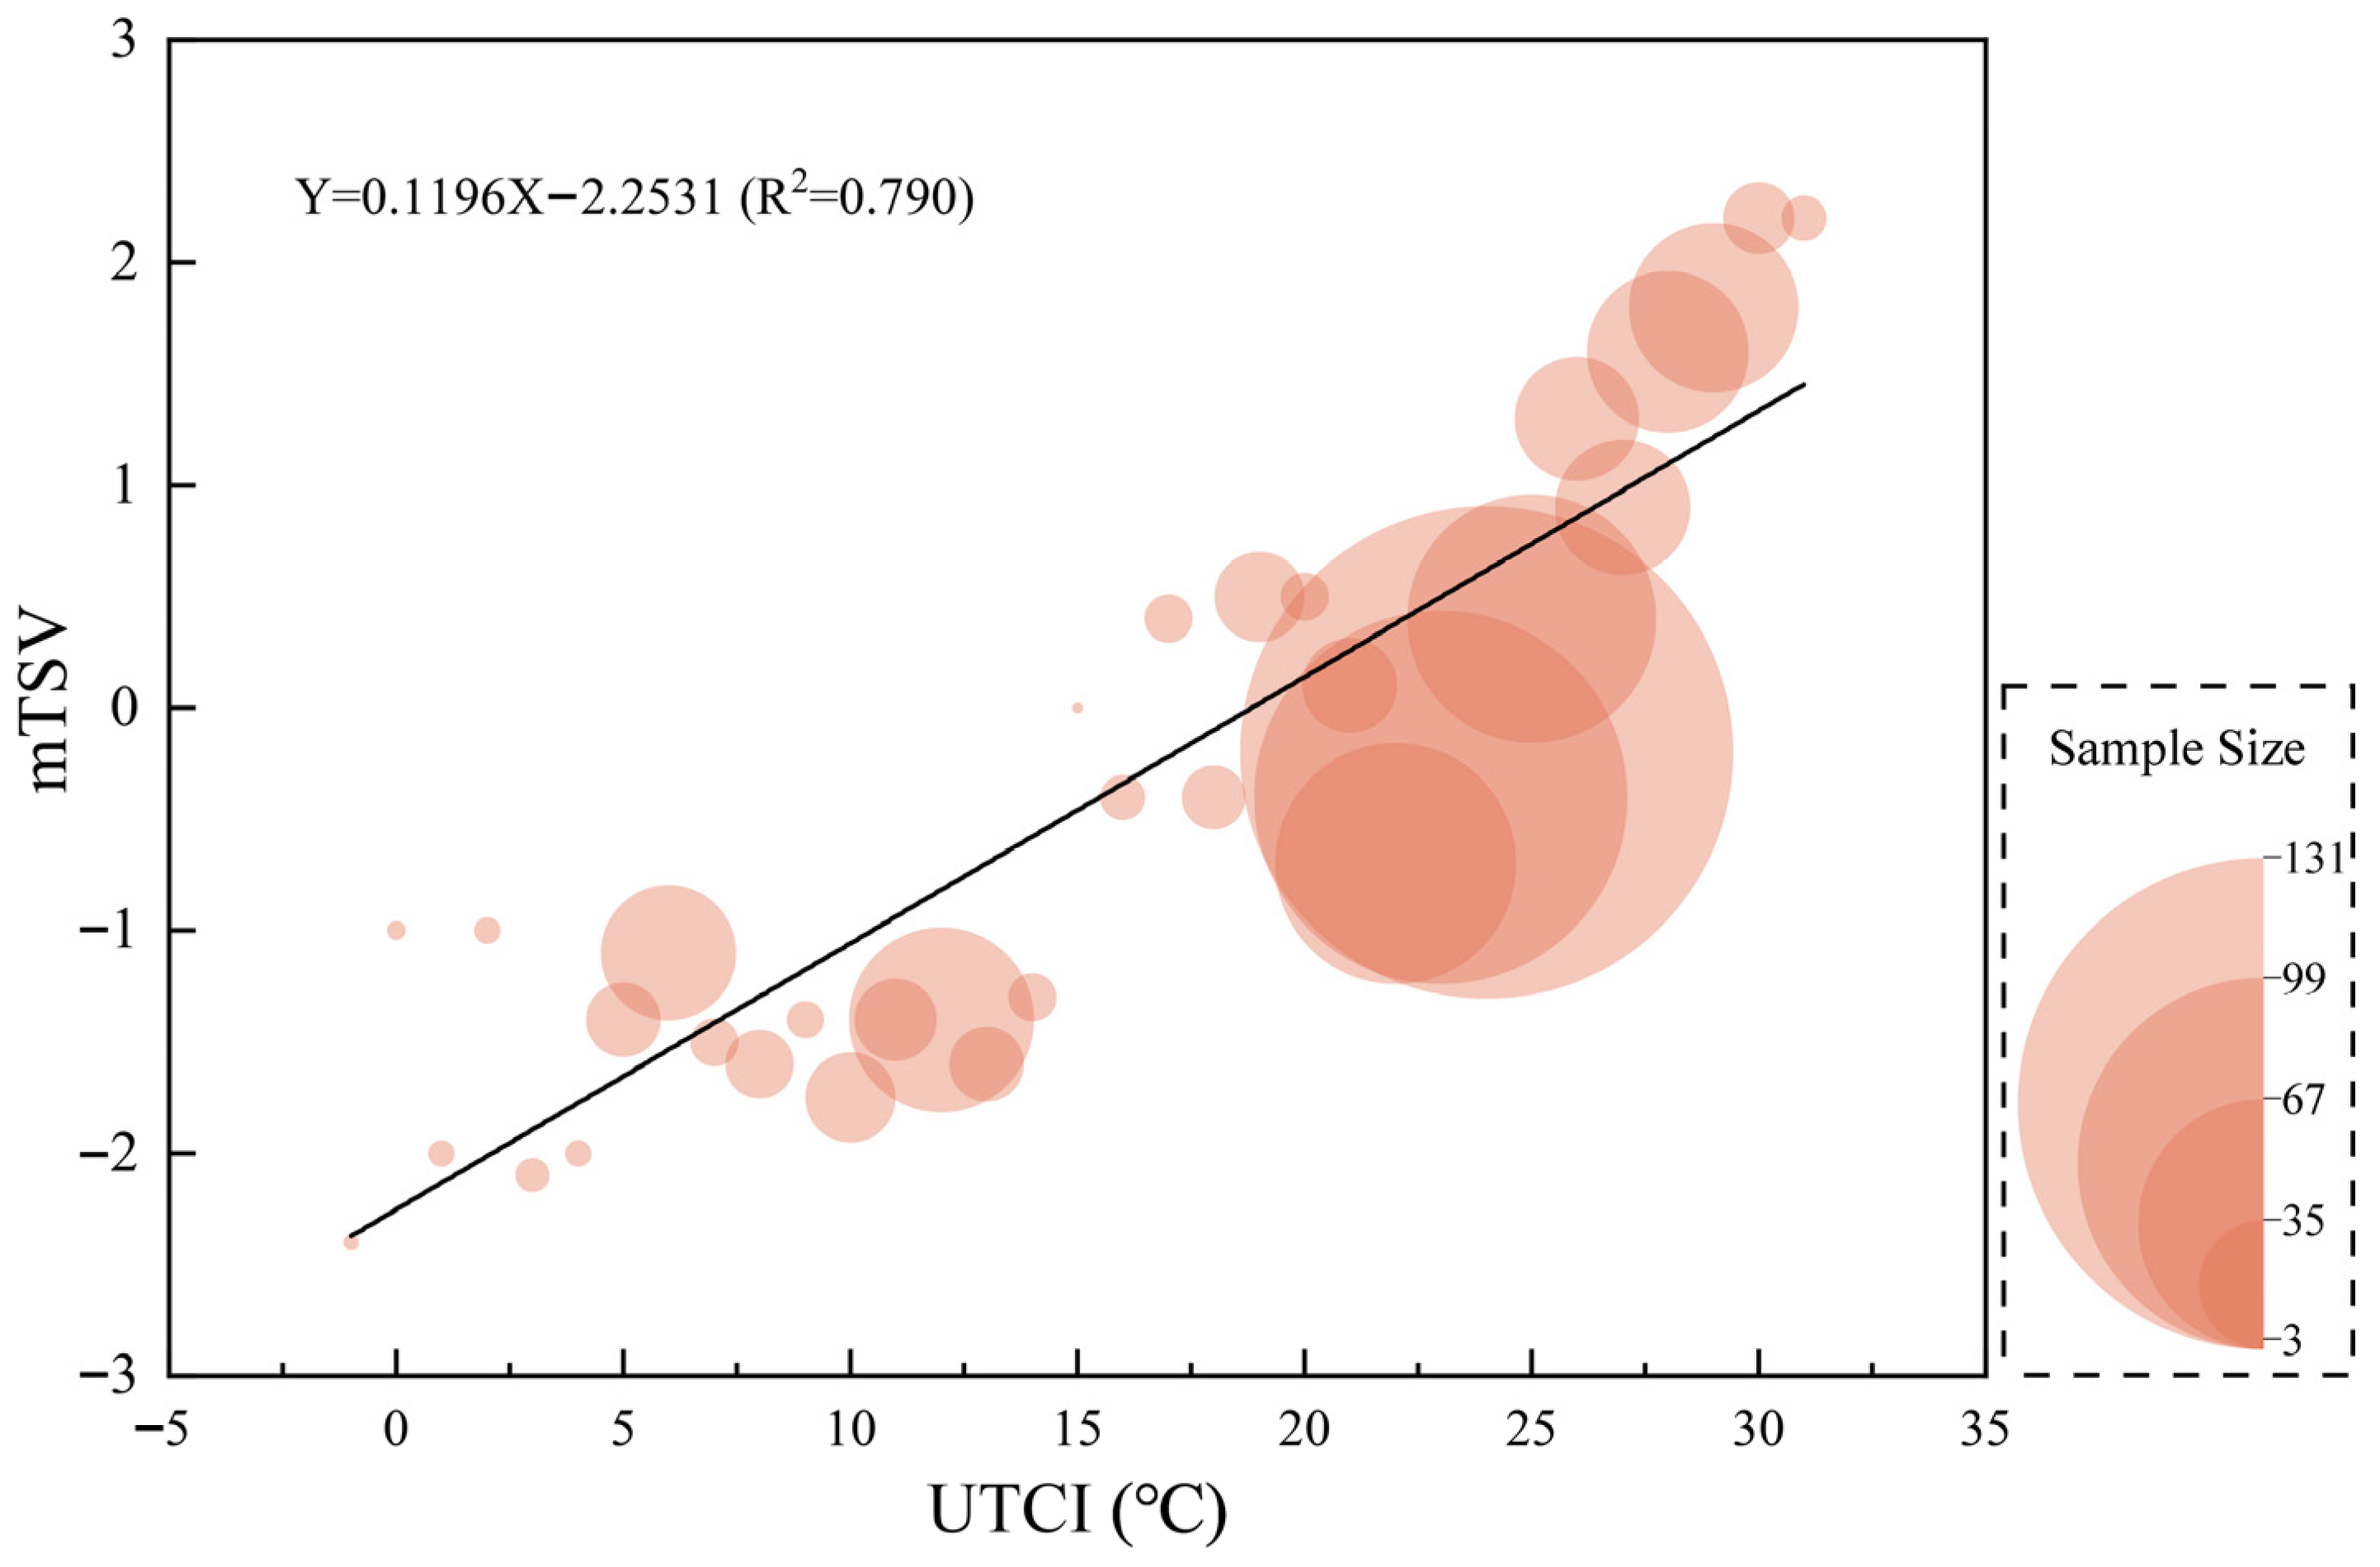
The practicality of UTCI for evaluating outdoor thermal comfort has been widely demonstrated worldwide. However, its applicability in the transition seasons in Dalian still requires further validation. In this study, the UTCI and mean thermal sensation vote (mTSV) were fitted by linear regression using 1 °C as the interval, the mean UTCI as the independent variable and mTSV as the dependent variable. As shown in Figure 7, the corresponding mathematical model is as follows:
A higher value for correlation coefficient R2 indicates a higher prediction accuracy. The results show that the R2 is 0.790 and the UTCI and mTSV are well fitted, indicating that UTCI can accurately evaluate outdoor thermal comfort in Dalian during the transition seasons.
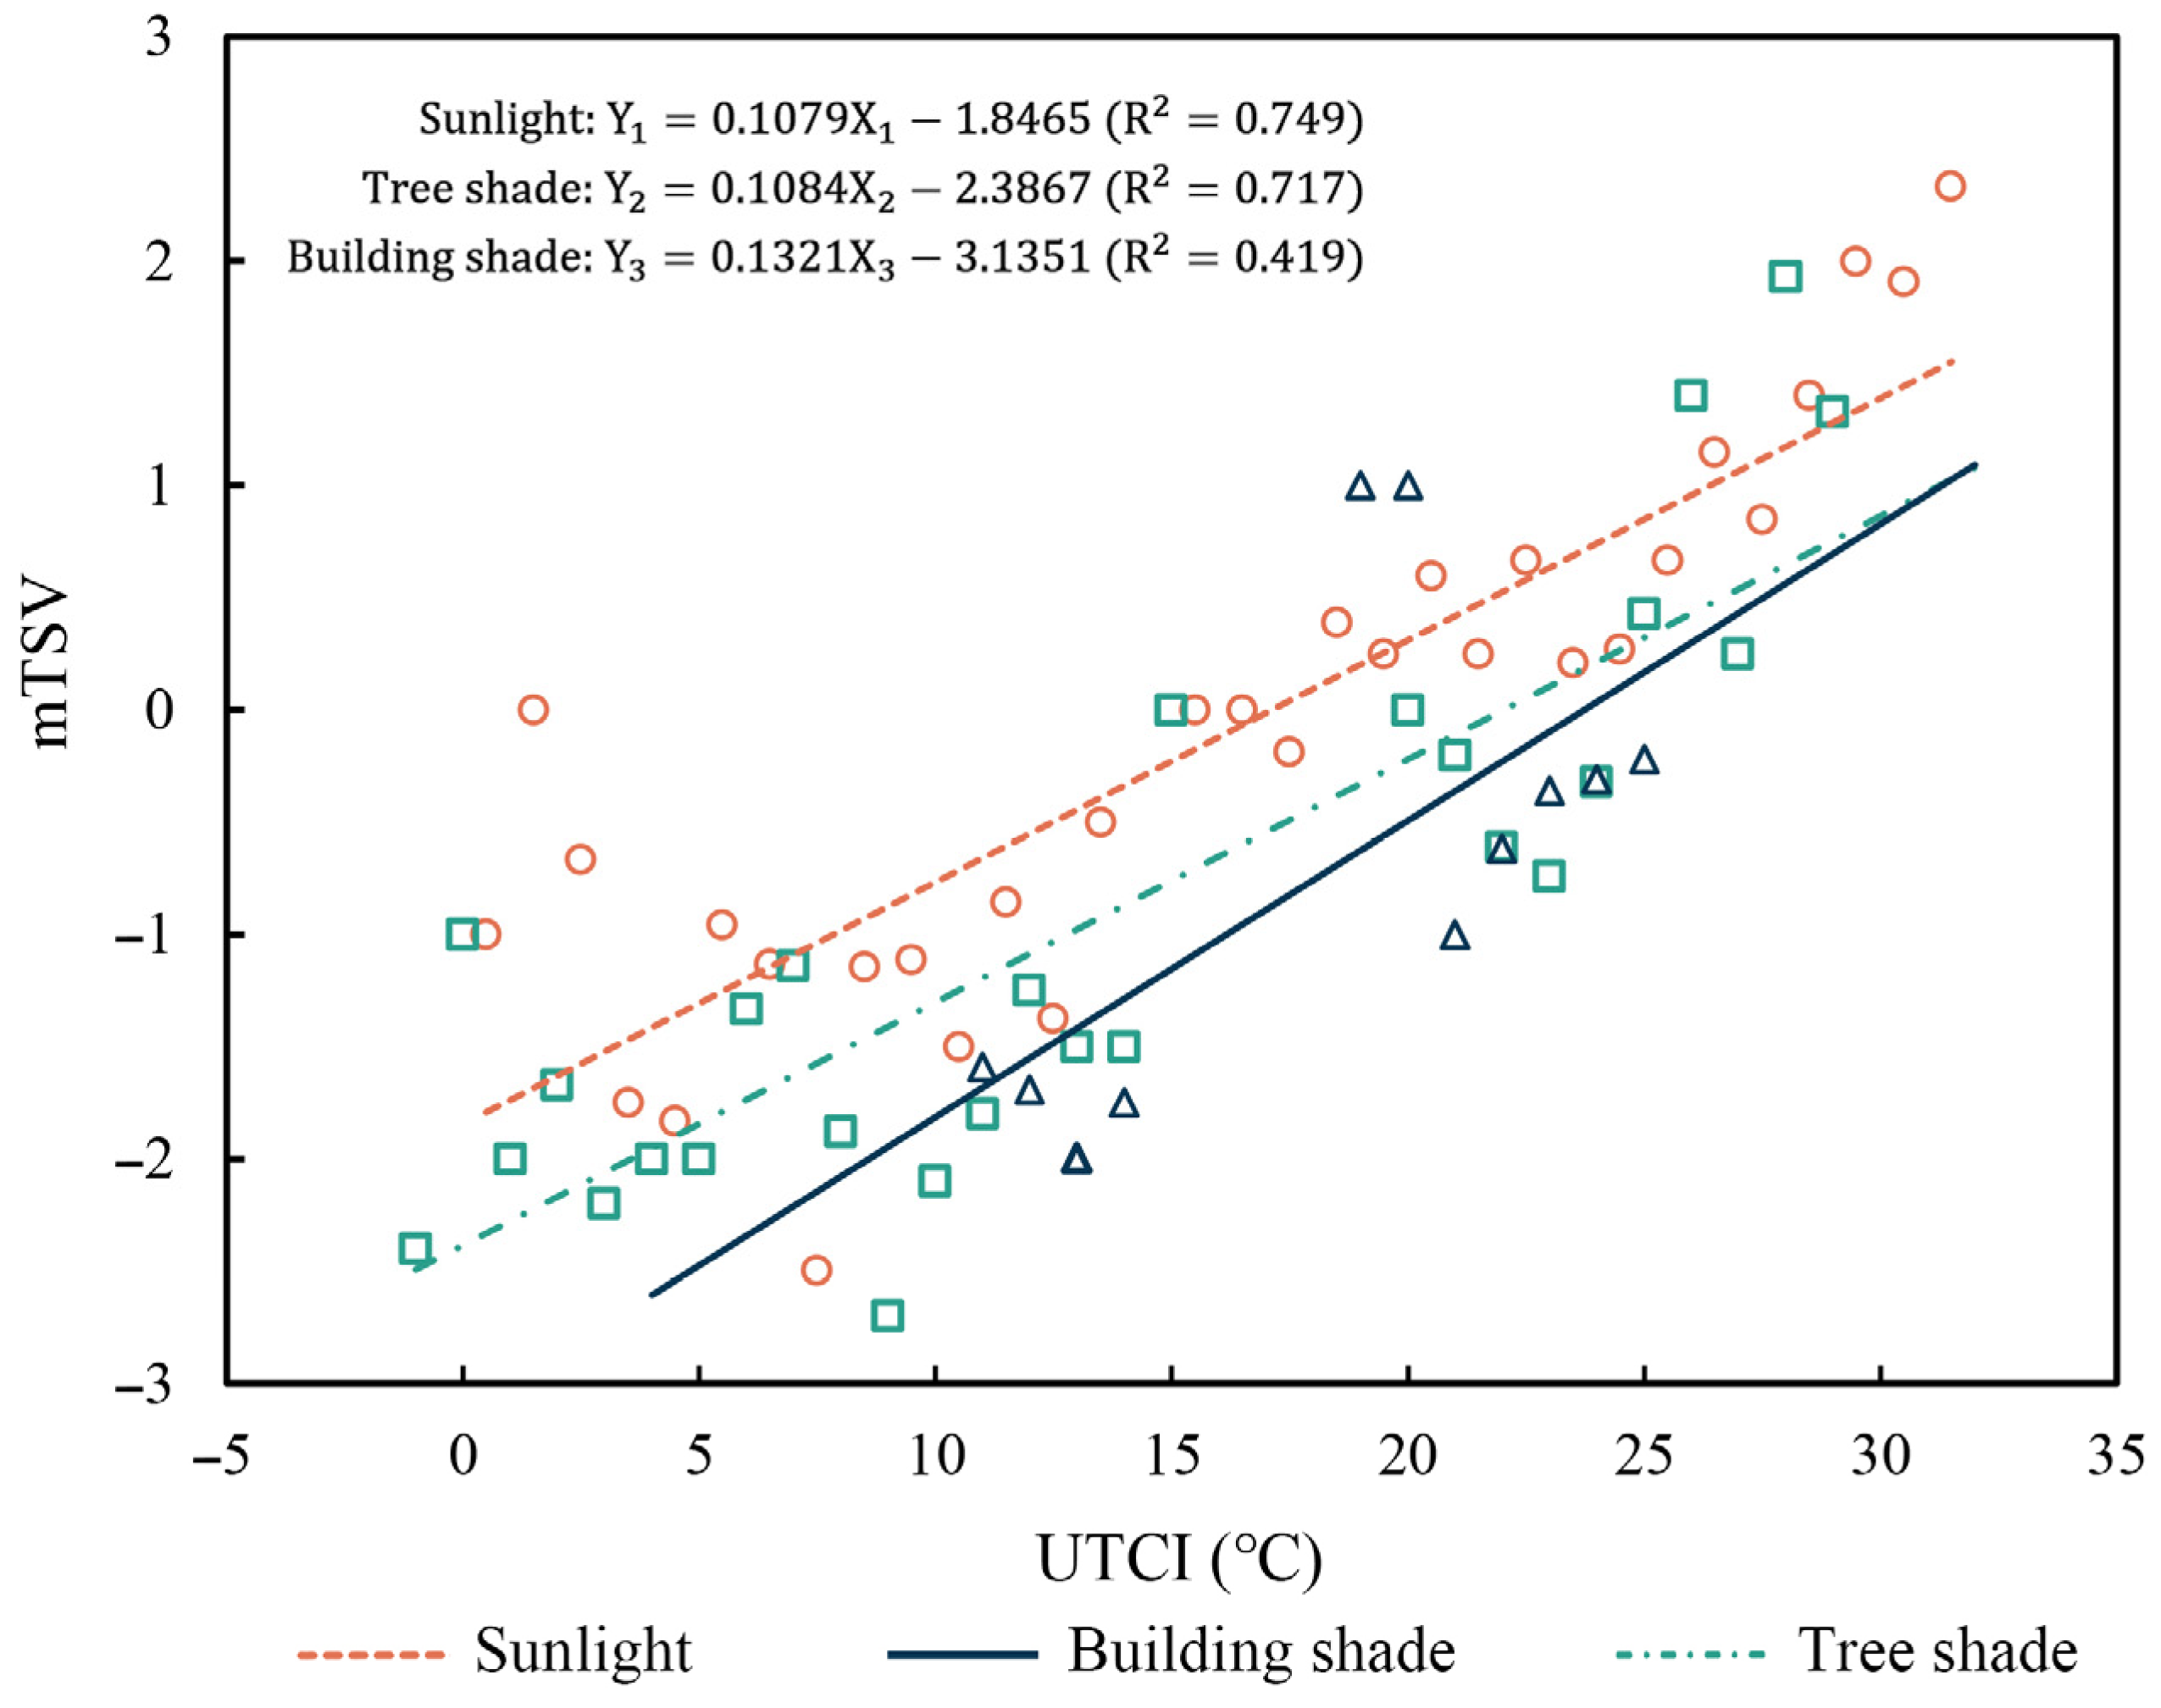
Figure 8 shows the linear regression relationship between mTSV and UTCI for three spatial environments (sunlight, tree shade and building shade) in the transition season, and the corresponding mathematical models are as follows:
Conclusions differ concerning whether building shade reduces outdoor heat stress more than tree shade under different climate types. A study conducted in Japan showed that pavilion shade reduced universal effective temperature more than tree shade [44], while a related study in Hong Kong concluded that tree shade could reduce UTCI more greatly compared to building shade [35]. In this study, it can be seen from Figure 6 that at the same UTCI, mTSV is highest in sunlight, second highest in tree shade and lowest in building shade, indicating that people feel warmer in sunlight and colder in building shade than in tree shade. Specifically, the average UTCI is 15.1, 21.7 and 18.2 °C for building shade, sunlight and tree shade, respectively. Compared to sunlight, building shade and tree shade environments decrease UTCI by 6.6 and 3.5 °C, respectively, and building shade performs better in reducing outdoor thermal stress than tree shade. The reason is that building shade has a smaller SVF and can block more solar radiation, which is a key meteorological parameter affecting the outdoor thermal environment in Dalian. These results are consistent with some studies conducted elsewhere [35,39]. In addition, in a comparison of the slopes of the linear regressions in the three environments, the results are as follows: in building shade (0.1321) > in tree shade (0.1084) > in sunlight (0.1079). It can be concluded that people are more sensitive to building shade in outdoor environments during the transition seasons in cold regions, which means that people’s thermal sensation is more likely to change in building shade. These findings confirm that people’s sensation of unsteady thermal comfort is greatly affected by the local microclimate. UTCI is sensitive to the local environment, and the same UTCI has different thermal sensations in different environments, requiring in situ research [32,39].
4.2.2. Neutral UTCI and Neutral UTCI Range
The temperature that people feel is neither cold nor hot is defined as the thermal neutral temperature. When mTSV = 0, the UTCI is neutral, and the UTCI range of mTSV (−0.5, 0.5) is in the neutral range, which represents the generally accepted range. According to the above regression Equation (3), the neutral UTCI is 18.8 °C and the neutral UTCI ranges from 14.7 to 23.0 °C. The neutral UTCI and neutral UTCI range for the transition season in Dalian are compared with the values in other climatic zones (Table 6). The neutral UTCI in Dalian is clearly lower than that in other regions, followed by Harbin and Tehran. This may be due to the mild oceanic climate of Dalian, which does not experience severe cold in winter or severe heat in summer, resulting in the poor adaptability of Dalian residents to the high-temperature environment. In the cold climate, the neutral UTCI ranges in Dalian and Harbin, Xi’an and Tehran are significantly different. Harbin has the largest neutral UTCI range, which has a higher annual temperature difference and more variable climate conditions in the severe cold region, and long-term thermal experience may change thermal perceptions, resulting in Harbin’s residents being more tolerant to the changeable climate conditions [4,36]. The neutral UTCI range in Dalian is narrower than that in Xi’an (a cold region of China) and wider than that in Tehran. In comparison with Guangzhou and Shanghai in the southern region of China, the range of neutral UTCI in Dalian during the transition season is larger than that in Guangzhou and smaller than that in Shanghai because Guangzhou is located in a hot summer and warm winter region, accompanied by relatively small changes in climate throughout the year. Therefore, the range of neutral UTCI is narrow. On the contrary, Shanghai belongs to a region with a hot summer and cold winter, where the climate fluctuates more. The above results confirm the existence of thermal adaptation in different climate regions. The neutral UTCI range and neutral UTCI in different regions are significantly affected by climatic factors, and it is necessary to study the subjective perceptions of outdoor thermal environments in various climate zones [4].
In addition, according to the Equations (6)–(8), the neutral UTCI under sunlight, tree shade and building shade is 17.1, 22.0 and 23.7 °C, respectively, and the neutral UTCI ranges from 12.5 °C to 21.7 °C, 17.4 °C to 26.6 °C and 19.9 °C to 27.5 °C, respectively. The neutral UTCI in sunlight is 4.9 and 6.6 °C lower than that in tree shade and building shade, respectively, while the neutral UTCI in building shade is 1.7 °C higher than that in tree shade, indicating that in transition seasons in cold regions, people tend to prefer a cooler environment in sunlight and a hotter environment in building shade compared to tree shade. These findings illustrate the differences in the effects of different spatial environments on people’s subjective perception of thermal comfort.
4.2.3. Thermal Acceptability Range
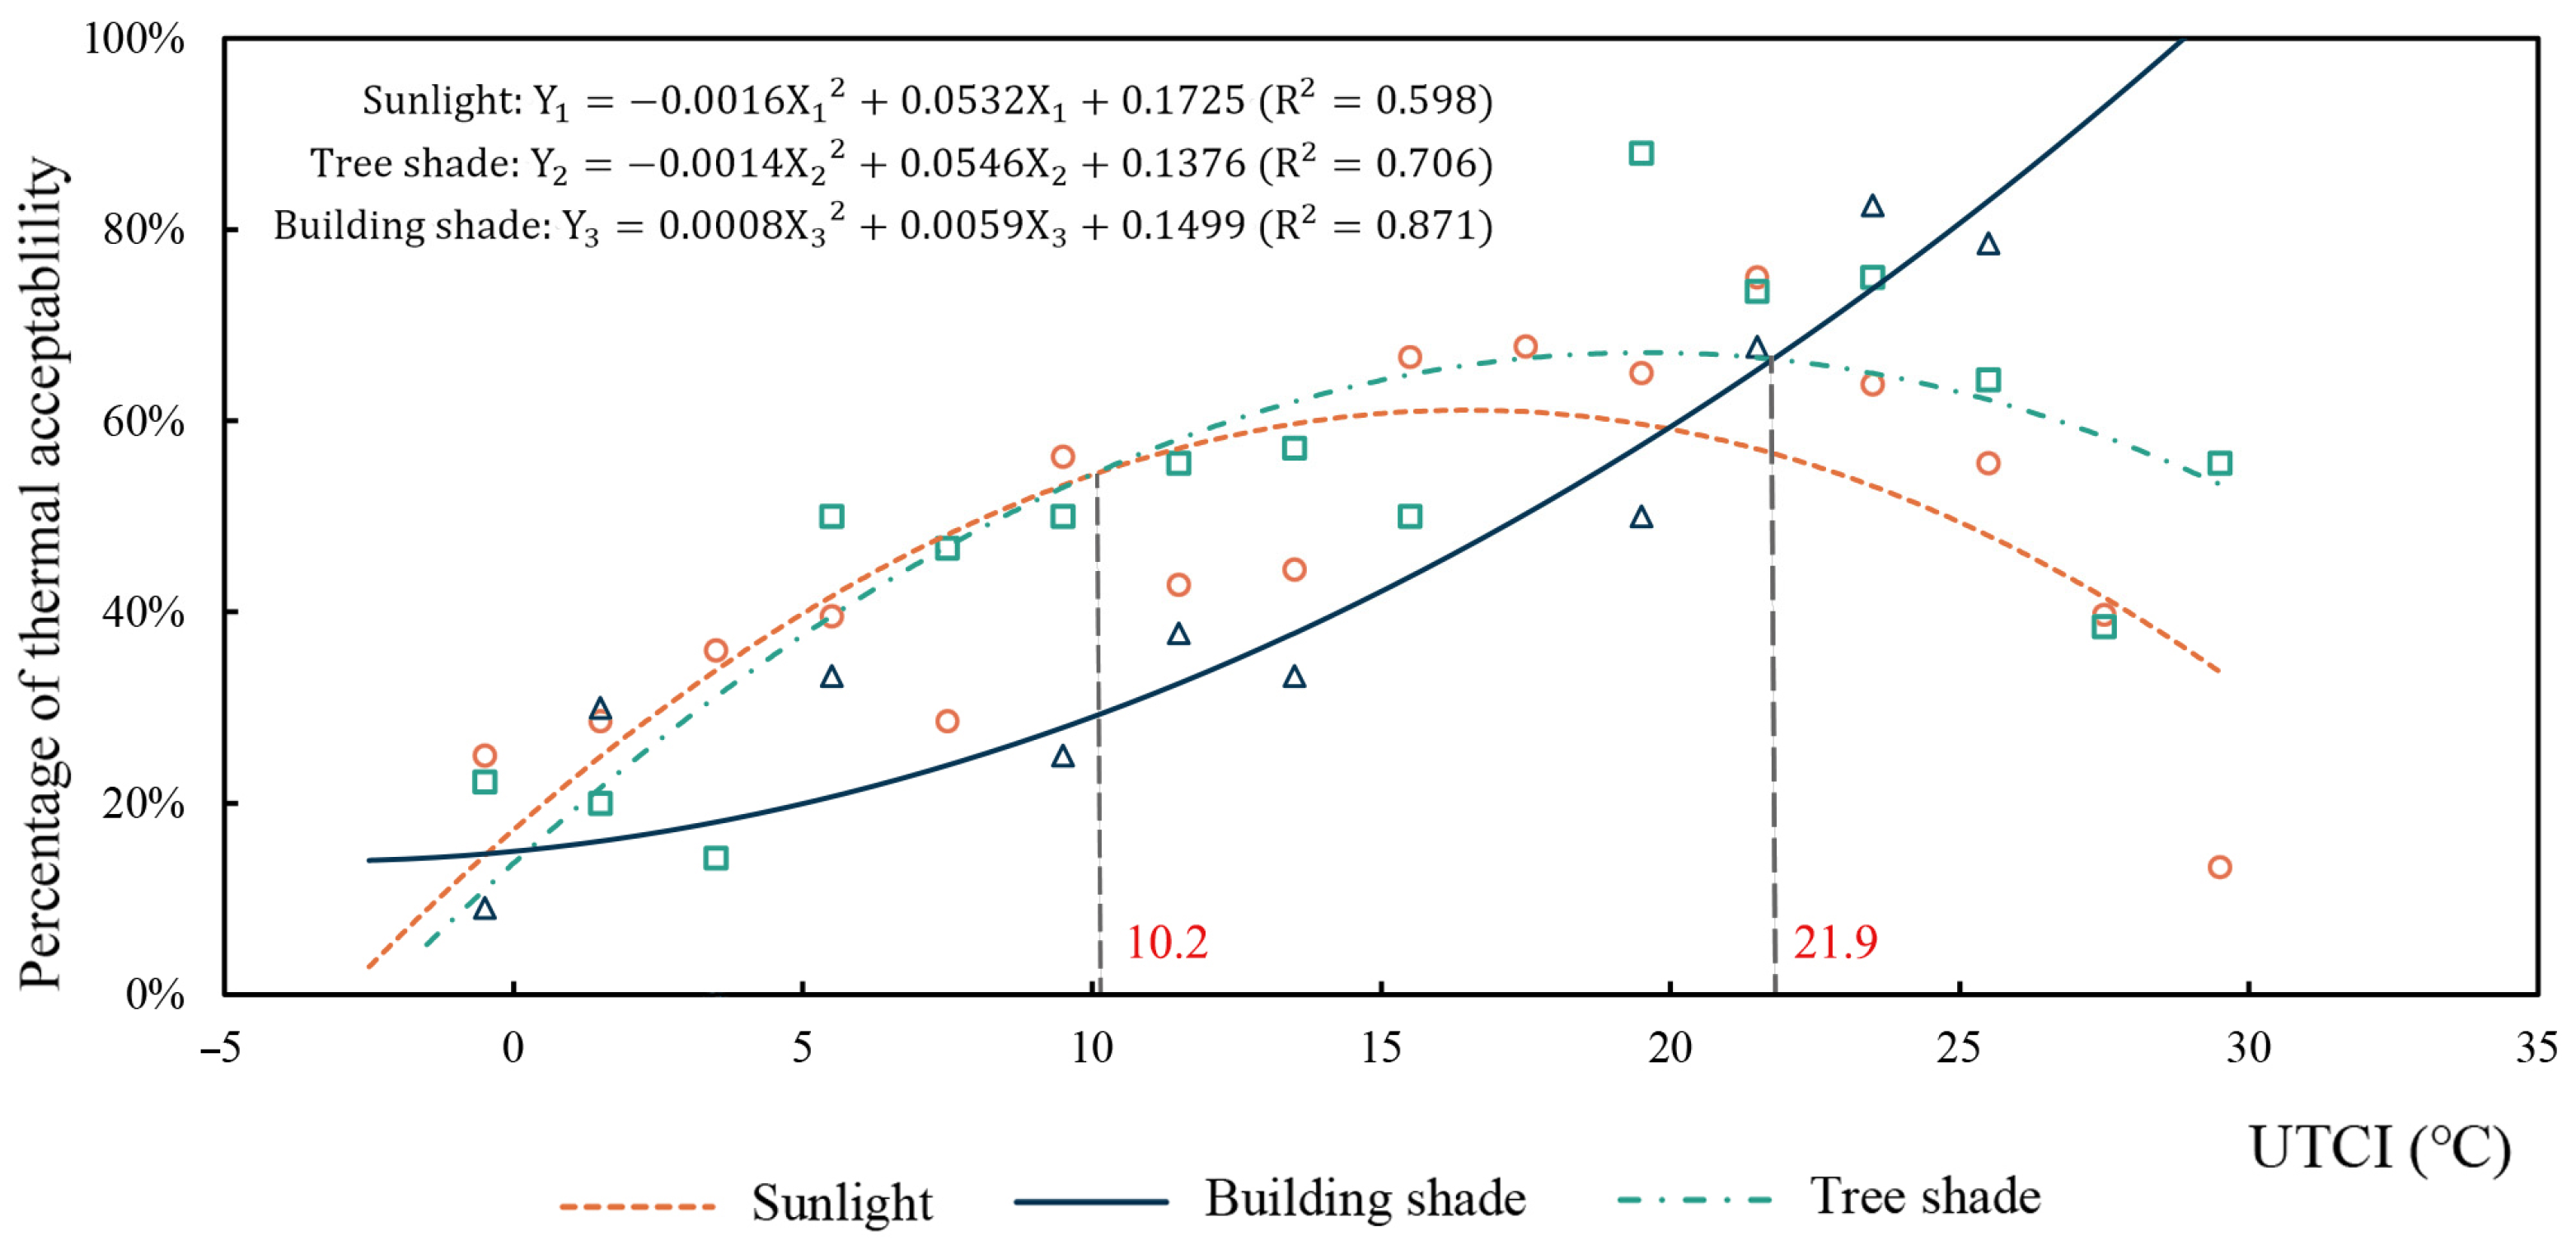
The thermal acceptability range is defined as the temperature considered to be within the acceptable range by at least 80% of the people, i.e., a range considered to be unacceptable by only 20% of people. Two methods are commonly used to determine the thermal acceptability range: subjective questionnaires obtained directly or a fitting regression analysis of subjective questionnaires and objective measurements. The fitting regression analysis method defines temperatures at TSV of −1 to 1 as acceptable and temperatures beyond TSV of −1 to 1 as unacceptable. The interval algorithm was used to calculate the acceptable percentage of UTCI temperature, and regression analysis was performed on the mean UTCI within the interval (Figure 9) to obtain fitted equations for sunlight (9), tree shade (10) and building shade (11).
The results show that the curves for sunlight and tree shade are parabolas with downward openings and the curve for building shade is a parabola with an upward opening. In other words, the thermal acceptability in building shade gradually increases with an increasing UTCI temperature, while for sunlight and tree shade, the thermal acceptability increases with increasing UTCI within a certain range but begins to decrease after reaching the apex. This is because the discomfort in sunlight increases significantly at higher temperatures and the cooling effect of trees decreases. It is worth noting that both sunlight and tree shade have higher thermal acceptability than building shade before their curves intersect with the building shade curve. In addition, the acceptable UTCI range of 80% of the subjects is 25.1–29.1 °C in building shade. However, the temperature ranges in sunlight and tree shade are not able to satisfy more than 80% of the subjects in the entire transition season, indicating that people are intolerant to the thermal environment in sunlight and tree shade, possibly due to the large fluctuations from climate change in cold regions.
When UTCI is 20.9 °C, the thermal acceptability percentage is the same at 66.3% in tree shade and building shade and 57.0% in sunlight. Above this temperature, the thermal acceptability percentage continues to increase in building shade, while satisfaction declines faster in sunlight and relatively slower in tree shade. This indicates that at higher temperatures (UTCI ≥ 21.9 °C), building shade provides a low radiation environment, thereby increasing satisfaction in the outdoor environment. When 10.2 °C ≤ UTCI <21.9 °C, the order of thermal acceptability percentages from high to low is as follows: tree shade, sunlight and building shade. When UTCI <10.2 °C, the order is sunlight, tree shade and building shade. The results show that in a hot environment during transition seasons, people prefer building shade that can completely block solar radiation, whereas in a cold environment, sunlight is not always preferred, and with a change from hot to cold, people choose between tree shade and sunlight.
5. Conclusions
This study investigates the differences in outdoor thermal comfort in different spatial types under long-term observations in the transition season in Dalian, China. By analyzing subjective and objective data of outdoor thermal environments, the following conclusions were drawn from the perspective of outdoor thermal environments in cold regions.
(1) A significant correlation is present between TSV and all meteorological parameters during transition seasons in cold regions, and it has a positive correlation with Ta, RH and Tmrt and a negative correlation with V1.5 m. Ta and Tmrt have the strongest correlation with TSV and are the main factors affecting thermal sensation. In the design stage, they can be prioritized to improve people’s evaluations of outdoor thermal environments in transition seasons. In contrast, the effect of wind speed on outdoor thermal sensation is relatively minor.
(2) The most common thermal sensation reported by subjects in the transition season is “slightly cool”. The human thermal sensation experiences a gradual transformation from “hot” to “cold” over time, and the proportion of discomfort gradually increases. Among the three outdoor environments, the TSV in sunlight was found to be more dispersed than in building shade and tree shade. In addition, building shade provides a cooler thermal sensation when compared with tree shade. For OCV, there are smaller fluctuations in sunlight and tree shade.
(3) As a thermal environment evaluation index, UTCI has good applicability during transition seasons in cold regions. UTCI is closely related to mTSV with a correlation coefficient of 0.790. Compared to sunlight, building shade and tree shade environments decrease UTCI by 6.6 and 3.5 °C, respectively, and neutral UTCI in transition seasons is 18.8 °C. By comparing the neutral UTCI and neutral UTCI range, it was found that there is an obvious thermal adaptation in different climate zones.
(4) The neutral temperature in sunlight (17.7 °C UTCI) is the lowest during transition seasons in cold regions, followed by tree shade (22.0 °C UTCI) and building shade (23.7 °C UTCI). At the same UTCI, mTSV is highest in sunlight and lowest in building shade, indicating that people feel warmer in sunlight and colder in building shade than in tree shade. In addition, people’s sensitivity to changes in UTCI in different environments differs, with sunlight < tree shade < building shade, which means that people’s thermal sensation is more likely to change in building shade. Therefore, to improve thermal comfort and extend outdoor activity times during the transition season, it is necessary to adopt various flexible design strategies, taking into account both the shading needs in sunlight environments under high-temperature conditions and the warmth needs in building shade environments under low-temperature conditions.
(5) The thermal acceptability results show that people vary in their acceptance of different environments in the transition season, with the acceptable UTCI range of 25.1–29.1 °C in building shade and consistently below 80% in sunlight and tree shade. In addition, there are differences in environmental requirements at different temperatures. When the temperature is higher (UTCI ≥ 21.9 °C), people prefer a low radiation environment in building shade. When 10.2 °C ≤ UTCI < 21.9 °C, people prefer to be in tree shade. When the temperature is lower (UTCI < 10.2 °C), people prefer sunlight.
This study confirms the applicability of UTCI in transition seasons in cold regions, investigates the subjective satisfaction and objective parameters of thermal comfort in three outdoor environments and analyzes the spatial differences in people’s thermal comfort evaluation. Considering that climate parameters fluctuate greatly at different times in transition seasons in cold regions and that thermal comfort varies among different space types, local governments and planners should adopt flexible optimization strategies when designing public spaces. For example, some shading measures can be added at higher temperatures and removed at lower temperatures. The findings can be used as an objective standard to evaluate outdoor thermal comfort conditions in Dalian and provide a reference for designing a comfortable thermal environment in different outdoor spaces during transition seasons in cold regions, which will help improve overall comfort in outdoor environments.
Author Contributions
Conceptualization, F.G.; methodology, F.G.; software, Z.W.; validation, F.G.; formal analysis, Z.W. and J.D.; investigation, Z.W., H.Z. and J.D.; resources, F.G.; data curation, Z.W.; writing—original draft preparation, J.D. and Z.W.; writing—review and editing, J.D. and F.G.; visualization, Z.W. and Y.M.; supervision, F.G., X.L. and S.S.Y.L.; project administration, F.G.; funding acquisition, F.G. All authors have read and agreed to the published version of the manuscript.
Funding
This research was funded by the China National Social Science Fund (No. 18BGL233).
Institutional Review Board Statement
Not applicable.
Informed Consent Statement
Informed consent was obtained from all subjects involved in the study.
Data Availability Statement
Not applicable.
Conflicts of Interest
The authors declare no conflict of interest.
References
- Dong, J.; Lin, M.; Zuo, J.; Lin, T.; Liu, J.; Sun, C.; Luo, J. Quantitative study on the cooling effect of green roofs in a high-density urban Area—A case study of Xiamen, China. J. Clean. Prod. 2020, 255, 120152. [Google Scholar] [CrossRef]
- Geng, Y.; Hong, B.; Du, M.; Yuan, T.; Wang, Y. Combined effects of visual-acoustic-thermal comfort in campus open spaces: A pilot study in China’s cold region, Build. Build. Environ. 2022, 209, 108658. [Google Scholar] [CrossRef]
- Thorsson, S.; Rocklöv, J.; Konarska, J.; Lindberg, F.; Holmer, B.; Dousset, B.; Rayner, D. Mean radiant temperature—A predictor of heat related mortality. Urban Clim. 2014, 10, 332–345. [Google Scholar] [CrossRef]
- Yin, Q.; Cao, Y.; Sun, C. Research on outdoor thermal comfort of high-density urban center in severe cold area. Build. Environ. 2021, 200, 107938. [Google Scholar] [CrossRef]
- Ma, X.; Tian, Y.; Du, M.; Hong, B.; Lin, B. How to design comfortable open spaces for the elderly? Implications of their thermal perceptions in an urban park. Sci. Total Environ. 2021, 768, 144985. [Google Scholar] [CrossRef] [PubMed]
- Knez, I.; Thorsson, S. Influences of culture and environmental attitude on thermal, emotional and perceptual evaluations of a public square. Int. J. Biometeorol. 2006, 50, 258–268. [Google Scholar] [CrossRef]
- Mutz, M.; Reimers, A.K.; Demetriou, Y. Leisure time sports activities and life satisfaction: Deeper insights based on a repre-sentative survey from Germany. Appl. Res. Qual. Life 2020, 16, 1–17. [Google Scholar] [CrossRef]
- Niu, J.; Liu, J.; Lee, T.-C.; Lin, Z.; Mak, C.; Tse, K.-T.; Tang, B.-S.; Kwok, K.C. A new method to assess spatial variations of outdoor thermal comfort: Onsite monitoring results and implications for precinct planning. Build. Environ. 2015, 91, 263–270. [Google Scholar] [CrossRef] [Green Version]
- Chen, L.; Wen, Y.; Zhang, L.; Xiang, W.-N. Studies of thermal comfort and space use in an urban park square in cool and cold seasons in Shanghai. Build. Environ. 2015, 94, 644–653. [Google Scholar] [CrossRef]
- Zhang, Y.; Liu, C. Digital Simulation for Buildings’ Outdoor Thermal Comfort in Urban Neighborhoods. Buildings 2021, 11, 541. [Google Scholar] [CrossRef]
- Bustamante-Zapata, A.M.; Zafra-Mejía, C.A.; Rondón-Quintana, H.A. Influence of Vegetation on Outdoor Thermal Comfort in a High-Altitude Tropical Megacity: Climate Change and Variability Scenarios. Buildings 2022, 12, 520. [Google Scholar] [CrossRef]
- Rupp, R.F.; Vasquez, N.G.; Lamberts, R. A review of human thermal comfort in the built environment. Energy Build. 2015, 105, 178–205. [Google Scholar] [CrossRef]
- Hao, X.; Liu, L.; Tan, H.; Lin, Y.; Hu, J.; Yin, W. The Impacts of Greenery Systems on Indoor Thermal Environments in Transition Seasons: An Experimental Investigation. Buildings 2022, 12, 506. [Google Scholar] [CrossRef]
- K’antor, N.; Egerhazi, L.; Unger, J. Subjective estimation of thermal environment in recreational urban spaces–part 1: Inves-tigations in Szeged, Hungary. Int. J. Biometeorol. 2012, 56, 1075–1088. [Google Scholar] [CrossRef]
- Jin, H.; Liu, S.; Kang, J. Thermal comfort range and influence factor of urban pedestrian streets in severe cold regions. Energy Build. 2019, 198, 197–206. [Google Scholar] [CrossRef]
- Yahia, M.W.; Johansson, E. Evaluating the behaviour of different thermal indices by investigating various outdoor urban environments in the hot dry city of Damascus, Syria. Int. J. Biometeorol. 2012, 57, 615–630. [Google Scholar] [CrossRef] [PubMed]
- Pantavou, K.; Theoharatos, G.; Santamouris, M.; Asimakopoulos, D. Outdoor thermal sensation of pedestrians in a Mediter-ranean climate and a comparison with UTCI. Build. Environ. 2013, 66, 82–95. [Google Scholar] [CrossRef]
- Tsitoura, M.; Tsoutsos, T.; Daras, T. Evaluation of comfort conditions in urban open spaces. Application in the island of Crete. Energy Convers. Manag. 2014, 86, 250–258. [Google Scholar] [CrossRef]
- Trindade da Silva, F.; Engel de Alvarez, C. An integrated approach for ventilation’s assessment on outdoor thermal comfort. Build. Environ. 2015, 87, 59–71. [Google Scholar] [CrossRef]
- Ruiz, M.A.; Correa, E.N. Adaptive model for outdoor thermal comfort assessment in an oasis city of arid climate. Build. Environ. 2015, 85, 40–51. [Google Scholar] [CrossRef]
- Amindeldar, S.; Heidari, S.; Khalili, M. The effect of personal and microclimatic variables on outdoor thermal comfort: A field study in Tehran in cold season. Sustain. Cities Soc. 2017, 32, 153–159. [Google Scholar] [CrossRef]
- Wang, Y.; De Groot, R.; Bakker, F.; Wörtche, H.; Leemans, R. Thermal comfort in urban green spaces: A survey on a Dutch university campus. Int. J. Biometeorol. 2016, 61, 87–101. [Google Scholar] [CrossRef] [PubMed] [Green Version]
- Xu, M.; Hong, B.; Mi, J.; Yan, S. Outdoor thermal comfort in an urban park during winter in cold regions of China. Sustain. Cities Soc. 2018, 43, 208–220. [Google Scholar] [CrossRef]
- Cohen, P.; Shashua-Bar, L.; Keller, R.; Gil-Ad, R.; Yaakov, Y.; Lukyanov, V.; Bar (Kutiel), P.; Tanny, J.; Cohen, S.; Potchter, O. Urban outdoor thermal perception in hot arid Beer Sheva, Israel: Methodological and gender aspects. Build. Environ. 2019, 160, 106169. [Google Scholar] [CrossRef]
- Canan, F.; Golasi, I.; Ciancio, V.; Coppi, M.; Salata, F. Outdoor thermal comfort conditions during summer in a cold semi-arid climate. A transversal field survey in Central Anatolia (Turkey). Build. Environ. 2018, 148, 212–224. [Google Scholar] [CrossRef]
- Nasrollahi, N.; Namazi, Y.; Taleghani, M. The effect of urban shading and canyon geometry on outdoor thermal comfort in hot climates: A case study of Ahvaz, Iran. Sustain. Cities Soc. 2020, 65, 102638. [Google Scholar] [CrossRef]
- Mohammad, P.; Aghlmand, S.; Fadaei, A.; Gachkar, S.; Gachkar, D.; Karimi, A. Evaluating the role of the albedo of material and vegetation scenarios along the urban street canyon for improving pedestrian thermal comfort outdoors. Urban Clim. 2021, 40, 100993. [Google Scholar] [CrossRef]
- Tian, Y.; Hong, B.; Zhang, Z.; Wu, S.; Yuan, T. Factors influencing resident and tourist outdoor thermal comfort: A comparative study in China’s cold region. Sci. Total Environ. 2022, 808, 152079. [Google Scholar] [CrossRef]
- De Freitas, C.; Grigorieva, E. Role of acclimatization in weather-related human mortality during the transition seasons of au-tumn and spring in a thermally extreme mid-latitude continental climate. Int. J. Environ. Res. Public Health 2015, 12, 14974–14987. [Google Scholar] [CrossRef] [Green Version]
- Li, S. User’ behavior of small urban spaces in winter and marginal seasons. J. Kyushu Dent. Soc. 1994, 10, 95–109. [Google Scholar]
- Li, J.; Zhao, L.; Peng, Z.; Wang, Z.; Shui, T. Study on Outdoor Thermal Comfort in the Transitional Season of Hefei. In E3S Web of Conferences; EDP Sciences: Les Ulis, France, 2020. [Google Scholar] [CrossRef]
- Jin, H.; Liu, S.; Kang, J. Gender differences in thermal comfort on pedestrian streets in cold and transitional seasons in severe cold regions in China. Build. Environ. 2019, 168, 106488. [Google Scholar] [CrossRef]
- Chen, Q.; Lin, C.; Guo, D.; Hou, Y.; Lai, D. Studies of outdoor thermal comfort in northern China. Build. Environ. 2014, 77, 110–118. [Google Scholar] [CrossRef]
- Zeng, Y.; Dong, L. Thermal human biometeorological conditions and subjective thermal sensation in pedestrian streets in Chengdu, China. Int. J. Biometeorol. 2014, 59, 99–108. [Google Scholar] [CrossRef] [PubMed]
- Cheung, P.K.; Jim, C. Comparing the cooling effects of a tree and a concrete shelter using PET and UTCI. Build. Environ. 2018, 130, 49–61. [Google Scholar] [CrossRef]
- Zhu, Z.; Liang, J.; Sun, C.; Han, Y. Summer Outdoor Thermal Comfort in Urban Commercial Pedestrian Streets in Severe Cold Regions of China. Sustainability 2020, 12, 1876. [Google Scholar] [CrossRef] [Green Version]
- Middel, A.; Selover, N.; Hagen, B.; Chhetri, N. Impact of shade on outdoor thermal comfort-a seasonal field study in Tempe, Arizona. Int. J. Biometeorol. 2016, 60, 1849–1861. [Google Scholar] [CrossRef] [Green Version]
- Kantor, N.; Chen, L.; Gal, C.V. Human-biometeorological significance of shading in urban public spaces-Summertime meas-urements in Pecs, Hungary. Landsc. Urban Plan. 2018, 170, 241–255. [Google Scholar] [CrossRef]
- Xu, M.; Hong, B.; Jiang, R.; An, L.; Zhang, T. Outdoor thermal comfort of shaded spaces in an urban park in the cold region of China. Build. Environ. 2019, 155, 408–420. [Google Scholar] [CrossRef]
- Hien, W.N.; Jusuf, S.K. Air Temperature Distribution and the Influence of Sky View Factor in a Green Singapore Estate. J. Urban Plan. Dev. 2010, 136, 261–272. [Google Scholar] [CrossRef]
- Vailshery, L.S.; Jaganmohan, M.; Nagendra, H. Effect of street trees on microclimate and air pollution in a tropical city. Urban For. Urban Green. 2013, 12, 408–415. [Google Scholar] [CrossRef]
- Coutts, A.M.; White, E.C.; Tapper, N.J.; Beringer, J.; Livesley, S.J. Temperature and human thermal comfort effects of street trees across three contrasting street canyon environments. Theor. Appl. Climatol. 2015, 124, 55–68. [Google Scholar] [CrossRef]
- Colter, K.; Middel, A.C.; Martin, C.A. Effects of natural and artificial shade on human thermal comfort in residential neigh-borhood parks of Phoenix, Arizona, USA. Urban For. Urban Green. 2019, 44, 126429. [Google Scholar] [CrossRef]
- Watanabe, S.; Nagano, K.; Ishii, J.; Horikoshi, T. Evaluation of outdoor thermal comfort in sunlight, building shade, and pergola shade during summer in a humid subtropical region. Build. Environ. 2014, 82, 556–565. [Google Scholar] [CrossRef]
- Jamei, E.; Rajagopalan, P.; Seyedmahmoudian, M.; Jamei, Y. Review on the impact of urban geometry and pedestrian level greening on outdoor thermal comfort. Renew. Sustain. Energy Rev. 2016, 54, 1002–1017. [Google Scholar] [CrossRef]
- Culjat, B. Climate and the Build Environment in the North; Royal. Institute of Technology: Stockholm, Sweden, 1975. [Google Scholar]
- ISO International Standard 7726; Thermal Environment-Instruments and Method for Measuring Physical Quantities International Standard Organization. ISO: Geneva, Switzerland, 1998.
- Broede, P.; Fiala, D.; Blazejczyk, K.; Holmér, I.; Jendritzky, G.; Kampmann, B.; Tinz, B.; Havenith, G. Deriving the operational procedure for the Universal Thermal Climate Index (UTCI). Int. J. Biometeorol. 2011, 56, 481–494. [Google Scholar] [CrossRef] [Green Version]
- Weihs, P.; Staiger, H.; Tinz, B.; Batchvarova, E.; Rieder, H.; Vuilleumier, L.; Maturilli, M.; Jendritzky, G. The uncertainty of UTCI due to uncertainties in the determination of radiation fluxes derived from measured and observed meteorological data. Int. J. Biometeorol. 2011, 56, 537–555. [Google Scholar] [CrossRef]
- ANSI/ASHRAE. ASHRAE Handbook-Fundamentals, Chapter 24.3; ASHRAE: Atlanta, GA, USA, 2017. [Google Scholar]
- Lin, T.-P.; Matzarakis, A.; Hwang, R.-L. Shading effect on long-term outdoor thermal comfort. Build. Environ. 2010, 45, 213–221. [Google Scholar] [CrossRef]
- Guo, F.; Zhang, H.; Fan, Y.; Zhu, P.; Wang, S.; Lu, X.; Jin, Y. Detection and evaluation of a ventilation path in a mountainous city for a sea breeze: The case of Dalian. Build. Environ. 2018, 145, 177–195. [Google Scholar] [CrossRef]
- He, X.; An, L.; Hong, B.; Huang, B.; Cui, X. Cross-cultural differences in thermal comfort in campus open spaces: A longitudinal field survey in China’s cold region. Build. Environ. 2020, 172, 106739. [Google Scholar] [CrossRef]
- Hadianpour, M.; Mahdavinejad, M.; Bemanian, M.; Nasrollahi, F. Seasonal differences of subjective thermal sensation and neutral temperature in an outdoor shaded space in Tehran, Iran. Sustain. Cities Soc. 2018, 39, 751–764. [Google Scholar] [CrossRef]
- Feng, X.; Zheng, Z.; Yang, Y.; Fang, Z. Quantitative seasonal outdoor thermal sensitivity in Guangzhou, China. Urban Clim. 2021, 39, 100938. [Google Scholar] [CrossRef]
- Wang, Y.; Pan, C.; Huang, Z. Comparison of applicability of PET and UTCI in different seasons in Shanghai. Build. Sci. 2020, 36, 55–61. [Google Scholar]
Figure 1.
A technique flowchart of the methodology applied in the present analysis.

Figure 2.
Monthly mean and maximum/minimum Ta and mean RH in Dalian.

Figure 3.
Fitting curve of clothing thermal resistance and air temperature.

Figure 4.
Proportions of TSV at measuring points.

Figure 5.
Proportions of OCV at measuring points.

Figure 6.
Preference distribution of meteorological parameters in different environments.

Figure 7.
Correlation analysis of UTCI and mean thermal sensation vote (mTSV).

Figure 8.
Regression relationship between mTSV and UTCI in three environments.

Figure 9.
Regression curve of UTCI and acceptable percentage in three environments.


Table 1.
Review of thermal comfort research in different regions.
| Region | Climate | Season | Measurement Time | Thermal Comfort Index |
|---|---|---|---|---|
| Damascus, Syria [16] | BWk | Summer, winter | 7 days in summer, 8 days in winter | PET |
| Athens, Greece [17] | Csa | Summer, autumn, winter | 2 days per season | UTCI |
| Crete, Greece [18] | Cfa | Hot and cold season | 1 day per season | PET/PMV/WBGT/ SET |
| Shanghai, China [9] | Cfa | Autumn, winter | 2 days in autumn, 3 days in winter | PET |
| Vitória, Brazil [19] | Aw | Spring, summer, winter | 2 days per season | PET |
| Mendoza, Argentina [20] | BWk | Summer, winter | 3 days per season | - |
| Teheran, Iran [21] | Csa | Winter | 5 days | - |
| Groningen, Netherlands [22] | Cfb | Spring, summer | 2 days in spring, 3 days in summer | PET |
| Xi’an, China [23] | Cwa/BSK | Winter | 3 days | UTCI/PET |
| Beer Sheva, Israel [24] | Bsh | Summer, winter | 10 days in summer, 3 days in winter | PET |
| Harbin, China [15] | Dwa | All year | 1 day per season | UTCI |
| Anatolia, Turkey [25] | BSk | Summer | 2 days | PET |
| Harbin, China [24] | Dwa | Spring, autumn, winter | 1 day per season | UTCI |
| Ahvaz, Iran [26] | BWh | Summer | 6 days | PET |
| Roorkee, India [27] | Cfa | Summer | 1 days | PET |
| Xi’an, China [28] | Cwa/BSK | Spring, summer, winter | 3 days per season | PET |
Table 2.
Overview of each survey point in Dalian University of Technology.
 | |||||
|---|---|---|---|---|---|
| Point | A | B | C | D | E |
| Sketch map |  |  |  |  |  |
| 1 |  |  |  |  |  |
| SVF | 0.837 | 0.974 | 0.766 | 0.963 | 0.842 |
| 2 |  | — |  |  |  |
| SVF | 0.228 | — | 0.717 | 0.361 | 0.313 |
| 3 |  |  |  |  |  |
| SVF | 0.582 | 0.772 | 0.535 | 0.711 | 0.426 |
Table 3.
Experimental instruments and parameters.
| Parameter | Instrument | Range | Precision |
|---|---|---|---|
| Air Temperature (Ta) | HOBO H21-002 | −20 to 50 °C | ±0.2 °C |
| Relative Humidity (RH) | 0–10% RH 10–90% RH 90–100% RH | ±3% RH ±2% RH ±3% RH | |
| Wind Velocity (Va) | Kestrel 5500 | 0.1–9.99 m/s 10.0–20.0 m/s | +(0.05 m/s + 5% readout) +(5% readout) |
| Globe Temperature (Tg) | JTR10 WBGT | 5–120 °C | ±0.5 °C |
Table 4.
Outdoor thermal comfort questionnaire adopted in this study.
| Outdoor Thermal Comfort Questionnaire |
|---|
| Date: _________ Time: _________ Gender: (1) Male (2) Female Age: _________ Province: _________ 1. Current location: □Under the Shade of Trees □Under the Shadow of Buildings □Under Direct Sunlight 2. Your current clothing includes (multiple choices): Upper:□Vest □Underwear □Short-sleeve T-shirt □Long-sleeve T-shirt □Pullover □Shirt □Sweater □Jacket □Thick coat □Thin coat □Cotton clothes □Down jacket Bottom: □Shorts □Short skirt □Trousers □Long skirt □Sweat pants □Woolen pants □Cotton pants Footwear: □Sandals □Shoes □Boots □Cotton-padded shoes □Pantyhose □Ankle-length socks □Socks □Low-cut liner socks Others: ___________________________ 3. Please describe your thermal sensation at present □−3 Cold □−2 Cool □−1 Slightly cool □0 Neutral □1 Slightly warm □2 Warm □3 Hot 4. Please describe your overall comfort level at present: □−1 Uncomfortable □0 Neutral □1 Comfortable 5. What changes do you expect from the following meteorological data at present: Air temperature: □Higher □Unchanged □Lower Relative humidity: □Higher □Unchanged □Lower Wind speed: □Stronger □Unchanged □Weaker Solar Radiation: □Stronger □Unchanged □Weaker |
Table 5.
The Pearson correlation between TSV and meteorological parameters.
| Ta | RH | V1.5 m | Tmrt | |
|---|---|---|---|---|
| TSV | 0.636 ** | 0.313 ** | −0.138 ** | 0.589 ** |
** Represents that the significance level is at 0.01.
Table 6.
Neutral UTCI and neutral UTCI range for the transition season in different climate regions.
Table 6.
Neutral UTCI and neutral UTCI range for the transition season in different climate regions.
| City, Country | Climate | Seasons | Neutral UTCI in Transition Season | Neutral UTCI Range in Transition Season |
|---|---|---|---|---|
| Dalian, China (this study) | Dwa | Autumn | 18.8 °C | 14.7–23.0 °C |
| Harbin, China [15] | Dwa | All year | 21.4 °C | 12.0–30.8 °C |
| Xi’an, China [53] | Cwa/BSk | Spring, summer, winter | 22.8 °C (Chinese), 21.8 °C (Pakistani) | 17.9–27.7 °C (Chinese), 15.6–28.0 °C (Pakistani) |
| Tehran, Iran [54] | BWk | All year | 21.5 °C | 17.7–25.4 °C |
| Guangzhou, China [55] | Cfa | All year | 23.7 °C | 21.3–26.1 °C |
| Shanghai, China [56] | Cfa | All year | 23.7 °C | 18.2–31.7 °C |
Publisher’s Note: MDPI stays neutral with regard to jurisdictional claims in published maps and institutional affiliations. |
© 2022 by the authors. Licensee MDPI, Basel, Switzerland. This article is an open access article distributed under the terms and conditions of the Creative Commons Attribution (CC BY) license (https://creativecommons.org/licenses/by/4.0/).
Share and Cite
MDPI and ACS Style
Guo, F.; Wang, Z.; Dong, J.; Zhang, H.; Lu, X.; Lau, S.S.Y.; Miao, Y. Spatial Differences in Outdoor Thermal Comfort during the Transition Season in Cold Regions of China. Buildings 2022, 12, 720. https://doi.org/10.3390/buildings12060720
AMA Style
Guo F, Wang Z, Dong J, Zhang H, Lu X, Lau SSY, Miao Y. Spatial Differences in Outdoor Thermal Comfort during the Transition Season in Cold Regions of China. Buildings. 2022; 12(6):720. https://doi.org/10.3390/buildings12060720
Chicago/Turabian StyleGuo, Fei, Zuoxing Wang, Jing Dong, Hongchi Zhang, Xiaodong Lu, Stephen Siu Yu Lau, and Yijia Miao. 2022. "Spatial Differences in Outdoor Thermal Comfort during the Transition Season in Cold Regions of China" Buildings 12, no. 6: 720. https://doi.org/10.3390/buildings12060720
Note that from the first issue of 2016, this journal uses article numbers instead of page numbers. See further details here.