
Vision-Based Methods for Relative Sag Measurement of Suspension Bridge Cables
by
 , ,
, ,
Can Huang
1,2, 
Yongwei Wang
1,3,
Shuyuan Xu
4,* ,
,
Wenchi Shou
5,
Chengming Peng
1,2 and
Danfeng Lv
1 1
CCCC Second Harbor Engineering Company Ltd., Wuhan 430040, China
2
CCCC Highway Bridge National Engineering Research Centre Co., Ltd., Beijing 100120, China
3
Key Laboratory of Large-Span Bridge Construction Technology, Wuhan 430040, China
4
School of Civil Engineering and Architecture, Zhejiang Sci-Tech University, Hangzhou 310018, China
5
School of Engineering, Design and Built Environment, Western Sydney University, Kingswood, NSW 2745, Australia
*
Author to whom correspondence should be addressed.
Buildings 2022, 12(5), 667; https://doi.org/10.3390/buildings12050667
Submission received: 22 April 2022
/
Revised: 10 May 2022
/
Accepted: 14 May 2022
/
Published: 17 May 2022
(This article belongs to the Special Issue Application of Emerging Technologies to Improve Construction Performance)
Abstract
:Main cables, comprising a number of wire strands, constitute a vital element in long-span suspension bridges. The determination of their alignment during construction is of great importance, and relative sag is commonly measured for the efficient sag adjustment of general strands. The conventional approach uses the caterpillar method, which is inconvenient, difficult-to-implement, and potentially dangerous. In order to realize the high-precision measurement of cable alignment in a strong wind environment, a vision-based method for relative sag measurement of the general cable strands is proposed in this paper. In the proposed measurement system, images of pre-installed optical targets are collected and analyzed to realize the remote, automatic, and real-time measurement of the relative sag. The influences of wind-induced cable shaking and camera shaking on the accuracy of the height difference measurement are also theoretically analyzed. The results show that cable strand torsion and camera roll have a great impact on the measurement accuracy, while the impacts of the cable strand swing and vibration, camera swing and vibration, and camera pitch and yaw are insignificant. The vision-based measurement system tested in the field experiment also shows a measurement error within 3 mm, which meets the requirements for cable adjustment construction. At the same time, the vision-based measurement method proposed and validated in this paper can improve the measurement accuracy and efficiency of strand alignment in a strong wind environment. Potential risks involved in the manual measurement, e.g., working at heights and in strong wind environments, can be eliminated, facilitating the automation of the cable erection process.
1. Introduction
Currently, suspension bridges, together with cable-stayed bridges, constitute the main solutions for long-span structures. The suspension bridge, in its modern form, typically consist of the anchorage, main towers, main cables, suspenders, and stiffening girders, according to their sequence of construction in common practices. A number of previous studies have investigated the challenges and solutions during the construction of these vital components [1,2], aiming for improved efficiency [3] and quality control [4]. In particular, main cables, as a major load-carrying member, connect between the towers and are anchored at each end of the ground or the bridge deck. As tension members, main cables are highly efficient in carrying all the loads transferred through the suspenders. Since the 1820s, wire strand cables were adapted for suspension cables for improved strength and reliability [5]. Cables are generally erected using an aerial spinning (AS) method or a prefabricated parallel wire strand (PWS) method [6]. In the former method, single wires are pulled across separately in situ, while in the latter method, prefabricated full-length wire stands are constructed directly. Challenges during the cable erection process, such as cable-saddle connection [7,8] and galloping in the wind field [9,10,11], have attracted intensive attention in academia [12]. During the operation and maintenance (O&M) phases of suspension bridges, the condition of the cable system requires close monitoring so as to identify safety issues such as broken wires and corrosion [13,14]. For example, Cho, Jin [15] proposed a cable climbing robot to approach the suspenders directly and inspect the inside status. Other studies deployed computer vision technology to determine the dynamic characteristics of cable-supported systems [16,17], given their intensive and successful applications in construction projects [18]. Accordingly, methods for the remedy and replacement of damaged cables have been proposed and tested in previous studies [19,20].
The configuration of suspension cables, especially sag, which is defined as the vertical intervals of the main cable in the main span, relates closely to the stability of the bridge and cable tensile forces. Specifically, the cable sag largely affects the aerodynamic stability of a suspension bridge, i.e., torsional frequency and flutter wind speed [21]. Extensive research efforts have been made regarding shape-finding analysis to determine the optimum cable configuration during the design stage [2]. At the construction stage, the main cables are commonly erected before the girder construction for earth-anchored suspension bridges. Therefore, the alignment control of all wire strands within a main cable, including the datum strand and the general strands, is vital to the construction quality control of a suspension bridge. Among all wire strands in the main cable, the initial configuration of the datum strand contributes largely to the main cable configuration, requiring precise control. An absolute triangular elevation method is commonly used by first determining the elevations of two prisms installed at the upper and lower middle of the datum strand with a total station. The midspan elevation of the strand is then calculated accordingly. In current practices, the sag measurement and adjustment of the datum strand are carried out at night when the temperature is stable, the wind speed is low, and there is no rain or fog. During the construction of the Shimotsui-Seto Bridge, a controlled tension method was first adopted for sag adjustment by determining cable sag under a constantly applied tension [22]. There are other methods proposed in previous studies as well, such as an iterative method based on the catenary theory [23] and a direct method based on the parabolic theory [24]. Other than the datum strand, there are general strands comprising the main cable. A relative sag method is intensively used for the sag adjustment of the general strands. Generally, a large caliper is used to measure the elevation difference between the datum strand and the general strand, which is then used for the sag adjustment of the general strand. Alternatively, a relative datum strand is selected as the reference strand for each layer of the cable. Based on the configuration of the relative datum strand, the sag of the general strands in the same layer and a new relative datum strand of the next layer can be adjusted. Iteratively, the configuration of the main cable can be precisely controlled.
Currently, the construction of bridges in high mountains and valleys or on the sea often faces a strong windy environment. To measure the cable sags under challenging conditions, conventional methods require trained inspectors to measure at height, e.g., on the cables or ladders, which is highly dangerous. Moreover, large calipers used in such methods are inconvenient to carry and difficult to implement. In particular, teamwork is required to conduct different tasks, such as providing adequate lighting and holding the ladder steady. In addition to the difficulties encountered during measurement, the accuracy of the measured height difference can be adversely affected by the shaking of cable strands. Considering the abovementioned issues in the current methods, this paper proposes a novel vision-based method to free inspectors from potentially dangerous and intensive tasks and, at the same time, improve the measurement accuracy. Specifically, two optical targets, installed in the midspan of the general strand and the datum strand, respectively, are used. An industrial camera is installed in the middle of the catwalk gantry, facing towards the span to obtain an orthophoto of the targets. A deep learning network is employed to learn features of the targets from images, enabling their detection and pixel-level location. Through proper conversion from the pixel distance, the actual spatial distance between the targets can be calculated. Considering other factors, such as tower deviation and strand temperature change, the elevation difference between the measured strand and the datum strand can be determined, providing informed and reliable instructions for sag adjustment. As a result, the proposed method can achieve the remote, automatic, and real-time measurement of general strand alignment with satisfactory precision and efficiency. In addition, a wide range of environmental factors are taken into account, and the proposed measurement method can be robust regarding various challenging conditions, e.g., wind conditions.
2. Principle of Sag Measurement
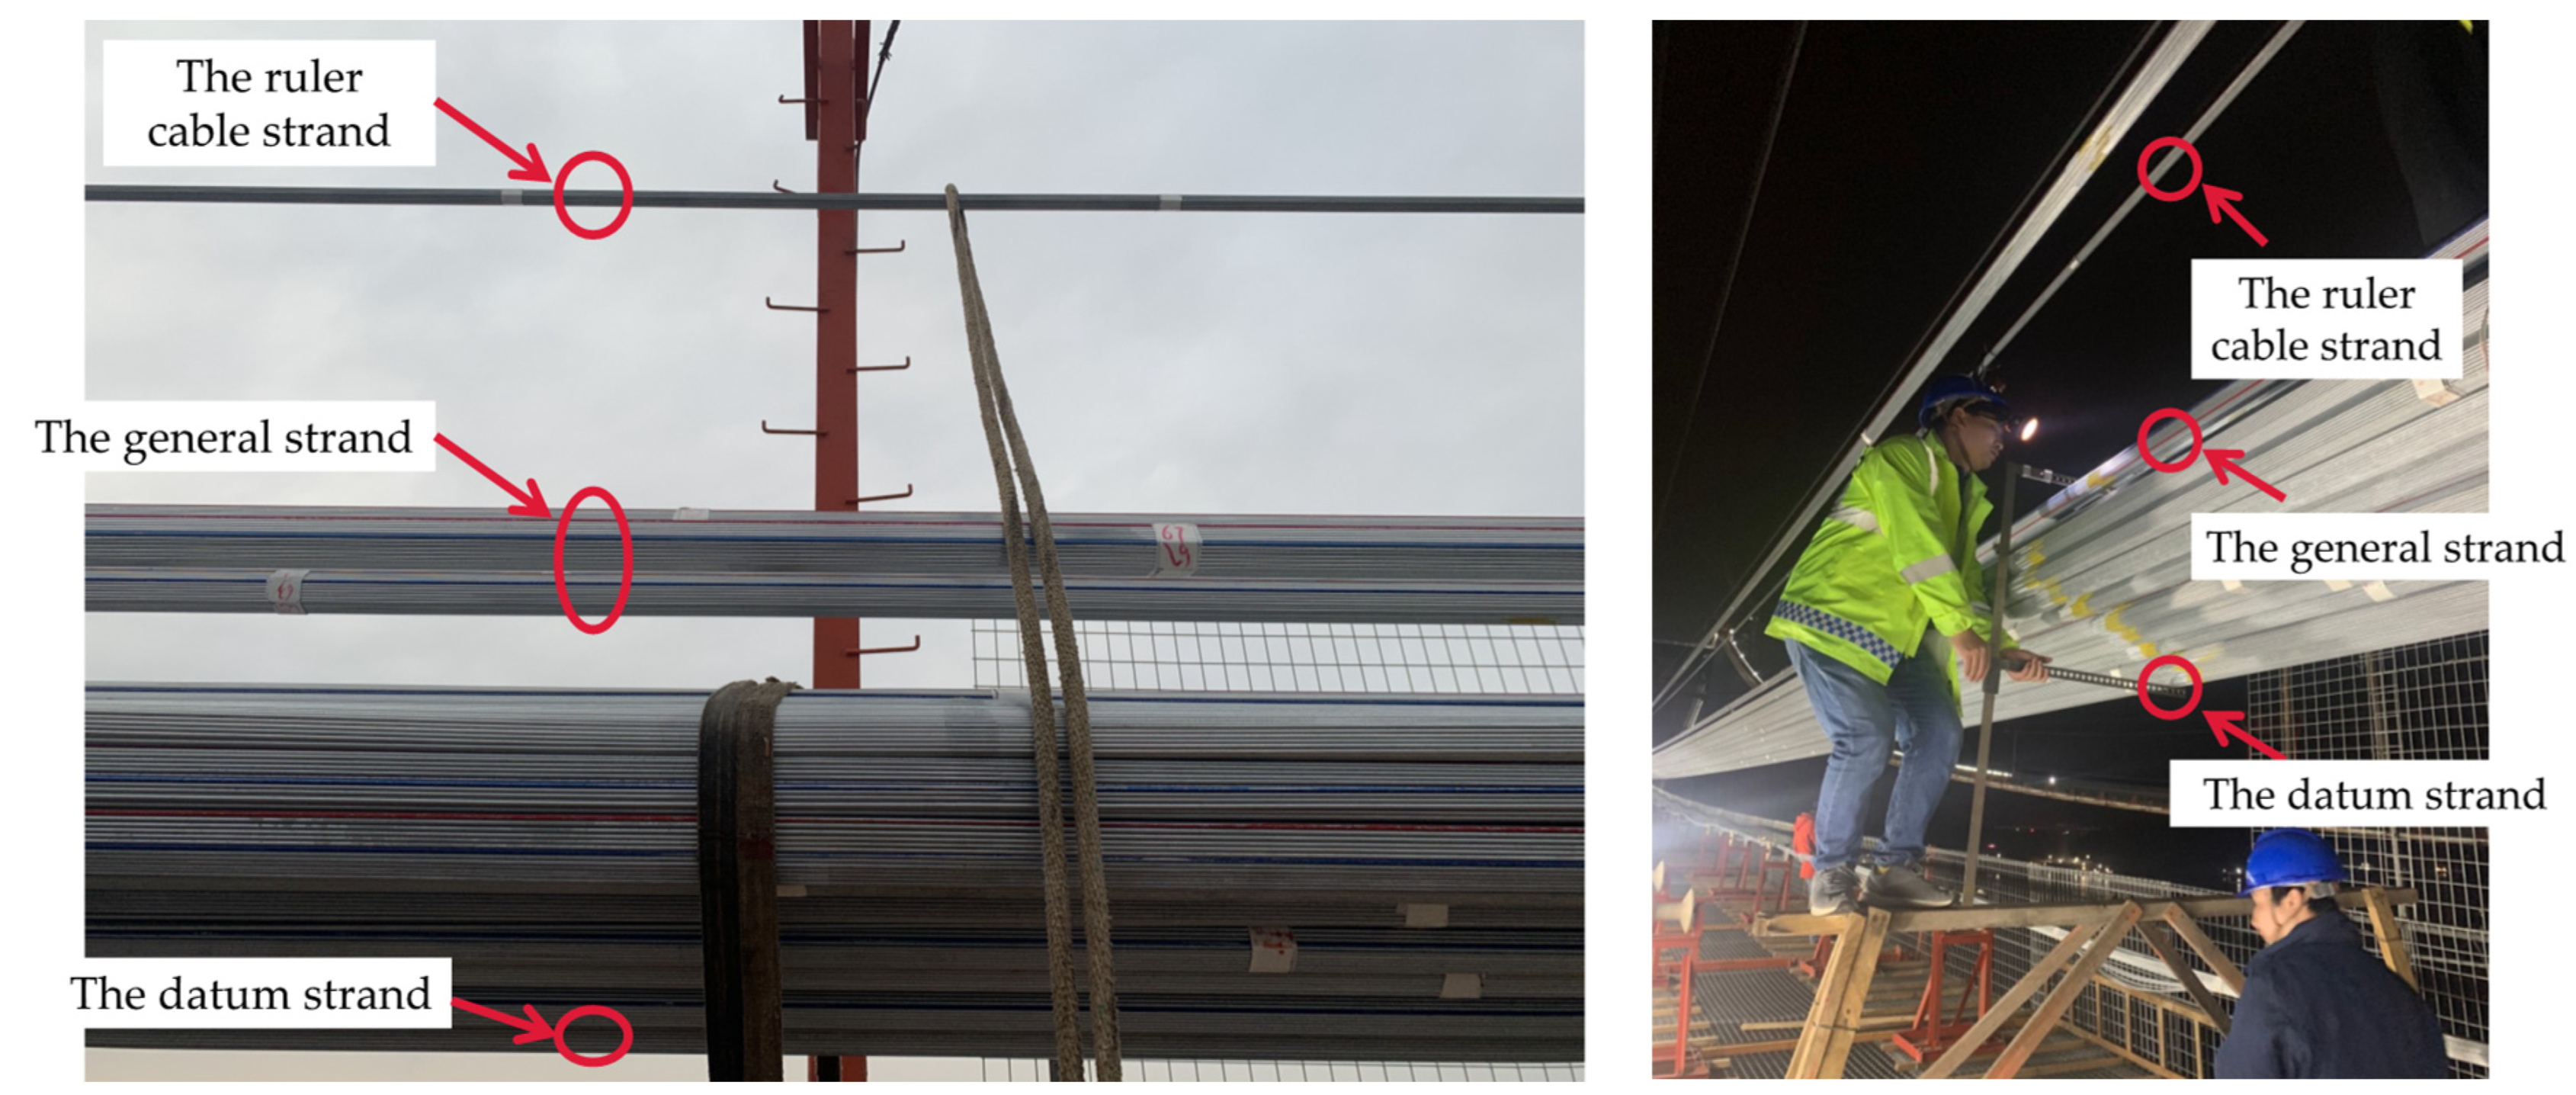
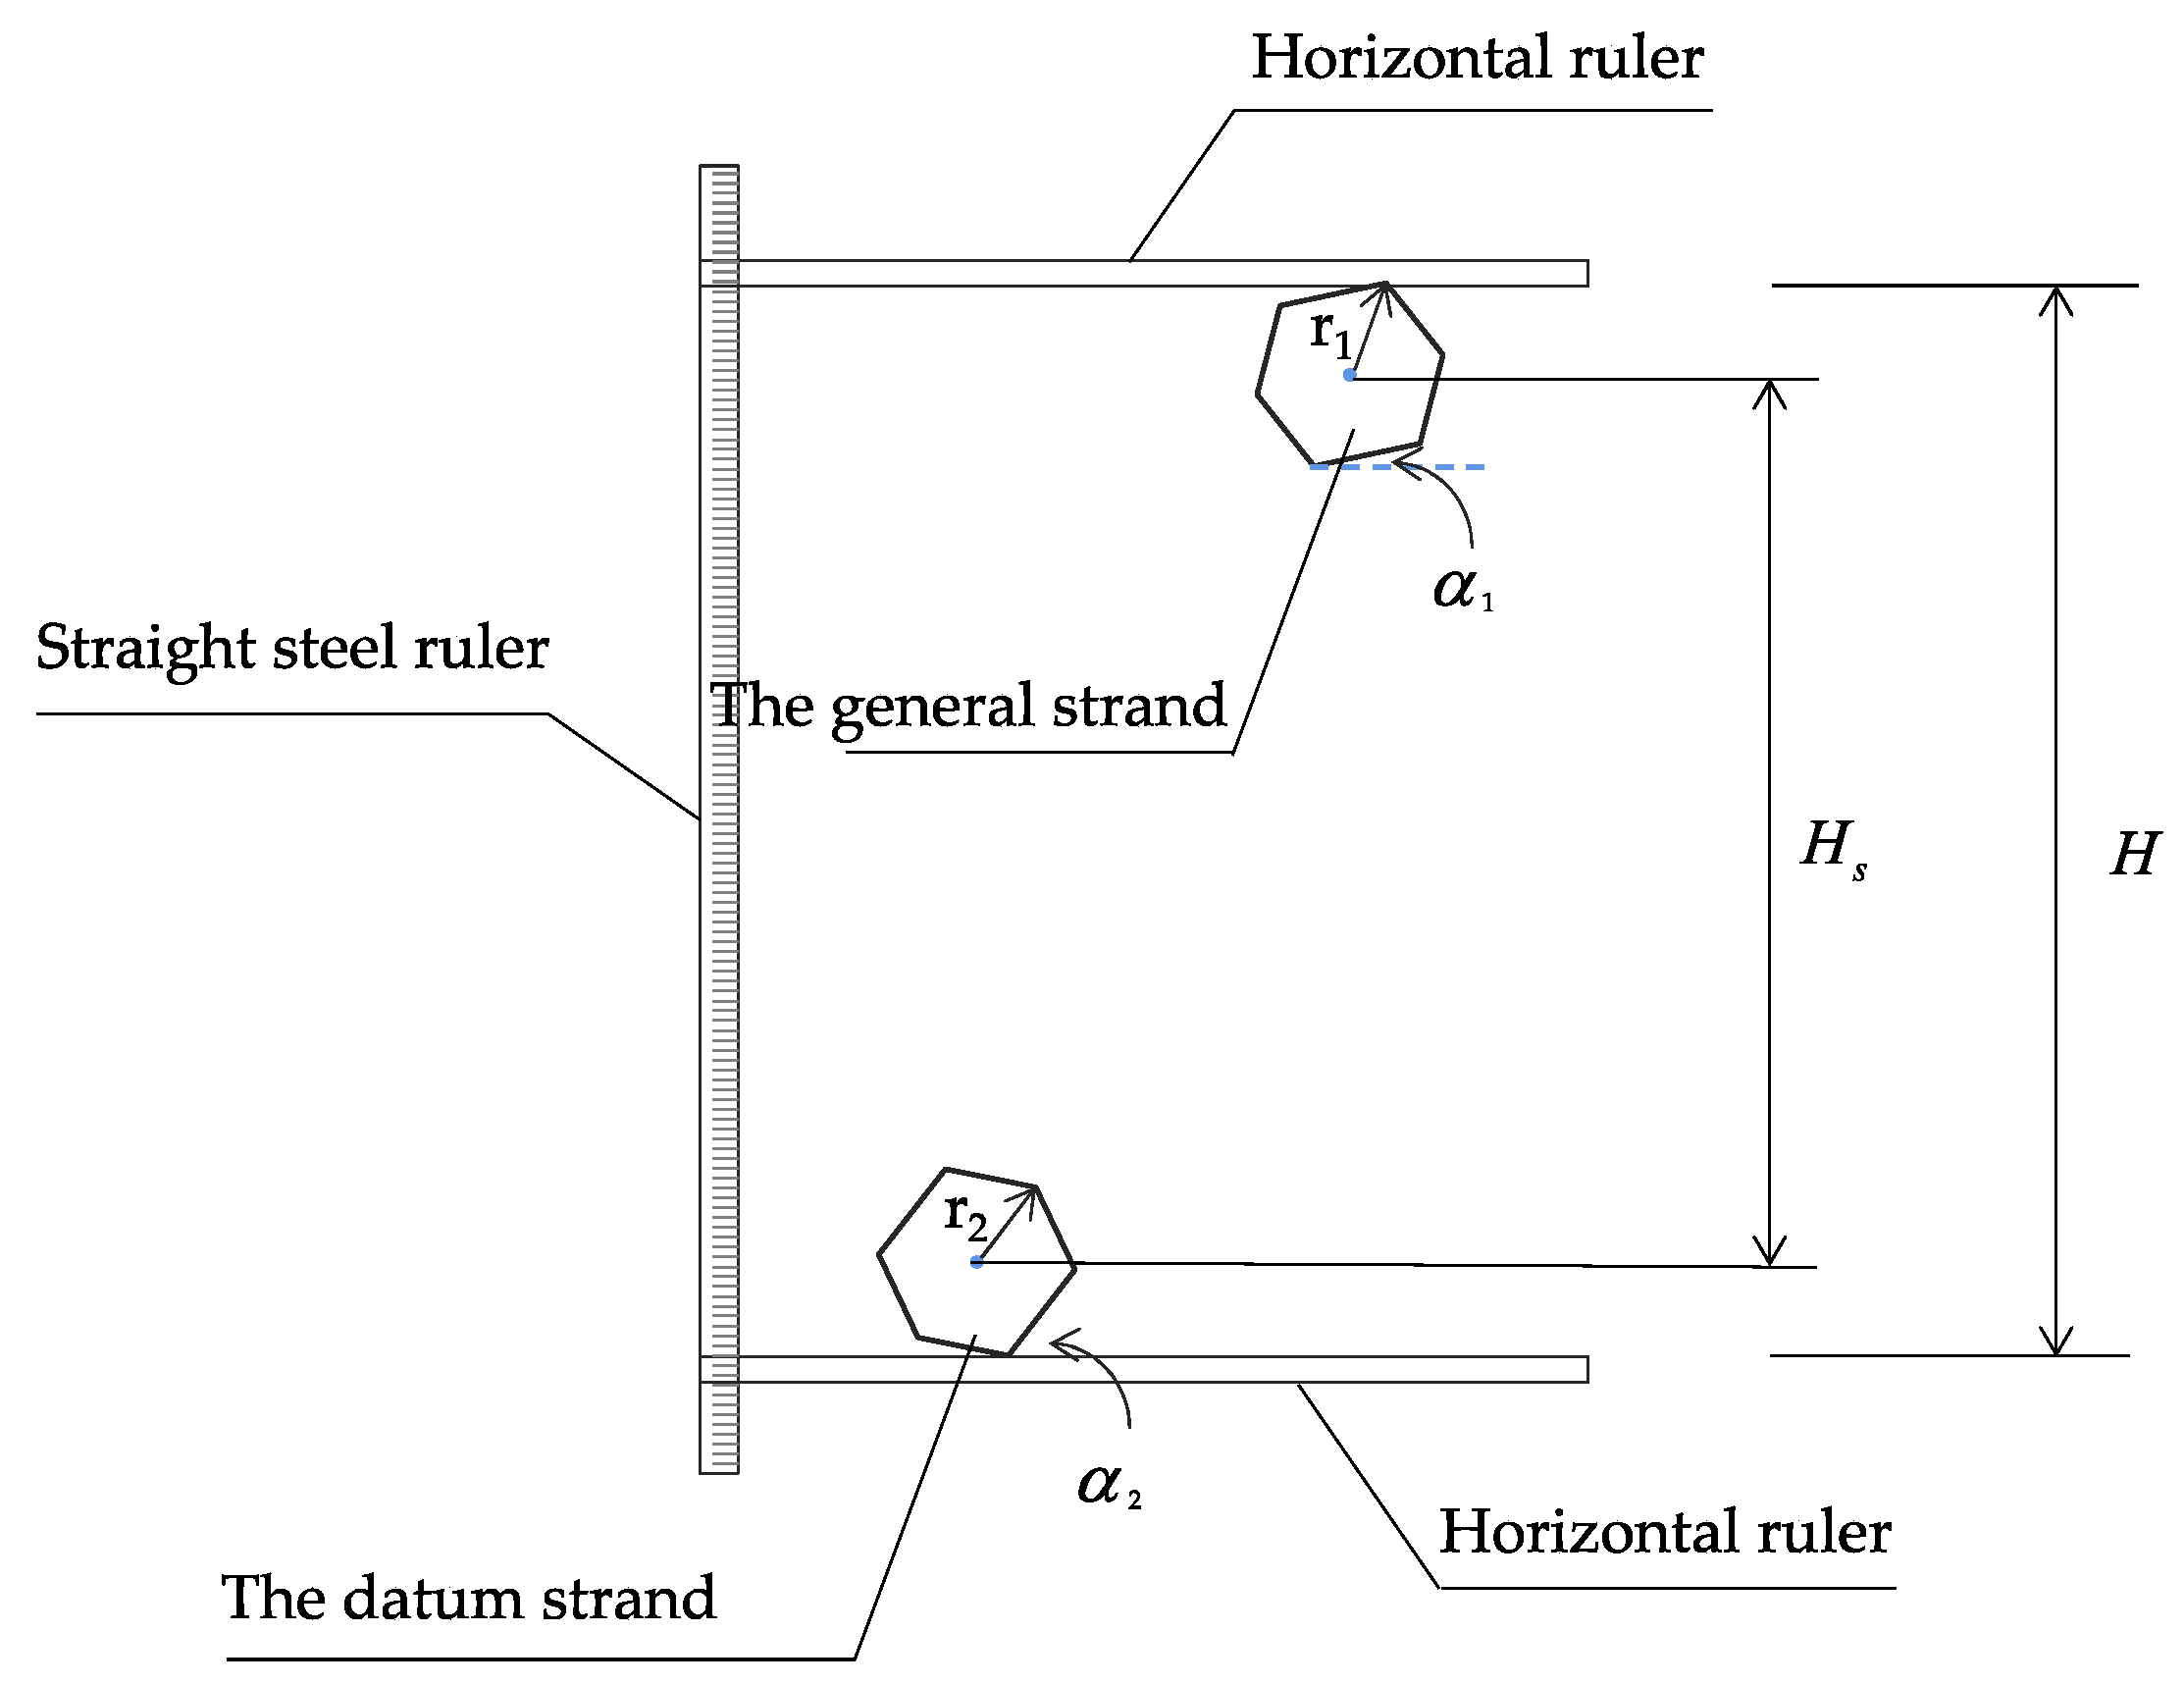
Figure 1 presents the conventional methods for on-site relative sag measurement and adjustment using calipers. According to the measurement principles (as illustrated in Figure 2), the elevation difference between the target strand and the datum strand is determined using the Equation (1).
where H is the height difference measured by the caliper, and are the rotation angles of the target strand and the datum strand, respectively, and and represent the diameter of the circumcircles for both wire strands.
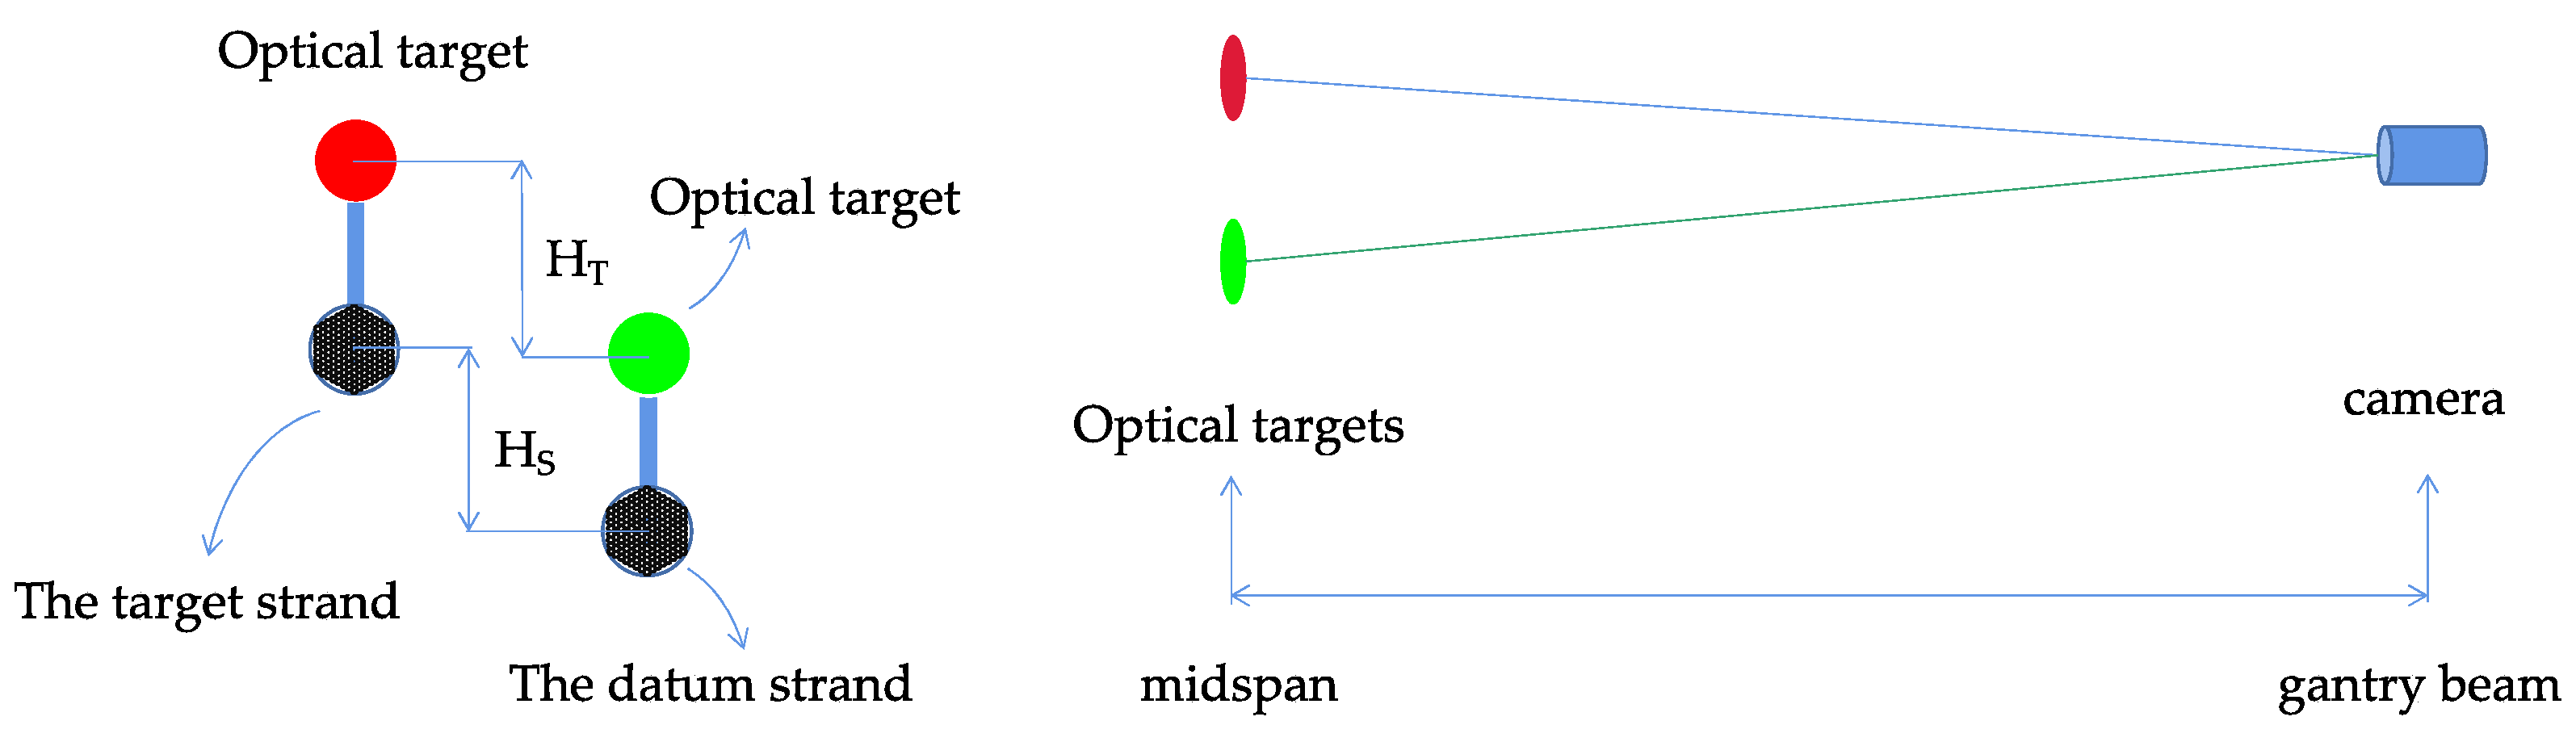
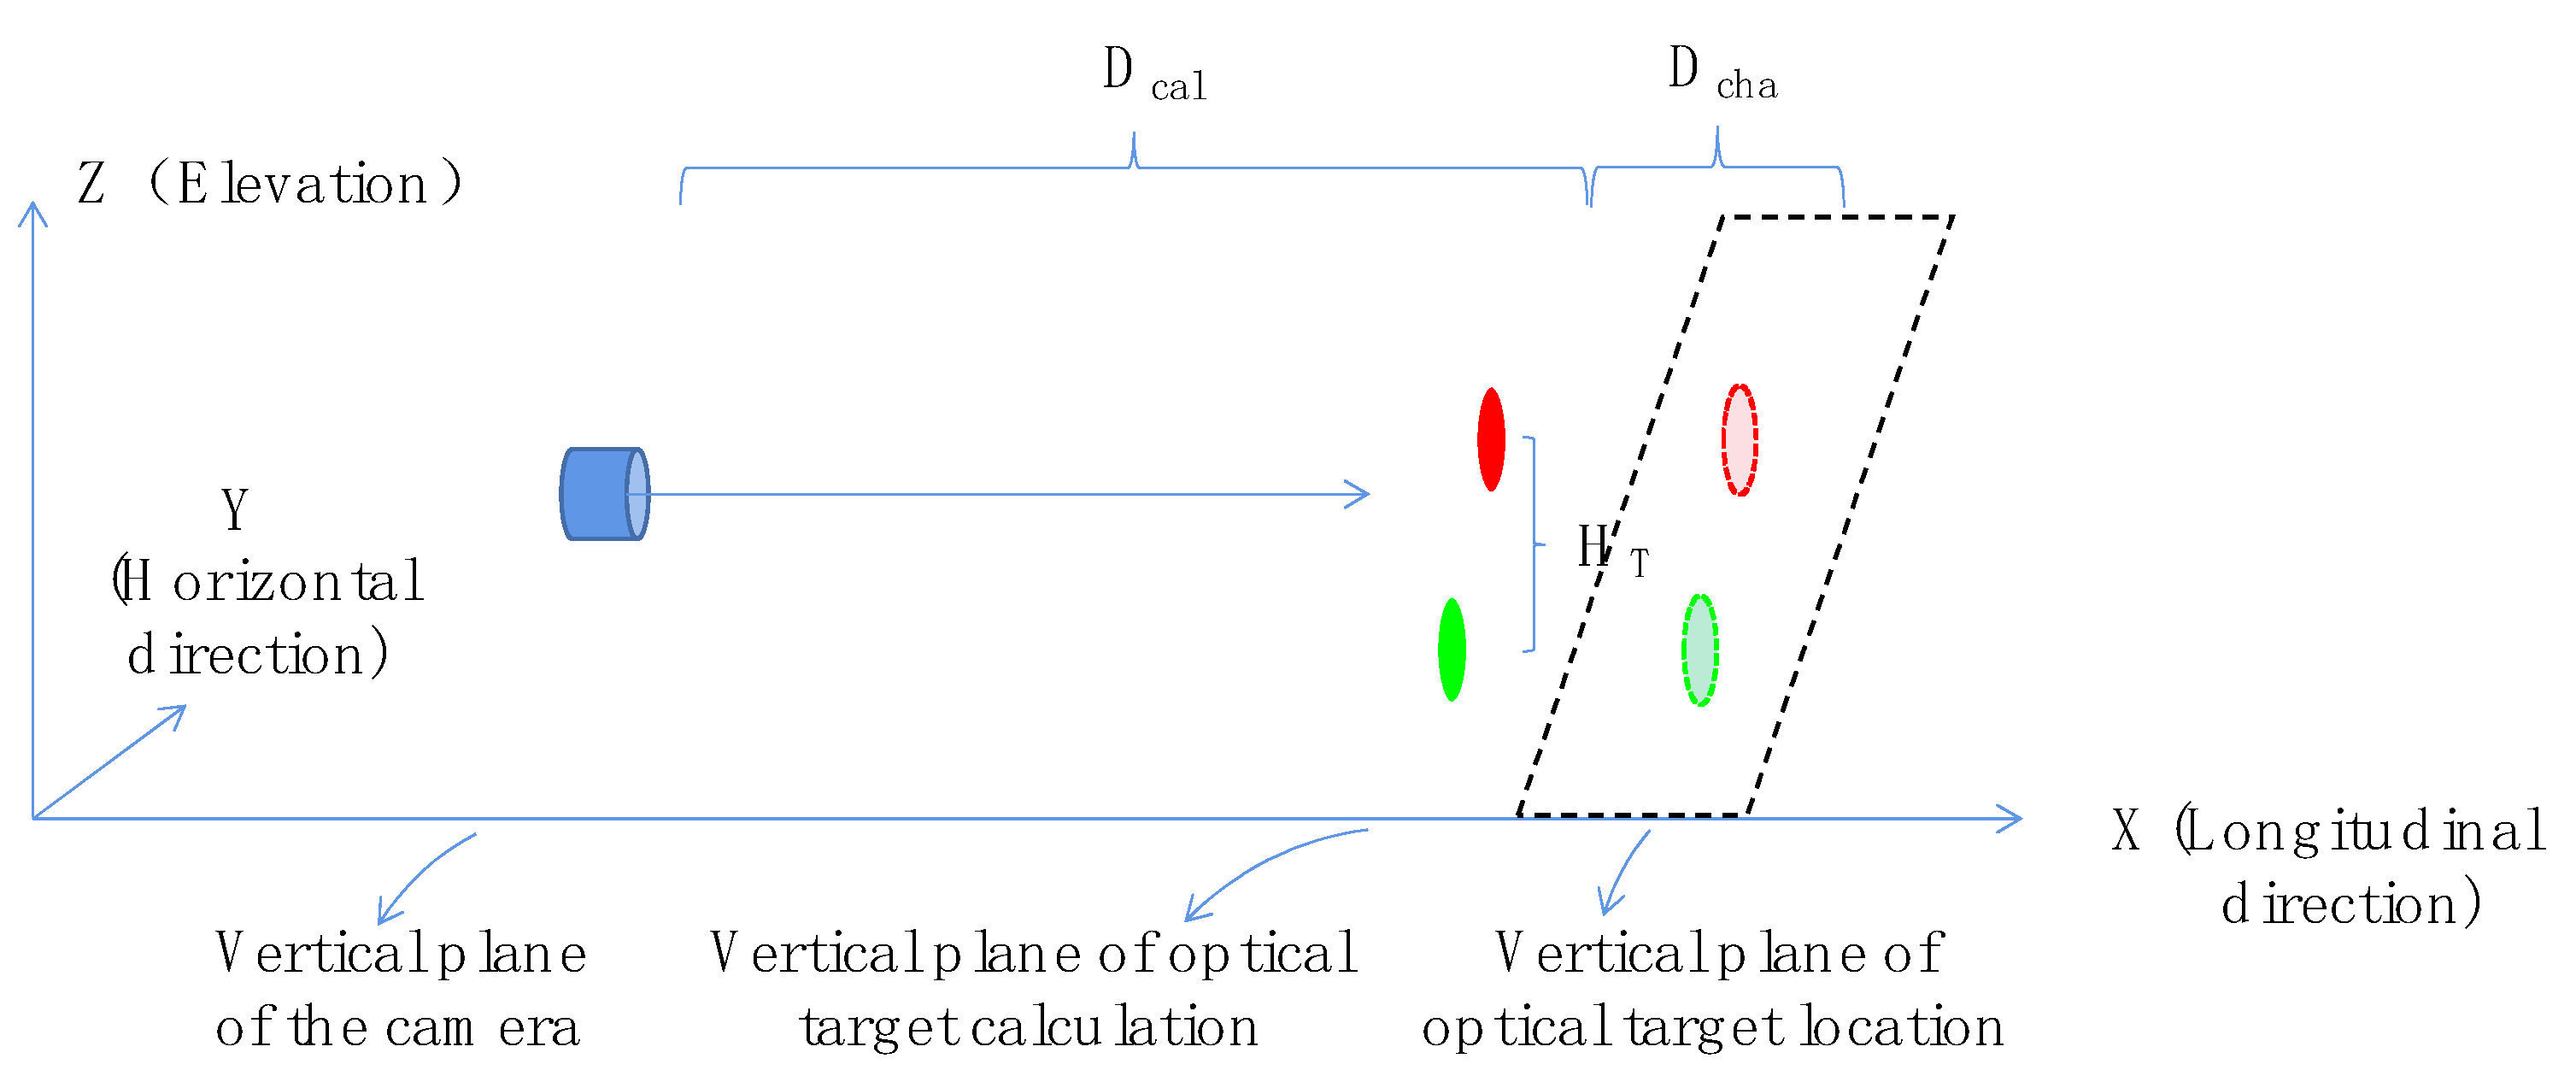
The proposed vision-based method to measure the relative sag, i.e., in the conventional method, employs a vision system to remotely collect imagery data and deep learning algorithms for analysis and measurement. To further facilitate field observation, a wire strand is erected directly above the datum strand, acting as a ruler for reference. All general wire strands will be adjusted based on this reference wire strand. Two optical targets are installed in the mid-span of the target strand and the reference strand, respectively. An industrial camera is installed in the middle of a gantry beam, facing the span to orthophoto the optical targets. In the images, optical targets are identified, and their pixel-level distance is estimated and converted to actual spatial distance. Different from the conventional methods, which directly measure the height difference of strands, the height difference between these two optical targets, i.e., , is estimated, as shown in Figure 3. Using the equation , the relative sag of the target strand can be determined. To ensure that the equality holds, hoops are used to fix the optical targets so that they are always positioned vertically and do not slide.
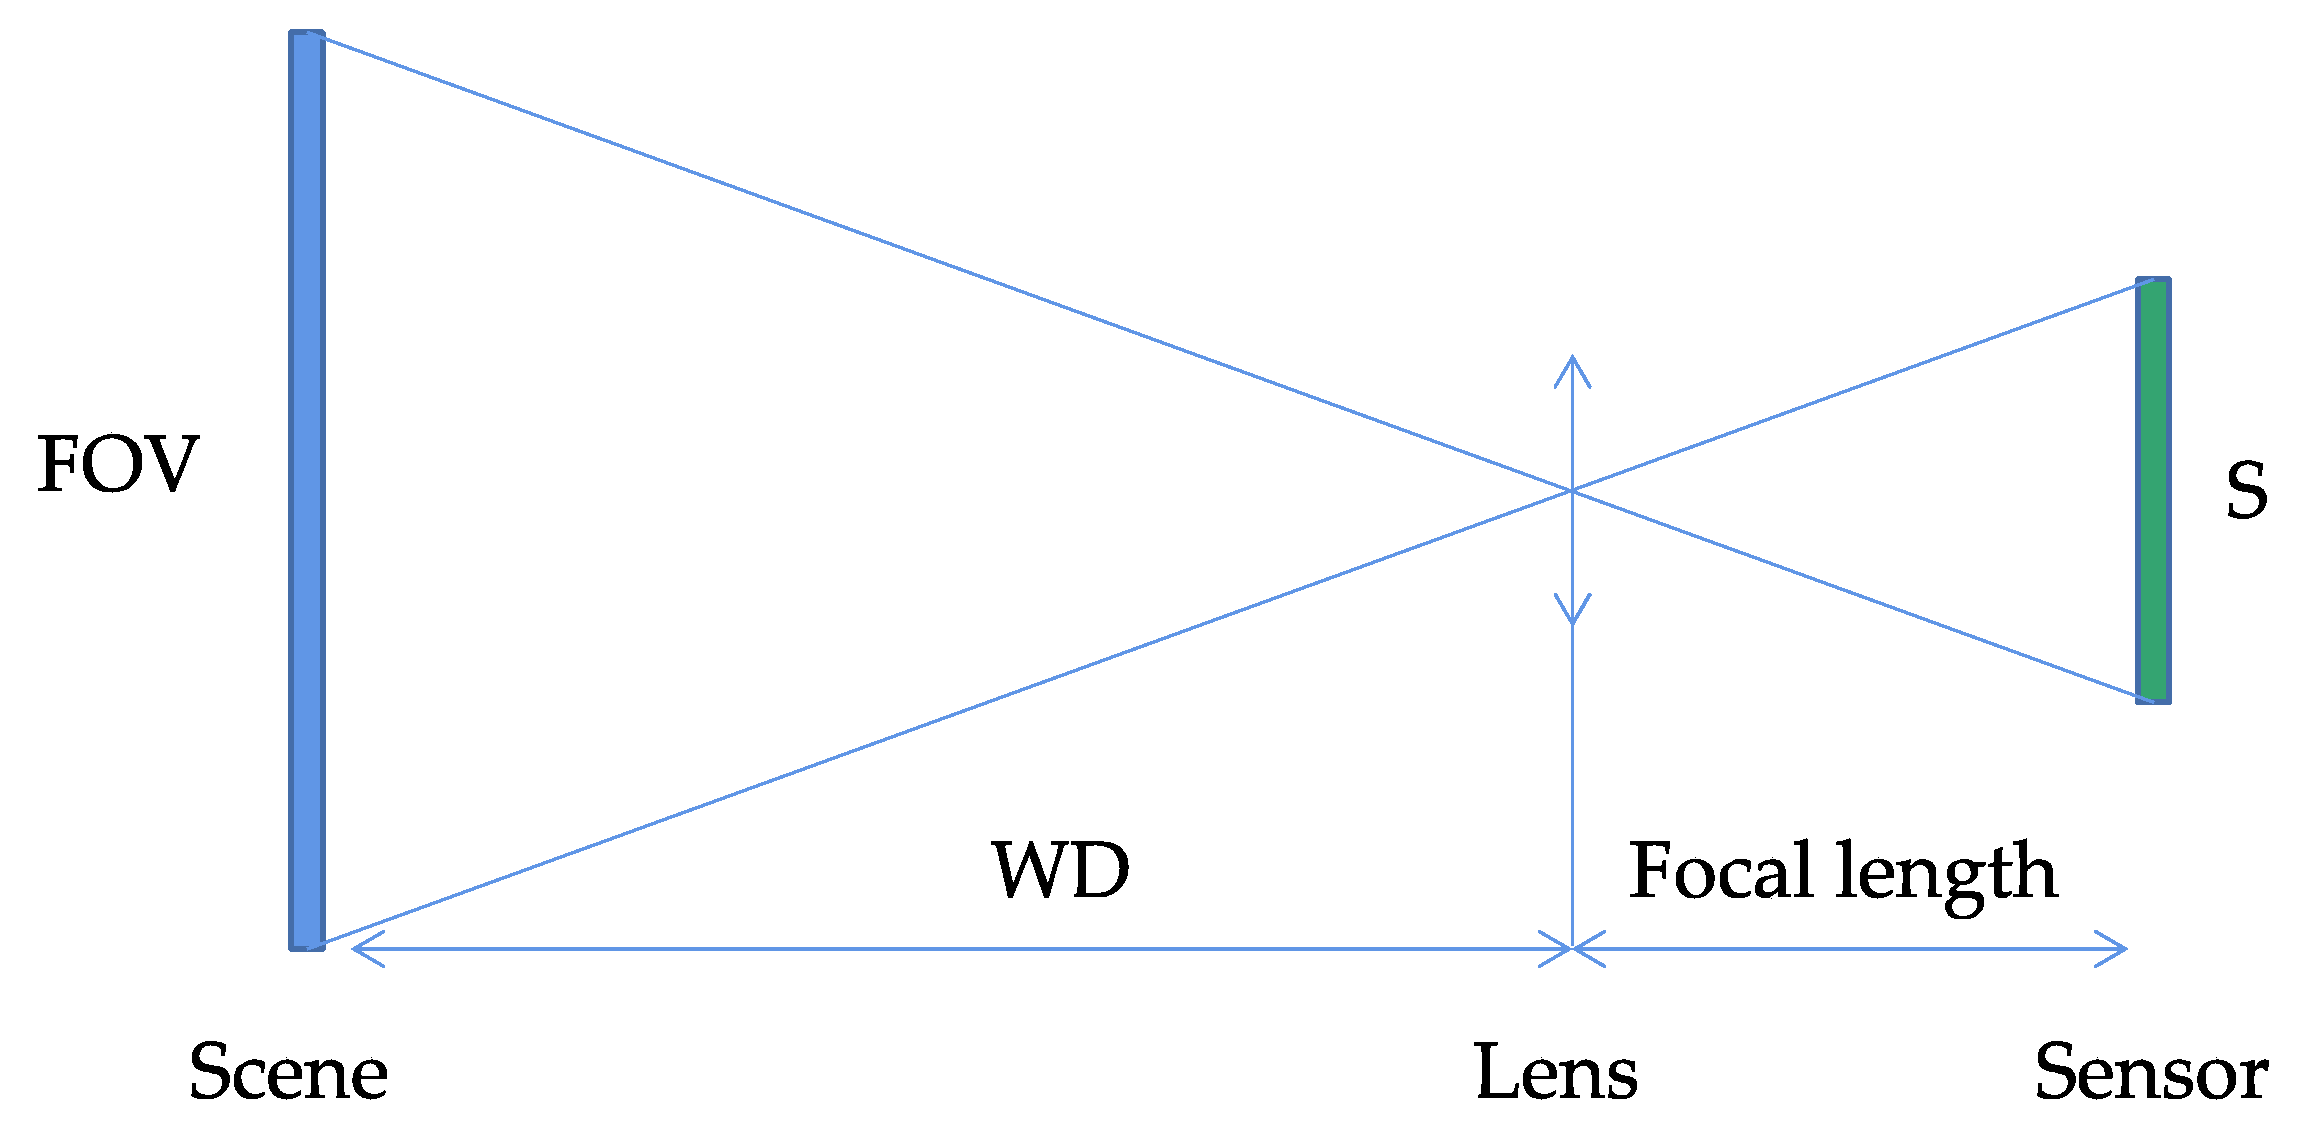
Large amounts of video data containing optical targets in different shooting angles, distances, and colors were used to train the deep neural network for feature extraction. The least square approach was applied for model fitting as well. The image coordinates of both targets on the general strand and the reference strand were obtained and denoted as () and (), respectively. Therefore, the pixel-wise distance of the optical targets can be calculated as in the vertical direction, and in the horizontal direction. Based on the lens focal length, sensor size, image resolution, shooting distance, and other parameters, the coefficient to convert pixel-wise distance on the image to actual distance , in the unit of mm/pix, can be further determined. Figure 4 illustrates the conversion, where WD represents the working distance, FOV is the field of view, and S represents the sensor resolution. The conversion coefficient is calculated using Equation (2), and the relative sag of a general strand is estimated using Equation (3).
where the subscripts L and W represent the FOV/resolution in the length/width direction of the frame, respectively.
3. Analysis of Factors Affecting Measurement Accuracy
Two variables directly affect the accuracy of relative sag measurement, i.e., pixel-wise height difference and the conversion coefficient , as indicated in Equation (3). The accuracy of the former variable is largely determined by the performances of target detection and the circle center fitting process, while the latter one is calculated based on parameters such as camera resolution, lens focal length, and camera-target distance. A summary of the factors affecting the measurement accuracy is listed in Table 1.
It can be seen from Table 1 that most of the adverse impacts can be mitigated by improving the hardware and algorithms, except for the wind-induced strand shaking and camera shaking. Such environmental factors can directly affect the pixel-wise positioning of the identified target in the image, causing constant changes in the relative sag. Therefore, the rest of this section mainly analyzes the measurement error caused by the wind-induced shaking of the strands and camera in the vision-based monitoring system.
3.1. Impact Analysis of Cable Strand Shaking
The cable strand shaking under wind actions can be categorized into three types, i.e., transverse swing, vertical vibration, and torsion in the cable plane. An example suspension bridge with a main span of 800 m and a sag to span length ratio of 1/10 is used to illustrate the impacts of the shaking of an individual strand.
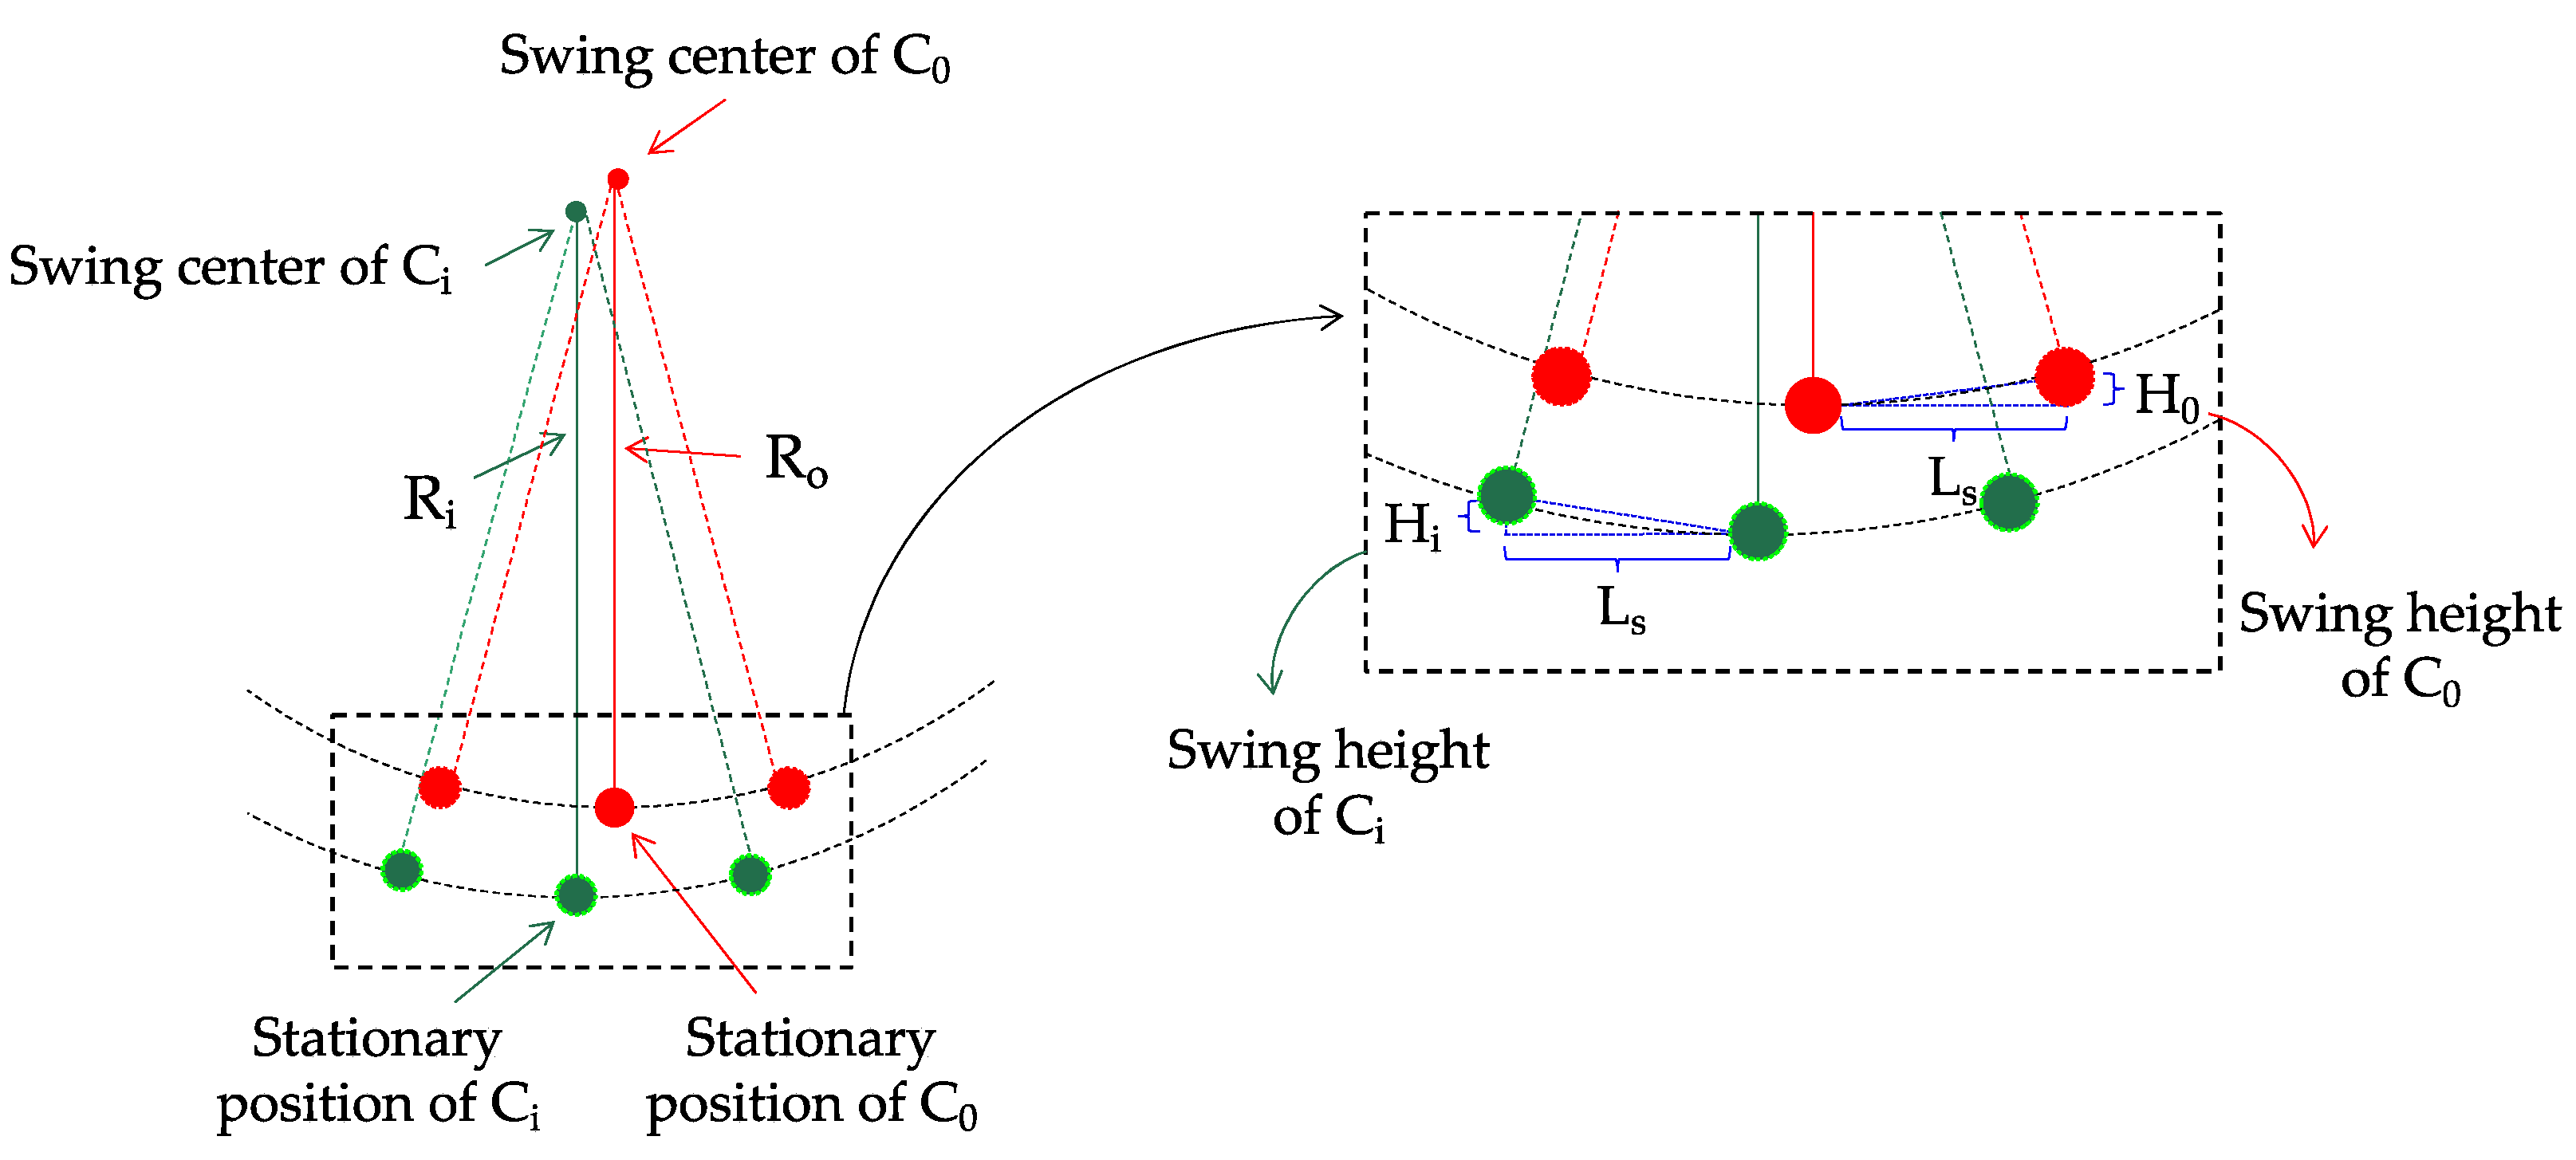
3.1.1. Impact Analysis of Transverse Swing
Assuming that the transverse swing amplitude of the strand is , the sag of the reference strand is , and the sag of the general strand is , as shown in Figure 5. Specifically, and in the figure represent the reference cable strand and a random general cable strand. The swing height of the reference strand and the targeted strand for relative sag measurement, i.e., and , can be calculated using Equations (4) and (5), respectively.
In the illustrative case, = 80 m, = 1 m, and = 75 m. As a result, the swing height of the reference strand is calculated to be 6.25 mm, indicating a height error of 6.25 mm~6.67 mm when the strand swings in the range of 1 m. When taking [−5 mm, 10 mm] as the control target of the measurement error, the measurement data will be filtered when the shaking amplitude of the cable strand reaches 1 m to reduce the measurement error.
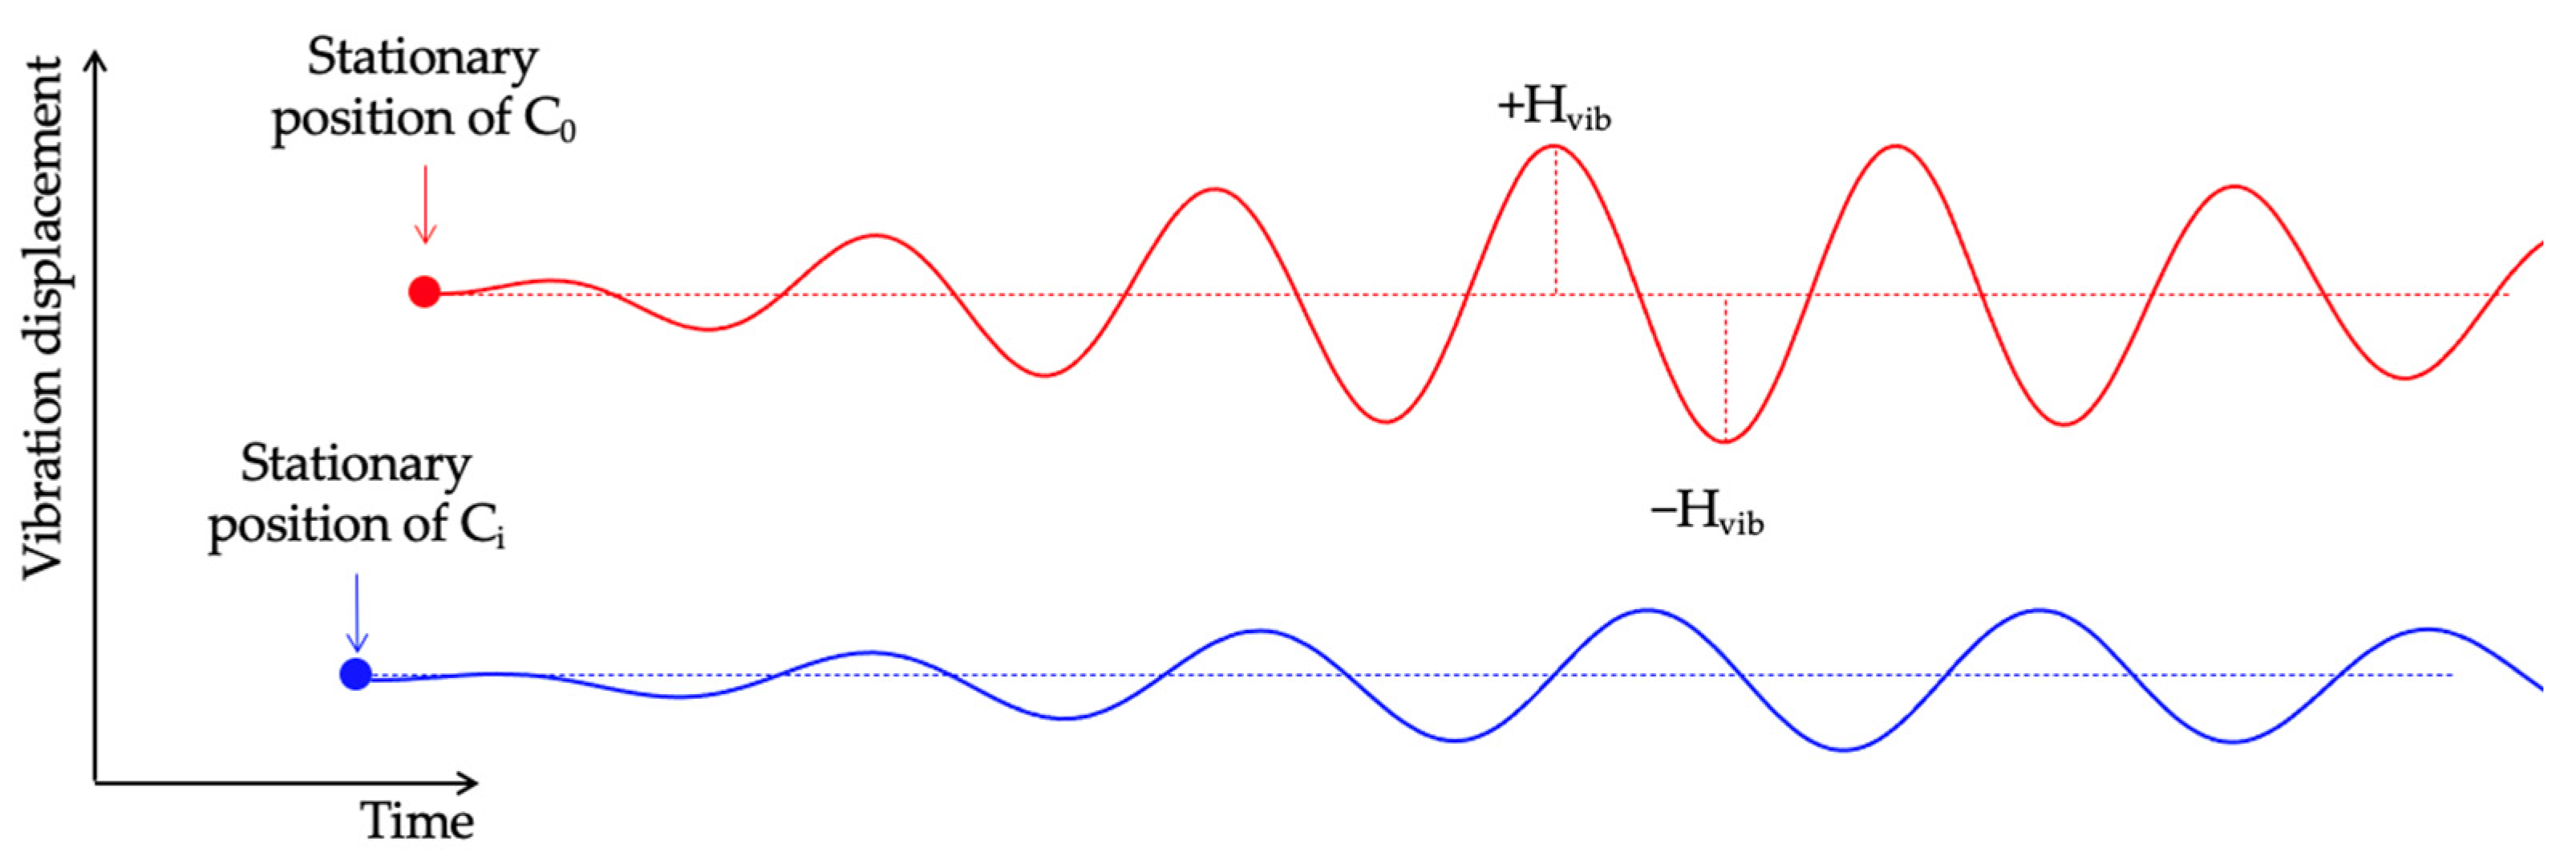
3.1.2. Vertical Vibration of Cable Strand
In addition to transverse swings, the strand will vibrate vertically under the action of external force. Figure 6 presents the vibration curve of a general strand, which is symmetrically distributed on both sides of the initial state. Specifically, the maximum displacement of the vibration is denoted as , the vibration period is , and the video sampling frequency is F. The height difference at the current time is estimated using the average height difference in the time period , where the duration is set to be . The error of visual measurement is denoted as . As a result, the maximum error visual measurement caused by individual strand vibration can be calculated using Equation (6).
In the illustrative case, it is assumed that F = 1 Hz and = 120 s. According to field measurement data, is generally shorter than 10 s, and is usually smaller than 100 mm. Take F = 1 Hz and = 120 s, and the maximum error caused by the vertical vibration of an individual strand is computed to be 3.11 mm. In the case when both the reference strand and the general strand vibrate simultaneously, the error should be 2.
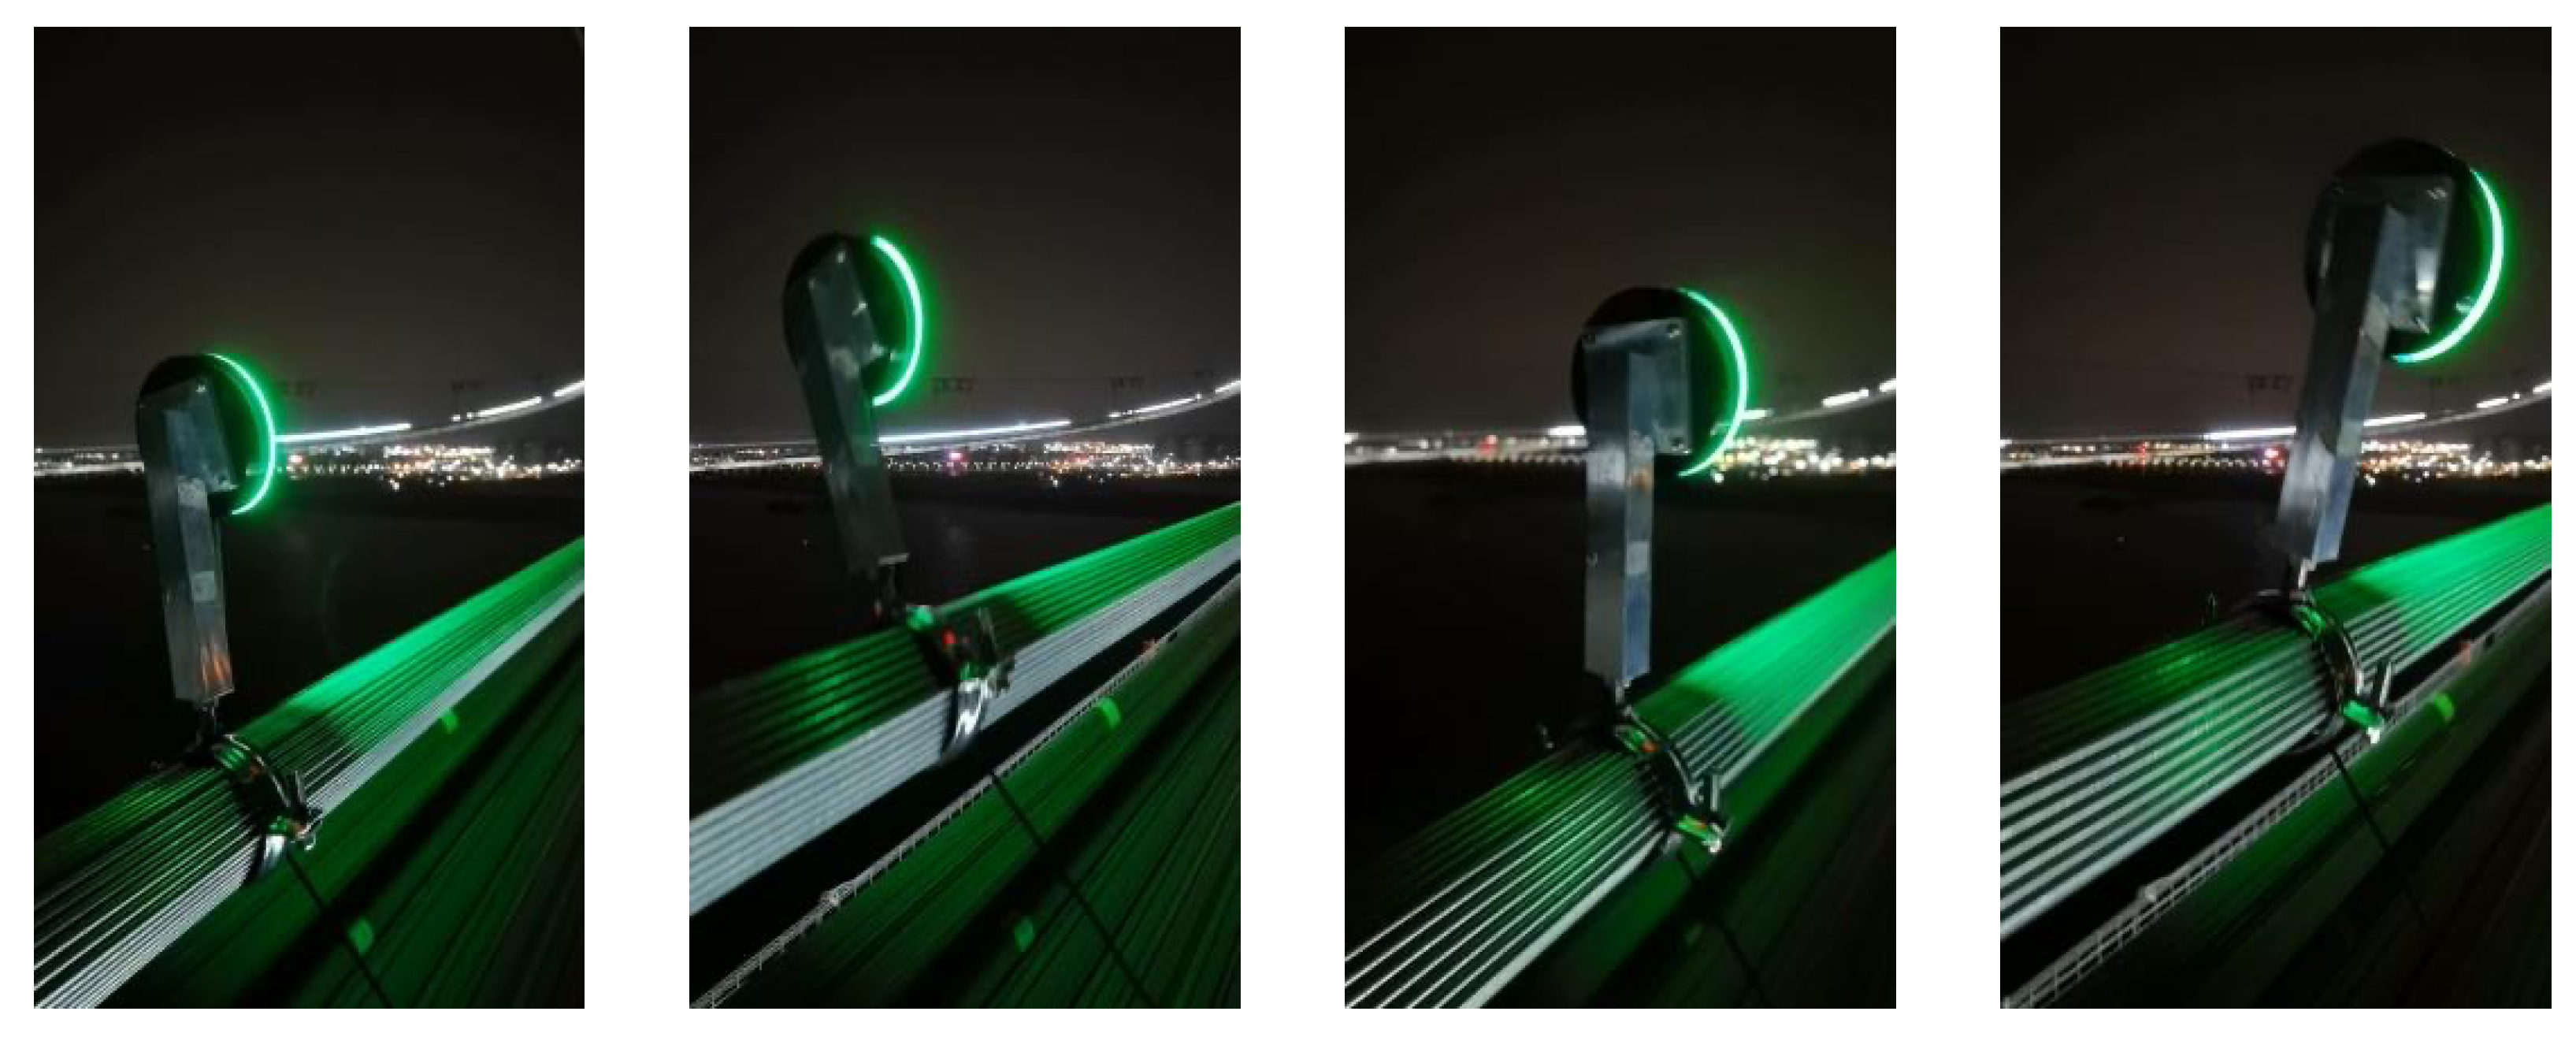
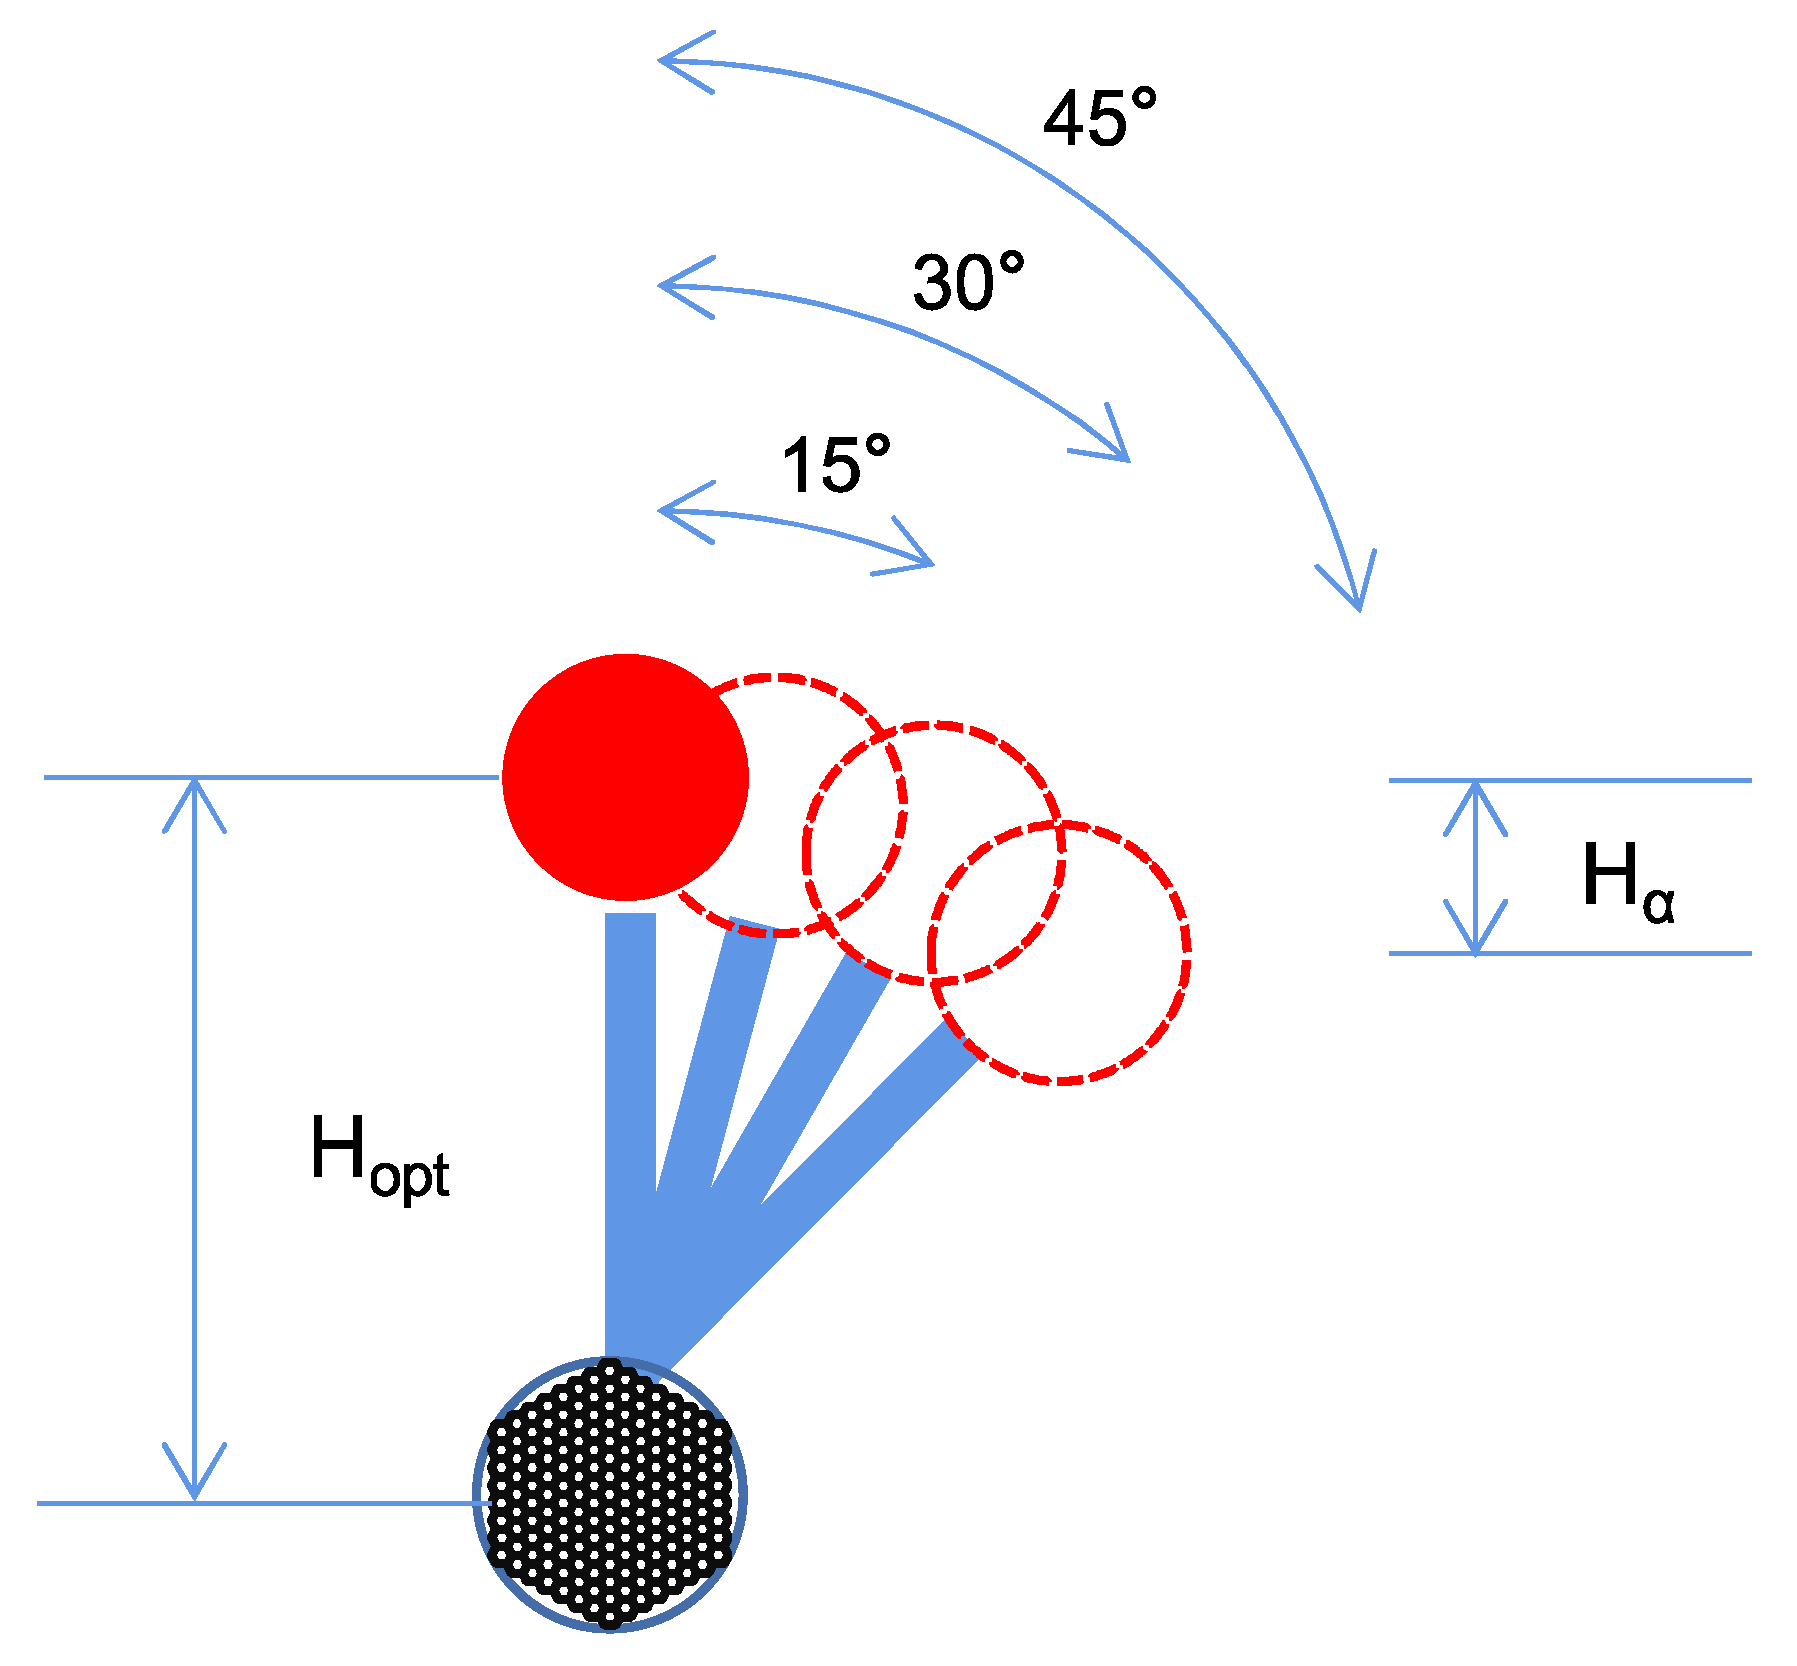
3.1.3. Strand Rotation out of the Cable Plane
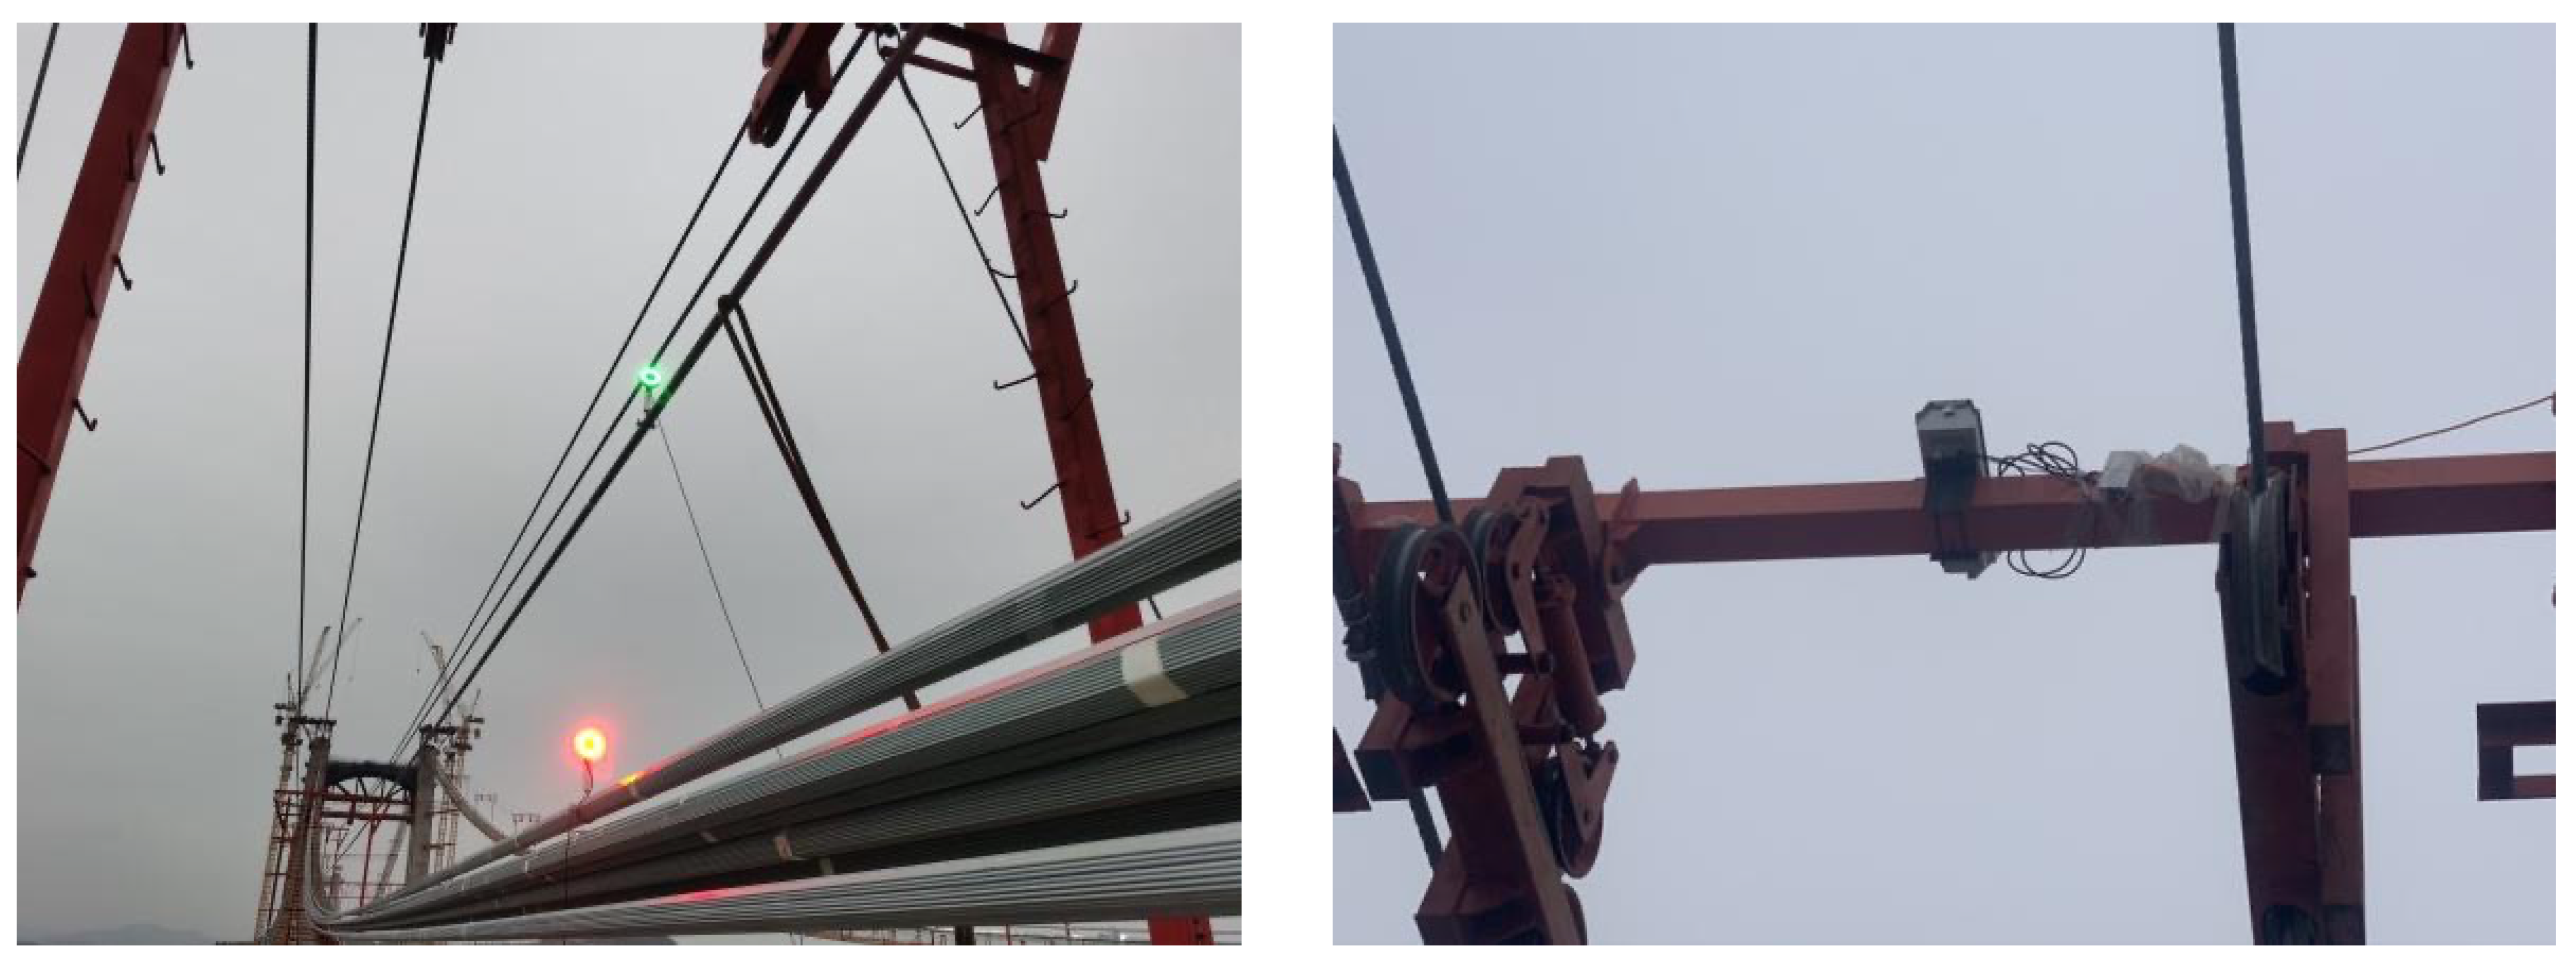
During cable adjustment, the general cable strands are temporarily anchored at the cable saddle on the top of the tower, whose midspan will have a certain degree of out-of-plane torsion under the action of wind force. Figure 7 includes on-site photos of such torsion, and Figure 8 is the schematic diagram of strand torsion. represents the height of the optical target, and the rotation angle of the targeted strand is denoted as α (0 < α < 90°).
As the strand rotates, the deviation between the optical target distance and the relative sag is calculated using Equation (7). Assuming = m and α = 30°, we have H30° = 26.79 mm.
3.1.4. Collective Impacts Caused by Wind-Induced Strand Shaking
The maximum measurement errors caused by the wind-induced cable strand shaking based on the empirical values of parameters (e.g., , , and ) are summarized in Table 2. By referring to Table 2, the following three conclusions can be drawn: (a) When the transverse swing amplitude is less than 200 mm, the measurement error is only 0.27 mm. Therefore, the horizontal spacing of cable strands can be used to filter out noise data in a real-time measurement scheme. (b) The accuracy of the height difference estimation improves as the amplitude and/or vibration period decreases. (c) The out-of-plane torsion of the strand largely contributes to the measurement error, recommending the correction of the measurement of the torsion angle.
3.2. Impact Analysis of Camera Shaking
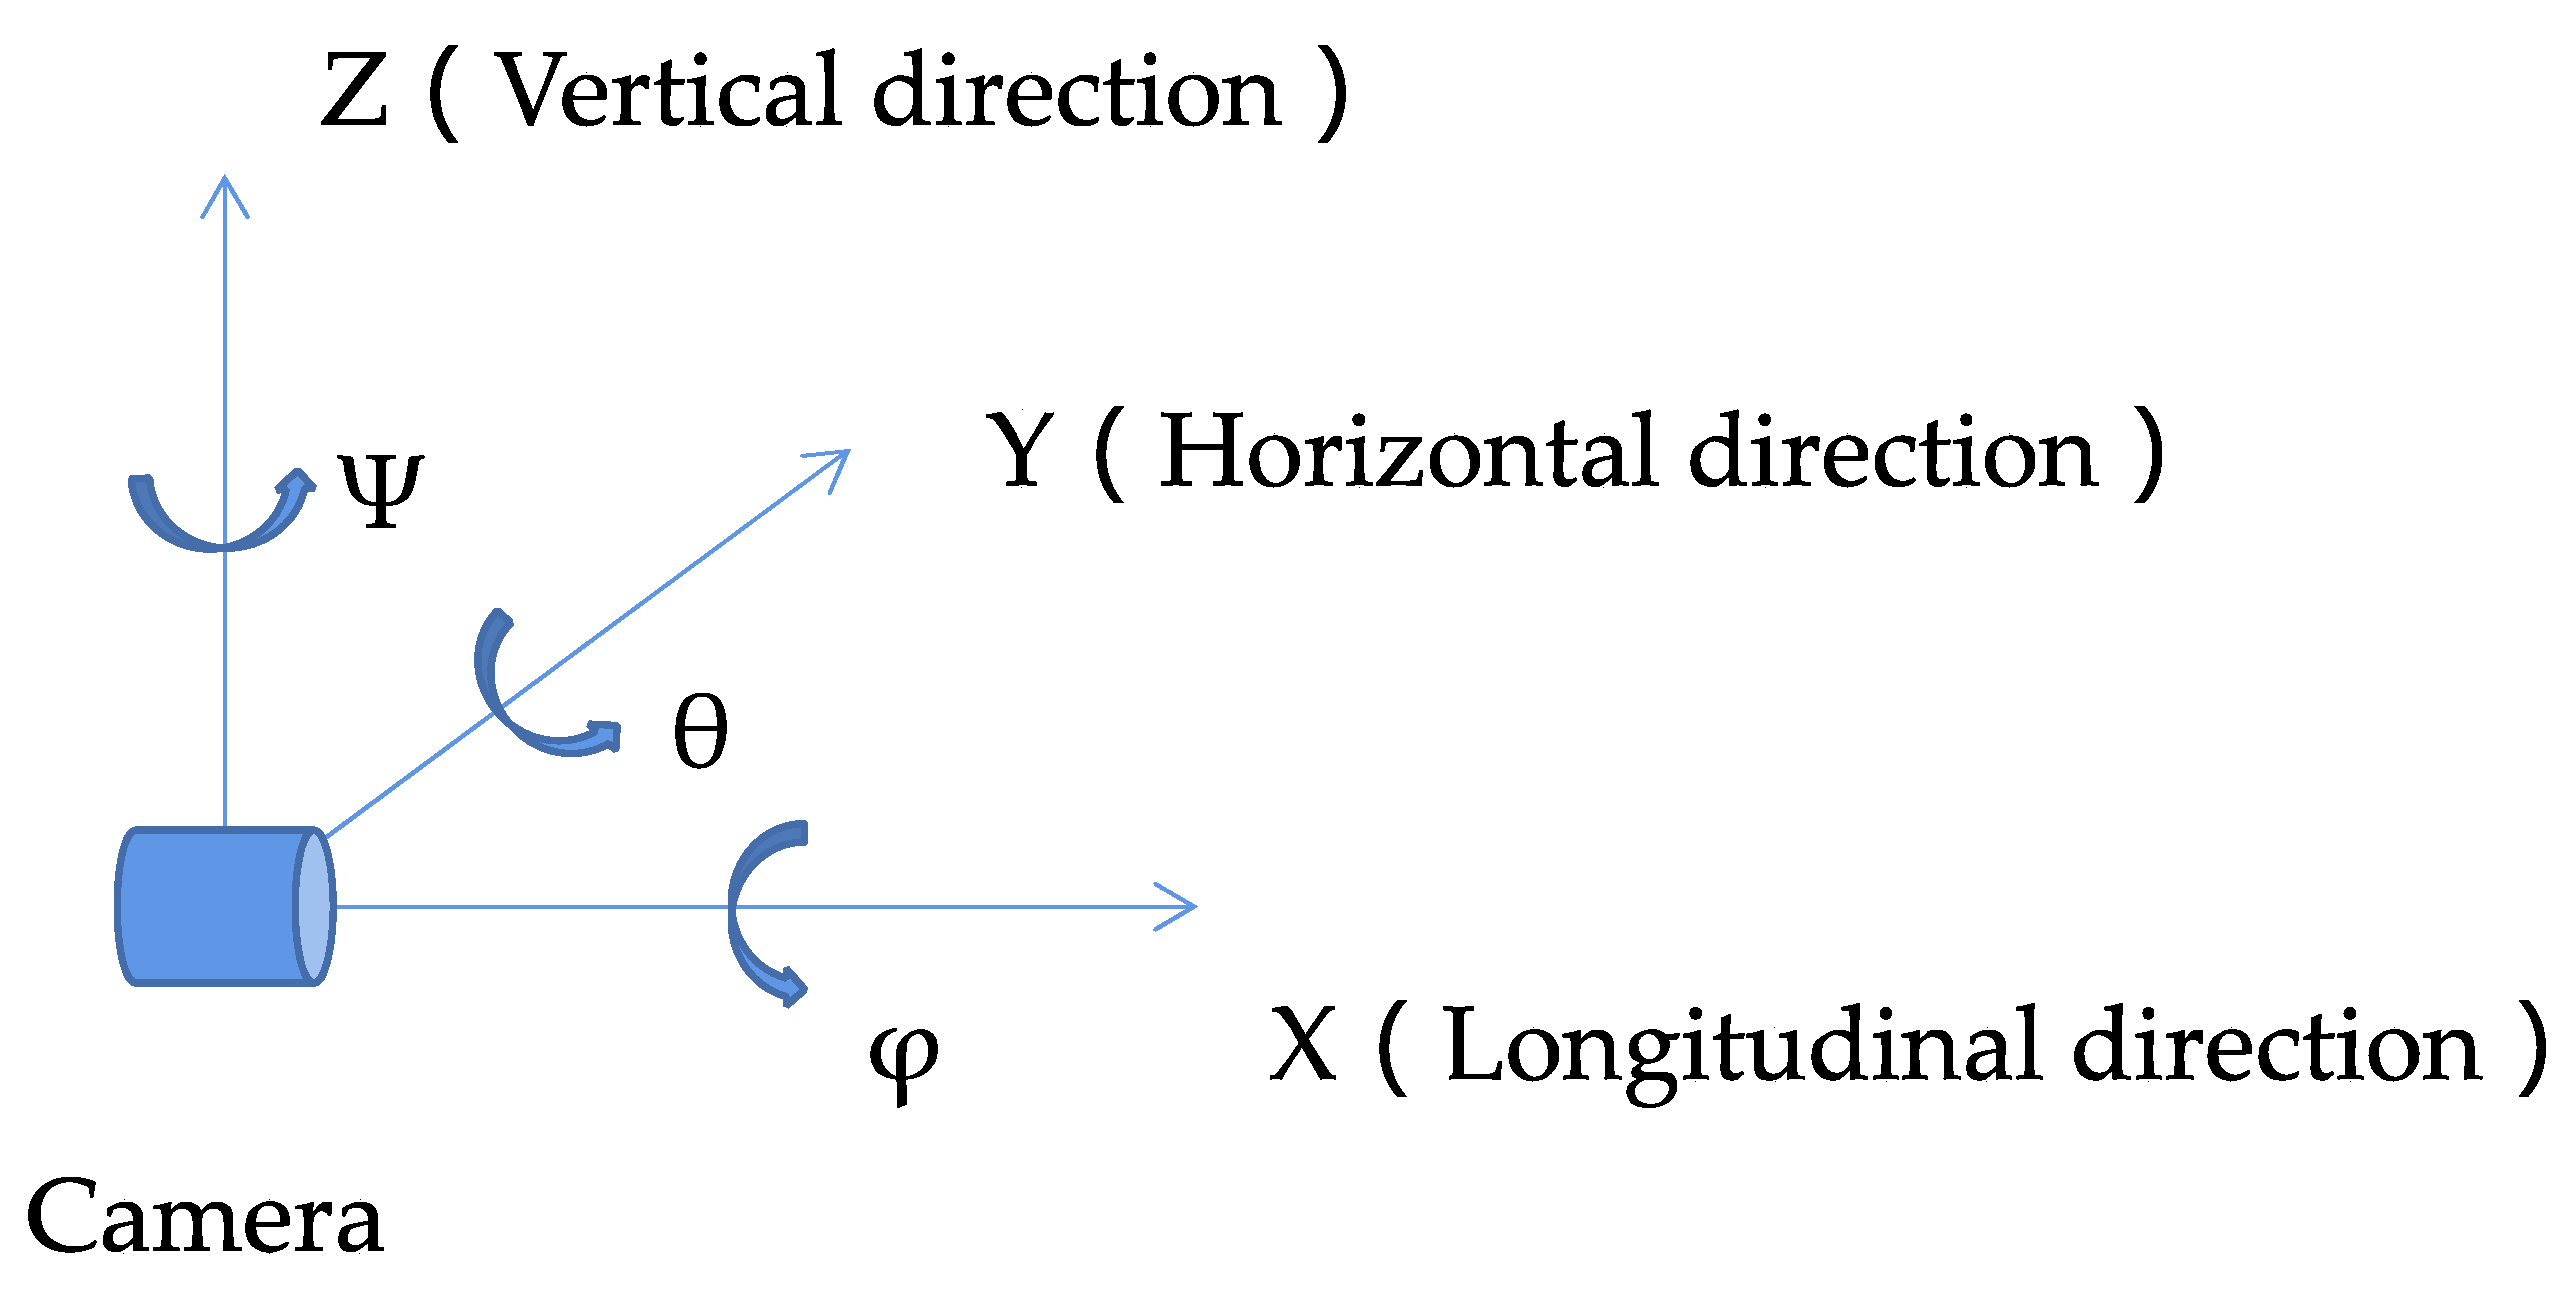
The camera used in the proposed system can be installed either on the top of the cable tower or at the cross beam of the catwalk gantry. The former approach produces better stability, yet it has occlusion issues and a necessitates a longer shooting distance, requiring a higher cost for camera lens. The catwalk beam is close to the midspan (about 55 m) and less subject to occlusions. However, the camera shaking along the catwalk due to wind action can adversely affect the measurement accuracy. The camera motions contain both displacements and rotations in the longitudinal, transverse, and vertical directions, as shown in Figure 9. Specifically, θ is the pitch angle, ψ is the yaw angle, and φ is the roll angle.
Due to the displacement in the longitudinal direction, it is assumed that the measurement distance from the camera to the optical target is , and the variation is (0 mm ≤ ≤ 100 mm), as shown in Figure 10. represents the height difference between the optical targets, without considering camera rotations. is relatively small, since the catwalk gantry is fixed and the optical target will not slide along the strand. Thus, the height difference between the optical targets will vary in the range of .
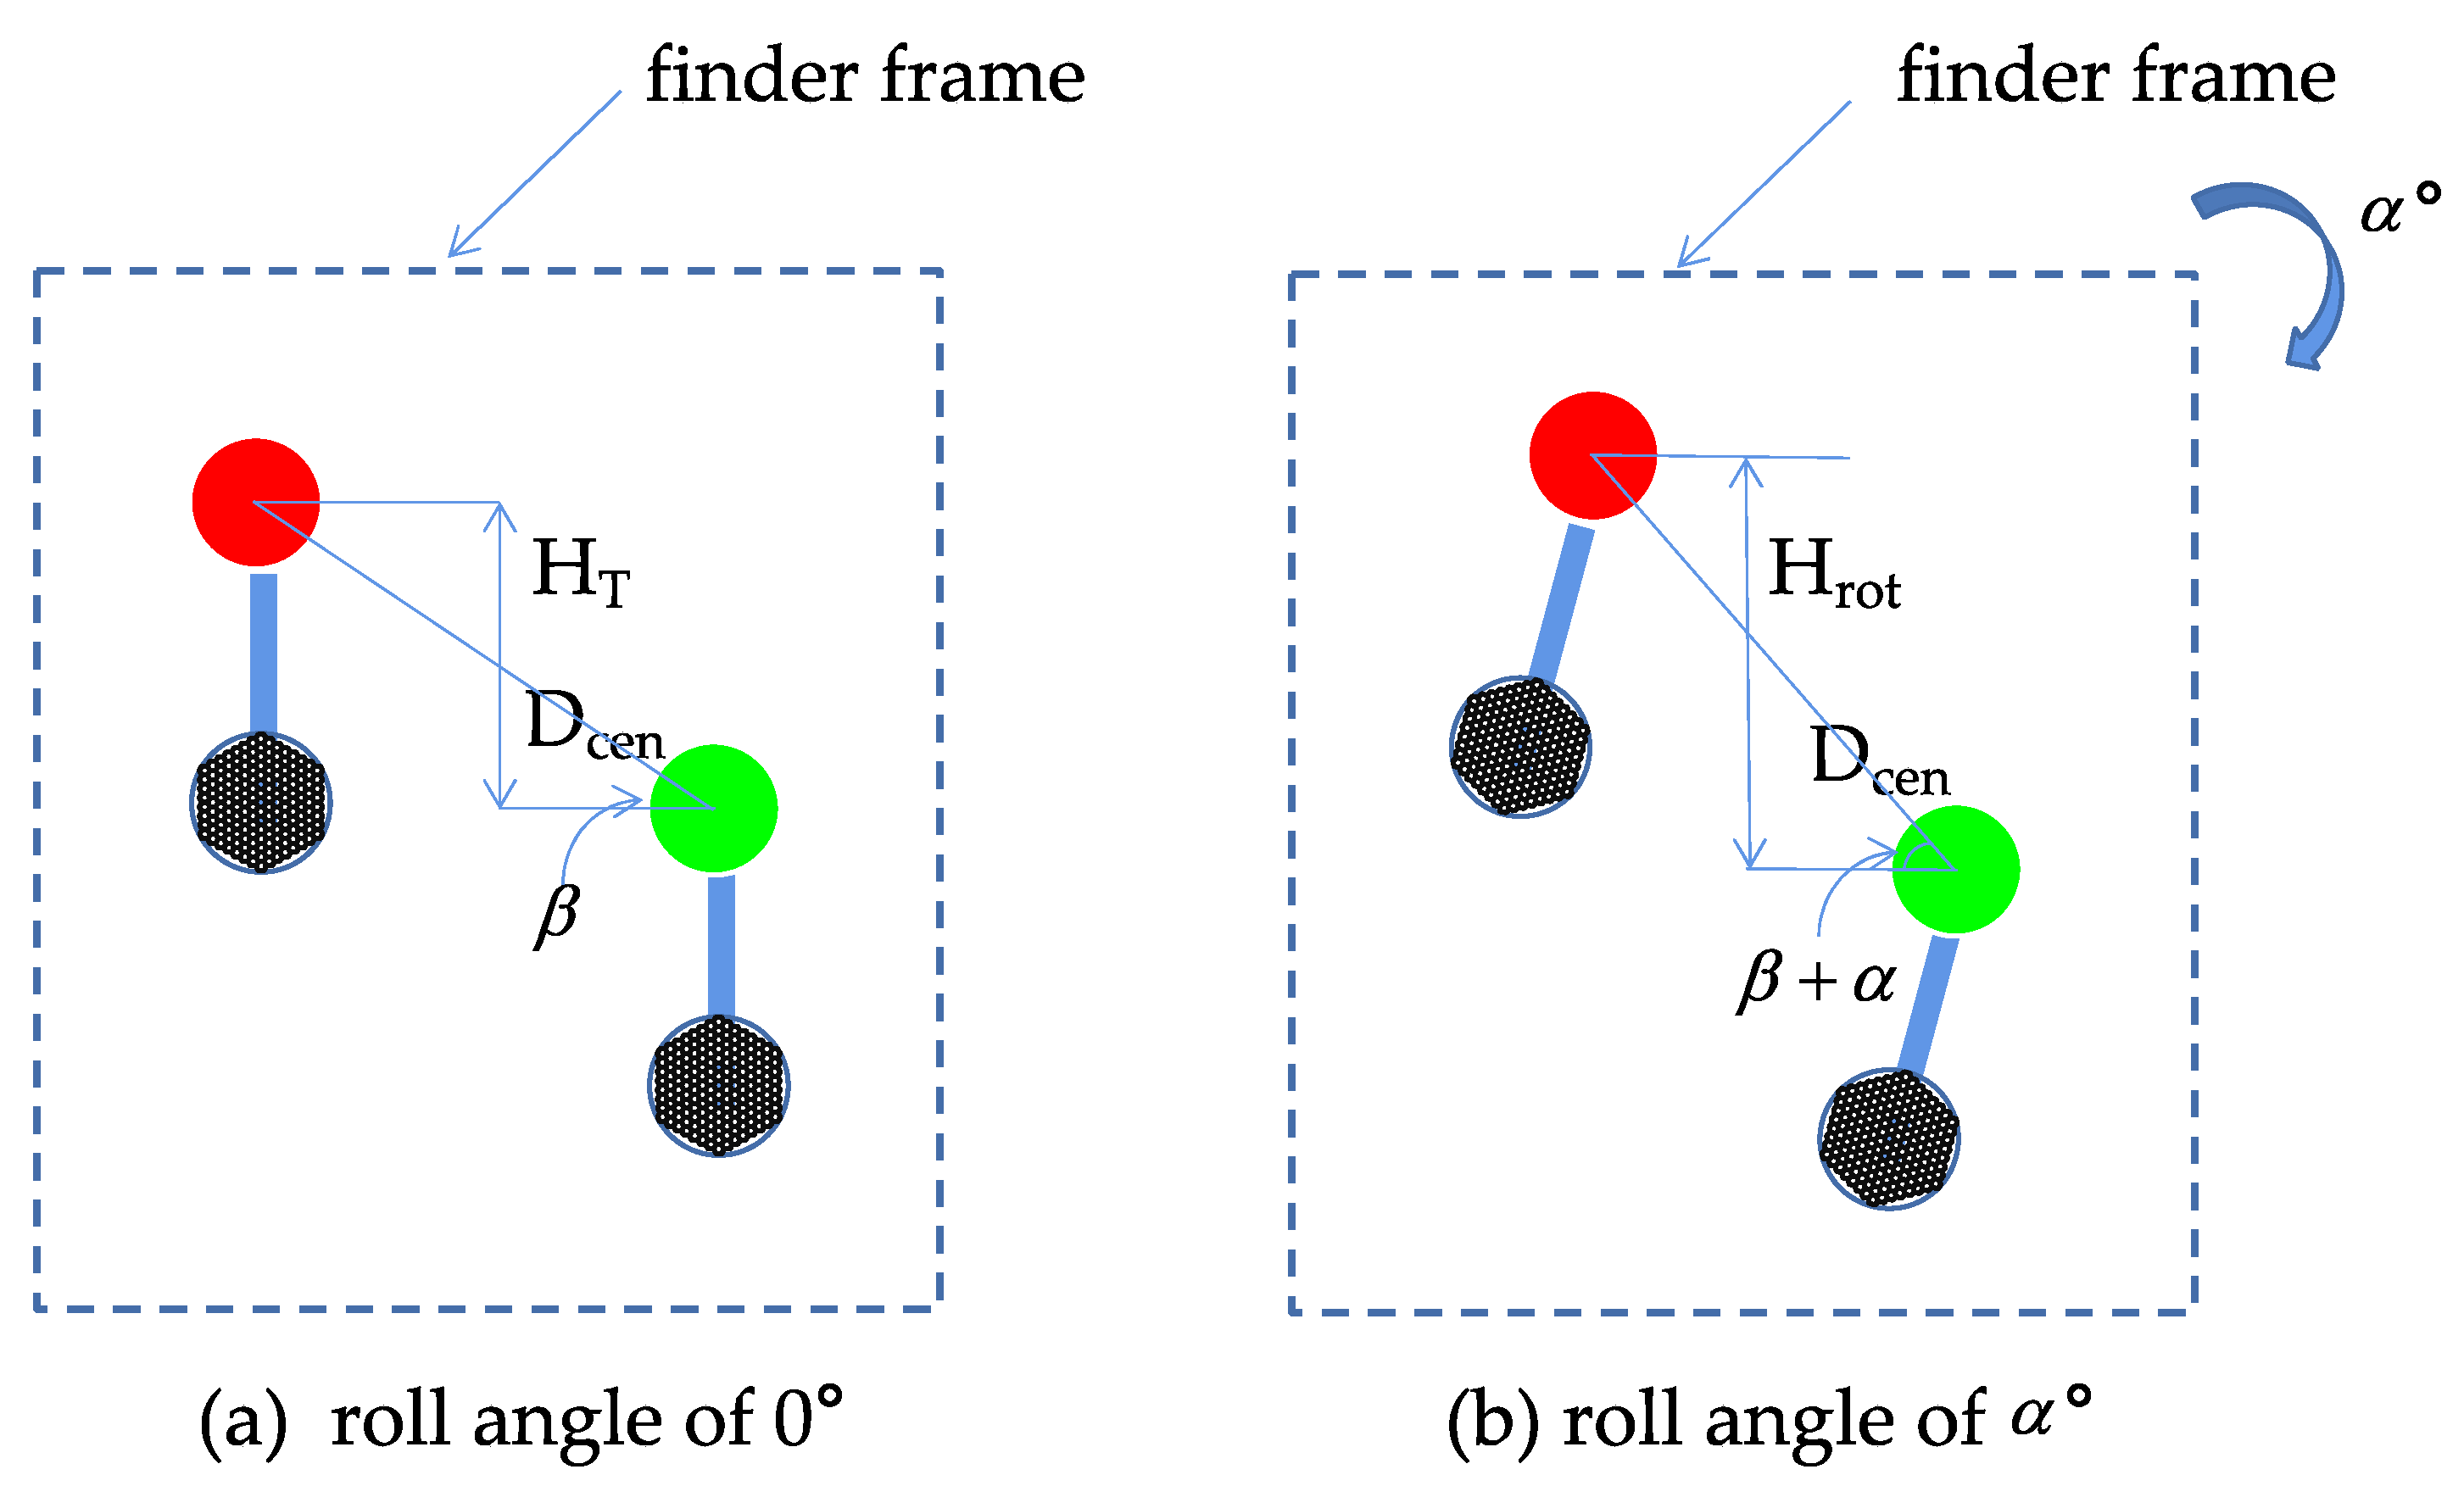
Under wind actions, the camera rotates in the longitudinal direction, causing the overall deflection of the collected image, as shown in Figure 11. It is worth noting that the image deflection does not change the actual spatial distance (i.e., ) between the target centers. Assuming that the angle between the line connecting the targets and the horizontal direction is , when the rolling angle is 0°, the height difference between the optical targets can be expressed as . When the roll angle is , the height difference is calculated as .
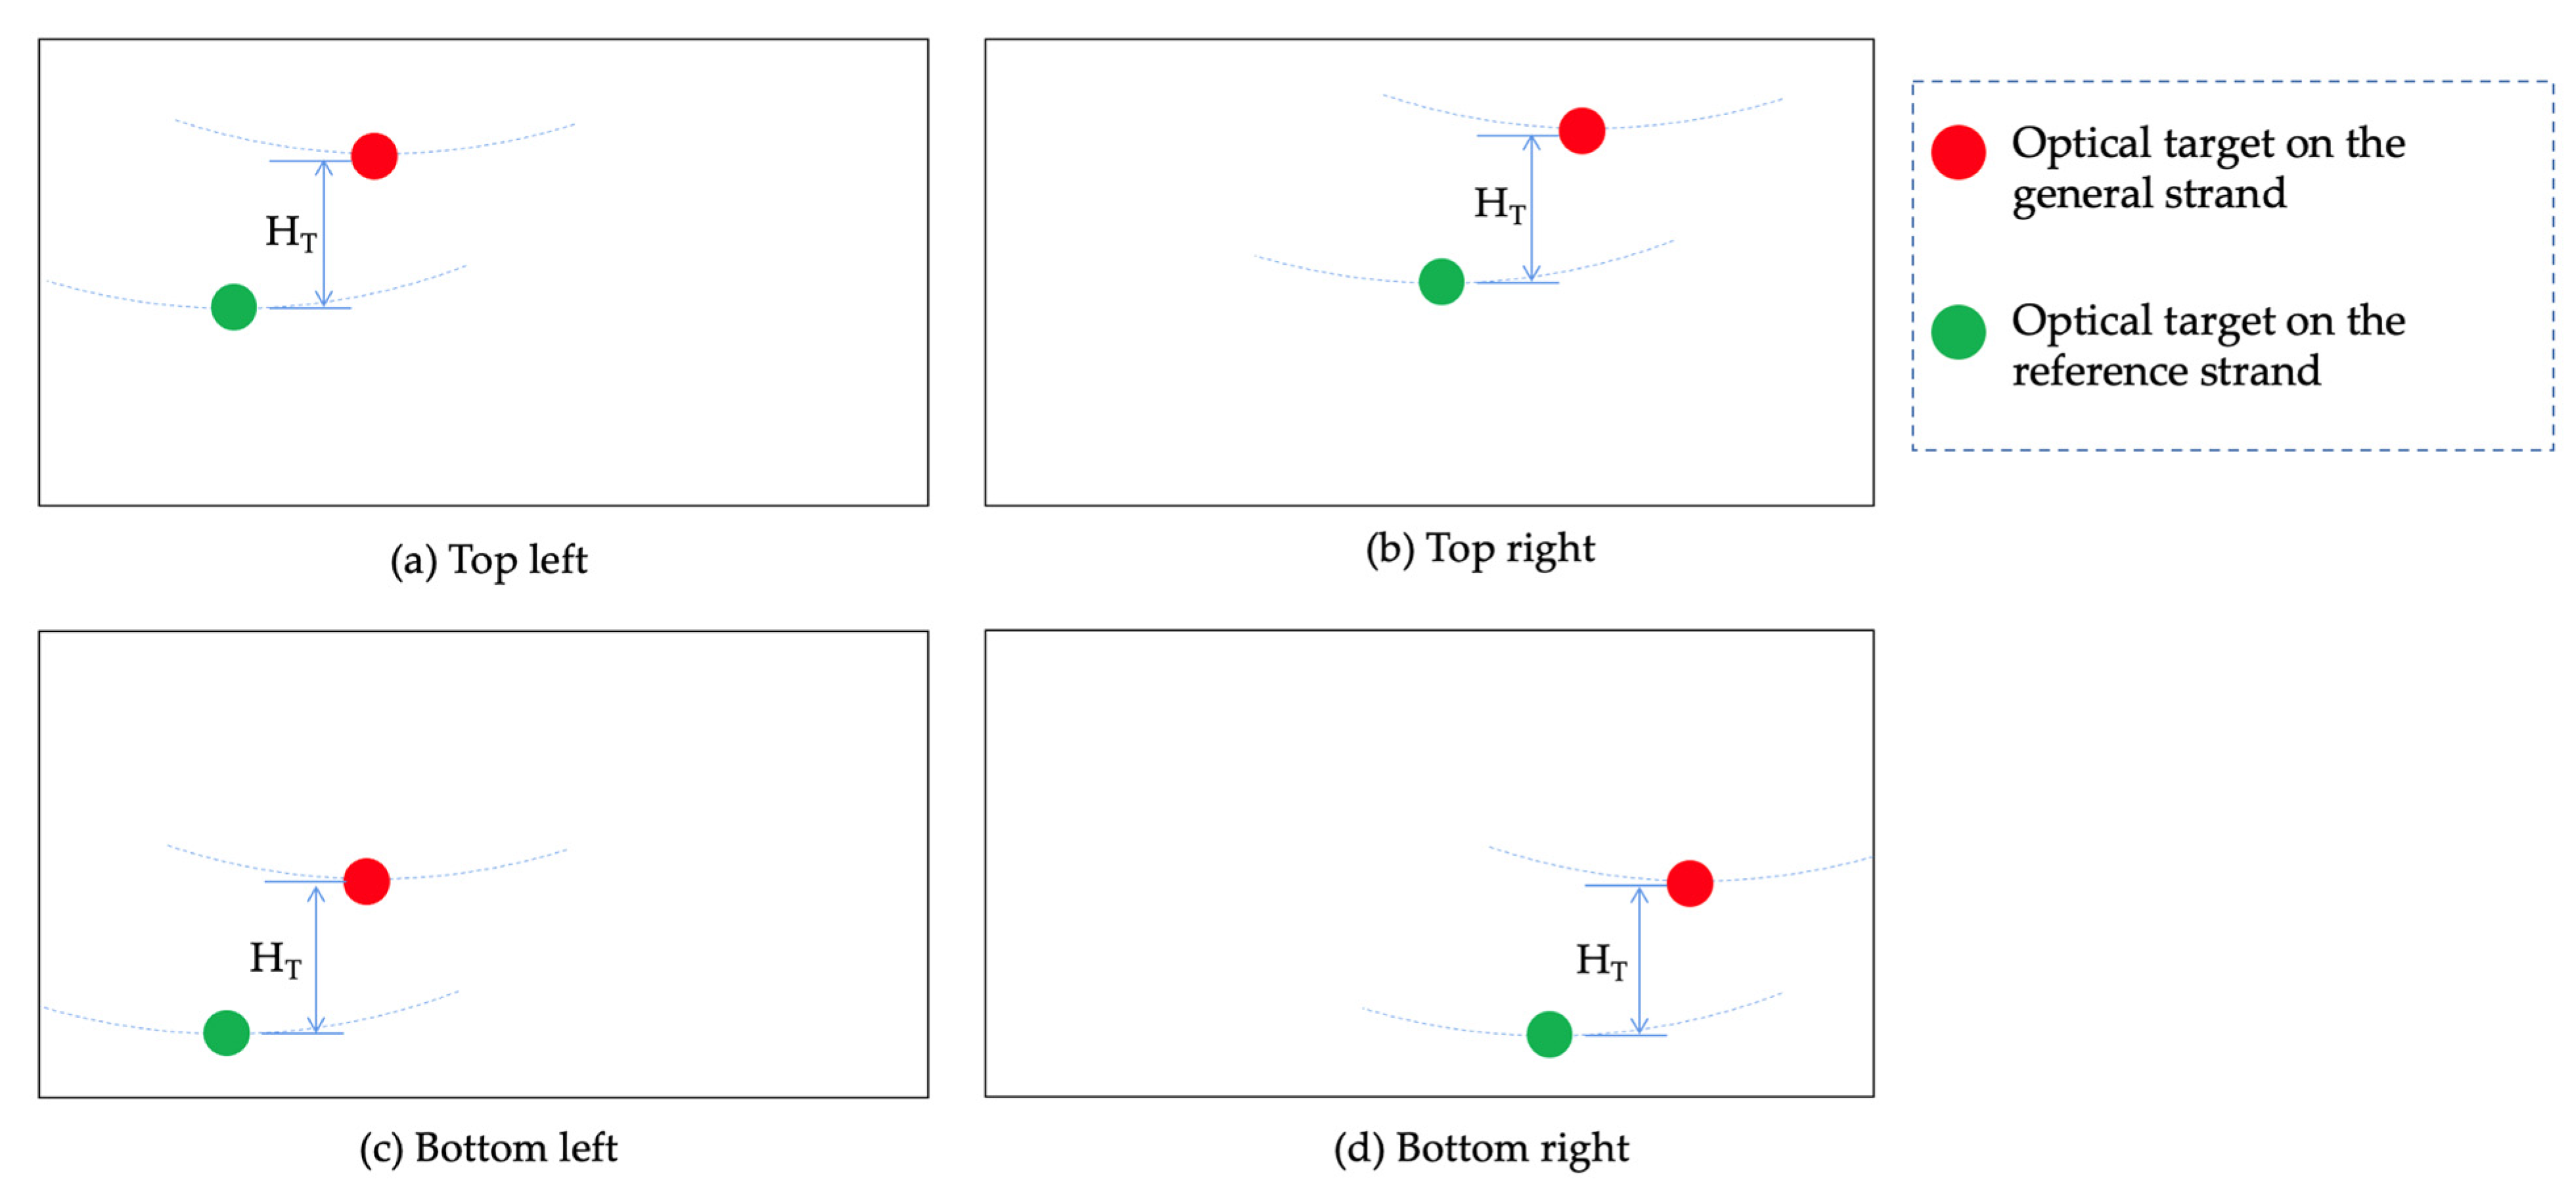
The camera displacements in the transverse and vertical directions only change the position of optical target in the collected images, as shown in Figure 12, causing no deviations to the measurement. Similarly, the pitch angle and yaw angle of the camera do not lead to image deflection. Their impacts on the measurement accuracy can be eliminated by expanding the monitoring range of the camera and using an anti-distortion lens.
Collectively, the maximum measurement errors caused by the wind-induced camera shaking are summarized in Table 3, according to the empirical values of key parameters. It can be concluded that the image deflection caused by the camera’s roll angle is the major contributor to the measurement error.
4. Development of the Vision-Based Measuring System
4.1. System Composition
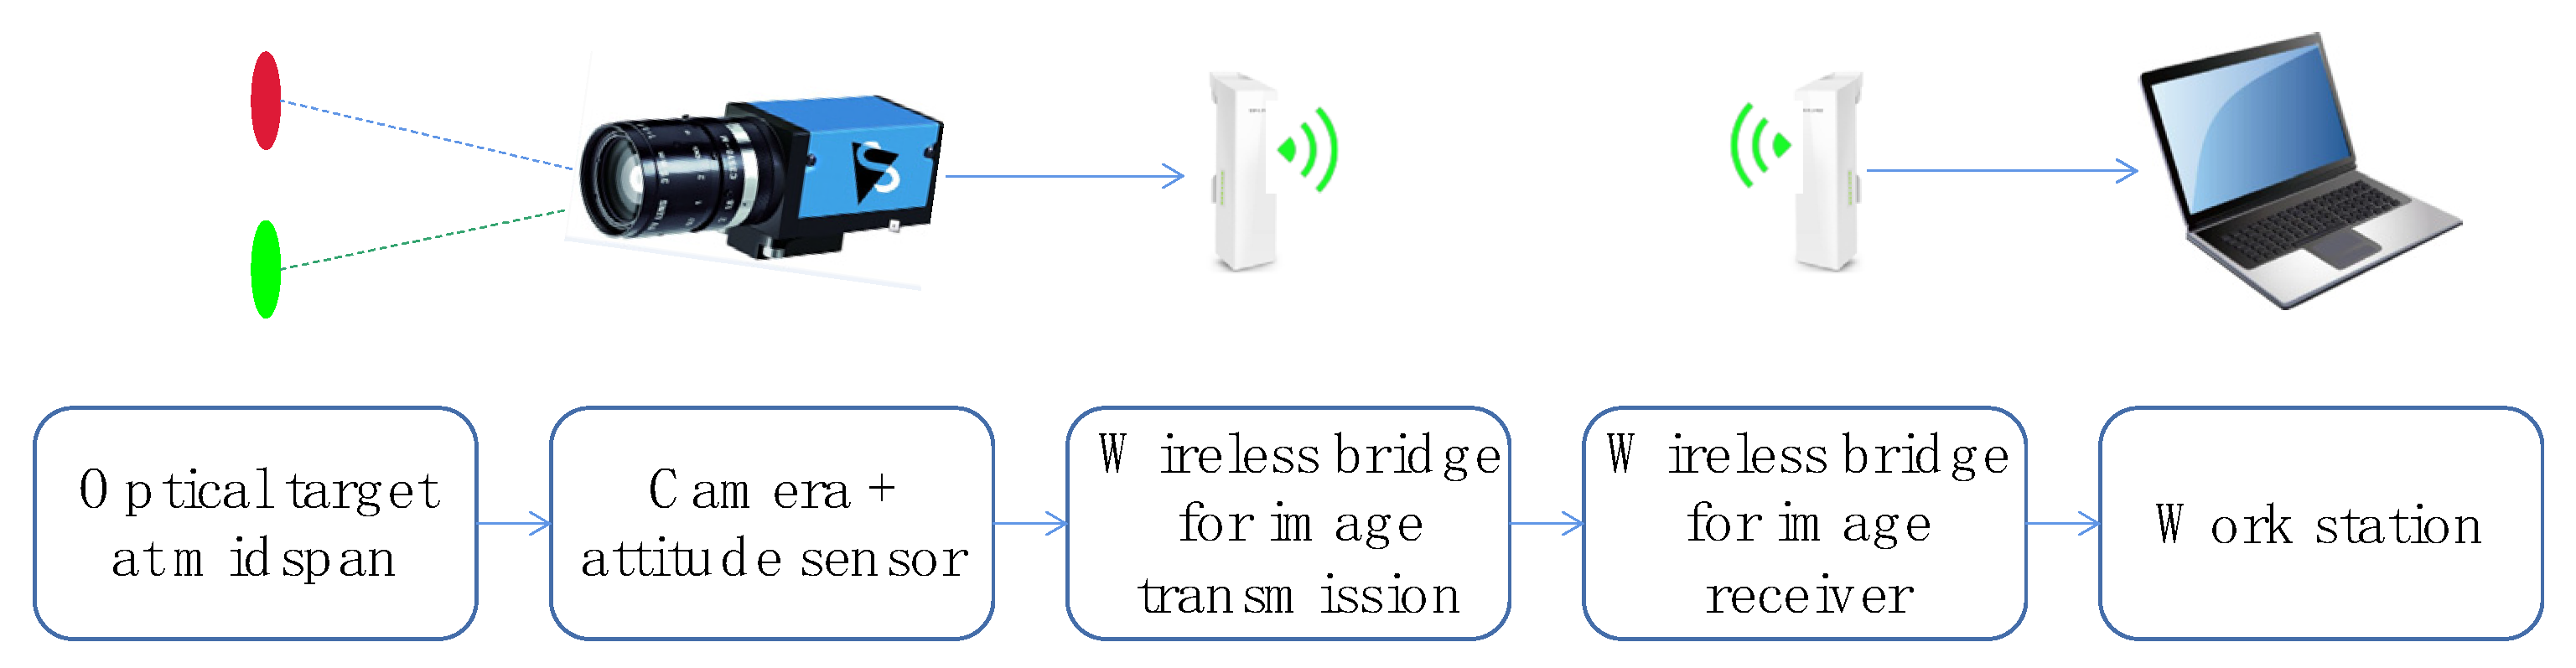
The vision-based system for relative sag measurement consists mainly of: (1) optical targets, (2) a camera, (3) an attitude sensor for measurement correction, (4) a wireless bridge for data transmission, and (5) a workstation for real-time data analysis and system control. Figure 13 illustrates the workflow of the proposed system.
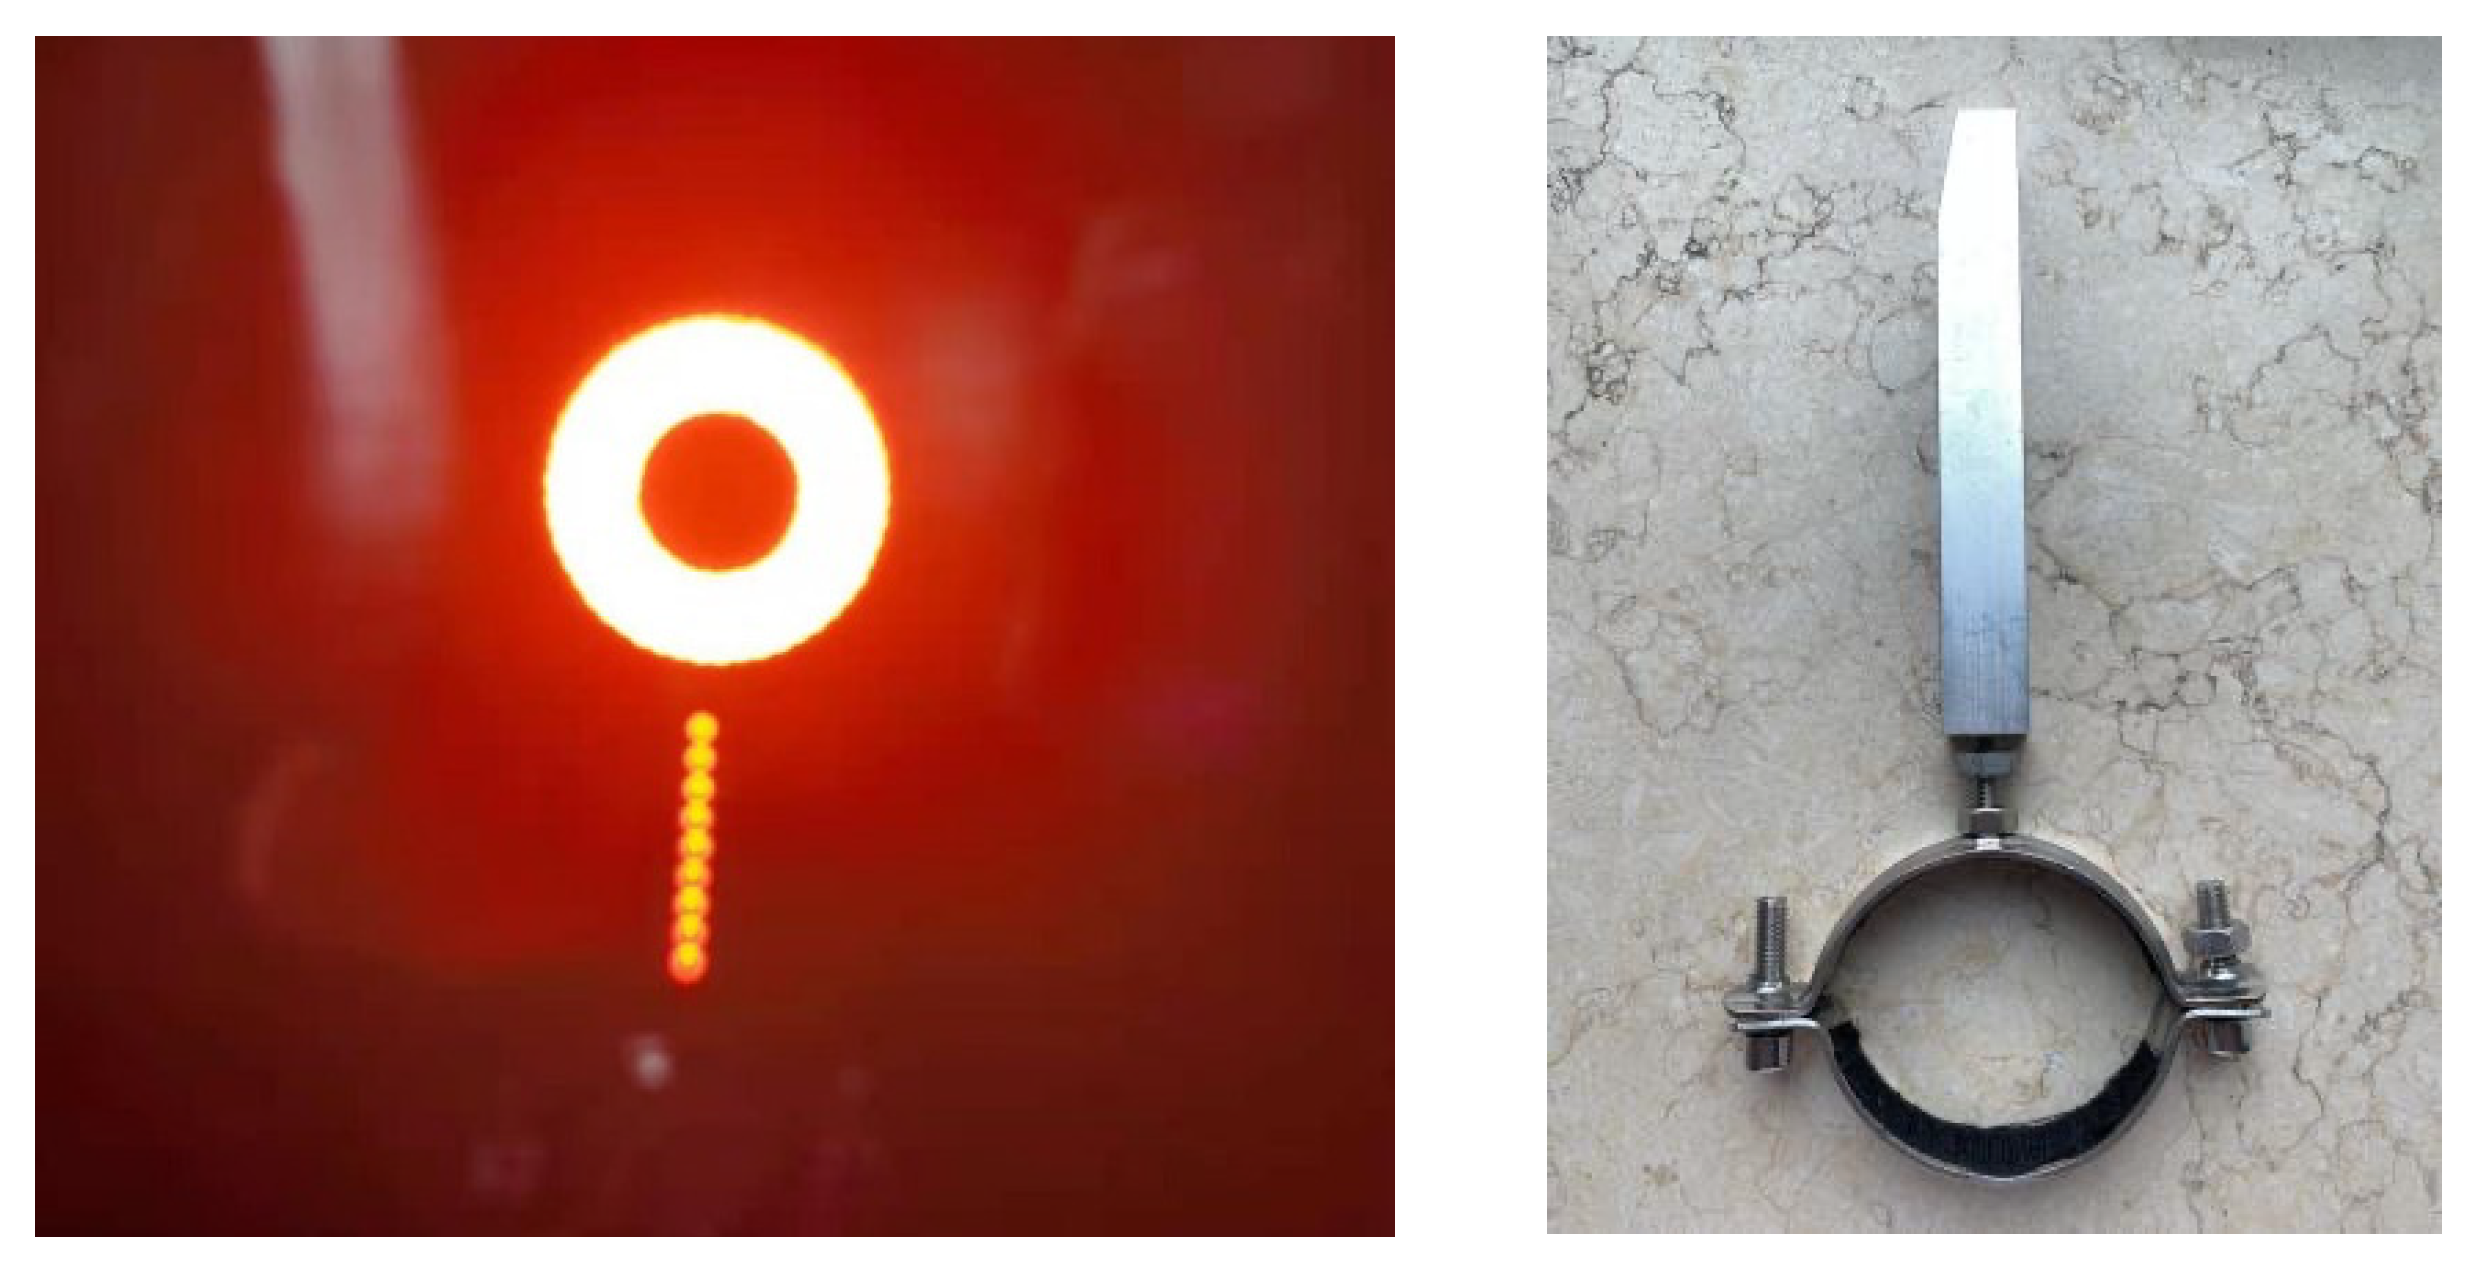
4.2. Design of the Optical Target
The optical target is designed to include a ring LED lamp, and its brightness can be adjusted as required. A vertical light band is set at the lower end of the target to collect the torsion angle of the strand. The bracket hoop of the optical target is customized according to the strand diameter. The top of the bracket is designed with an elevation angle of 10°, making it easier to be captured by the camera. The optical target and bracket are shown in Figure 14.
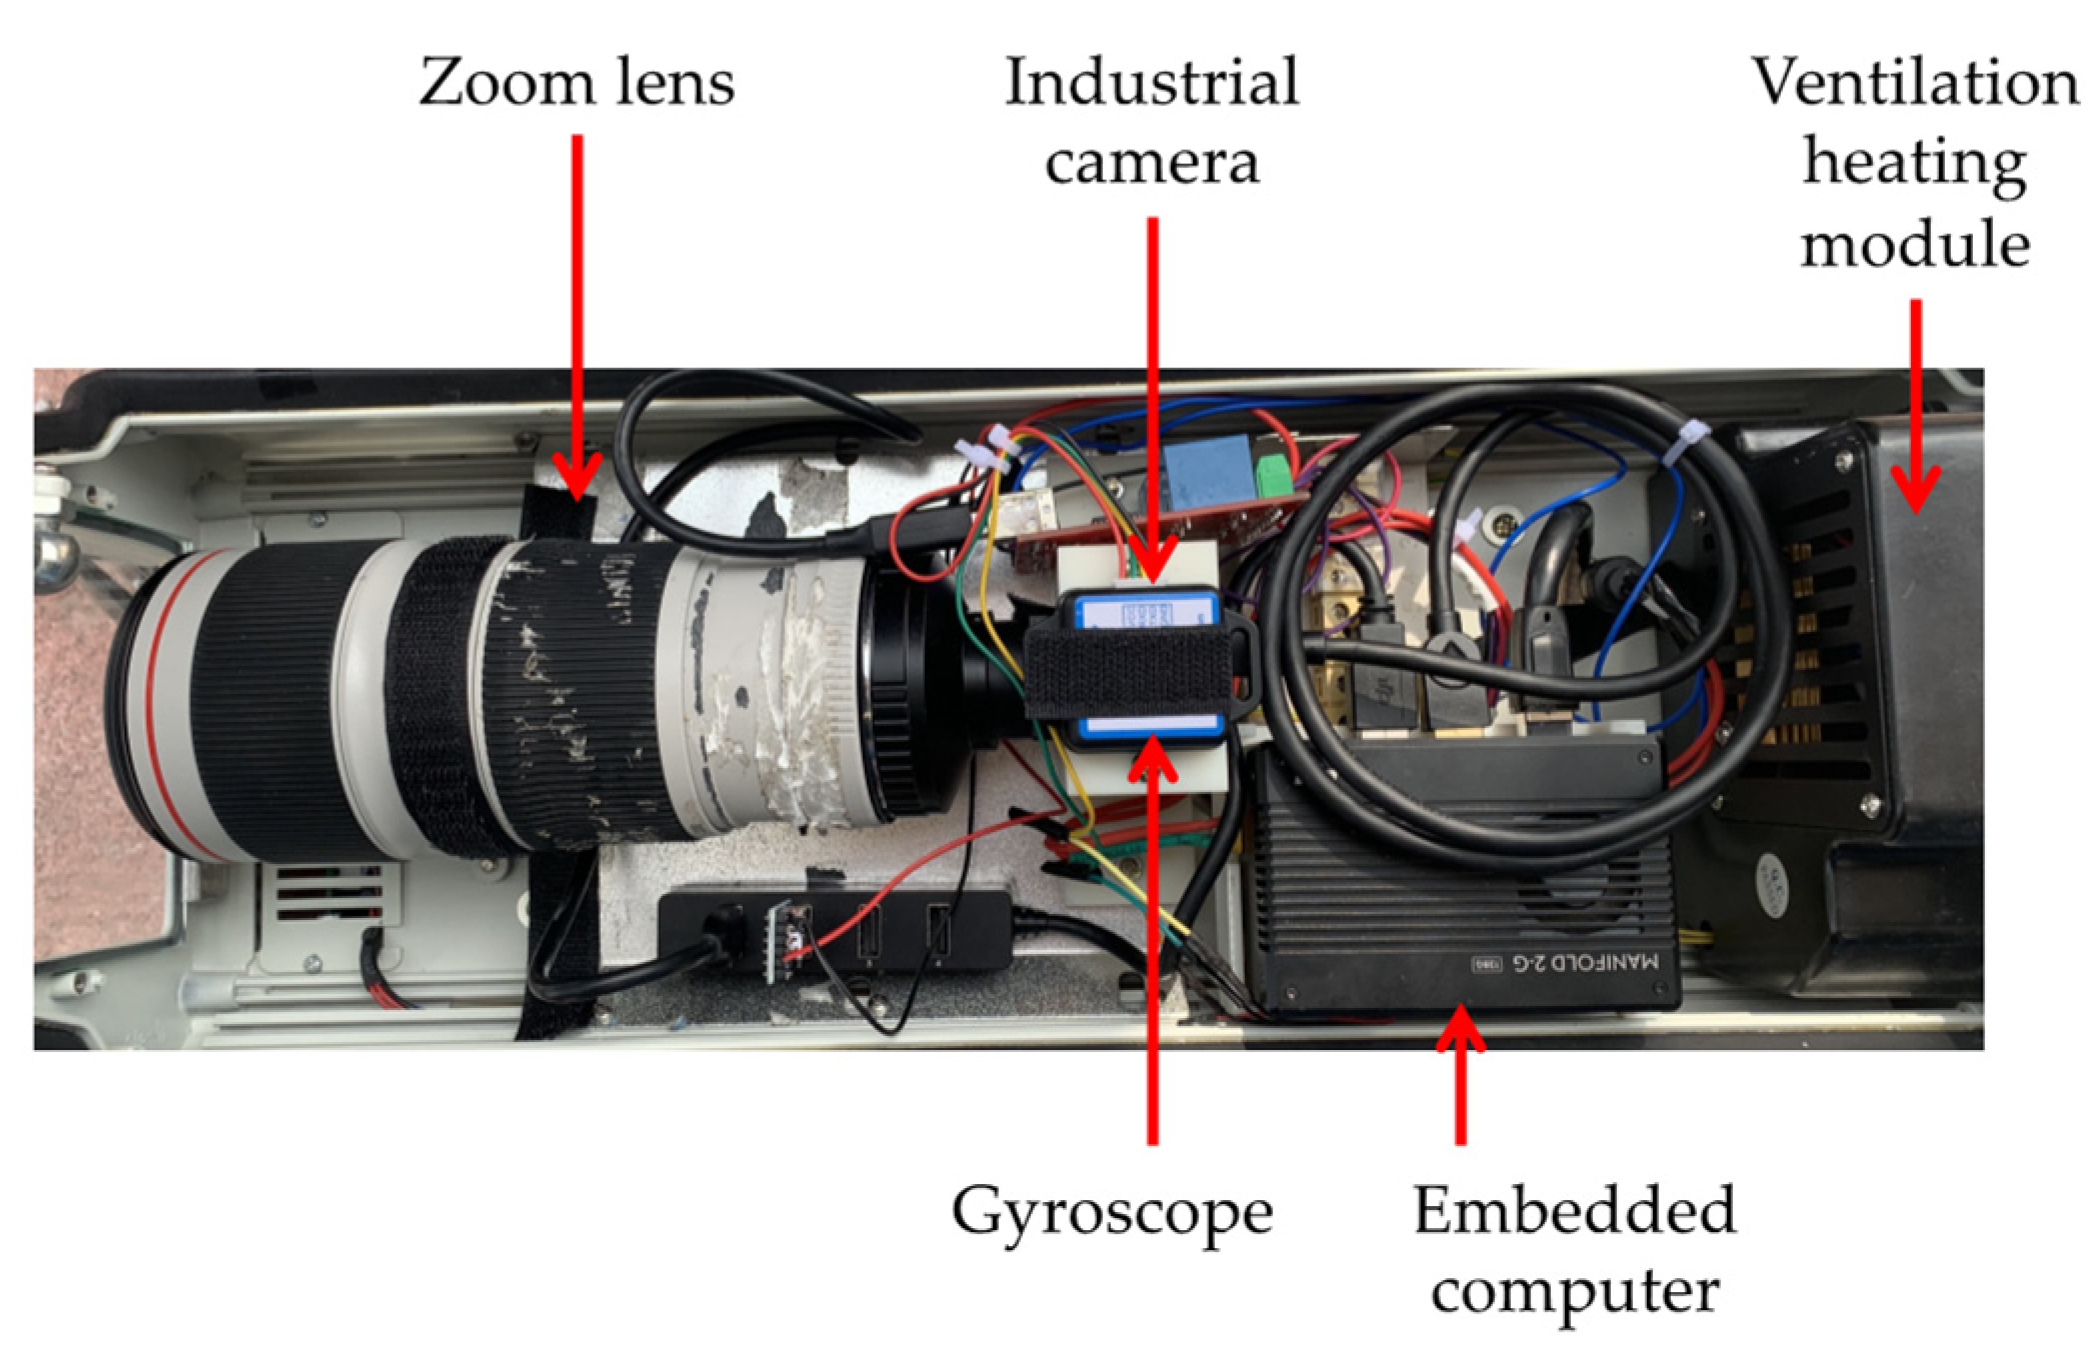
4.3. Integrated Camera Set
The main data acquisition and transmission modules are integrated, as shown in Figure 15. The integrated camera set consists of a zoom lens, an industrial camera, a gyroscope, and an embedded processor. Specifically, the gyroscope is used to monitor the camera attitude in a real-time manner, and the embedded computer is used for efficient image compression and command transmission. In addition, a ventilation and heating module is employed to improve the internal environment of the equipment to maintain durability, and the external protective cover is used for dust and rain protection.
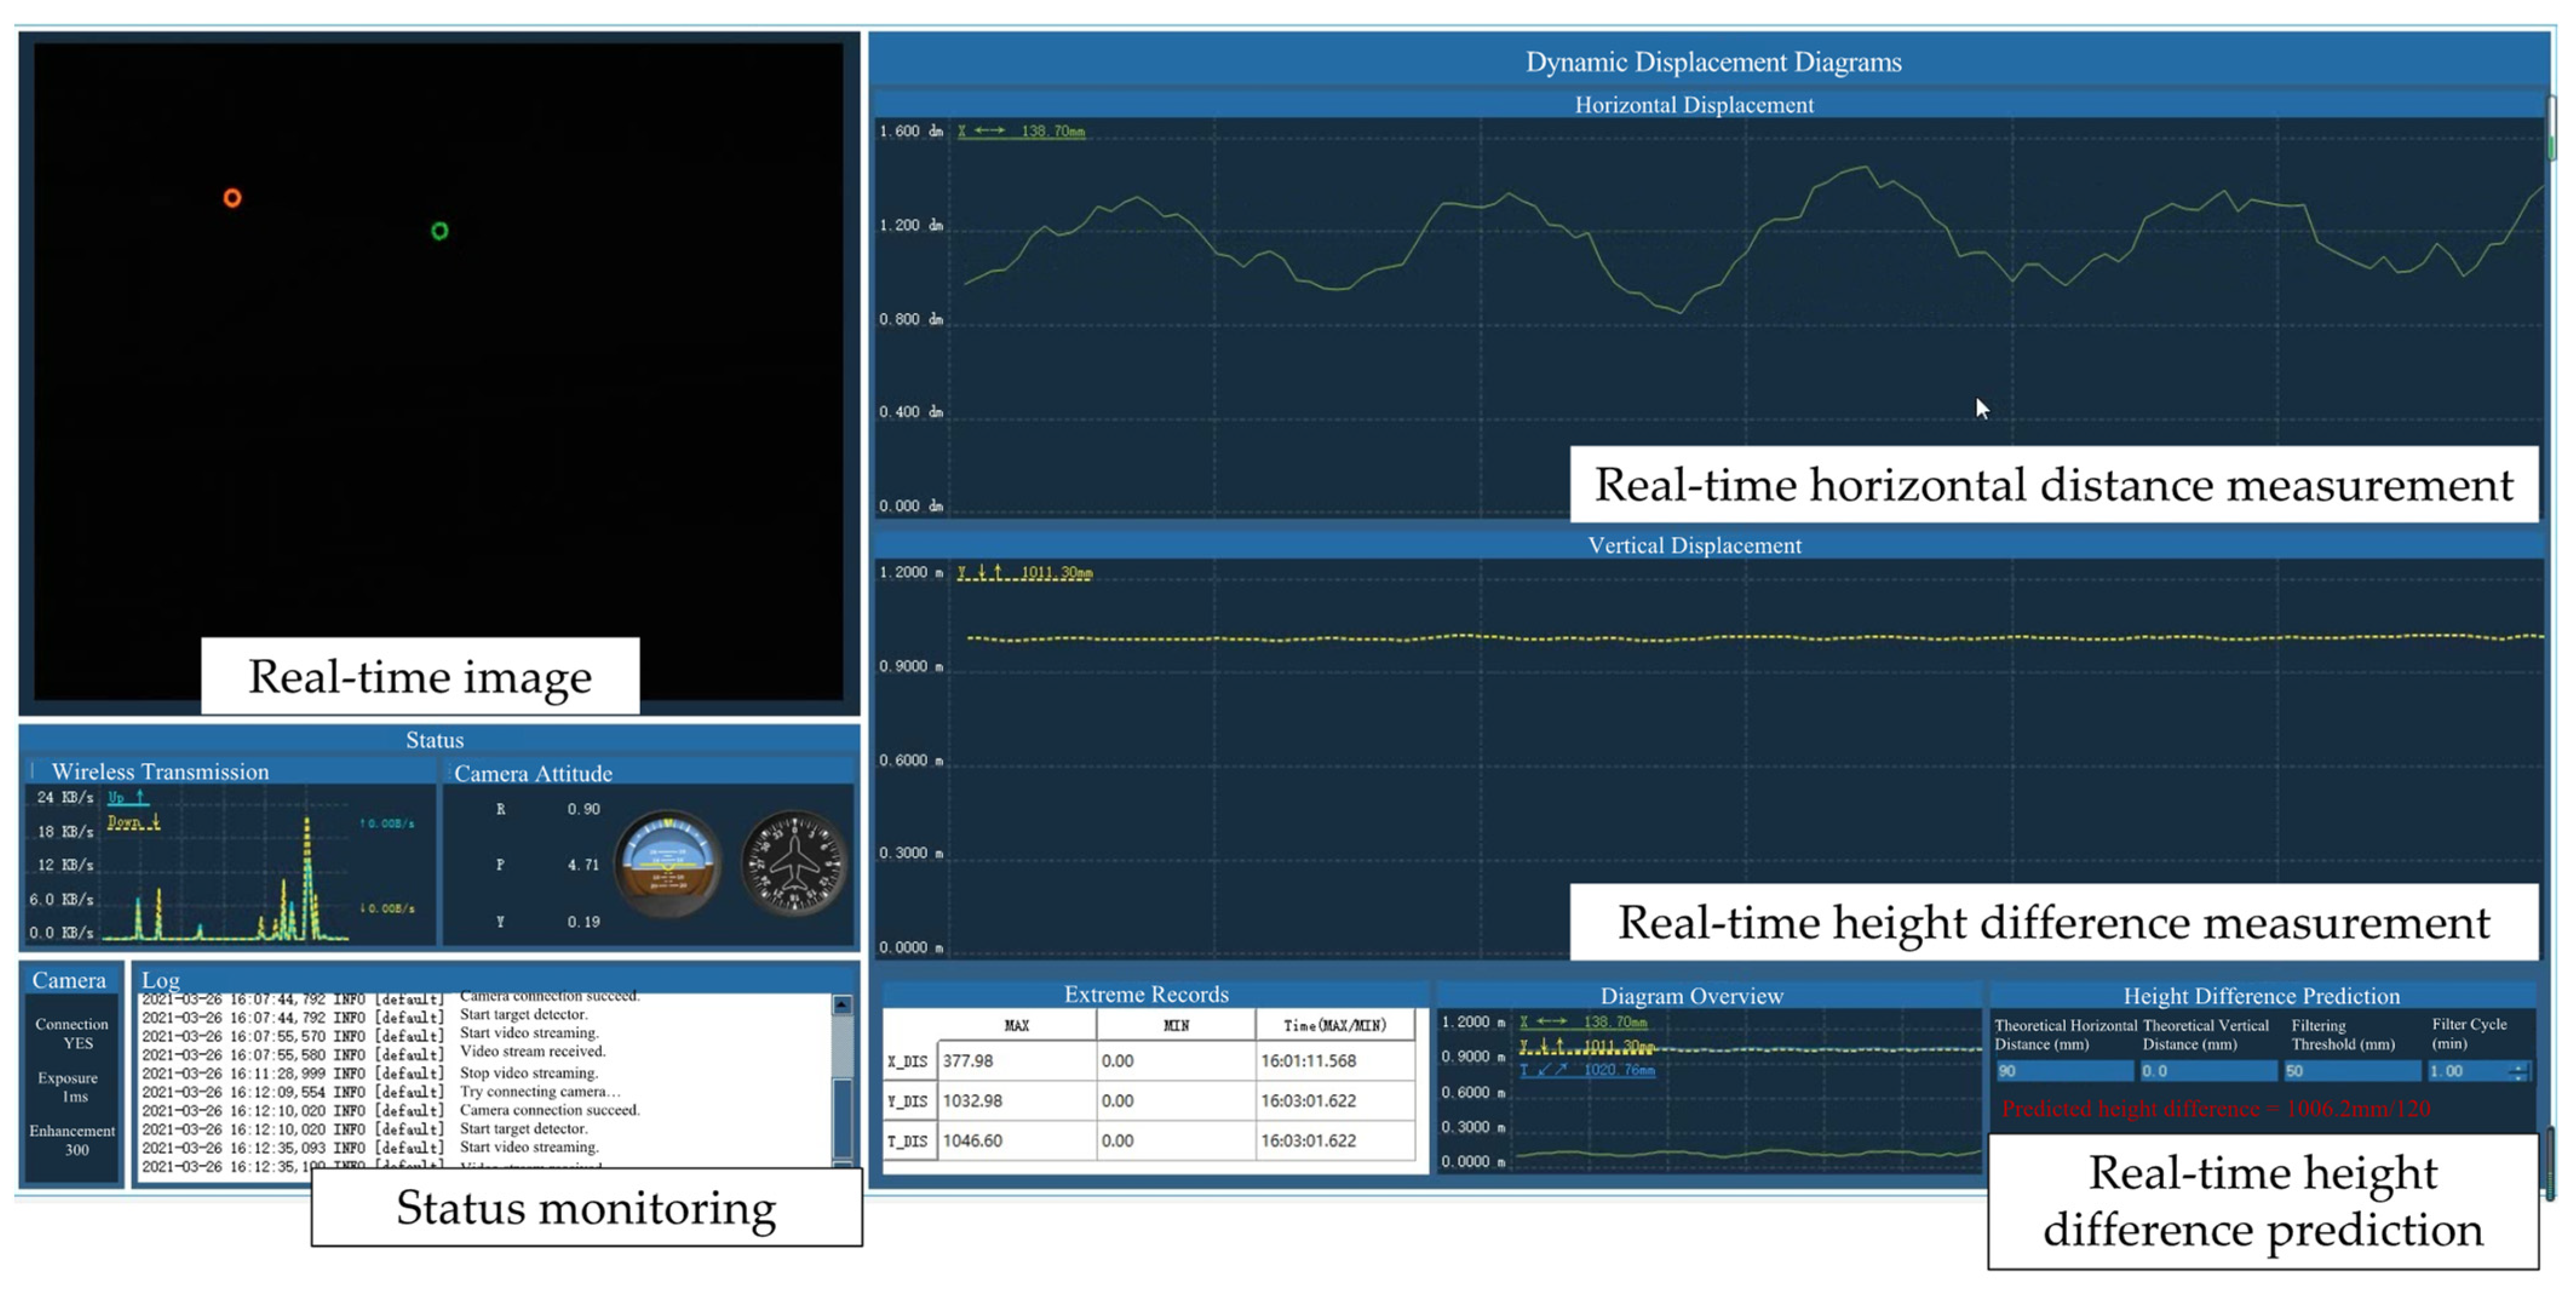
4.4. Visual Monitoring Software
The visual monitoring software is designed to achieve real-time detection and tracking of the optical target, horizontal spacing measurement, real-time measurement of the vertical height difference, static height difference prediction, wireless transmission network monitoring, and camera attitude monitoring. Figure 16 presents the interface of developed software, including a few previously mentioned modules.
In order to eliminate the influence of wind-induced transverse swing and vertical vibration of the strands, Equation (8) is used to predict the static height difference ().
where and are the height difference and horizontal spacing between the targets, respectively. The image acquisition frequency is set to 1 Hz, is the current time, and is the data acquisition time of and . The number of height differences, , is determined by satisfying two conditions, i.e., .
5. Field Application
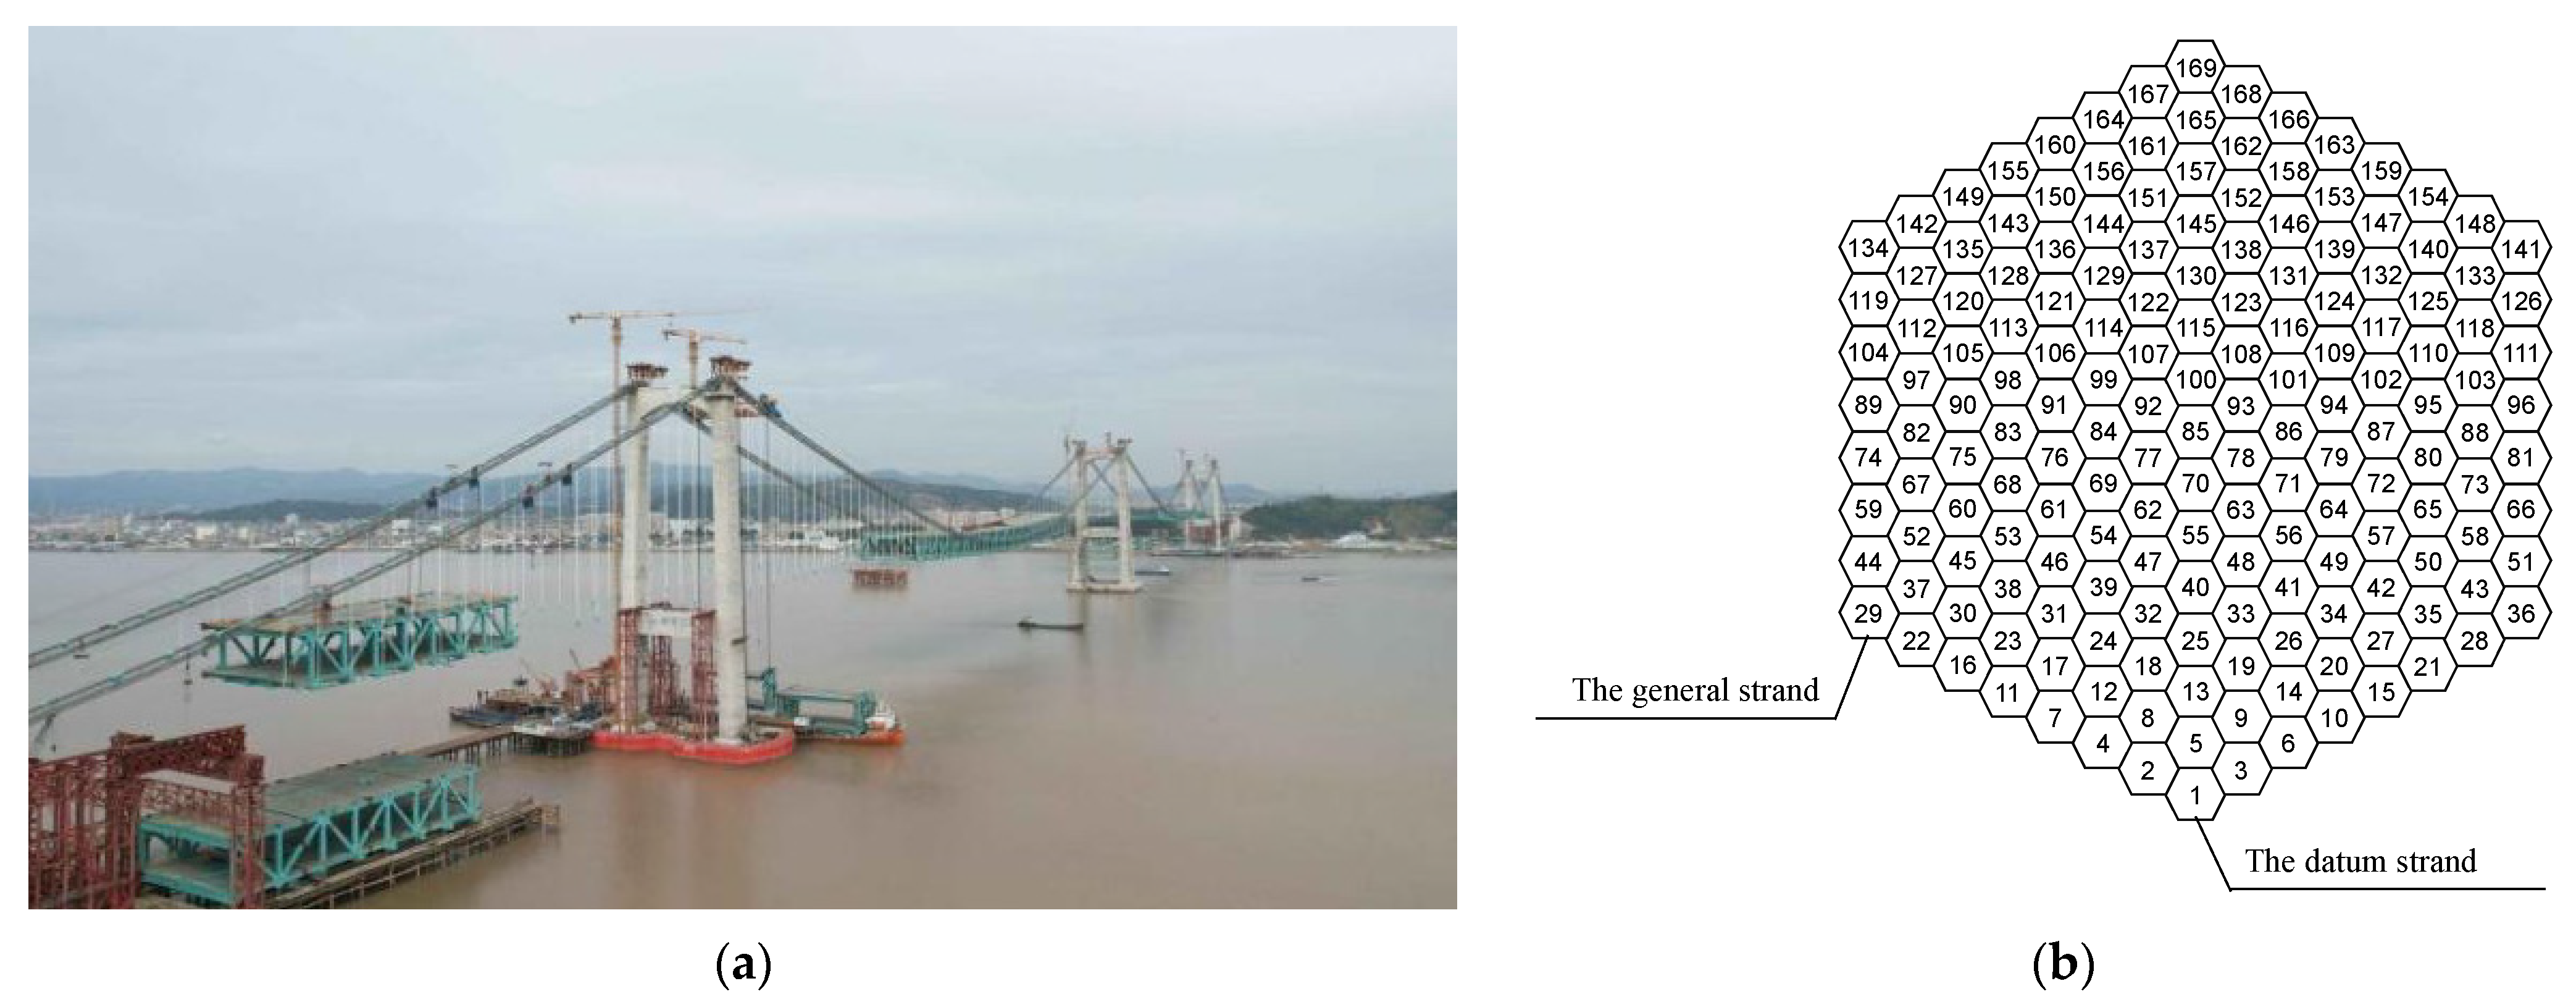
The developed system was applied to the Oujiang Beikou Bridge, validating its efficiency in sag measurement for the suspension cables. The main bridge of the Oujiang Beikou Bridge is a suspension bridge with three towers, four spans, and a double layer stiffening girder. Figure 17a is a photo of the Oujiang Beikou main bridge under construction. The total length of the bridge superstructure is 2178 m, consisting of two main spans of 800 m and two suspended side spans of 230 m and 348 m, respectively. The cable sag is 80 m and the sag to span length ratio is 1/10. Each main cable is composed of 169 strands, and each strand is made of 127 wires composed of Φ 5.4 mm galvanized high-strength steel wire. The wire stands are arranged in an approximate regular hexagon, as illustrated in Figure 17b. The erection method for the main cables is the prefabricated parallel wire strand (PPWS) method, given its higher construction efficiency, easy control of fabrication, and higher precision compared to the aerial spinning (AS) method [12].
5.1. Layout of the Vision-Based Measuring System
In this project, a ruler cable strand is used as the reference strand to adjust the configuration of the general strands. First, two light targets were installed at the midspan of the general cable strand and the reference cable strand. The targets had an outer diameter of 90 mm and included 4 rows of LED lamps, which were powered by batteries. The camera integration set (as introduced in Section 4.3) and the bridge camera were mounted at the middle top of the gantry beam. The hardware specifications for the camera integration set are summarized in Table 4. The on-site hardware equipment was directly powered by the distribution box. The transmission direction of the bridge signal faced the remote monitoring room, and a video recorder was installed and connected to a high-performance computer for real-time target identification and height difference calculation. The field installation is shown in Figure 18.
5.2. Distance Calibration and Accuracy Verification
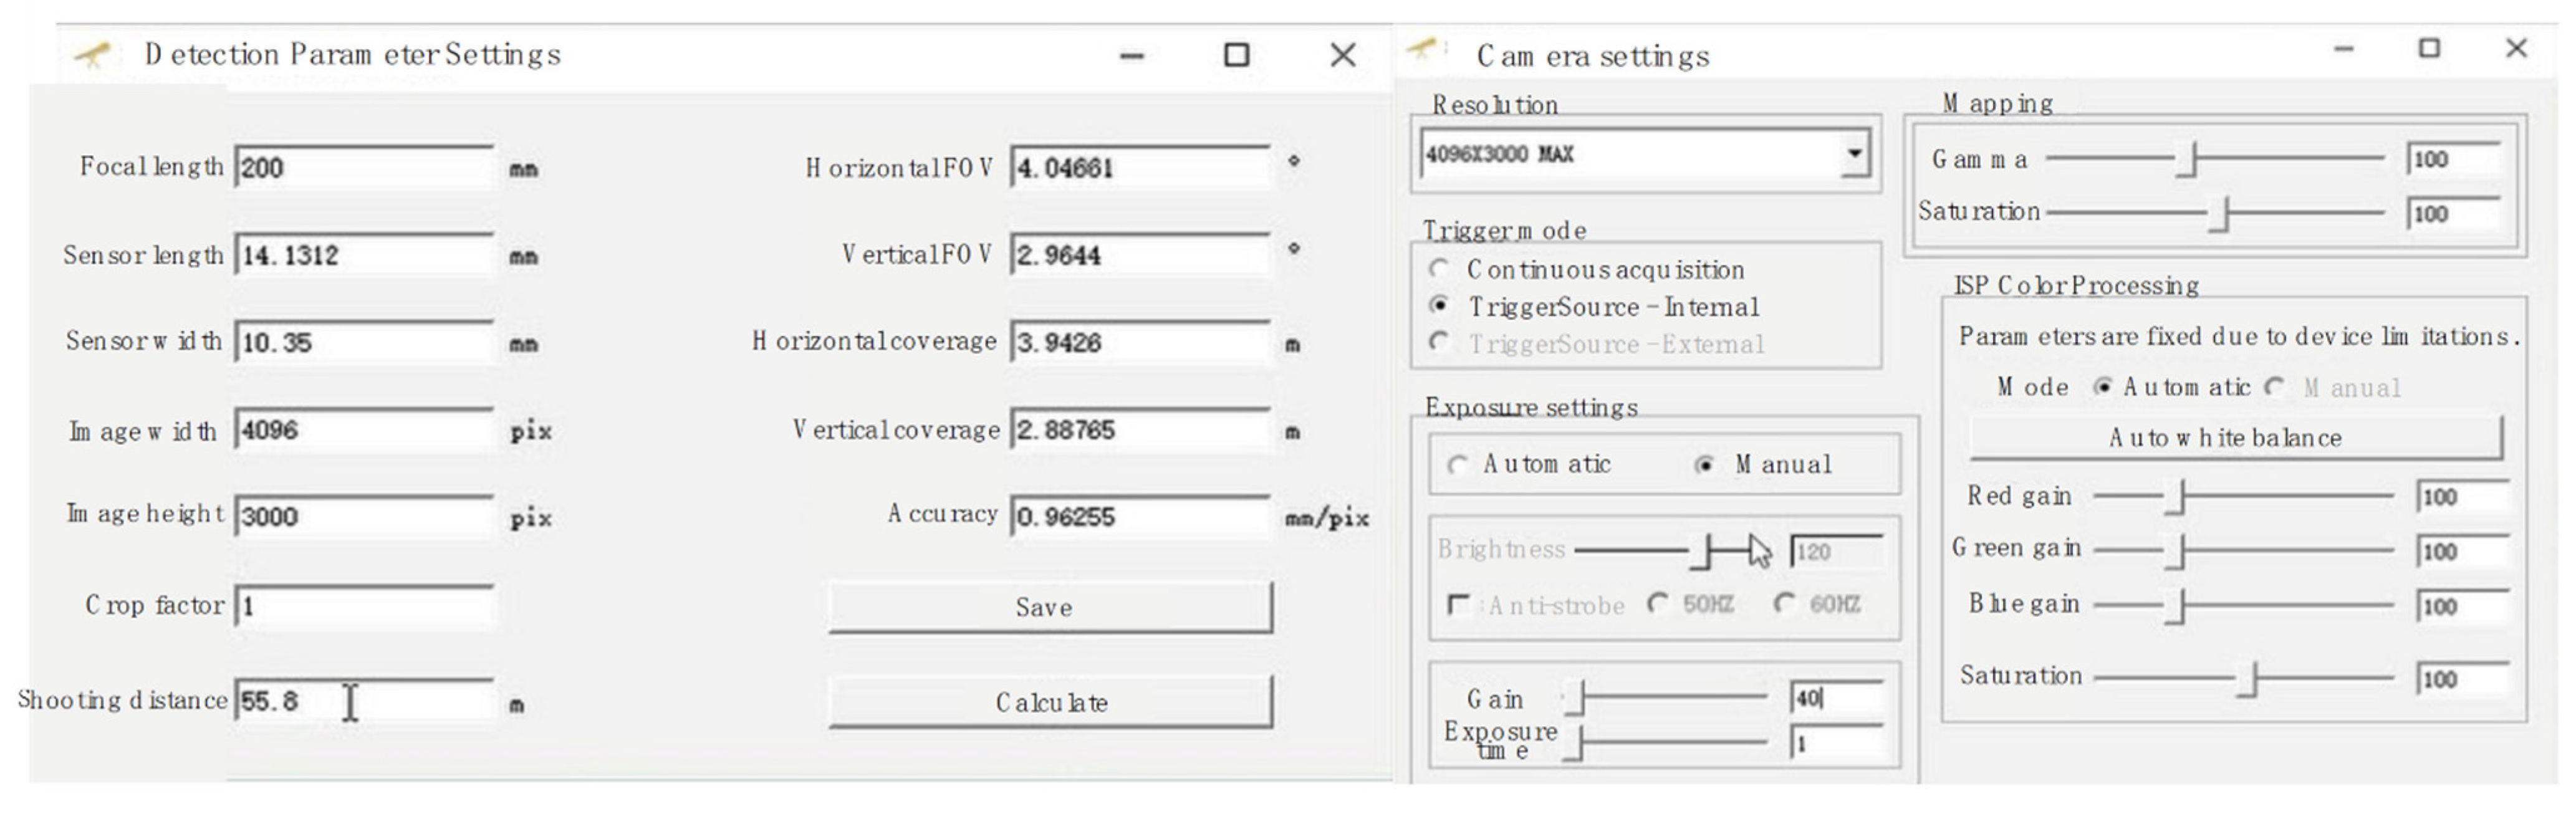
In addition to the on-site hardware installation, the parameters of the developed software require calibration beforehand. Figure 19 shows the interface for parameter settings of the developed software. Specifically, the camera gain was set to be relatively low, considering that the optical target itself emits light. The image can be dimmed as a whole, to better capture the characteristics of the target and improve the accuracy of target recognition and positioning.
The shooting distance is calibrated using a measuring rod customized on site. The measuring rod is perforated every 10 cm, from 60 cm to 130 cm. The distance between the two optical targets is measured first by a measuring tape and then by the visual system. The measurement results are shown in Table 5. According to the results, the overall measurement error of the developed vision-based system is less than 2 mm, including the tape measurement error, optical target positioning error, distance parameter setting error, and static height difference prediction algorithm error.
5.3. Validation of the Proposed Measuring System
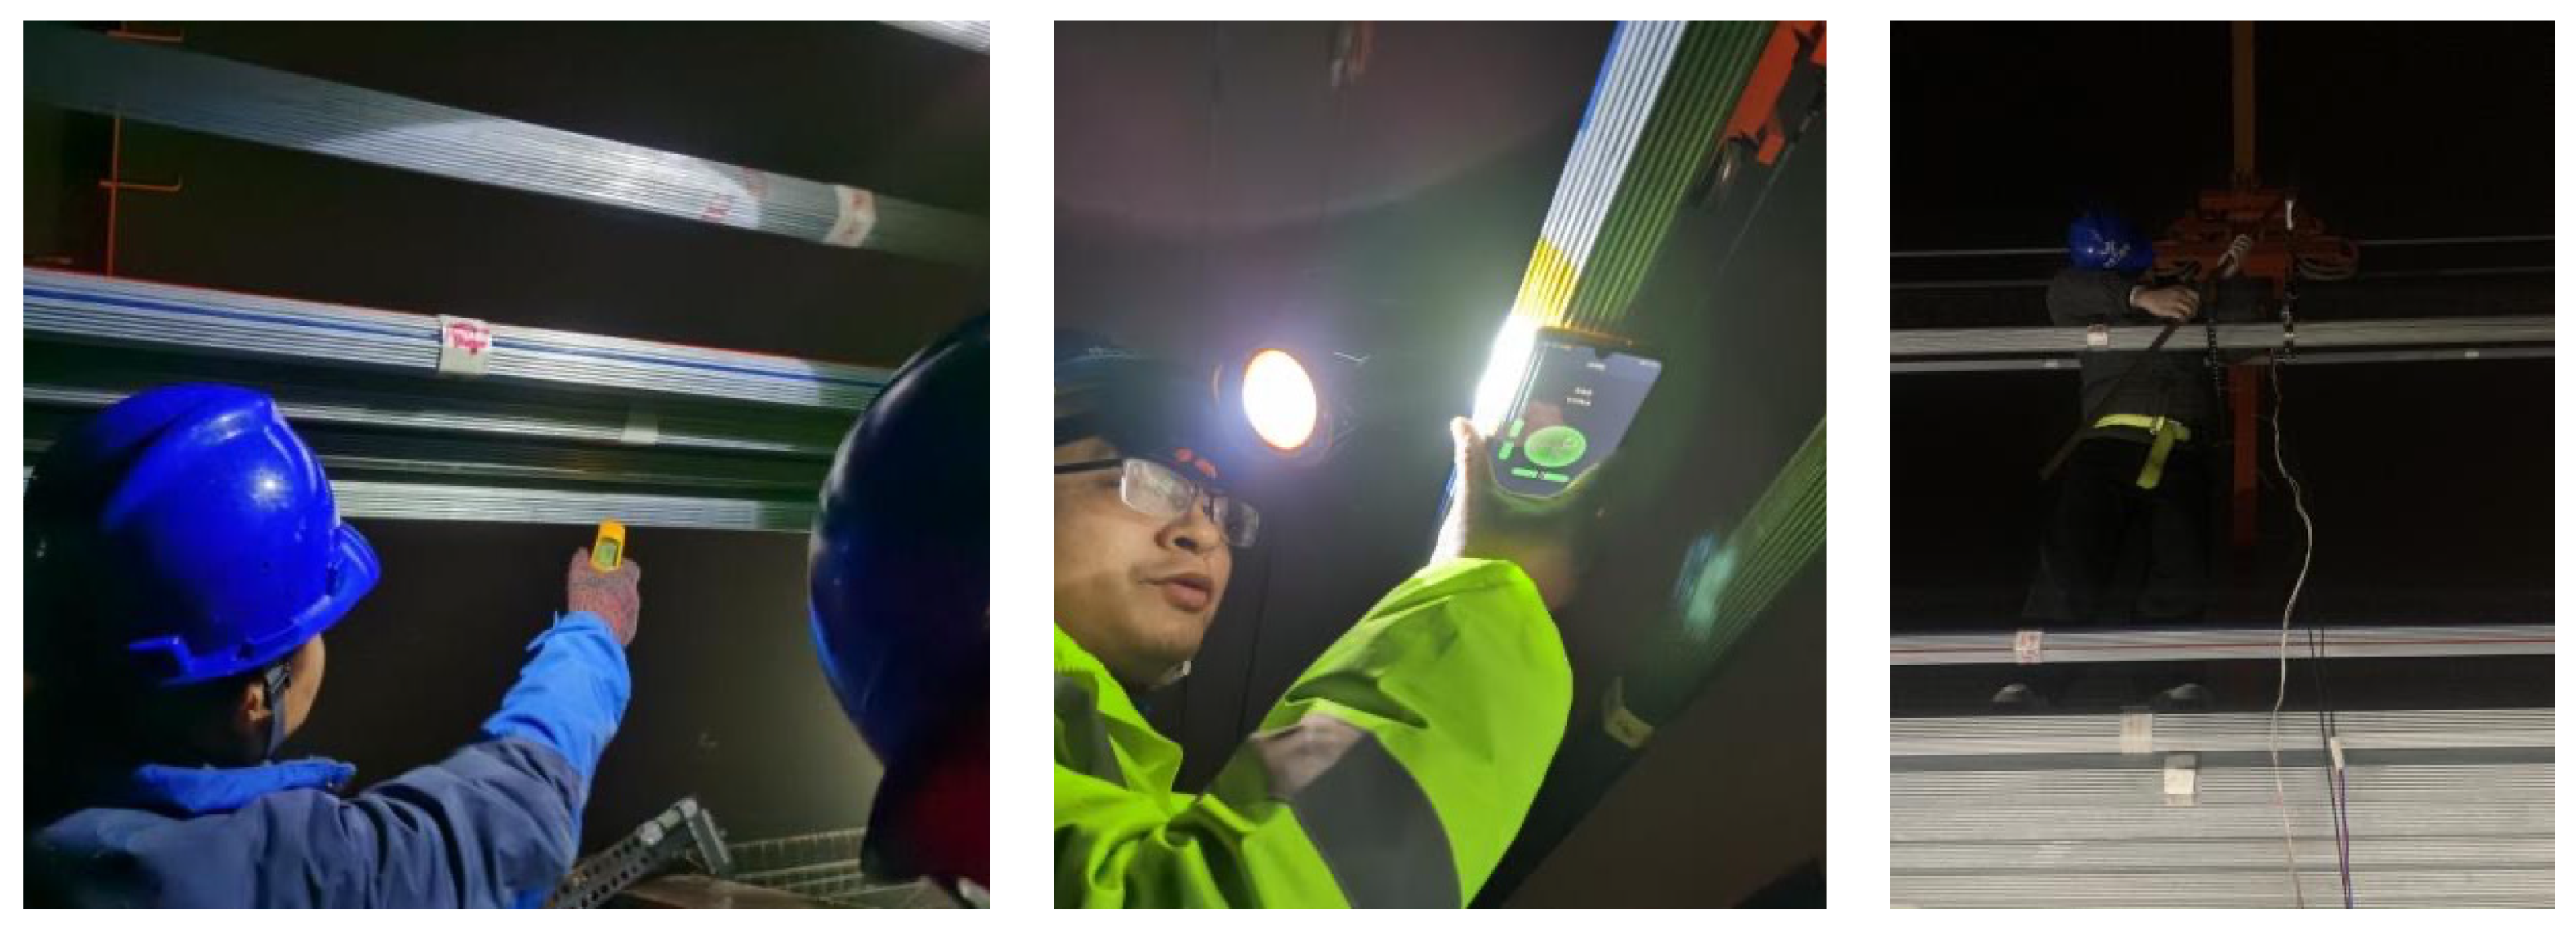
The height difference measurement, using a caliper and the proposed system, were both carried out at night. Figure 20 presents the photos of the field experiment. During the test, the wind force was level 2~3 and the temperature was 8~10°. The general strands presented a maximum 30 cm horizontal displacement and 5 cm vertical displacement. Neither the out-of-plane torsion of the strand nor the camera shaking was significant. The wind-induced shaking posed challenges to the conventional approach using the caliper; thus, an average of three separate measurement times was used. The comparison between the caliper measurement and the proposed method is shown in Table 6. Notably, with strand shaking and camera shaking, the overall measurement error of the proposed measuring system is about 3 mm.
5.4. Discussion
At present, the sag of the cable strand during erection is generally measured manually with a caliper. The comparison between this conventional method and the vision-based measurement system proposed in this paper in terms of accuracy, efficiency, and automation is shown in Table 7.
It can be concluded that the proposed method based on computer vision has a lower requirement for field operators, is more efficient, and can improve the measurement accuracy. In addition, a large amount of cable strand shaking data accumulated in the measurement process can provide a data basis for further research on wind-induced cable strand shaking mechanisms and the optimization of the visual measurement algorithm.
5.5. Further Improvement of the Measuring System
Although this study verifies the feasibility of a vision-based system to measure the relative sag of general cable strands and validates its accuracy, the hardware and software of the system still need to be optimized. In the optical target design, the target size, support height, and bracket structure can be further optimized to realize rapid disassembly and installation. In terms of the camera integration, the selection and integration design of the comprising gadgets in the integration box can help reduce the volume of the equipment. Moreover, the algorithms used to predict the static height difference of strands can be further improved. In terms of system design, the measurement accuracy reduction caused by strand torsion, and the observation difficulty caused by strand swing requires further investigation. The above improvements will further improve the applicability and measurement accuracy of the proposed measurement system.
6. Conclusions
Regarding the drawbacks of conventional methods, this paper innovatively proposes a vision-based method to measure the relative sag of general wire strands of suspension bridges regarding datum methods. Theoretical analysis, in terms of both cable strand shaking and camera shaking, is conducted, based on which a vision-based measuring system is developed. Pre-designed optical targets are attached to cable strands, and an integrated camera set is designed to conduct data collection. An ad hoc monitoring and analysis software system is developed to determine the relative sag of target strands. Through field experiment, the following conclusions are drawn:
- (1)
- In a strong wind environment, cable strand torsion and camera rolling are the main contributors to the measurement errors, as indicated in Table 3 and Table 4. To further improve the measurement accuracy, it is necessary to design the optical target support, monitor the camera attitude, and develop the correction algorithm.
- (2)
- The strand sag measurement error of the proposed measuring method in a complex field environment is 3 mm, and this error can be further reduced after hardware and software optimization.
- (3)
- The developed measuring system can be applied to the main cable erection construction in a strong wind environment and can be further extended to the monitoring of strand shape change from day to night. In this way, the feasibility study of daytime cable adjustment can be conducted in future work.
- (4)
- The measuring system can reduce the personnel demand and time cost, eliminate the potential risk of surveyors working in adverse environments (e.g., high altitude, dark and windy weather), and facilitate the automation of cable erection in suspension bridge construction.
Author Contributions
Conceptualization, C.H. and Y.W.; methodology, Y.W. and S.X.; software, Y.W. and C.P.; validation, Y.W., D.L. and C.P.; formal analysis, Y.W.; investigation, S.X.; resources, C.H.; data curation, Y.W.; writing—original draft preparation, S.X.; writing—review and editing, S.X. and W.S.; visualization, C.P. and W.S.; supervision, C.H.; project administration, C.H.; funding acquisition, C.H. and Y.W. All authors have read and agreed to the published version of the manuscript.
Funding
This research was funded by the National Development Plan (2021YFF0500900) and (2021YFF0500902).
Institutional Review Board Statement
Not applicable.
Informed Consent Statement
Not applicable.
Data Availability Statement
The data presented in this study are available on request from the corresponding author. The data are not publicly available due to reasons of confidentiality.
Acknowledgments
This research was funded by the National Development Plan (2021YFF0500900) and 2021YFF0500902.
Conflicts of Interest
The authors declare no conflict of interest.
References
- Kim, H.-K.; Lee, M.-J.; Chang, S.-P. Determination of hanger installation procedure for a self-anchored suspension bridge. Eng. Struct. 2006, 28, 959–976. [Google Scholar] [CrossRef]
- Chen, Z.; Cao, H.; Ye, K.; Zhu, H.; Li, S. Improved Particle Swarm Optimization-Based Form-Finding Method for Suspension Bridge Installation Analysis. J. Comput. Civ. Eng. 2015, 29, 04014047. [Google Scholar] [CrossRef]
- Wang, X.; Fei, P.; Dong, Y.; Wang, C. Accelerated Construction of Self-Anchored Suspension Bridge Using Novel Tower-Girder Anchorage Technique. J. Bridge Eng. 2019, 24, 05019006. [Google Scholar] [CrossRef]
- Zhang, J.-P.; Huang, H.-Y.; Liu, A.-R.; Mei, L.-B.; Li, Y.-H. Experimental study on nonlinear behaviors and construction control method in the process of structural system transition of self-anchored suspension bridge. Eng. Mech. 2009, 26, 160. [Google Scholar]
- Peters, T.F. Transitions in Engineering: Guillaume Henri Dufour and the Early 19th Century Cable Suspension Bridges; Birkhauser: New York, NY, USA, 1987. [Google Scholar]
- CCC Second Highway Engineering Bureau Co. Ltd. Serial Handbooks of Highway Bridge Construction: Suspension Bridge; China Communications Press: Beijing, China, 2014; p. 622. [Google Scholar]
- Gil, H.; Choi, Y. Cable Erection Test at Splay Band for Spatial Suspension Bridge. J. Bridge Eng. 2002, 7, 300–307. [Google Scholar] [CrossRef]
- Gil, H.; Choi, Y. Cable Erection Test at Pylon Saddle for Spatial Suspension Bridge. J. Bridge Eng. 2001, 6, 183–188. [Google Scholar] [CrossRef]
- Hua, X.; Wang, C.; Li, S.; Chen, Z. Experimental investigation of wind-induced vibrations of main cables for suspension bridges in construction phases. J. Fluids Struct. 2020, 93, 102846. [Google Scholar] [CrossRef]
- Li, S.; An, Y.; Wang, C.; Wang, D. Experimental and numerical studies on galloping of the flat-topped main cables for the long span suspension bridge during construction. J. Wind. Eng. Ind. Aerodyn. 2017, 163, 24–32. [Google Scholar] [CrossRef]
- Wang, C.; Hua, X.; Huang, Z.; Tang, Y.; Chen, Z. Post-critical behavior of galloping for main cables of suspension bridges in construction phases. J. Fluids Struct. 2021, 101, 103205. [Google Scholar] [CrossRef]
- Chen, Y.; Wei, W.; Dai, J. The key quality control technology of main cable erection in long-span suspension bridge construction. In IOP Conference Series: Earth and Environmental Science; IOP Publishing: Bristol, UK, 2017; Volume 61, p. 12124. [Google Scholar]
- Betti, R.; Yanev, B. Conditions of Suspension Bridge Cables: New York City Case Study. Transp. Res. Rec. 1999, 1654, 105–112. [Google Scholar] [CrossRef]
- Karanci, E.; Betti, R. Modeling Corrosion in Suspension Bridge Main Cables. II: Long-Term Corrosion and Remaining Strength. J. Bridge Eng. 2018, 23, 04018026. [Google Scholar] [CrossRef]
- Cho, K.H.; Jin, Y.H.; Kim, H.M.; Moon, H.; Koo, J.C.; Choi, H.R. Caterpillar-based cable climbing robot for inspection of suspension bridge hanger rope. In Proceedings of the 2013 IEEE International Conference on Automation Science and Engineering (CASE), Madison, WI, USA, 17–20 August 2013. [Google Scholar]
- Kim, S.-W.; Kim, N.-S. Dynamic characteristics of suspension bridge hanger cables using digital image processing. NDT E Int. 2013, 59, 25–33. [Google Scholar] [CrossRef]
- Wang, Y.; Li, K.; Chen, Y.; Xu, S.; Shou, W. Research on Non-Contact and Non-Fixed Cable Force Measurement Based on Smartphone. Appl. Sci. 2021, 11, 8902. [Google Scholar] [CrossRef]
- Xu, S.; Wang, J.; Shou, W.; Ngo, T.; Sadick, A.M.; Wang, X. Computer vision techniques in construction: A critical review. Arch. Comput. Methods Eng. 2020, 28, 3383–3397. [Google Scholar] [CrossRef]
- Hossain, I.; Sluszka, P. Suspension bridge cable replacement. In Proceedings of the IABSE Symposium Shanghai 2004, Shanghai, China, 22–24 September 2004. [Google Scholar]
- Sun, Z.; Ning, S.; Shen, Y. Failure investigation and replacement implementation of short suspenders in a suspension bridge. J. Bridge Eng. 2017, 22, 05017007. [Google Scholar] [CrossRef]
- Zhang, X.; Sun, B. Parametric study on the aerodynamic stability of a long-span suspension bridge. J. Wind Eng. Ind. Aerodyn. 2004, 92, 431–439. [Google Scholar] [CrossRef]
- Birdsall, B.; Celis, J. A bridge for the 21st century. Civ. Eng. 1997, 67, 68. [Google Scholar]
- Tan, H.; Yuan, S.; Xiao, R. The adjustment of datum strand of long span suspension bridges. China Railw. Sci. 2010, 31, 38–43. [Google Scholar]
- He, J.; Li, C.; Ke, H.; Liu, Y.; Zhang, Y.; Dong, C.; Li, H.; Zhang, Z. A Simplified Calculation Method of Length Adjustment of Datum Strand for the Main Cable with Small Sag. Adv. Civ. Eng. 2019, 2019, 6075893. [Google Scholar] [CrossRef]
Figure 1.
Photos of the field measurement method.

Figure 2.
Measurement principle of the conventional method.

Figure 3.
Measurement principle of the proposed method.

Figure 4.
Illustrations for conversion coefficient determination.

Figure 5.
Schematic diagram of transverse swing of cable strand.

Figure 6.
Schematic diagram of strand vibration in the vertical direction.

Figure 7.
Photos of plane torsion of the general cable strands.

Figure 8.
Schematic diagram of plane torsion of a cable strand.

Figure 9.
Schematic diagram of the camera motion.

Figure 10.
Schematic diagram of the spatial relationship between the camera and the optical target.

Figure 11.
Schematic diagram of image deflection caused by camera deflection.

Figure 12.
Optical targets appearing at different positions in the monitoring range due to camera shakings.
Figure 12.
Optical targets appearing at different positions in the monitoring range due to camera shakings.

Figure 13.
Vision-based system for relative sag measurement.

Figure 14.
Design of the optical target and the bracket.

Figure 15.
Integrated camera set used in this study.

Figure 16.
Screenshots of the visual monitoring software.

Figure 17.
The Oujiang Beikou Bridge: (a) a photo of Oujiang Beikou bridge under construction; (b) an image of the cross section of the main suspension cables.
Figure 17.
The Oujiang Beikou Bridge: (a) a photo of Oujiang Beikou bridge under construction; (b) an image of the cross section of the main suspension cables.

Figure 18.
Photos of on-site installation of the optical targets and the camera.

Figure 19.
Main settings for the software.

Figure 20.
Photos of cable strand temperature, angle, and height difference measurement.


Table 1.
Factors affecting the calculation of the cable height difference.
| Factors | Affected Variables/Process | Proposed Improvement | |
|---|---|---|---|
| Environmental factors | Changes in lighting | Adapt the camera exposure and other parameters to different lighting. | |
| Rain and fog | Avoid such measurement conditions. | ||
| Wind-induced strand shaking | Dynamically change the distance between the optical targets. | ||
| Wind-induced camera shaking | Dynamically change the distance between the optical targets. | ||
| Algorithms | Deep learning-based algorithm for target detection | Increase the video data for model training. | |
| Center fitting algorithm | Change algorithms. | ||
| Devices | Camera | Deploy cameras with higher resolutions. | |
| Camera lens | Deploy suitable lens. | ||
Table 2.
Summary of measurement errors caused by different types of strand shaking.
| Items | Type of Strand Motion | ||||||
|---|---|---|---|---|---|---|---|
| Transverse Swing | Vibration in the Elevation Direction | Plane Rotation | |||||
| Calculation formula | |||||||
| Parameters | , | , | , , | , , | , , | α = 15° | A = 30° |
| Maximum error (mm) | 6.67 | 0.27 | 3.11 | 1.44 | 0.72 | 6.81 | 26.79 |
Table 3.
Summary of measurement errors caused by wind-induced camera shaking.
| Items | Type of Camera Motion | ||||||
|---|---|---|---|---|---|---|---|
| Displacement (Longitudinal) | Displacement (Horizontal) | Displacement (Elevation) | Pitch Angle | Yaw Angle | Roll Angle | ||
| Equation | |||||||
| Parameters | Dcal = 55 m, Dcha = 100 mm, = 1 m | / | / | / | / | Dcen = 1.5 m, β = 45°, α = 5° | Dcen = 1 m, β = 80°, α = 5° |
| Maximum error (mm) | 1.82 | 88.41 | 11.39 | ||||
Table 4.
Specifications of the main hardware.
| Items | Products | Specifications |
|---|---|---|
| Camera |  MindVision (MV-SUF1200GC-T) | Image sensor: 1.1″CMOS Active picture element: 4096 × 3000 Frame rate: 23 fps Pixel bit depth: 12 bit |
| Lens |  Canon (EF 70–200 mm f/4L IS II USM) | Focal distance/iris: 70–200 mm f/4 Viewing angle: diagonal 34~12°, vertical 19°30′~7°, horizontal 29~10° Maximum diameter and length: 80 × 176 mm Weight: ≈780 g |
| Computer |  DJI (Manifold2-G) | CPU: Intel i7-8550U GPU: NVIDIA Jetson TX2 RAM: 8 GB 128 bit, DDR4 1333 MHz Dimension: 91 × 61 × 35 mm Weight: ≈230 g |
| AHRS IMU sensor |  Wit-motion (WT61CT) | Size: 51.3 × 36 × 15 mm Dimension: 2 Axis angle (Roll pitch) + 3 Axis acceleration + 3 Axis angular velocity +3 Axis magnetic field Acceleration range: ±16 g Angular velocity range: ±2000°/s Angle range: X ± 180°, Y ± 90° Attitude measurement stability: 0.05° |
| Wireless bridge |  TP-Link (TL-S5G-5KM) | Maximum transmission distance: 5 km Wireless rate: 867 Mbps Wireless standard: IEEE 802.11 a/n/ac Antenna coverage angle: horizontal 45°, vertical 30° Dimension: 224 × 79 × 60 mm |
Table 5.
Accuracy comparison of measurements between the visual measuring system and a caliper.
| The distance measured by the caliper (mm) | 601 | 702 | 800 | 900 | 1001 | 1099 | 1199 | 1300 |
| The distance measured by the measuring system (mm) | 601.46 | 702.9 | 801.59 | 901.61 | 1001.49 | 1100.86 | 1200.46 | 1301.17 |
| Error (mm) | 0.46 | 0.9 | 1.59 | 1.61 | 0.49 | 1.86 | 1.46 | 1.17 |
Table 6.
Measurement results of the caliper vs. the proposed measuring system.
| # | Strand No. | Deflection Angle (Clockwise) | Height Difference (mm) | Measurement of the Caliper (mm) | Calibrated Measurement of the Caliper (mm) | Measurement of the Proposed System (mm) | Measurement Error (mm) |
|---|---|---|---|---|---|---|---|
| 1 | Reference strand | 27.3° | 18.88 | 510.6 | 456.35 | 455.6 | −0.75 |
| General strand of No. 96 | 24.8° | 35.37 | |||||
| 2 | Reference strand | 28.8° | 18.90 | 1061.8 | 1009.24 | 1010.9 | 1.66 |
| General strand of No. 102 | 48.6° | 33.66 | |||||
| 3 | Reference strand | 27.4° | 18.88 | 1066.4 | 1014.92 | 1018 | 3.08 |
| General strand of No. 106 | 6.6° | 32.60 | |||||
| 4 | Reference strand | 27.0° | 18.87 | 1061.3 | 1007 | 1009.3 | 2.30 |
| General strand of No. 109 | 34.2° | 35.42 | |||||
| 5 | Reference strand | 9.0° | 17.64 | 1074.75 | 1025.74 | 1022.6 | −3.14 |
| General strand of No. 118 | 2° | 31.36 | |||||
| 6 | Reference strand | 9.0° | 17.64 | 950.1 | 896.96 | 897.3 | 0.34 |
| General strand of No. 122 | 32° | 35.5 |
Table 7.
Comparison between the traditional measuring method and the proposed measuring system.
| Aspects | Caliper | Proposed System | |
|---|---|---|---|
| Accuracy | Slight strand shaking | ≥1 mm | ≤1 mm |
| Moderate strand shaking | ≥5 mm | ≤3 mm | |
| Significant strand shaking | ≥10 mm | ≤3 mm | |
| Time cost of a single-strand measurement | ≥3 min | ≥2 min | |
| Required operators | ≥2 | 1 | |
Publisher’s Note: MDPI stays neutral with regard to jurisdictional claims in published maps and institutional affiliations. |
© 2022 by the authors. Licensee MDPI, Basel, Switzerland. This article is an open access article distributed under the terms and conditions of the Creative Commons Attribution (CC BY) license (https://creativecommons.org/licenses/by/4.0/).
Share and Cite
MDPI and ACS Style
Huang, C.; Wang, Y.; Xu, S.; Shou, W.; Peng, C.; Lv, D. Vision-Based Methods for Relative Sag Measurement of Suspension Bridge Cables. Buildings 2022, 12, 667. https://doi.org/10.3390/buildings12050667
AMA Style
Huang C, Wang Y, Xu S, Shou W, Peng C, Lv D. Vision-Based Methods for Relative Sag Measurement of Suspension Bridge Cables. Buildings. 2022; 12(5):667. https://doi.org/10.3390/buildings12050667
Chicago/Turabian StyleHuang, Can, Yongwei Wang, Shuyuan Xu, Wenchi Shou, Chengming Peng, and Danfeng Lv. 2022. "Vision-Based Methods for Relative Sag Measurement of Suspension Bridge Cables" Buildings 12, no. 5: 667. https://doi.org/10.3390/buildings12050667
Note that from the first issue of 2016, this journal uses article numbers instead of page numbers. See further details here.