1. Introduction
In real estate markets, there is a growing relevance and appreciation for Green Buildings, especially in EU countries where the greater part of residential buildings is built before the first regulations on energy performance.
The European directive 31/2010/UE was imposed on member states to lower the energy consumption of buildings and provided the first definition of nZEB building (“nearly Zero Energy Building”); in Italy, this directive was received with Legislative Decree 63/2013, then converted into Law 90 on 3 August 2013, according to which, from 1 January 2019, new buildings occupied by public administrations and owned by the latter must be nZEB, including school buildings; from 1 January 2021, the above provision is extended to all new buildings and buildings undergoing major renovations, therefore, both public and private buildings. Based on the most recent surveys, Italy registers a 15.86% nZEB share for new construction [
1].
Green Buildings have amply demonstrated to have not only lower energy bills but can improve indoor life and productivity, with their sustainable characteristics and design. All this determines, consequently, an increase in market value for buildings [
2].
Over time, the building energy performance has become an effective assets valuation tool, as demonstrated by regulatory innovations in many cities or countries.
In Europe, the Energy Performance Certification (EPC) for buildings was provided for by the European directives 2002/91/CE and 2006/32/CE. However, this application has different implications in each of the European Member States, as reported by Buildings Performance Institute Europe (BPIE) [
3,
4]. The energy label is mandatory in order to purchase/sell a property in some countries (e.g., Spain or Italy), while, in other countries, there is not this legislative obligation (e.g., among these: Czech Republic or Netherland, for example) [
5]. EPC may be based on a seven A–G ranks related to the energy classification system, with or without more subclasses (i.e., A and A+ as in Austria, Portugal and Ireland, for example [
6]), using non-renewable primary energy or not (kWh/m
2 year) or CO
2 emissions as indicators to build reference levels for energy ranking. Some countries—Denmark and Hungary—do not use any indicator to describe building energy performance.
Based on the latest references provided by ENEA [
7], in Italy, the buildings with high energy performance went from about 7% to 10% of the total in the period 2016–2019, thanks to the contribution of major renovations and new constructions; over 60% of the Italian housing stock is included in the least efficient energy classes (F–G) because it was mainly built between 1945 and 1972; new buildings represent only 3.4% of the Energy Performance Certificates (APE), and of these, more than 90% are of high energy performance (A–B). The non-residential sector, which accounts for 15% of the total APE, accounts for more than 50% of the certificates in the intermediate energy classes (C–D–E) and for more than 10% in the most efficient ones (A–B).
Several international experiences are focused on the topic of green premium for buildings, in terms of higher sale price for properties having better ecological characteristics and energy efficiency.
The growing interest in this theme is clear evidence that energy performance certification is an element having an increasingly greater weight in real estate investments.
The literature particularly recommends expanding the studies on real estate markets of mid-size cities and in marginal regions with low per capita output and income [
8].
The main aim of this work is to highlight how, through policies oriented towards sustainable practices, direct economic impacts can be achieved on real estate values and how, in some urban contexts, the “green premium” for buildings can be understood as a real “gold premium”.
Generally, sustainable interventions on buildings have economic impacts about two different premia: a technical-thermal premium in terms of better quality of indoor life and lower energy management costs and a market premium in terms of higher real estate value. Identifying and quantifying this latter aspect is particularly the main objective of the paper, to be pursued through the use of Evolutionary Polynomial Regression, a very innovative tool for analyzing real estate markets. In this sense, we also want to test the reliability and flexibility of using this innovative tool.
Existing buildings, built in a traditional way, use energy resources in an inefficient manner, and in their construction phases and management, produce waste, greenhouse gases and pollutants in large quantities. Green Buildings, unlike conventional buildings or “Brown Buildings”, as well as trying to use the energy resources efficiently and avoid an excessive land consumption, aim to preserve environmental resources, together improving the properties’ indoor life.
The definition of a “Green Building” has evolved over time. The U.S. Office of the Federal Environmental Executive (OFEE) defines it as “
the practice of (1) increasing the efficiency with which buildings and their sites use energy, water, and materials, and (2) reducing building impacts on human health and the environment, through better siting, design, construction, operation, maintenance, and removal—the complete building life cycle” [
9].
A Green Building is defined in a similar way by the Environmental Protection Agency (EPA): “
the practice of creating structures and using processes that are environmentally responsible and resource-efficient throughout a building’s life-cycle from siting to design, construction, operation, maintenance, renovation and deconstruction. This practice expands and complements the classical building design concerns of economy, utility, durability, and comfort. Green building is also known as a sustainable or ‘high performance’ building” [
10].
The two above definitions refer to the concept of Life Cycle Assessment (LCA), which considers and values the impacts of a service or product under all the aspects (social, economic and environmental). LCA verifies whether a service or product used in a Green Building is truly green, taking into account solid waste generated in its phases of industrial production, exercise and final disposal; in other terms, it considers a wide range of environmental impacts, without even neglecting the issues related to global warming or water and air pollution associated with the service/product considered.
This article first highlights the main scientific literature about the impact of Energy Performance Certificate on real estate values, with exclusive reference to those papers which implemented market analysis using Hedonic Price Models (HPM). Afterwards,
Section 3 delivers the methodological structure of Evolutionary Polynomial Regression. In
Section 4, this tool was applied for the city of Reggio Calabria (Italy) in order to detect the market premium for Green Buildings.
Section 5 contains some final reflections about the topic and a summary of the results.
2. Literature Review
As already mentioned, Green Buildings generate a whole-family benefits in terms of possible government incentives or tax deductions, better quality life and productivity, lower management costs, as many international researches suggest [
11,
12,
13,
14,
15].
Partial equilibrium models have been adopted in these studies about real estate markets to analyze the short-term effects on the properties’ rental rate considering architectural and technical features characteristics, among which the energy and ecological values added.
The increase in the demand curve for Green Buildings is demonstrated to the fact that if higher initial building costs for better ecological and family benefits are supported, this causes a consequent decline in demand for “brown” buildings (alternatives to formers).
These works assume that a “rent market premium” in the long-term exist related to innovations in order to favor the effectiveness of green measures and to reduce the ecological costs of building projects and preferences and behaviors tending to maintain adequate standards for the technological characteristics involved. A further “market premium on the sale price” is derived for Green Buildings by the combination of two factors: higher rent obtainable due to the better appeal of these buildings and the higher effect of intrinsic characteristics on real estate values (mainly due to lower risk for “negative premium” from the real estate market if this latter discloses a growing tend toward green buildings at the expense of existing non-green buildings; lower risk of future and possible carbon taxes; adaptation, in advance, to future and possible new environmental laws and regulations; lower management costs as those related to energy).
The EPC rating is one the most common information currently reported in every real estate advertisement, providing a description of building’s energy performance mandatory by law. Because of this, many studies started to investigate whether and/or how much this information influences the choices in real estate markets.
Hedonic Price Models are the most suitable tools to analyze the EPC’s impact on real estate values, in this direction a review of the literature was performed for European countries [
16]. The main study cases refer to residential and commercial markets.
Looking far back in time, interest for energy efficiency and environmental awareness developed with the increase over time in hydrocarbons’ prices: Johnson and Kaserman [
17], Laquatra [
18], Longstreth [
19], Dinan and Miranowski [
20] and Longstreth et al. [
21] all tried to implement hedonic price models including among the real estate attributes as an energy variable. After these pioneering works, only in 2011 did studies start investigating the effect of “green” labels on commercial buildings such as ENERGY STAR and LEED [
15]. For example, for downtown Chicago, Dermisi and McDonald [
22] highlighted that only the LEED-certified properties sold for a 23% price premium, while an Energy Star certification had no influence on real estate sale prices.
About more recent studies, in 2011, Brounen and Kok [
23] highlighted for the Dutch residential market the appreciation of EPC in terms of faster time sales and increasing price. In 2012, Kok and Jennen [
24] investigate on the EPC’s effect on sale prices for Dutch cities, they highlighted that green office building rents were 6.5% higher with respect to those with lower EPCs by analyzing about 1100 rental transactions. Cajias and Piazolo [
25] applied in 2013 a hedonic model to verify in Germany the relationship among sales and rentals in consequence of EPC: buildings with best energy classes (B, C and D) were rented more than the worst G-ranked buildings; similar results were confirmed for real estate sales (+32.8% in real estate values for buildings with low energy consumption). Also in 2013, for single-family homes in Sweden, Högberg [
26] verified through 1073 real estate data a growing real estate prices when the energy class increases.
A report published in 2013 by the Directorate-General for Energy of European Community collected various studies referred to several European cities or countries (Austria, Belgium, France, England, Ireland) to elevate the EPC’s effect on properties values [
27]. This report highlighted that the EPC’s impact on properties prices is often influenced from the time this certification was already mandatory in the countries analyzed: a significant effect on real estate values did exist where the EPC was a consolidated practice, while the influence of EPC was ineffective in those countries where the rule application was recent. Concluding, for all countries considered, the real estate values increase in correspondence to higher energy rankings.
In Ireland, Hyland et al. [
28] detected in 2013 that A-ranked energy efficiency properties registered a rental price premium of about 2% and a sale price premium of 9%, if compared to D-ranked energy class. In addition, they highlighted that the scarcity of monetary resources to perform renovation interventions, determines for buildings that not require further investment on energy retrofitting a preference in the real estate market.
In Portugal, Ramos et al. [
29] showed in 2014 that real estate units with better EPCranking (A, B, C), if compared with D-rank ones, were characterized by a 5.9% higher unitary price. A reduction of 4% in real estate prices was recorded for properties with low energy rankings (E, F, G). Subsequently, Evangelista et al. [
30] confirmed in 2019 the results of Ramos et al. [
29] for Portugal, with higher values of EPC appreciation (properties with A and B energy classes recorded a green premium of 12.5% for existing buildings and 13.1% for new buildings).
Studies in 2015 and 2016 developed by Fuerst et al. in U.K. [
31,
32] found a relationship between energy performance rankings and sale prices. Compared to D-rank properties, buildings with A- and B-rank recorded a 5% market premium, C-rank buildings recorded a 1.8% market premium, while buildings with lower energy classes (F, E, G) recorded a 1–7% reduction in sale prices [
32].
For cultural aspects and, perhaps, for certainly milder climatic conditions, in Southern European countries, the EPC’s impact on real estate prices is a topic on which little has been investigated.
Investigating on the premium price of dwellings with high energy rankings (A, B, C and D classes) in 2016, De Ayala et al. [
33] detected in Spain a premium price for these real estate goods ranging between 5.4% and 9.8% compared to the less efficient ones. Also in Spain (Barcelona) in 2016, Marmolejo [
34] highlighted a low effect on real estate prices, due to the fact that energy retrofitting upgrading costs are not sufficiently recuperable by sellers. Italian experiences are mainly attributable to Fregonara et al. [
35] in 2017 and Bottero et al. [
36] in 2018, evaluating the EPC’s impact in the residential real estate market of Turin (Italy) through hedonic models. Their results suggested that, also in Italy, a significant appreciation for green buildings exists. Marmolejo and Chen [
37,
38] recurred to a spatial hedonic model detecting a significant increase in real estate prices related to the EPC ranking and how, in 2019, this economic impact varies in different housing segments in Barcelona: for more recent buildings the energy class does not have a significant impact on their prices, but they are instead relevant for all other properties. Again, Taltavull et al. [
39] assessed in 2019 the green premium for buildings in the province of Alicante (Spain) in correspondence to various climate zones. In line with this latter study, and with reference to the metropolitan areas of Barcelona, Valencia and Alicante, Marmolejo and Chen [
40] found in 2019 that the impact of energy performance was higher a scarcity of efficient homes in local real estate markets was evident.
In any case, it should be noted that some studies have shown no positive relationship between real estate prices and energy class. This because EPC is often used as “proxy” variable to include in it the impacts of more and omitted real estate characteristics. Among these studies, in 2017, Olaussen et al. [
41] highlighted in Norway the possibility that energy efficiency may incorporate the effect of construction quality variable. In addition, Cerin et al. [
42], analyzing 67,559 real estate transactions in Sweden in the time period 2009–2010, recorded a negative relationship among energy label and real estate prices, likely for the lack of an EPC classification reference value. However, the latter study is conflicting with the study of Högberg [
26] that, for the same time period, verified in Stockholm a positive impact of better energy class in the property market.
The literature review confirms and recognizes that a market premium for buildings’ green characteristics does exist. Hedonic price models have a higher degree of reliability and completeness. Certainly, the consumers’ choices in building energy performance vary depending on location, economic factors, real estate stock, time and variation in climate zones.
3. Materials and Method: Evolutionary Polynomial Regression
Evolutionary Polynomial Regression (EPR) is a data-driven hybrid technique, where genetic programming is combined with numerical regression to develop flexible mathematical models, suitable for multiple application purposes.
The EPR approach overcomes the main limits of so-called “black-box” data-driven models. Often, the latter can be difficult to build or understood, or in other cases, they need many data that are difficult to be quantified or find. For example, artificial neural networks or genetic algorithms are effective to reproduce databases related to some observed phenomenon but have obvious limits in the model structure identification and overfitting. Instead, the stepwise regression is generalized in EPR by considering non-linear model components, although, with respect to regression parameters, these components are linear.
From this point of view, EPR is similar to non-linear global stepwise regression, since mathematical expressions of optimal models are searched taking into account a full set of available formulas by leveraging flexible modifications of the original mathematical structures. Some general expressions of EPR models can be represented as follows: in particular, they are “pseudo-polynomial” expressions because the parameters can be calculated as for a linear problem or for polynomial forms [
43,
44]:
In the above equations, Ŷ represents the vector of model predictions, m is the number of additive terms, the parameter aj to be assessed is determined by a least squares (LS) method, Xk is candidate explanatory variables, the exponent (j, l) with l = (1, …, 2k) is the exponent of the l-th input within the k-th term (the exponents are chosen among candidate values, real numbers, which should include the value 0) and, at last, the function f is selected among a set of possible alternatives and may be exponential, tangent hyperbolic, natural logarithmic or others. Note that structure of Equation (4) requires the assumption that function g is invertible, due to the subsequent step of parameter estimation.
The LS method has the advantage of relating the “pseudo-polynomial” structure of the model with its coefficients; furthermore, it is possible to impose the LS to find for mathematical structures that only contain positive coefficients aj in particular modeling systems, where negative coefficient values are often used to balance the realization of specific errors related to the finite training dataset [
45,
46].
The structure of the model is searched by exploring the combinatorial space of exponents to be assigned to each candidate input. Any real number could be chosen as exponent values; however, they are coded as integers during the search procedure. Genetic algorithms and iterative implementation of LS method allow searching for EPR the statistically better function expressions that link the possible combinations of vectors of the explanatory variables (i.e., real estate characters) to the dependent variable (i.e., property sale price). Note that for EPR method implementation, an exogenous definition of the mathematical expression and a minimum number of parameters to fit the dataset in the best way are not required, since the optimal solution is directly provided by an iterative process related to genetic algorithm.
Two main phases characterize EPR: identification of the model structure by generating a set of polynomial expressions and traditional regression method to estimate the polynomial coefficients. At the basis of the algorithm used, there is the idea of generating a population of functional expressions considering their capacity to adapt to the available data. For this reason, the algorithm of EPR finds both the functional forms of the model and the values of the polynomial coefficients. All this without the identification a priori of a specific functional expression or with several inputs of the model, namely, the parameters and the exponents, preliminarily defined at the first stage of the method implementation.
The Coefficient of Determination (COD) allows us to check the statistical accuracy of each model provided by the EPR implementation, ranging between 0 and 1:
where
yestimated is the dependent variable value assessed by EPR,
ydetected is the collected values of the dependent variable and
N is the dataset size. The model statistical accuracy is greater when the COD is close to the value 1.
A more recent version of EPR exploits Multi-Objective Genetic Algorithms (MOGA) to identify those models which maximize accuracy of data and parsimony of mathematical expressions simultaneously [
47]. Then, EPR-MOGA provides an expression set with several accuracy to experimental data and different complexity degree of mathematical structure of models. The trade-off between accuracy and complexity allows an optimization strategy leading to a range of model solutions, among which the user could select the most appropriate one according to the specific requirements of interest and typology of experimental data considered.
The genetic algorithm underlying EPR-MOGA carries out a multi-objective optimization strategy based on the Pareto dominance criterion. These objectives aim to maximize the model accuracy with appropriate statistical criteria for verification of the model equation, maximization of the model’s parsimony considering the minimization of the number of terms of the model equation and reduction in the model complexity by minimization of the number of explanatory variables in the model equation.
4. Discussion and Results
The aim of the case study is to highlight the capabilities of EPR-MOGA as an analysis tool and particularly to detect the market real estate premium for green buildings characterized by the higher degree of energy efficiency. Firstly, this application should demonstrate that EPR-MOGA is significantly helpful as a tool for data modeling and analysis; secondly, EPR-MOGA is tested on a wide real estate dataset aimed at determining the relationship between the selling price and a set of real estate characteristics influencing it (among them, the energy class of the building/residential unit).
To highlight the impact of Green Buildings in marginal economic regions, the case study examines a mid-size real estate market related to a non-metropolitan city (Reggio Calabria, about 180,000 inhabitants). In particular, for some its semi-central neighborhoods, EPR implementation involved a real estate market segment of newly built residential buildings. All features are unexplored so far in the real estate market analysis of Green Buildings.
The analysis concerns a sample of 515 residential properties located in the urban central area of Reggio Calabria (Southern Italy) and detected over 25 years. Only 24 are Green Buildings (energy class equal to A or B), but the data are not insignificant; on the contrary, it makes the research even more significant taking into account that the market for green buildings is practically in its infancy for the city of Reggio Calabria. Most of the observation of green buildings are located in zone 6, i.e., in a semi-peripheral area of a suburban district (see
Table 1). This avoids any effects related to the context. We also excluded any possible interference due to the characteristic of its panoramic character.
Given the lack of transparency in the Italian real estate market, the methodology used in the research has provided data collection through the difficult and complex process of “elicitation”, that is, the confidential confession of information to the researchers from: the direct actors (buyers, especially, and sellers), operators (promoters), intermediaries (realtors and agencies) and by notaries.
The quality and build type are the same for all sampled real estate units (apartments located in used multi-story buildings), and the central area of interest is homogeneous under the points of view regarding the qualification and distribution of main urban services. About the sample, georeferencing procedures have been used to verify the “Zone” variable to facilitate and support data building. For this purpose, with WebGIS tools, the data collection is facilitated by the fact that the geodatabase makes available, in a coordinated way and continuously, every real estate document specifically relating to each property, with further possibilities to integrate the information systems [
48,
49].
In
Table 1, the variables considered are described, their acronyms given, their typologies provided (cardinal, ordinal or dummy) and the description and measurement units specified.
Table 2 reports the statistical description of real estate variables.
EPR-MOGA methodology is iteratively implemented for the real estate sample by considering the structure of the generic expression as reported in the mentioned equation (1) without the function (f). Each additive monomial term of the mathematical expression is assumed to be a combination of the input variables raised to the proper numerical exponents. The candidate exponents selected from the research belong to the set (0; 0.5; 1; 2), and the maximum number l of additive terms in the final expressions is assumed to be 5. The implementation of the econometric technique for the real estate sample considered has generated several models. The optimal model to be analyzed for highlighting the relationship between the real estate characteristics and the selling price has been selected according to the statistical performance level, the complexity of the algebraic expressions and the coherence of the coefficients’ signs under an empiric profile. The first two aspects are resolved through the COD associated by EPR-MOGA with each model, and the mathematical form is visible in the quantity of the terms of the equation and in the combination of the variables in each term. The empirical coherence of the functional relationships between the explanatory variables in each model and the selling price, is a less immediate operation with some complex aspects related to the presence of more variables combined in the terms of the equation and/or they occur repeated more times.
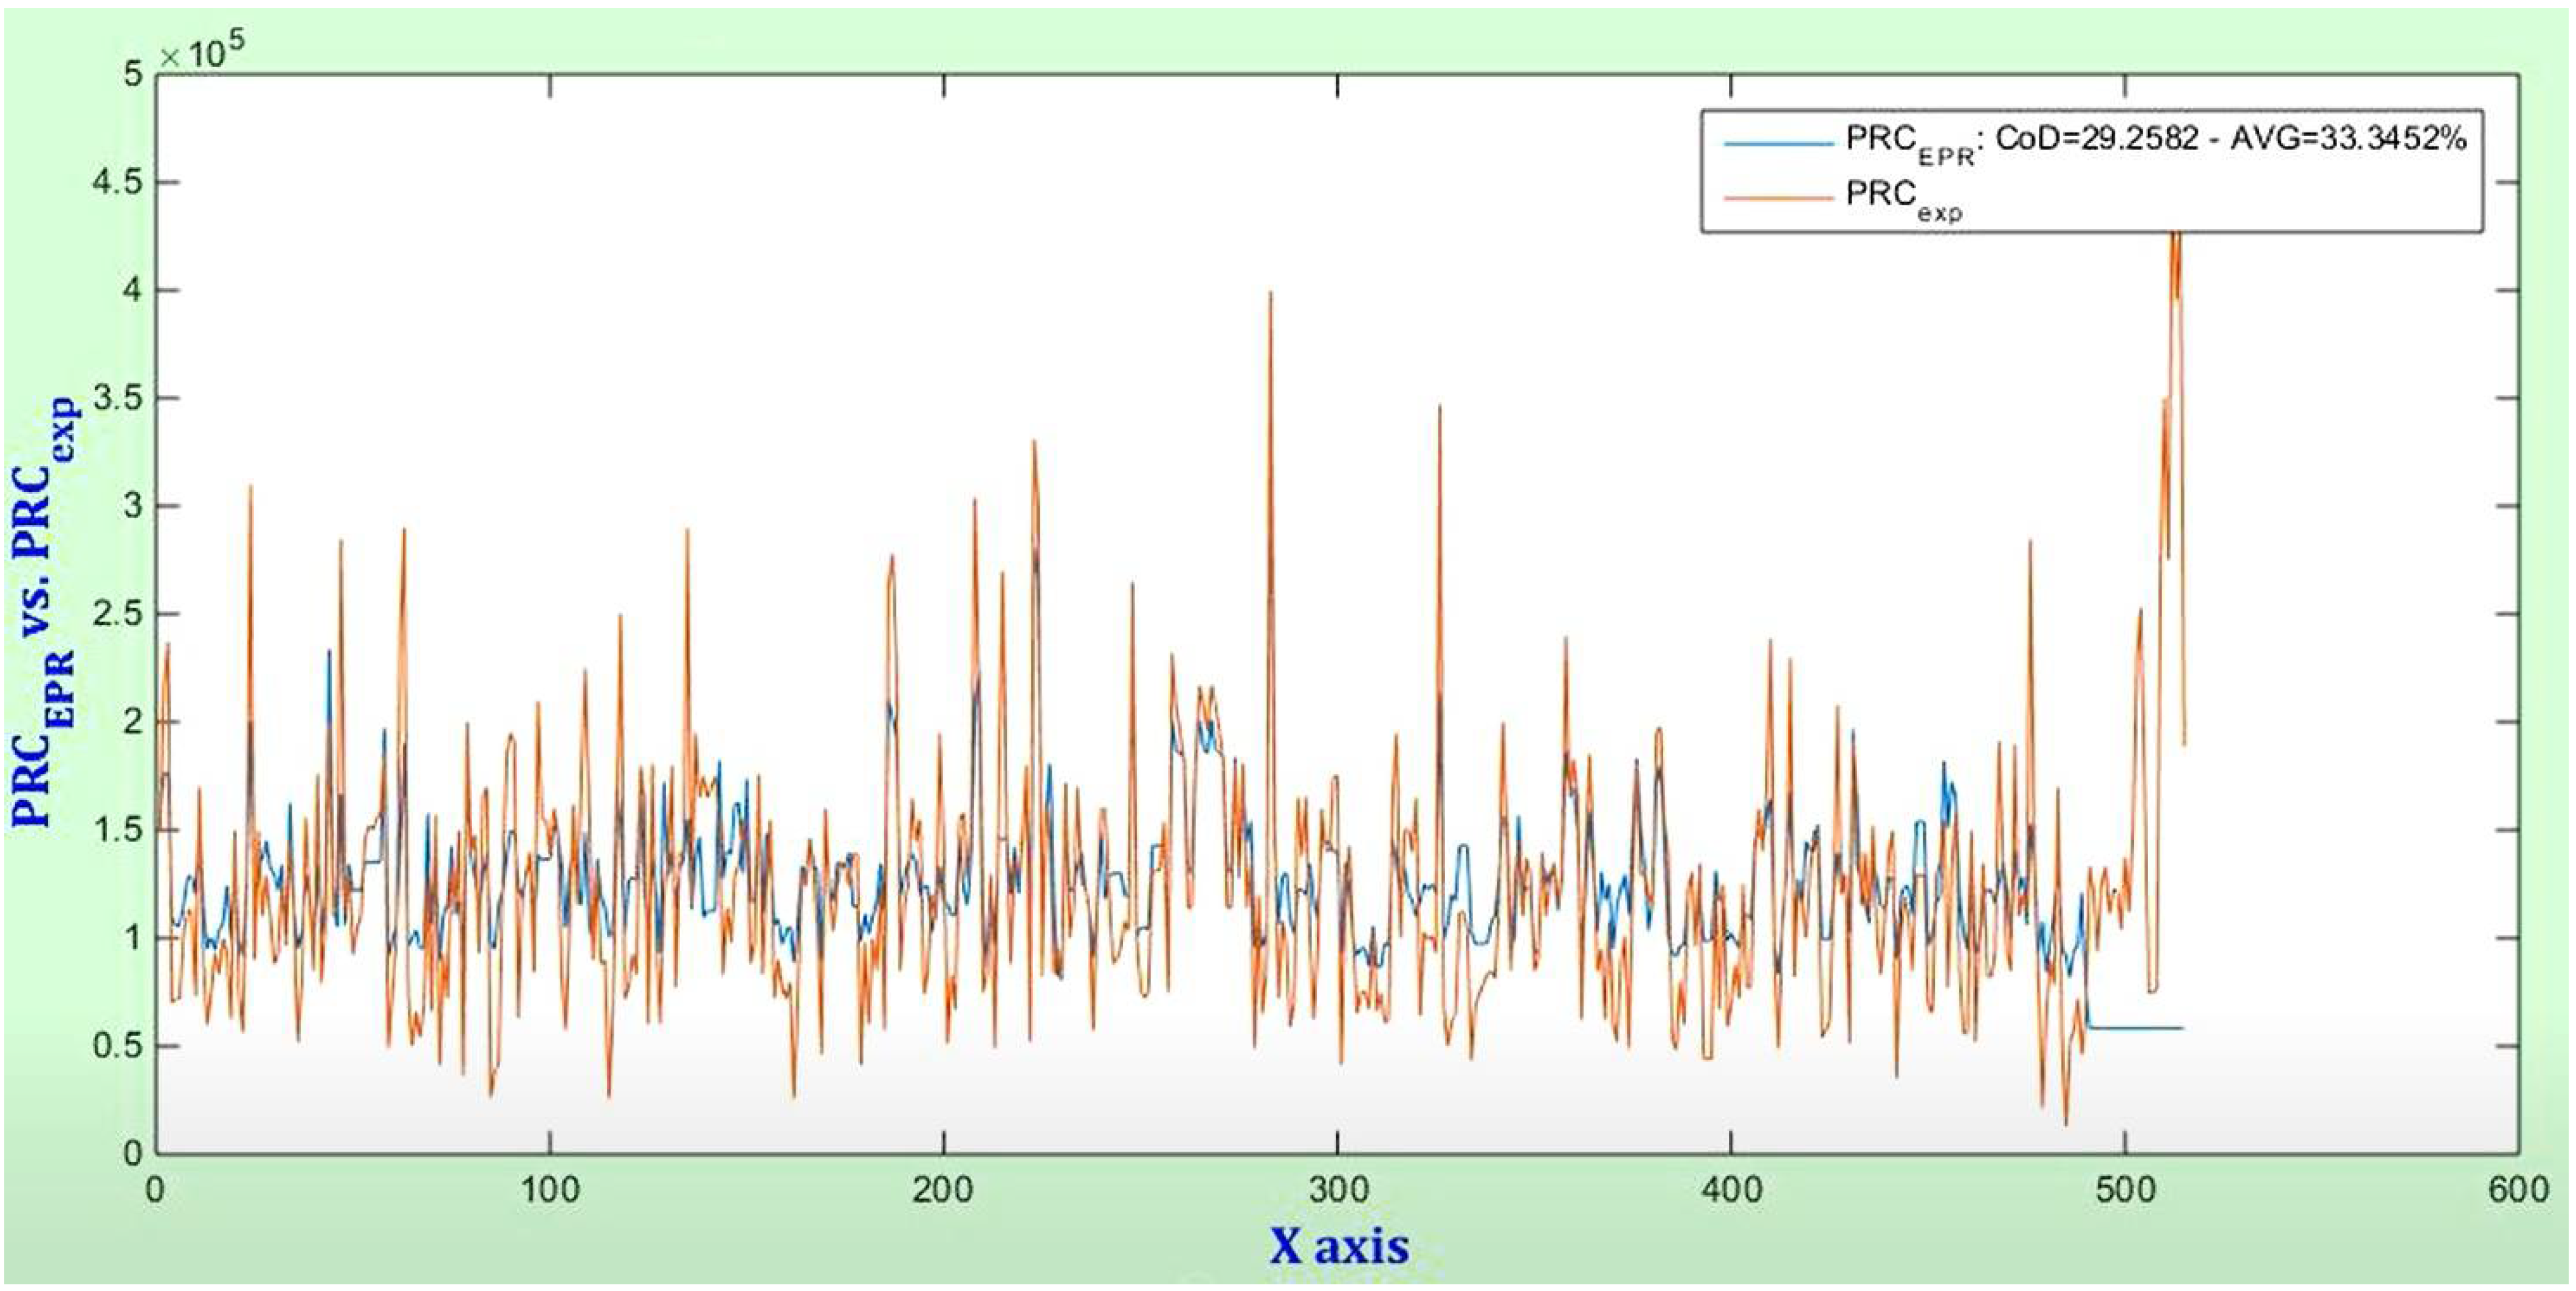
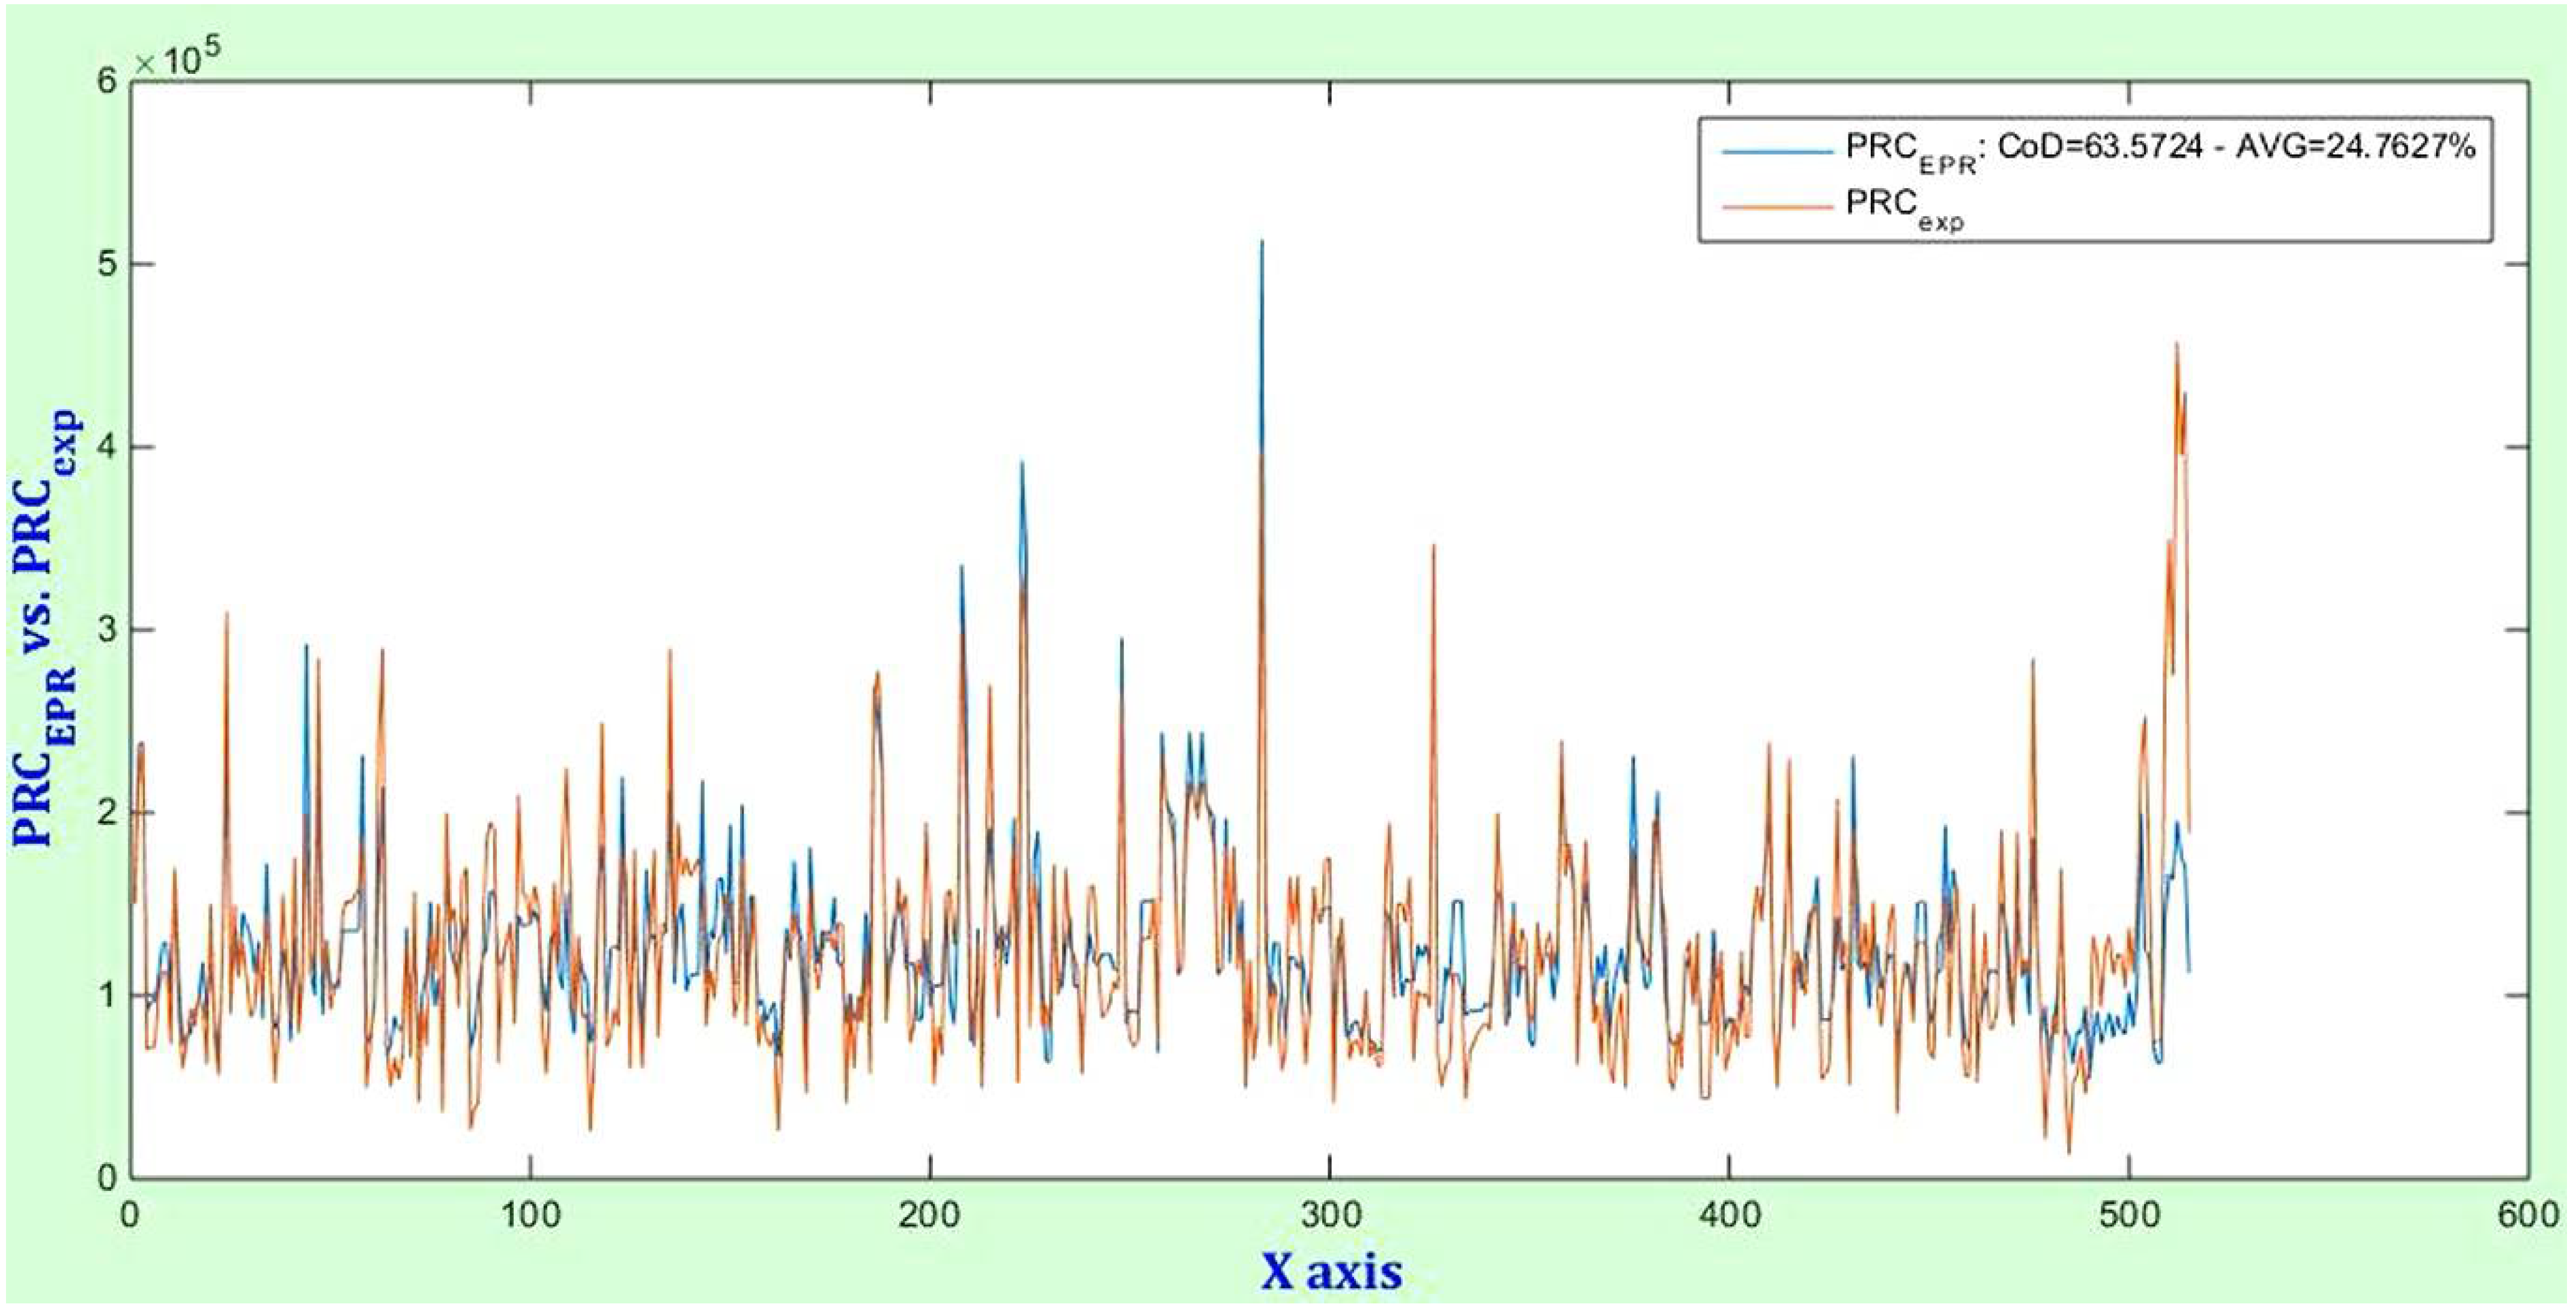
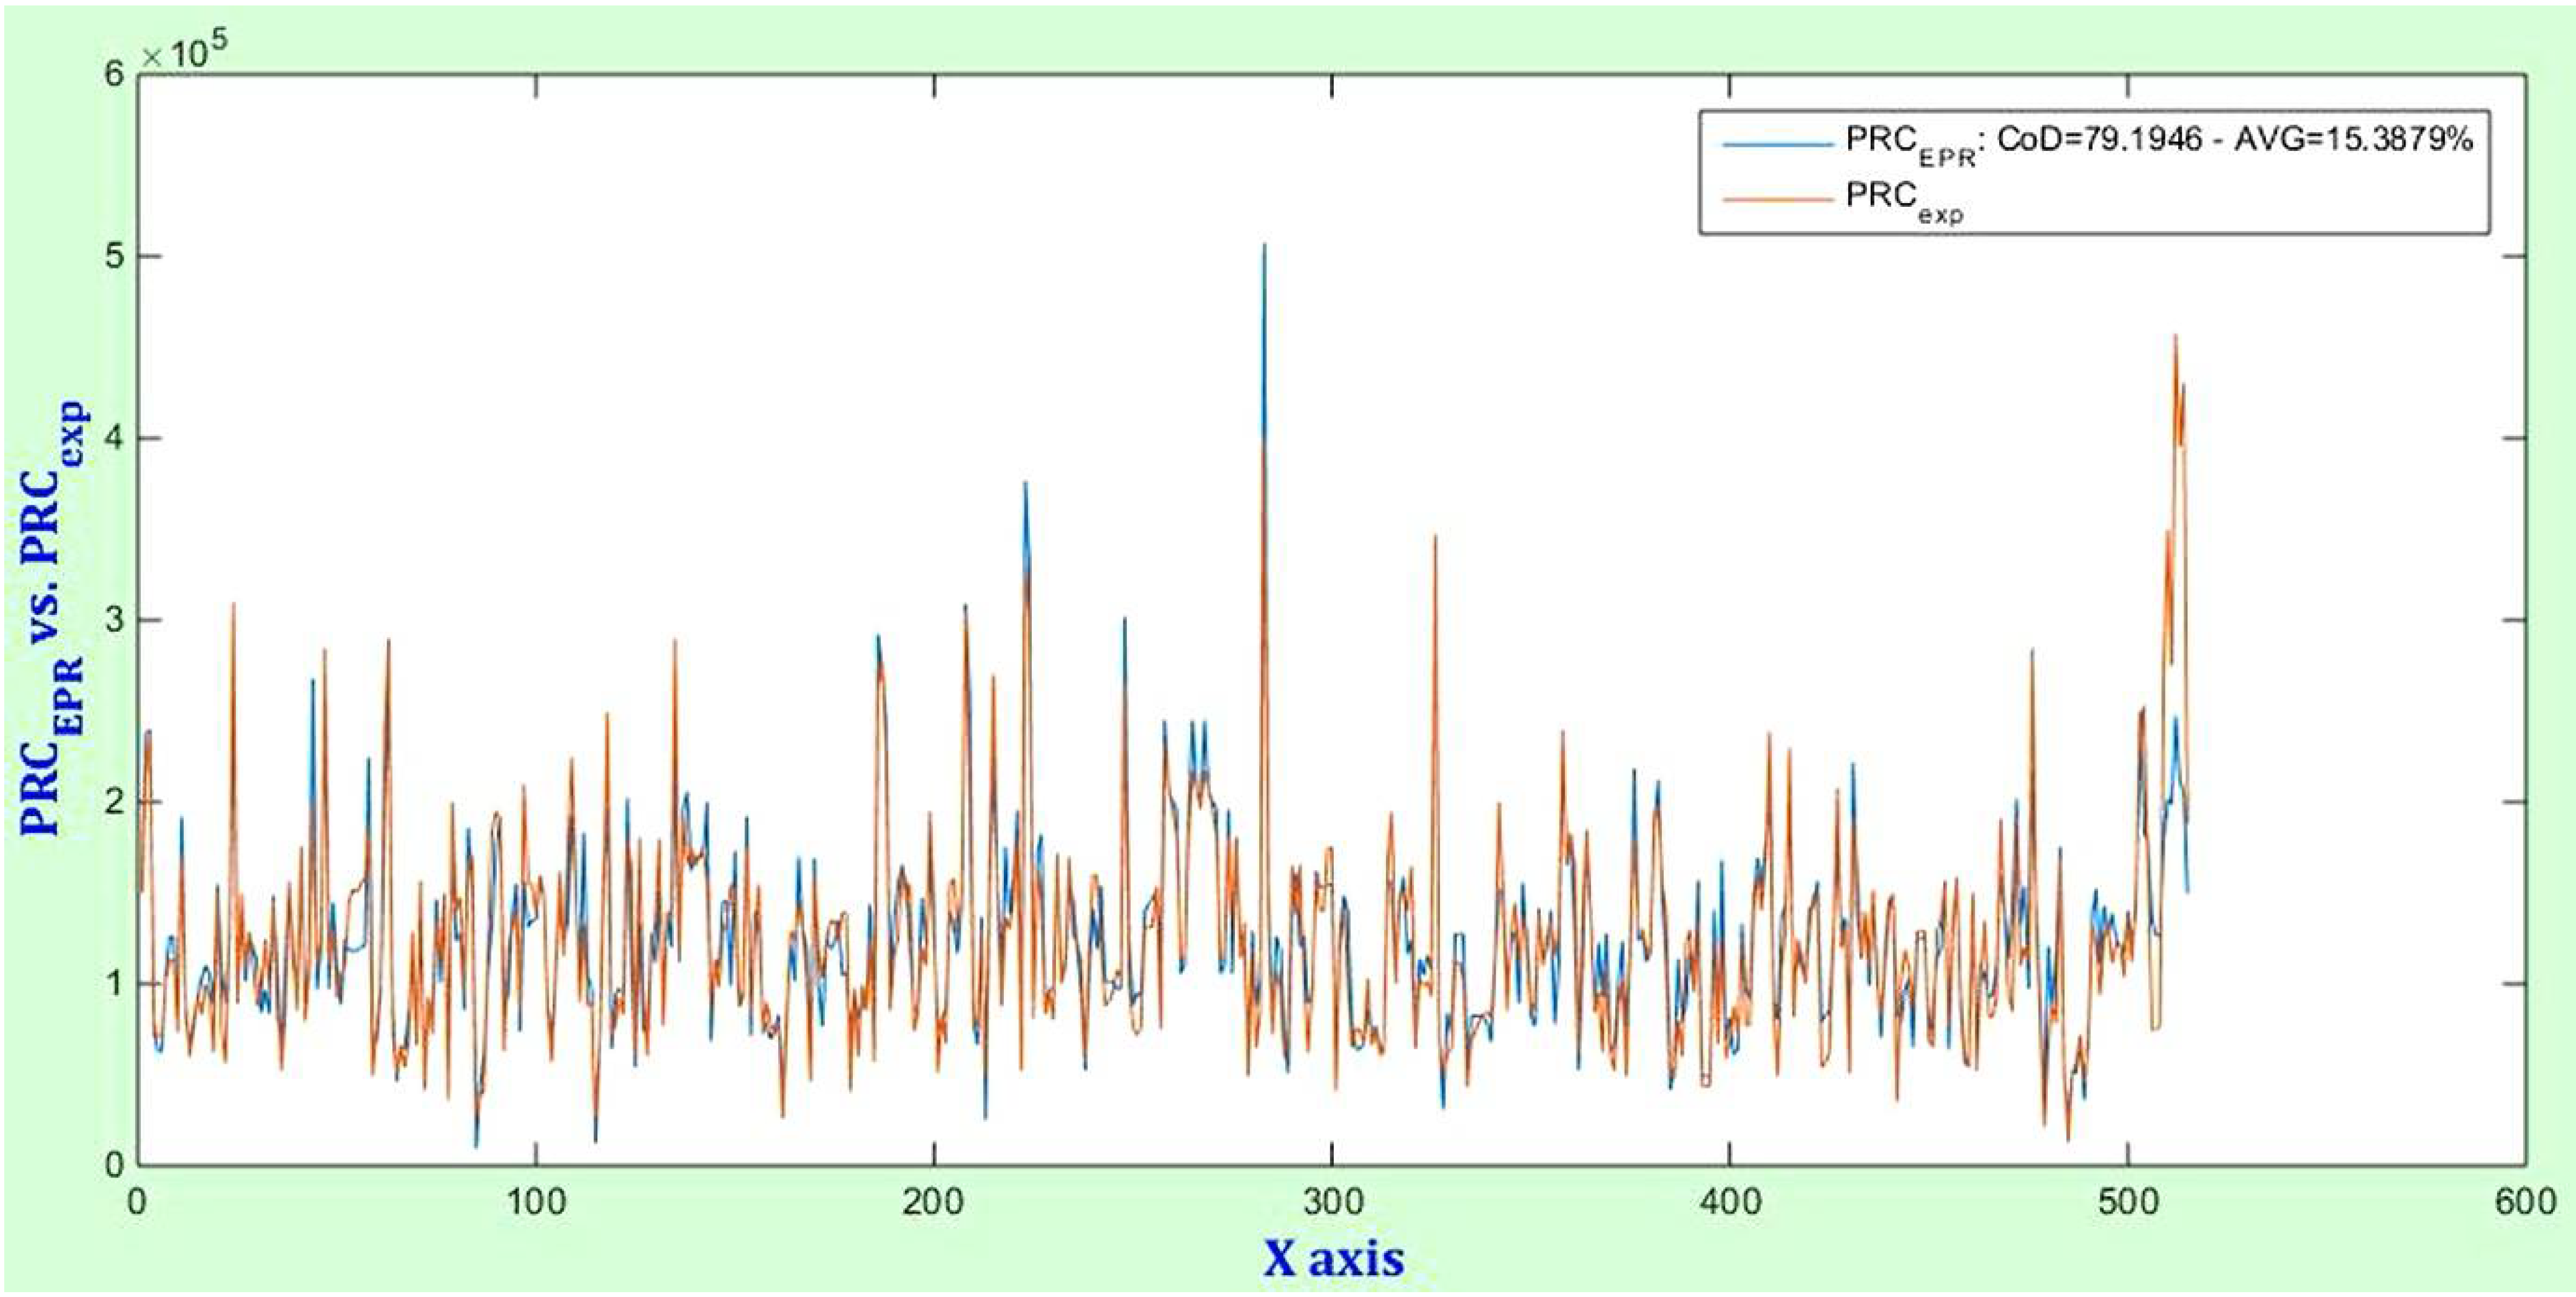
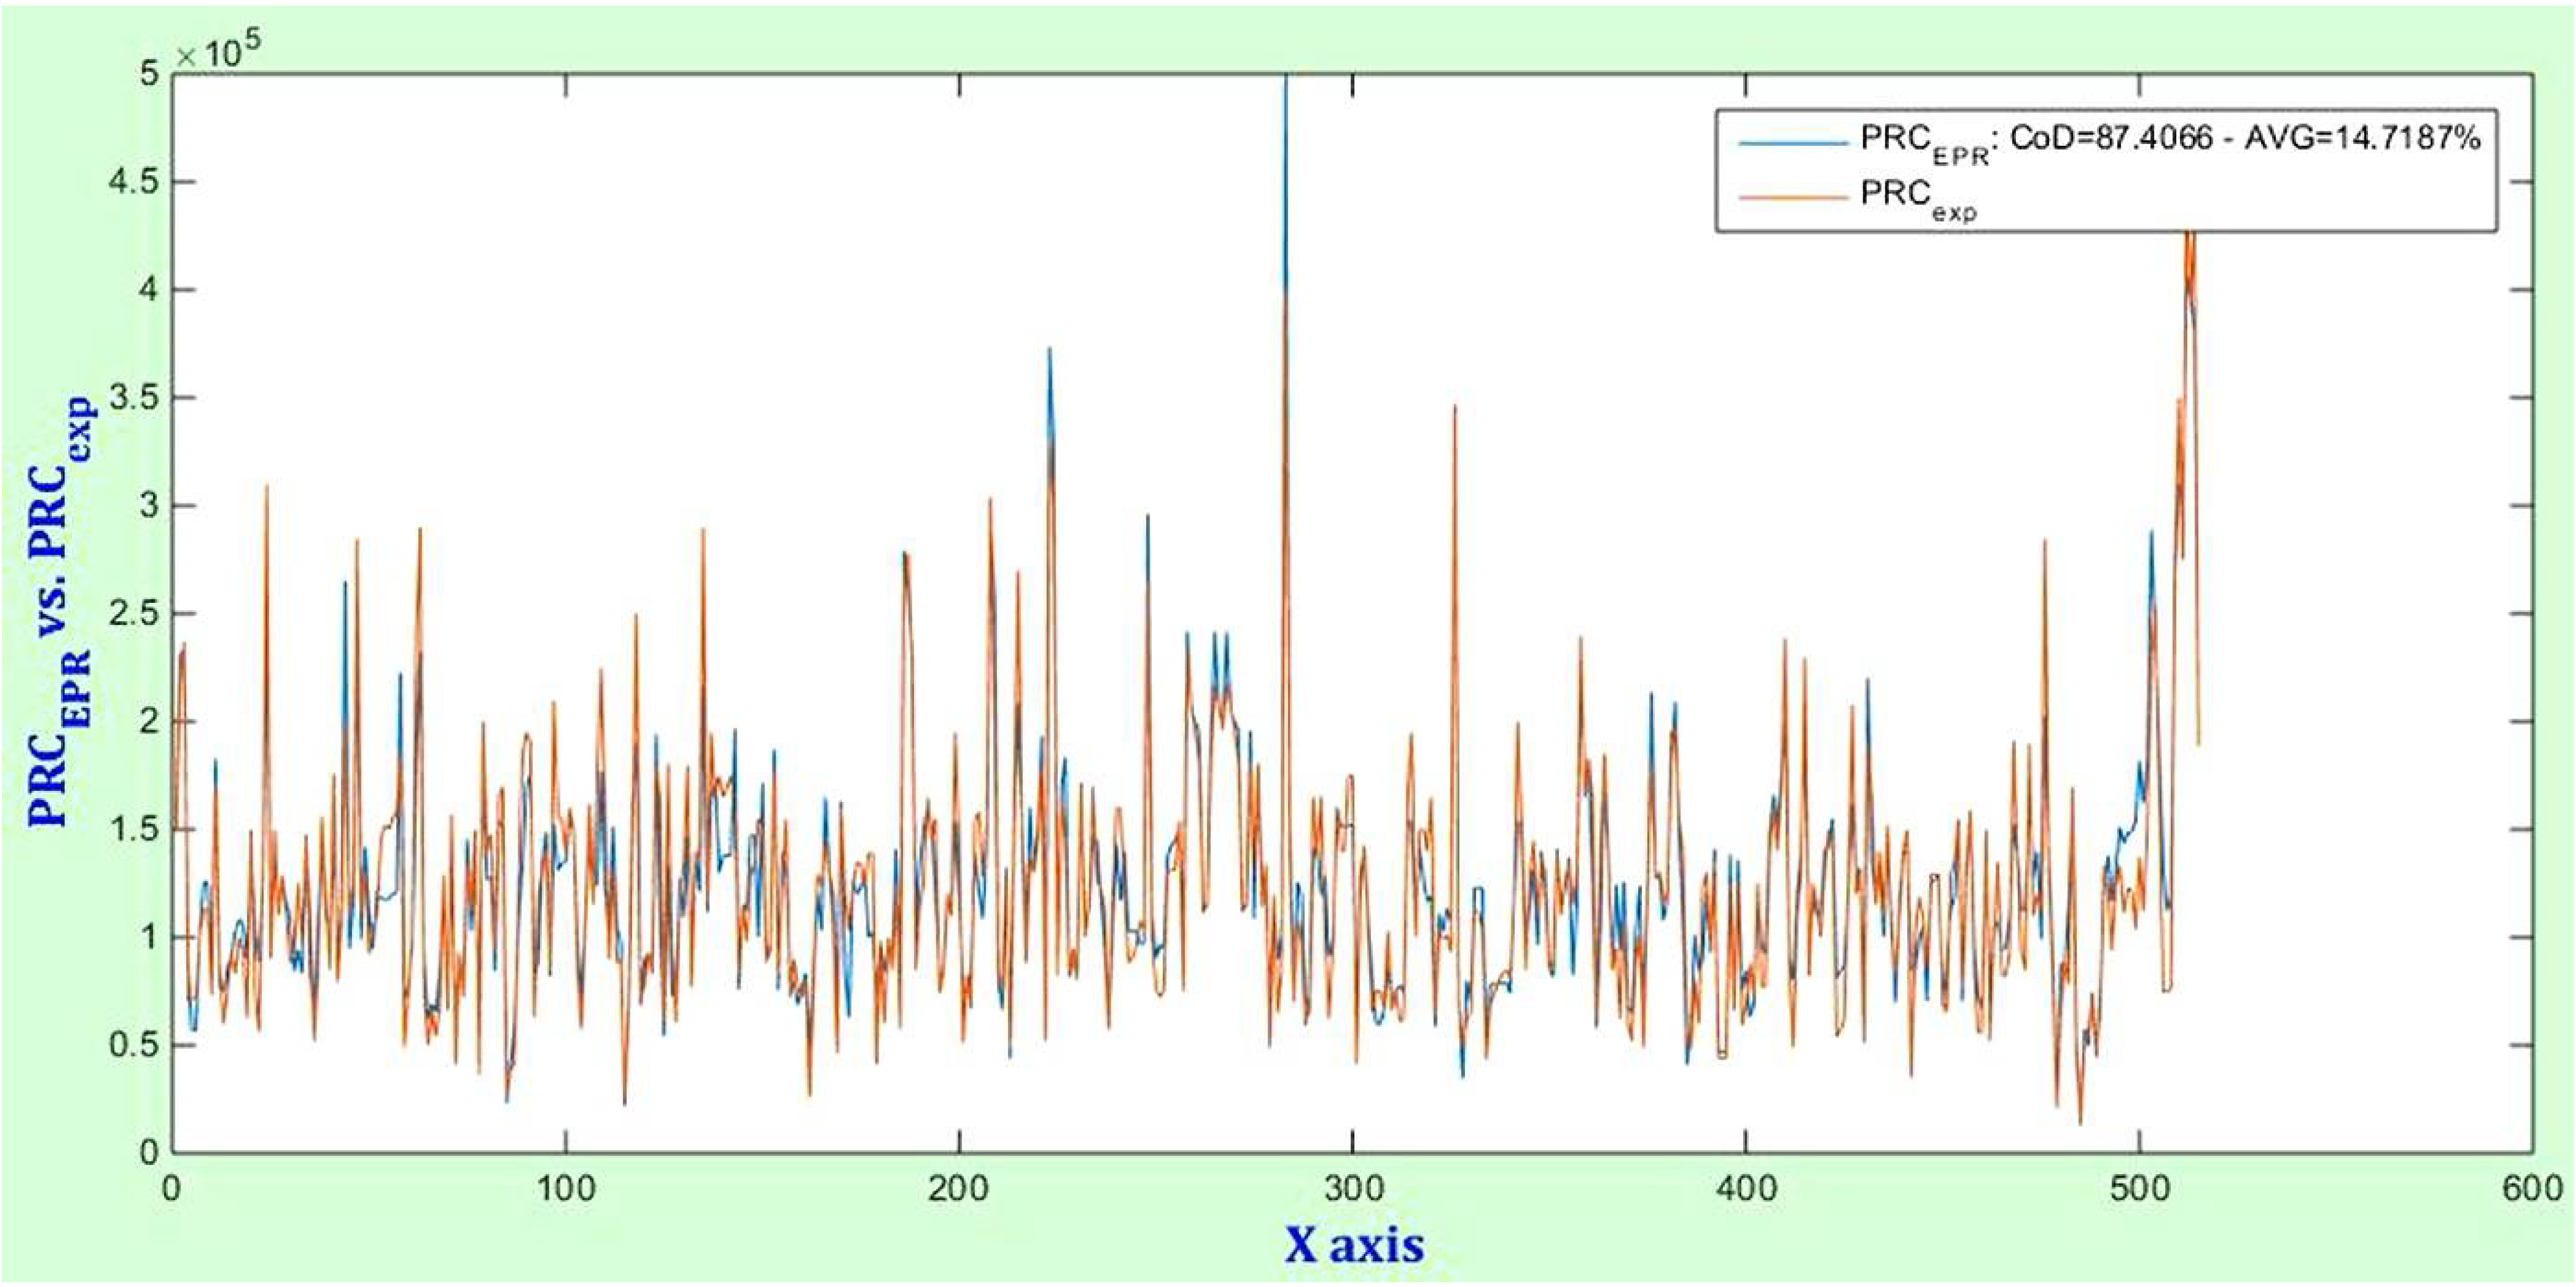
The application of EPR-MOGA has generated five equations (
Table 3) classified—from the first to the fifth—according to the increasing statistical accuracy of the outputs in terms of COD and to the complexity of the models in relation to the number of terms, the number of selected explanatory variables and the combination of the explanatory variables that constitute each term.
The models selected by EPR-MOGA are characterized by a different algebraic form complexity, with COD ranging from about 29% to about 91%. Then, under the point of view of statistical performance indicator associated by EPR-MOGA, for some models, there is a high statistical reliability in terms of the coherence of the detected data (models IV and V).
The reliability of the model chosen is checked by another calculated statistical index, i.e., the absolute percentage mean error which takes into account all the percentage errors measured for each detected prices respect to corresponding values estimated through the model.
Interpreting the results, the only use of the statistical criterion would lead to choose equation V (see
Table 3) as the model that better replicate the analyzed phenomenon, as it is characterized by a COD next to unity and, therefore, by a very high degree of statistical reliability. This model consists of all the explanatory variables considered, with exception of “AGE” variable (
Table 4). This is because the property’s age for the various real estate sampled is sufficiently overlapping.
Table 4 shows, for each model, the variables selected by EPR-MOGA reputed as the most relevant on the real estate sale prices. Regarding this aspect, it should be pointed out that the internal area, maintenance status, positional variable and the number of bathrooms are included in all models, whereas the property age variable is not included in any model. The energy class variable is relevant in three of the five models.
Note that the complexity of the terms of the mathematical expression V does not allow an immediate interpretation of the functional relationships among the explanatory variables. For this reason, the functional links of the i-th independent explanatory variable with the variation in the selling prices has been explained through an exogenous simplified approach that, instead of determining the partial derivative of the dependent variable with respect to the i-th variable, considers the values of the other variables in the model equal to their average values of the starting database and provides the analysis of the variations in value of the assessed changes of selling prices in correspondence to each i-th variable in the admissible range of its corresponding sample values.
Among the main objectives is that of highlighting the impact of the variable energy class, whose presence, in the model with greater statistical reliability, determines a variation of 41.52%. Confirming the significant weight that this variable assumes in valorization of residential properties.
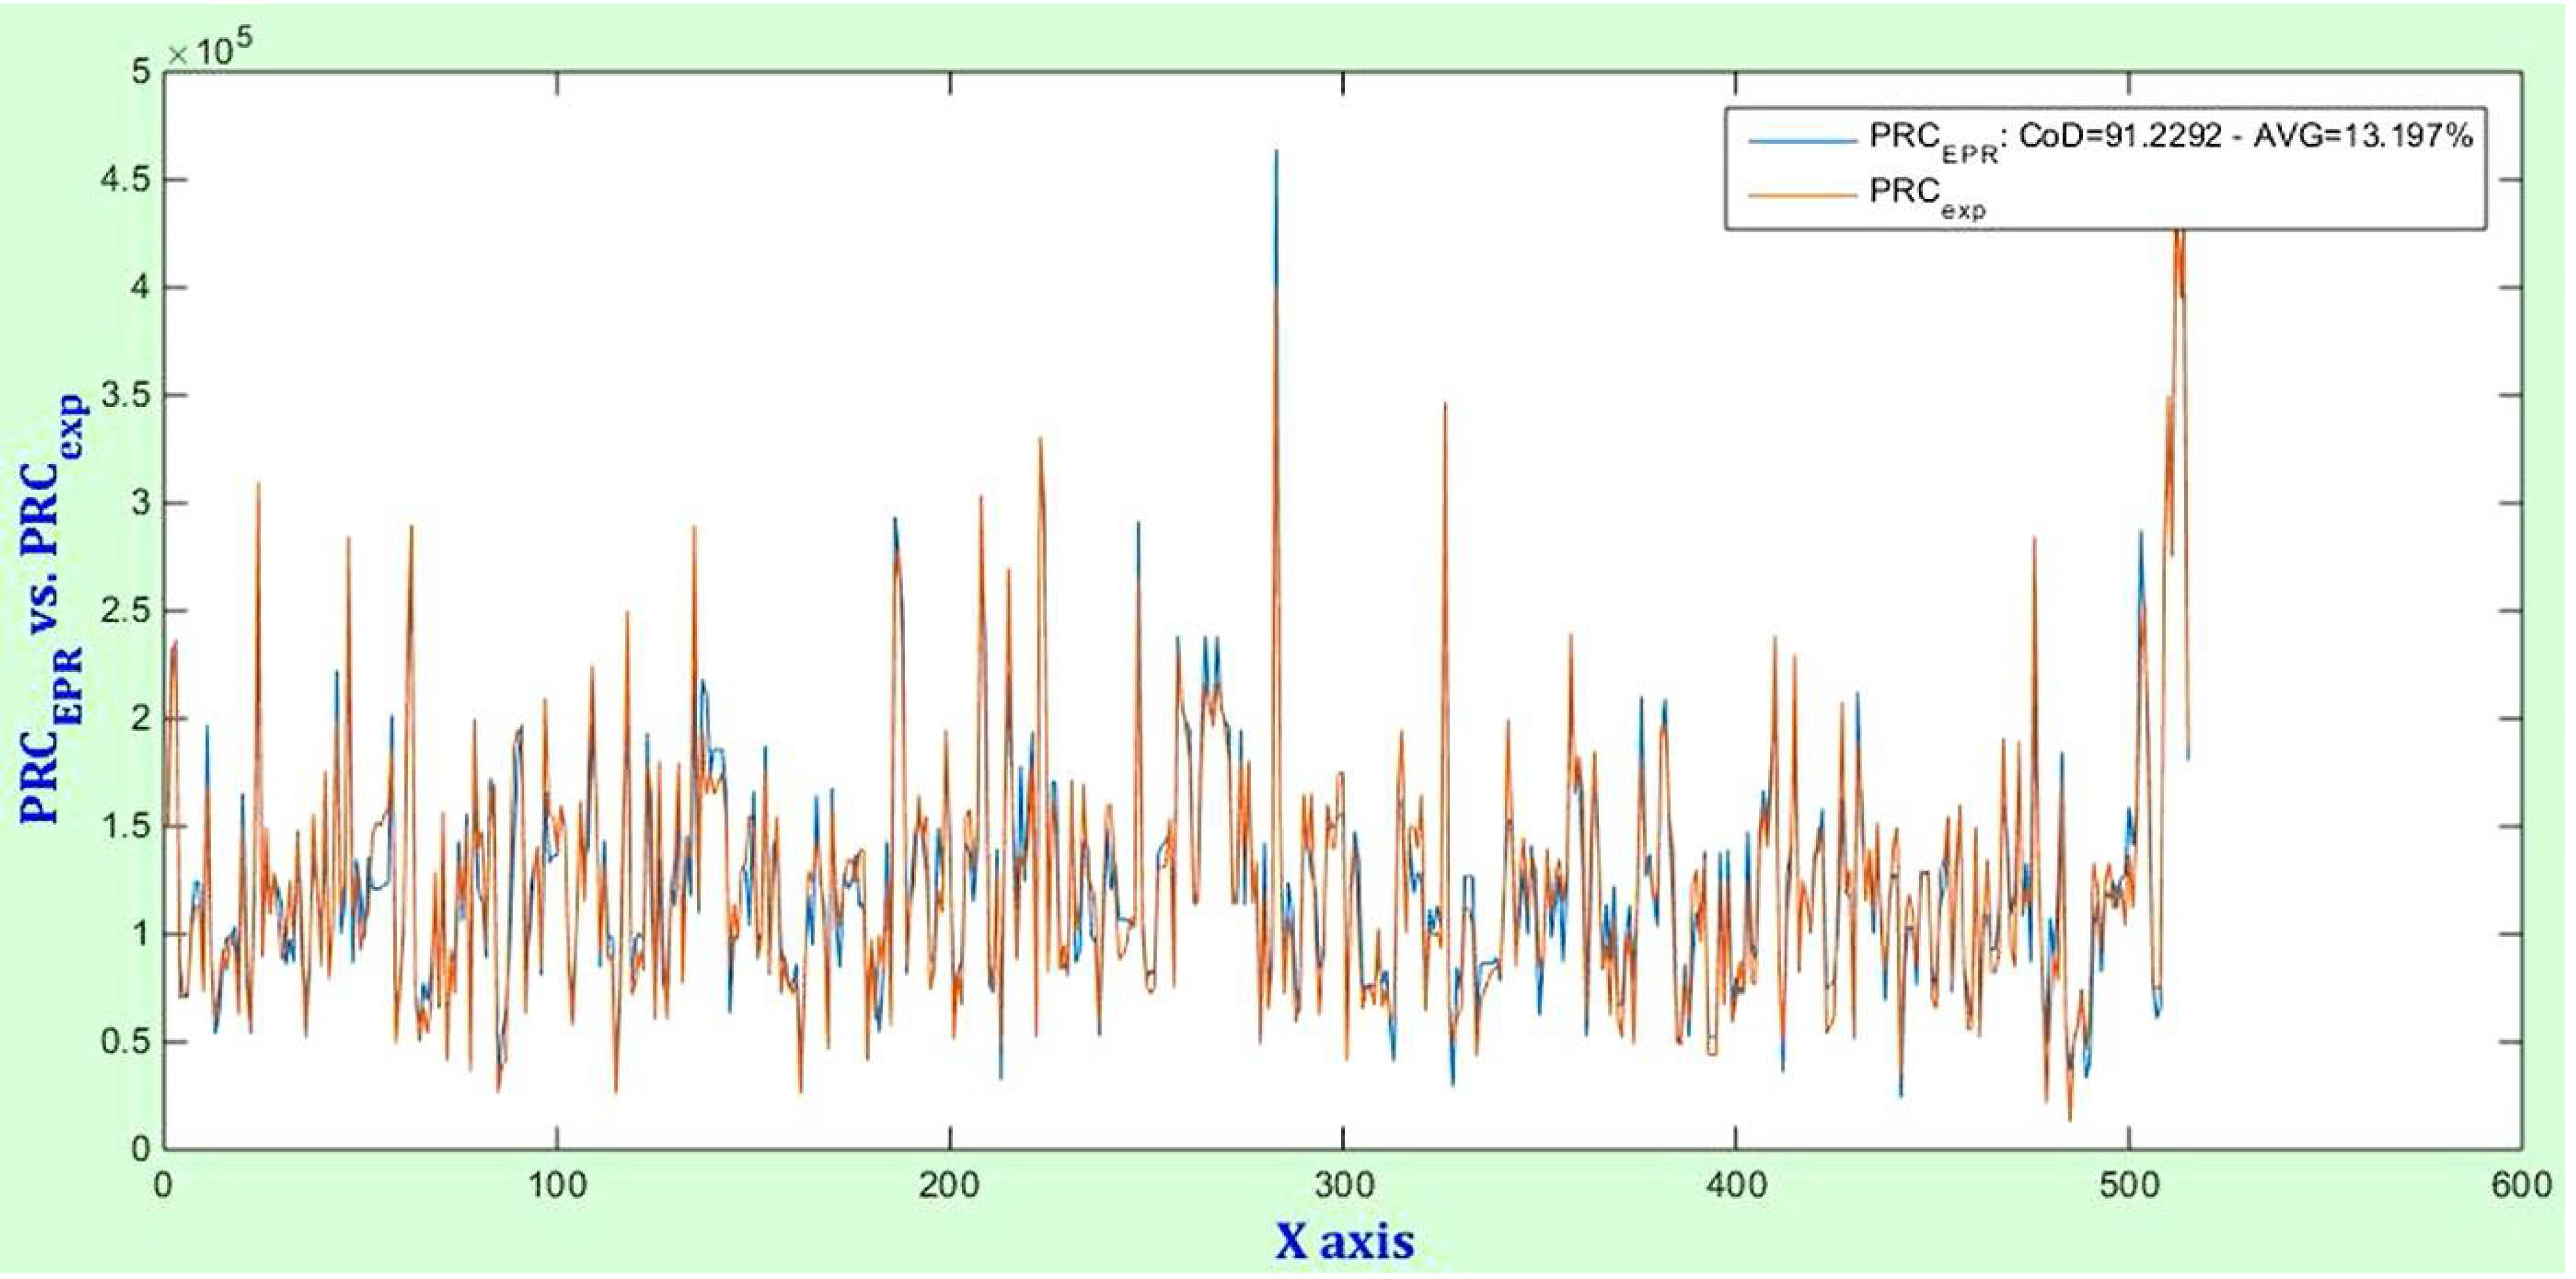
The outputs of the elaborations carried out for all models have been represented in
Figure 1,
Figure 2,
Figure 3,
Figure 4 and
Figure 5, where X
axis represents the number of observations, and on the Y
axis of each model, the selling price determined by EPR-MOGA (PRC
EPR) is compared to the selling price expected in correspondence of each model (PRC
exp).
5. Conclusions
The research reached the objective to obtain empirical evidence of a real estate market premium for Green Buildings and of an aware role of the private real estate market as a driver to foster urban and architectural sustainability and energy efficiency.
The negative environmental impact of the construction and buildings sector has worsened over time due to the over-use of resources in the last decades. Pollution, mainly produced by energy over-consumption in buildings, has increased considerably due to wrong architectural design and urban management. A set of issues makes the adoption of general mitigation measures no longer able to be extended, creating to significant incentive toward building sustainability.
Urban and architectural policies, in fact, are increasingly oriented towards sustainability, energy efficiency, conservation, reuse, architectural retrofit in an ecological manner, re-vitalization of the existing city and a more effective management of historical and architectural heritage, including energy aspects.
Housing market analysis is the basis that defines links between housing characteristics and their market price.
In the study area, it has been detected that the first sale of apartments in some buildings with proven ecological characteristics carrying energy certification belonging to energy class A or B show a higher selling price than usual housing, which is unexpected in a small market of a poor city in a marginal region. This differential is due to the marginal price (i.e., market premium) paid for the ecological feature (i.e., energy efficiency).
Through a real estate market analysis carried out for the urban area of Reggio Calabria (Italy), the market premium for green buildings has been detected, i.e., the positive differential in terms of higher selling price for buildings having better energy efficiency and ecological characteristics. This research’s goal has been pursued with an innovative tool: the Evolutionary Polynomial Regression.
The results obtained by the application of the proposed method suggest there is a percentage impact equal to 41.52% in relation to the incidence of the price of the properties on the presence of a good/excellent energy class (A or B).


 ,
, 


