
Hybrid Ventilation in an Air-Conditioned Office Building with a Multistory Atrium for Thermal Comfort: A Practical Case Study


1
Department of Urban Planning and Spatial Information, Feng Chia University, Taichung 407, Taiwan
2
Department of Architecture, National University of Science and Technology, Taipei 106, Taiwan
3
Department of Mechanical Engineering, Chung Yuan Christian University, Taoyuan 320, Taiwan
*
Author to whom correspondence should be addressed.
Buildings 2021, 11(12), 625; https://doi.org/10.3390/buildings11120625
Submission received: 6 November 2021
/
Revised: 1 December 2021
/
Accepted: 6 December 2021
/
Published: 8 December 2021
(This article belongs to the Section Building Energy, Physics, Environment, and Systems)
Abstract
:This study involved a series of computational fluid dynamics simulations to evaluate the effectiveness of stack and displacement ventilation in providing better thermal comfort in an air-conditioned office building. To reduce energy consumption, the public area of the studied building is cooled by air from air-conditioned rooms with lower temperatures. The air, which is driven by buoyancy, then, flows outside through the multistory atrium. The simulation results indicated that displacement ventilation provides superior thermal comfort performance relative to stack ventilation. A design with a higher ceiling, a higher heat source and a lower inlet with cold air can substantially enhance the efficiency of displacement ventilation. Furthermore, handrails near the atrium play a crucial role because they help to retain cold air in the public space for a longer period, thereby contributing to a better predicted mean vote value.
1. Introduction
Atrium design has been widely applied in commercial buildings worldwide to improve aesthetics and use of natural daylight [1,2]. An atrium can create a space that facilitates circulation and socialization. Lighting performance is almost proportional to the area of a glass roof and inversely proportional to the height of a building; however, in an indoor thermal environment, lighting performance is almost inversely proportional to the area of a glass roof and proportional to the height of a building [3].
Generally, the thermal environment in a building with an atrium is stratified, and stack ventilation is complex and dynamic [4]. Lu et al. analyzed stack-driven airflow and indoor thermal stratification in large spaces by applying a zonal stack ventilation method [4]. Given that building atriums tend to be large, these spaces may lead to high energy consumption that accounts for up to 60% of a building’s total energy consumption if heating, ventilation, and air-conditioning system or building design are not appropriate [5]. José et al. [6] evaluated stack ventilation in a 10-story office building in Mexico City; they also emphasized that both stratification patterns and thermal comfort analysis must be analyzed.
Therefore, in contrast to most relevant studies that have tended to focus on the solar chimney performance and assessed the effect of solar radiation or geometry parameters on stack ventilation or stratification pattern [7,8], the present study examined a hybrid ventilation scheme for an air-conditioned commercial building with an atrium. Several design strategies were developed to scale up the effect of the ventilation scheme and increase the level of thermal comfort.
1.1. Stack Ventilation
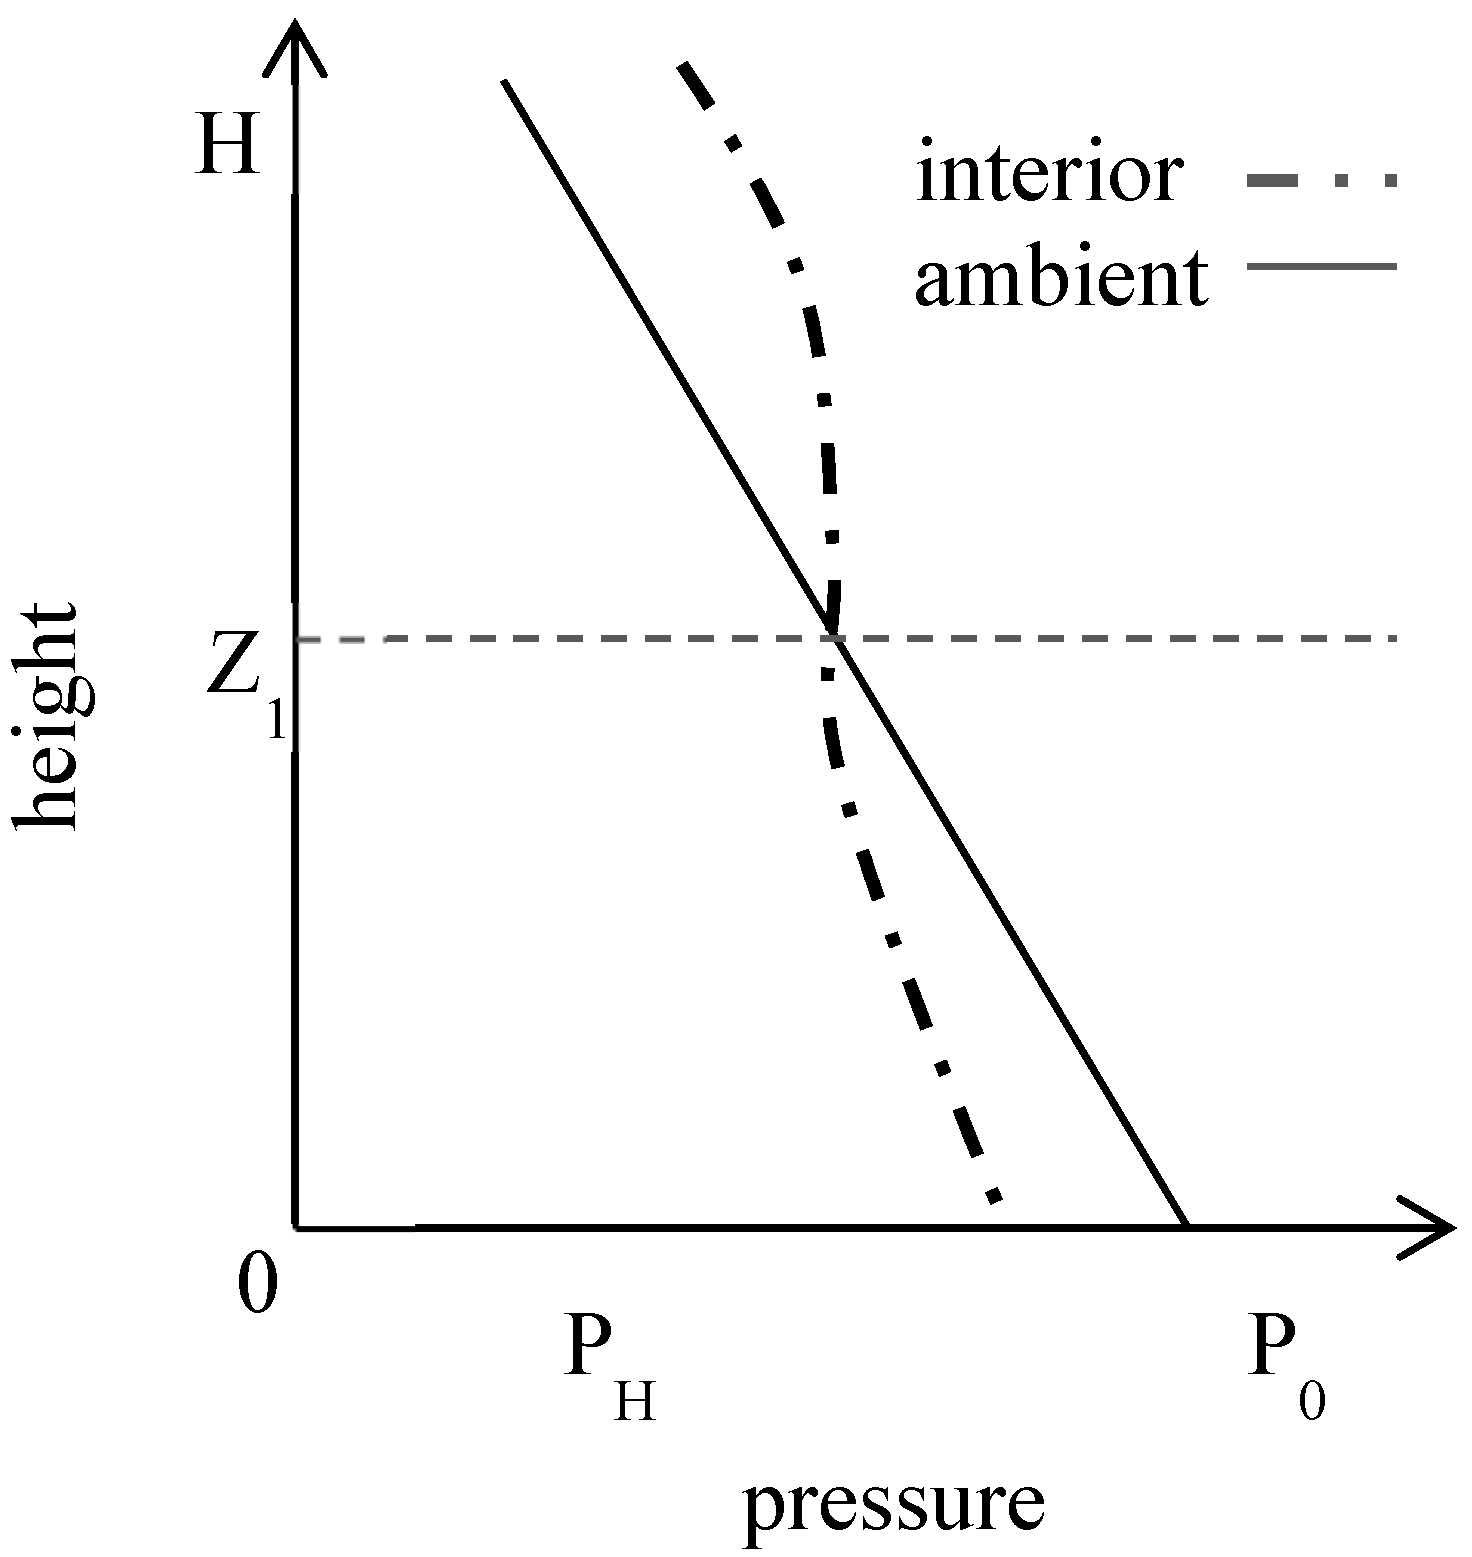
Ventilation driven by thermal buoyancy occurs when internal and external air has different densities, which is caused by temperature differences between inside and outside environments. Thermal buoyancy is sometimes referred to as the stack effect or the chimney effect. The difference in density creates pressure disparities that pull air in and out of a building through openings that are suitably positioned in a building envelope. When the indoor air temperature is higher than the outdoor air temperature, an overpressure and an underpressure are formed in the upper and lower sections, respectively, of a building. At a given height (Z1), indoor and outdoor pressures are equal. This is referred to as the neutral level. Pressure above the neutral level (overpressure) drives air out through openings and pressure under the neutral level (overpressure) pulls air into internal spaces (Figure 1).
Linden [9] reported that neutral level height is dependent on effective area, which is determined in turn by vent area. A study by Fitzgerald and Woods [10] revealed that neutral level height is also dependent on the ratio of upper to lower vent dimensions. When an upper opening is considerably larger than a lower opening, a lower pressure develops at the lower part of a space, leading to an increase in neutral level height. The total ventilation flow rate in a building is determined by its effective areas and distances between its upper and lower vents.
Livermore and Woods [11] added an additional floor and additional heat sources between upper and lower openings; their result revealed that having heat sources at a higher height increased the neutral level and created a pronounced stratification area. However, they also reported that the effect of having heat sources at a higher height diminished when the neutral level was higher than those of heat sources; their study further verified that if an additional heat flux was insufficient to heat up the incoming air from an upper opening, incoming air with cooler temperature then descends to the floor, mixes with upward-flowing warm air from a lower floor, and eventually causes a building to have uniform temperature distribution.
Kotani et al. [12] tested a multistory building by using multiple divided openings and heat sources. They concluded that the airflow rate through a top outlet remains constant when the total inlet area is constant regardless of the number of divided openings; they also discovered that positioning openings at a higher height led to lower airflow rates. An experiment by Holford and Hunt [13] evaluated the effectiveness of exhausting heat through various atrium designs; their results indicated that the top opening of a building must be sufficiently large, or heat would accumulate in the upper part of the building’s atrium.
1.2. Displacement Ventilation
Stratification occurs when a stable density interface exists between the warm air at an upper layer and the cooler incoming air. This form of ventilation is known as displacement ventilation [9]. In contrast to mixing ventilation, displacement ventilation is characterized by large temperature variations within a space. For a given temperature difference and vent area, displacement ventilation leads to better ventilation and greater energy efficiency relative to mixing ventilation [14].
An evaluation report compiled by the National Institute of Standard and Technology compared studies by Bourassa et al. [15] on the effectiveness of displacement ventilation in various types of buildings in diverse cities. The report indicated that displacement ventilation can reduce energy consumption for cooling by at least 13%.
In essence, the factors that influence displacement ventilation are inlet amount and temperature, the locations of the inlet and outlet, space height, and heat load [16]. Gan and Lin’s studies [17,18] verified that these factors, inlet location has a greater influence on indoor thermal comfort, airflow pattern, and stratification. Their studies also revealed that reducing inlet velocity and increasing inlet temperature is helpful in lowering the feelings of discomfort within a building. Therefore, more flexibility should be applied when determining the distances between inlets and users. With respect to the influence of other factors, Mundt [19] and Awad et al. [20] have reported that heat flux, heat source location, and outlet location influence the stratification in a space. Lee [21] revealed that a higher ceiling height enhances the efficiency of displacement ventilation. Lin et al. and Chiang et al. [22] compared various inlet air temperatures within the context of displacement ventilation and verified that inlet air at 24 °C can be used to improve indoor thermal comfort.
2. Description of Study Building
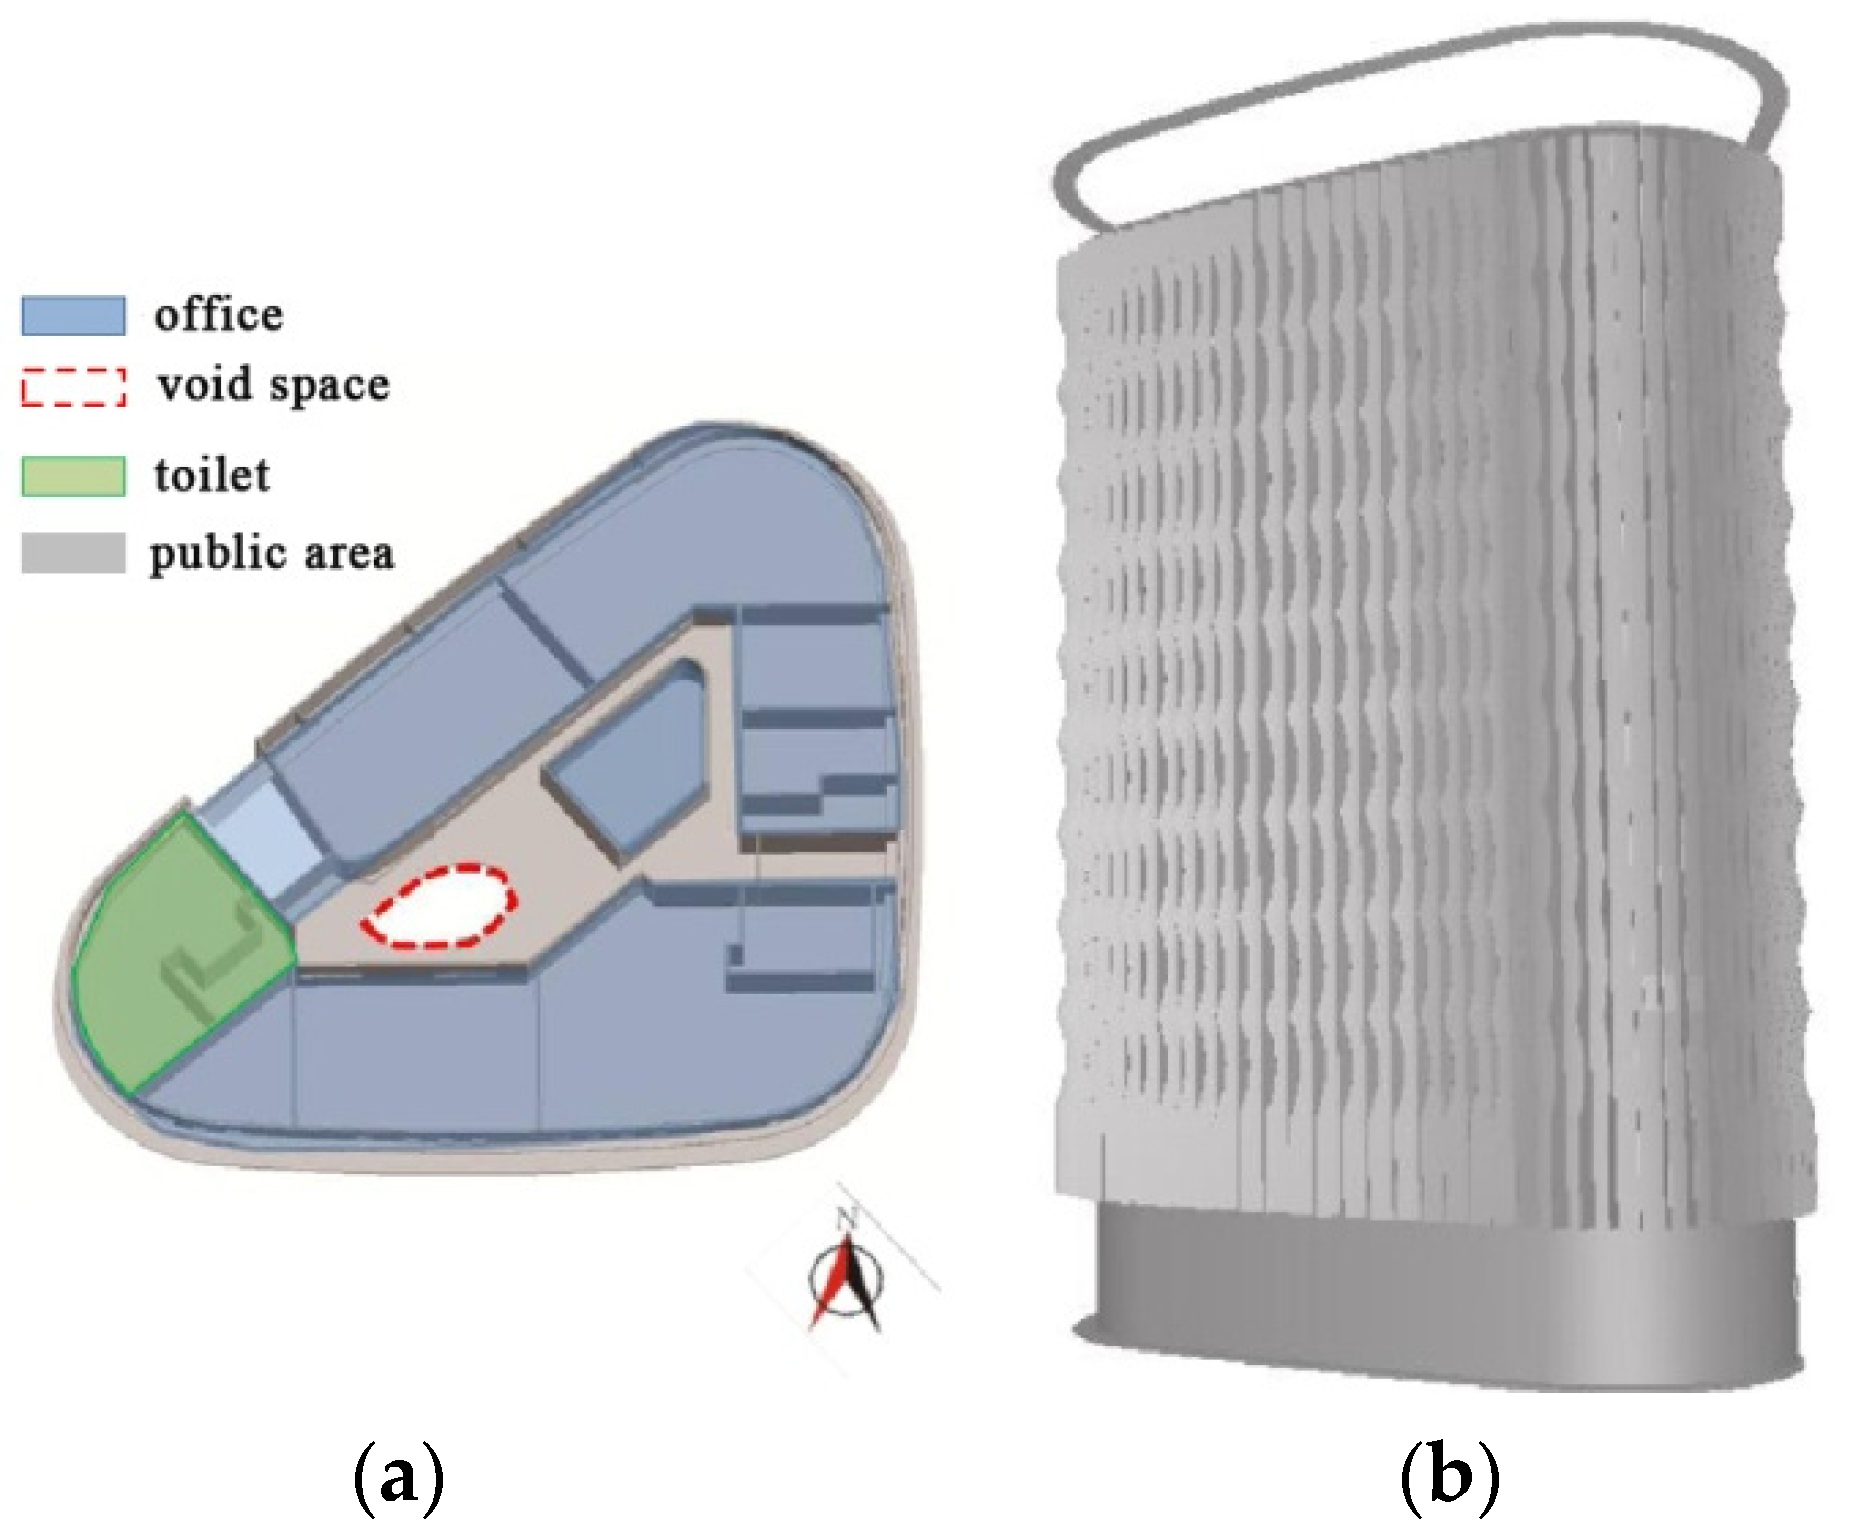
The present study applied displacement and stack ventilation within an atrium to remove the heat in an office building in Taipei. Figure 2 presents the floor plan and perspective of the studied building. The intakes were positioned at the east side of the building because of the prevailing wind direction. The building’s public area and open space were enclosed by office rooms that gave the building a triangular shape. The atrium in the center of the building was formed by connecting the void section of each floor vertically.
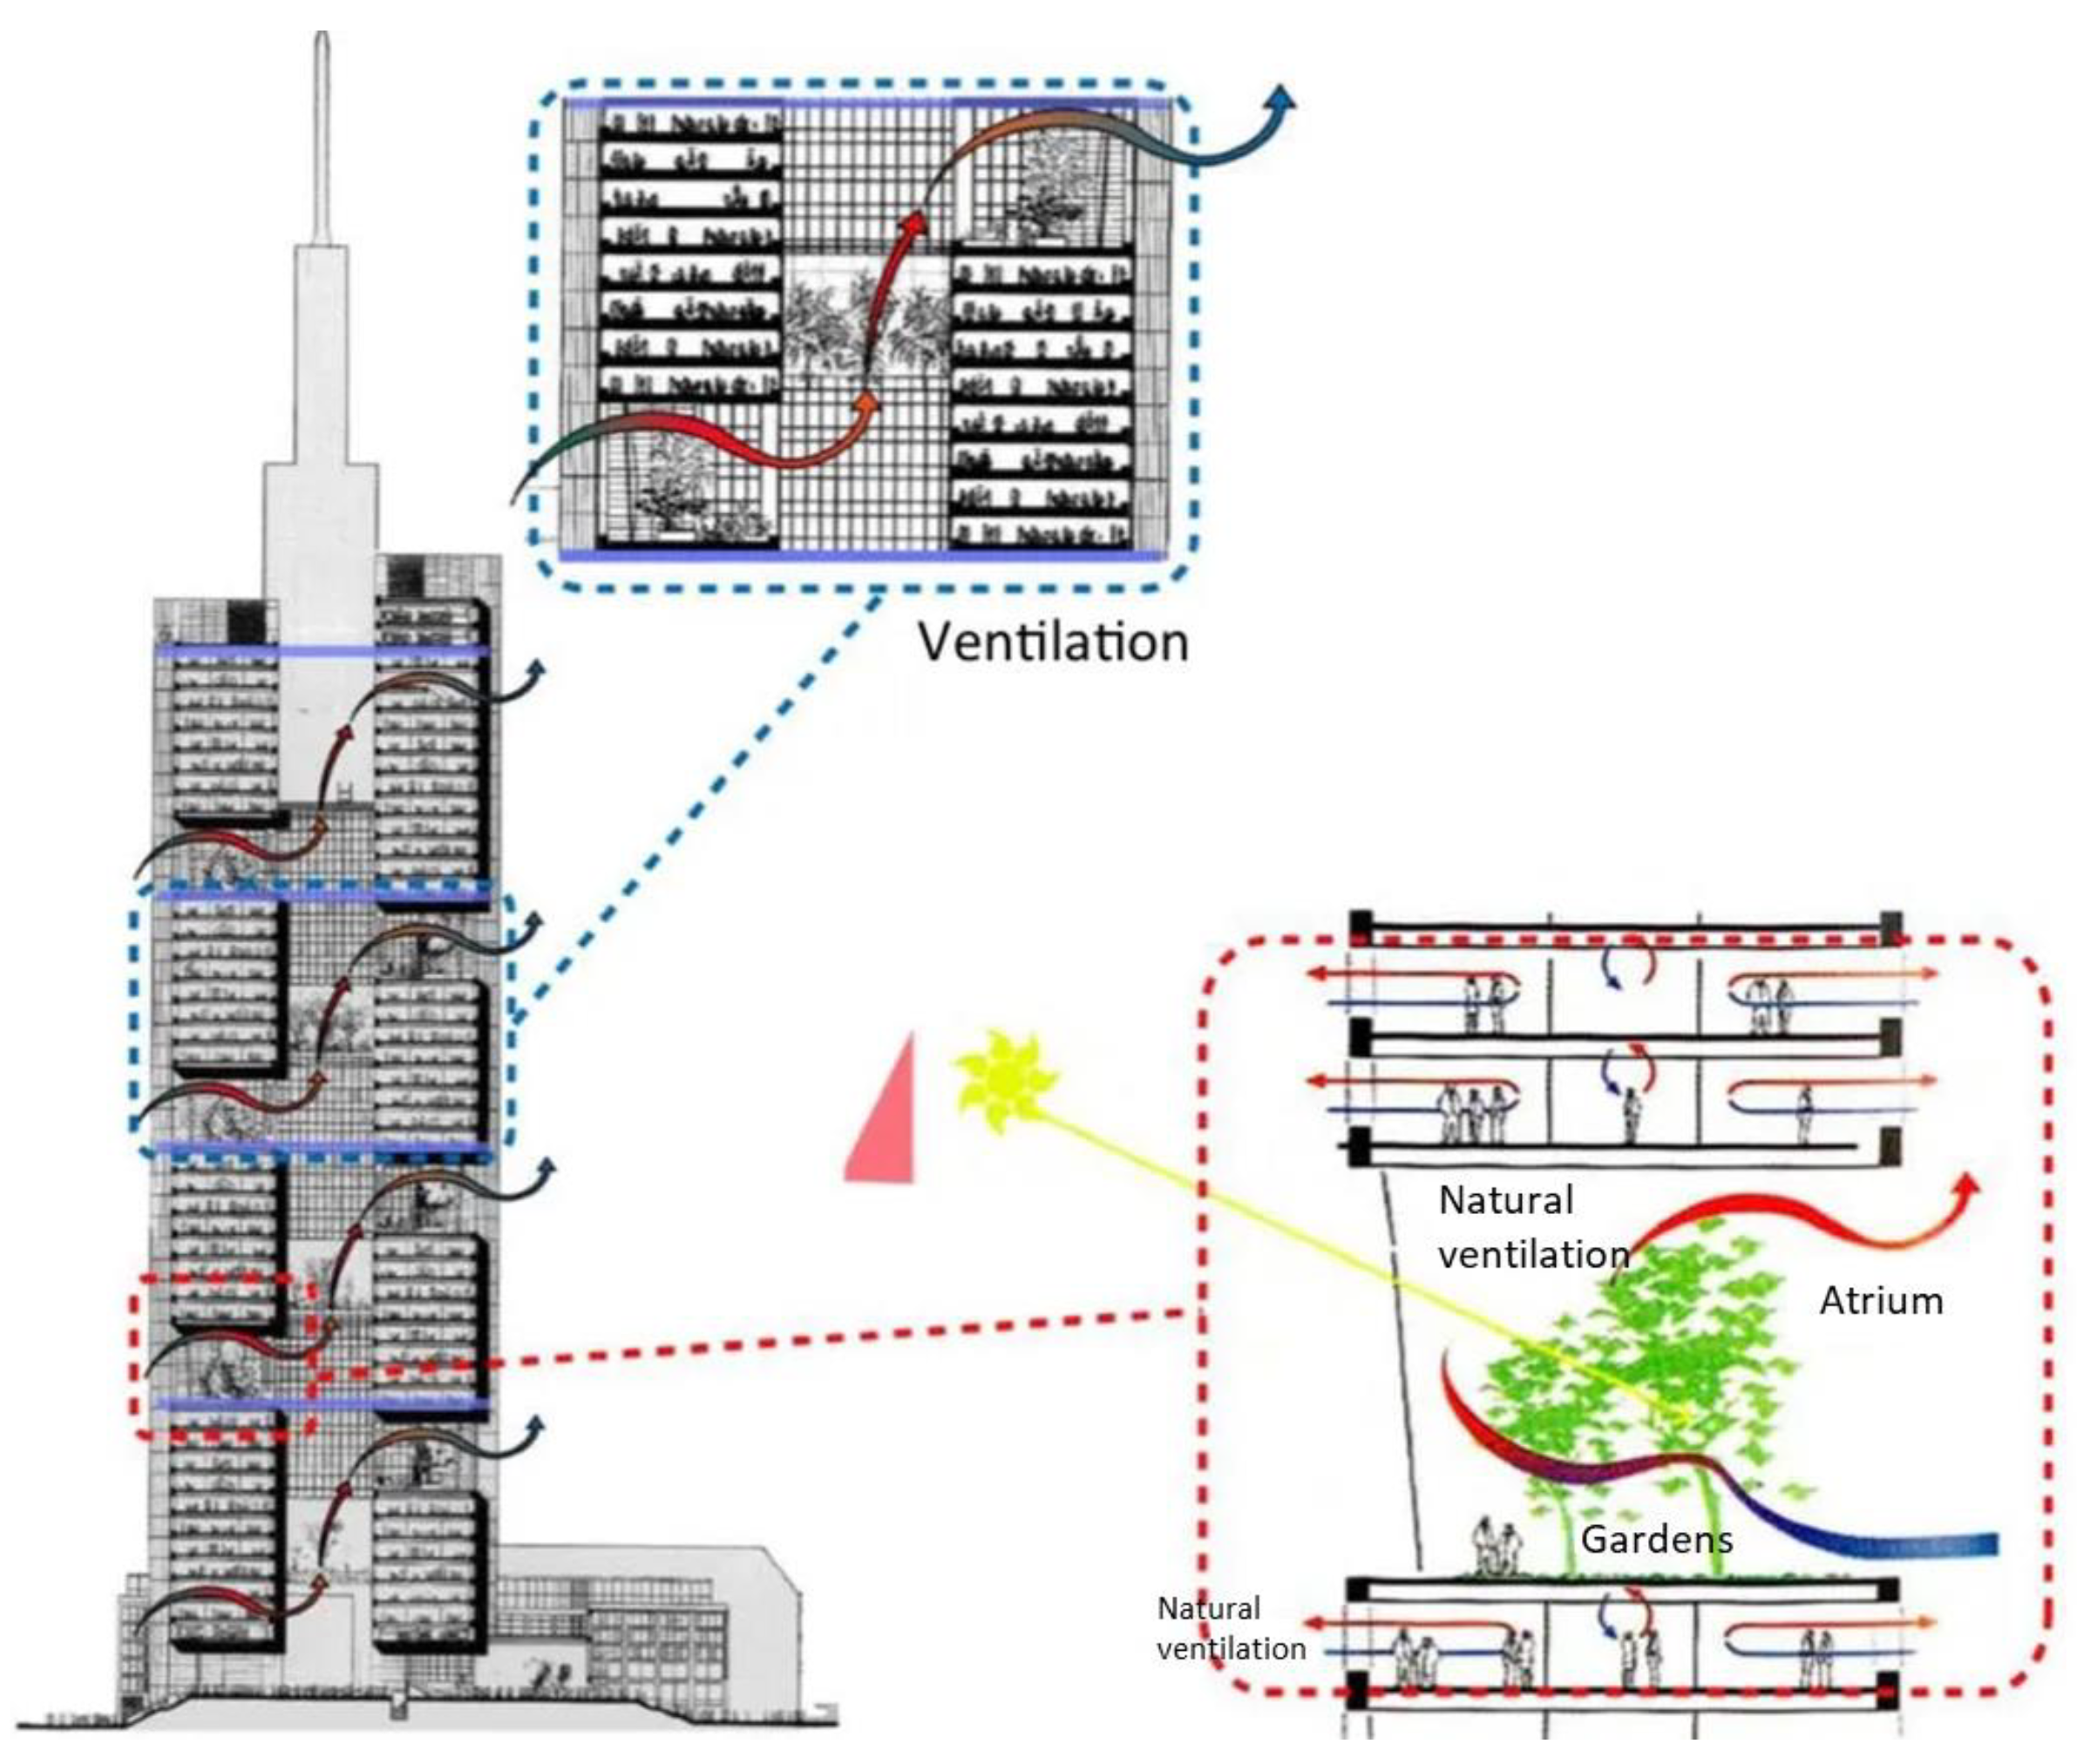
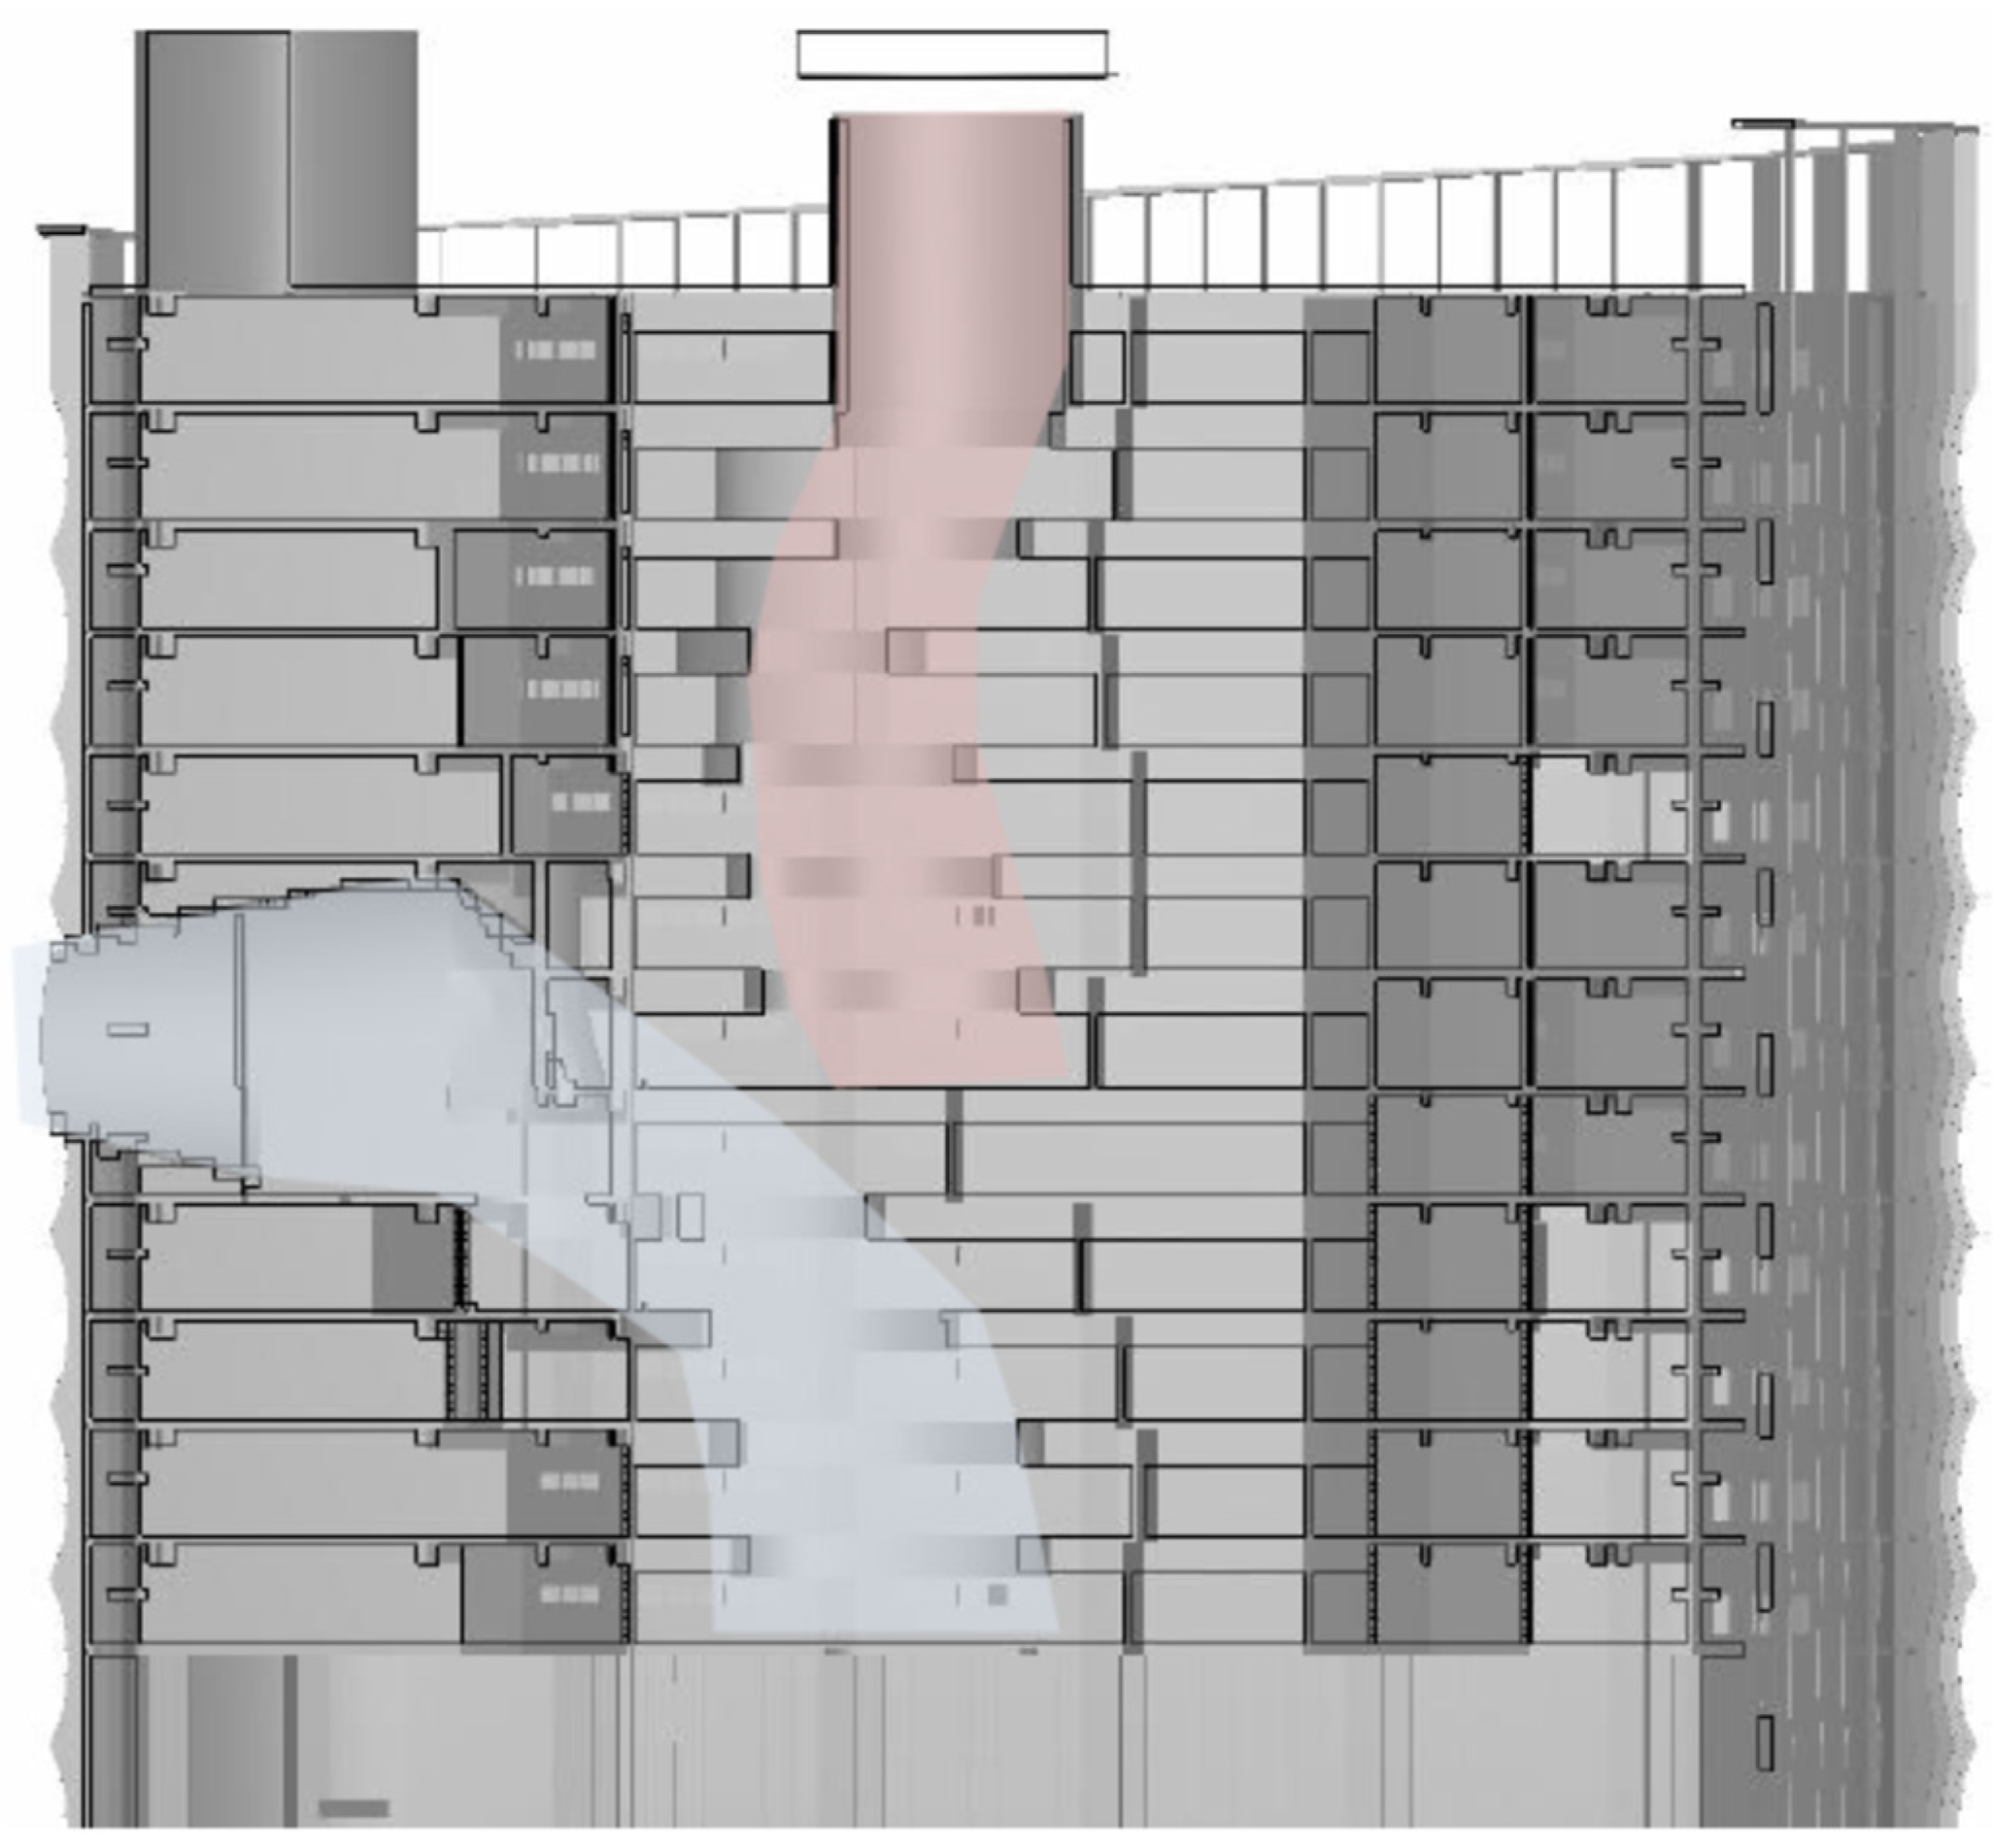
In most buildings, the total intake area is larger than the vent at the top of the atrium, which results in a low neutral level height. The establishment of a higher atrium or use of specific chimneys to serve specific floors can alleviate this problem; however, in practice, the height of an atrium is limited, and floor area is sacrificed when multiple chimneys are employed. The renowned architect, Norman Foster, designed a commercial bank building in Frankfurt by dividing it into multiple sections that each had its own atrium (Figure 3). The present study referenced this concept of splitting a building into upper and lower sections, such that each section has one atrium that is designed for stack ventilation. The detailed drawings of two atriums are presented in Figure 4. Relative to the upper section, the performance of the lower section is more complex to assess because of the various locations and dimensions of open space on each floor. Therefore, the present study only focused on assessing the thermal comfort performance within the upper section.
In this study, the temperature for triggering the air-conditioning system was set to 24 °C. On the basis of this criterion and weather data, the air-conditioning systems in Taipei operate for approximately 72% of annual working hours (8:00–18:00); the relevant values and percentages are listed in Table 1.
3. Research Objectives and Procedure
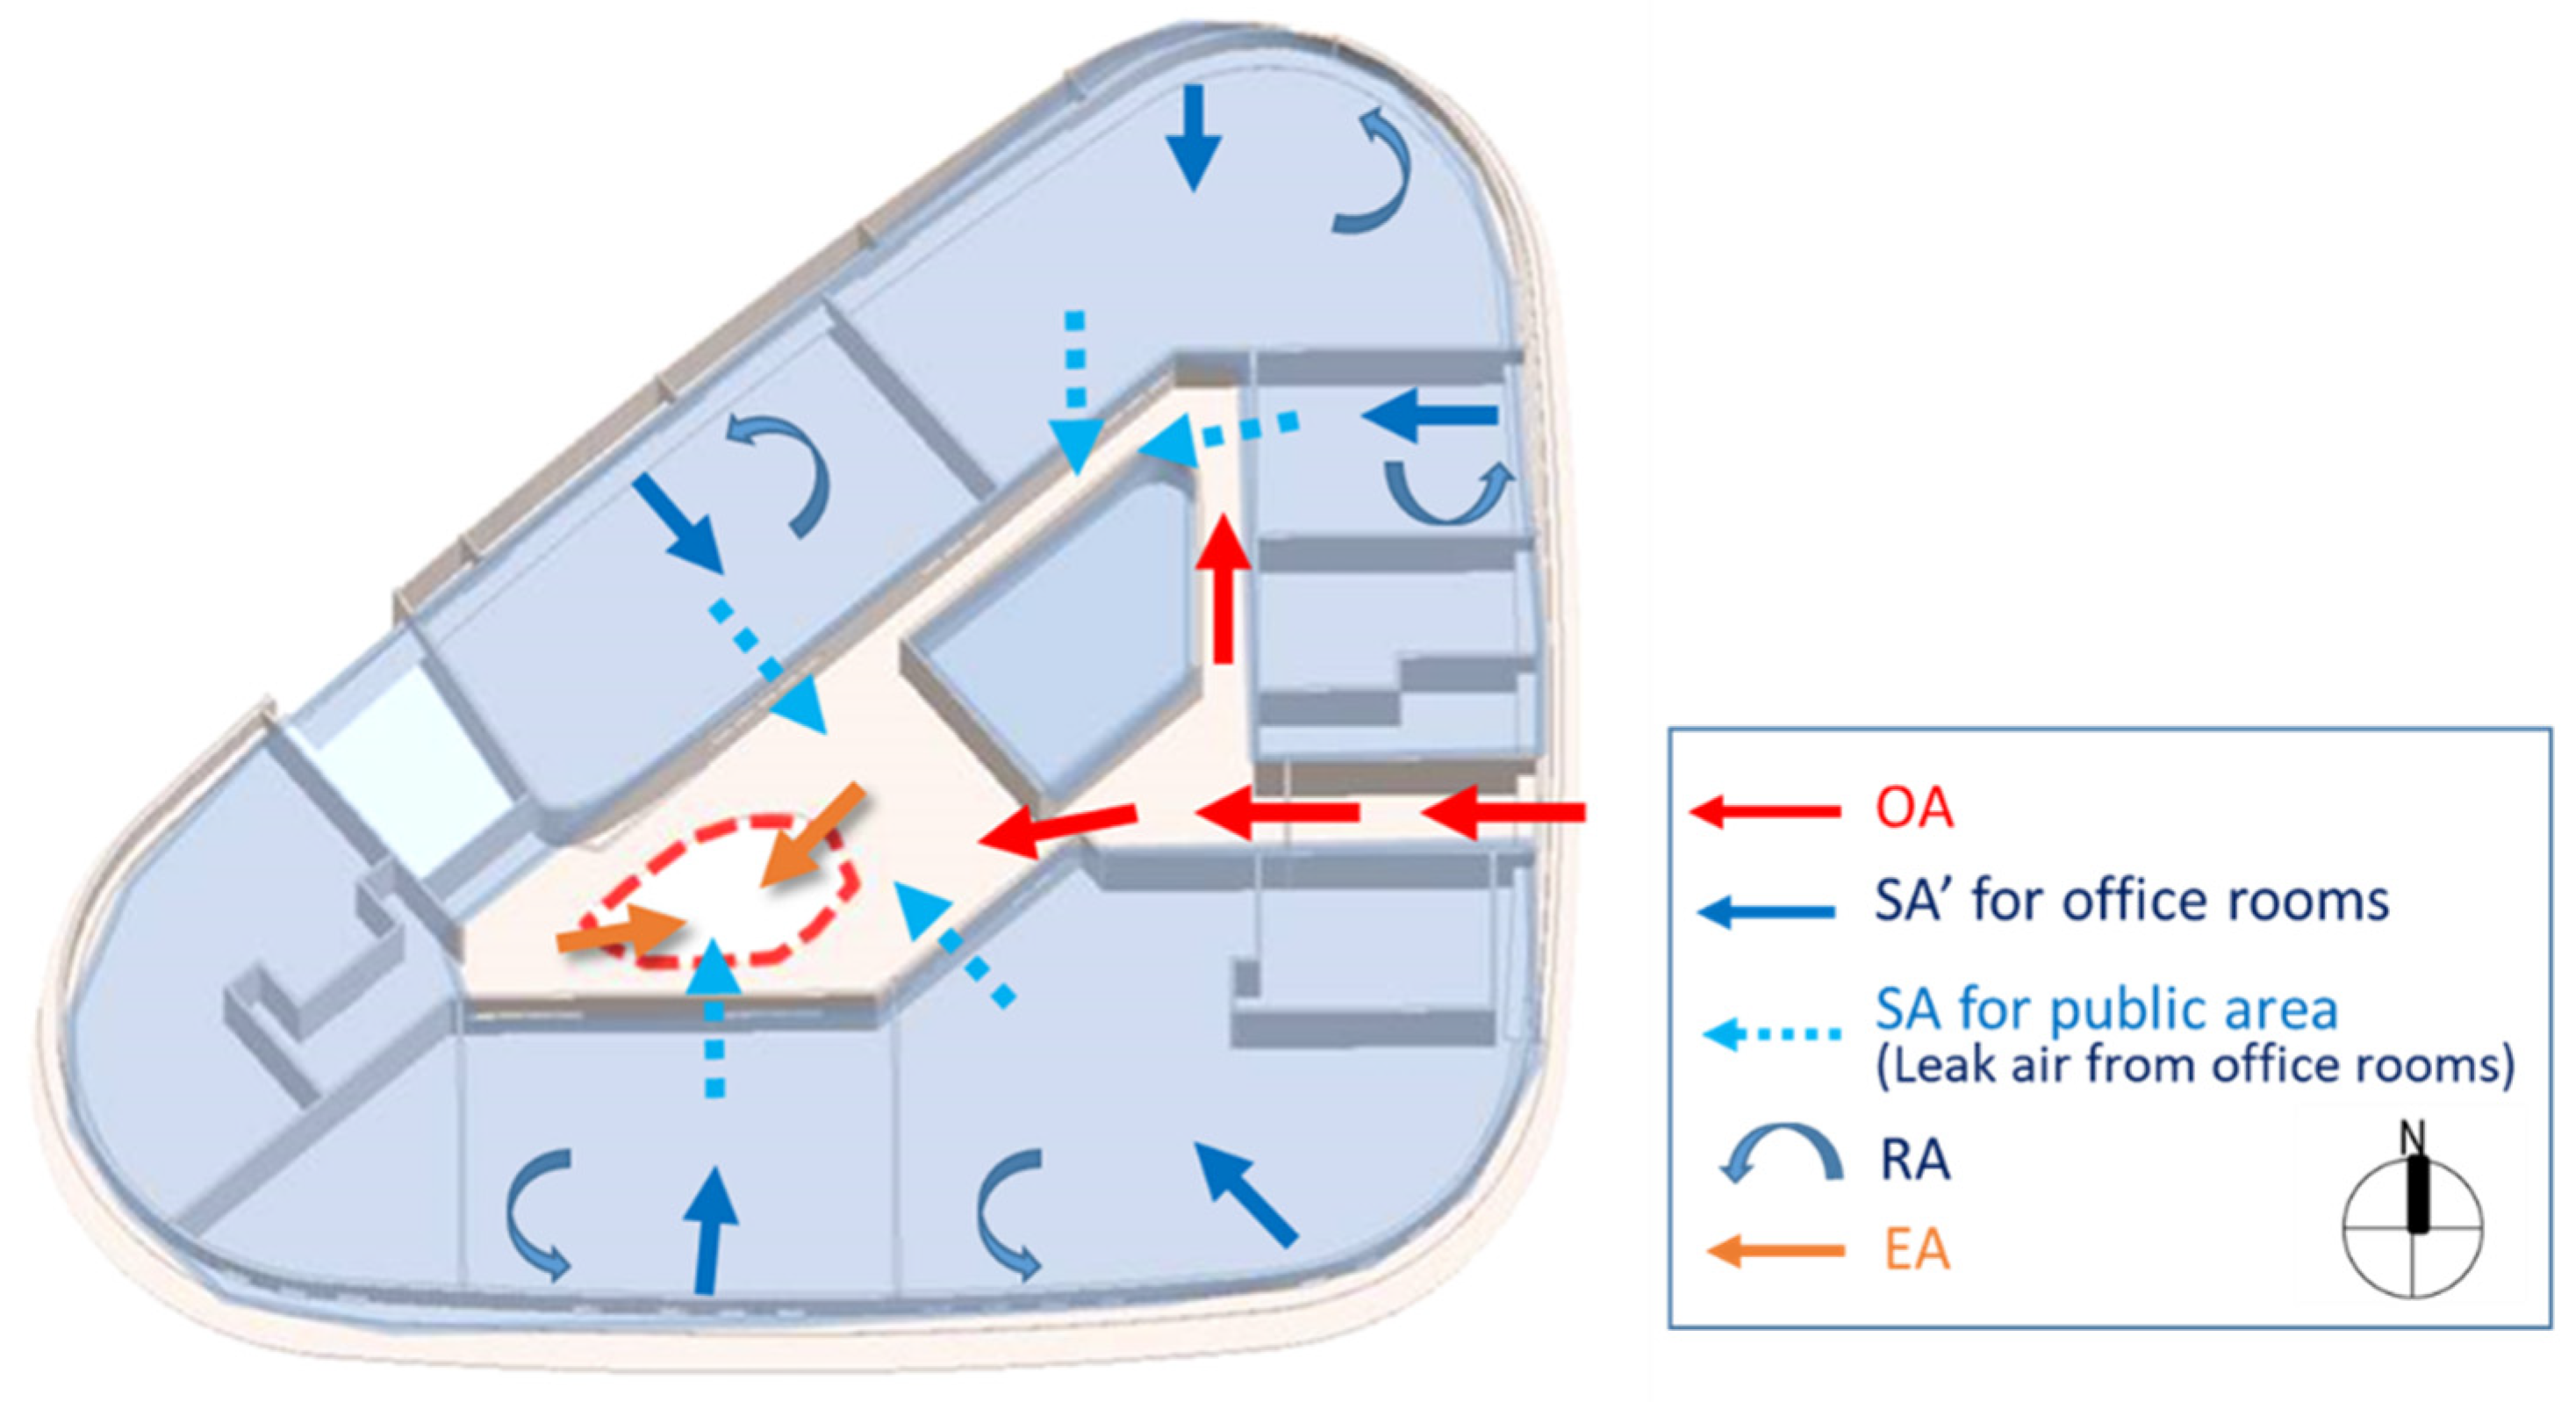
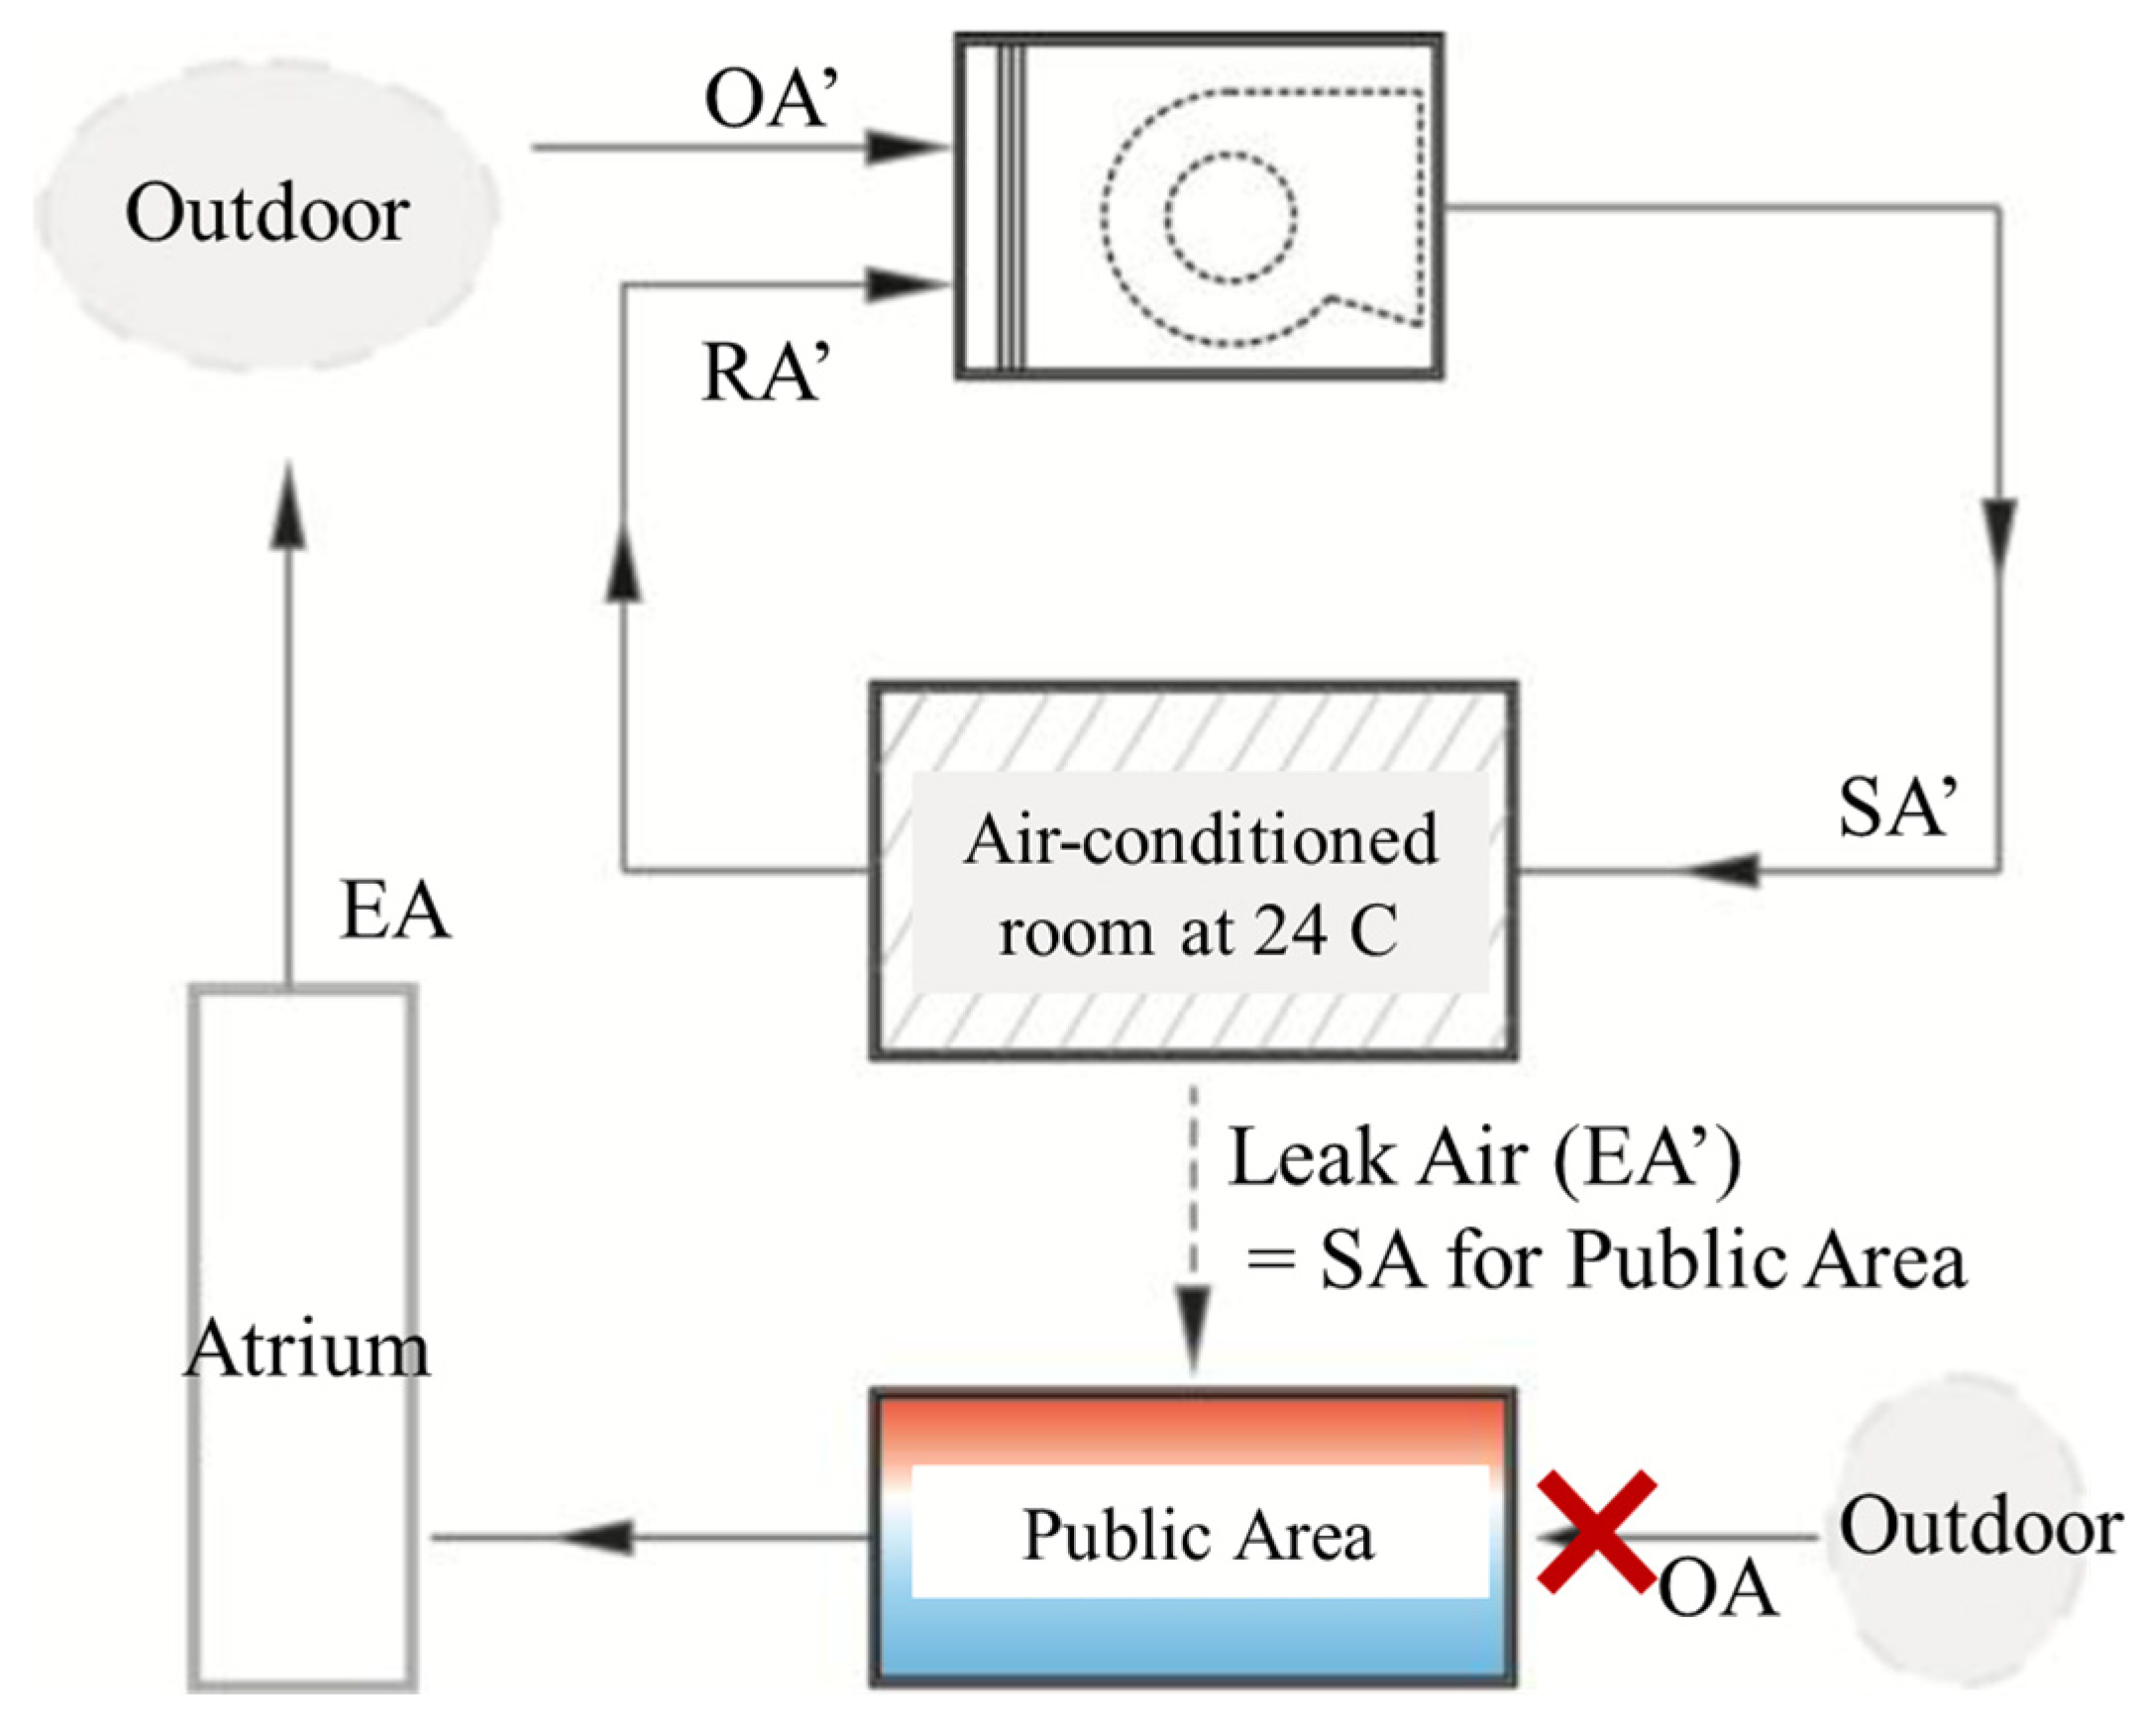
On the basis of the aforementioned weather condition, air conditioners must be used to cool rooms, particularly those in office buildings. Therefore, the present study disregarded fully air-conditioned office rooms; instead, the focus was on the public areas and utilization of leaked air with cooler temperatures from office rooms, and a multistory atrium was used to drive stack and displacement ventilation to improve thermal comfort. The ventilation mechanism comprised two systems; the first system was for office rooms and the second system was for public areas. These two systems had individual targets and ventilation loops, but they were linked by the leaked air in the first system. The system for office rooms applied conventional mechanical ventilation, and it had its own circulation (OA’, SA’, RA’ and EA’). The fresh air from outdoor (OA’) was set to 4000 cfm for each floor in the studied building on the basis of the predictions of an air-conditioning engineer and the handbook of green building design in Taiwan [24]. Another system for public areas applied stack ventilation and placement ventilation. The leaked air from office rooms, the EA’ in the first system, then became the SA in this system. Therefore, the airflow rate of SA on each floor was set to 4000 cfm. The airflow path in Figure 5 started from the intakes on the east side (OA), passed through public areas, mixed with the leaked air (SA for the public area) from office rooms, passed through the atriums, and eventually exhausted out to outside (EA) from the top vent of the building. Because the first system was well developed, the present study focused on the second system.
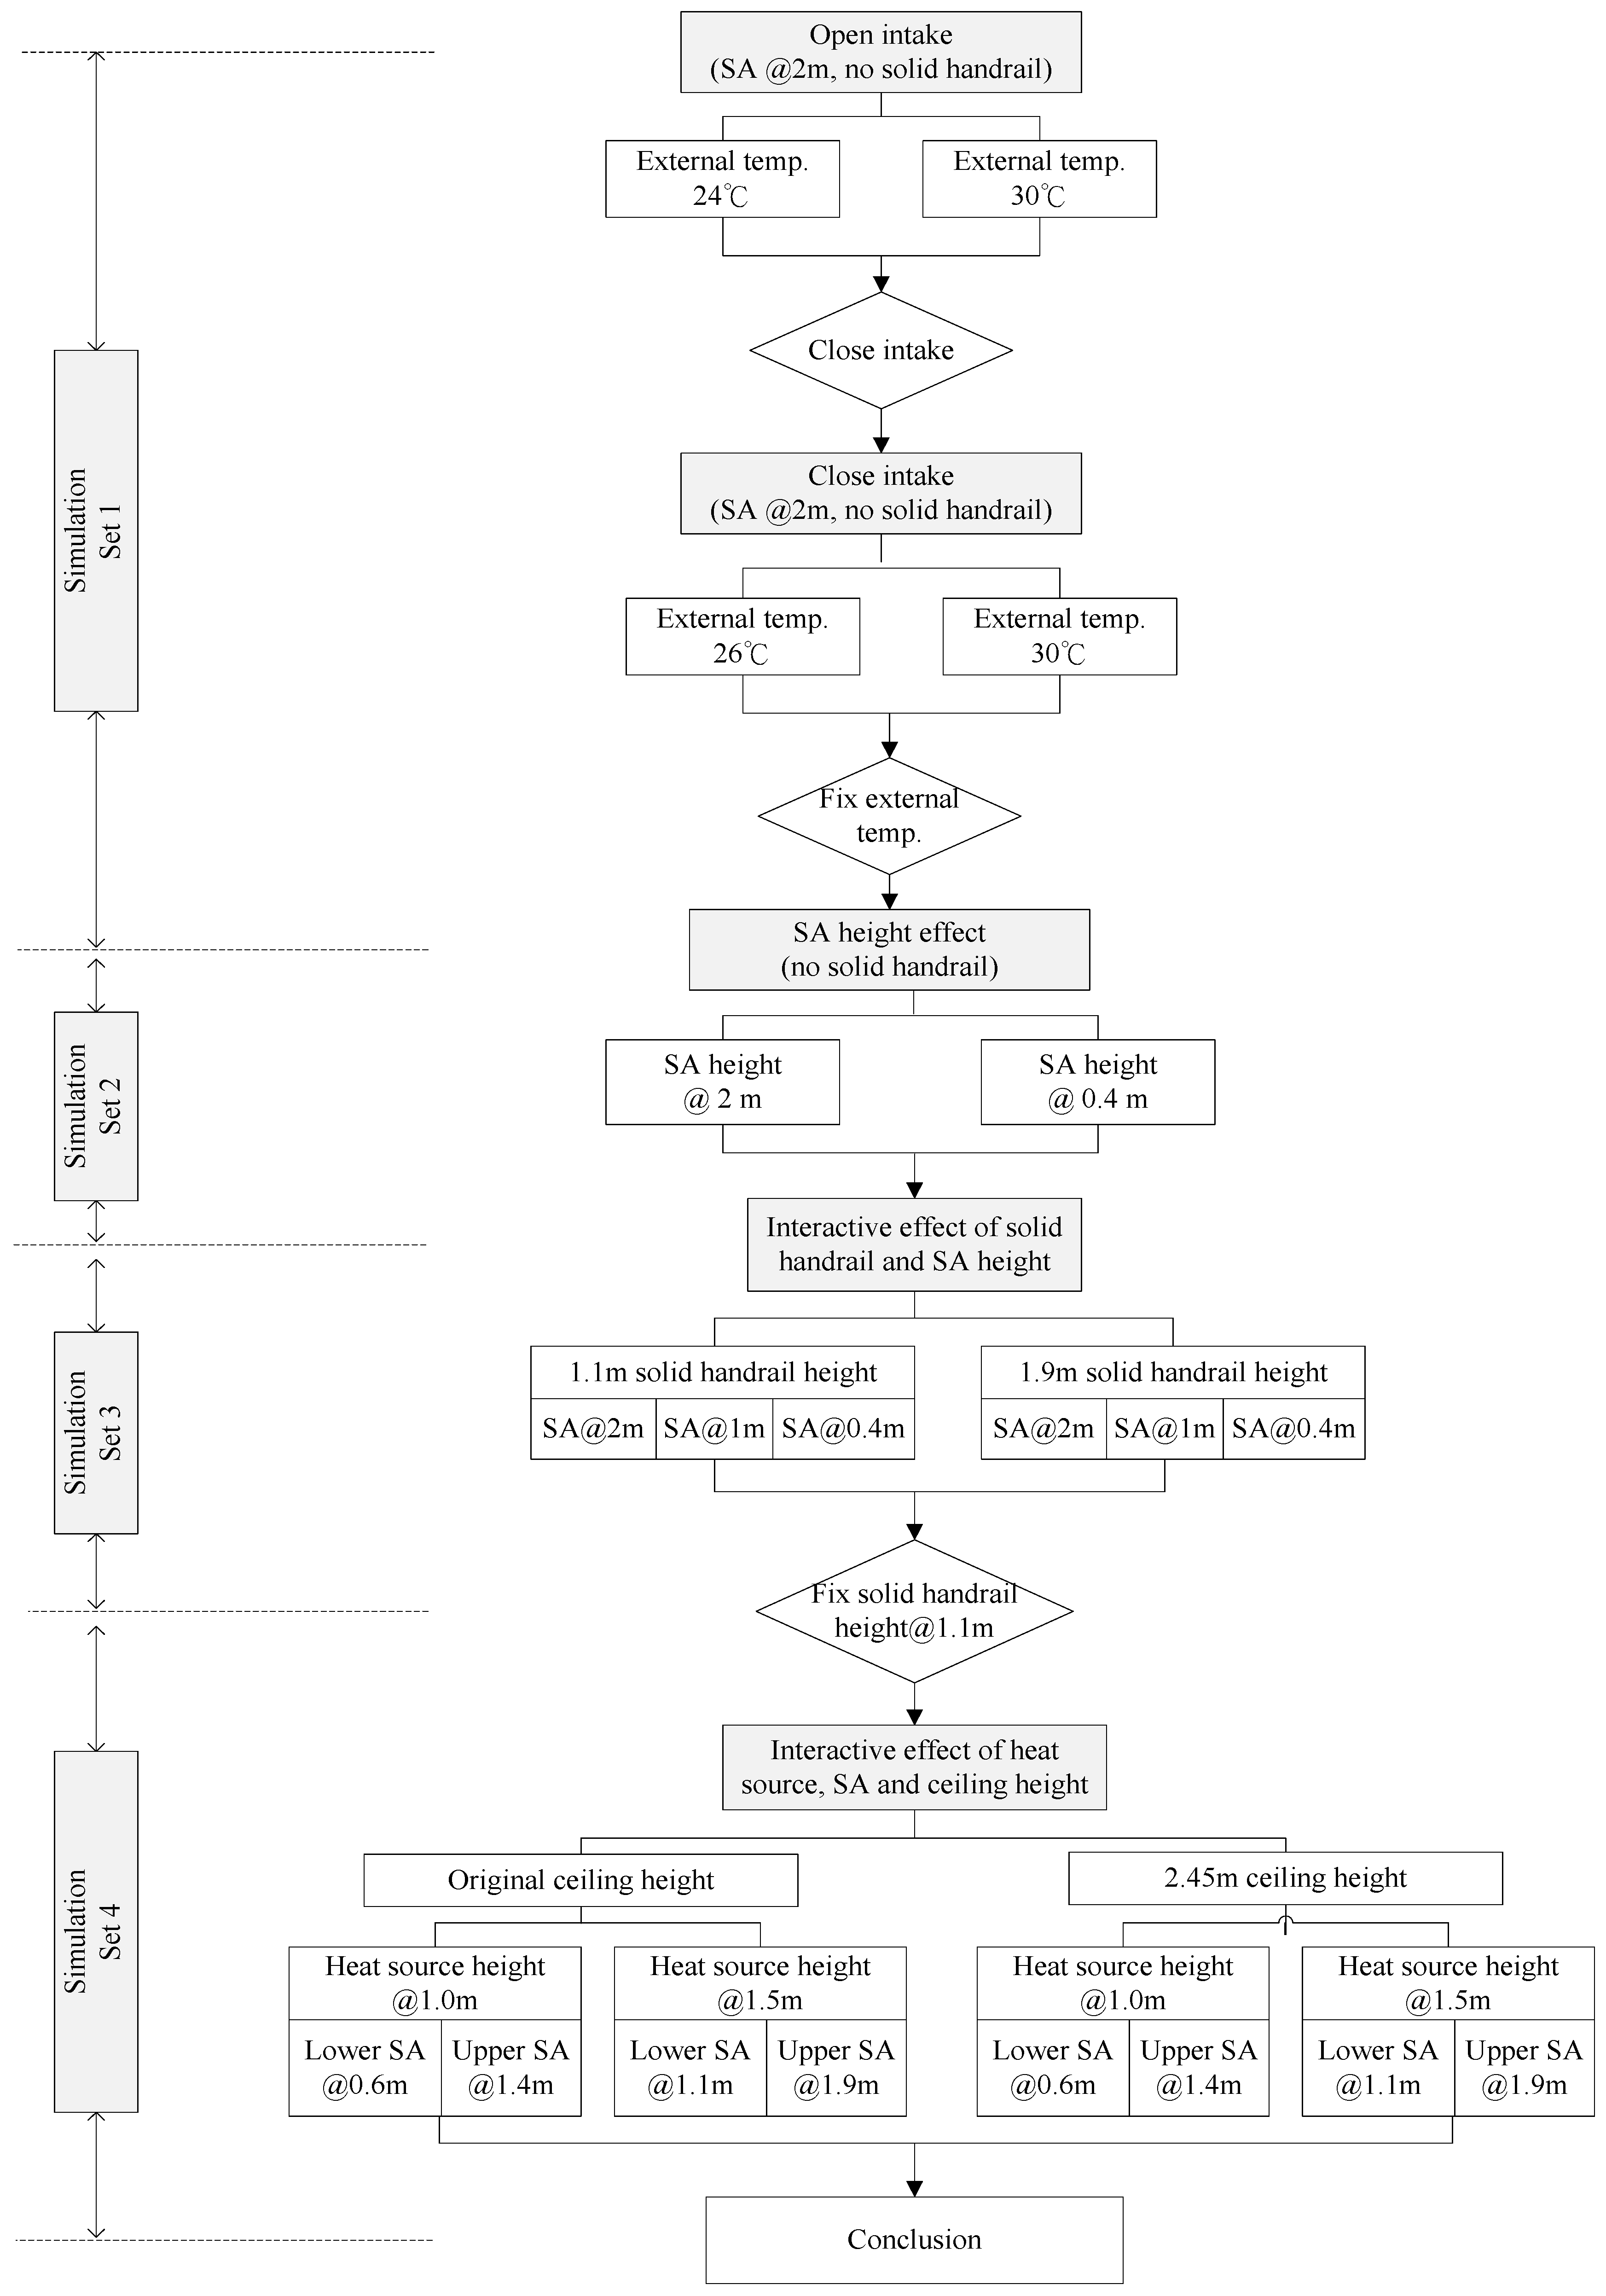
A series of computational fluid dynamics (CFD) simulation sets was established (Figure 6) to analyze thermal comfort performance in relation to both stack and displacement ventilation, and to develop design principles for the multistory atrium and surrounding spaces. The variables in the present study were ambient condition, location of the cooler air leaked from air-conditioned rooms (SA), the height of heat source, and ceiling height.
First simulation set:
This set was used to evaluate how ambient temperature affects stack ventilation when cool air from office rooms is utilized to cool the public area. The ambient temperature of 24 °C and 30 °C were used on the basis of weather data. The results of this set served as the reference for evaluating the effects of the intakes on the east side of the building. If the intakes had no effect, they were closed for subsequent simulation sets.
Second simulation set:
This set was used to evaluate the effect of SA location.
Third simulations set:
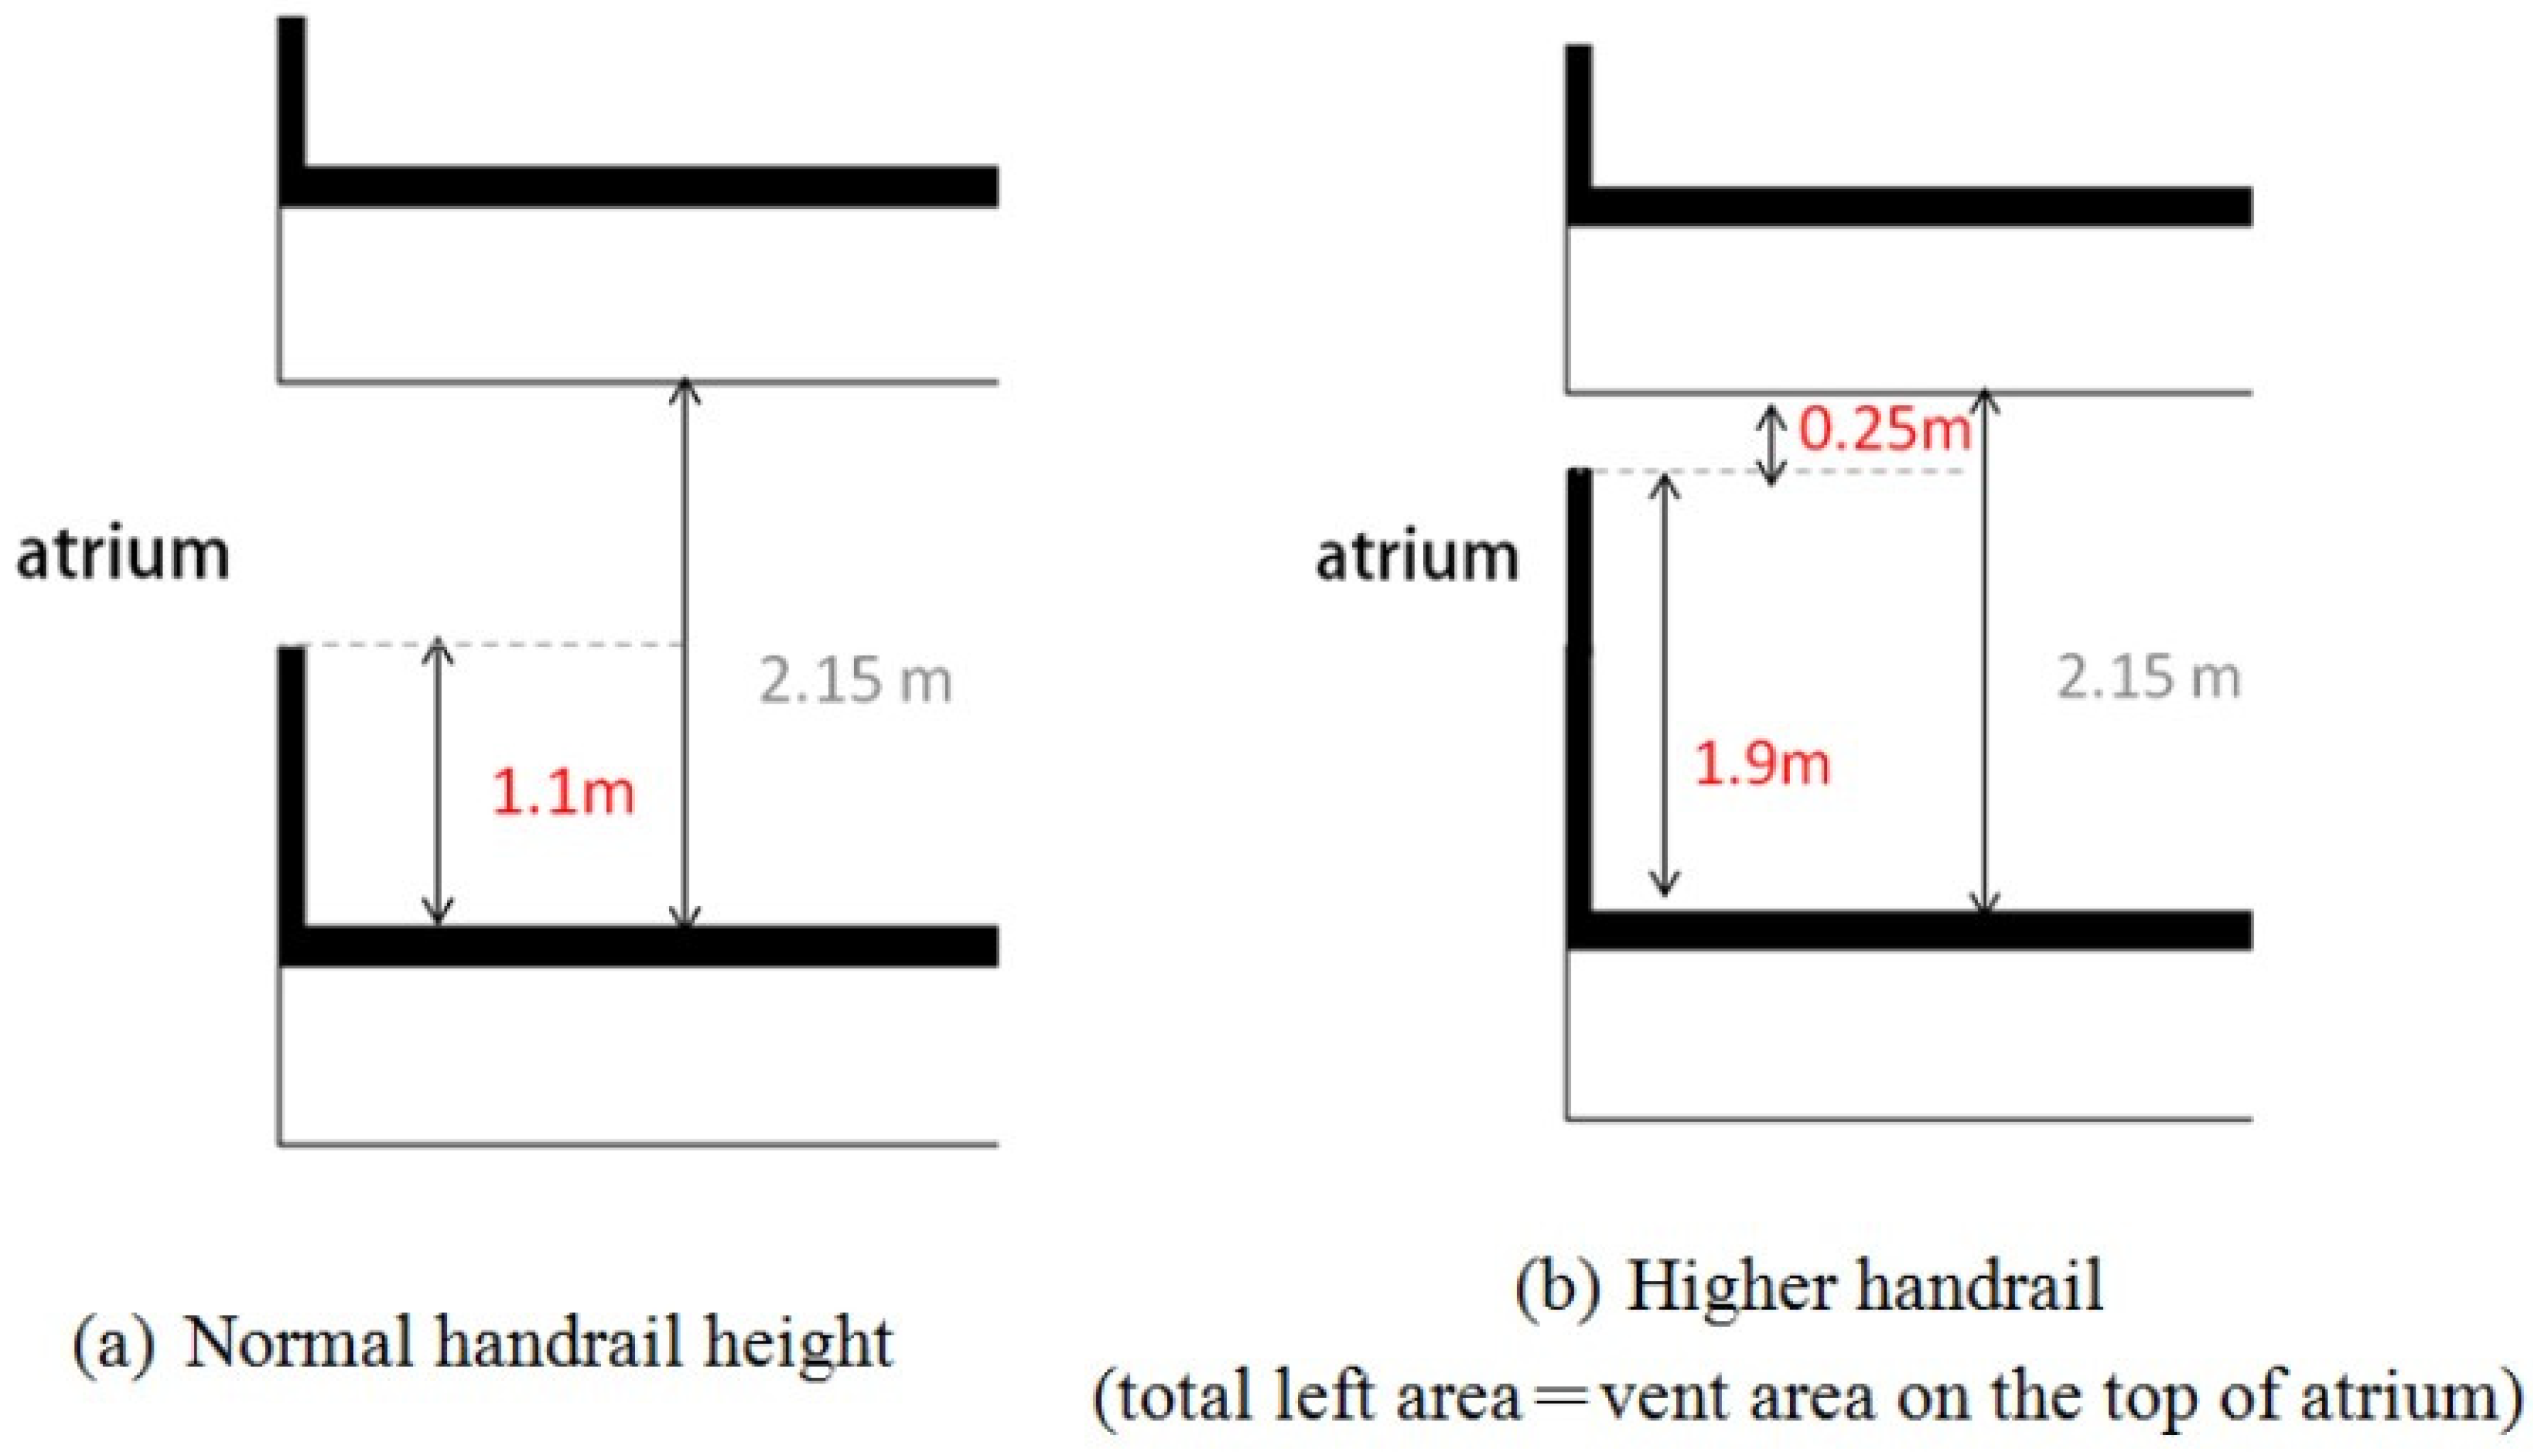
This set was used to evaluate the interactive effects of various SA locations and handrail heights on thermal comfort. The settings for the third simulation were identical to those of the second set and two heights of the handrail near the atrium were considered (Figure 7).
Forth simulation set:
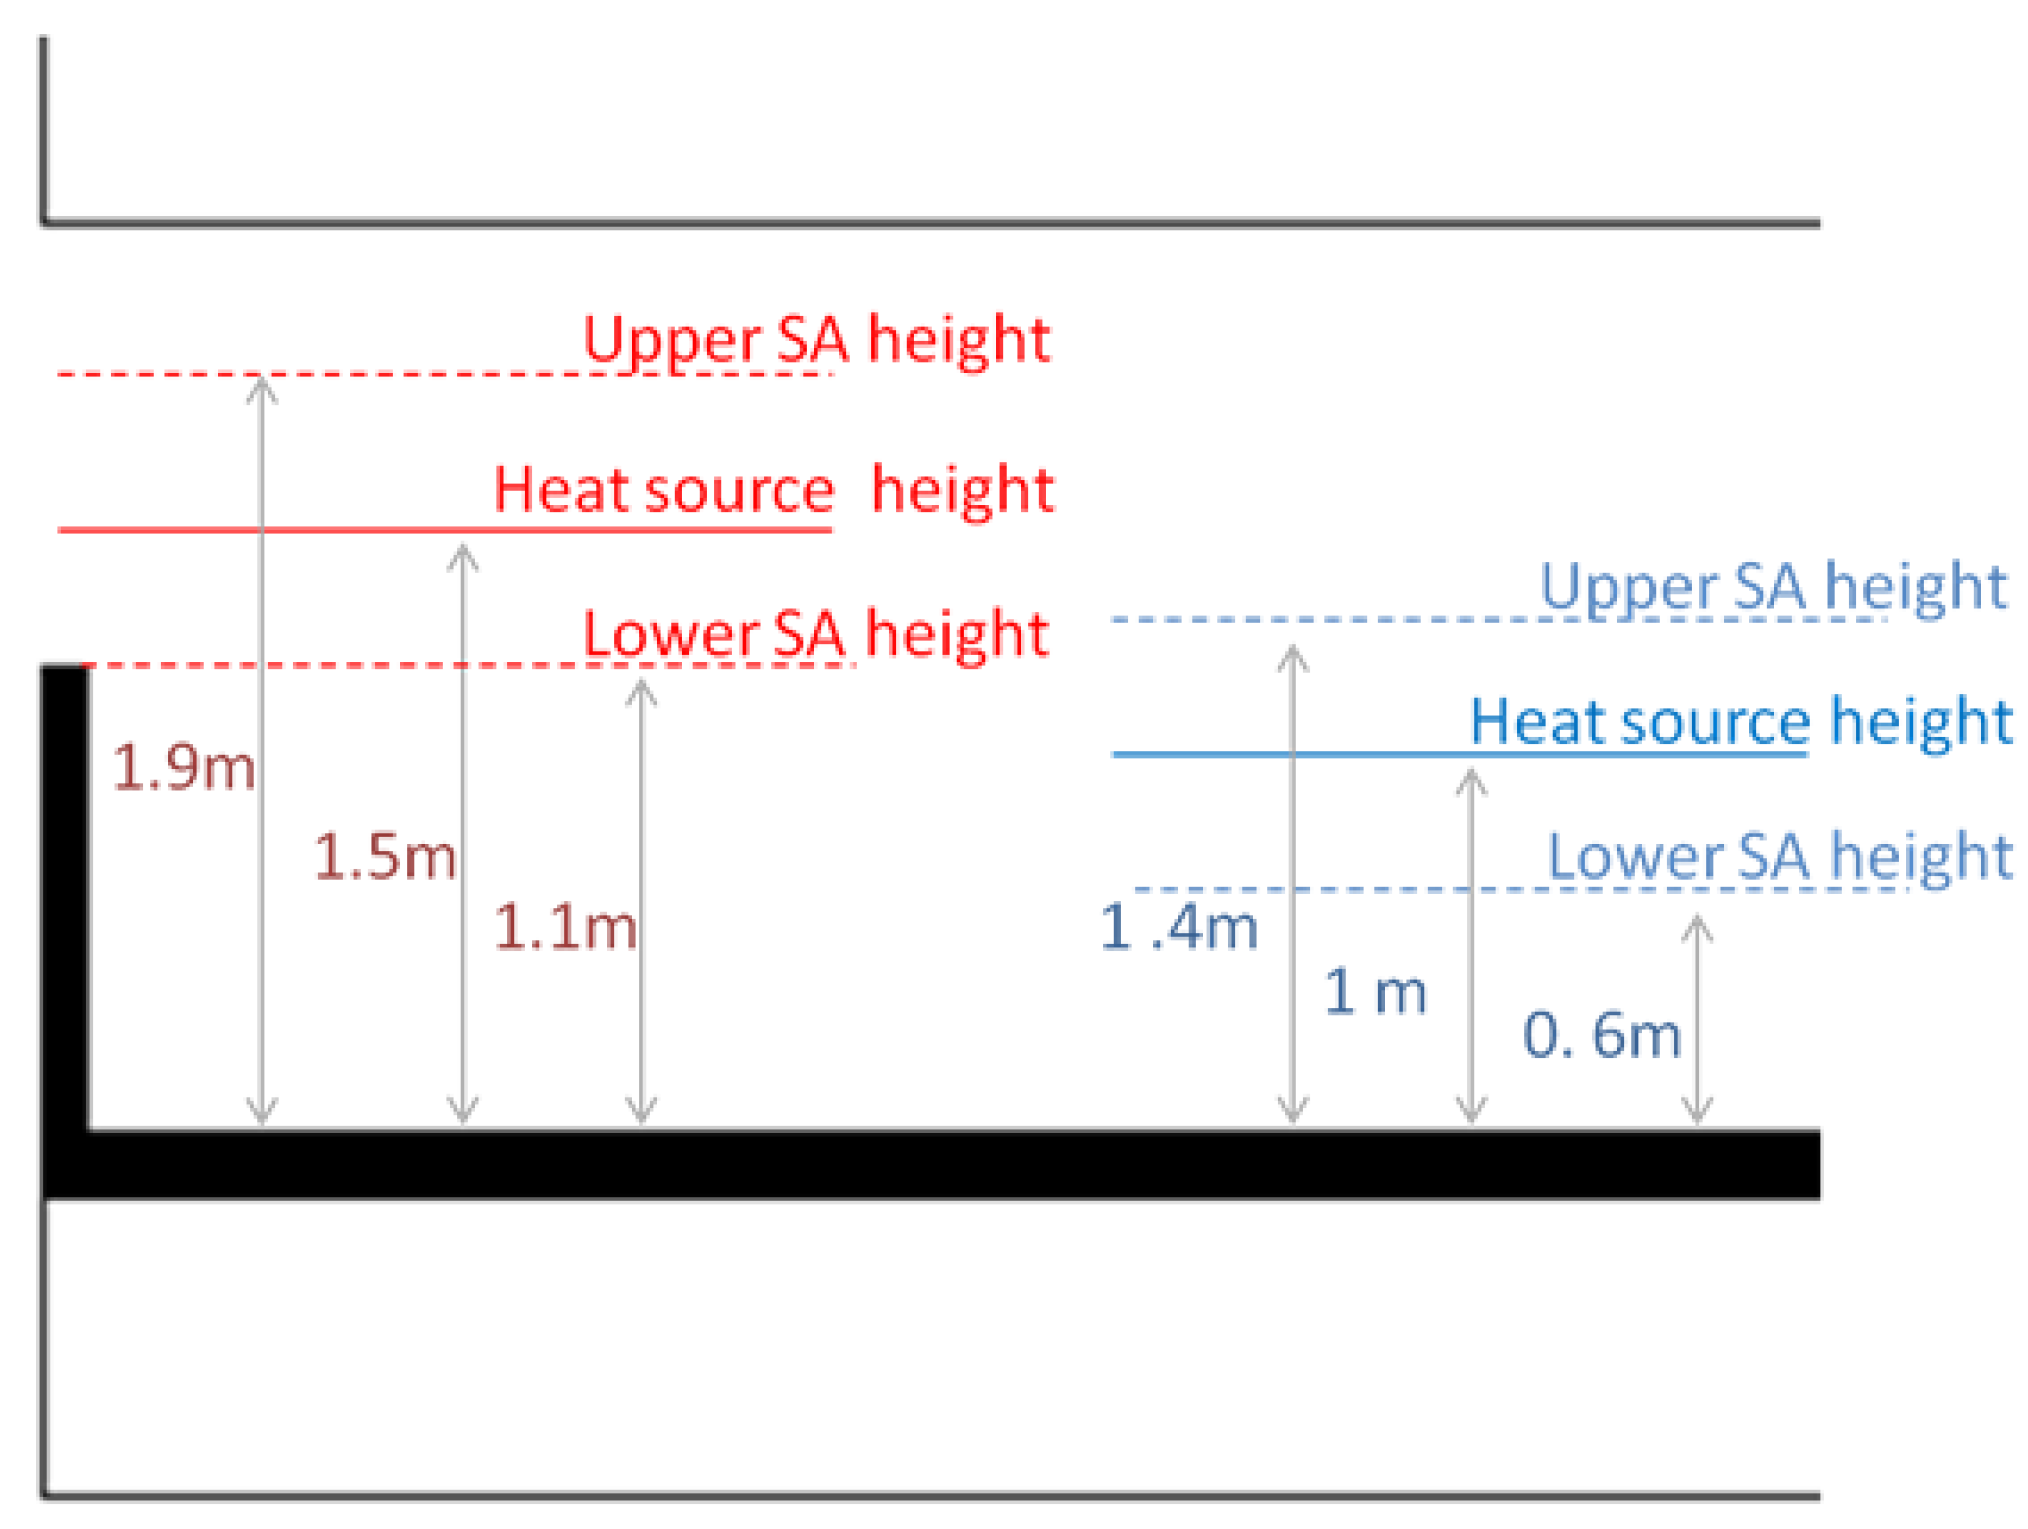
This set was used to evaluate the interactive effects of heat source, SA, and ceiling height (Figure 8). On the basis of sitting and standing height, the heat sources were set at the heights of 1.5 m and 1.0 m, respectively. The SA locations were set at the distance of 0.4 m above and under the heat sources, respectively. The ceiling heights of 2.15 m and 2.45 m were also examined on the basis of local office building regulations.
4. Methodology
4.1. Neutral Level Height and Flow Flux
Linden [9] revealed that the flow driven by heat sources with heat flux W can be characterized by the buoyancy flux, which is calculated using the following equation:
where γ is the coefficient of expansion and CP is the specific heat capacity at a constant pressure (Notably, the buoyancy flux due to a heat flux of W (kilowatts) in the air at room temperature is B = 0.0281 W, where B is measured in m4s−3).
In an enclosure with high-level and low-level openings generated by a single point source of buoyancy on the floor of the enclosure, a simple stratification consisting of two layers separated by a horizontal interface can be developed. The lower layer has a uniform ambient temperature, whereas the upper layer has a uniform but higher temperature that is determined by the buoyancy flux from the source. The dimensionless depth of the cool ambient layer, = h/H, is given by
where h is the height of the neutral level, HS is the distance between the highest and lowest openings, and A* is the effective opening area.
The total flow flux through the room can be known as:
4.2. Occupant Density
Occupant density can differ depending on building types and locations. Generally, an average working space area is approximately 9.3–16.7 m2/person [25] in the United States, 6–12 m2/person [26] in Europe, and 4–8 m2/person [27] in Asia. The occupant density of the building, examined in the present study, allowed for an average working space area of 8 m2/person. However, the occupant density of the public area was difficult to estimate. Therefore, in this present study, the density of the public area was assumed to be identical to that of office rooms.
4.3. Heat Source
In addition to occupancy, equipment also influences the heat flux and indoor thermal comfort in a building. In contrast to office rooms with various equipment, only lighting equipment was considered for the public area. The heat flux of lighting was approximately 16 W/m2 (DF < 1). According to the American Society of Heating, Refrigerating and Air-Condition Engineers (ASHRAE) handbook [28], a walking man produces 130 W and generates 6 × 10⁻⁵ kg/s of moisture [29]. Overall, the heat source condition on each floor was 16 W/m2 for lighting heat, 16.25 W/m2 for human heat, and 7.5 × 10⁻⁶ kg/m2s for moisture generation.
4.4. Weather Condition
To limit the number of factors considered, the only weather condition considered in this study was temperatures of more than 24 °C; the prevailing wind was disregarded. According to air-conditioning engineering design for the studied building, 4000 cfm of external air (OA) is assigned for the office rooms on each floor. Therefore, the balance temperature in the public was predicted to be approximately 28 °C. That is, when the external temperature was higher than 28 °C, the atrium may only have tiny effects. Therefore, in the present study, the ambient temperatures of 24 °C and 30 °C were first considered for the evaluation of the effects of ambient conditions on stack ventilation. Table 2 presents the weather data at 24 °C and 30 °C.
4.5. CFD Model
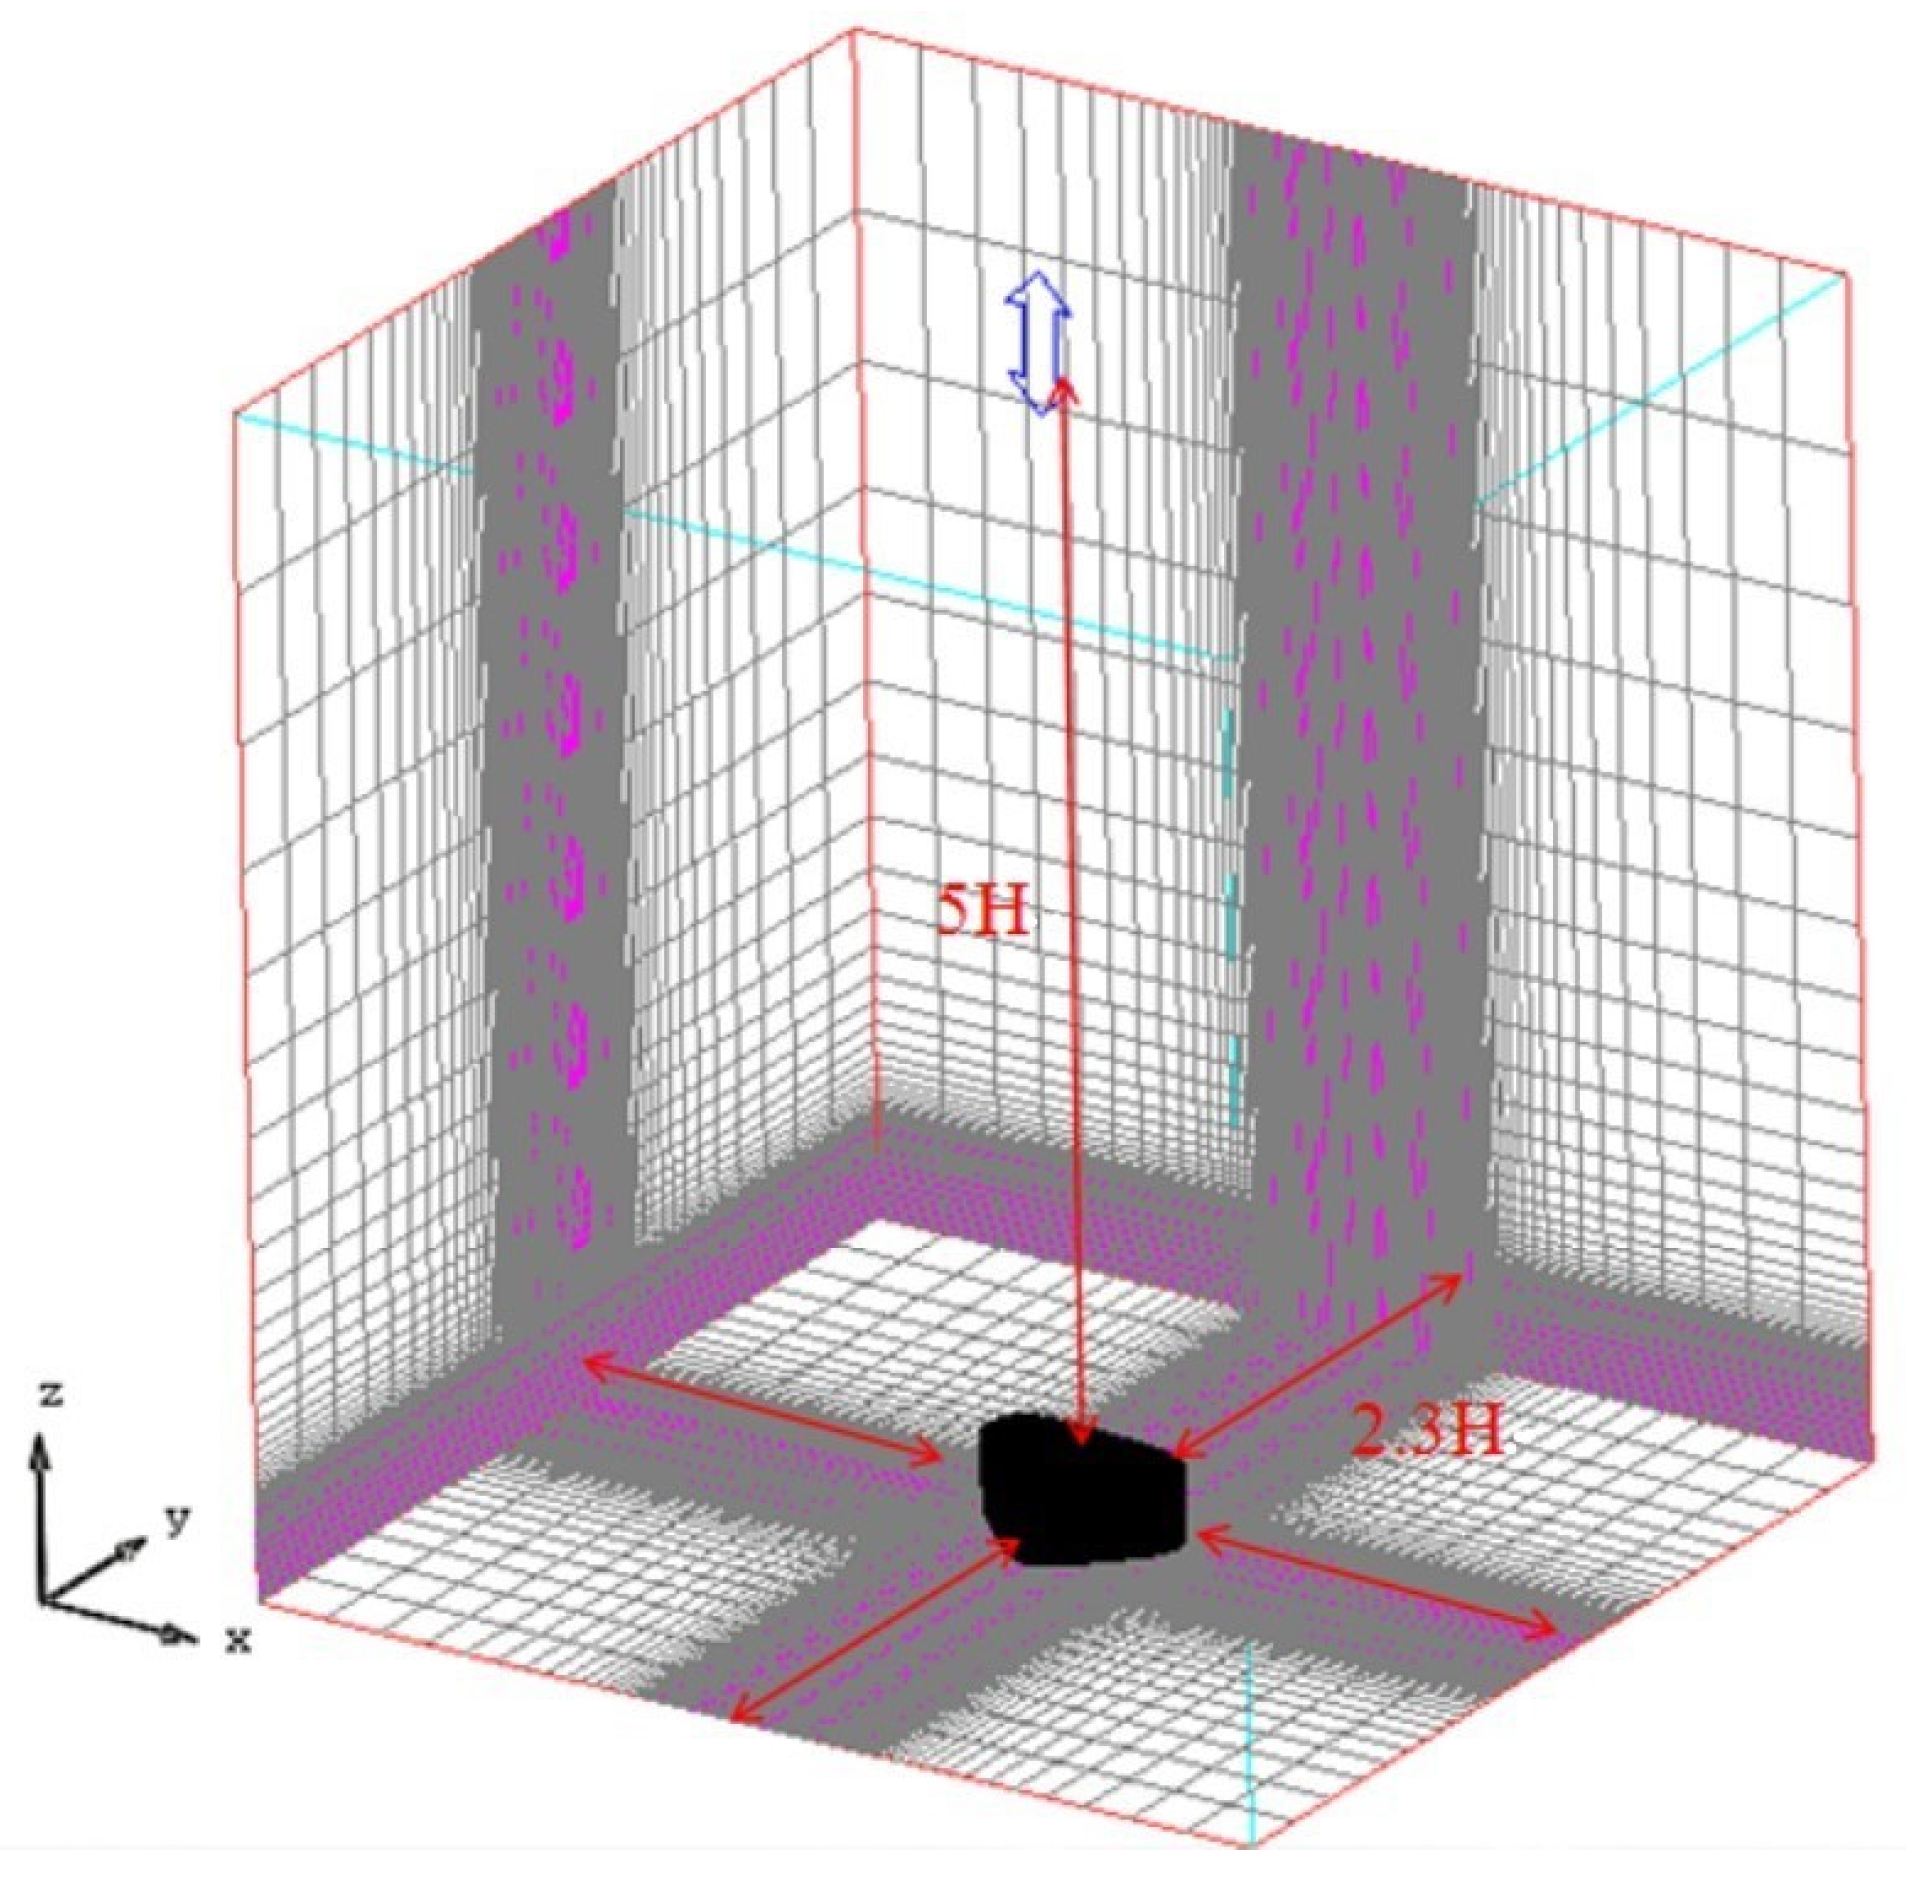
Gan argued that even if the prevailing wind is not considered, a simulation domain should be extended, such that accurate results can be obtained [30]. The present study referenced a study by Franke et al. [31] to extend the computational domain by 5 H (H is building height) above the roof of the building and by 2.3 H between the building sidewalls and the boundary. Based on this assumption, the dimensions of the computational domain in this study were set to 318.85 m, 300.46 m, and 347.3 m for the x-axis, y-axis, and z-axis, respectively (Figure 9).
Numerous studies have used the standard k-ε turbulence model. However, the simulations using the RNG k-ε model by Posner et al. [32] showed superior agreement with experimental data and demonstrated greater feasibility for predicting the indoor airflow relative to the standard k-ε turbulence model. For the RNG k-ε turbulence equation, the empirical turbulence coefficients were set as follows: = 0.7179, = 0.7179, = 1.68, and = 0.085. Thermal effect, buoyancy, and humidity were all considered.
4.6. Evaluation Index
Predicted mean vote-predicted percentage dissatisfied (PMV-PPD) is a comprehensive index for assessing thermal comfort. The PMV of a large population of people exposed to a certain environment is derived from the physics of heat transfer combined with an empirical fit to sensation. PMV establishes a thermal change based on steady-state heat transfer between the human body and the environment and assigns a comfort vote for that amount of change. The PMV equation only applies to humans who are exposed for a long period to constant conditions at a constant metabolic rate. Through the application of conservation of energy, the following heat balance equation can be obtained [28]:
PPMV = 4 + (0.303 exp(−0.036 H) + 0.0275) × {6.57 + 0.46 H + 0.31 Pa + 0.0017 HPa + 0.0014 HTa − 4.13 fcl (1 + 0.01 dT) (Tcl − Tr) − hcfcl (Tcl − Ta)}
- Ta: air temperature
- Pa: pressure
- Tr: mean radiation temperature
- v: velocity
- H: metabolism
- Tcl: surface temperature of clothing
- fcl: thermal resistance of clothing
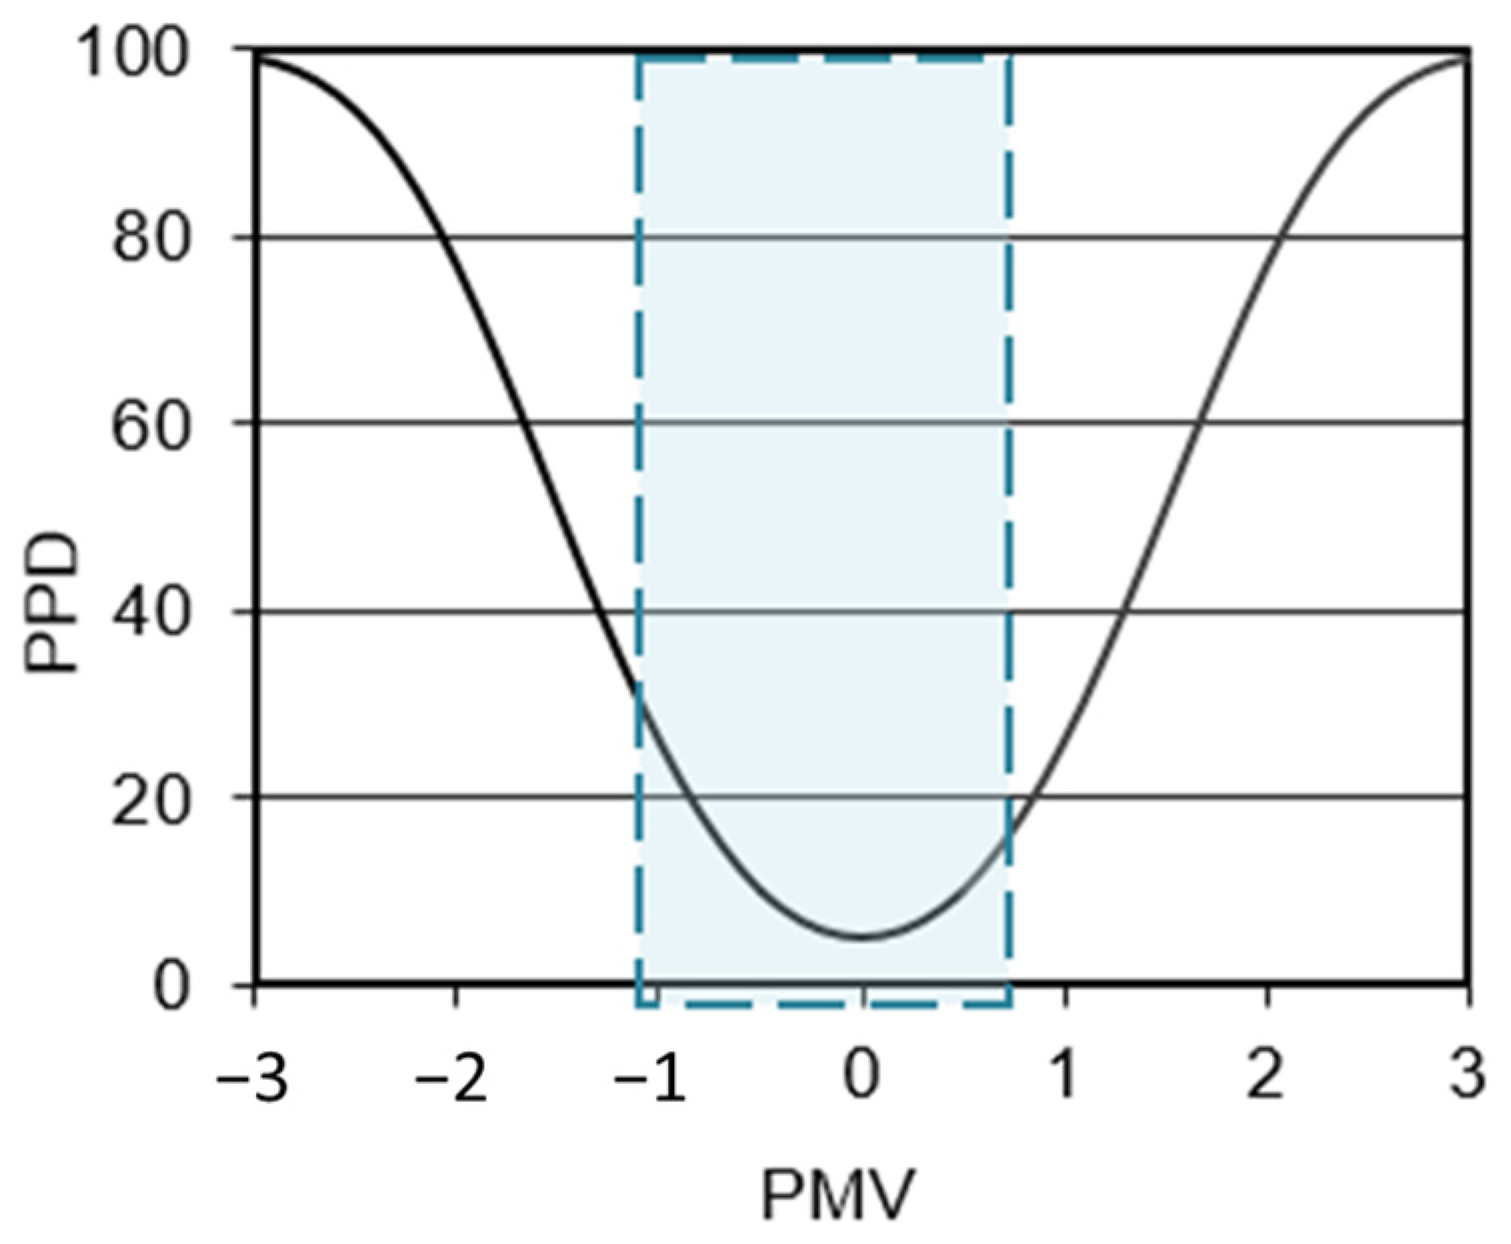
The sensation of thermal comfort can be expressed using seven levels and a range between −3 and 3. The middle point, the value of zero, means comfortable sensation. A negative direction away from zero presents colder gradually and a positive direction means hotter, as listed in Table 3. PPD is the predicted percent of people unsatisfied at each PMV. As PMV changes away from zero in either the positive or negative direction, PPD increases.
PPD = 100 − 95 exp[−(0.03353 PMV4 + 0.2179 PMV2)]
According to ASHRAE Standard 55, the range of comfortable sensation is more than −0.5 and less than 0.5 for PMV and less than 10% for PPD [33]. However, Wong et al. indicated that [34,35] the comfort range can be extended by 0.5 more for people living in tropical and sub-tropical zones. In the present study, +1 was thus adopted as the criterion for evaluating the thermal comfort in a building (Figure 10).
The vertical temperature distribution is also a key index to evaluate thermal comfort in a space, especially when displacement ventilation is applied. If a gradient is sufficiently enough, local warm discomfort can occur at the head and cold discomfort can occur at the feet, although the body as a whole remains thermally neutral. Generally, the air temperature difference in the vertical direction should ideally be less than 3 °C between the head (1.1 m above the floor) and ankles (0.1 m above the floor) [28].
5. Result and Discussion
5.1. CFD Validation
To ensure the validity of the numerical procedure and boundary condition for the present study, an additional simulation was conducted, and the results were compared with those of in Linden’s study [9]. Natural ventilation with an external temperature of 24 °C was first applied for the building model.
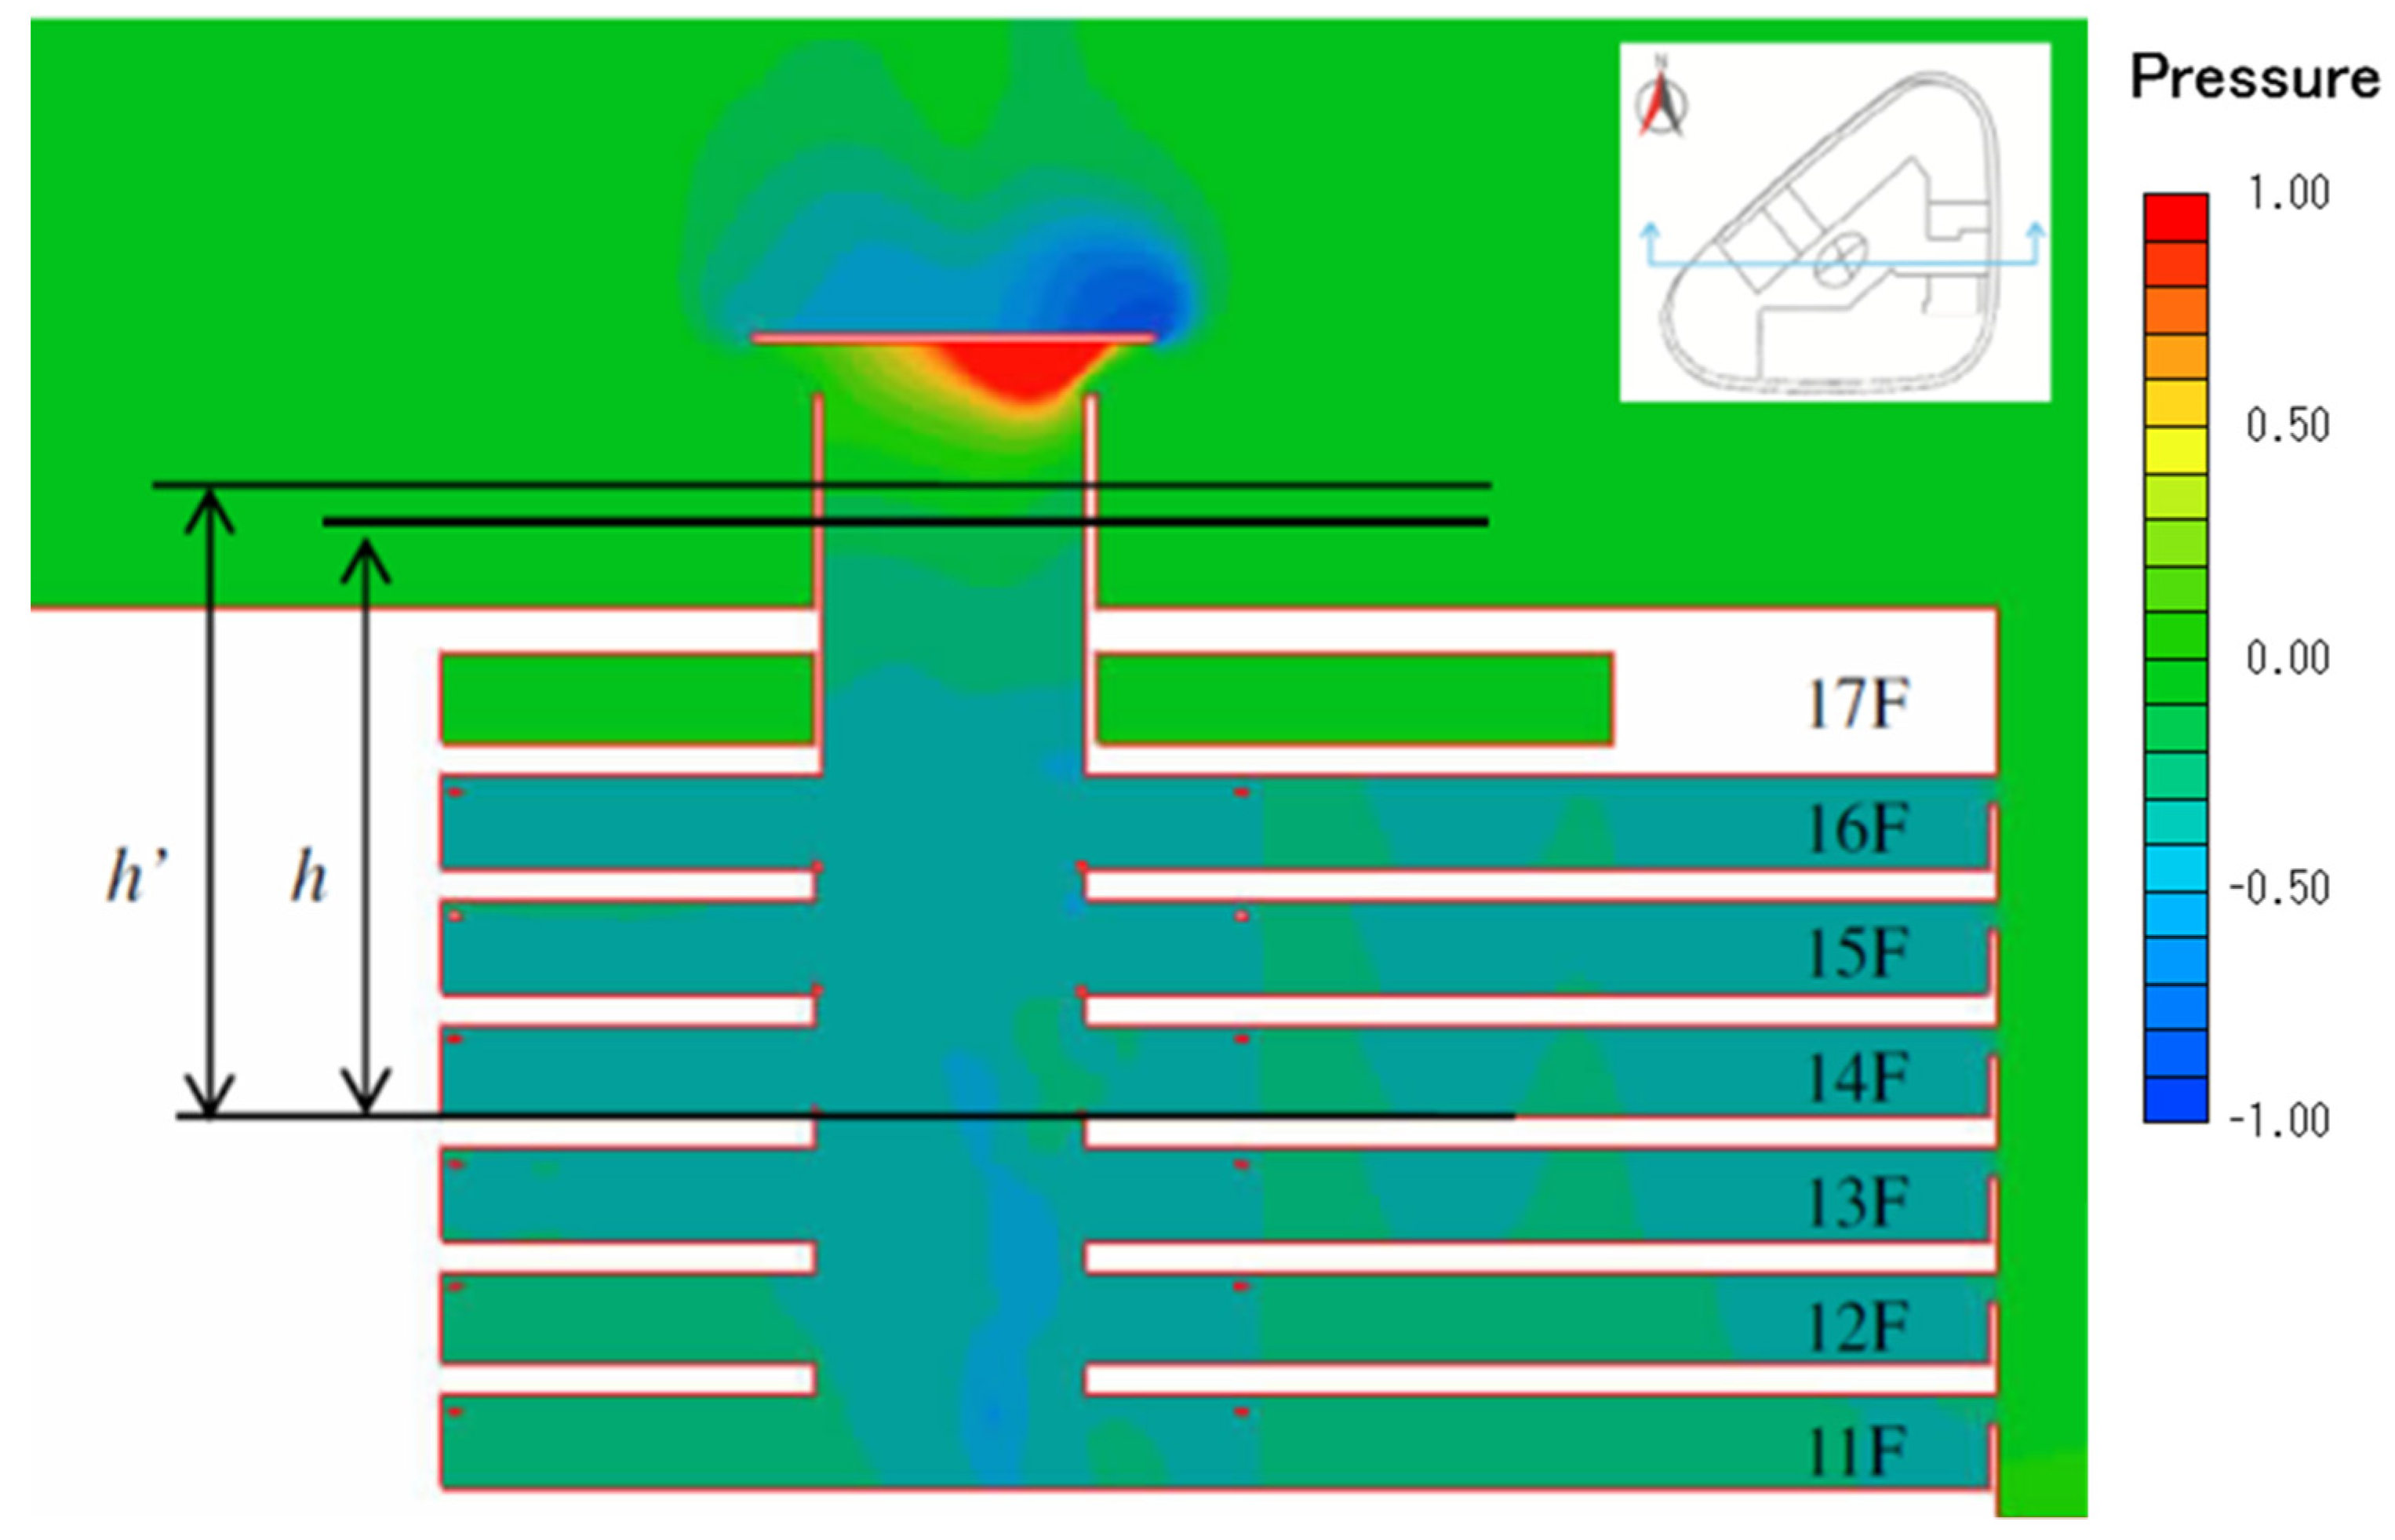
As presented in Figure 11, the vent area on the top of the atrium and the total intake area on the east side were, respectively, 30 and 14.4 m2 (2.4 m2 for each floor). The heat source, which was 32.25 W/m2 (16 + 16.25 W/m2) as a heat point in the middle of the building. The simulation results indicated that the neutral level height was 14.35 m above the heat source and the total airflow through the building was 6.86 m3/s The differences between these values and the calculations by Linden’s study were all less than 10%, which indicated that the present numerical procedure was adequate and reliable (Table 4 and Table 5).
5.2. Grid-Sensitivity Analysis
To obtain more information on the inside of the simulated building, the grids used for the present study were not uniform in size, and their densities were closer to that of the public area and stacked with a growth rate of 1.2. The total mesh number was 18,811,826 (374 in x-axis, 281 in y-axis, and 179 in z-axis).
To reduce numerical errors, both iterative convergence and grid setting should be assessed. In this study, a grid-sensitivity analysis was performed by comparing the chosen grid to a grid with mesh density that is twice as fine. Table 6 presents the results of velocity from the intake on the east side of the building. The selected grid was considered satisfactory because the maximum discrepancy between the two grid arrangements was less than 10%.
5.3. Ambient Condition Effect When Intakes Are Open
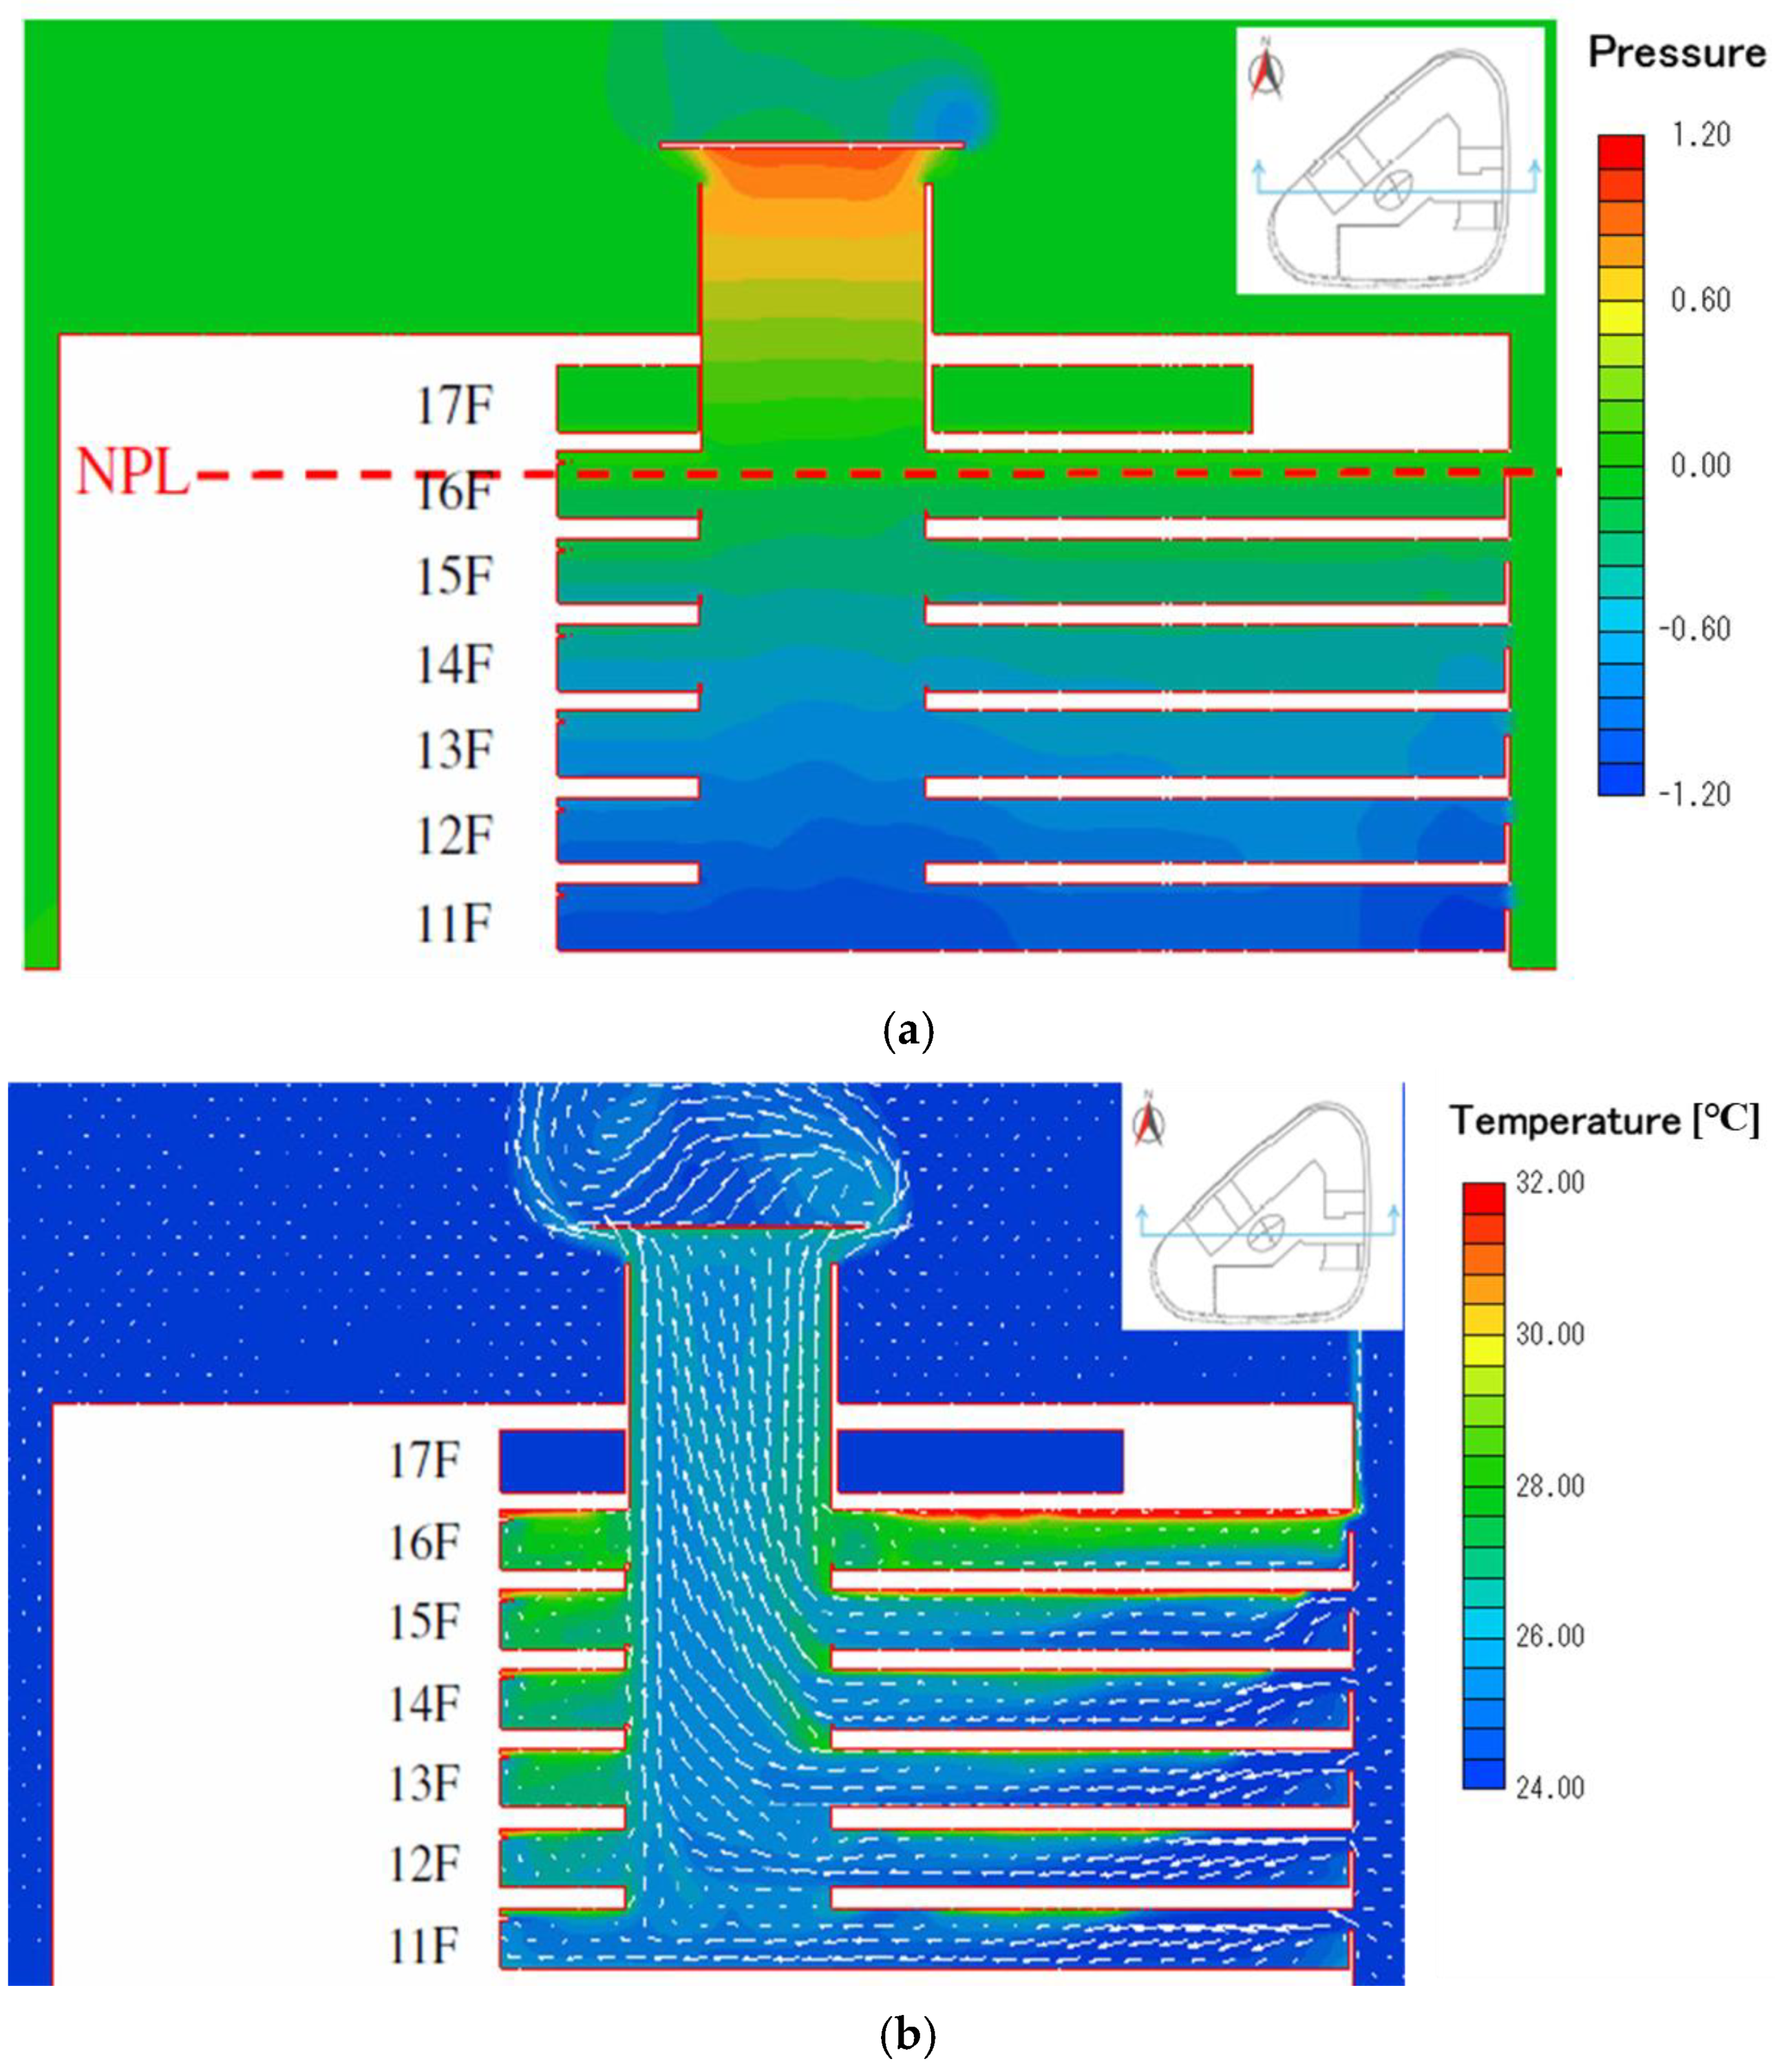
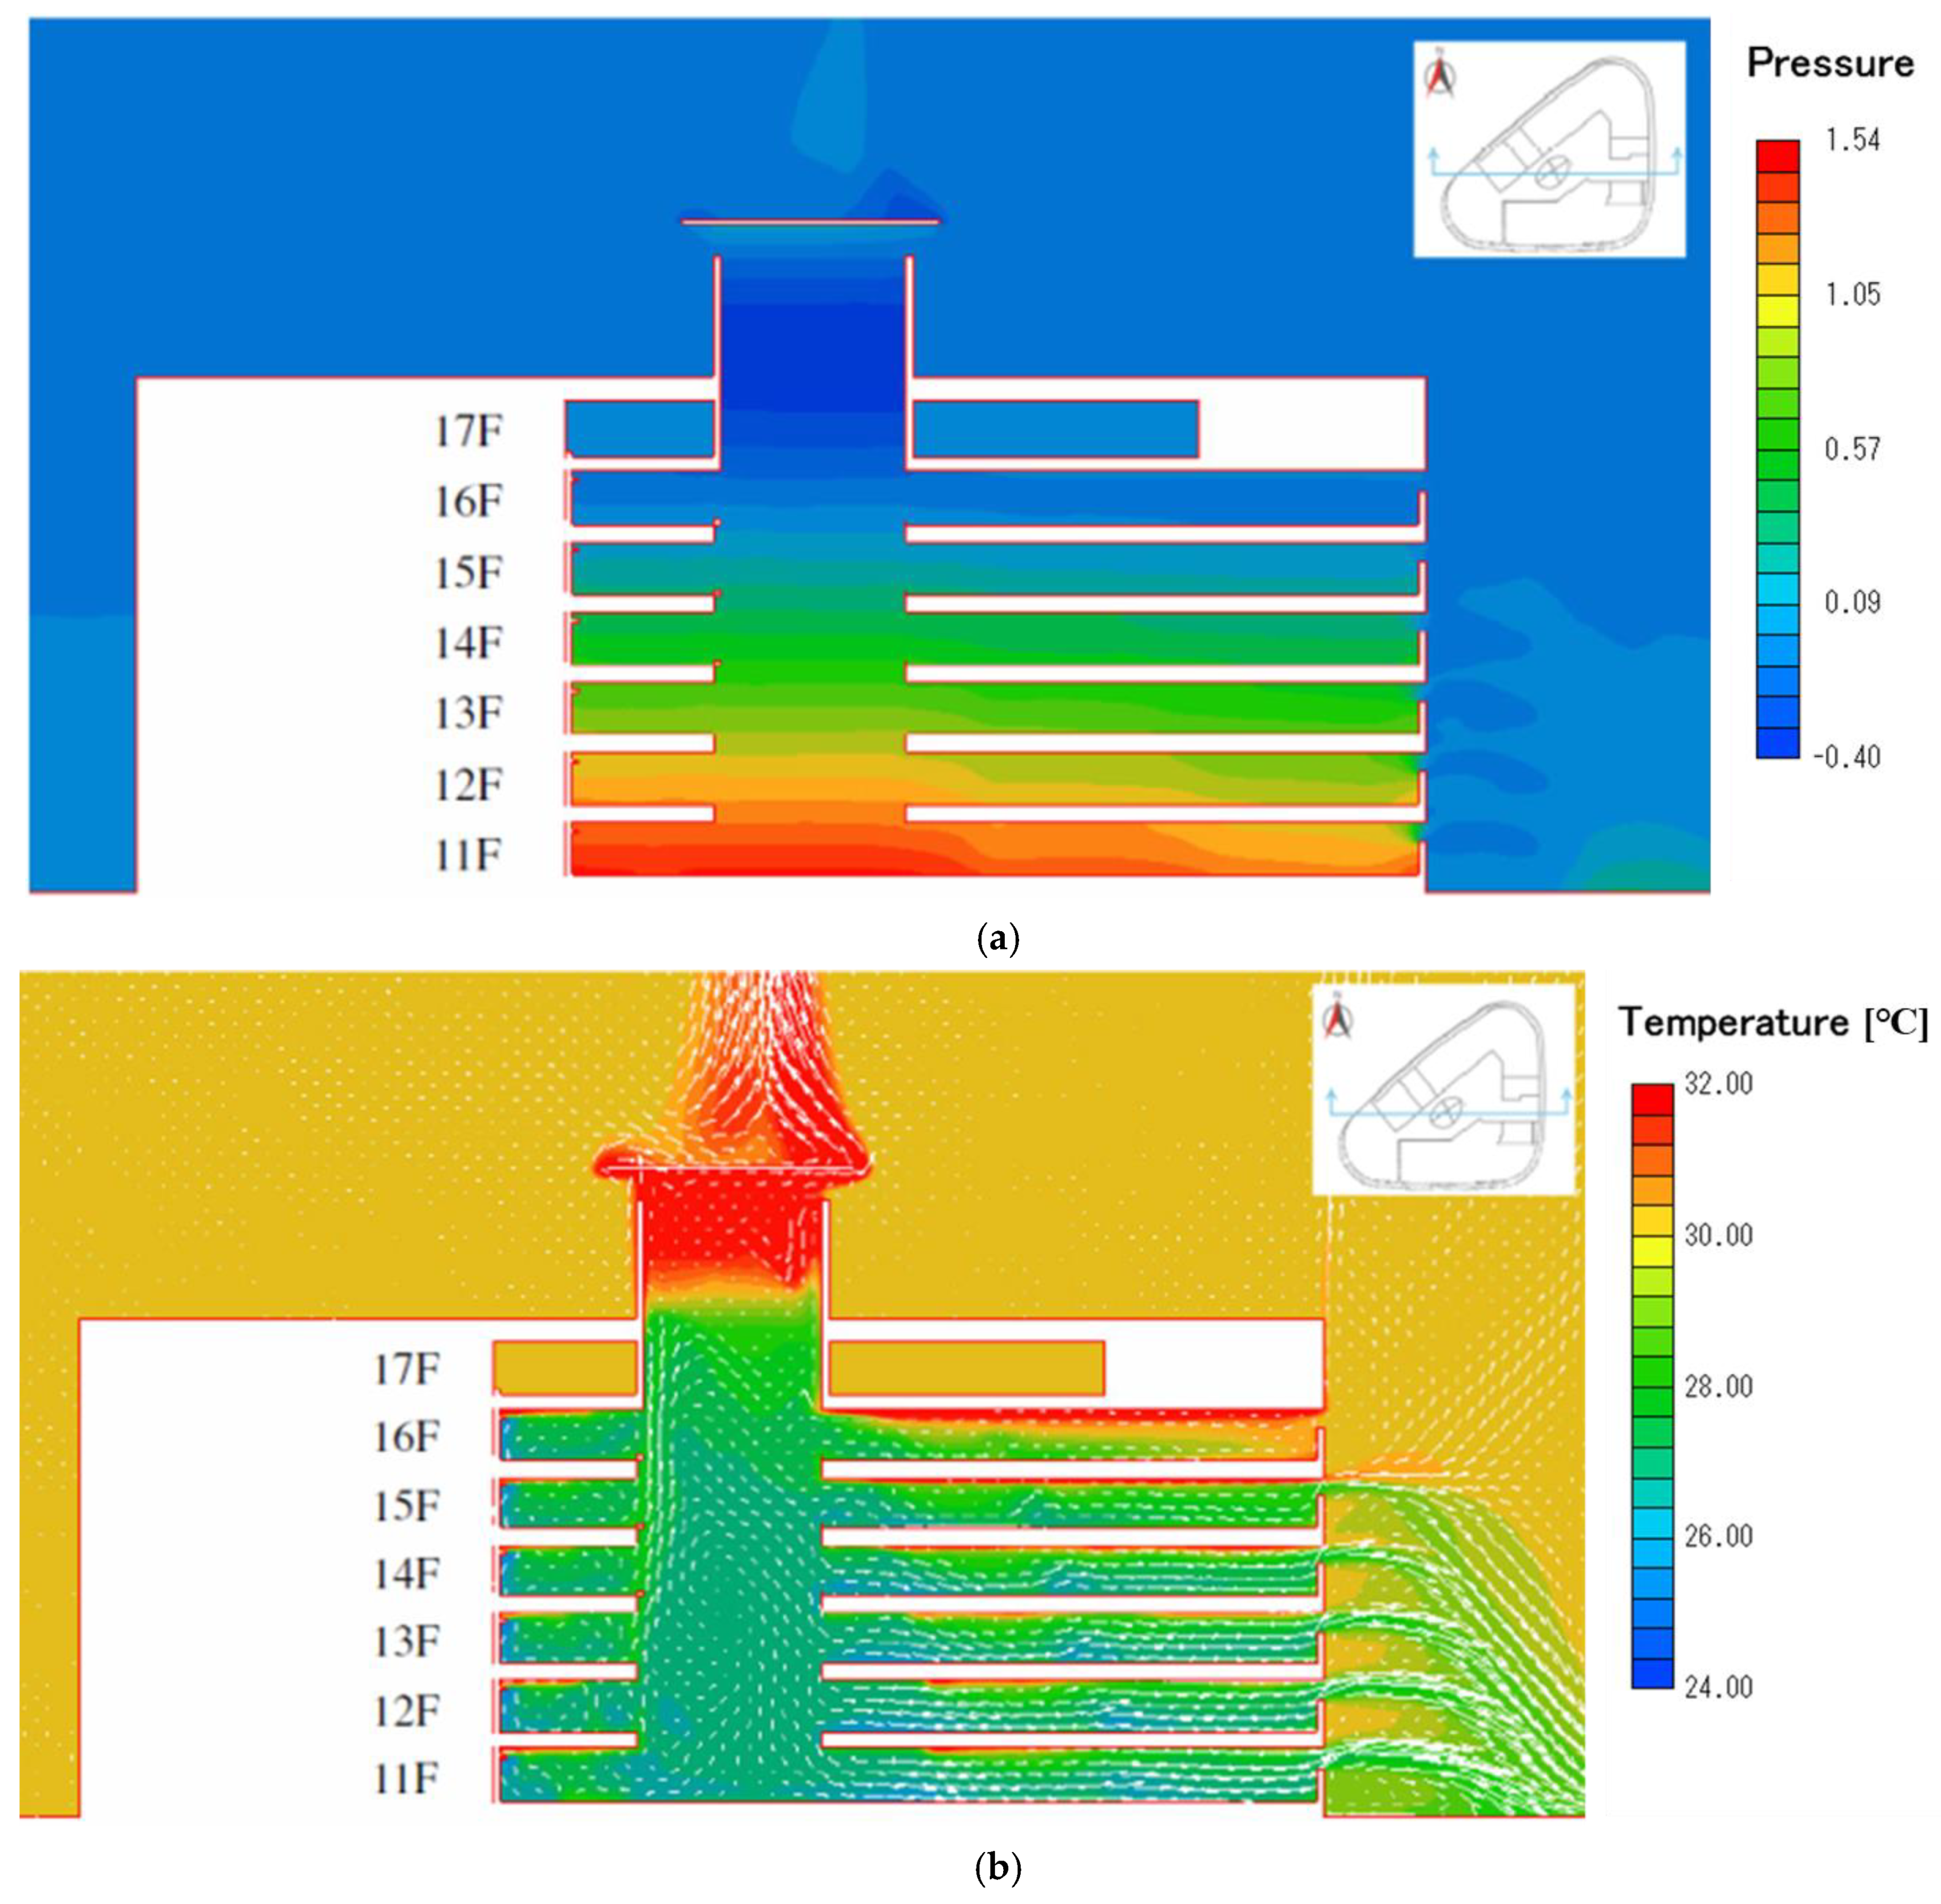
The model employing an ambient temperature of 24 °C was first simulated to evaluate how cold air from office rooms (SA) improves the thermal comfort in the public area and the results obtained were almost identical to those of another study [13]. Specifically, the flow rate was smaller on higher floors, and the neutral level height decreased by approximately 3 m compared with the simulation in which fully natural ventilation was applied (Figure 12). Therefore, the airflow on 16F was reversed (i.e., flowed inward) resulting in an increased temperature. The PMV value on this floor was as high as 0.96, which was still an acceptable value. Overall, when the ambient temperature was at 24 °C, the PMV value should be maintained at less than 1.0 in the public area; in this manner, all floors can have ventilation with both external air (OA) and cold air from office rooms (SA) (Table 7).
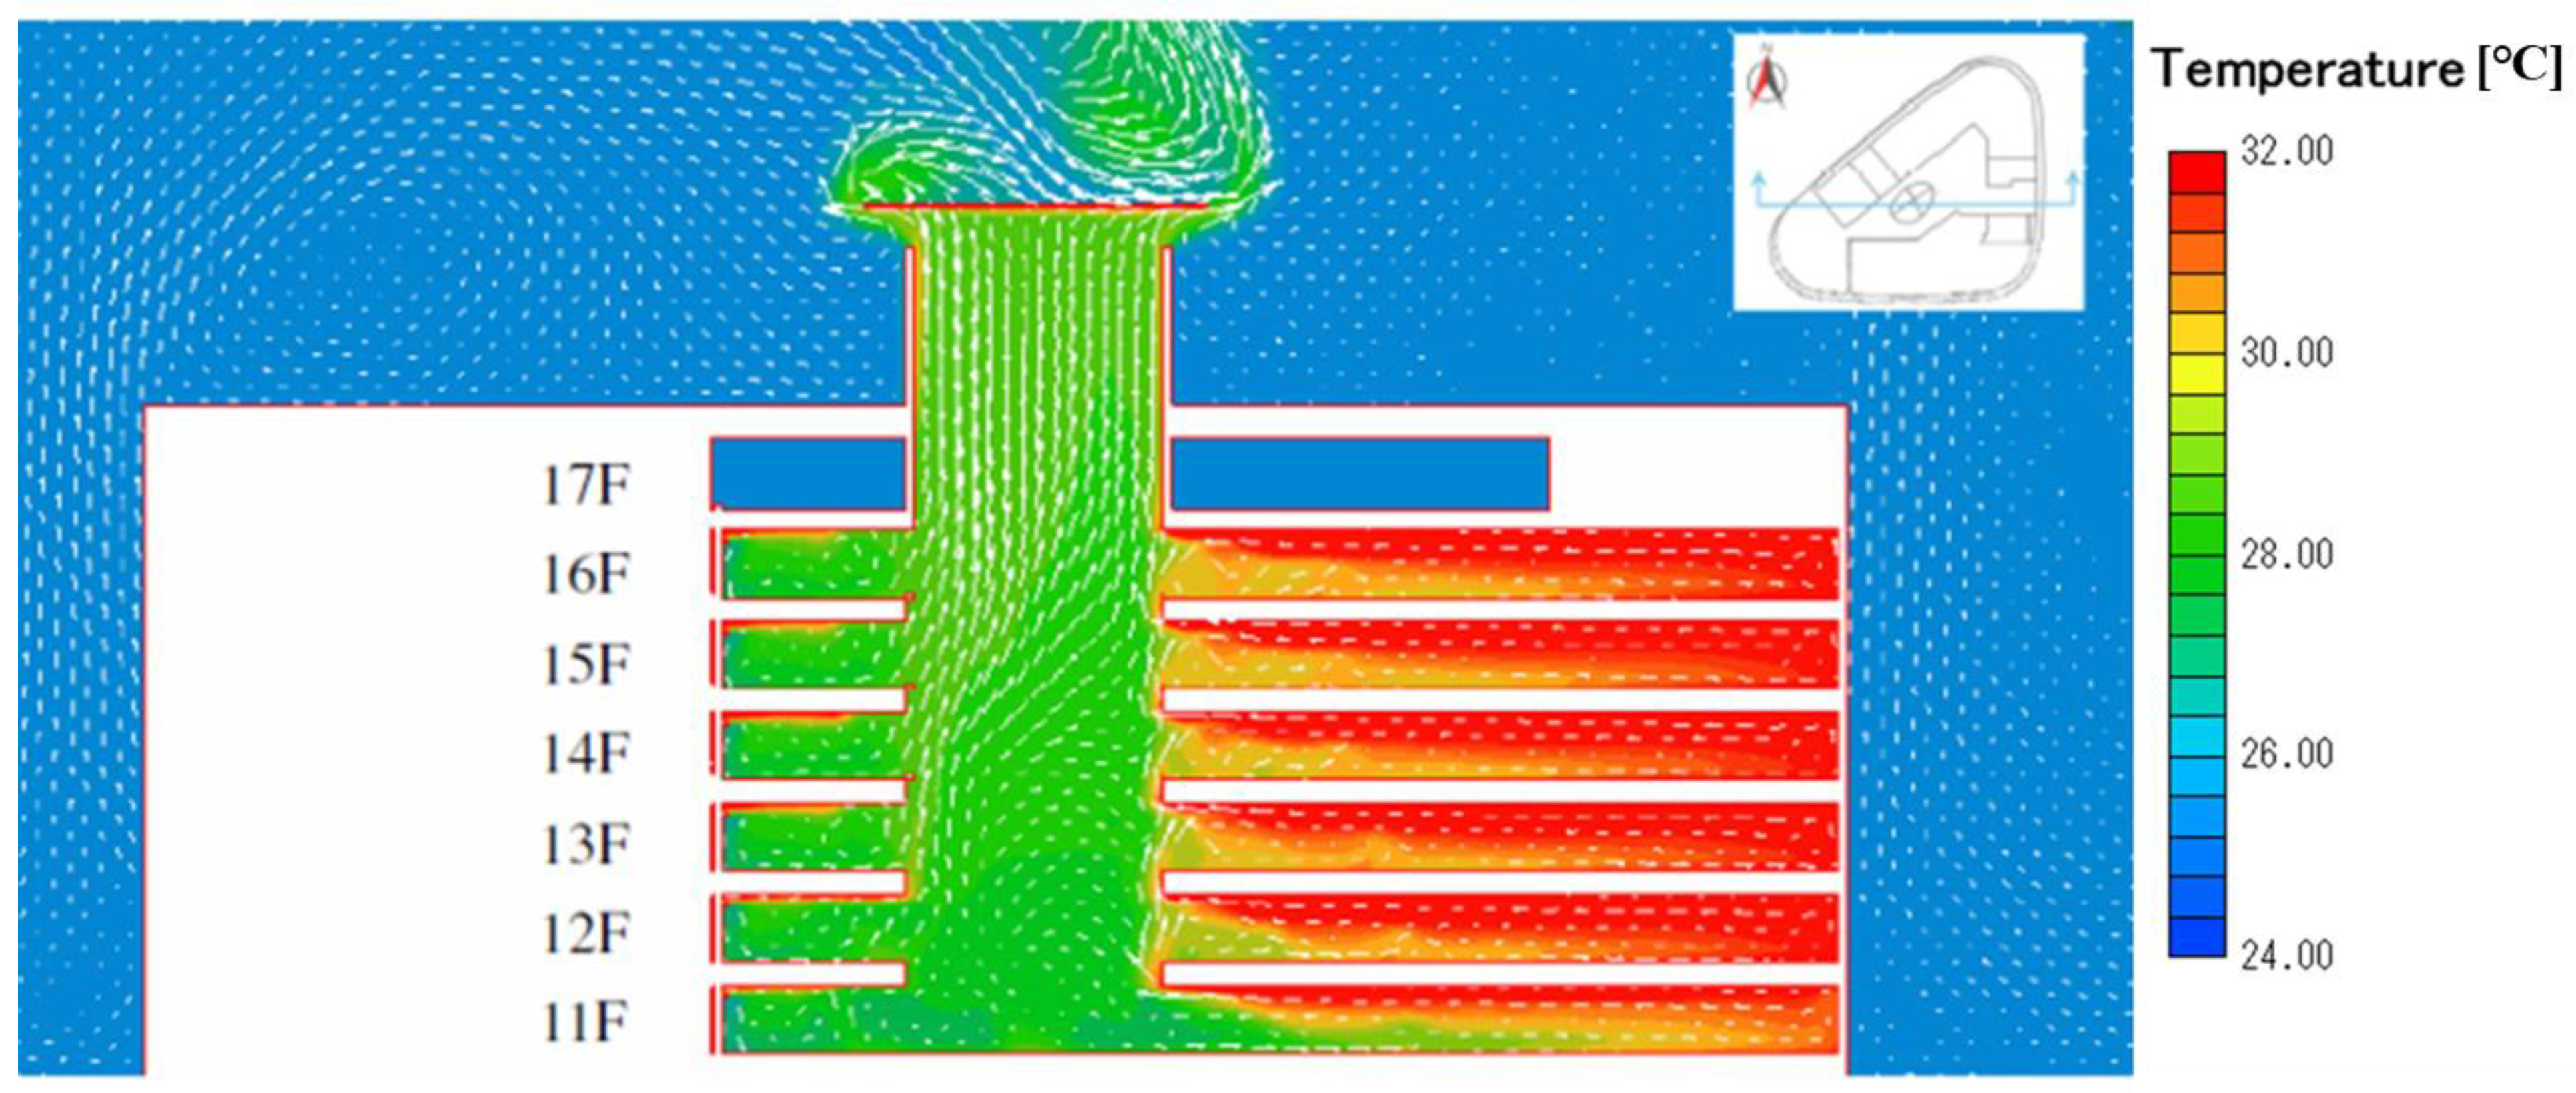
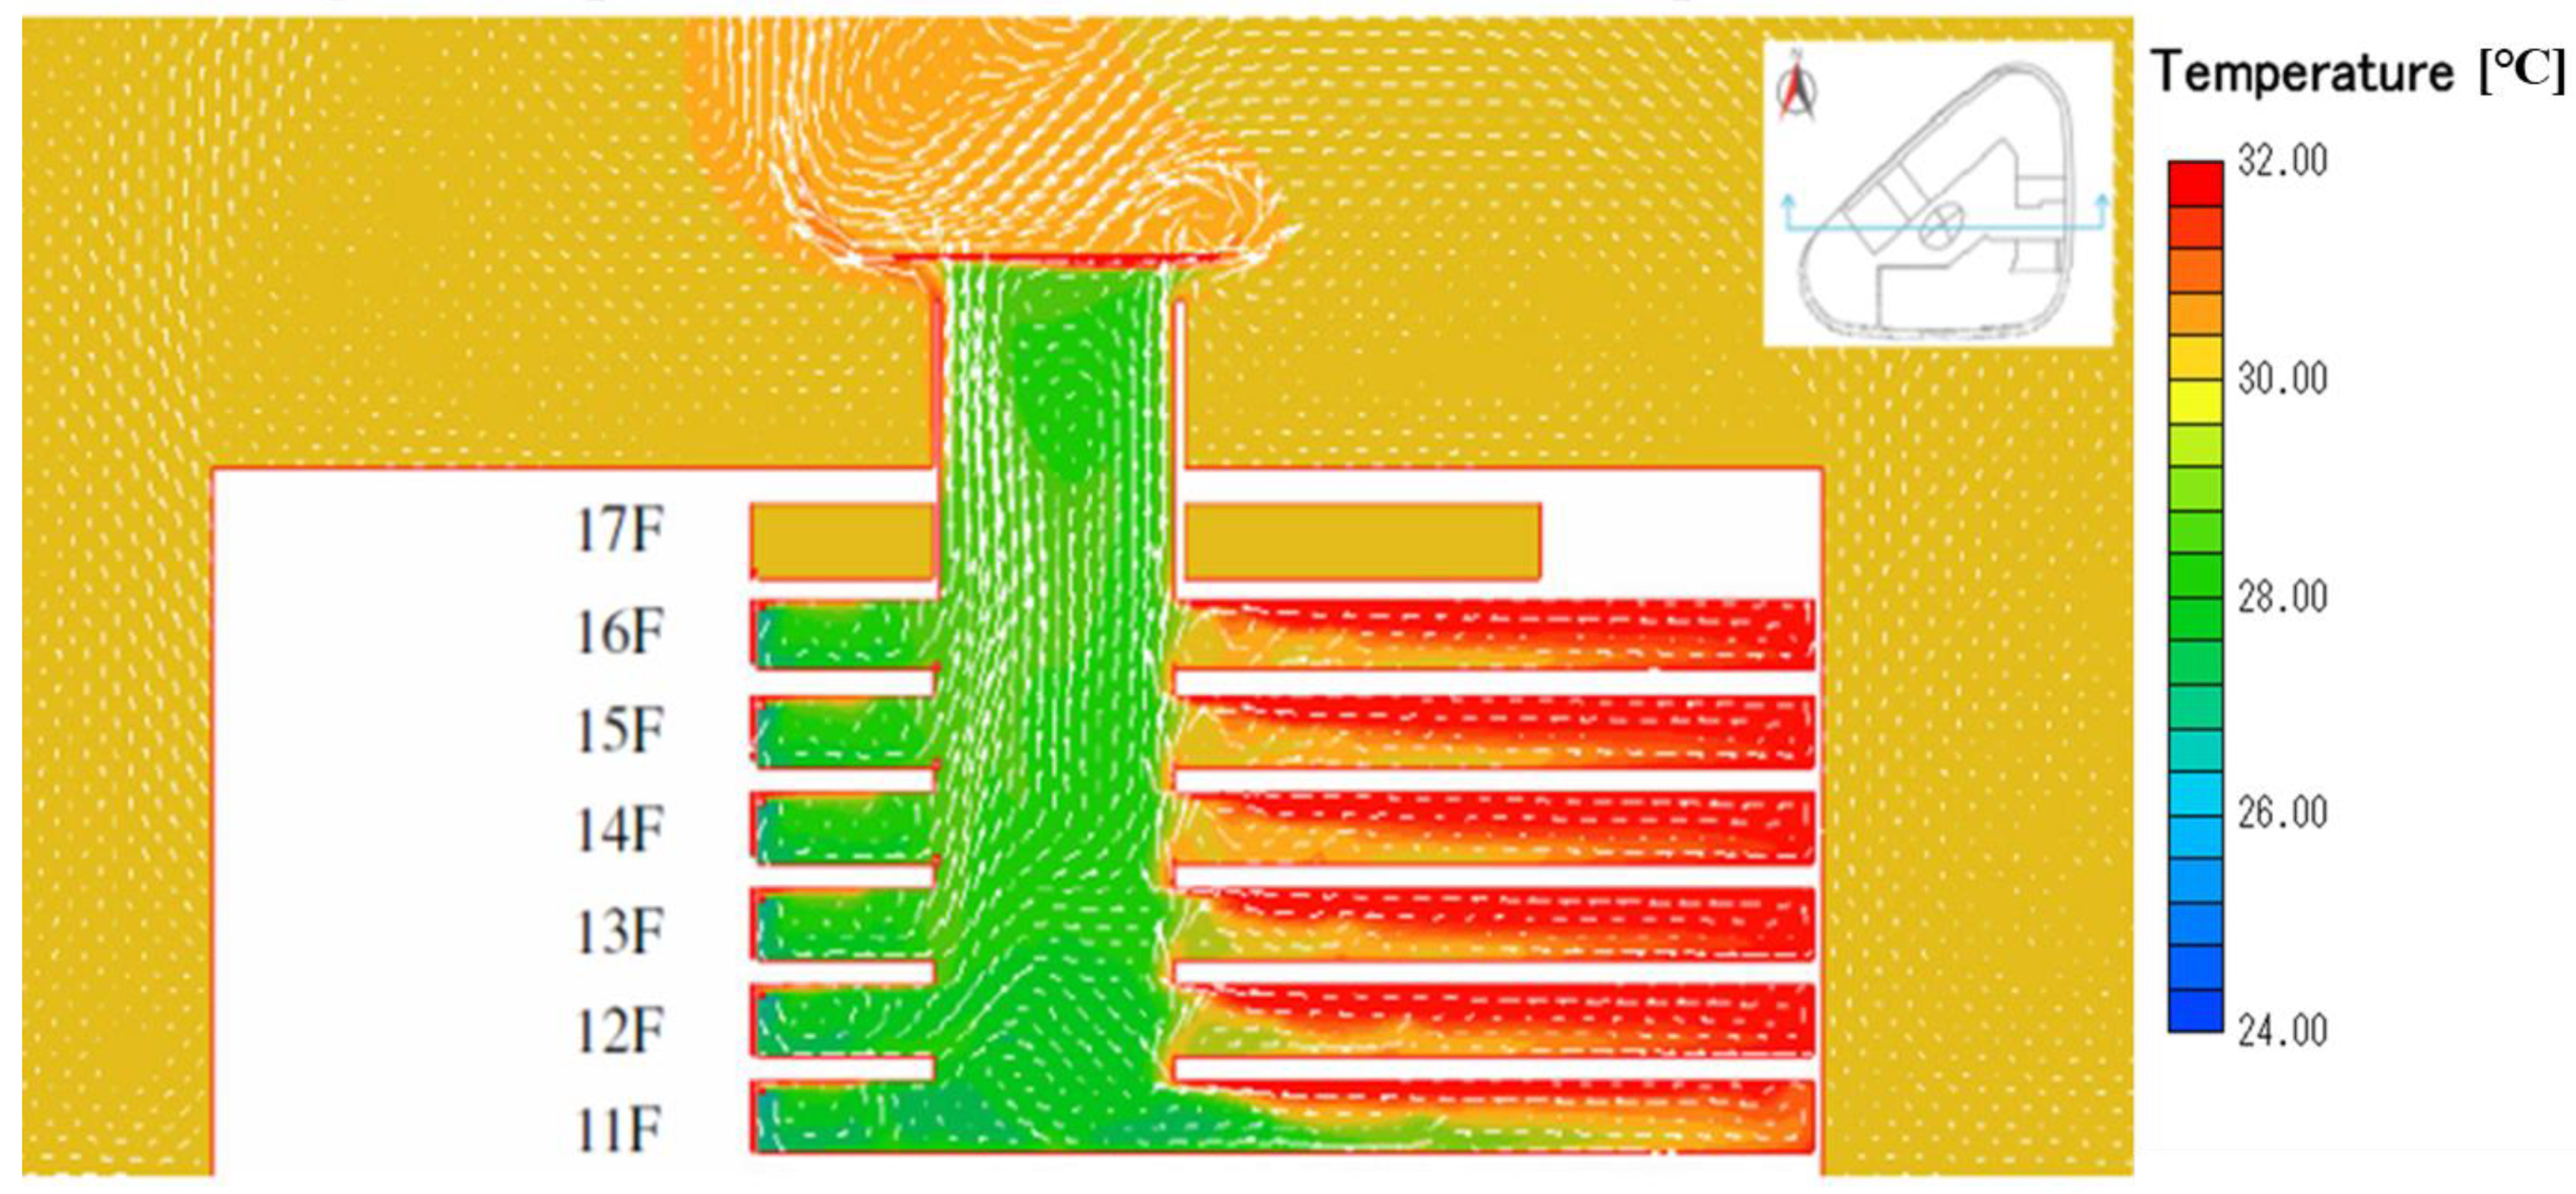
Figure 13 indicates that when the ambient temperature was 30 °C, the pressure distribution reversed (i.e., indoor pressure became higher than outdoor pressure), relative to that of the simulation with an ambient temperature of 24 °C. The SA cooled the public area. However, it did not flow out through the atrium but to the openings on the east side of the building. The simulation with an ambient temperature of 27 °C produced the same results. Therefore, the intakes on the east side of the building should be closed to avoid cold air flowing out when the ambient temperature is higher than 27 °C. The preceding results indicate that when the outdoor temperature is more than 3 °C higher than the indoor temperature, the intakes become outlets, and the atrium then has no influence on the ventilation system.
5.4. Ambient Condition Effect When the Intakes Are Closed
Figure 14 and Figure 15 present the temperature distributions that were obtained in the absence of external air (OA) entering the building when the ambient temperature was 26 °C and 30 °C. The results indicated that external air (OA) and solar radiation had a negligible influence on the thermal condition in public areas. Vlocity, temperature, and humidity remained unchanged as a whole. The maximum discrepancy was less than 9% (Table 8).
The following simulation sets did not consider the effects of ambient conditions and directly applied the ambient temperature of 30 °C. Furthermore, the effects of the moisture generation by humans were not pronounced. Humidity was replaced by the comprehensive index, PMV, to evaluate thermal comfort in public areas.
5.5. Effect of SA Height
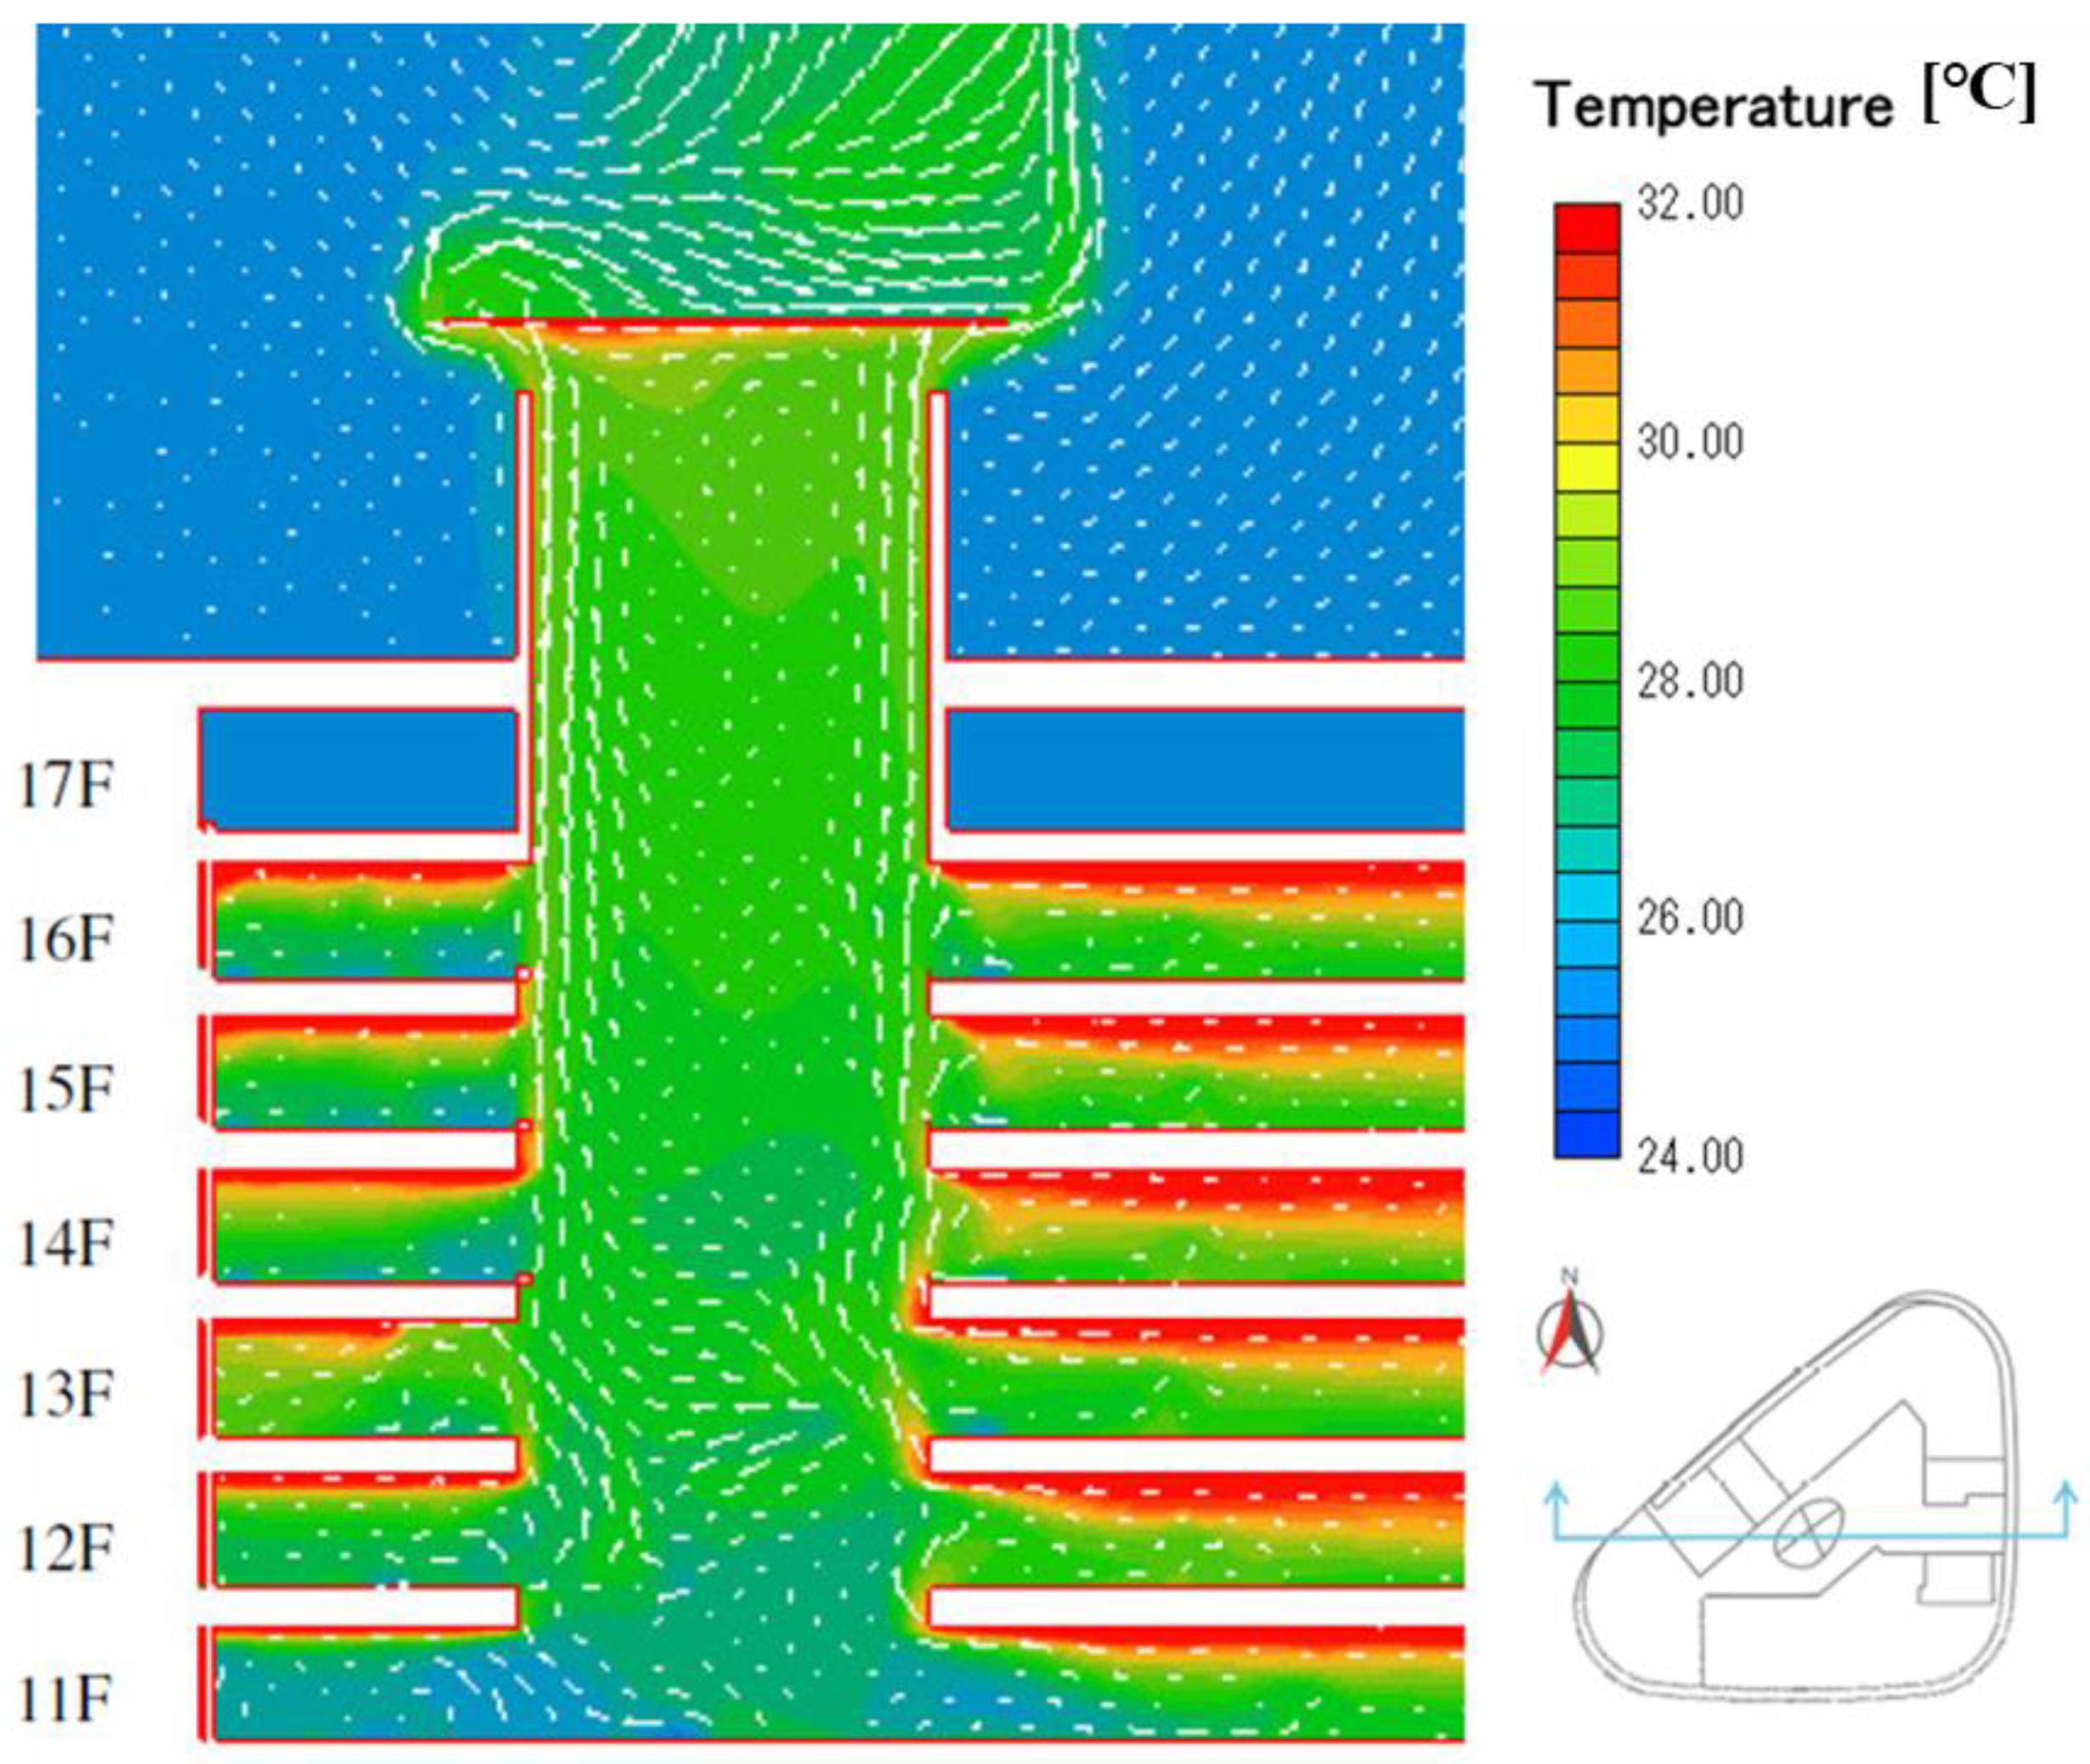
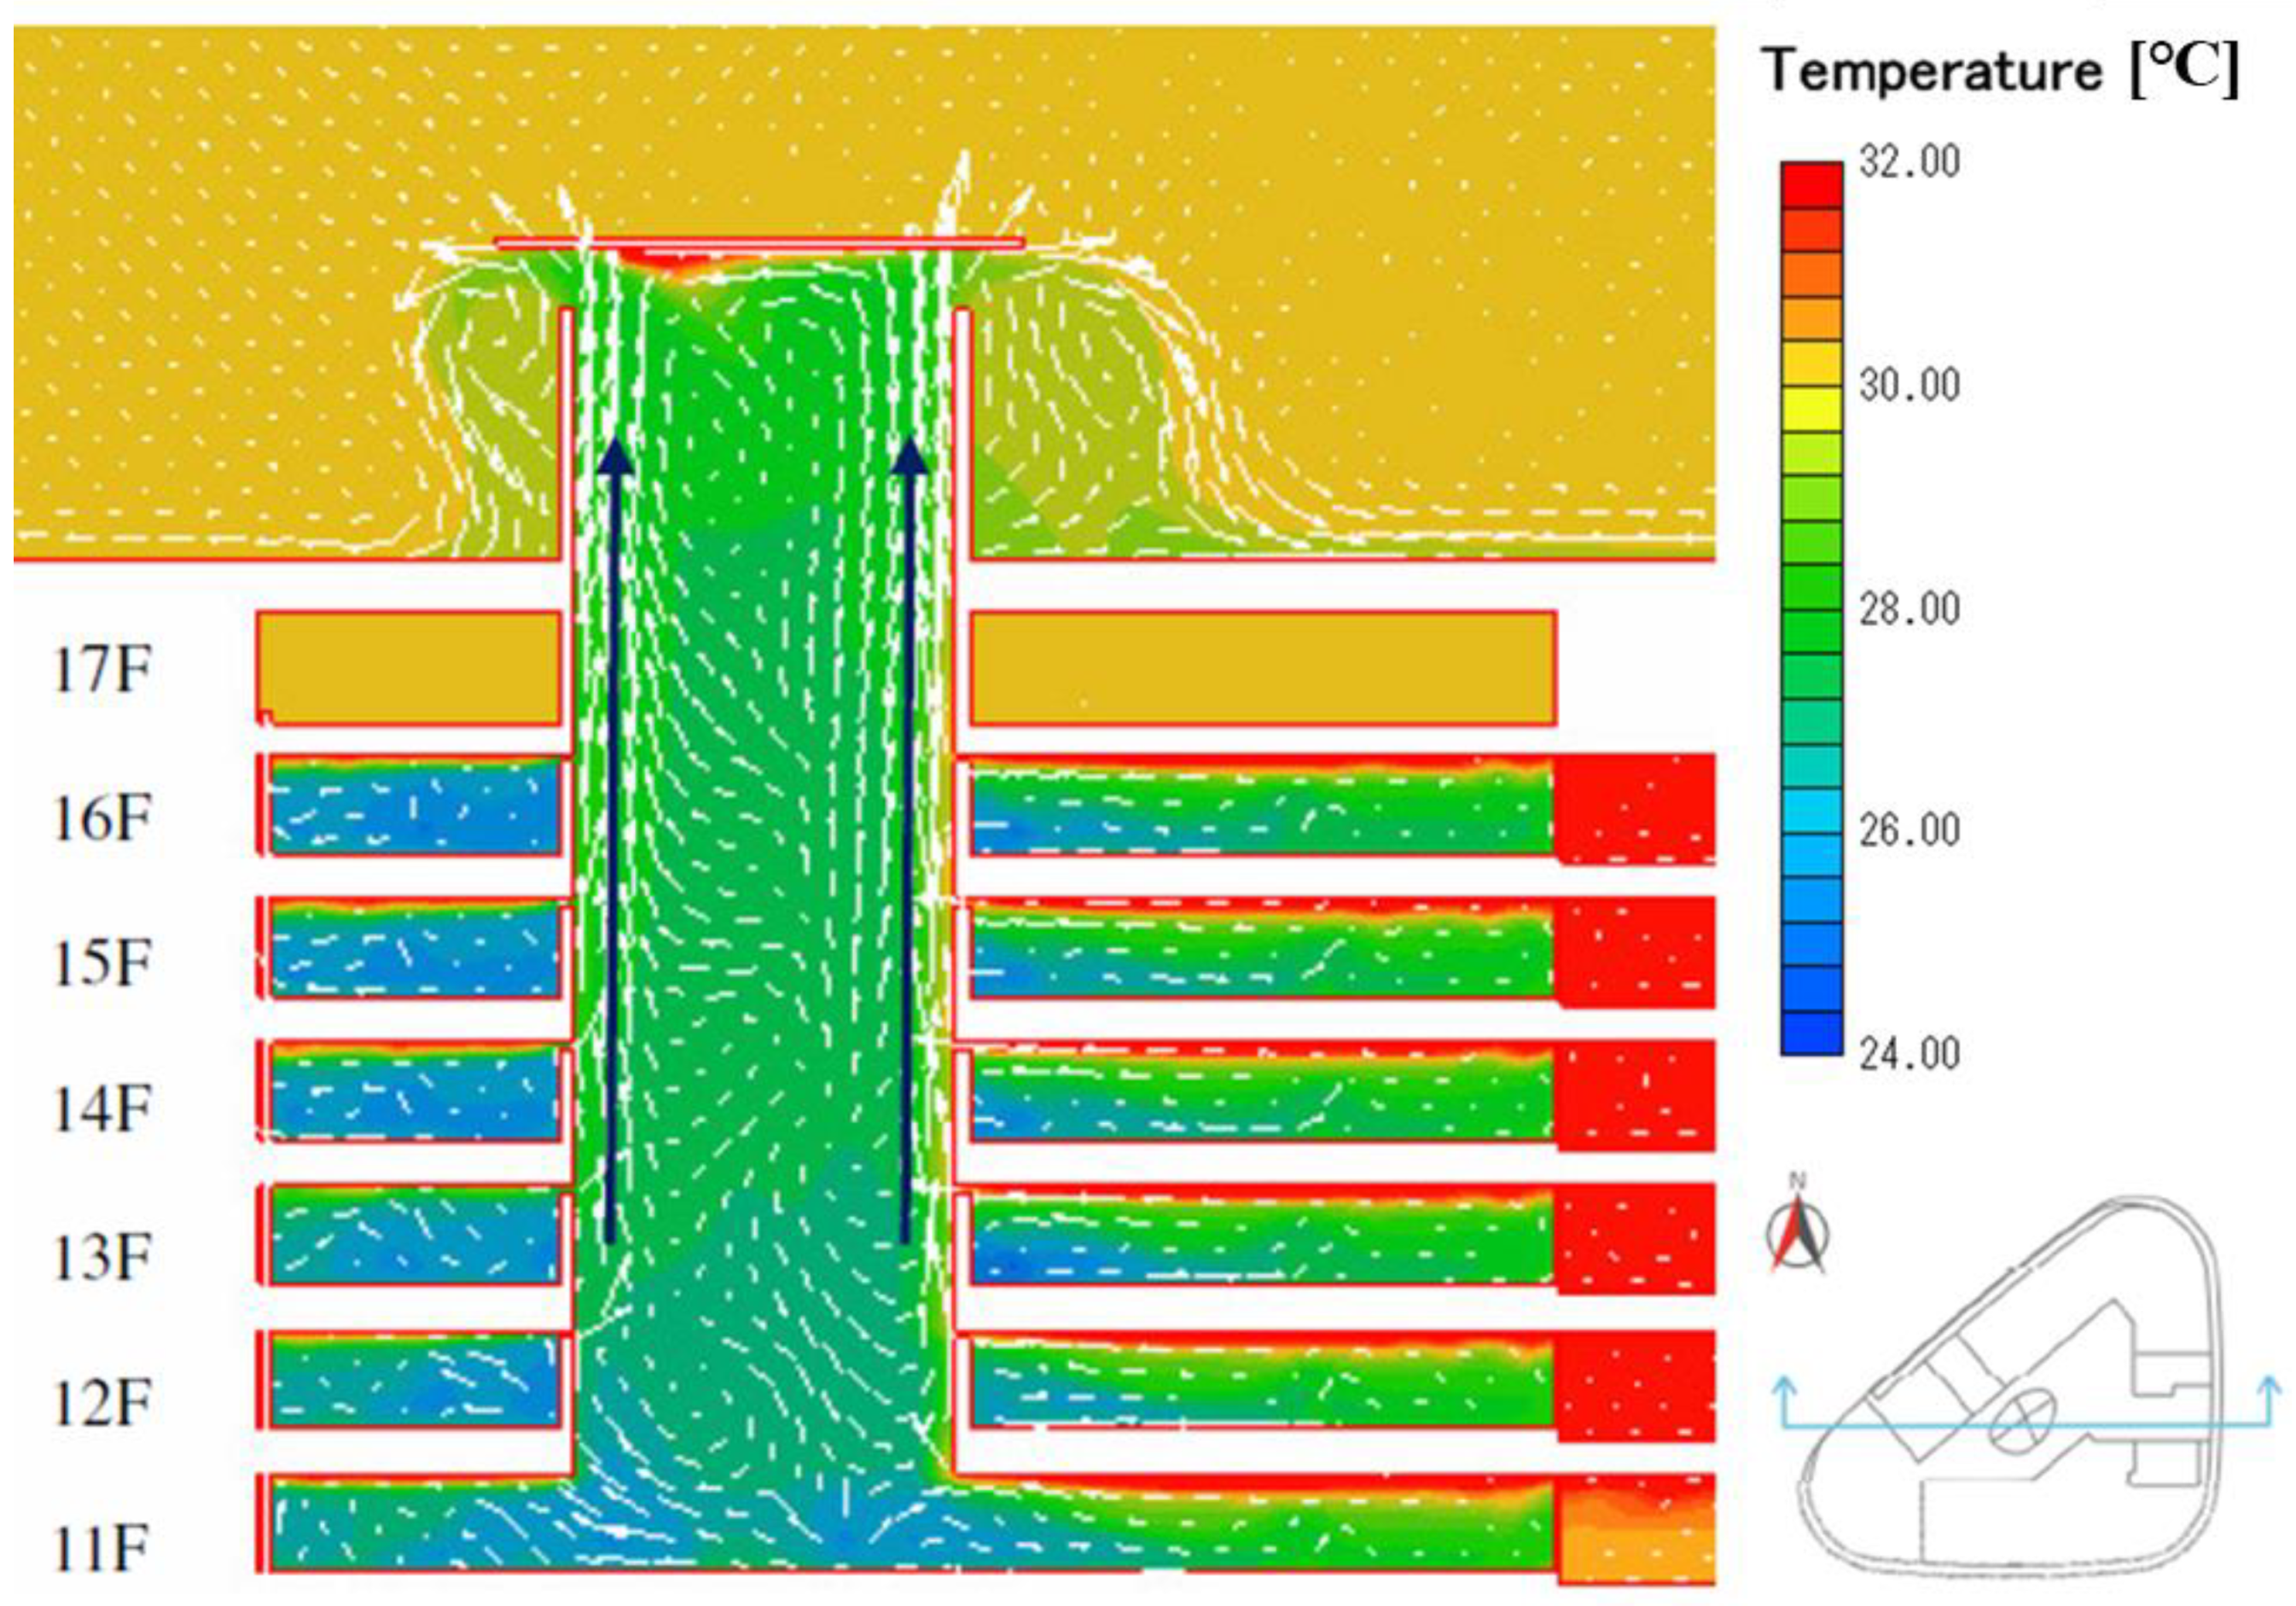
The simulation sets were developed with e aim of improving the efficiency of displacement ventilation by changing the height of the cold air from office rooms (SA). Figure 16 indicates that the heat generated by lighting at ceiling height accumulated at the upper section of the space and flowed to the atrium, which marginally influenced the breathing zone. The cold air (SA) from office rooms passed through the public area to the atrium. However, not all of the air flowed upward; some descended to the bottom floor and mixed with the air from other floors. The difference in average temperature between the bottom floor and other floors was as high as 2 °C when a low SA height was set. Among the floors, the PMV value on 11F was the lowest (Table 9).
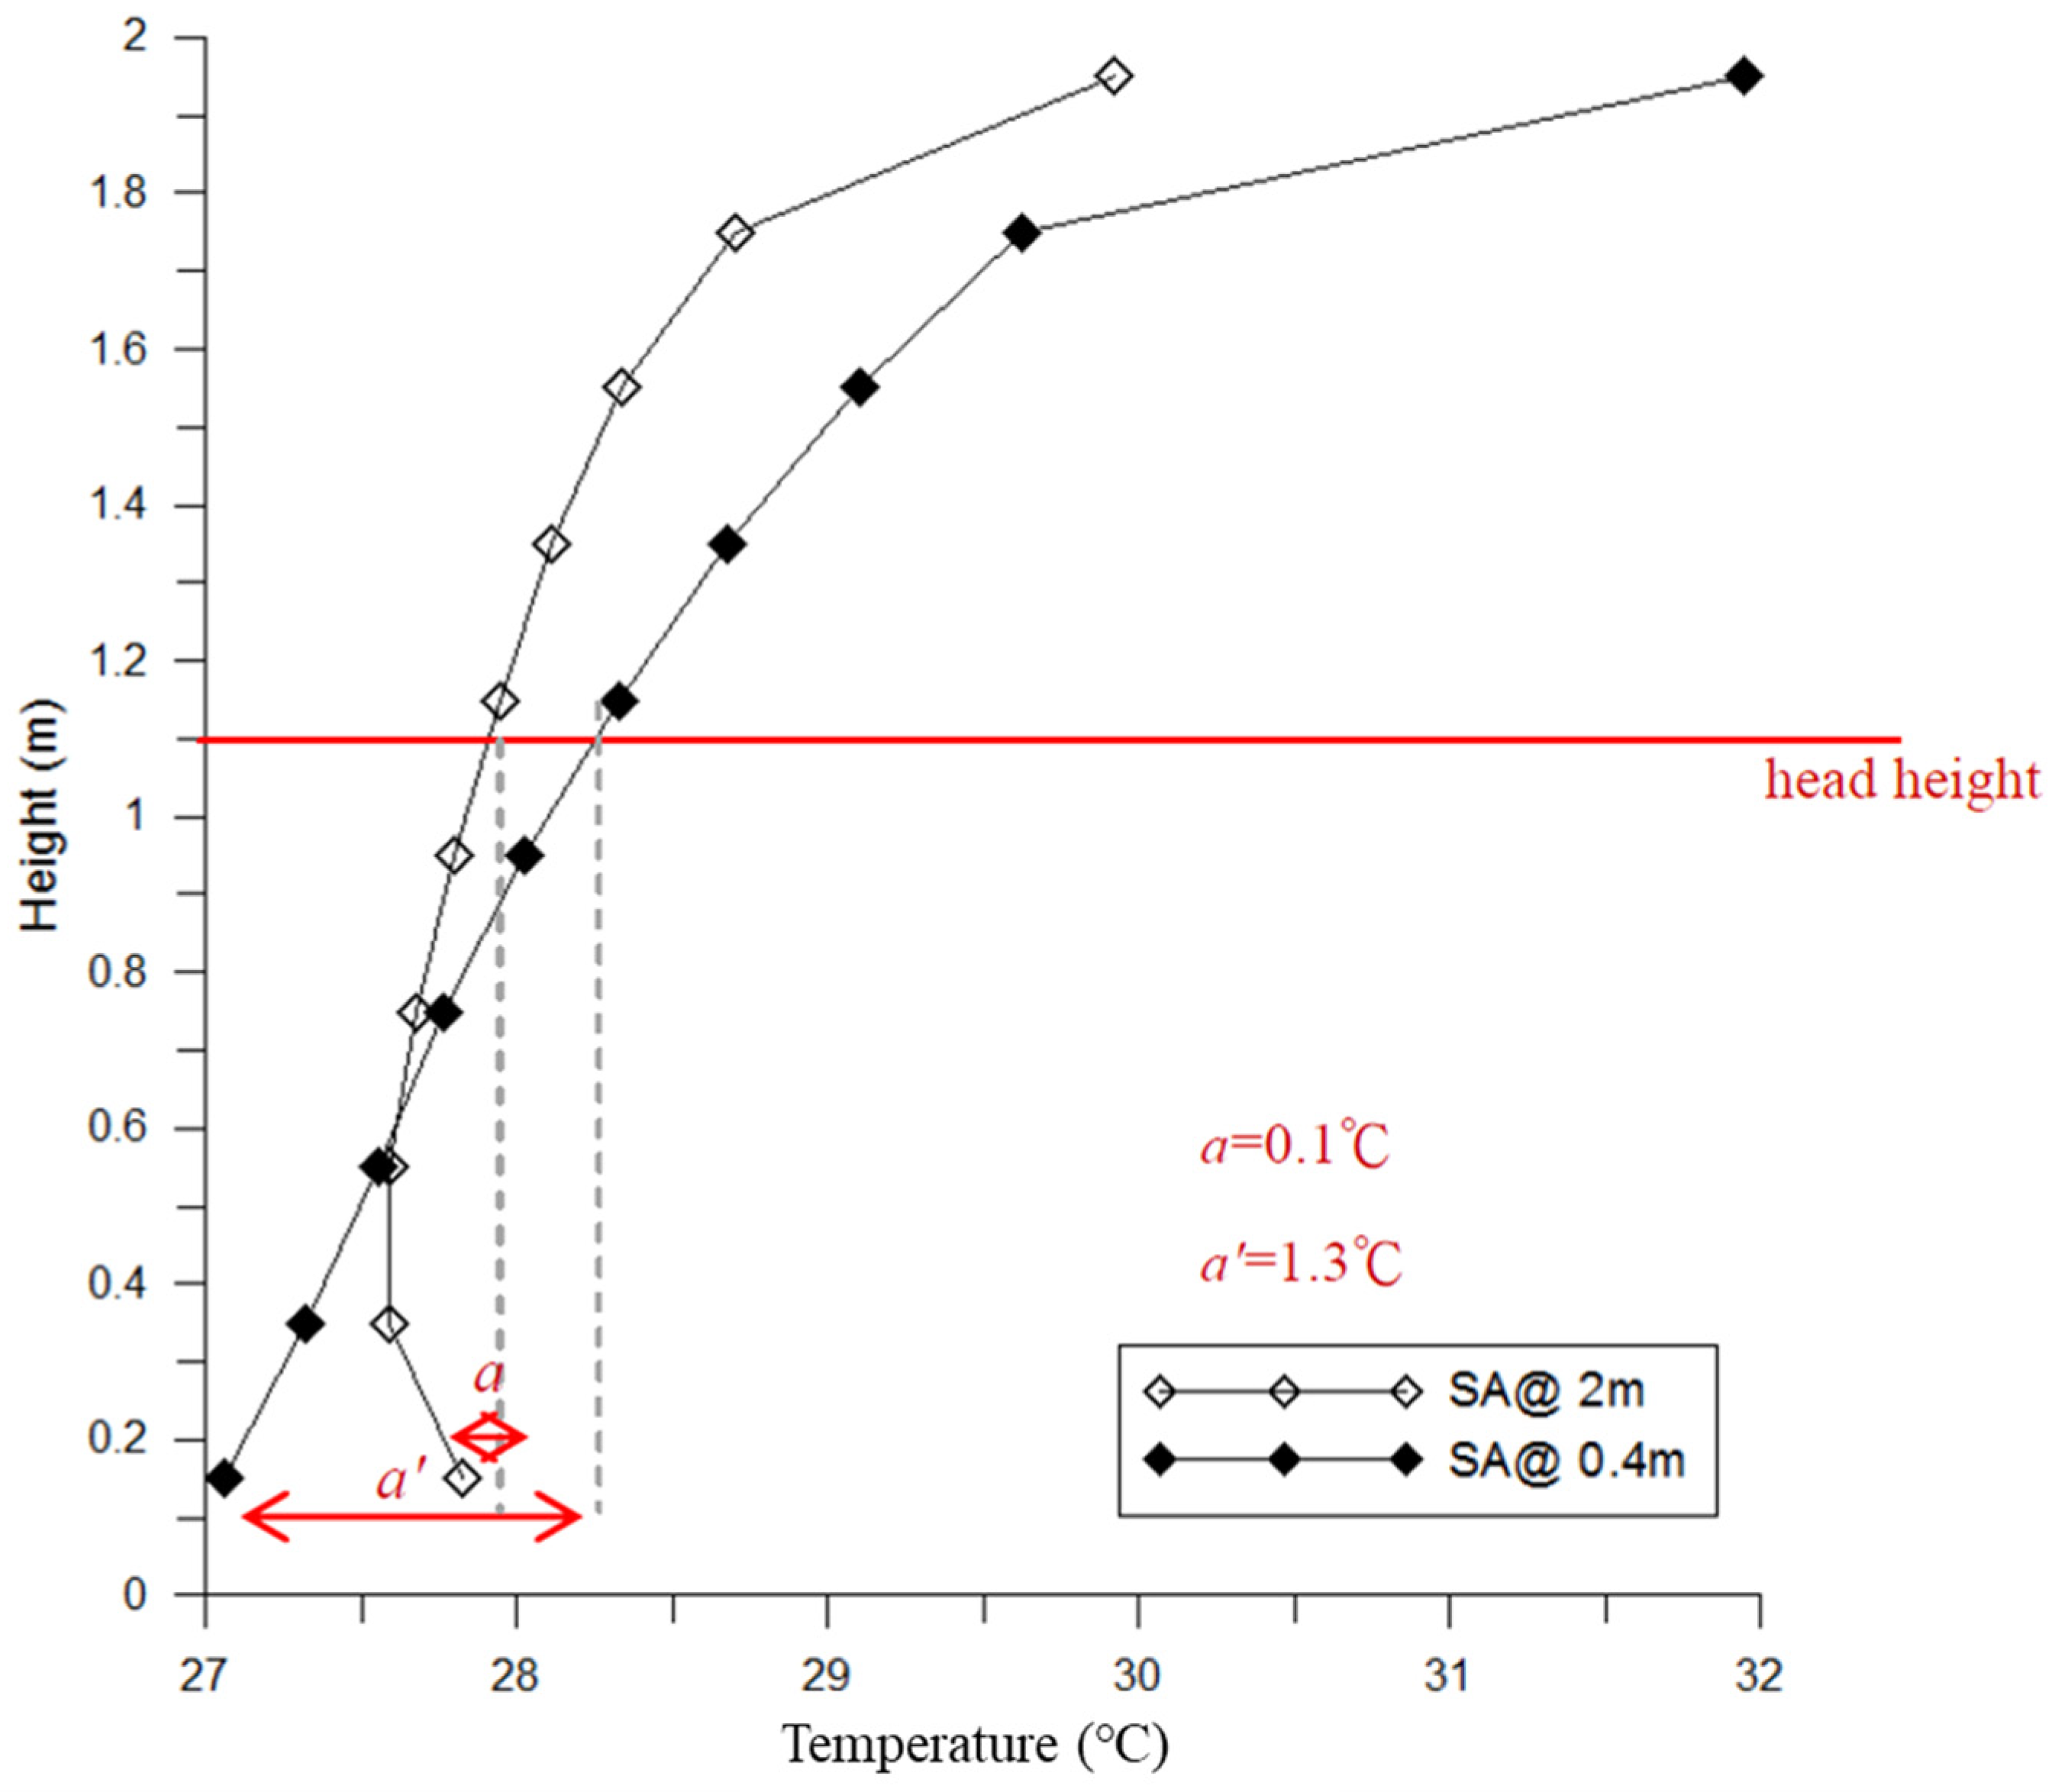
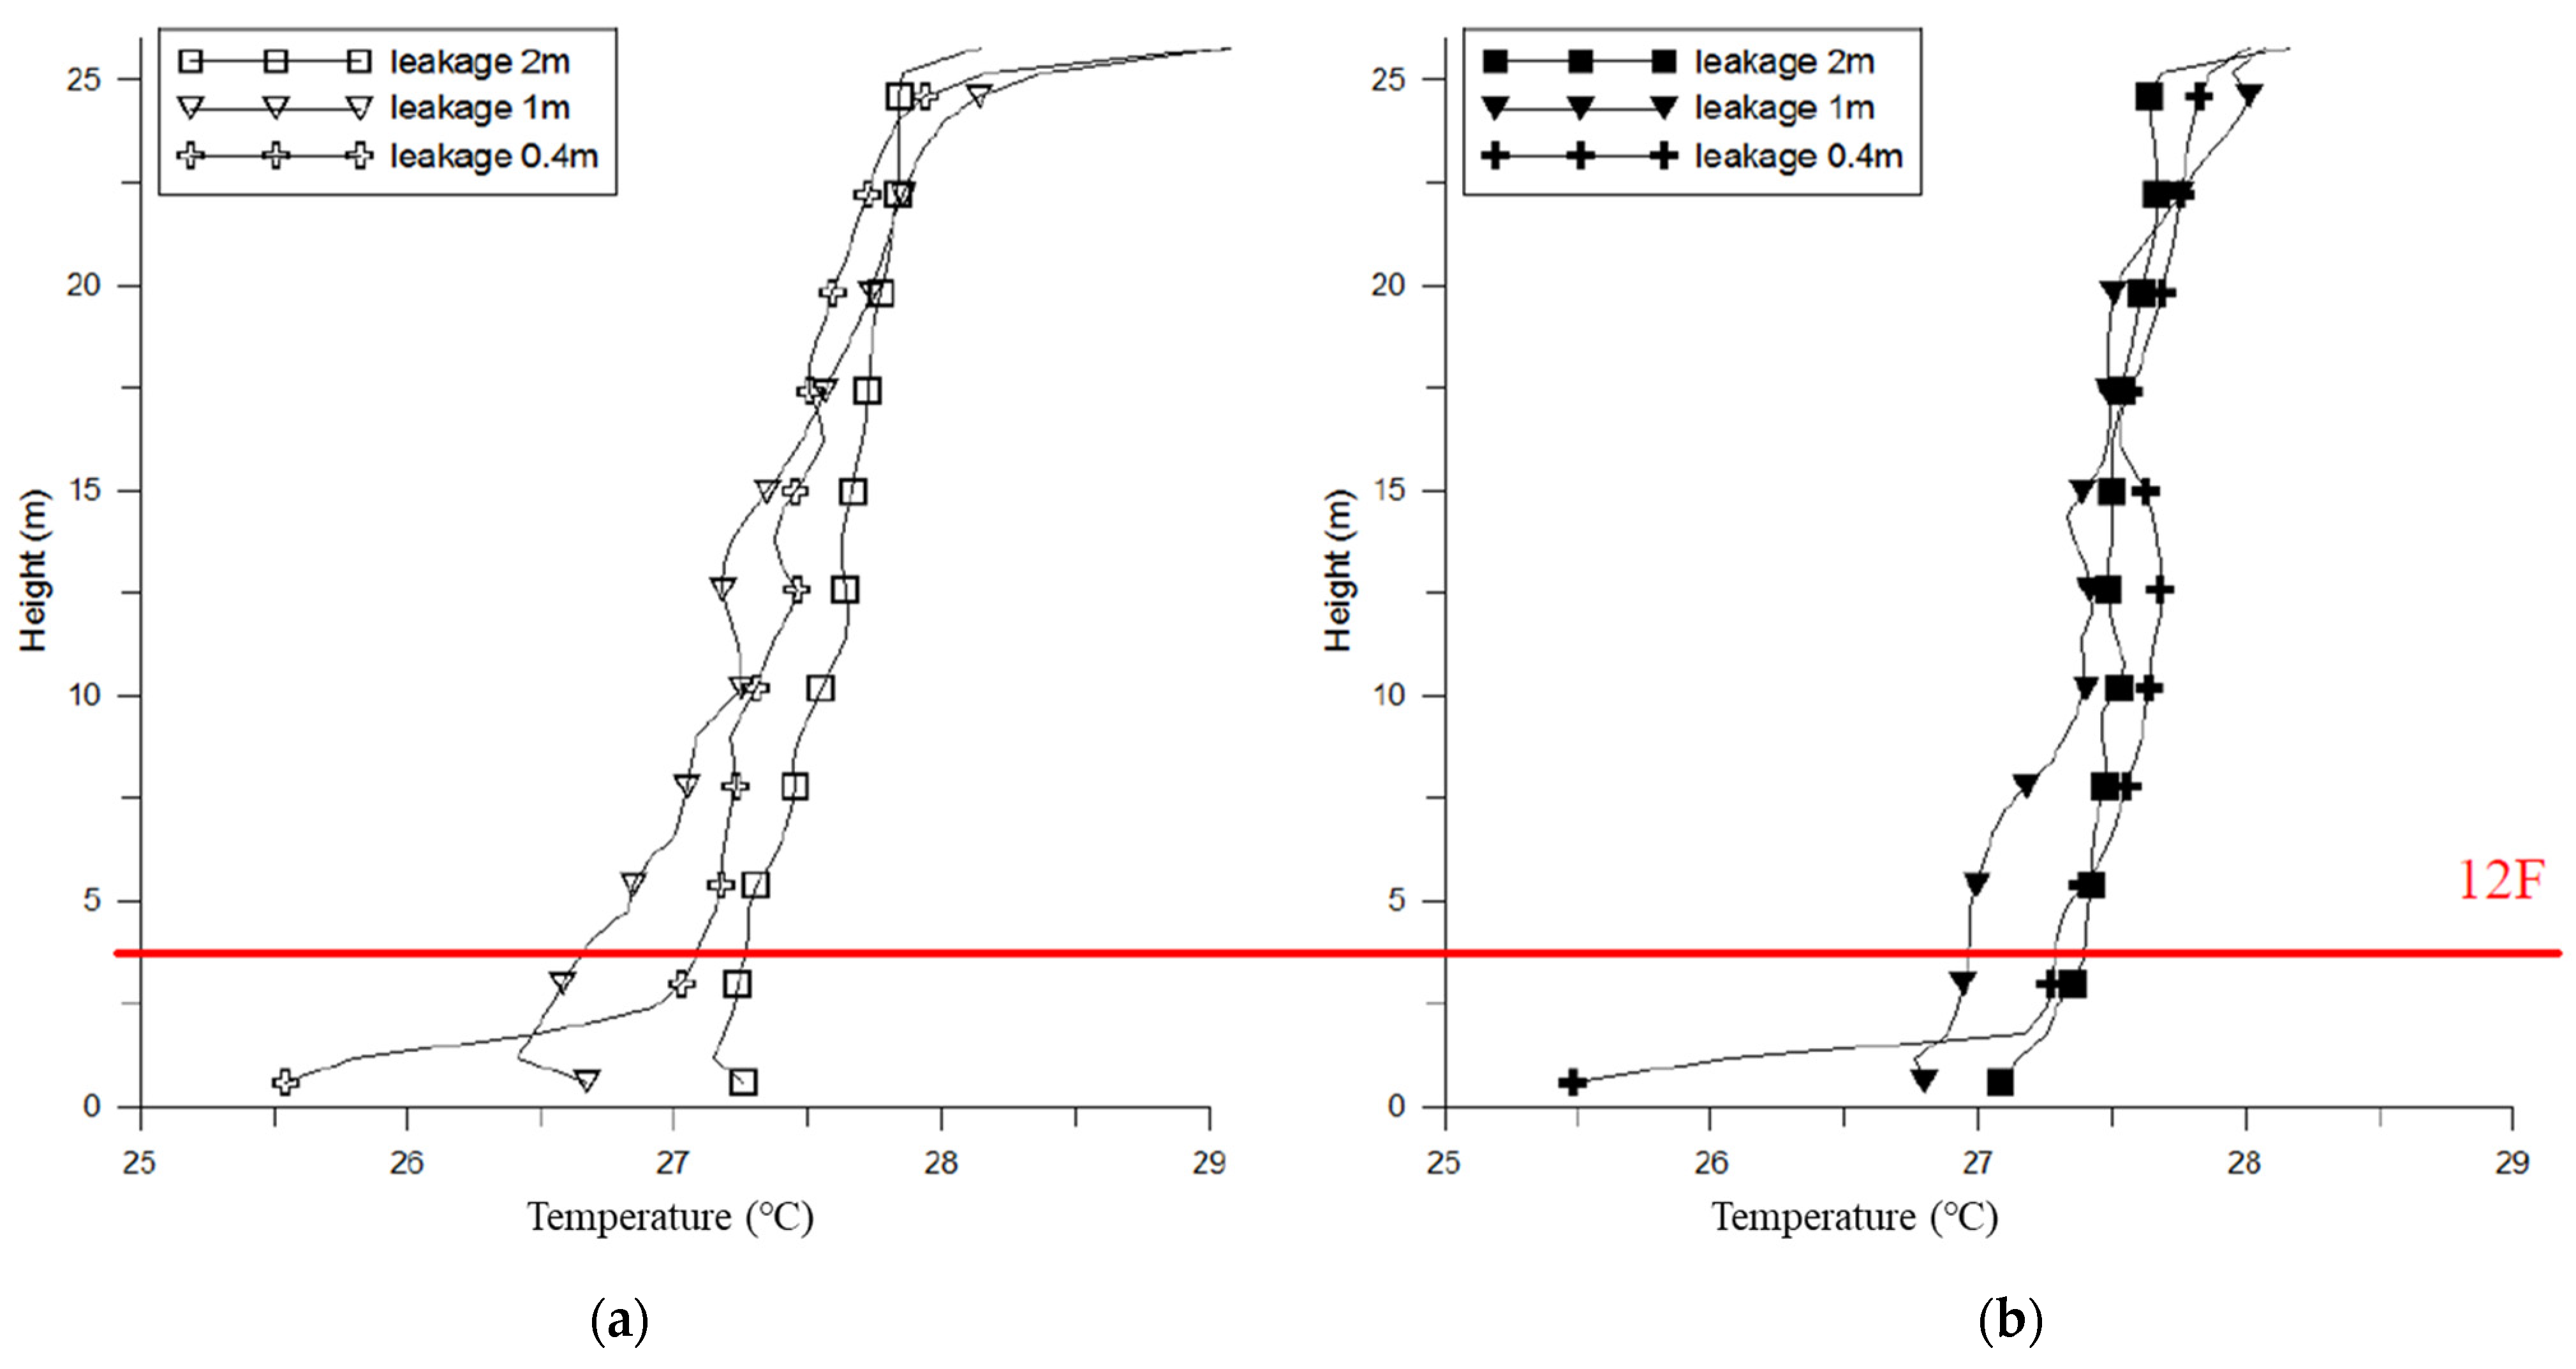
The change in SA height substantially influenced vertical temperature distribution. Figure 17 indicates that the temperature gradient in the public areas (ΔT) increased from 2.2 °C to 5 °C when the SA height was reduced to 0.4 m from 2 m. Although the heat clearly accumulated at the upper section of the space, the vertical temperature difference in the breathing zone (ΔTbz) increased from 0.1 °C to 1.3 °C.
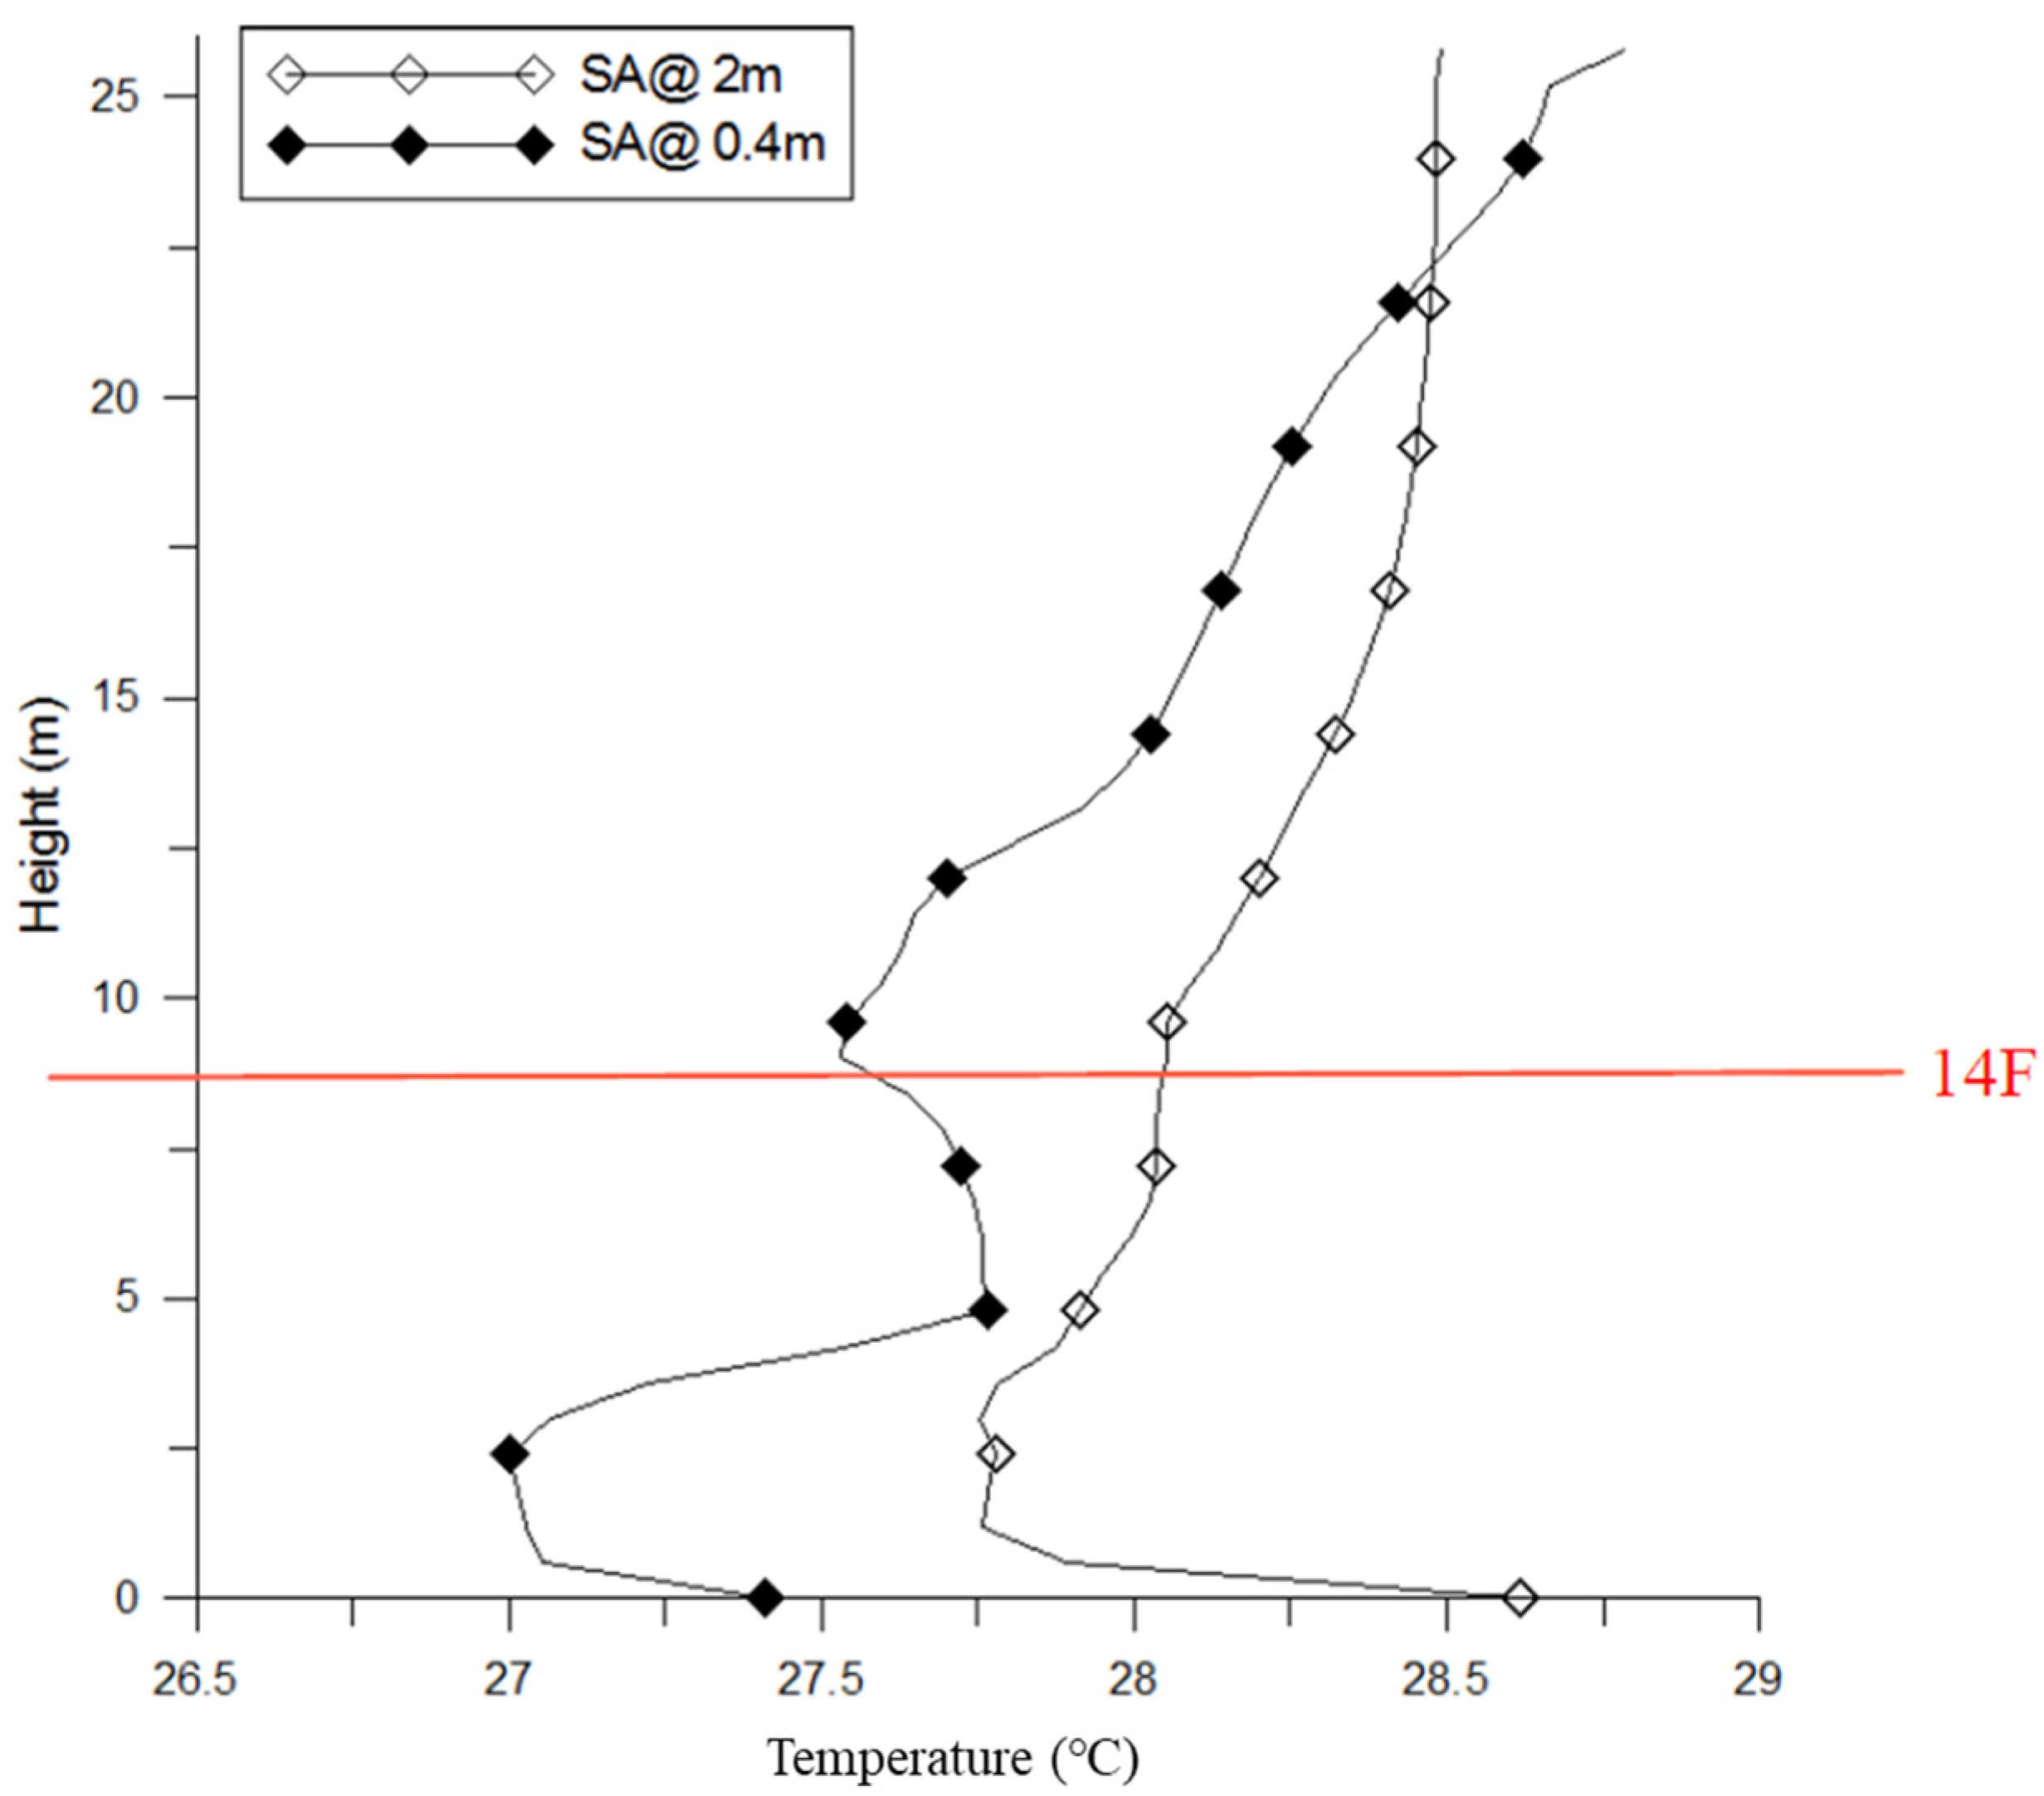
Below the 13th Floor, the sinking cold air mixed with the rising hot air in the atrium, causing a nonuniform flow distribution. Above the 14th Floor, the temperature difference decreased gradually and became uniform, the stack effect became smaller, and the vertical temperature differences in the atrium (ΔTat) were less than 1.5 °C (Figure 18).
5.6. The Effect of Handrail Height and SA Height
To address the problem of the sinking cold air that was observed in the previous simulation set, this simulation set positioned the handrail near the atrium and assumed that the cold air from office rooms (SA) remained in the public areas for a longer period. Various SA heights were considered for this set. Figure 19 indicates that the handrail can prevent the SA from descending to the lower floor and retain the air in the public areas for a longer period. Relative to the previous simulation set, the PMV value decreased by 0.04–0.56 when 1.1 m handrails were used. However, handrail height only marginally influenced thermal comfort. The PMV value was only reduced by approximately 0.1 when handrail height was increased from 1.1 to 1.9 m (Table 10). The PMV results of the various floors were similar, and the differences (ΔPMV) were all smaller than 0.5.
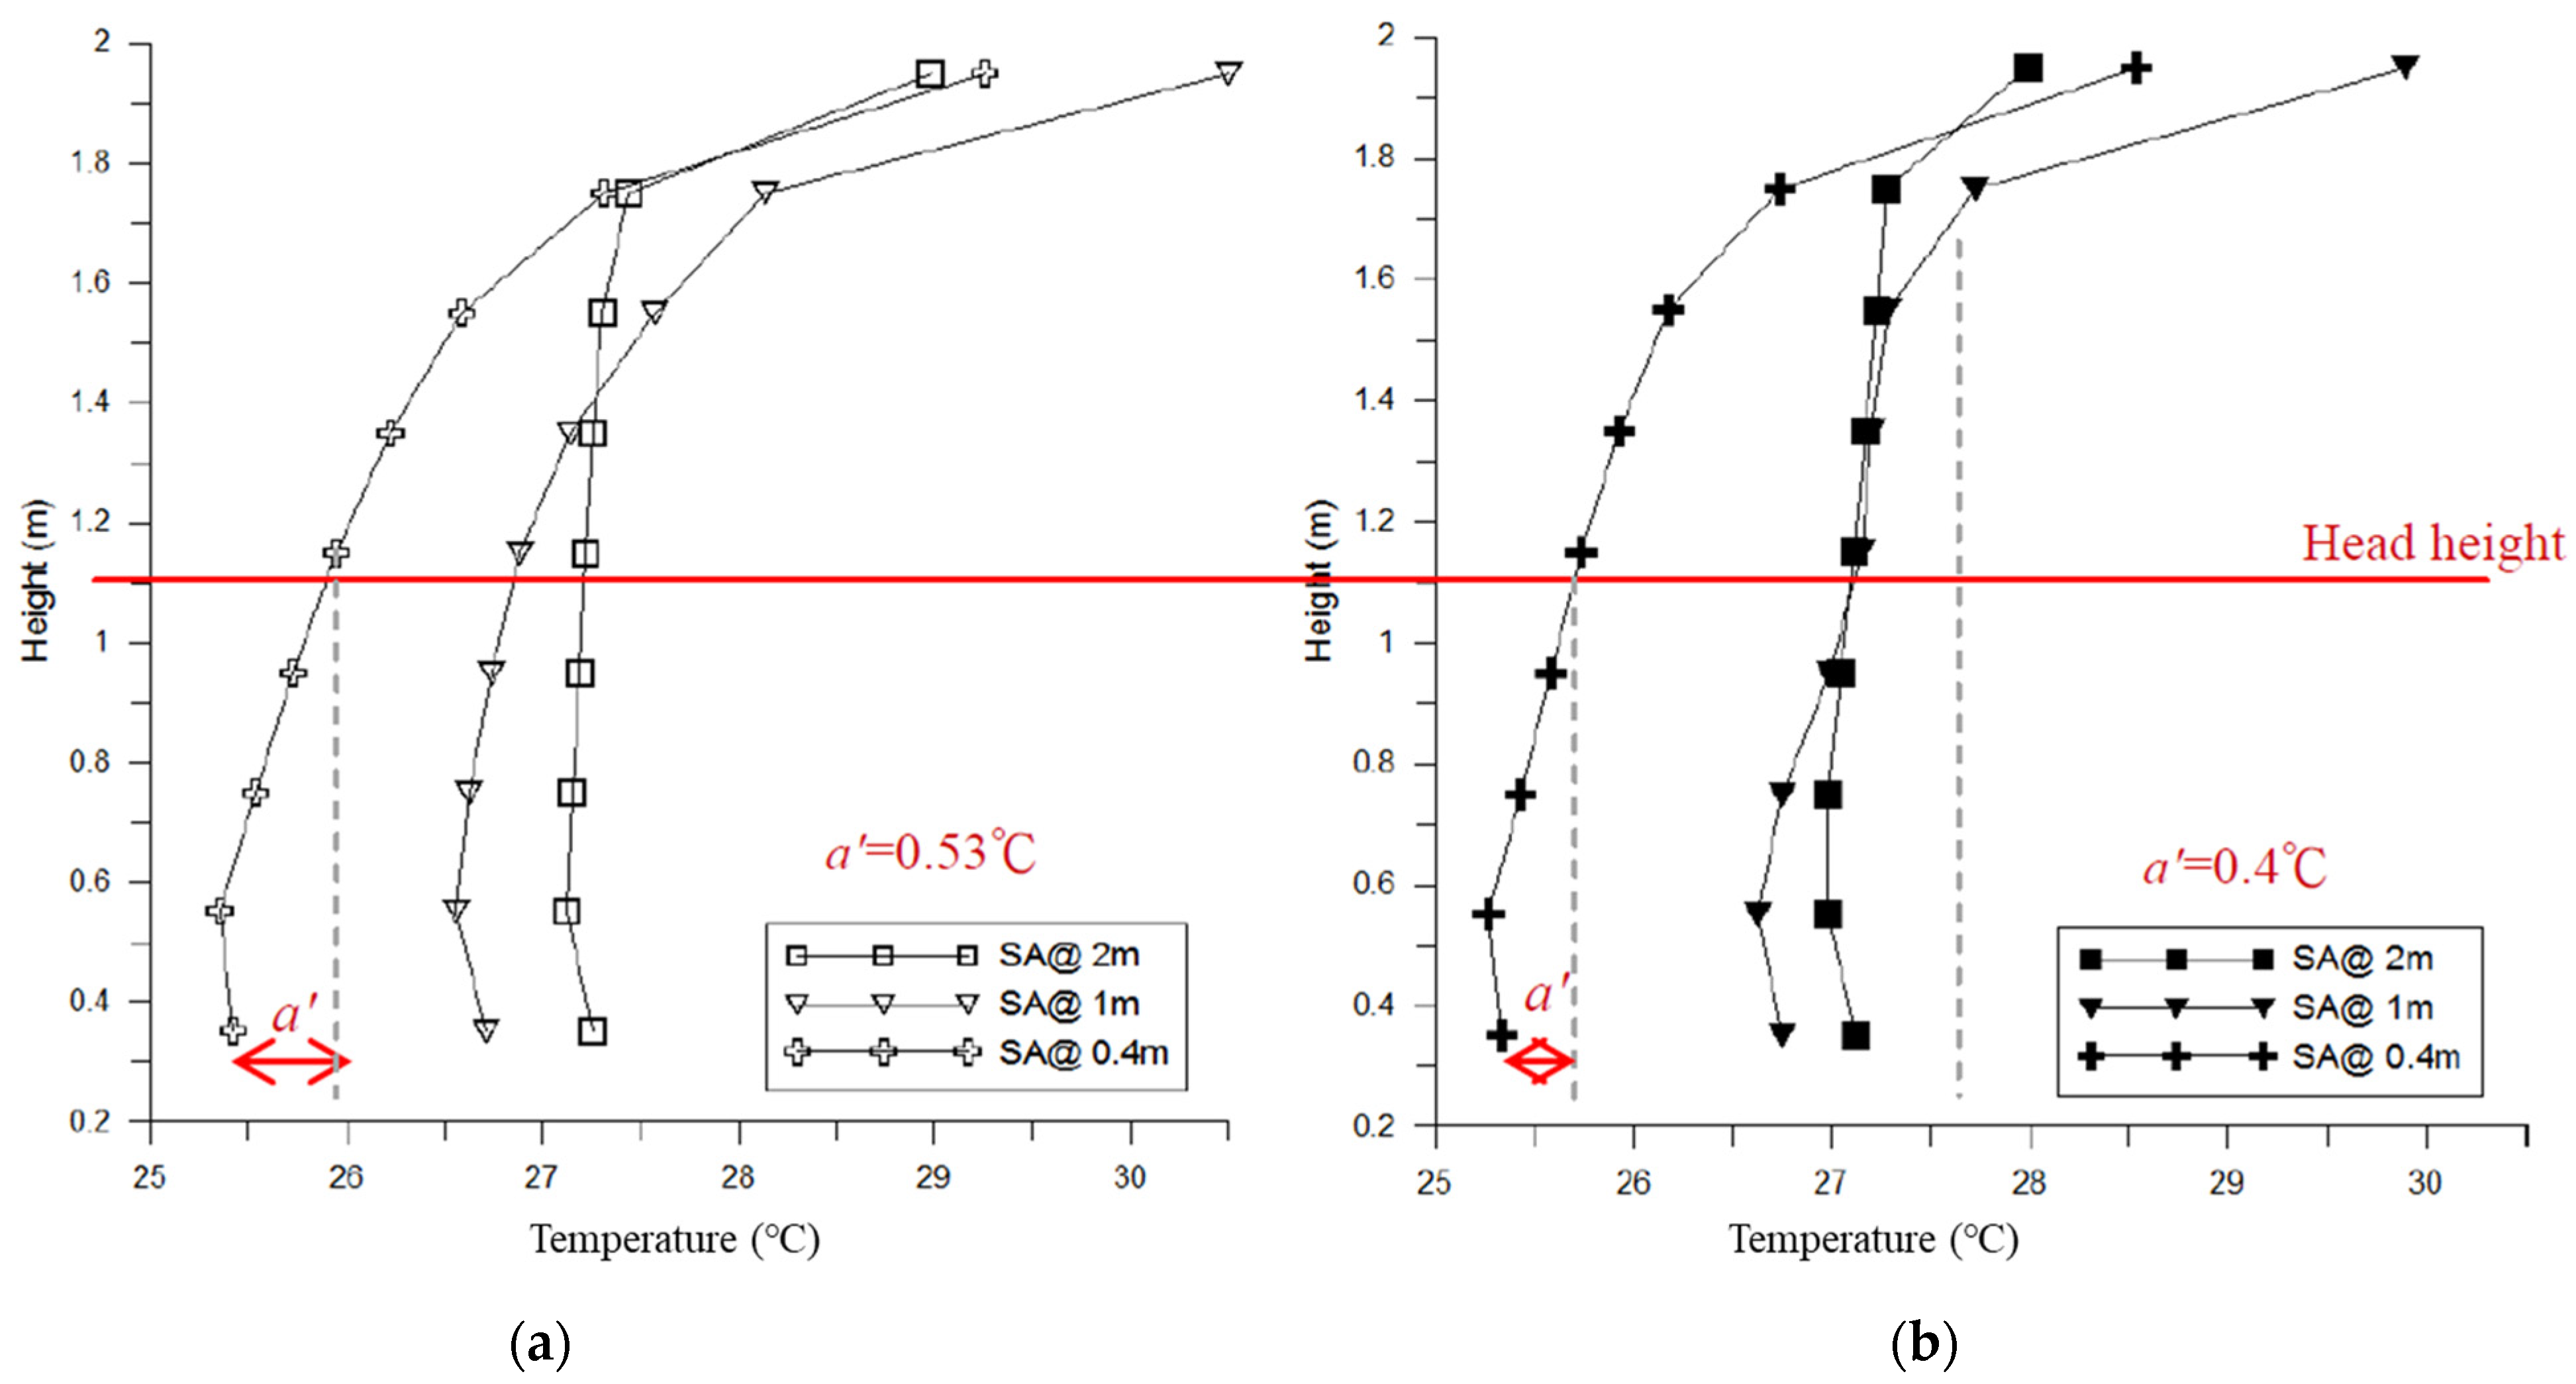
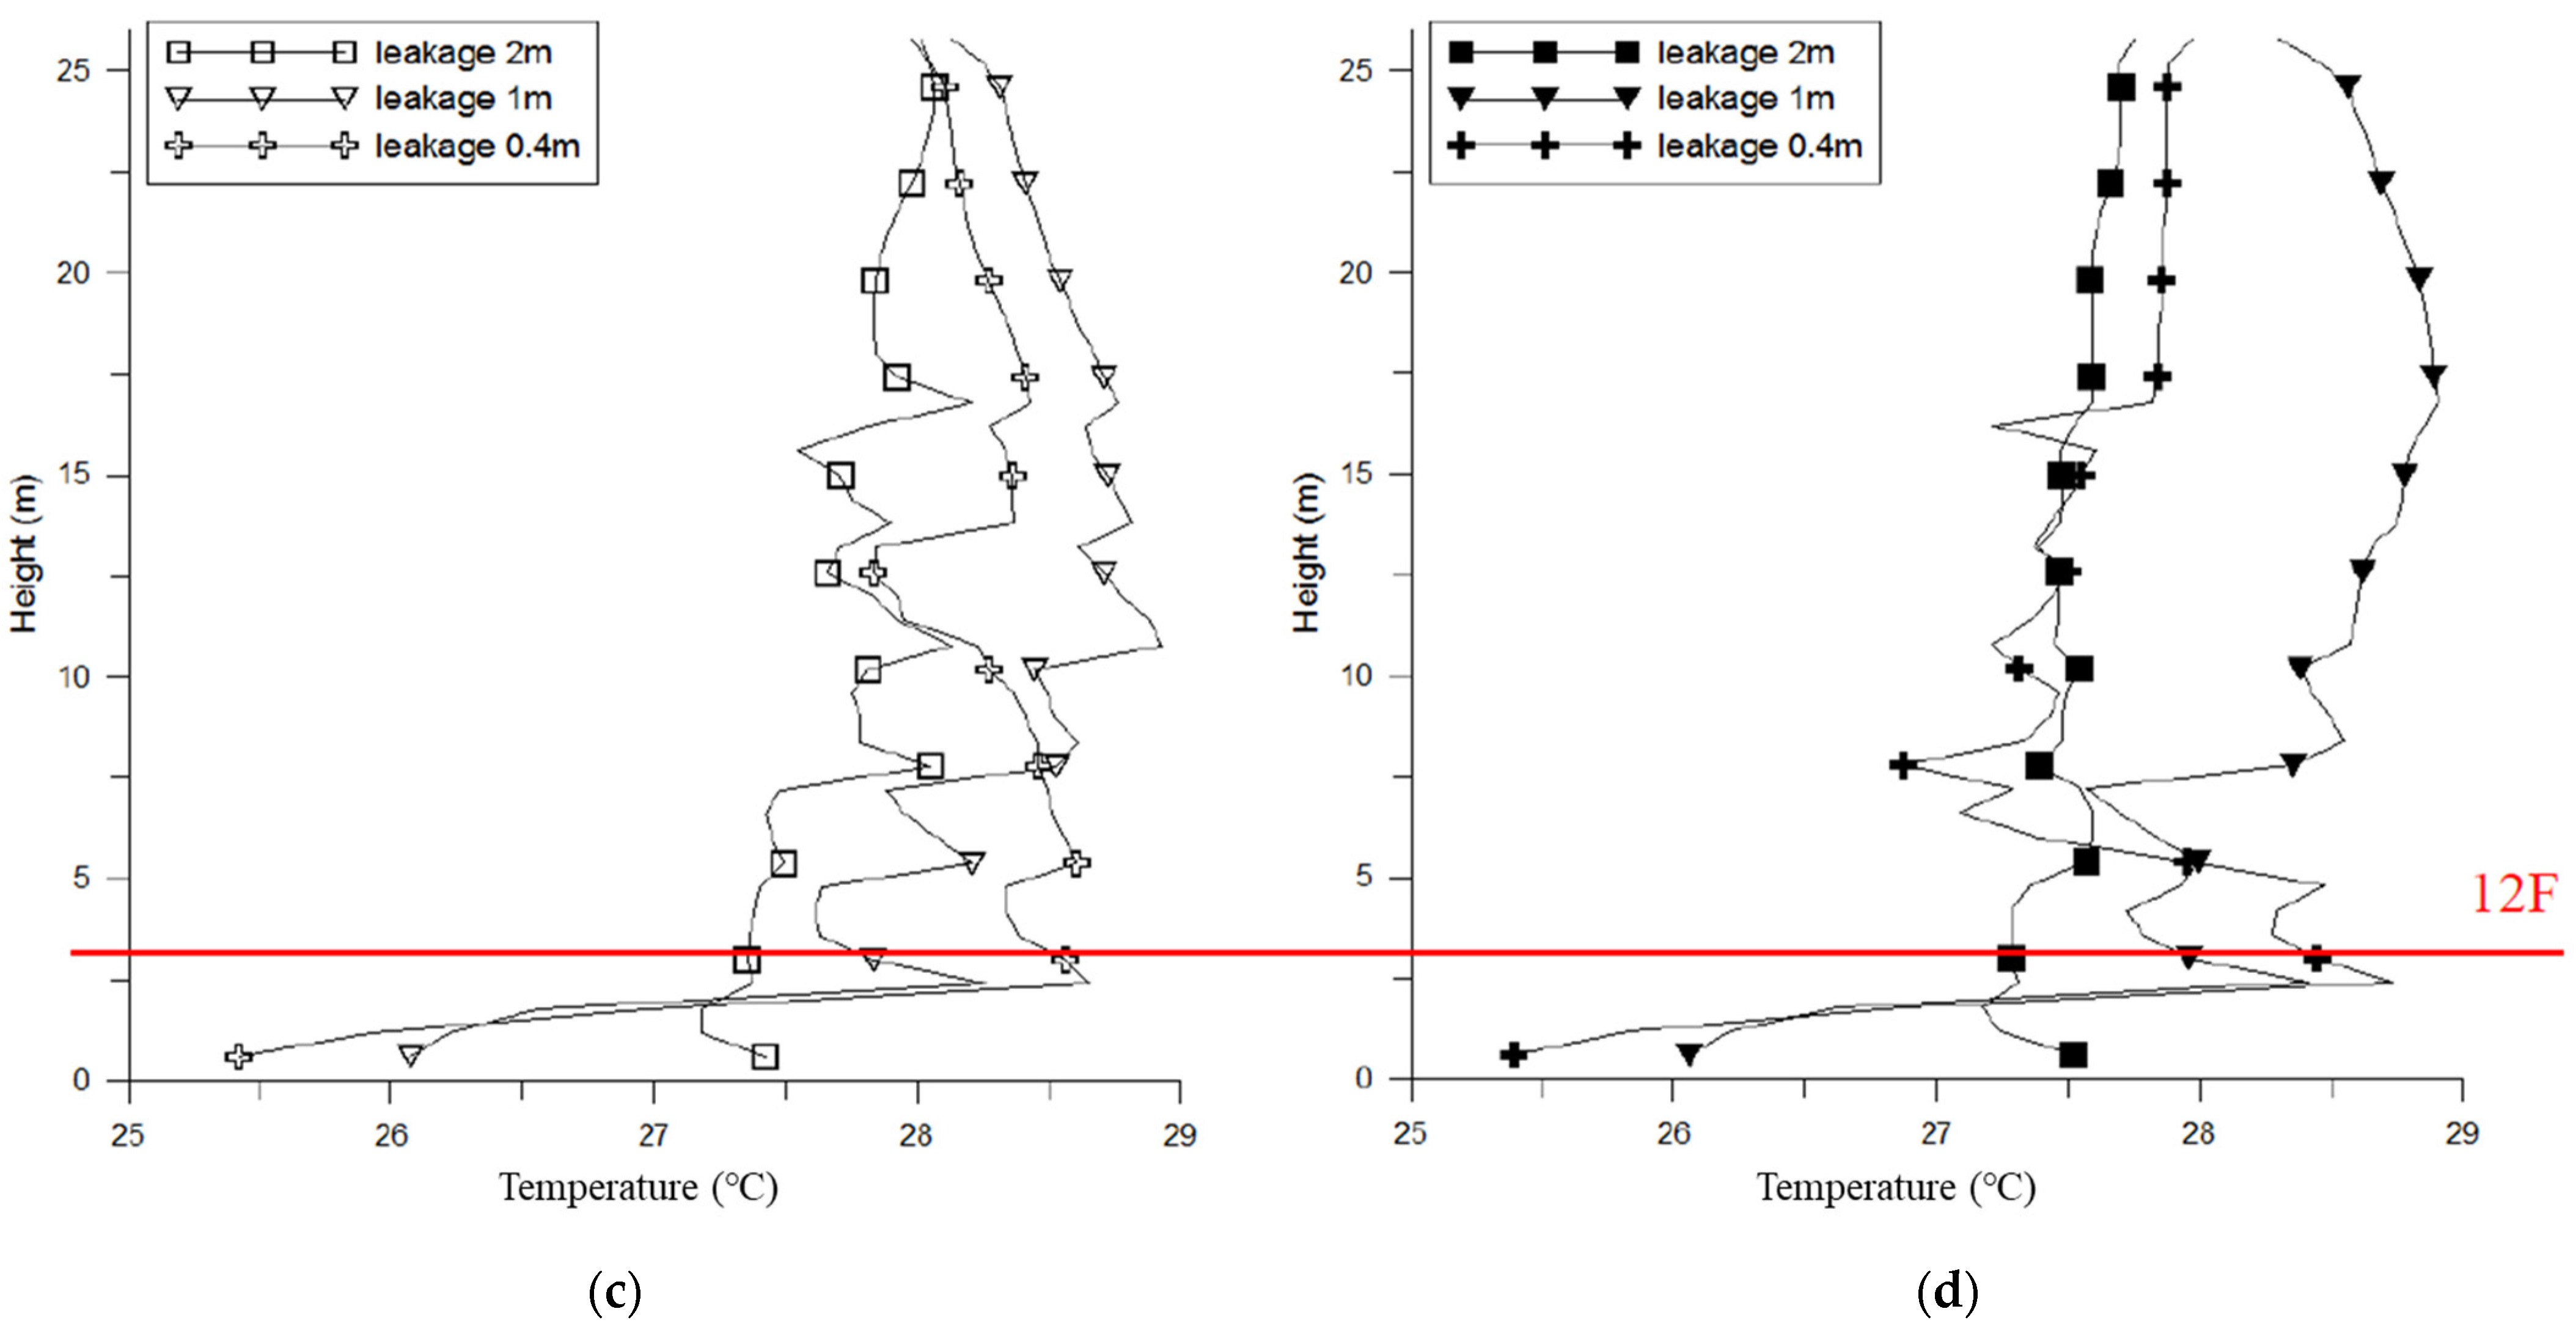
If a handrail was indicated as a necessary design element, the SA height effect had a greater influence relative to the previous simulation set. In the studied building, when the handrail was set at 1.1 m, the PMV value can be reduced by 0.1 when the SA was reduced from 1.0 to 0.4 m. When the SA height was higher than the handrail, the SA effect on thermal comfort gradually decreased, resulting in the PMV value increasing to 1.09 (Table 10). Similar results were obtained for the vertical temperature in the breathing zone. When the SA had a height that was between the floor and handrail height, the vertical temperature differences (ΔTbz) in the breathing zone were all smaller than 0.53 °C (Figure 20). However, the area near the lighting equipment was not influenced by changes in handrail or SA height. Therefore, when the entire space of public areas was considered, the SA still had substantial effects on vertical temperature distribution even though its height was higher than the handrail. The vertical temperature gradient in the spaces (ΔT) increased when SA height was lowered. This phenomenon was more pronounced when lower handrails were applied. The largest ΔT value was 3.8 °C.
Figure 20 indicates that hot air rose along the handrail to the upper part of the atrium and then flowed out through the vent at the top of the atrium. Stratification was also not pronounced in the middle of the atrium. Therefore, the outer part of the atrium formed a heat-belt area that was 0.5 °C to 2 °C hotter than the middle section of the atrium (Figure 21).
Overall, having handrails substantially improved thermal comfort in the public area. Setting the SA location at a position that was lower than the height of the handrail helped to reduce the temperature levels but increased the temperature difference vertically. Higher handrails contributed marginally to a reduction in PMV value. However, from the perspective of design, a handrail lower than human height is more spatially and visually appealing. Therefore, a 1.1-m handrail was used for the following simulations.
5.7. Effect of Heat Source, SA and Ceiling Height
For this simulation set, the height of the heat source was changed on the basis of usage behavior. The SA height was adjusted to be 0.4 m above or under the heat source. Ceiling height was also considered for this set. The simulation results revealed that the PMV values increased when the heat source moved from the floor to the ceiling. Table 11 indicated that the PMV value for each floor was influenced by heat source height. The PMV value increased by 0.1–0.22 when the heat source was at a height of 1.0 m. However, when the heat source was positioned higher than the height of the handrail, its influence on PMV diminished, and the ΔPMV values were all less than 0.5.
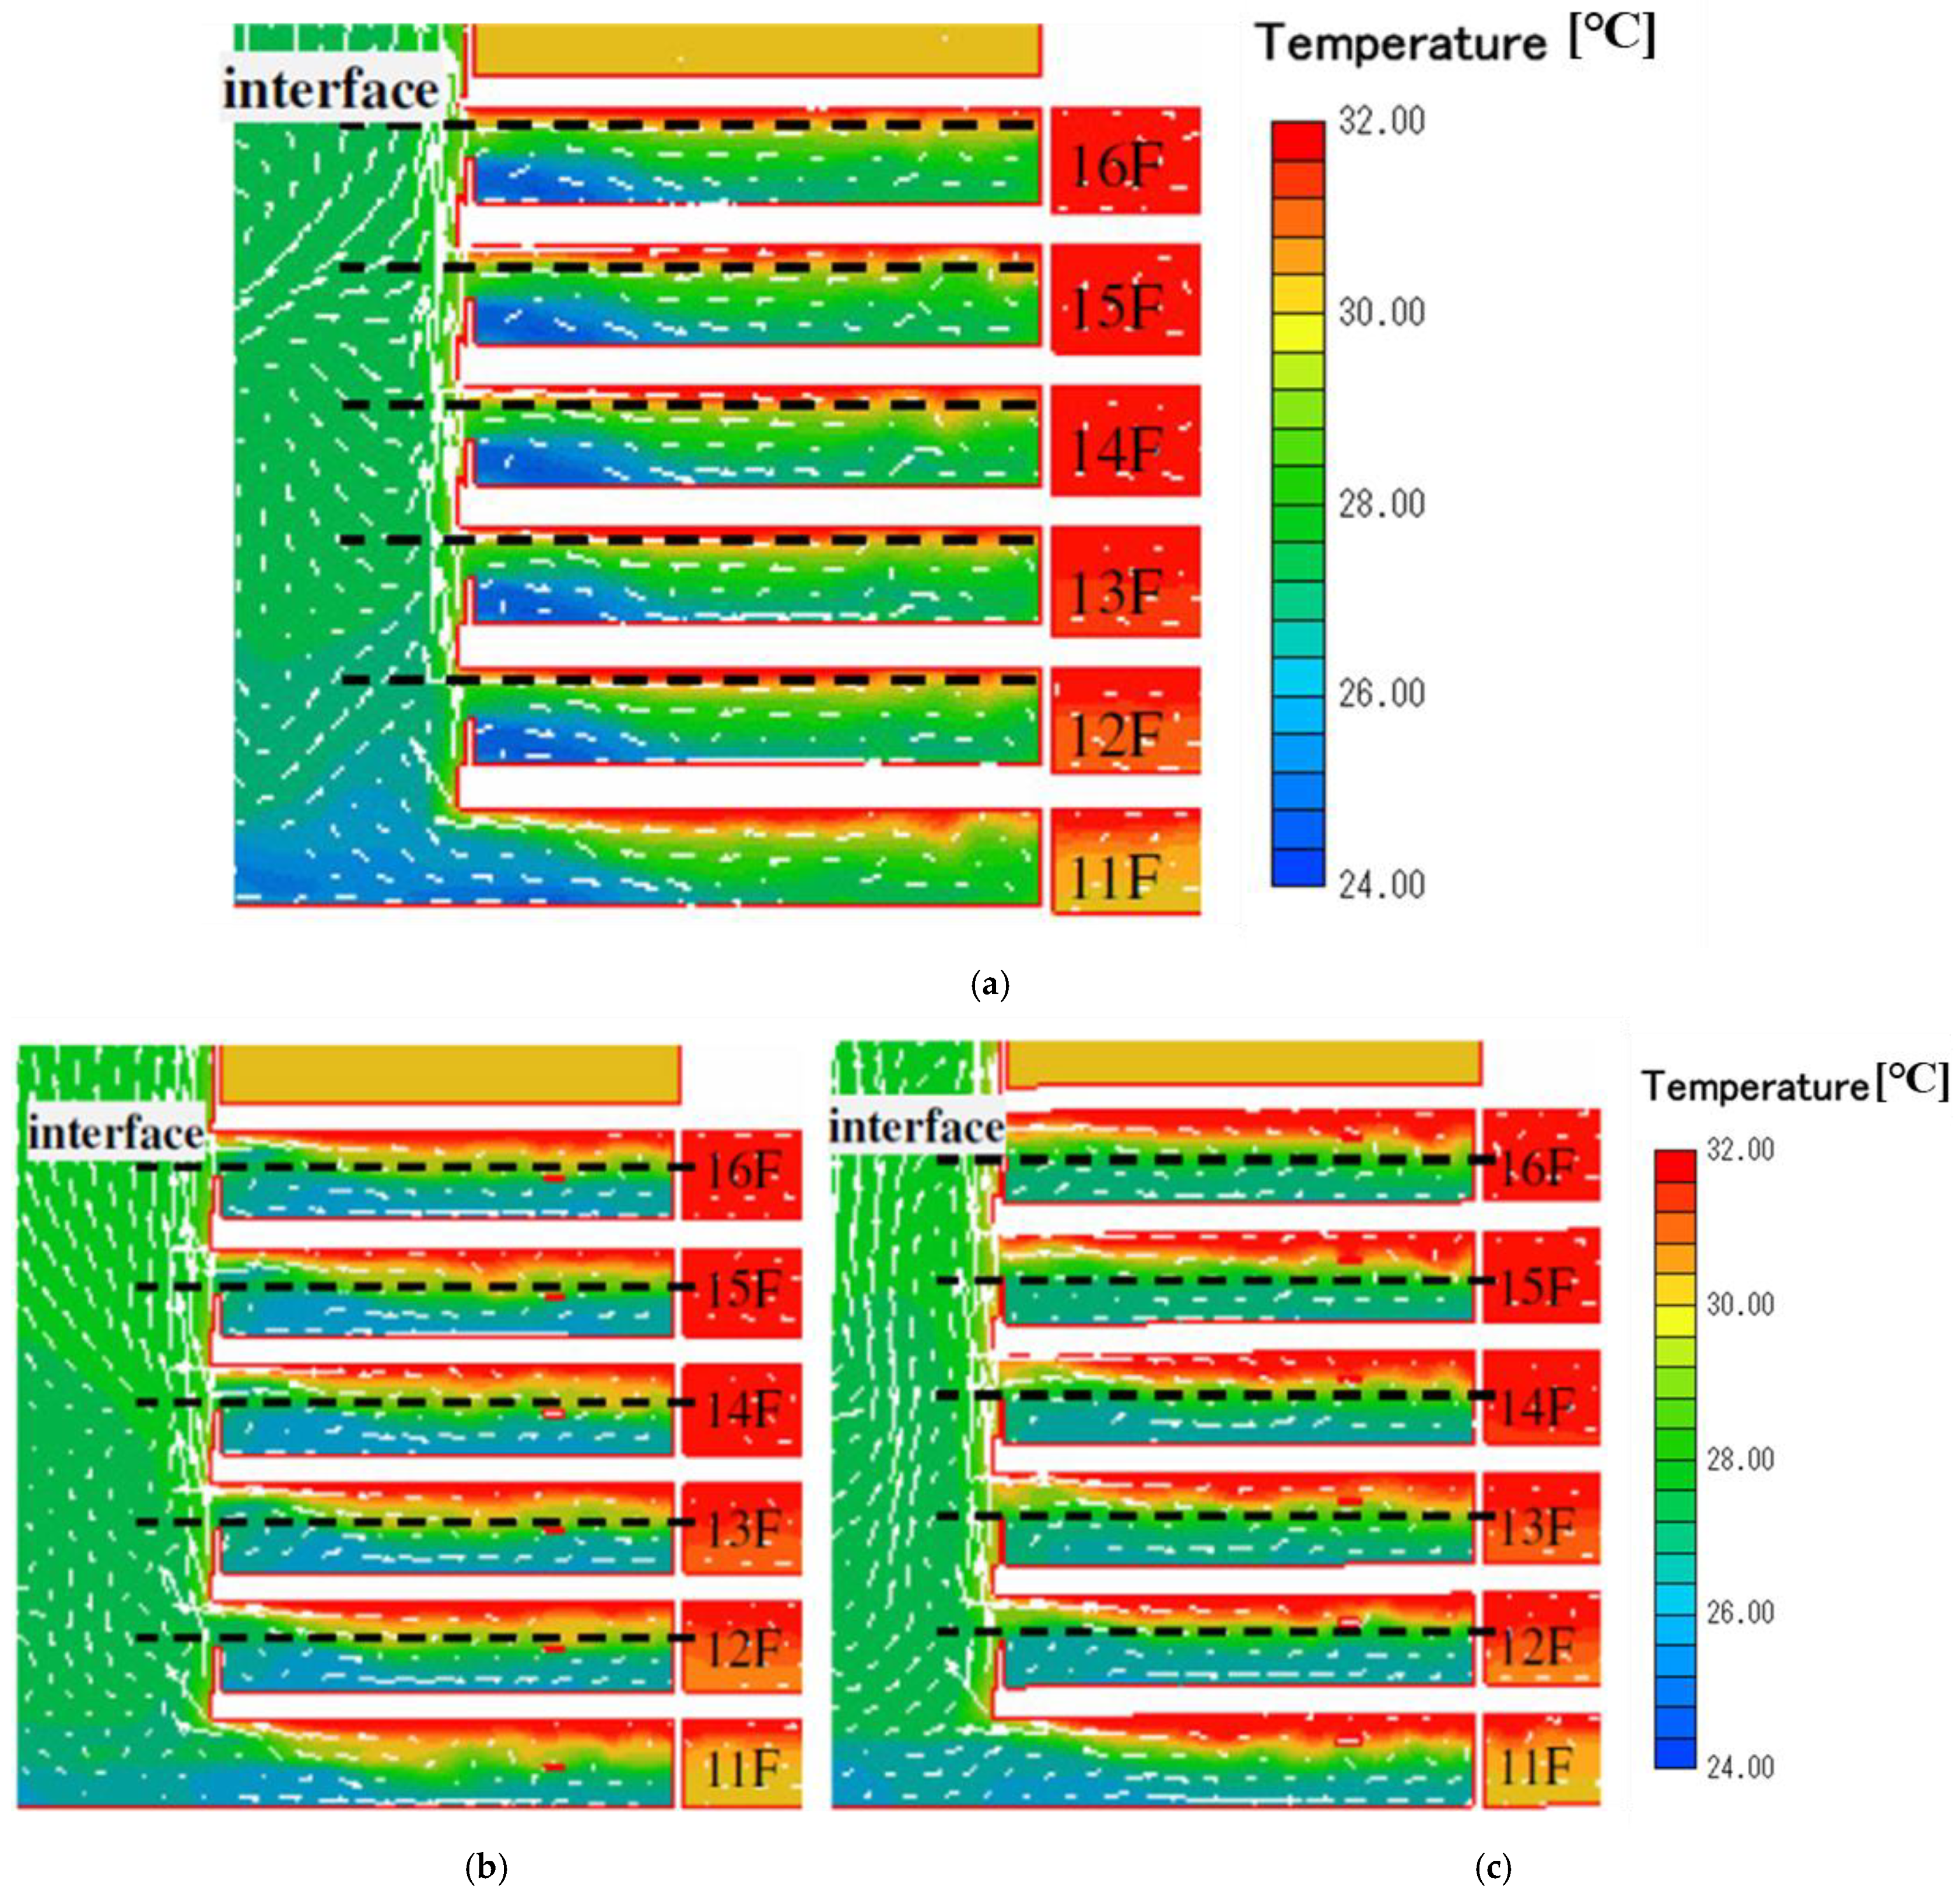
Figure 22 presents the vertical temperature stratification with various heat source heights. The results indicated that the handrail played a crucial role in stratification formation. When the heat source was positioned at a lower height than the handrail, temperature interfaces were formed at the same height as the handrails, and the zones below the handrail had a uniform temperature that was approximately between 26 °C and 27 °C. The interactive effect of heat sources and the handrails increased when the heat sources were at a higher height than the handrail. The temperature interfaces were higher when the heat sources were at a higher height.
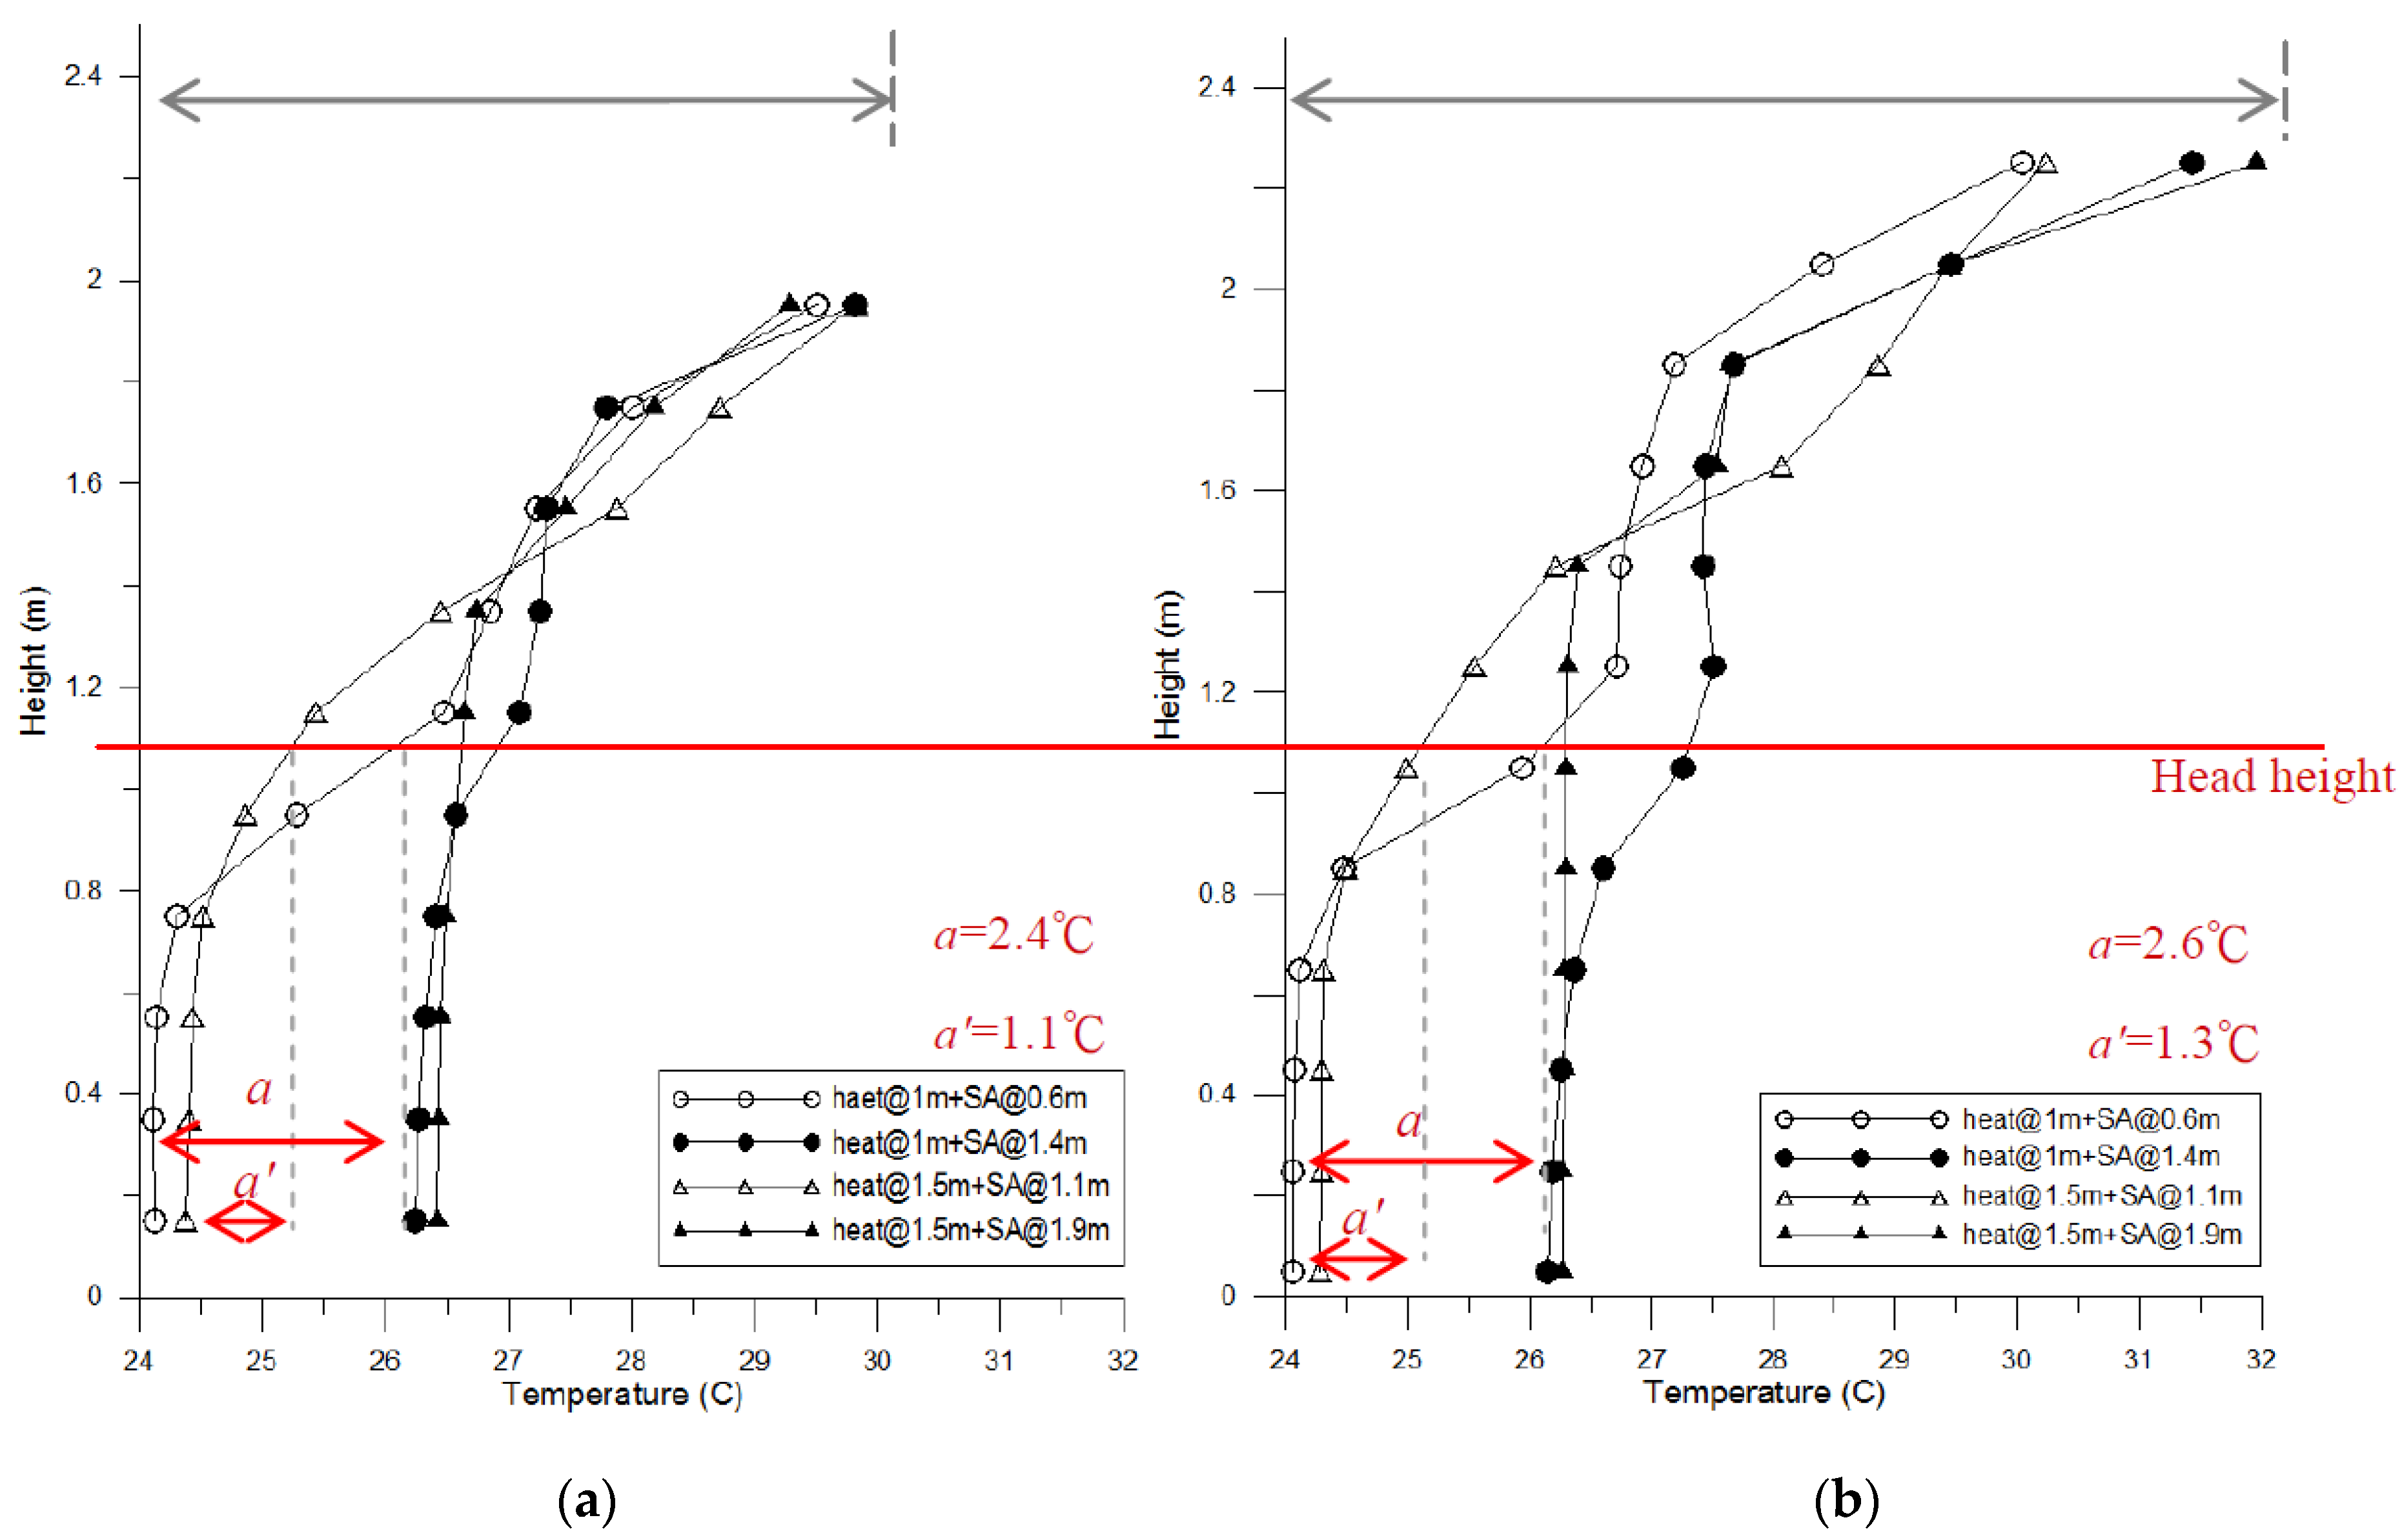
Table 12 presents the PMV values when SA was set at a distance of 0.4 m above or under the heat source. Overall, PMV values were effectively reduced when the SA was positioned under the heat source. When the heat source was at a height of 1.0 m, a lower SA height resulted in PMV values being between 0.20–0.23 less than the results associated with a higher SA height. When the heat source was at a height of 1.5 m (i.e., the heat source was positioned higher than the handrail), the influence of the heat source decreased in the breathing zone, whereas the SA effect increased. A lower SA height resulted in better PMV values, which decreased by 0.22–0.3.
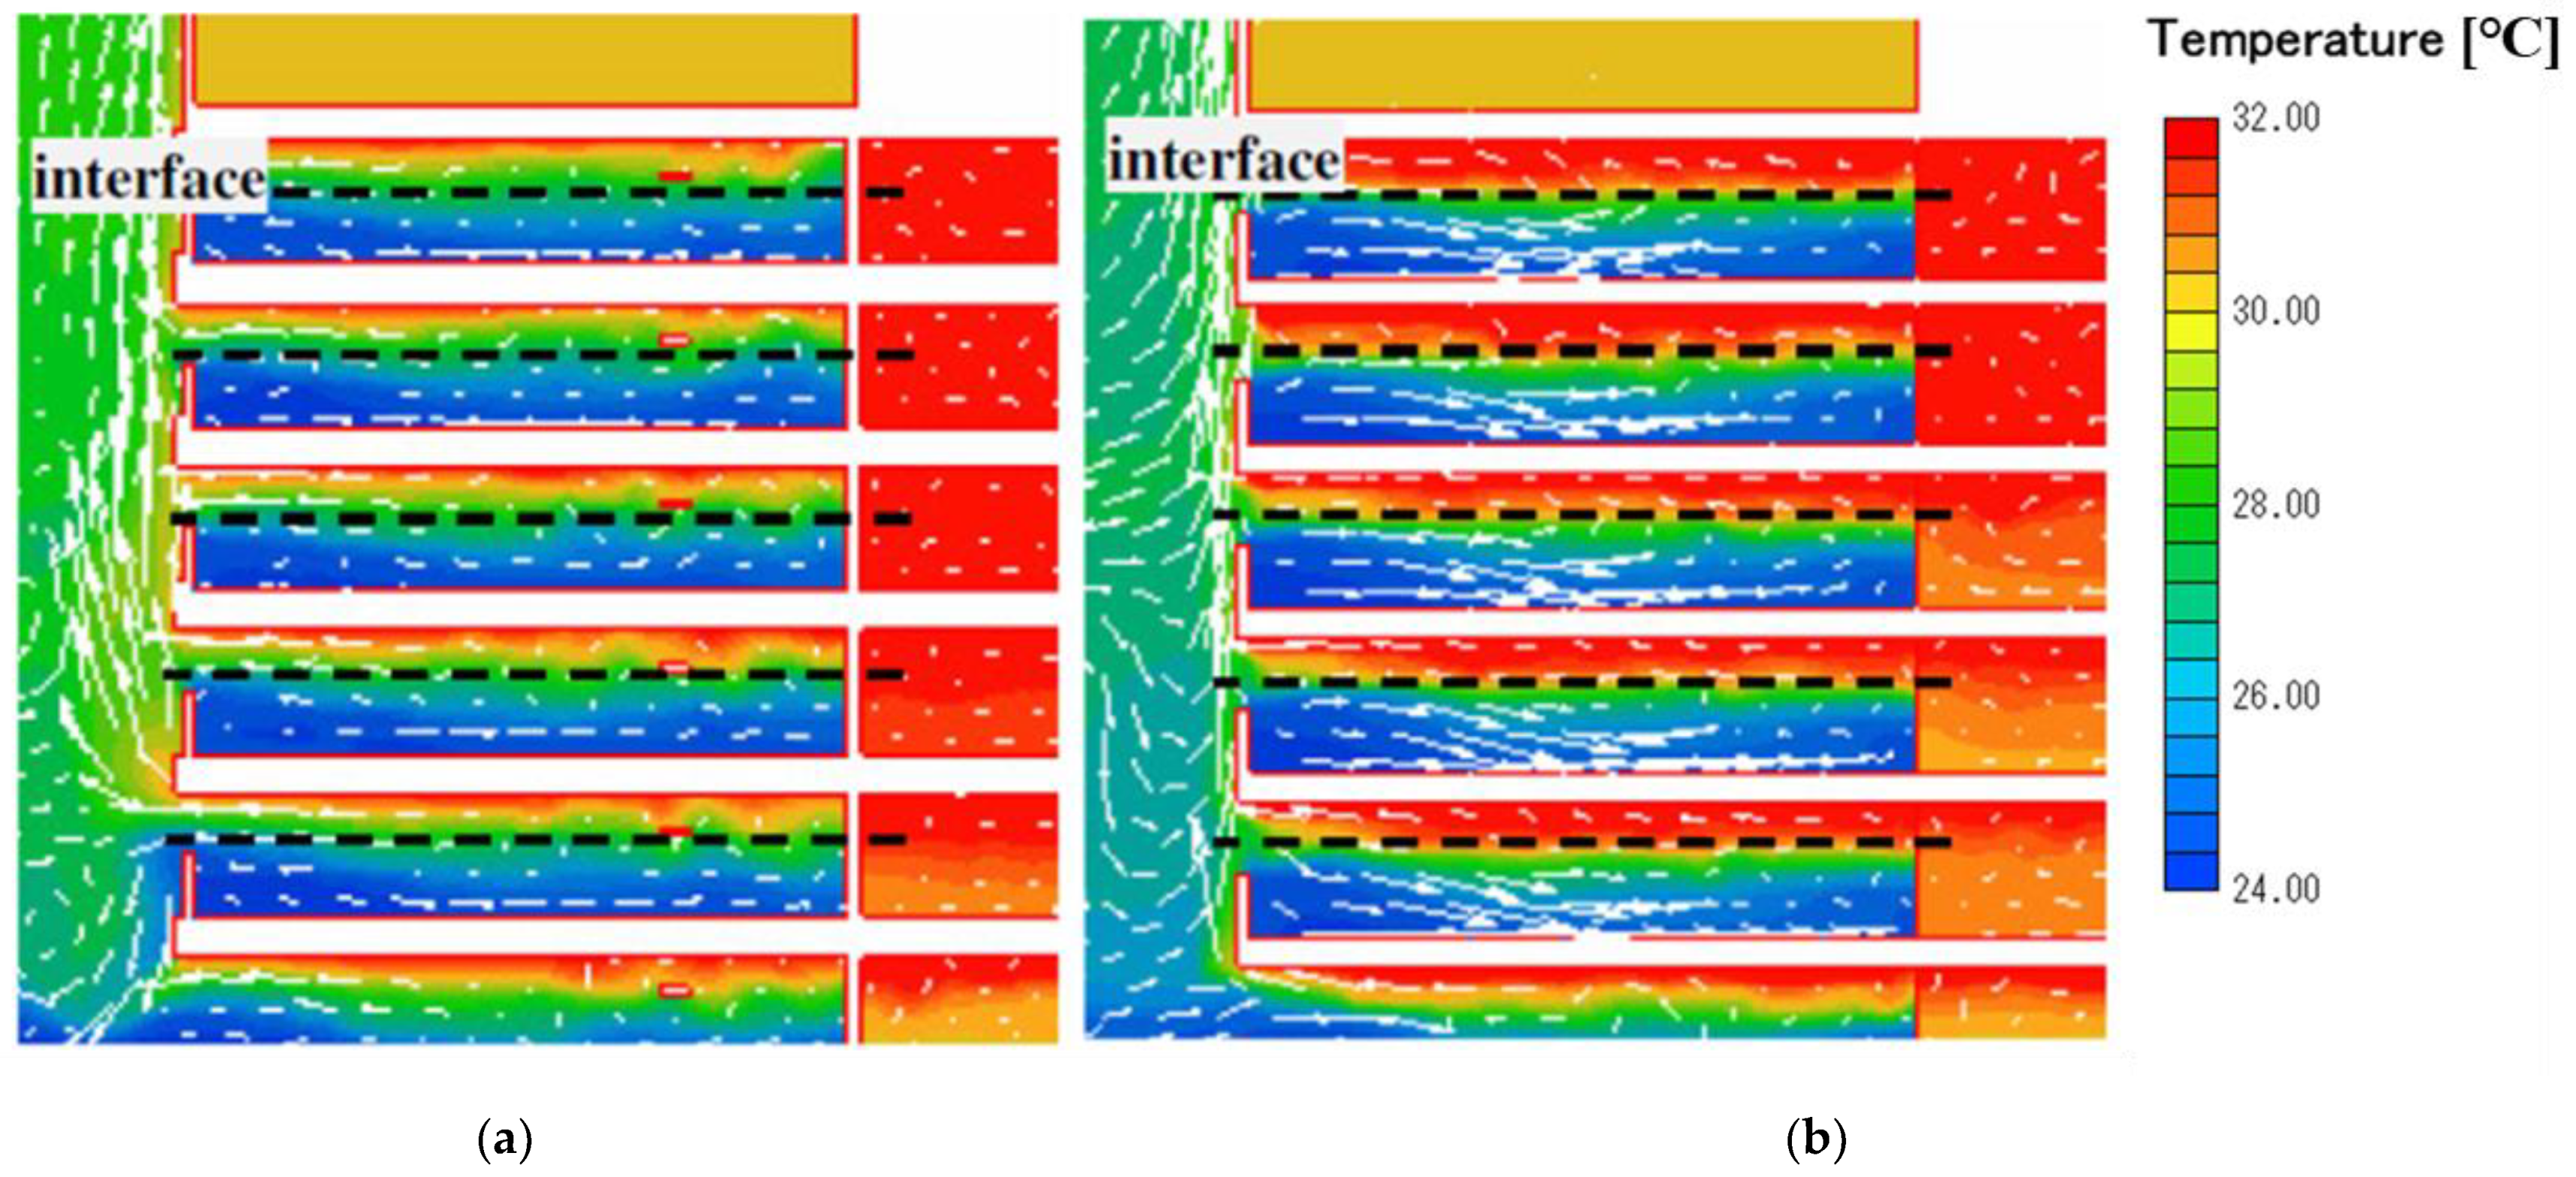
Overall, if the heat sources were positioned higher than the handrail, the interactive effect of handrails, heat sources, and SA height substantially influenced vertical temperature distribution. A higher heat source and t lower SA location resulted in more favorable PMV values for each floor. With respect to the effect of ceiling height, a comparison of Table 12 and Table 13 indicated that when the ceiling height was reduced from 2.15 m to 2.45 m, the PMV values were slightly reduced by 0.1. Figure 23 indicates that a higher ceiling provided more space for heat accumulation, which reduce the influence of accumulated heat on thermal comfort in the breathing zone. Therefore, the vertical temperature difference (ΔTbz) was small. However, the vertical temperature gradient of the entire space (ΔT) varied with ceiling height. Figure 24 indicates that when the ceiling height was increased to 2.45 m, ΔT increased from 5.5 °C to 6.5 °C (i.e., 1–2 °C higher than the values obtained with a ceiling height of 2.1 m).
6. Conclusions
The present study proposed an alternative hybrid ventilation scheme for air-conditioned commercial buildings. The developed design strategies were examined by performing a series of CFD simulations to clarify the interactive influences of building design factors on thermal comfort. The following findings were obtained:
- (1)
- Ambient conditions determine indoor pressure distribution. When the external temperature is higher than the internal temperature of a building, the average internal pressure becomes greater than the external pressure; therefore, the application of the stack effect for ventilation is unsuitable for this scenario.
- (2)
- When the external-air intakes are closed, ambient conditions have a limited effect on the indoor environment of a building. The roof heat by solar radiation slightly enhances stack ventilation.
- (3)
- In an air-conditioned building, the ambient temperature is typically higher than the indoor temperature. Therefore, stack ventilation has a limited influence on thermal comfort. In this scenario, displacement ventilation becomes a primary means of achieving indoor thermal comfort. On the basis of this finding, the hybrid ventilation scheme was developed, shown in Figure 25. The ventilation mechanism comprises two systems, with the first being designed for office rooms and the second being designed for public areas. These two systems have individual targets and ventilation loops, but they are linked by the leaked air in the first system.
- (4)
- The use of a handrail (porosity = 0) near the atrium prevents the cold air from flowing to the atrium and not descending to the bottom of the building. Therefore, the cold air is retained in the space, which leads to a more favorable PMV value. A normal handrail height of 1.1 m was sufficient in the present study.
- (5)
- When the inlet with cold air is positioned above the heat source, higher PMV values are obtained in the breathing zone. When the SA is positioned below the heat source, the PMV values in the breathing zone are considerably reduced, and the vertical temperature difference increases, indicating the increased effect of displacement ventilation.
- (6)
- A higher ceiling height can reduce the temperature difference in the upper area of a given space. Overall, having a higher space, increasing the height of heat sources, and reducing the height of inlets with cooler air can enhance the effect of displacement ventilation, resulting in more favorable PMV values. The combination examined in the presented study achieved a PMV value of 0.54.
Author Contributions
Conceptualization, W.-H.C. and H.-H.H.; writing—original draft preparation, H.-H.H.; writing—review and editing, J.-S.H. All authors have read and agreed to the published version of the manuscript.
Funding
This research received no external funding.
Institutional Review Board Statement
Not applicable.
Conflicts of Interest
The authors declare no conflict of interest.
References
- Acosta, I.; Varela, C.; Molina, J.F.; Navarro, J.; Sendra, J.J. Energy efficiency and lighting design in courtyards and atriums: A predictive method for daylight factors. Appl. Energy 2018, 211, 1216–1228. [Google Scholar] [CrossRef]
- Ghasemi, M.; Noroozi, M.; Kazemzadeh, M.; Roshan, M. The influence of well geometry on the daylight performance of atrium adjoining spaces: A parametric study. J. Build. Eng. 2015, 3, 39–47. [Google Scholar] [CrossRef]
- Wu, P.; Zhou, J.; Li, N. Influences of atrium geometry on the lighting and thermal environments in summer: CFD simulation based on-site measurements for validation. Build. Environ. 2021, 197, 107853. [Google Scholar] [CrossRef]
- Lu, Y.Y.; Dong, J.K.; Wang, Z.J.; Wang, Y.L.; Wu, Q.; Wang, L.; Liu, J. Evaluation of stack ventilation in a large space using zonal simulation and a reduced-scale model experiment with particle image velocimetry. J. Build. Energy 2021, 34, 101958. [Google Scholar] [CrossRef]
- Moosavi, L.; Mahyuddin, N.; Ab Ghafar, N.; Ismail, M.A. Thermal performance of atria: An overview of natural ventilation effective designs. Renew. Sustain. Energy Rev. 2014, 34, 654–667. [Google Scholar] [CrossRef] [Green Version]
- Fernández-Zayas, J.L.; Villa-Medina, J.F.; Valle, N.C.-d.; Porta-Gándara, M.Á. Experimental analysis of natural ventilation of an office building in Mexico City. Case Stud. Therm. Eng. 2021, 28, 101661. [Google Scholar] [CrossRef]
- Al-Kayiem, H.H.; Sreejaya, K.V.; Gilani, S.I.U.H. Mathematical analysis of the influence of the chimney height and collector area on the performance of a roof top solar chimney. Energy Build. 2014, 68, 305–311. [Google Scholar] [CrossRef]
- Shi, L.; Zhang, G.; Yang, W.; Huang, D.; Cheng, X.; Setunge, S. Determining the influencing factors on the performance of solar chimney in buildings. Renew. Sustain. Energy Rev. 2018, 88, 223–238. [Google Scholar] [CrossRef]
- Linden, P.F. The fluid mechanics of natural ventilation. Annu. Rev. Fluid Mech. 1999, 31, 201–238. [Google Scholar] [CrossRef] [Green Version]
- Fitzgerald, S.D.; Woods, A.W. Natural ventilation of a room with vents at multiple levels. Build. Environ. 2004, 39, 505–521. [Google Scholar] [CrossRef]
- Livermore, S.R.; Woods, A.W. Natural ventilation of a building with heating at multiple levels. Build. Environ. 2007, 42, 1417–1430. [Google Scholar] [CrossRef]
- Kotani, H.; Satoh, R.; Yamanaka, T. Stack effect in light well of high rise apartment building. In Proceedings of the IIR International Symposium: Air Conditioning in High Rise Buildings ’97, Shanghai, China, 9–12 September 1997; pp. 628–633. [Google Scholar]
- Holford, J.M.; Hunt, G.R. Fundamental atrium design for natural ventilation. Build. Environ. 2003, 38, 409–426. [Google Scholar] [CrossRef]
- Architectural Energy Corporation. Energy Design Resources Design Brief-Displacement Ventilation. 2005. Available online: https://issuu.com/jean-yvesmesnil/docs/edr_designbriefs_displacementventilation (accessed on 6 December 2021).
- Emmerich, S.J.; McDowell, T. Initial Evaluation of Displacement Ventilation and Dedicated Outdoor Air Systems for U.S. Commercial Buildings; Report Number: 7244; NISTIR: Gaithersburg, MD, USA, 2005. [Google Scholar]
- Lee, K.; Jiang, Z.; Chen, Q. Air distribution effectiveness with stratified air distribution systems. ASHRAE Trans. 2009, 115, 322–333. Available online: https://www.researchgate.net/publication/288643682_Air_distribution_effectiveness_with_stratified_air_distribution_systems (accessed on 6 December 2021).
- Gan, G. Numerical investigation of local thermal discomfort in offices with displacement ventilation. Energy Build. 1995, 23, 73–81. [Google Scholar] [CrossRef]
- Lin, Z.; Chow, T.T.; Tsang, C.F.; Fong, K.F.; Chan, L.S. CFD study on effect of the air supply location on the performance of the displacement ventilation system. Build. Environ. 2005, 40, 1051–1067. [Google Scholar] [CrossRef]
- Mundt, E. Non-buoyant pollutant sources and particles in displacement ventilation. Build. Environ. 2001, 36, 829–836. [Google Scholar] [CrossRef]
- Awad, A.S.; Calay, R.K.; Badran, O.O.; Holdo, A.E. An experimental study of stratified flow in enclosures. Appl. Therm. Eng. 2008, 28, 2150–2158. [Google Scholar] [CrossRef]
- Lee, C.K.; Lam, H.N. Computer modeling of displacement ventilation systems based on plume rise in stratified environment. Energy Build. 2007, 39, 427–436. [Google Scholar] [CrossRef]
- Chiang, W.; Wang, C.; Huang, J. Evaluation of cooling ceiling and mechanical ventilation systems on thermal comfort using CFD study in an office for subtropical region. Build. Environ. 2012, 48, 113–127. [Google Scholar] [CrossRef]
- Available online: http://cmiserver.mit.edu/natvent/Europe/commerzbank.htm (accessed on 1 July 2013).
- The Architecture and Building Research Institute (ABRI). 2012 Green Buildings Evaluation Book; ABRI: New Taipei, Taiwan, 2012.
- Reynolds, J.S. Mechanical and Electrical Equipment for Buildings; John Wiley & Sons: Hoboken, NJ, USA, 1999. [Google Scholar]
- Jones, V. Ernst Neufert Architects’ Data; Wiley-Blackwell: Hoboken, NJ, USA, 1980. [Google Scholar]
- Architectural Institute of Japan. Newest Architects’ Data; Chan’s Arch-Publishing: Taipei, Taiwan, 2011. [Google Scholar]
- ASHRAE. Related Commercial Resources of “Thermal Comfort”; ASHRAE: Peachtree Corners, GA, USA, 2009. [Google Scholar]
- Lu, X. Estimation of indoor moisture generation rate form measurement in buildings. Build. Environ. 2003, 38, 665–675. [Google Scholar] [CrossRef]
- Gan, G. Simulation of buoyancy-driven natural ventilation of buildings-Impact of computational domain. Energy Build. 2010, 42, 1290–1300. [Google Scholar] [CrossRef]
- Franke, J.; Hellsten, A.; Schlünzen, H.; Carissimo, B. COST Action 732: Best Practice Guideline for the CFD Simulation of Flows in the Urban Environment; Cost: Hamburg, Germany, 2007. [Google Scholar]
- Posner, J.D.; Buchanan, C.R.; Rankin, D.D. Measurement and prediction of indoor airflow in a model room. Energy Build. 2003, 35, 515–526. [Google Scholar] [CrossRef]
- Hussain, S.; Oosthuizen, P.H. Numerical investigations of buoyancy-driven natural ventilation in a simple three-storey atrium building and thermal comfort evaluation. Appl. Therm. Eng. 2013, 57, 133–146. [Google Scholar] [CrossRef]
- Wong, N.H.; Feriadi, H.; Lim, P.Y.; Tham, K.W.; Sekhar, C.; Cheong, K.W. Thermal comfort evaluation of naturally ventilated public housing in Singapore. Build. Environ. 2002, 37, 1267–1277. [Google Scholar] [CrossRef]
- Wong, N.H.; Khoo, S.S. Thermal comfort in classroom in the tropics. Energy Build. 2003, 35, 337–351. [Google Scholar] [CrossRef]
Figure 1.
Pressure distribution and neutral level height.

Figure 2.
Studied building. (a) Standard plan. (b) Perspective.

Figure 3.
Commercial bank building in Frankfurt designed by Norman Foster. Adapted from available online: http://cmiserver.mit.edu/natvent/Europe/commerzbank.htm (accessed on 1 July 2013) [23].
Figure 3.
Commercial bank building in Frankfurt designed by Norman Foster. Adapted from available online: http://cmiserver.mit.edu/natvent/Europe/commerzbank.htm (accessed on 1 July 2013) [23].

Figure 4.
A section of the studied building.

Figure 5.
Predicted flow path in the studied building.

Figure 6.
Research procedure.

Figure 7.
Handrail height settings.

Figure 8.
Heat source height settings.

Figure 9.
Computational domain.

Figure 10.
Comfort zone adopted in the present study.

Figure 11.
The comparison of neutral level between this study and Linden’s equation.

Figure 12.
Simulation at 24 °C when both external air and cold air from office rooms are applied. (a) Pressure distribution. (b) Temperature contour with flow vectors.
Figure 12.
Simulation at 24 °C when both external air and cold air from office rooms are applied. (a) Pressure distribution. (b) Temperature contour with flow vectors.

Figure 13.
Simulation at 30 °C when both external air and cold air from office rooms are applied. (a) Pressure distribution. (b) Temperature contour with flow vectors.
Figure 13.
Simulation at 30 °C when both external air and cold air from office rooms are applied. (a) Pressure distribution. (b) Temperature contour with flow vectors.

Figure 14.
Temperature distribution with ambient temperature at 26 °C.

Figure 15.
Temperature distribution with ambient temperature at 30 °C.

Figure 16.
Temperature distribution in atrium with low SA height (0.4 m).

Figure 17.
Vertical temperature distribution of public area with varying SA height.

Figure 18.
Vertical temperature distribution of atrium with varying SA height.

Figure 19.
Temperature distribution with 1.9 m handrail and 0.4 m SA height.

Figure 20.
Vertical temperature difference with various handrail and SA heights. (a) 1.1 m handrail. (b) 1.9 m handrail.
Figure 20.
Vertical temperature difference with various handrail and SA heights. (a) 1.1 m handrail. (b) 1.9 m handrail.

Figure 21.
Vertical temperature distribution with various handrail heights. (a) Vertical temperature distribution in middle section of atrium with 1.1 m handrails. (b) Vertical temperature distribution in middle section of atrium with 1.9 m handrails. (c) Vertical temperature distribution in outer ring of atrium with 1.1 m handrails. (d) Vertical temperature distribution in outer ring of atrium with 1.9 m handrails.


Figure 22.
Temperature distribution with various heat source heights. (a) Heat source at ground level when SA height was 0.4 m. (b) Heat source at 1 m when SA height was 0.4 m. (c) Heat source at 1.5 m when SA height was 0.4 m.
Figure 22.
Temperature distribution with various heat source heights. (a) Heat source at ground level when SA height was 0.4 m. (b) Heat source at 1 m when SA height was 0.4 m. (c) Heat source at 1.5 m when SA height was 0.4 m.

Figure 23.
Temperature distribution with various ceiling heights (heat source at 1.5 m when SA at 1.1 m). (a) 2.15 m ceiling height. (b) 2.45 m ceiling height.
Figure 23.
Temperature distribution with various ceiling heights (heat source at 1.5 m when SA at 1.1 m). (a) 2.15 m ceiling height. (b) 2.45 m ceiling height.

Figure 24.
Vertical temperature distribution with various ceiling heights. (a) 2.15 m ceiling height. (b) 2.45 m ceiling height.
Figure 24.
Vertical temperature distribution with various ceiling heights. (a) 2.15 m ceiling height. (b) 2.45 m ceiling height.

Figure 25.
Cooling mechanism for entire building.


Table 1.
Annual statistics of external temperature above 24 °C in Taipei.
| Temp. (°C) | 24 | 25 | 26 | 27 | 28 | 29 | 30 | 31 |
|---|---|---|---|---|---|---|---|---|
| Hours (h) | 544 | 221 | 241 | 238 | 211 | 239 | 223 | 236 |
| Annual ratio (%) | 15 | 6 | 7 | 7 | 6 | 7 | 6 | 6 |
| Temp. (°C) | 32 | 33 | 34 | 35 | 36 | 37 | 38 | total |
| Hours (h) | 209 | 158 | 69 | 14 | 12 | 7 | 3 | 2625 |
| Annual ratio (%) | 6 | 4 | 2 | 0 | 0 | 0 | 0 | 72 |
Table 2.
Solar radiation and humidity at 24 °C and 30 °C.
| Temperature (°C) | 24 | 30 |
|---|---|---|
| Relative humidity | 80% | 75% |
| Diffuse radiation (horizontal) | 75 W | 200 W |
Table 3.
Sensation equivalent of PMV value.
| PMV Value | Sensation |
|---|---|
| +3 | heat |
| +2 | hot |
| +1 | warm |
| 0 | comfort |
| −1 | cool |
| −2 | cold |
| −3 | freeze |
Table 4.
Comparison between present study and Linden’s equation.
| Linden’s | This Study | Difference | |
|---|---|---|---|
| Neutral level height (m) | H = 14.29 | h’ = 14.35 | 4.2% |
| Total airflow (m3/s) | Q = 6.35 | Q’ = 6.86 | 8.0% |
Table 5.
Airflow rate on each floor.
| Floor | Q’ (m3/s) |
|---|---|
| 11F | 1.15 |
| 12F | 1.15 |
| 13F | 1.18 |
| 14F | 1.15 |
| 15F | 1.13 |
| 16F | 1.10 |
| total | 6.86 |
Table 6.
Velocity for various grid arrangements (m/s).
| Floor | 11F | 12F | 13F | 14F | 15F | 16F |
|---|---|---|---|---|---|---|
| Chosen grid | 0.89 | 0.79 | 0.68 | 0.58 | 0.42 | 0.18 |
| 2 times finer grid | 0.93 | 0.85 | 0.74 | 0.63 | 0.46 | 0.19 |
| Discrepancy | −4% | −7% | −8% | −8% | −9% | −5% |
Table 7.
PMV-PPD values with weather condition at 24 °C.
| 11F | 12F | 13F | 14F | 15F | 16F | Avg. | |
|---|---|---|---|---|---|---|---|
| PMV | 0.26 | 0.50 | 0.61 | 0.64 | 0.73 | 0.96 | 0.65 |
| PPD (%) | 6 | 10 | 13 | 14 | 16 | 24 | 14 |
Table 8.
Thermal parameters at various ambient temperatures.
| Items | Ambient Temp. | 11F | 12F | 13F | 14F | 15F | 16F | Avg. |
|---|---|---|---|---|---|---|---|---|
| Velocity (m/s) | 26 °C | 0.11 | 0.11 | 0.11 | 0.11 | 0.11 | 0.11 | 0.11 |
| 30 °C | 0.11 | 0.12 | 0.12 | 0.11 | 0.11 | 0.11 | 0.11 | |
| Temp. (°C) | 26 °C | 28.30 | 29.29 | 29.30 | 29.30 | 29.20 | 29.30 | 29.12 |
| 30 °C | 28.36 | 29.26 | 29.30 | 29.30 | 29.30 | 29.30 | 29.14 | |
| Humidity (%) | 26 °C | 43.43 | 42.08 | 42.10 | 42.02 | 42.07 | 41.99 | 42.28 |
| 30 °C | 43.40 | 42.25 | 42.04 | 42.11 | 42.05 | 42.01 | 42.31 |
Table 9.
PMV value for each floor with varying SA height.
| SA Height | 11F | 12F | 13F | 14F | 15F | 16F | Avg. |
|---|---|---|---|---|---|---|---|
| 0.4 m | 0.78 | 1.19 | 1.15 | 1.27 | 1.21 | 1.16 | 1.13 |
| 2 m | 1.12 | 1.39 | 1.39 | 1.39 | 1.36 | 1.39 | 1.34 |
Table 10.
PMV values with various handrail and SA heights.
| Handrail Height | SA Height | 11F | 12F | 13F | 14F | 15F | 16F | Avg. |
|---|---|---|---|---|---|---|---|---|
| 1.1 m | 2 m | 1.07 | 1.05 | 1.09 | 1.08 | 1.10 | 1.11 | 1.09 |
| 1 m | 0.78 | 0.90 | 0.93 | 0.98 | 0.89 | 0.83 | 0.88 | |
| 0.4 m | 0.79 | 0.73 | 0.75 | 0.79 | 0.80 | 0.82 | 0.78 | |
| 1.9 m | 2 m | 1.05 | 0.96 | 0.96 | 0.99 | 0.98 | 0.97 | 0.98 |
| 1 m | 0.79 | 0.81 | 0.74 | 0.78 | 0.78 | 0.77 | 0.77 | |
| 0.4 m | 0.76 | 0.68 | 0.68 | 0.68 | 0.71 | 0.71 | 0.70 |
Table 11.
PMV values with various heat source heights.
| Heat Source Height | SA Height | 11F | 12F | 13F | 14F | 15F | 16F | Avg. |
|---|---|---|---|---|---|---|---|---|
| 0 m | 0.4m | 0.79 | 0.73 | 0.75 | 0.79 | 0.80 | 0.82 | 0.78 |
| 1 m | 1.4m | 0.89 | 0.89 | 0.91 | 0.89 | 0.89 | 0.91 | 0.90 |
| 1.5 m | 1.9m | 0.85 | 0.87 | 0.97 | 0.94 | 0.96 | 0.98 | 0.92 |
Table 12.
PMV values with various SA heights.
| Heat Source Height | SA Height | 11F | 12F | 13F | 14F | 15F | 16F | Avg. |
|---|---|---|---|---|---|---|---|---|
| 1 m | 1.4m | 0.89 | 0.89 | 0.91 | 0.89 | 0.89 | 0.91 | 0.90 |
| 0.6m | 0.68 | 0.67 | 0.68 | 0.70 | 0.69 | 0.70 | 0.69 | |
| 1.5 m | 1.9m | 0.85 | 0.87 | 0.97 | 0.94 | 0.96 | 0.98 | 0.92 |
| 1.1m | 0.58 | 0.65 | 0.66 | 0.69 | 0.67 | 0.68 | 0.65 |
Table 13.
PMV values with 2.45 m ceiling height.
| Heat Source Height | SA Height | 11F | 12F | 13F | 14F | 15F | 16F | Avg. |
|---|---|---|---|---|---|---|---|---|
| 1 m | 1.4 m | 0.71 | 0.84 | 0.83 | 0.80 | 0.83 | 0.83 | 0.81 |
| 0.6 m | 0.49 | 0.53 | 0.58 | 0.61 | 0.62 | 0.64 | 0.59 | |
| 1.5 m | 1.9 m | 0.79 | 0.85 | 0.84 | 0.86 | 0.86 | 0.89 | 0.87 |
| 1.1 m | 0.40 | 0.57 | 0.53 | 0.56 | 0.59 | 0.62 | 0.54 |
Publisher’s Note: MDPI stays neutral with regard to jurisdictional claims in published maps and institutional affiliations. |
© 2021 by the authors. Licensee MDPI, Basel, Switzerland. This article is an open access article distributed under the terms and conditions of the Creative Commons Attribution (CC BY) license (https://creativecommons.org/licenses/by/4.0/).
Share and Cite
MDPI and ACS Style
Hsu, H.-H.; Chiang, W.-H.; Huang, J.-S. Hybrid Ventilation in an Air-Conditioned Office Building with a Multistory Atrium for Thermal Comfort: A Practical Case Study. Buildings 2021, 11, 625. https://doi.org/10.3390/buildings11120625
AMA Style
Hsu H-H, Chiang W-H, Huang J-S. Hybrid Ventilation in an Air-Conditioned Office Building with a Multistory Atrium for Thermal Comfort: A Practical Case Study. Buildings. 2021; 11(12):625. https://doi.org/10.3390/buildings11120625
Chicago/Turabian StyleHsu, Hao-Hsiang, Wei-Hwa Chiang, and Jian-Sheng Huang. 2021. "Hybrid Ventilation in an Air-Conditioned Office Building with a Multistory Atrium for Thermal Comfort: A Practical Case Study" Buildings 11, no. 12: 625. https://doi.org/10.3390/buildings11120625
Note that from the first issue of 2016, this journal uses article numbers instead of page numbers. See further details here.