
The Interaction between Congruency and Numerical Ratio Effects in the Nonsymbolic Comparison Test

 , and
, and
Abstract
:1. Introduction
Current Study
- (1)
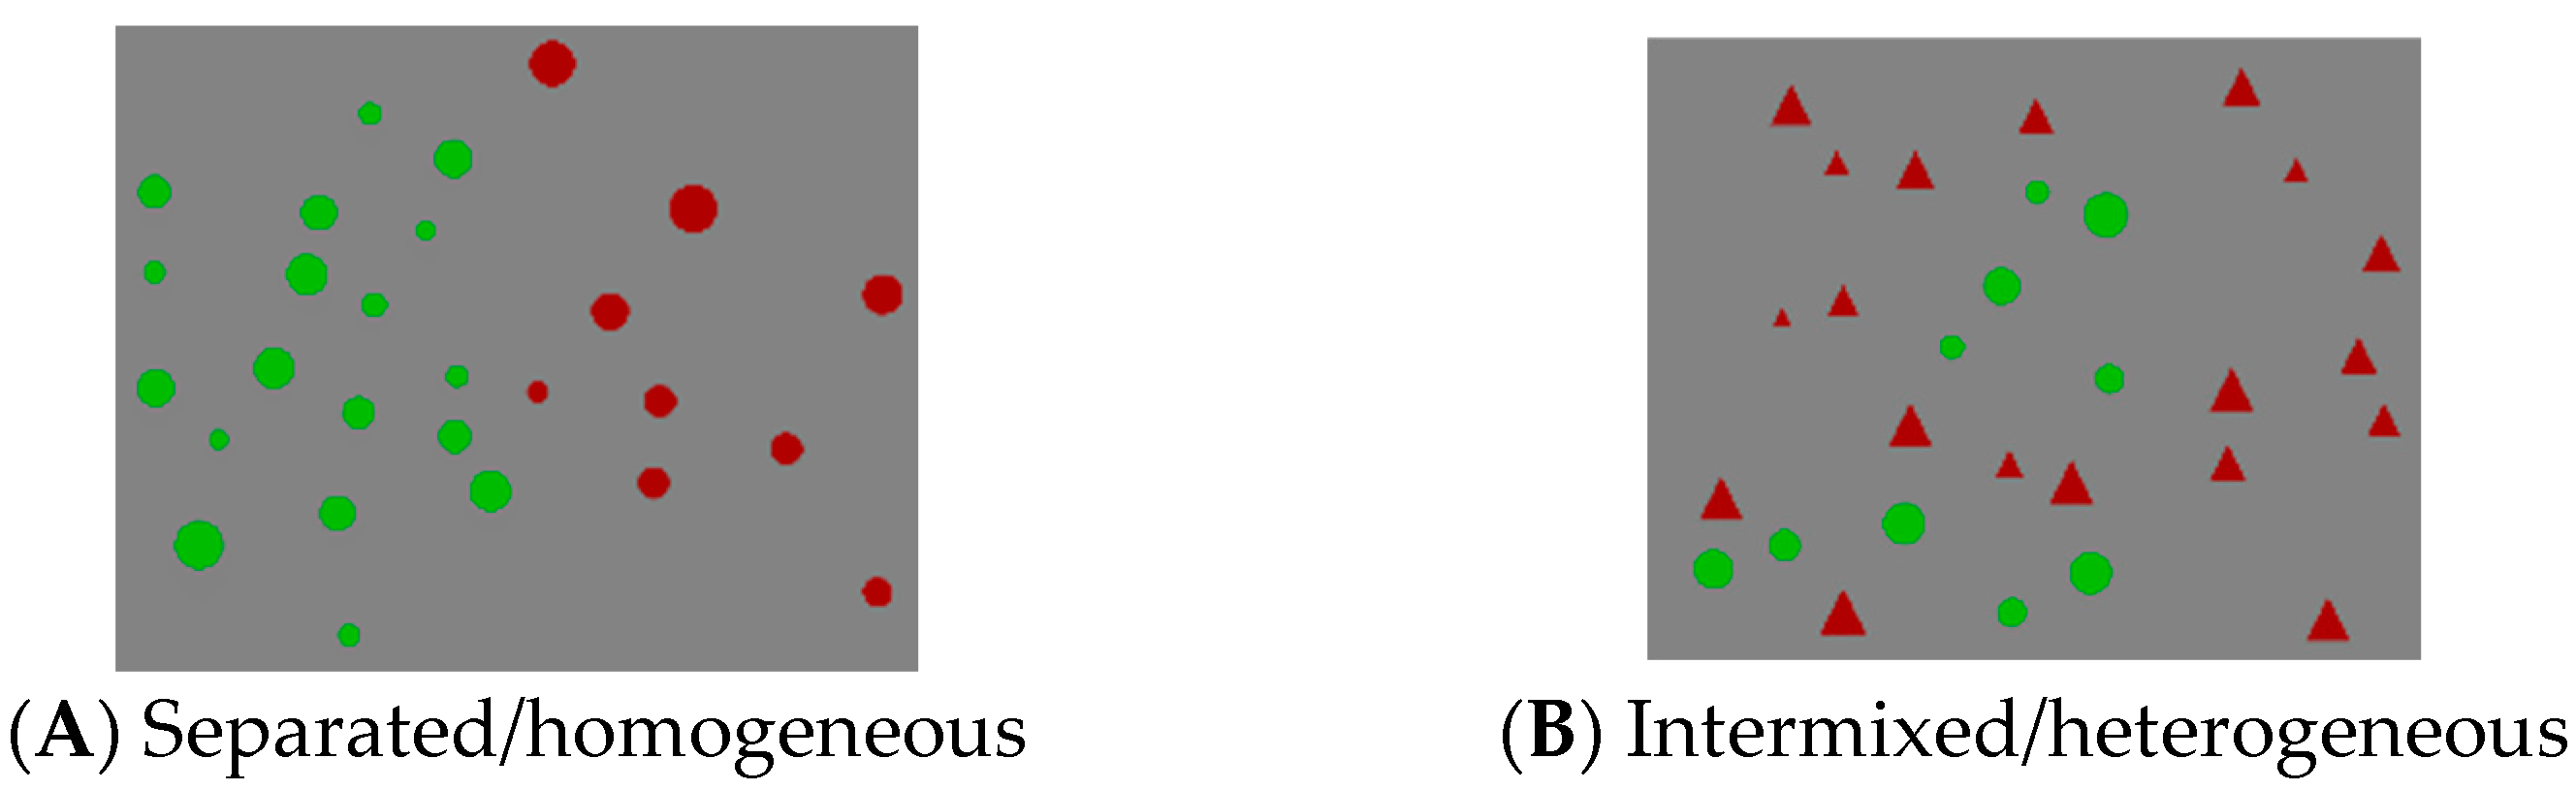
- The congruency effect would be smaller in the intermixed/heterogeneous format than in the separated/homogenous format even in the case of full incongruency. We hypothesized that the difference between formats might be explained by the difficulties in estimating visual cues. In the intermixed/heterogeneous format, the comparison of convex hull and cumulative areas might be distorted. From this perspective, in intermixed/heterogeneous conditions, participants may not be able to accurately estimate visual cues and would have to rely mostly on the estimation of numerical features;
- (2)
- The NRE would be higher in the intermixed/heterogeneous format than in the separated/homogenous format. In a previous study, it was suggested that visual and numerical features of compared arrays can be processed in parallel [39]. Their interrelationships may vary depending on how easy and accessible it is to evaluate and compare non-numerical visual parameters. We hypothesized that if in intermixed/heterogeneous conditions, the estimation of visual cues is impeded, numerical features would be more salient than non-numerical visual features. Therefore, the NRE would increase in the intermixed format;
- (3)
- The congruency effect would increase with a larger numerical proportion, and this dependency would be more pronounced in the separated format. This hypothesis is based on the assumption that the estimation of visual and numerical information can be processed in parallel, but in incongruent trials, these processes come into conflict. Consequently, if the estimation of numerical information becomes more noisy due to an increase in numerical proportion, the effect of visual cues and the congruency effect might increase. The congruency effect would be higher when the estimation of visual parameters is easier than the estimation of numerical information. In such a case, the congruency effect would be more pronounced in the separated format and when the numerical proportion between the two sets is high.
2. Materials and Methods
2.1. Sample
2.2. Instrument and Procedure
Nonsymbolic Comparison Test
2.3. Statistical Approach
3. Results
3.1. Descriptive Statistics
3.2. Results of GLMM
4. Discussion
4.1. Limitations
4.2. Conclusions
Author Contributions
Funding
Institutional Review Board Statement
Informed Consent Statement
Data Availability Statement
Conflicts of Interest
References
- Halberda, J.; Mazzocco, M.M.M.; Feigenson, L. Individual Differences in Non-Verbal Number Acuity Correlate with Maths Achievement. Nature 2008, 455, 665–668. [Google Scholar] [CrossRef] [PubMed]
- Lipton, J.S.; Spelke, E.S. Origins of Number Sense: Large-Number Discrimination in Human Infants. Psychol. Sci. 2003, 14, 396–401. [Google Scholar] [CrossRef] [PubMed]
- Starr, A.; Libertus, M.E.; Brannon, E.M. Number Sense in Infancy Predicts Mathematical Abilities in Childhood. Proc. Natl. Acad. Sci. USA 2013, 110, 18116–18120. [Google Scholar] [CrossRef] [PubMed]
- Odic, D.; Starr, A. An Introduction to the Approximate Number System. Child. Dev. Perspect. 2018, 12, 223–229. [Google Scholar] [CrossRef] [PubMed]
- DeWind, N.K.; Adams, G.K.; Platt, M.L.; Brannon, E.M. Modeling the Approximate Number System to Quantify the Contribution of Visual Stimulus Features. Cognition 2015, 142, 247–265. [Google Scholar] [CrossRef] [PubMed]
- Harvey, B.M.; Dumoulin, S.O. Can Responses to Basic Non-Numerical Visual Features Explain Neural Numerosity Responses? NeuroImage 2017, 149, 200–209. [Google Scholar] [CrossRef]
- Van Rinsveld, A.; Guillaume, M.; Kohler, P.J.; Schiltz, C.; Gevers, W.; Content, A. The Neural Signature of Numerosity by Separating Numerical and Continuous Magnitude Extraction in Visual Cortex with Frequency-Tagged EEG. Proc. Natl. Acad. Sci. USA 2020, 117, 5726–5732. [Google Scholar] [CrossRef]
- Park, J.; DeWind, N.K.; Woldorff, M.G.; Brannon, E.M. Rapid and Direct Encoding of Numerosity in the Visual Stream. Cereb. Cortex 2016, 26, 748–763. [Google Scholar] [CrossRef]
- Sokolowski, H.M.; Fias, W.; Mousa, A.; Ansari, D. Common and Distinct Brain Regions in Both Parietal and Frontal Cortex Support Symbolic and Nonsymbolic Number Processing in Humans: A Functional Neuroimaging Meta-Analysis. NeuroImage 2017, 146, 376–394. [Google Scholar] [CrossRef]
- Price, G.R.; Palmer, D.; Battista, C.; Ansari, D. Nonsymbolic Numerical Magnitude Comparison: Reliability and Validity of Different Task Variants and Outcome Measures, and Their Relationship to Arithmetic Achievement in Adults. Acta Psychol. 2012, 140, 50–57. [Google Scholar] [CrossRef]
- Libertus, M.E.; Feigenson, L.; Halberda, J. Preschool Acuity of the Approximate Number System Correlates with School Math Ability: Approximate Number System and Math Abilities. Dev. Sci. 2011, 14, 1292–1300. [Google Scholar] [CrossRef]
- Dehaene, S. Precis of The Number Sense. Mind Lang. 2001, 16, 16–36. [Google Scholar] [CrossRef]
- Sasanguie, D.; Defever, E.; Van den Bussche, E.; Reynvoet, B. The Reliability of and the Relation between Non-Symbolic Numerical Distance Effects in Comparison, Same-Different Judgments and Priming. Acta Psychol. 2011, 136, 73–80. [Google Scholar] [CrossRef] [PubMed]
- Holloway, I.D.; Ansari, D. Mapping Numerical Magnitudes onto Symbols: The Numerical Distance Effect and Individual Differences in Children’s Mathematics Achievement. J. Exp. Child Psychol. 2009, 103, 17–29. [Google Scholar] [CrossRef] [PubMed]
- Lyons, I.M.; Nuerk, H.-C.; Ansari, D. Rethinking the Implications of Numerical Ratio Effects for Understanding the Development of Representational Precision and Numerical Processing across Formats. J. Exp. Psychol. Gen. 2015, 144, 1021–1035. [Google Scholar] [CrossRef] [PubMed]
- Smets, K.; Gebuis, T.; Reynvoet, B. Comparing the Neural Distance Effect Derived from the Non–Symbolic Comparison and the Same–Different Task. Front. Hum. Neurosci. 2013, 7, 28. [Google Scholar] [CrossRef] [PubMed]
- Dietrich, J.F.; Huber, S.; Nuerk, H.-C. Methodological Aspects to Be Considered When Measuring the Approximate Number System (ANS)—A Research Review. Front. Psychol. 2015, 6, 295. [Google Scholar] [CrossRef] [PubMed]
- Dehaene, S. The Neural Basis of the Weber–Fechner Law: A Logarithmic Mental Number Line. Trends Cogn. Sci. 2003, 7, 145–147. [Google Scholar] [CrossRef]
- Izard, V.; Dehaene, S. Calibrating the Mental Number Line. Cognition 2008, 106, 1221–1247. [Google Scholar] [CrossRef]
- Zebian, S. Linkages between Number Concepts, Spatial Thinking, and Directionality of Writing: The SNARC Effect and the REVERSE SNARC Effect in English and Arabic Monoliterates, Biliterates, and Illiterate Arabic Speakers. J. Cogn. Cult. 2005, 5, 165–190. [Google Scholar] [CrossRef]
- Nieder, A.; Miller, E.K. Coding of Cognitive Magnitude. Neuron 2003, 37, 149–157. [Google Scholar] [CrossRef]
- Feigenson, L.; Dehaene, S.; Spelke, E. Core Systems of Number. Trends Cogn. Sci. 2004, 8, 307–314. [Google Scholar] [CrossRef] [PubMed]
- Van Opstal, F.; Gevers, W.; De Moor, W.; Verguts, T. Dissecting the Symbolic Distance Effect: Comparison and Priming Effects in Numerical and Nonnumerical Orders. Psychon. Bull. Rev. 2008, 15, 419–425. [Google Scholar] [CrossRef] [PubMed]
- Verguts, T.; Van Opstal, F. Dissociation of the Distance Effect and Size Effect in One-Digit Numbers. Psychon. Bull. Rev. 2005, 12, 925–930. [Google Scholar] [CrossRef]
- Maloney, E.A.; Risko, E.F.; Preston, F.; Ansari, D.; Fugelsang, J. Challenging the Reliability and Validity of Cognitive Measures: The Case of the Numerical Distance Effect. Acta Psychol. 2010, 134, 154–161. [Google Scholar] [CrossRef]
- Chesney, D. Numerical Distance Effect Size Is a Poor Metric of Approximate Number System Acuity. Atten. Percept. Psychophys. 2018, 80, 1057–1063. [Google Scholar] [CrossRef] [PubMed]
- Leibovich, T.; Henik, A. Magnitude Processing in Non-Symbolic Stimuli. Front. Psychol. 2013, 4, 375. [Google Scholar] [CrossRef]
- Content, A.; Velde, M.V.; Adriano, A. Approximate Number Sense Theory or Approximate Theory of Magnitude? Behav. Brain Sci. 2017, 40, e168. [Google Scholar] [CrossRef]
- Van Hoogmoed, A.H.; Kroesbergen, E.H. On the Difference Between Numerosity Processing and Number Processing. Front. Psychol. 2018, 9, 1650. [Google Scholar] [CrossRef]
- Gebuis, T.; Reynvoet, B. The Interplay between Nonsymbolic Number and Its Continuous Visual Properties. J. Exp. Psychol. Gen. 2012, 141, 642–648. [Google Scholar] [CrossRef]
- Szűcs, D.; Nobes, A.; Devine, A.; Gabriel, F.C.; Gebuis, T. Visual Stimulus Parameters Seriously Compromise the Measurement of Approximate Number System Acuity and Comparative Effects between Adults and Children. Front. Psychol. 2013, 4, 444. [Google Scholar] [CrossRef] [PubMed]
- Gebuis, T.; Cohen Kadosh, R.; Gevers, W. Sensory-Integration System Rather than Approximate Number System Underlies Numerosity Processing: A Critical Review. Acta Psychol. 2016, 171, 17–35. [Google Scholar] [CrossRef] [PubMed]
- Leibovich, T.; Katzin, N.; Harel, M.; Henik, A. From “Sense of Number” to “Sense of Magnitude”: The Role of Continuous Magnitudes in Numerical Cognition. Behav. Brain Sci. 2017, 40, e164. [Google Scholar] [CrossRef] [PubMed]
- Gilmore, C.; Attridge, N.; Clayton, S.; Cragg, L.; Johnson, S.; Marlow, N.; Simms, V.; Inglis, M. Individual Differences in Inhibitory Control, Not Non-Verbal Number Acuity, Correlate with Mathematics Achievement. PLoS ONE 2013, 8, e67374. [Google Scholar] [CrossRef] [PubMed]
- Clayton, S.; Gilmore, C. Inhibition in Dot Comparison Tasks. ZDM Math. Educ. 2015, 47, 759–770. [Google Scholar] [CrossRef]
- Shilat, Y.; Salti, M.; Henik, A. Shaping the Way from the Unknown to the Known: The Role of Convex Hull Shape in Numerical Comparisons. Cognition 2021, 217, 104893. [Google Scholar] [CrossRef]
- Gilmore, C.; Cragg, L.; Hogan, G.; Inglis, M. Congruency Effects in Dot Comparison Tasks: Convex Hull Is More Important than Dot Area. J. Cogn. Psychol. 2016, 28, 923–931. [Google Scholar] [CrossRef]
- Salti, M.; Katzin, N.; Katzin, D.; Leibovich, T.; Henik, A. One Tamed at a Time: A New Approach for Controlling Continuous Magnitudes in Numerical Comparison Tasks. Behav. Res. 2017, 49, 1120–1127. [Google Scholar] [CrossRef]
- Kuzmina, Y.; Malykh, S. The Effect of Visual Parameters on Nonsymbolic Numerosity Estimation Varies Depending on the Format of Stimulus Presentation. J. Exp. Child Psychol. 2022, 224, 105514. [Google Scholar] [CrossRef]
- Kuzmina, Y.; Antipkina, I. The Association between Approximate Number Sense (ANS) and Math Achievement Depends on the Format of the ANS Test. J. Cogn. Dev. 2022, 23, 545–570. [Google Scholar] [CrossRef]
- Leibovich-Raveh, T.; Stein, I.; Henik, A.; Salti, M. Number and Continuous Magnitude Processing Depends on Task Goals and Numerosity Ratio. J. Cogn. 2018, 1, 19. [Google Scholar] [CrossRef] [PubMed]
- Brauer, M.; Curtin, J.J. Linear Mixed-Effects Models and the Analysis of Nonindependent Data: A Unified Framework to Analyze Categorical and Continuous Independent Variables That Vary within-Subjects and/or within-Items. Psychol. Methods 2018, 23, 389–411. [Google Scholar] [CrossRef] [PubMed]
- Stata Corporation. Stata User’s Guide; Stata Press: College Station, TX, USA, 2003; Volume 9, ISBN 1-881228-74-6. [Google Scholar]
- Burr, D.; Ross, J. A Visual Sense of Number. Curr. Biol. 2008, 18, 425–428. [Google Scholar] [CrossRef] [PubMed]
- Kang, I.; Ratcliff, R. Modeling the Interaction of Numerosity and Perceptual Variables with the Diffusion Model. Cogn. Psychol. 2020, 120, 101288. [Google Scholar] [CrossRef]
- Leibovich, T.; Henik, A. Comparing Performance in Discrete and Continuous Comparison Tasks. Q. J. Exp. Psychol. 2014, 67, 899–917. [Google Scholar] [CrossRef]
- Duthoo, W.; Abrahamse, E.L.; Braem, S.; Boehler, C.N.; Notebaert, W. The Congruency Sequence Effect 3.0: A Critical Test of Conflict Adaptation. PLoS ONE 2014, 9, e110462. [Google Scholar] [CrossRef]
- Viarouge, A.; Lee, H.; Borst, G. Attention to Number Requires Magnitude-Specific Inhibition. Cognition 2023, 230, 105285. [Google Scholar] [CrossRef]
- Pekár, J.; Kinder, A. The Interplay between Non-Symbolic Number and Its Continuous Visual Properties Revisited: Effects of Mixing Trials of Different Types. Q. J. Exp. Psychol. 2020, 73, 698–710. [Google Scholar] [CrossRef]


| Condition | Figures | Format | Numerical Proportion | Congruency | Number of Figures (Red:Green) |
|---|---|---|---|---|---|
| 1 | Circles | Separated | Small | Congruent | 9:18; 9:19; 16:8; 19:10 |
| 2 | Circles | Separated | Small | Incongruent | 9:18; 9:19; 16:8; 19:10 |
| 3 | Circles and triangles | Intermixed | Small | Congruent | 9:18; 9:19; 16:8; 19:10 |
| 4 | Circles and triangles | Intermixed | Small | Incongruent | 9:18; 9:19; 16:8; 19:10 |
| 5 | Circles | Separated | Large | Congruent | 9:12; 13:18; 13:10; 16:12 |
| 6 | Circles | Separated | Large | Incongruent | 9:12; 13:18; 13:10; 16:12 |
| 7 | Circles and triangles | Intermixed | Large | Congruent | 9:12; 13:18; 13:10; 16:12 |
| 8 | Circles and triangles | Intermixed | Large | Incongruent | 9:12; 13:18; 13:10; 16:12 |
| Conditions | Mean | SD | 95% CI | Range |
|---|---|---|---|---|
| Whole test | 0.83 | 0.09 | 0.82; 0.84 | 0.51–0.98 |
| Small proportion | 0.91 | 0.10 | 0.90; 0.92 | 0.52–1.00 |
| Large proportion | 0.74 | 0.09 | 0.73; 0.75 | 0.43–0.95 |
| Intermixed format | 0.83 | 0.09 | 0.82; 0.84 | 0.47–0.98 |
| Separated format | 0.83 | 0.09 | 0.82; 0.84 | 0.50–0.98 |
| Congruent | 0.87 | 0.09 | 0.86; 0.88 | 0.50–0.98 |
| Incongruent | 0.79 | 0.10 | 0.78; 0.80 | 0.41–0.99 |
| Numerical Proportion | Separate Format | Intermixed Format | ||
|---|---|---|---|---|
| Congruent | Incongruent | Congruent | Incongruent | |
| Small | 0.92 (0.01) | 0.88 (0.01) | 0.92 (0.01) | 0.92 (0.01) |
| Large | 0.84 (0.01) | 0.61 (0.01) | 0.75 (0.01) | 0.76 (0.01) |
| Both | 0.89 (0.01) | 0.74 (0.01) | 0.83 (0.01) | 0.83 (0.01) |
| Variables | Baseline Model | Model 1 | Model 2 | Model 3 |
|---|---|---|---|---|
| B (s.e.) | B (s.e.) | B (s.e.) | B (s.e.) | |
| Fixed effects | ||||
| Intercept | 1.72 *** (0.04) | 2.62 *** (0.04) | 2.70 *** (0.05) | 2.59 *** (0.05) |
| Intermix.format | 0.18 *** (0.02) | −0.31 *** (0.04) | −0.01 (0.05) | |
| Incongruent | −0.51 *** (0.02) | −0.70 *** (0.04) | −0.45 *** (0.05) | |
| Large prop. | −1.32 *** (0.02) | −1.02 *** (0.04) | −0.80 *** (0.05) | |
| Interactions | ||||
| Format*Incongr. | 1.02 *** (0.05) | 0.37 *** (0.08) | ||
| Format*Propor. | −0.10 (0.05) | −0.60 *** (0.07) | ||
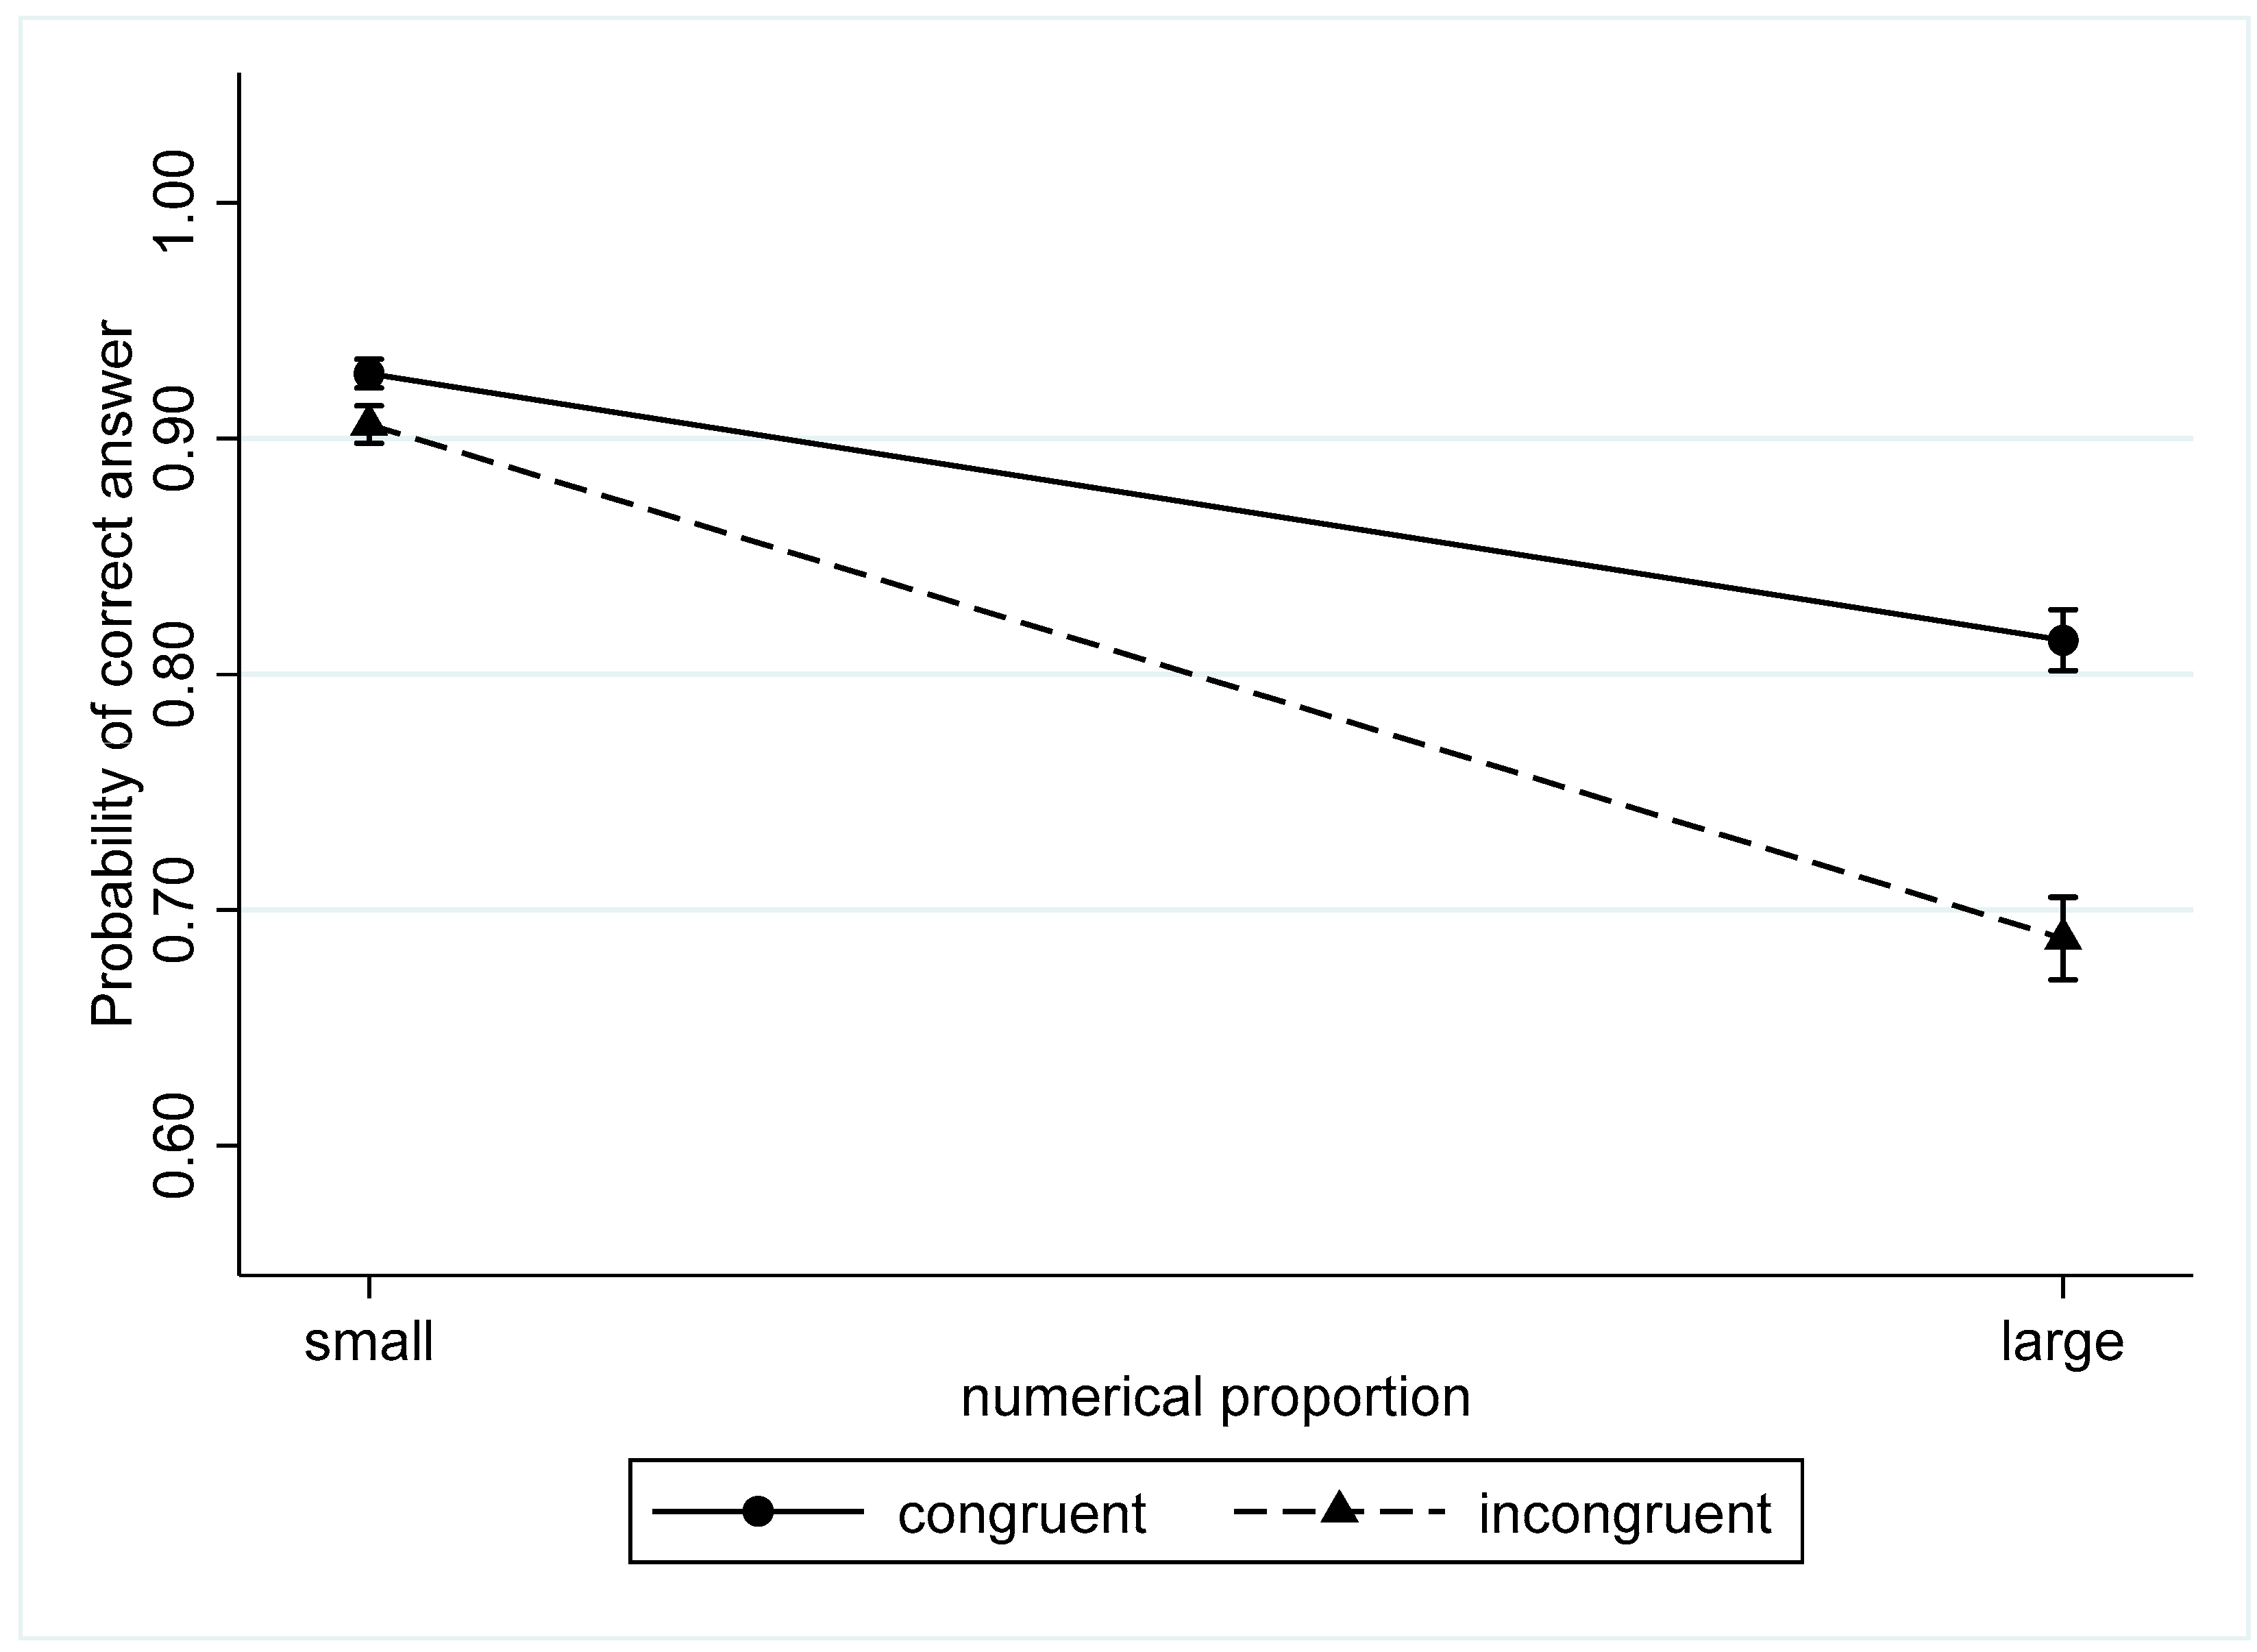
| Propor.*Incongr. | −0.44 *** (0.05) | −0.88 *** (0.07) | ||
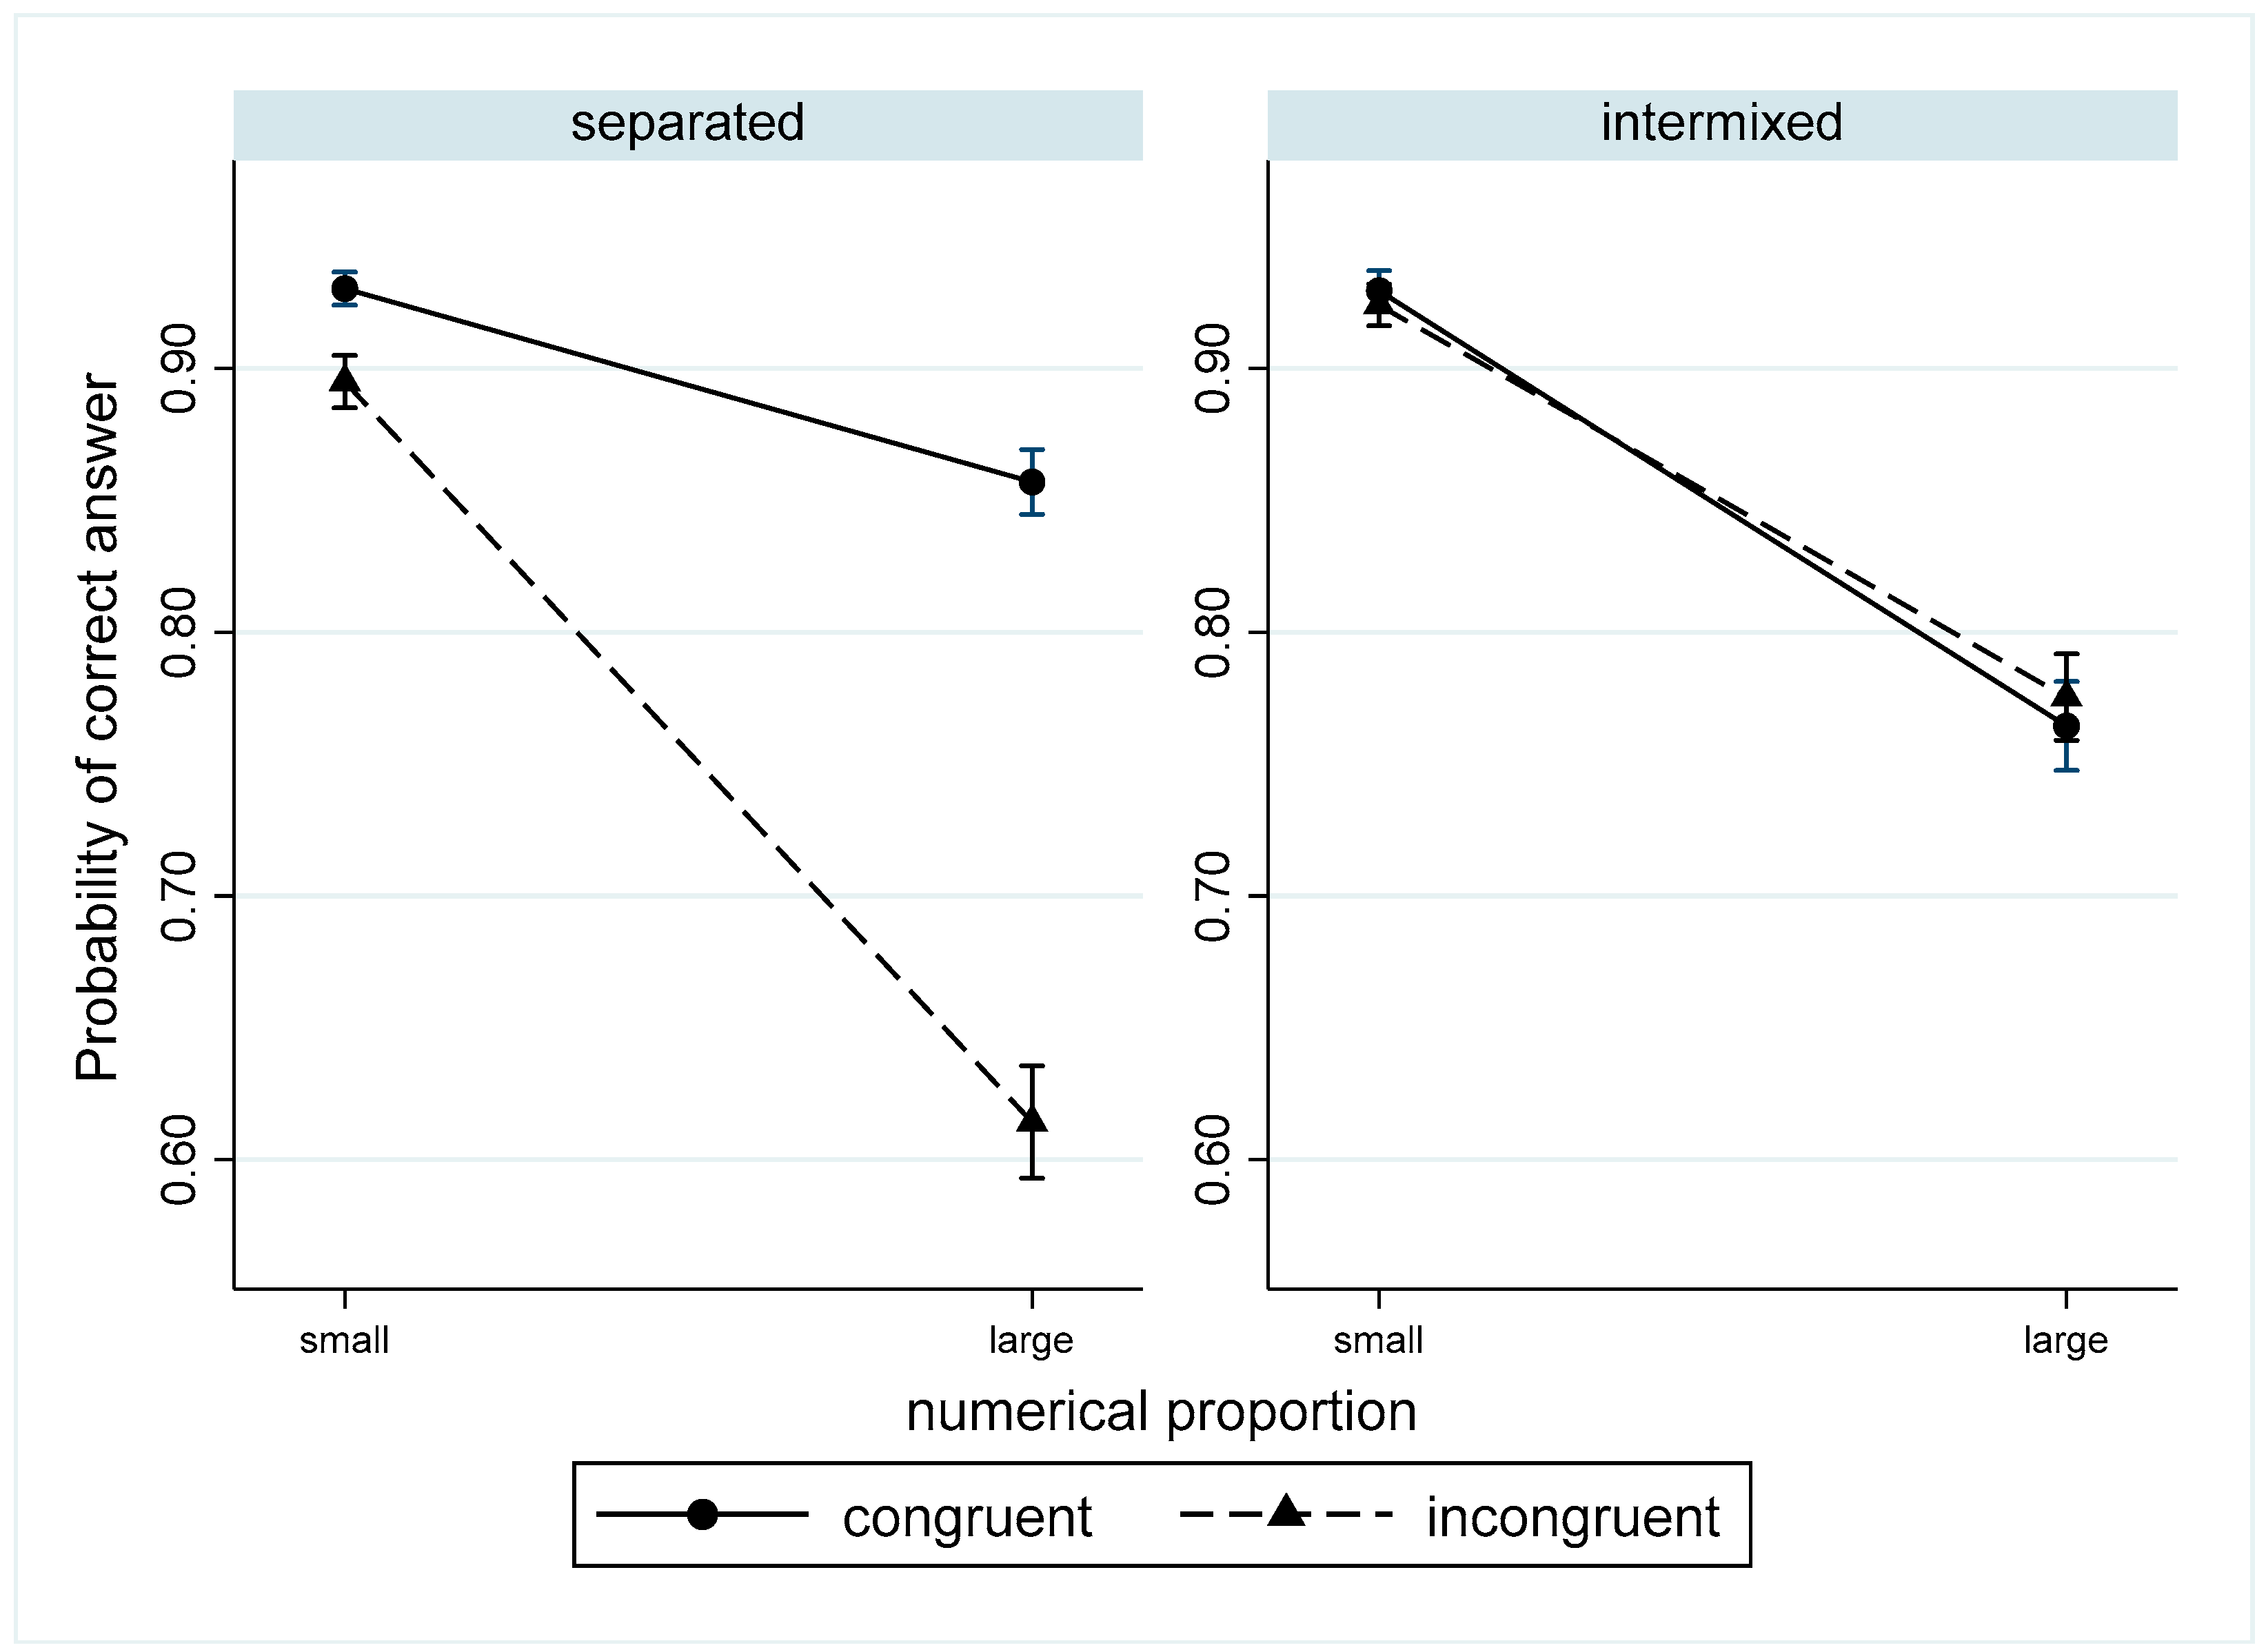
| Propor.*Incongr.*Format | 1.02 *** (0.10) | |||
| Random effects | ||||
| Between-individual variance | 0.34 | 0.40 | 0.41 | 0.42 |
| Log-likelihood | −27,068.55 | −25,074.56 | −24,812.72 | −24,759.24 |
| LR test (df) | 3987.98 *** (3) | 523.70 *** (3) | 106.95 *** (1) | |
| ICC | 0.09 | |||
| Effects | Separated Format | Intermixed Format |
|---|---|---|
| B (Log Odds) (s.e.) | B (Log Odds) (s.e.) | |
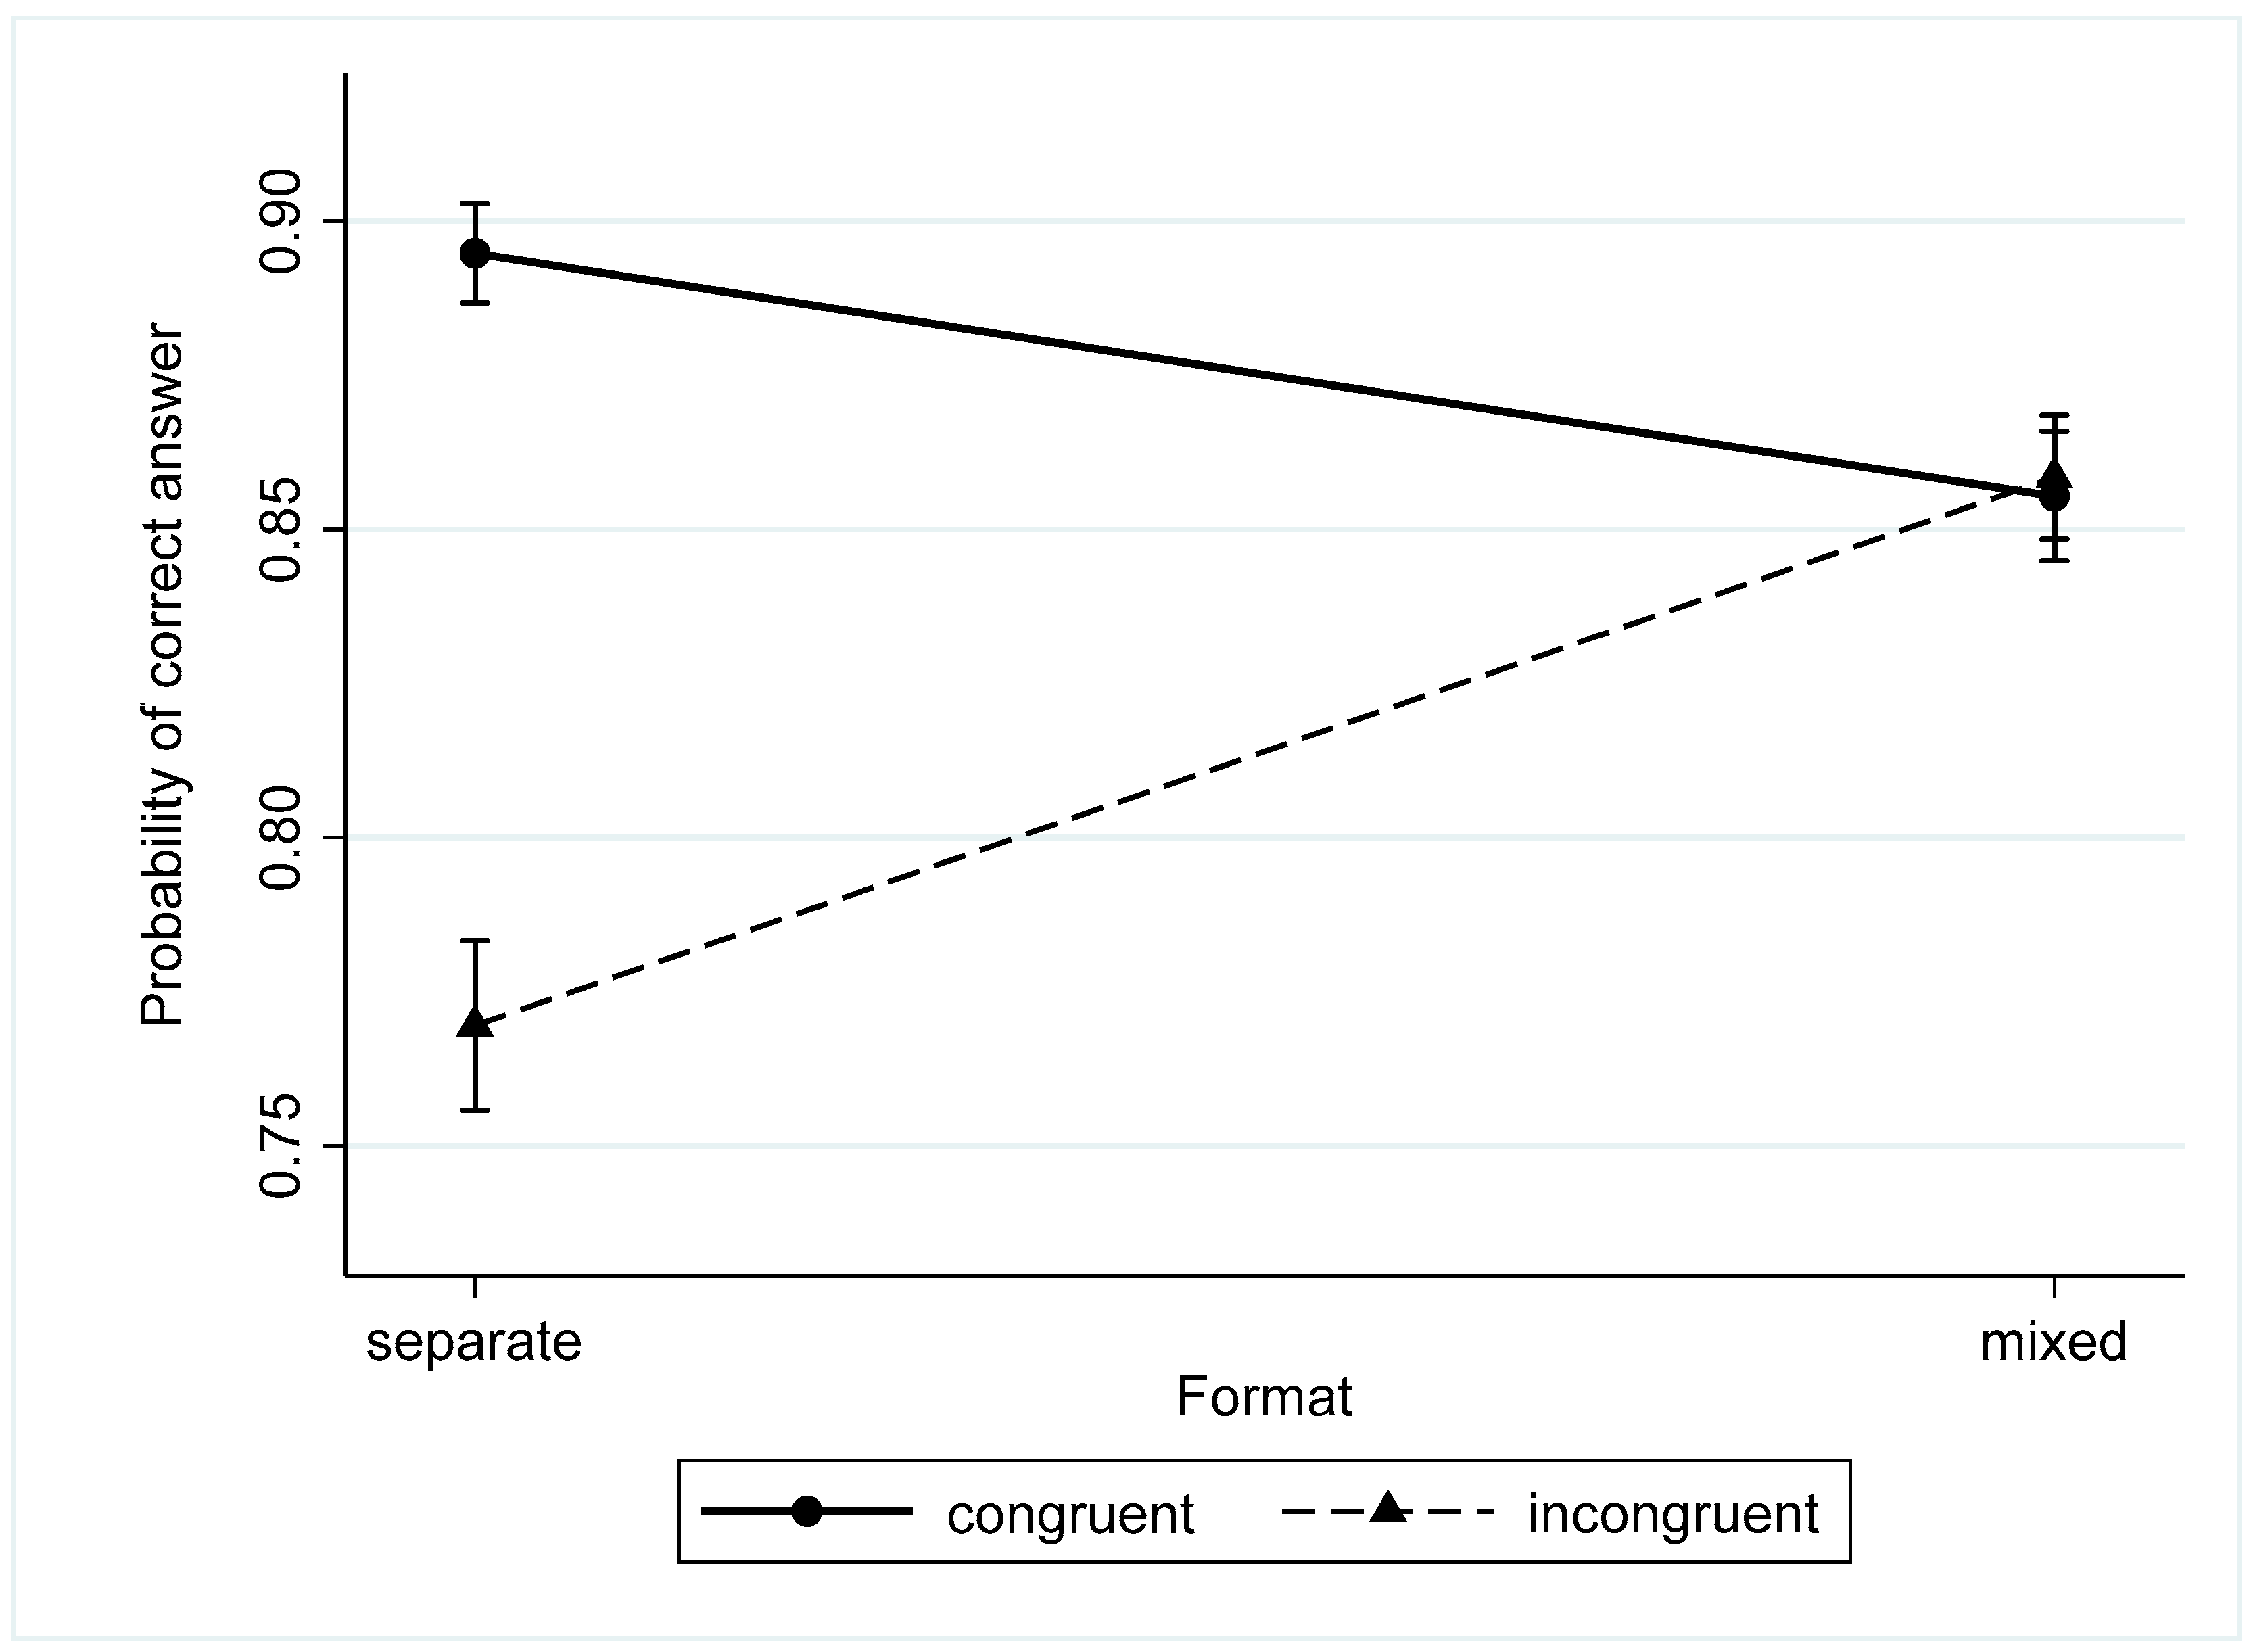
| The congruency effect | −0.90 *** (0.03) | 0.13 *** (0.04) |
| Numerical ratio effect | −1.22 *** (0.03) | −1.32 *** (0.04) |
| Conditions | Small Proportion | Large Proportion |
|---|---|---|
| B (Log Odds) (s.e.) | B (Log Odds) (s.e.) | |
| Intermixed format | −0.08 (0.06) | 0.06 (0.04) |
| Separated format | −0.45 *** (0.05) | −1.33 *** (0.04) |
| Conditions | Congruent Trials | Incongruent Trials |
|---|---|---|
| B (s.e.) | B (s.e.) | |
| Intermixed format | −1.40 *** (0.05) | −1.26 *** (0.05) |
| Separated format | −0.80 *** (0.05) | −1.68 *** (0.05) |
Disclaimer/Publisher’s Note: The statements, opinions and data contained in all publications are solely those of the individual author(s) and contributor(s) and not of MDPI and/or the editor(s). MDPI and/or the editor(s) disclaim responsibility for any injury to people or property resulting from any ideas, methods, instructions or products referred to in the content. |
© 2023 by the authors. Licensee MDPI, Basel, Switzerland. This article is an open access article distributed under the terms and conditions of the Creative Commons Attribution (CC BY) license (https://creativecommons.org/licenses/by/4.0/).
Share and Cite
Kuzmina, Y.; Marakshina, J.; Lobaskova, M.; Zakharov, I.; Tikhomirova, T.; Malykh, S. The Interaction between Congruency and Numerical Ratio Effects in the Nonsymbolic Comparison Test. Behav. Sci. 2023, 13, 983. https://doi.org/10.3390/bs13120983
Kuzmina Y, Marakshina J, Lobaskova M, Zakharov I, Tikhomirova T, Malykh S. The Interaction between Congruency and Numerical Ratio Effects in the Nonsymbolic Comparison Test. Behavioral Sciences. 2023; 13(12):983. https://doi.org/10.3390/bs13120983
Chicago/Turabian StyleKuzmina, Yulia, Julia Marakshina, Marina Lobaskova, Ilya Zakharov, Tatiana Tikhomirova, and Sergey Malykh. 2023. "The Interaction between Congruency and Numerical Ratio Effects in the Nonsymbolic Comparison Test" Behavioral Sciences 13, no. 12: 983. https://doi.org/10.3390/bs13120983