Article

Random Forest Classification of Alcohol Use Disorder Using fMRI Functional Connectivity, Neuropsychological Functioning, and Impulsivity Measures

1
Henri Begleiter Neurodynamics Lab, Department of Psychiatry, SUNY Downstate Health Sciences University, Brooklyn, NY 11203, USA
2
Center for Biomedical Imaging and Neuromodulation, Nathan S. Kline Institute for Psychiatric Research, Orangeburg, NY 10962, USA
3
Department of Psychiatry, NYU School of Medicine, New York, NY 10016, USA
*
Author to whom correspondence should be addressed.
These authors contributed equally to this work.
Brain Sci. 2020, 10(2), 115; https://doi.org/10.3390/brainsci10020115
Submission received: 7 January 2020 / Revised: 12 February 2020 / Accepted: 18 February 2020 / Published: 20 February 2020
(This article belongs to the Special Issue Recent Advances in Human Brain Connectivity)

Abstract

:
Individuals with alcohol use disorder (AUD) are known to manifest a variety of neurocognitive impairments that can be attributed to alterations in specific brain networks. The current study aims to identify specific features of brain connectivity, neuropsychological performance, and impulsivity traits that can classify adult males with AUD (n = 30) from healthy controls (CTL, n = 30) using the Random Forest (RF) classification method. The predictor variables were: (i) fMRI-based within-network functional connectivity (FC) of the Default Mode Network (DMN), (ii) neuropsychological scores from the Tower of London Test (TOLT), and the Visual Span Test (VST), and (iii) impulsivity factors from the Barratt Impulsiveness Scale (BIS). The RF model, with a classification accuracy of 76.67%, identified fourteen DMN connections, two neuropsychological variables (memory span and total correct scores of the forward condition of the VST), and all impulsivity factors as significantly important for classifying participants into either the AUD or CTL group. Specifically, the AUD group manifested hyperconnectivity across the bilateral anterior cingulate cortex and the prefrontal cortex as well as between the bilateral posterior cingulate cortex and the left inferior parietal lobule, while showing hypoconnectivity in long-range anterior–posterior and interhemispheric long-range connections. Individuals with AUD also showed poorer memory performance and increased impulsivity compared to CTL individuals. Furthermore, there were significant associations among FC, impulsivity, neuropsychological performance, and AUD status. These results confirm the previous findings that alterations in specific brain networks coupled with poor neuropsychological functioning and heightened impulsivity may characterize individuals with AUD, who can be efficiently identified using classification algorithms such as Random Forest.

1. Introduction

Alcohol use disorder (AUD) is a chronic, addictive, and relapsing disorder [1,2]. Individuals with chronic AUD manifest a variety of neurocognitive impairments [3], which may underlie both structural and functional features of the brain [4,5,6], and some of these impairments do not recover even after prolonged abstinence from drinking [7,8]. Recent studies have proposed the potential utility of resting state functional Magnetic Resonance Imaging (fMRI) connectivity as one of the neuroimaging biomarker for the quantitative clinical evaluation of AUD [9,10,11]. Therefore, it may be important to further confirm the utility of this neural measure as a potential biomarker, which can be used to improve the predictive accuracy of AUD diagnosis [11,12,13].
Recent studies are increasingly using Machine Learning (ML) approaches to predict and/or classify various neuropsychiatric disorders and outcomes [14,15,16], including AUD [11,17,18]. ML is becoming an essential part of data analytics [16], which can also handle numerous variables on a smaller sample size [19]. Random Forest (RF) is a widely used ML method to predict/classify individuals with a particular diagnosis from the unaffected controls [20]. RF uses randomly generated bootstrapped data sets that can then be used to train an ensemble of decision trees, which will determine an outcome by a majority “vote” to classify the data [21]. The main advantages of RF methods are: (i) they are non-parametric and therefore do not depend on the distribution of the data [20], they relatively have a smaller bias and less variance resulting in good generalization power [22], and (iii) they gracefully handle multi-collinearity in data, a problem that destabilizes traditional regression-based methods.
Modern neuroscience views the brain as a complex organ with multiple, specialized, and interactive networks of distributed anatomical regions that support functions most basic to higher-order cognition [23,24,25]. Evidence from fMRI, electroencephalogram, (EEG), magnetoencephalogram (MEG), and other imaging studies also support the view that neurocognitive processing arise from coordinated networks of distributed brain areas [23,26,27,28] that mediate fundamental aspects of cognitive domains, including attention, perception, memory, language, and motor processing [29,30,31]. These large-scale brain networks also underlie cognitive and affective dysfunction in psychiatric and neurological disorders [32], including addiction [33]. Therefore, in order to understand the neurocognitive mechanism of alcohol addiction, it is vital to investigate functional integrity of the networks as well as neuropsychological functioning of individuals with AUD. At the behavior level, AUD is also characterized by increased impulsivity [34,35,36] and associated brain networks [10,37,38]. Therefore, it is desirable that any predictive model of AUD using brain network features should also include representative features from neurocognitive as well as impulsivity measures.
Accumulating evidence from fMRI studies suggest that functional connectivity (FC), a measure to elicit temporal synchrony between neural signals across specific brain regions [39], is an effective method not only to study the functional organization of a healthy brain [40,41,42] but also to understand neurocognitive impairments and psychopathology [43,44]. Recent studies have also demonstrated that AUD is associated with atypical FC in resting state networks [9,10,11,45,46,47,48], thus compelling its use in ML models for predicting AUD. Among the resting state networks, the Default Mode Network (DMN) is the most studied network and has been shown to play a central role in the intrinsic network properties and neural organization during spontaneous mental processes [39]. Atypical DMN connectivity has been reported in alcohol and other substance use (see, review by Zhang and Volkow [49]), and the connectivity changes have been primarily attributed to craving and relapse in chronic abusers of drugs [49]. Aberrations in the DMN were shown to be related to impaired self-awareness, negative emotions, and to ruminations related to addiction [49].
The DMN, which is a functional network representing the ongoing mental processes during resting state, primarily involves basic neural activity underlying self-referential thought, mentation, and introspection [50], and recent studies have reported aberrant DMN connectivity in AUD [10,45,47]. In a study using fMRI FC to examine several resting state networks, including the DMN, Zhu et al. [11] reported that the RF method successfully classified AUD from control subjects both within and between networks. It is important to relate network dynamics to corresponding neuropsychological functions and behavioral outcomes, such as impulsivity, which are characteristic features in AUD [3,51,52]. For example, it is well-established that individuals with AUD manifest neuropsychological impairments in executive functioning, memory, and visuospatial processing [3,53,54,55,56], and studies have also demonstrated that AUD was associated heightened impulsivity [34,57]. Furthermore, all three domains are related among each other in the development and maintenance of alcohol addiction [58,59]. For instance, impulsivity observed in addicted individuals may result from a failure or dysfunction of the executive system and both domains may underlie distinct yet interactive brain systems [60]. Therefore, it is essential for the FC studies on AUD to include features from these domains (i.e., neuropsychological and impulsivity measures), which may have implications for diagnosis and/or preventive strategies. Therefore, the present study has been designed to perform a predictive model based on the RF classification of AUD using neural measures such as fMRI-based DMN FC together with relevant neuropsychological (i.e., executive functioning, and visual-spatial working memory) and personality (i.e., impulsivity) predictors.
In this context, the goal of the current study is to identify specific features of FC, neuropsychological, and impulsivity measures that contribute to a successful classification of AUD individuals from healthy controls using an RF algorithm. Based on findings from previous studies, we also expect that the RF method will prove highly useful to successfully extract salient features from all three domains (FC, neuropsychological, and impulsivity) to classify AUD individuals from unaffected controls. Since individuals with chronic AUD are known to have deficits in all three domains that are related among themselves and with AUD, we hypothesize that specific connections across the DMN regions, especially the prefrontal–parietal and prefrontal–hippocampal connections, along with particular subsets of neuropsychological and impulsivity features will contribute to AUD classification as revealed by the importance rankings of the RF parameters.

2. Methods

2.1. Participants

The demographic and clinical characteristics of the sample are presented in Table 1, and a detailed description is available in Pandey et al. [6]. All participants in the current study were drawn from the sample of a larger study on brain dysfunction in chronic alcoholism conducted at the SUNY Downstate Health Sciences University, Brooklyn, NY, USA. From a selected list of adult male participants who could be contacted during the MRI data collection period (n = 152), 68 individuals who had a lifetime AUD (DSM-IV alcohol dependence criteria) and 84 individuals who did not have any diagnosis of substance use disorders (SUD) were identified. Subjects from these subsets (AUD patients and non-SUD community controls) who agreed to participate and met the inclusion and exclusion criteria, including the MRI scanning protocols, were recruited for the current study until 30 subjects in each group (AUD and controls) were successfully scanned. Thus, the final sample comprised thirty male participants with AUD (mean age (SD) = 41.42 (7.31) years) and thirty unaffected male controls (mean age (SD) = 27.44 (4.74) years). The race distribution of the sample was: Black/African American = 25; White/European American = 9; Asian = 21; American Indian = 1; More than one race = 2; and Unknown = 2. Participants with AUD were recruited from alcohol treatment centers in and around New York City after they had been detoxified and were abstinent for at least 30 days prior to testing. Some of the participants from the AUD group had consumed tobacco (n = 20) and/or marijuana (n = 10) during the last 6 months (but not at least 5 days before testing). None of the participants were in withdrawal for alcohol or any other drugs (including for nicotine) at the time of testing. Individuals for the control group (CTL) were recruited through advertisements and screened to exclude any personal or family history of major medical, psychiatric, or substance-related disorders. None of the participants from the control group ever met the diagnosis of substance dependence or abuse (DSM-IV), although some of the control participants (n = 12) were light/regular drinkers and had used alcohol in the last 6 months (n = 18) (see Table 1 for details). All participants were asked to abstain from alcohol and other drugs for 5 days prior to MRI scans. A modified version of the semi-structured assessment of genetics of alcoholism (SSAGA) [61] was administered to assess alcohol/substance use and related co-existing disorders and family history of these disorders. The majority of subjects were right-handed, with only a few who were either left-handed (5 in the AUD group and 2 in the CTL group) or bi-dexterous (2 in the AUD group and 1 in the CTL group). Clinical and psychometric data were collected at the SUNY Downstate Health Sciences University, while the fMRI data were acquired at the Nathan Kline Institute (NKI) for Psychiatric Research. Standard MRI protocols and exclusion criteria (implants, tattoos, cosmetics, claustrophobia, etc.) were used to ensure subjects’ safety and the quality of data. Individuals with hearing/visual impairment, a history of head injury or moderate and severe cognitive deficits (>21) on the mini-mental state examination (MMSE) [62] were also excluded from the study. Informed consent was obtained from the participants and the research protocol was approved by the Institutional Review Boards of both centers (IRB approval ID: SUNY–266893; NKI–212263).

2.2. Neuropsychological Assessment

2.2.1. Tower of London Test (TOLT)

Computerized adaptations of the Tower of London Test (TOLT) [63] and the Visual Span Test (VST) [64,65] were administered using the Colorado assessment tests for cognitive and neuropsychological assessment [66], as described previously [6]. Planning and problem-solving ability of the executive functions were assessed using the TOLT in which participants solved a set of puzzles with graded difficulty levels by arranging the color beads one at a time from a starting position to a desired goal position in as few moves as possible. The test consisted of 3 puzzle types with 3, 4, and 5 colored beads placed on the same number of pegs, with 7 problems/trials per type and a total of 21 trials. Five performance measures from the sum total of all puzzle types were used in the analysis: (i) excess moves (additional moves beyond the minimum moves required to solve the puzzle); (ii) the average pickup time (initial thinking/planning time spent until picking up the first bead to solve the puzzle); (iii) the average total time (total thinking/planning time to solve the problem in each puzzle type); (iv) the total trial time (total performance/execution time spent on all trials within each puzzle type); and (v) the average trial time (mean performance/execution time across trials per puzzle type).

2.2.2. Visual Span Test

The VST was used to assess visuospatial memory span from the forward condition and working memory from the backward condition. In this test, 8 randomly arranged squares were displayed on the screen, and 2–8 squares flashed in a predetermined sequence depending on the span level being assessed. Each span level was administered twice, with a total of 14 trials in each condition. During the forward condition, subjects were required to repeat the sequence in the same order via mouse clicks on the squares. In the backward condition, subjects were required to repeat the sequence in reverse order (starting from the last square). Four performance measures were collected during forward and backward conditions (with a total of 8 scores): (i) the total correct trials (total number of correctly performed trials); (ii) the span (maximum sequence-length achieved); (iii) the total average time (sum of the mean time taken across all trials performed); and (iv) the total correct average time (sum of the mean time taken across all trials correctly performed).

2.3. Impulsivity Scores

Impulsivity was assessed using the Barratt Impulsiveness Scale—Version 11 (BIS-11) [67], which is a 30-item self-administered tool with excellent psychometric properties [68]. The impulsivity scores consisted of three factors: motor impulsivity (BIS_MI), non-planning (BIS_NP), and attentional impulsivity (BIS_AI), and a total score (BIS_Tot).

2.4. MRI Data Acquisition

MRI scans were acquired at the Nathan Kline Institute using a 3.0 Tesla Siemens Tim Trio scanner (Erlangen, Germany). A continuous resting-state fMRI scan was acquired for the duration of 6.11 min in both AUD and CTL participants, who were instructed to keep their eyes closed but to stay awake and not to move. A series of T2*-weighted gradient echo single-shot echo-planar imaging (EPI) volumes with the following sequence parameters was acquired: Repetition Time (TR) = 2750 ms; Echo Time (TE) = 30 ms; flip angle = 80°; voxel size = (2.5 × 2.5 × 3.5) mm3; matrix size = 96 × 96; number of slices = 34; number of volumes = 130; Field of View (FOV) = 240 mm; and Grappa acceleration factor = 3. The sequence was carefully optimized to minimize the effects of magnetic susceptibility inhomogeneities (such as distortions and signal dropouts), as well as the effects of mechanical vibrations, which elevate Nyquist ghosting levels. In addition, a magnetization-prepared rapid gradient-echo (MPRAGE) high-resolution three-dimensional T1-weighted structural image was also collected to be used as an anatomical reference for the fMRI data and for the non-linear registration of imaging data between subjects. The sequence parameters for the MPRAGE were: TR = 2500 ms; TE = 3.5 ms; Inverse Time (TI) = 1200 ms; flip angle = 8°; voxel size = 1 × 1 × 1 mm3; matrix size = 256 × 256 × 192; FOV = 256 mm; and number of averages = 1.

2.5. Image Processing

Processing of the imaging data included the following stages. Within each subject, the MPRAGE and fMRI volumes were registered using the intra-subject inter-modality linear registration module [69] of the automatic registration toolbox (ART; https://www.nitrc.org/projects/art). The brainwash program within the ART toolbox was used for skull-stripping the MPRAGE volumes. To correct for small subject motion during fMRI acquisitions, motion detection and correction was performed using the 3dvolreg module of the AFNI software package [70]. To correct for the geometric distortions of the fMRI images due to magnetic susceptibility differences in the head, particularly at brain/air interfaces, we used the non-linear registration module of the ART [71]. The skull-stripped MPRAGE images from all subjects were non-linearly registered to a study-specific population template using ART’s non-linear registration algorithm, which is one of the most accurate inter-subject registration methods available [72]. The population template was formed using an iterative method [73]. The motion corrected fMRI time-series were detrended using PCA [74]. Finally, fMRI from all subjects were normalized to a standard space using the image registration steps outlined above, which were mathematically combined into a single transformation and used in re-sampling the fMRI.

2.6. DMN Seed Regions and FC Calculations

Based on the empirical evidence from extensive rs-FC fMRI literature, the recent conceptualization of the default mode network by Andrews-Hanna et al. [75] has included voxels spanning six anatomical regions: (i) the medial prefrontal cortex (mPFC; dmPFC, rostral ACC, and parts of the anterior and ventral mPFC), (ii) the lateral frontal cortex (superior frontal cortex and inferior frontal gyrus), (iii) the medial parietal cortex (PCC and retrosplenial cortex), (iv) the medial temporal lobe (hippocampus and PHF), (v) the lateral parietal cortex (spanning angular gyrus and posterior supramarginal gyrus), and (iv) the lateral temporal cortex (LTC) (extending anteriorly to the temporal poles). The seed regions of the DMN for the current study were adapted from this theoretical review as well as from the LORETA (Low Resolution Electromagnetic Tomography) studies on EEG current sources by Imperatori et al. [76] and Thatcher et al. [77] who have reportedly derived the seeds from the work of Buckner et al. [78]. These seed regions included six anatomical locations involving both hemispheres: the posterior cingulate cortex (PCC), anterior cingulate cortex (ACC), inferior parietal cortex (IPL), PFC, LTC, and the parahippocampal gyrus (PHG) (Table 2 and Figure 1). Each seed region contained the voxels within a 10 mm radius from the peak/centroid point of the anatomical locations referenced using the eLORETA software [79]. The ROI-to-ROI connectivity [80], the most commonly used method to derive FC across brain regions [81], was computed using Pearson correlation coefficients between all unique pairs (N = 66) of BOLD time series data of the DMN seed regions listed in Table 2. The resulting correlation coefficients were Fisher Z-transformed for further statistical analyses.

2.7. Random Forest Classification Model and Parameters

Random forest classification analysis was performed using R-packages “randomForest” (https://cran.r-project.org/web/packages/randomForest), “caret” (https://cran.r-project.org/web/packages/caret), and “randomForestExplainer” (https://cran.r-project.org/web/packages/randomForestExplainer). A Random Forest classifier consists of a collection of tree-structured classifiers where each tree casts a unit vote for a class/group for each set of predictor variables [82]. A growing number of studies in computational biology are using RF because (i) it is nonparametric, interpretable, efficient, and (ii) it has high prediction accuracy for many types of data due to its unique advantages in dealing with a small sample size, high-dimensional feature space, and complex data structures [83]. The two main parameters of the random forest algorithm are the number of trees in the ensemble and the number of variables randomly selected for the splitting decision at each node. Two levels of randomness are used by the random forest to construct the ensemble of trees: first, the model trains itself using a training data for creating each tree based on bootstrap aggregating (bagging). At the second level, the algorithm randomly selects a subset of features to split at each node while growing a decision tree for group classification. In order to maximize the classification accuracy (by reducing the errors or impurity), only a single best feature (variable) among a random subset of features is selected at each internal node. This process is recursively repeated until one of the three conditions is met: (i) the tree has either reached a specified depth, (ii) the number of samples in a node becomes lower than the set threshold, and (iii) when all the samples are grouped into the same category [84]. Some of the important concepts and parameters of the Random Forest classification method are listed in Table A1 (see Appendix A).
The Random Forest classification model included 66 DMN connections, 13 neuropsychological scores, and 4 BIS scores as features, while the group status (AUD and CTL) served as the outcome variable. The training data consisted of a full sample for identifying significant features for classifying the groups. To compute prediction error and classification accuracy, we used the Out-of-Bag (OOB) error method. According to Breiman and Cutler [85], in random forests, there is no need for cross-validation or a separate test sample to get an unbiased estimate of the test sample error, which is estimated internally in the algorithm. Each decision/classification tree is constructed using a different bootstrap sample from the training data (due to random selection), and about one-third of the observations from the training data are left out during each bootstrap, called the out-of-bag sample, which will be used only to estimate the prediction accuracy of the RF model. While classification trees are grown for each bootstrap sample (which is approximately two-thirds of the training data), the OOB error rate is calculated for each classification tree being built. The aggregate of OOB scores on all ‘ntree’ trees (which is the maximum number of trees preset in the model calculation) will provide the ensemble OOB error rate. Thus, the OOB score provides a validation for the RF model. In the model used in the current study, the maximum number of trees ‘ntree’ was set at 500 (default). The optimal number of features analyzed at each node (‘Mtry’) was estimated to be 10 (using the “tuneRF” function) and was used in the classifier algorithm. The final list of variables that significantly contributed for the classification was tabulated, and 3-dimensional connectivity maps of top significant DMN connections within a brain anatomical template were created using custom Matlab scripts.

3. Results

3.1. Random Forest Classification

3.1.1. Classification Accuracy and Top (Ranked) Significant Variables

The classification accuracy was 76.67% as the RF algorithm correctly classified 23 out of 30 subjects in each group. The model identified 14 DMN connections, two neuropsychological variables (memory span and total correct scores of the forward condition of the VST), and all four impulsivity scores as significantly contributing to classifying individuals into either the AUD or CTL group (Table 3 and Figure 2 and Figure 3). Among the significant DMN connections, the AUD group showed hyperconnectivity in three DMN connections across bilateral ACC and bilateral PFC (L.ACC–L.PFC, L.ACC–R.ACC, and R.ACC–R.PFC) as well as in two connections across bilateral PCC and left IPL (L.PCC–L.IPL and R.PCC–L.IPL), while showing hypoconnectivity in rest of the connections across the anterior–posterior and interhemispheric regions (L.PCC–R.ACC, R.PCC–R.ACC, L.PCC–R.PFC, L.ACC–L.LTC, R.ACC–L.LTC, L.PFC–R.LTC, L.IPL–R.PFC, R.IPL–L.LTC, and R.PFC–R.LTC) (see Figure 4 and Table 3). AUD individuals also showed relatively poorer visuo-spatial memory performance and higher impulsivity than controls.

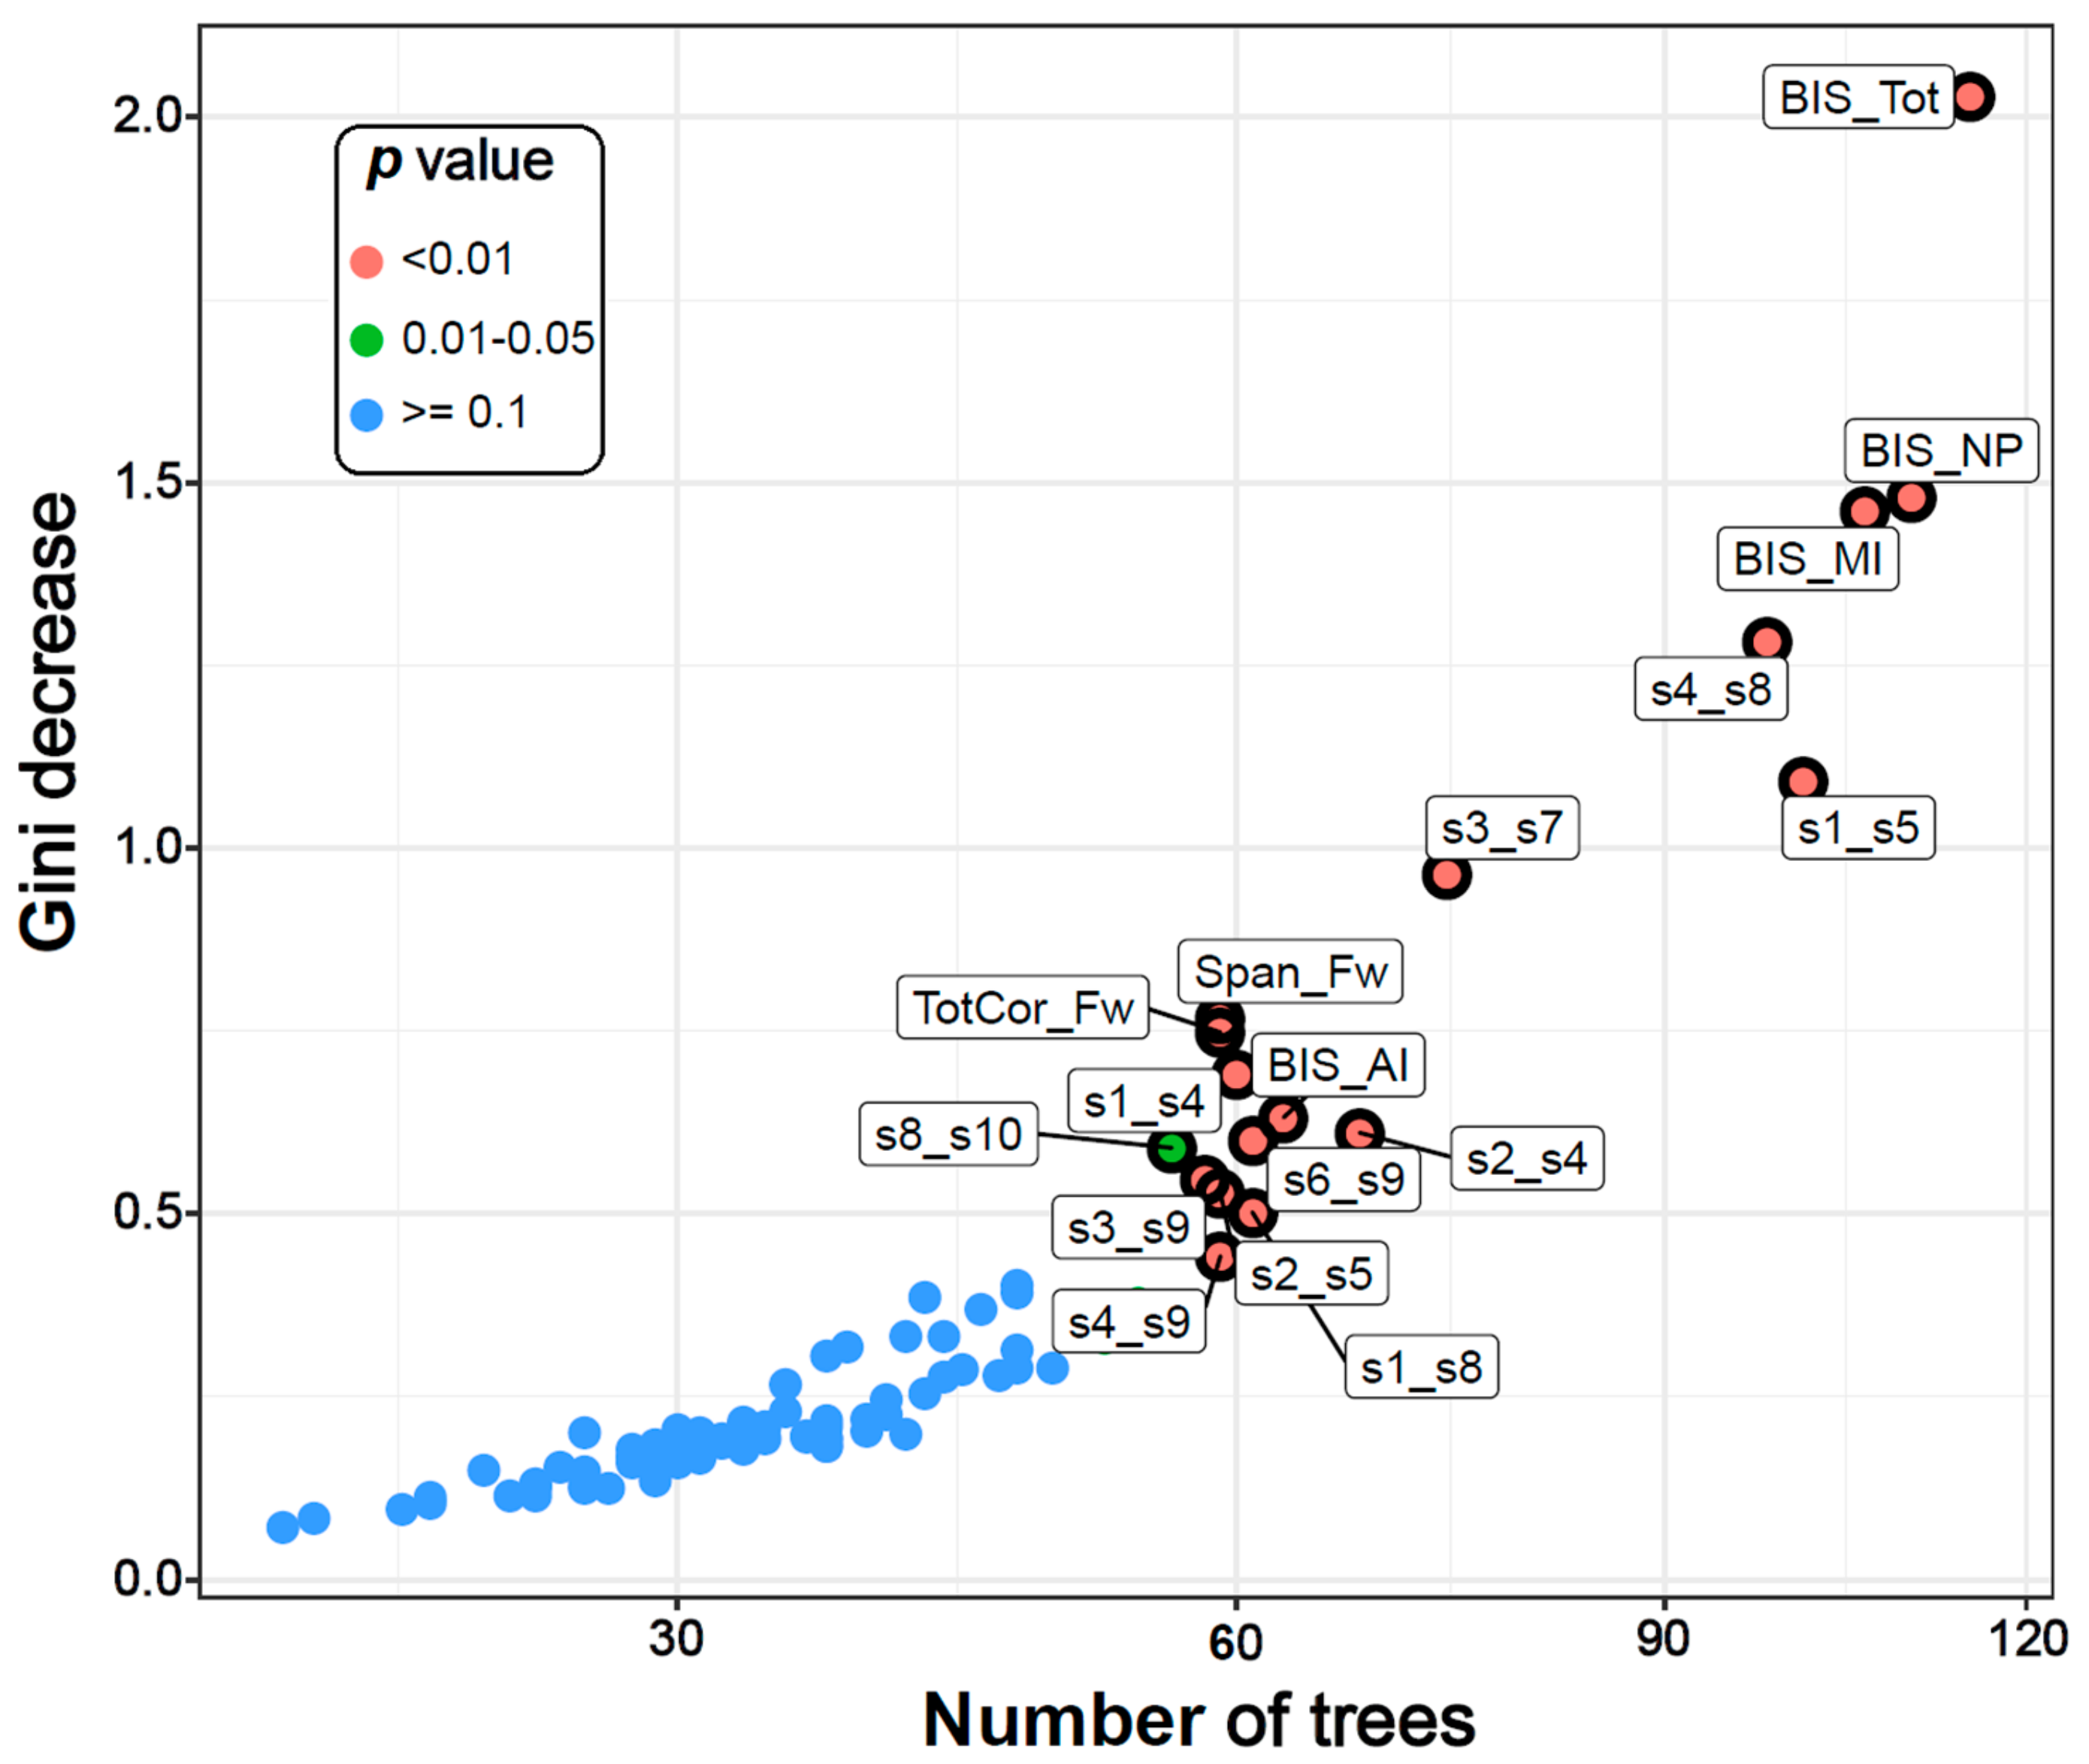
3.1.2. Multi-Way Importance Plot

The top significant variables were also shown in a multi-way importance plot based on the relationships across three RF measures of importance, viz., the Gini decrease, the number of trees, and the p-value (Figure 2). A particular variable is deemed significant if that variable is used for splitting more often than that of a random chance. As listed in Table 3, the variables that were found to be important for group classification are: 14 DMN connections, two neuropsychological variables (the memory span and total correct scores of the forward condition of the VST), and all four impulsivity (BIS) scores.

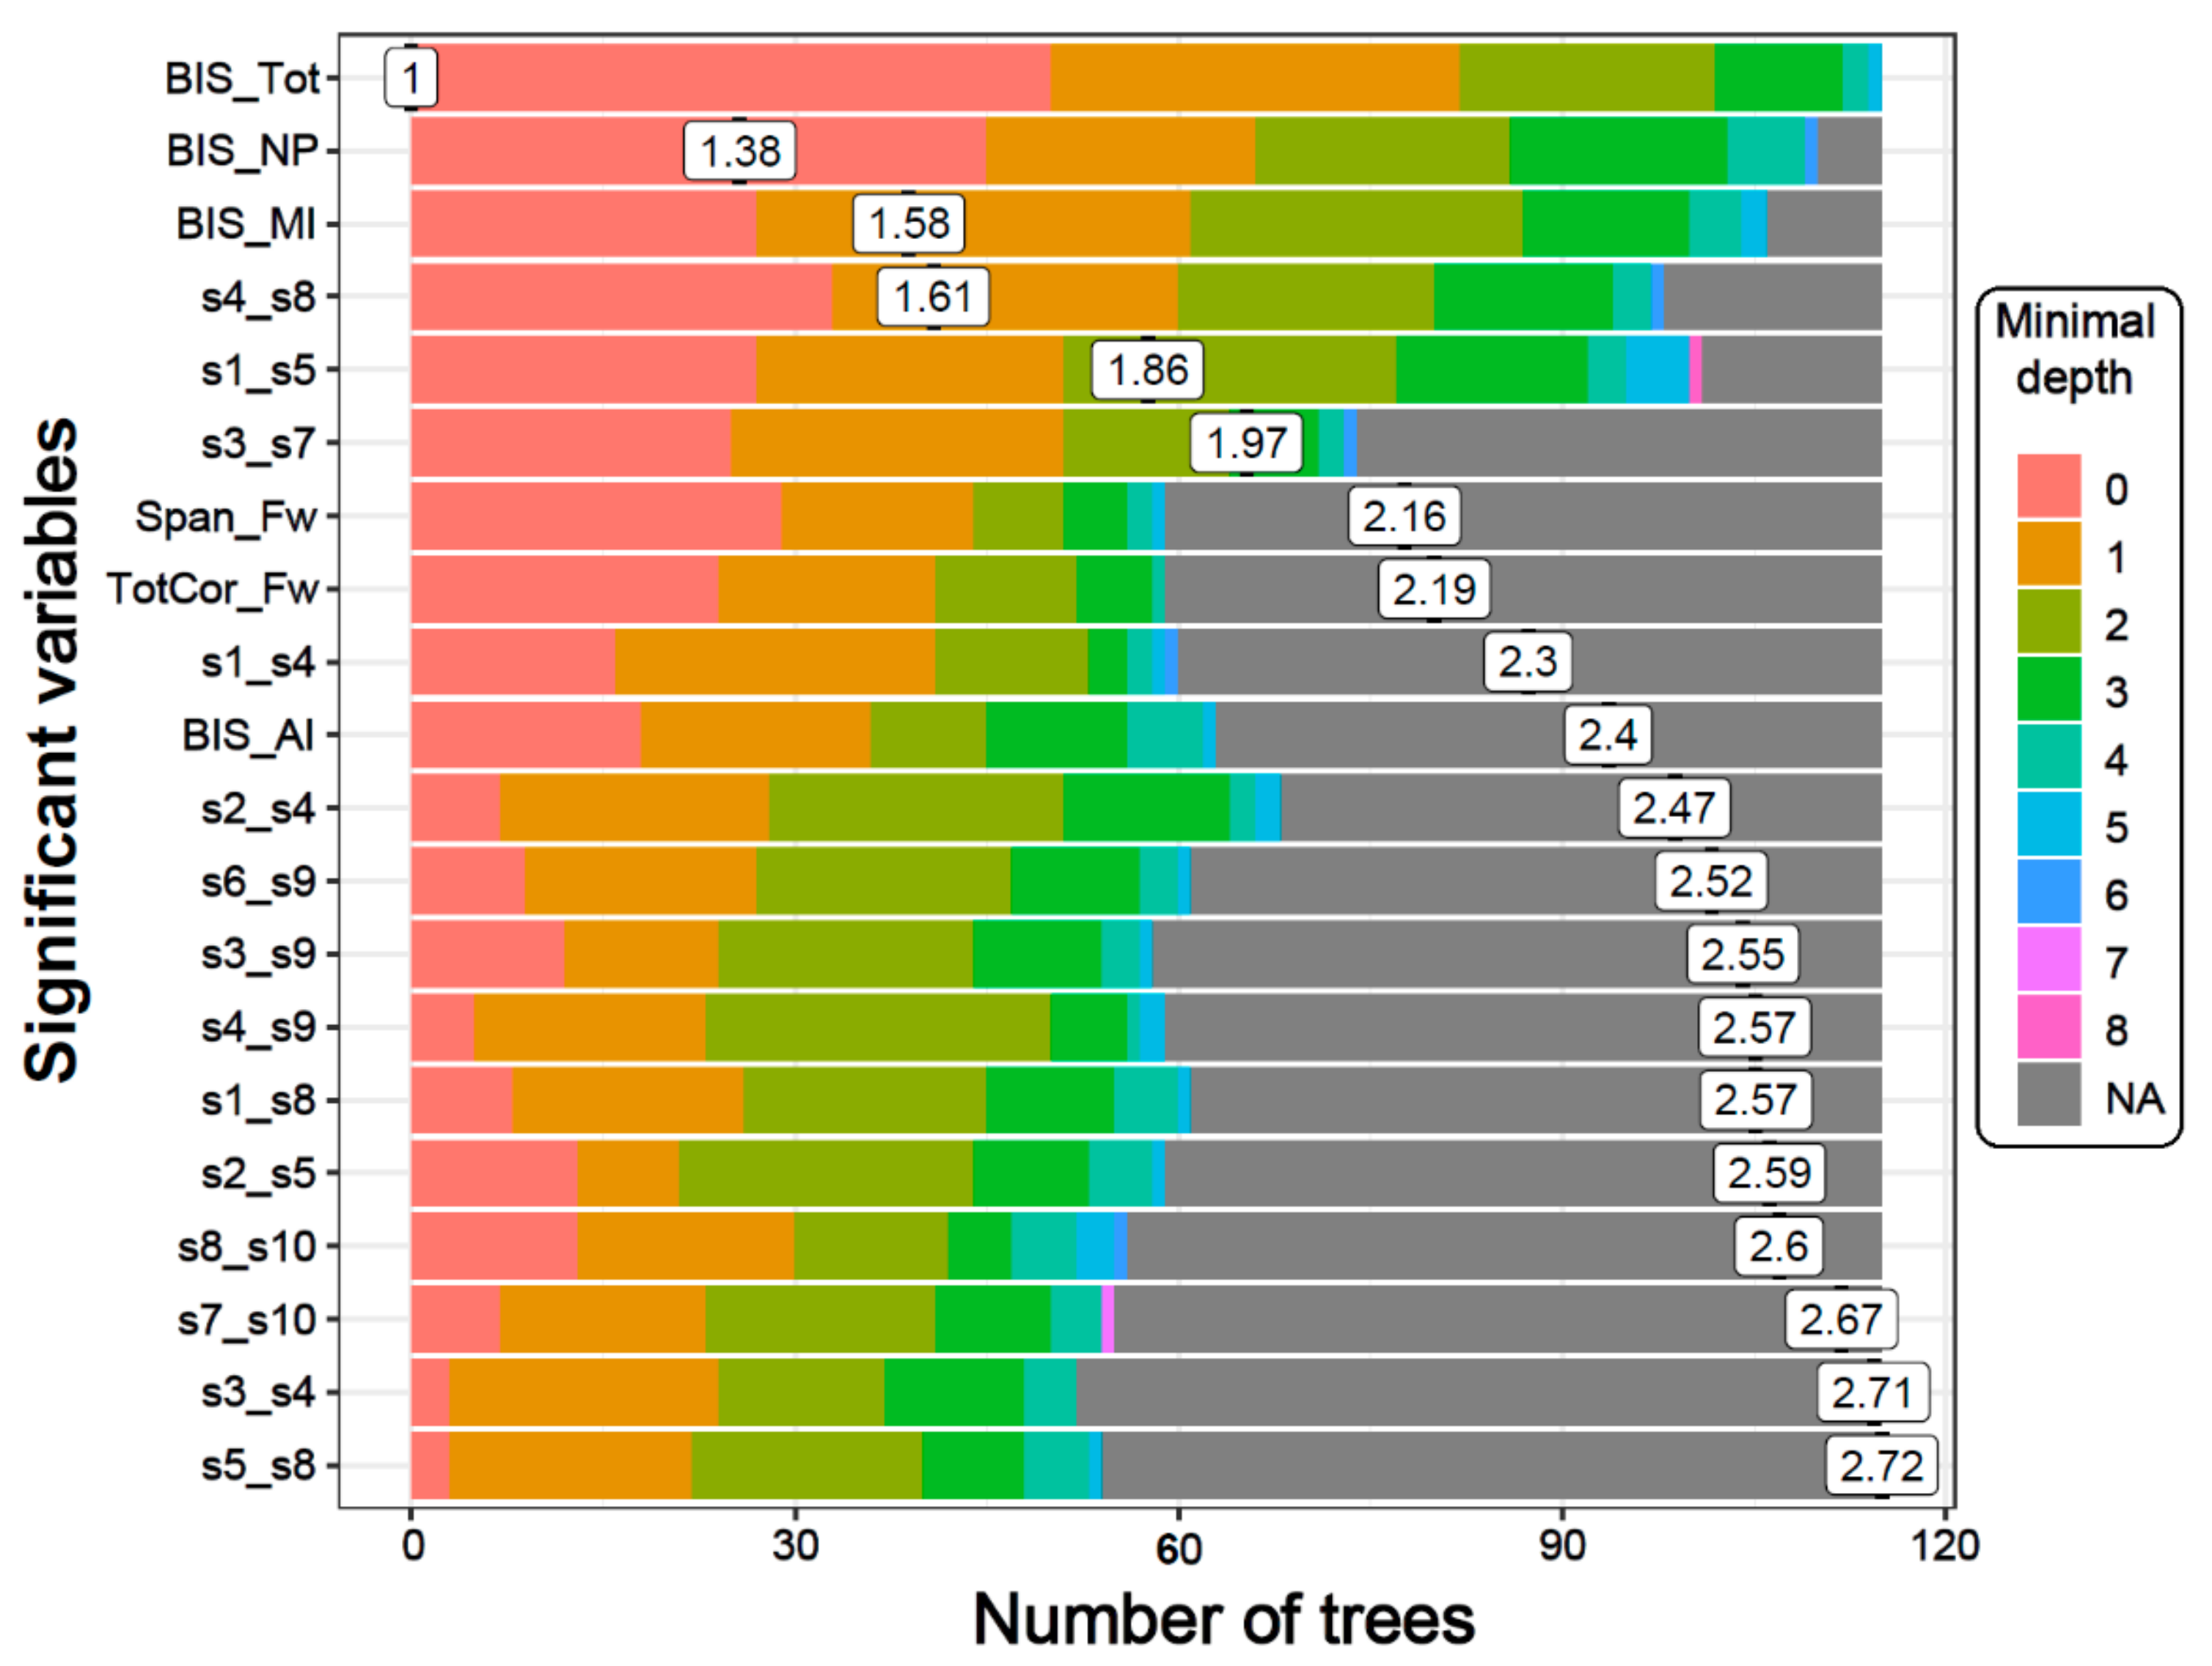
3.1.3. Distribution of Minimal Depth

The distribution of minimal depth among the trees of the forest for the top significant variables is shown in Figure 3. The minimal depth of a variable represents the depth of the node that splits on that variable and is the closest to the root of the decision tree. A lower mean minimal depth of a variable represents a higher number of observations (participants) categorized in a specific group on the basis of that variable. The order/rank of the top significant variables (14 DMN connections, two neuropsychological scores, and all four impulsivity scores) followed the same pattern in the minimal depth plot, which is based on the minimal depth and the number of trees.

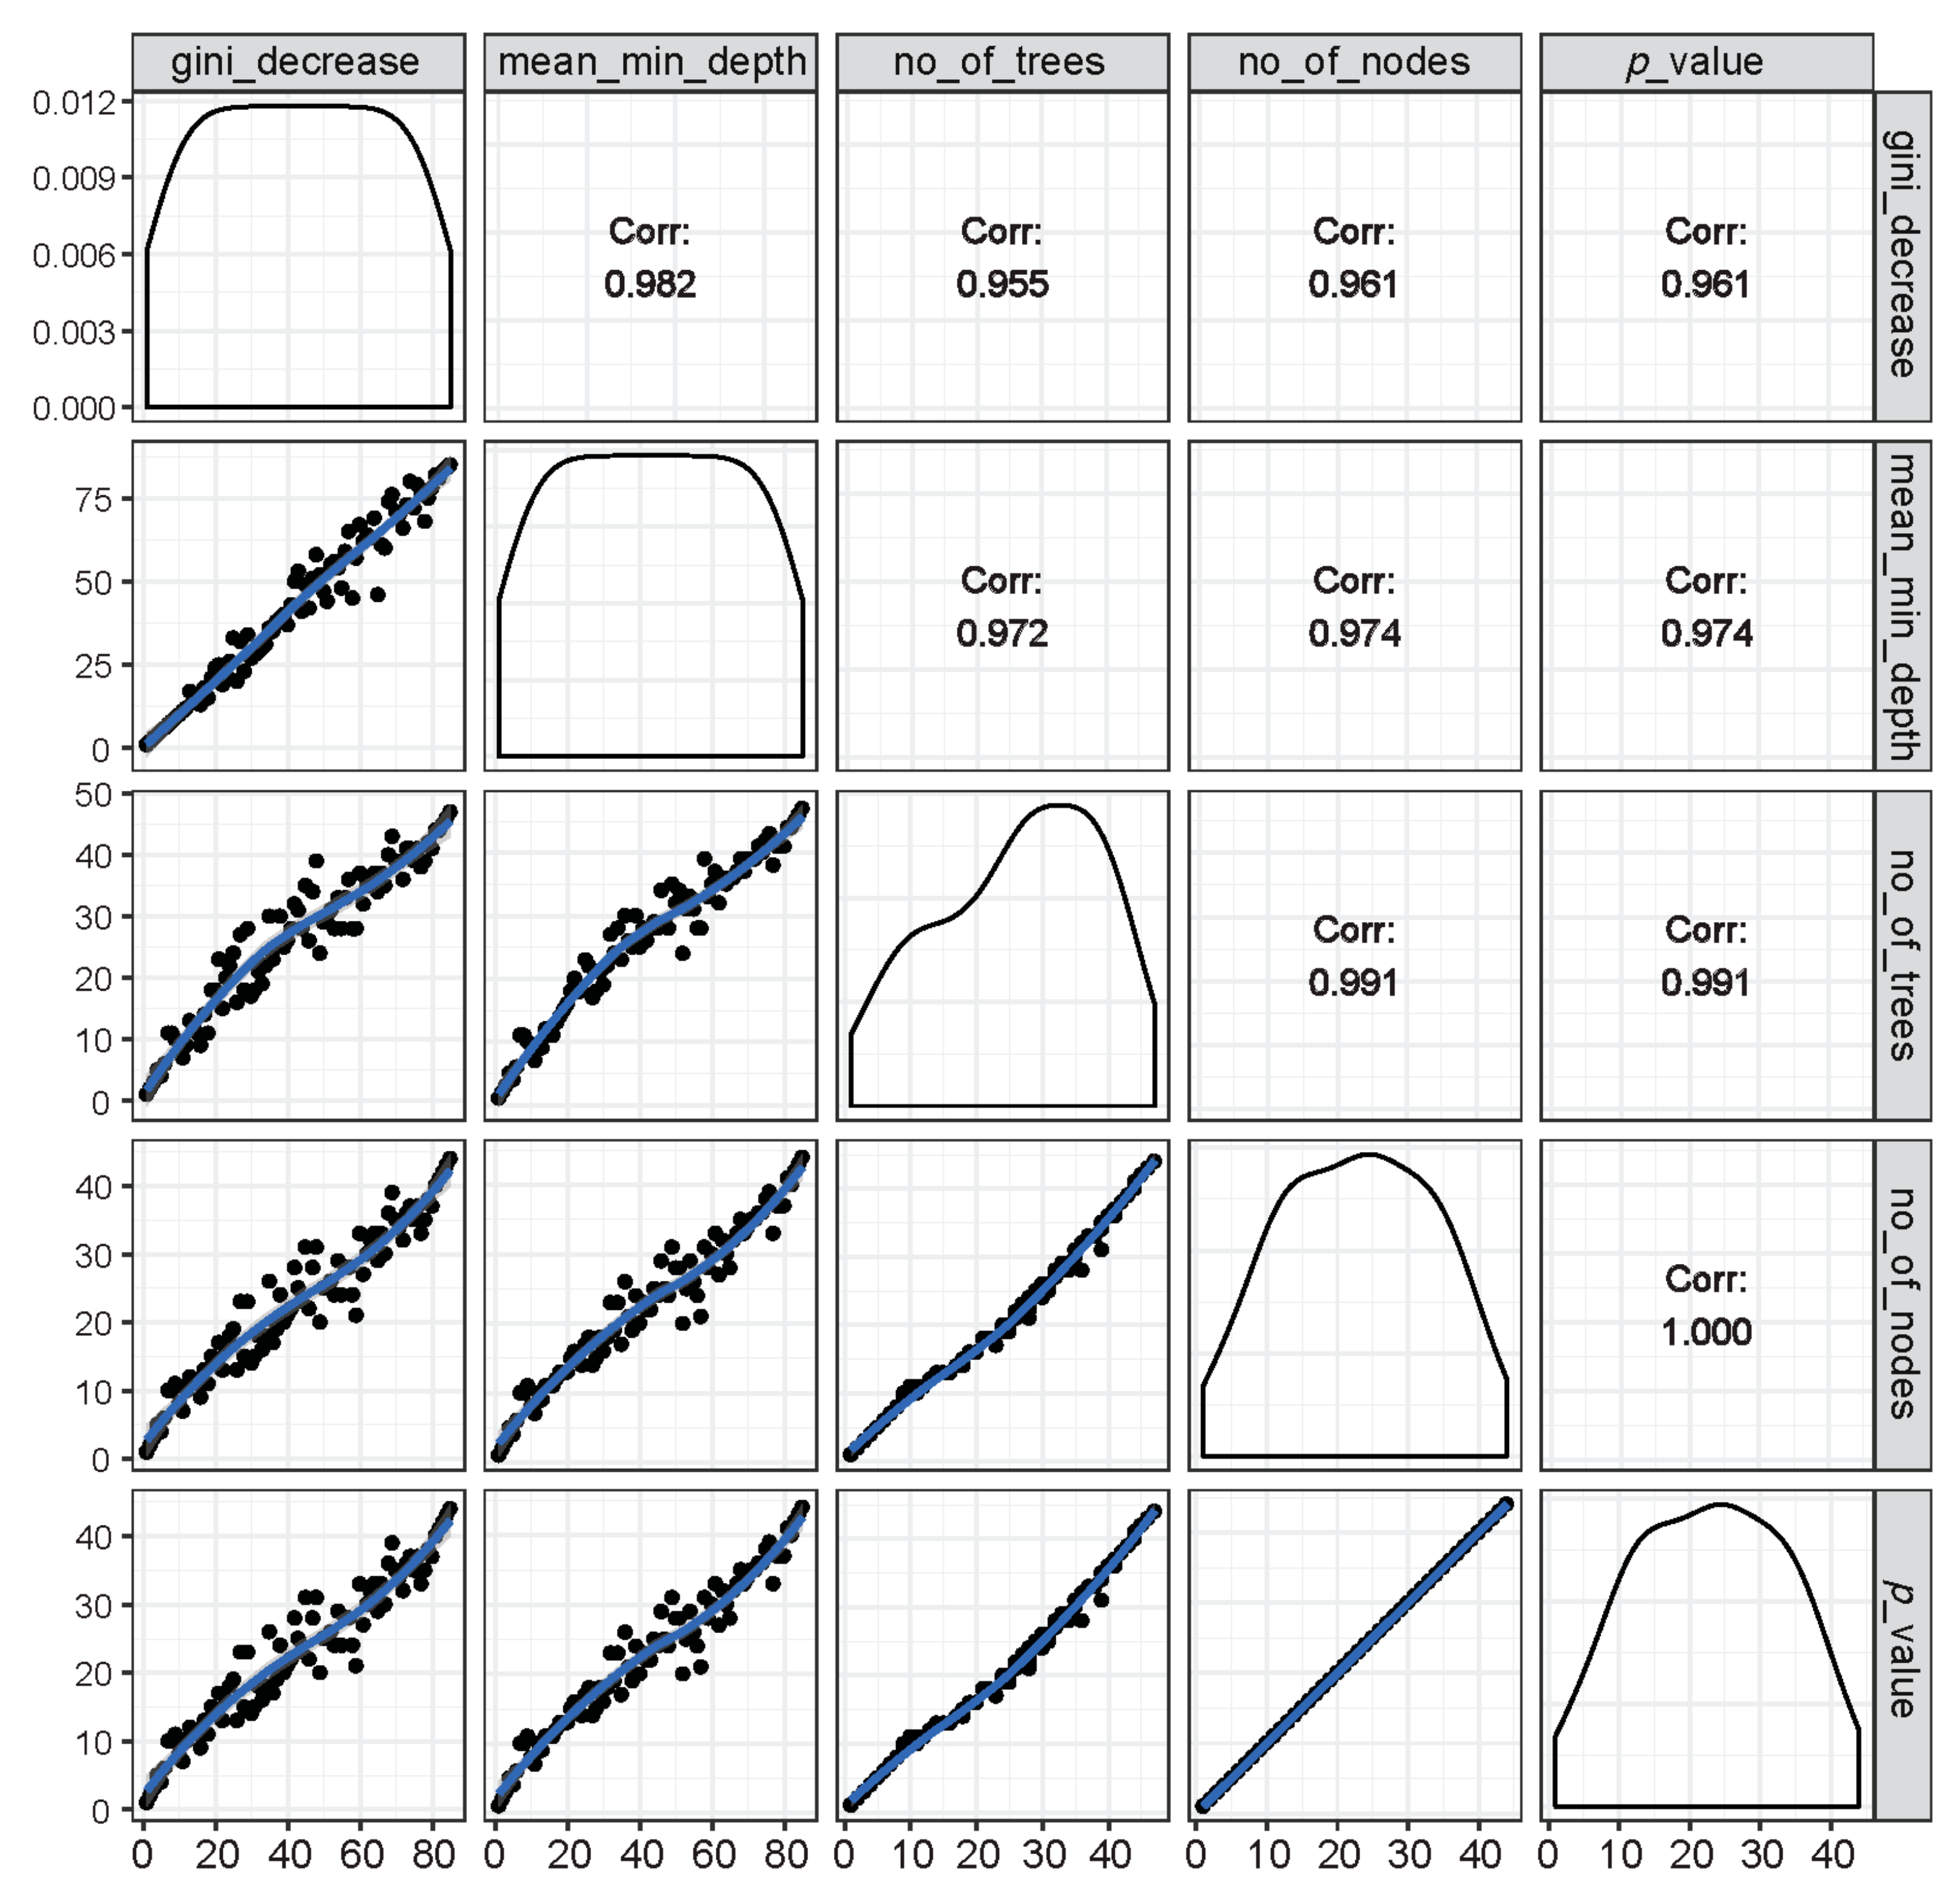
3.1.4. Relations among Rankings of Different RF Parameters

The relations among rankings of different RF parameters are shown in Figure 4. The correlations across any two parameters were very high, suggesting that the importance rankings of variables based on different RF parameters were mostly similar and that these parameters are highly reliable and consistent in the classification performance.

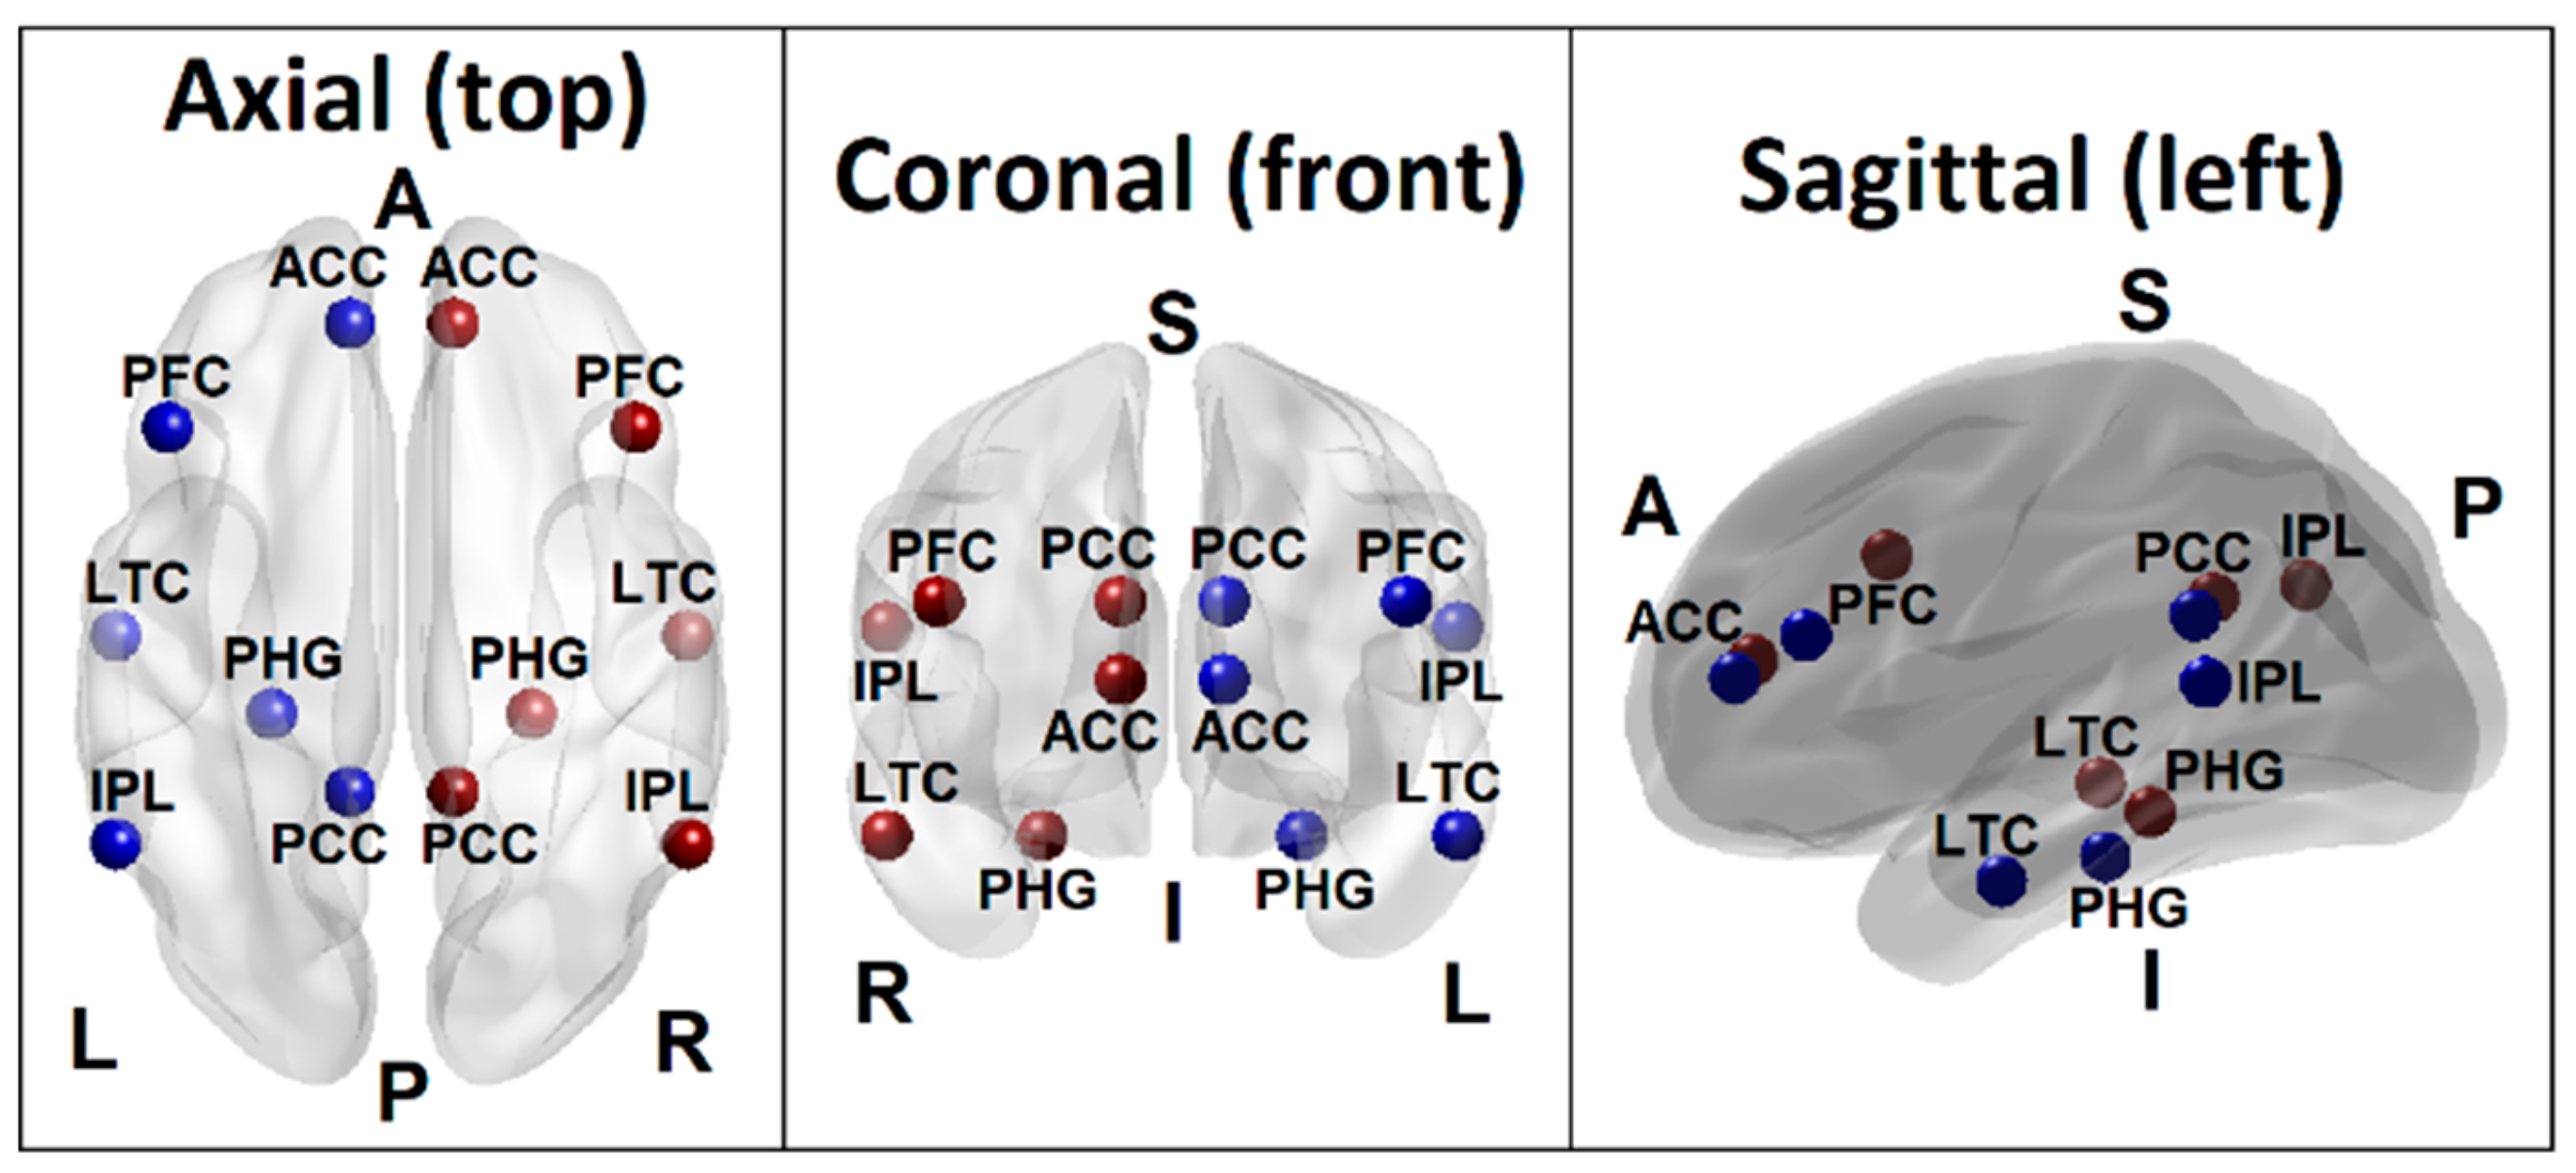
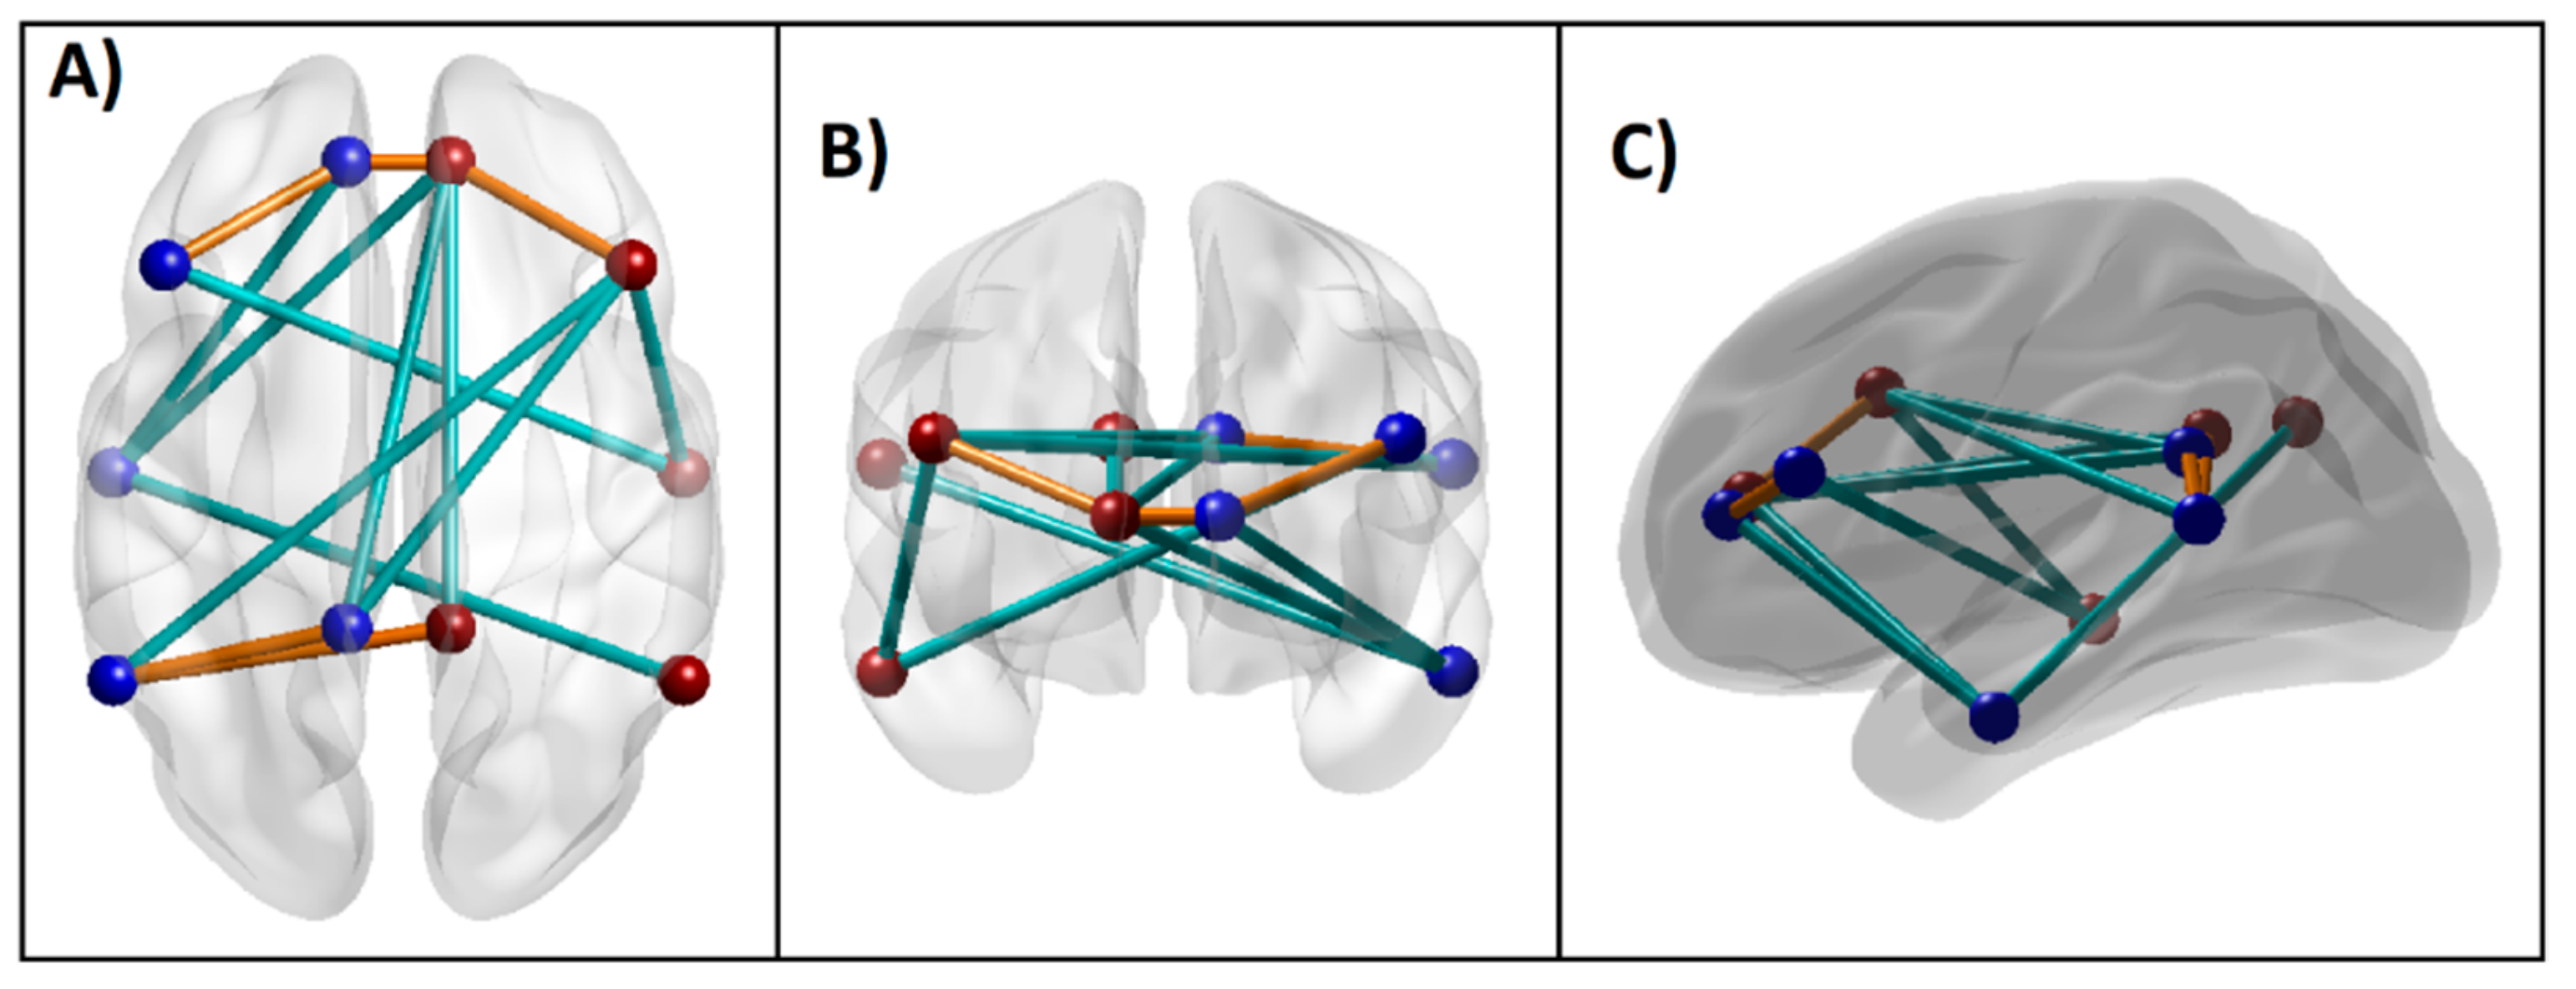
3.1.5. Connectivity Mapping of Significant DMN Connections

The 3-D brain connectivity map of significant DMN connections, which contributed to group classification, is shown in Figure 5. Compared to the CTL group, AUD individuals showed hyperconnectivity in five of the significant DMN connections (orange lines), while showing hypoconnectivity in the remaining nine connections (cyan lines). Specifically, the AUD group showed hyperconnectivity across bilateral ACC and PFC as well as between bilateral PCC and left IPL, while showing hypoconnectivity across other regions primarily involving anterior–posterior and interhemispheric long-range connections.

3.2. Correlations between Top Significant Variables and Age

Since age difference across the groups was statistically significant (p < 0.001), the association of age with significant predictor variables was evaluated within each group using the bivariate Pearson correlation as well as in the total sample using partial correlation adjusted for group effect (Table 4). Overall, age was not found to have robust effects on most of the top variables. On the other hand, age was negatively correlated (p < 0.05) with the top two neuropsychological variables (memory span and total correct scores of the forward condition of the VST) only within the AUD group, suggesting that older AUD individuals displayed poorer memory performance than younger AUD subjects. Furthermore, age was negatively correlated (p < 0.05) with the L.ACC–R.ACC connection in the CTL group while it was positively correlated (p < 0.05) with the R.IPL–L.LTC connection in the total sample.

3.3. Correlations among the Top Significant Variables

Correlations among the top significant variables are shown in Figure 6. It was found that BIS impulsivity scores had highly significant negative correlations (p < 0.01) with visual memory performance (i.e., memory span and total correct scores of the forward condition of the VST), indicating that individuals with higher impulsivity showed poorer visual memory performance. Interestingly, of the six FC variables that showed significant correlations (p < 0.05) with one or more BIS scores, three DMN connections (s1–s5/L.PCC–L.IPL, s2–s5/R.PCC–L.IPL, and s3–s7/L.ACC–L.PFC) were positively correlated with impulsivity as well as having hyperconnectivity in AUD (Figure 5), whereas the other three DMN connections (s1–s4/L.PCC–R.ACC, s3–s9/L.ACC–L.LTC, and s6–s9/R.IPL–L.LTC) were negatively correlated with impulsivity (p < 0.05) as well as having hypoconnectivity in AUD (Figure 5), thus linking altered FC and higher impulsivity with AUD status. Furthermore, of the four FC variables that had significant correlations with two visual memory scores (i.e., the memory span and total correct scores of the forward condition of the VST), three of them (s1–s4/L.PCC–R.ACC, s2–s4/R.PCC–R.ACC, and s4–s9/R.ACC–L.LTC) showed significant positive correlations (p = 0.05–0.01) and one of the connections (s3–s7/L.ACC–L.PFC) showed a significant negative correlation (p < 0.05) with visual memory scores. Interestingly, the three connections that had positive correlations with visual memory scores also had hypoconnectivity in AUD (Figure 5), whereas the single negatively correlated connection had hyperconnectivity in AUD (Figure 5), thus linking altered FC and poor neuropsychological performance with AUD status. Although similar correlations were observed within each group, these correlations were either less significant or non-significant in the within-group analysis possibly due to a relatively smaller sample size (N = 30).

4. Discussion

The current study aimed to identify specific features of FC, neuropsychological, and impulsivity to classify individuals with AUD from a CTL group. Findings showed that the RF model achieved a classification accuracy of 76.67% and identified 14 DMN connections, two neuropsychological variables (memory span and total correct scores of the forward condition of the VST), and all impulsivity factors as important features to classify participants into either AUD or CTL group (Table 3 and Figure 2, Figure 3 and Figure 5). Relative to the CTL group, AUD individuals manifested hyperconnectivity across the bilateral anterior cingulate cortex (ACC) and prefrontal cortex (PFC) as well as between the bilateral posterior cingulate cortex (PCC) and the left inferior parietal lobule (IPL), while showing hypoconnectivity in several connections involving anterior–posterior and interhemispheric long-range connectivity (Figure 5). Furthermore, AUD subjects showed poorer neuropsychological performance and visual spatial memory span as well as increased impulsivity compared to the CTL group. Furthermore, the top important variables from the three different domains, as identified by the RF method, were also associated with each other as well as with AUD status (Figure 6).

4.1. Aberrant FC in Individuals with AUD

4.1.1. Hyperconnectivity within Frontal and Parietal Regions in AUD

The observed hyperconnectivity across prefrontal regions in AUD is an important finding, given the prominent role of ACC and PFC in human cognition [86,87,88,89] as well as in the development of AUD [4,90,91,92,93]. Therefore, it is highly likely that altered FC within prefrontal DMN nodes may be a manifestation of these structural/functional impairments of frontal lobe regions in AUD. Previous findings from the literature also suggest that prefrontal hyperconnectivity in AUD may have resulted in increased impulsivity and a lack of inhibitory control in these subjects, as there is an association between prefrontal hyperconnectivity and externalizing traits, such as impulsivity, aggression, psychopathy, [94,95,96] and ADHD [97,98]. Therefore, the observed hyperconnectivity across the prefrontal regions may indicate a state of neural hyper-excitability in individuals with AUD [99]. In the same groups of subjects, we have recently reported that the AUD group had smaller volumes in frontal cortices (left pars orbitalis, right medial orbitofrontal, right caudal middle frontal regions) as well as in bilateral hippocampi [6], further confirming possible aberrations frontal networks exhibited by AUD patients. Furthermore, the increased impulsivity and visual memory performance observed in the current study could also be related to hyperconnectivity in the frontal networks observed in the current study as well as to the structural deficits reported in our earlier work on the same participants [6]. On the other hand, the AUD group also manifested local hyperconnectivity within the posterior regions (bilateral PCC–L.IPL). It is well known that PCC and IPL are pivotal regions for social cognition [100], and recent studies have suggested that hyperconnectivity between these regions may indicate interpersonal and emotional disturbances [101,102]. During a cue-reactivity performance in AUD patients (without a control group), Huang et al. [103] observed hyperconnectivity between dorso-medial PFC and insula anteriorly and between PHG and angular gyrus posteriorly in addition to long-range hypoconnectivity across multiple regions during the alcoholic beverage condition compared to non-alcoholic beverage condition. Taken together, local hyperconnectivity in frontal and parietal regions may indicate aberrations in emotional, motivational and social behaviors, possibly giving rise to externalizing features in AUD. However, since prior FC findings in AUD are limited, more DMN studies in different subgroups of AUD are warranted in order to further confirm and understand the present findings.

4.1.2. Hypoconnectivity across Anterior–Posterior and Interhemispheric Connections in AUD

In tandem with the local hyper-connectivity in prefrontal and parietal regions (as discussed in the previous section), the AUD group also manifested hypoconnectivity in the majority of the top significant connections (9 of 14), which included anterior–posterior and interhemispheric long-range connections (Figure 5) across fronto-parietal and fronto-temporal regions. While the fronto-parietal network includes hub regions for cognitive control [104] and is implicated in several neuropsychiatric disorders [105], the fronto-temporal network subserves linguistic processing [106] and social cognition [107] and is primarily implicated in psychoses and autism [108,109,110]. As mentioned above, there are only a handful of fMRI FC studies on AUD and they differ extensively in methodology and the networks that were examined. On the other hand, a few studies on other addictions point to converging findings. For example, a recent study on internet gaming addiction suggested that the addicted individuals showed hypoconnectivity in the long-range anterior–posterior connections, viz., between the medial PFC and the PCC and between the left IPL and the medial PFC [111]. In a study on smoking addiction, Tang et al. [112] reported that smokers had reduced effective connectivity from the PCC to the medial PFC (ACC) and from the IPL to the medial PFC, compared to non-smokers. As mentioned earlier, Huang et al. [103] reported hypoconnectivity in long-range connections across multiple regions of reward and executive processes in AUD patients with excessive craving, in addition to local hyperconnectivity at anterior and posterior regions, while processing alcohol cues. These studies from drug and behavioral addictions suggest that there might be a common substrate for the entire addiction spectrum disorders, which can include addiction for substances and behaviors. On the other hand, hyperconnectivity within prefrontal nodes observed in the current study may be interpreted as a compensatory mechanism to overcome the functional loss due to prefrontal hypoactivity found in abstinent AUD individuals [113]. Furthermore, diffusion tensor imaging (DTI) studies have reported widespread abnormalities in the white matter tracts of associative fibers [114,115] as well as interhemispheric fibers [6,116]. In sum, although these findings support the view that weaker anterior–posterior connectivity representing attentional and higher-cognitive processing can be a marker in addiction in general, more FC studies on AUD and related disorders are needed to elucidate distinct and shared neural mechanisms underlying AUD and other addictions.

4.2. Poor Neuropsychological Performance in AUD

The RF model also identified two scores in the VST forward condition as important features to classify those with AUD from controls: (i) memory span, and (ii) total correct score. The AUD participants showed poor performance in terms of lower memory span and less correct trials compared to CTL participants. It has long been established that individuals with AUD manifest neuropsychological impairments in multiple domains, such as deficits in executive functioning, memory, and visuospatial processing [3,53,54,55,56,117]. It is also known that while the recovery of some cognitive processes are known to occur, certain deficits can persist even after prolonged abstinence [8]. In our sample of abstinent AUD individuals, the observed visuospatial memory deficits despite the abstinent status, suggests that residual cognitive deficits can potentially impair neural processes needed to encode and maintain stimulus sequences, such as rehearsal. These impairments may also interfere with higher cognitive processes during task performance or real-life functioning that involve these visual memory processes. In our previous study on the same groups of subjects, we reported that the AUD group had a smaller bilateral hippocampal volume [6] and that lower volumes in prefrontal cortex and left hippocampus were associated with poorer visuospatial memory performance [6]. Furthermore, the hyperconnectivity across parahippocampal hub in the current study may also be related to the visual memory deficit, possibly representing a compensatory mechanism during the memory performance. On the other hand, in the context of numerous reports of impaired executive functioning in AUD [8], it was surprising to find that the TOLT variables failed to emerge as important features for classification. It is possible that the AUD sample in our study, due to their abstinent status, manifested significant deficits mainly in visual short-term memory in the VST but the executive functioning as tapped by the TOLT was either largely recovered due to abstinence. Furthermore, it is also possible that TOLT scores might be more relevant in the RF model involving FC features of other networks during resting state (e.g., executive control, attentional, etc.) or task performance (e.g., response inhibition, reward processing, etc.) rather than the DMN as used in the current study. Future FC studies during resting state as well as task performance using various domains of neuropsychological features may resolve this puzzle.

4.3. Heightened Impulsivity in AUD

Our finding shows that all BIS impulsivity scores were among the top variables that classified individuals with AUD from the CTL group. The AUD group also showed significantly increased impulsivity compared to the controls. This finding supports the existing view that impulsivity is a core feature of substance use disorders and may result from impaired inhibitory control [35]. We have also observed that six of the top FC variables showed significant correlations with one or more BIS scores (Figure 6). These findings can be supported by earlier studies that have drawn etiological connections among AUD, externalizing traits such as impulsivity, and neural disinhibition in the form of electrophysiological features (e.g., low P3 amplitude and delta and theta oscillations underlying P3 during cognitive processing, and increased resting state beta power) [34,99,118,119]. Importantly, impulsivity was found to be associated with reduced P3 amplitude in AUD [34] and other externalizing disorders [120,121,122]. The heightened impulsivity observed in the AUD group may also be related to altered FC at the frontal connections in the current study and to the lower volumes observed in frontal regions in the same subjects, as reported in our previous study [6]. There is also evidence from other studies that both structural and functional aspects of frontal lobes contribute to increased impulsivity in AUD patients [38,58,123,124]. Furthermore, recent studies have found association of impulsivity with resting state measures of EEG power [125], EEG-based FC [126] and fMRI-based FC [10], suggesting that impulsivity in AUD may underlie specific brain networks.

4.4. Associations among AUD, FC, Impulsivity, and Neurocognition

The observed correlations among FC, neuropsychological performance, and impulsivity measures may indicate reciprocal interactions across these domains (Figure 6). It is interesting to note that increased impulsivity and poor neuropsychological performance were also associated with altered FC in AUD (e.g., hyper-connectivity was associated with increased impulsivity, and FC connections that had positive correlations with visual memory scores also showed hypoconnectivity in AUD), thus linking all three domains with AUD status as well. Although previous studies have separately shown that AUD was associated with altered FC [10,126], poor neuropsychological performance [3,54], and heightened impulsivity [34,57], no previous studies have incorporated all three domains in a single study, making the current study the first to examine these domains together. In our previous study on the same participants, we showed that lower volumes in frontal regions and hippocampus were associated with poorer neuropsychological functioning in AUD subjects [6], and studies are underway in our laboratory to incorporate structural and functional brain measures as well as neuropsychological and behavioral (e.g., impulsivity) in the predictive model of AUD. Future studies may also include comprehensive measures in each domain and implement predictive and path models to understand the exact nature of these associations.

4.5. Potential Implications, Limitations, and Future Directions

The findings of the present study have shown that features from all three domains have contributed to the classification of AUD from CTL individuals, as shown in the list of important variables identified by the RF model (see Table 2 and Figure 2 and Figure 3). The implications of these findings are the identification of potential biomarkers of alcoholism, which may include a combination of altered DMN FC (local hyperconnectivity at the frontal and parietal regions and long-range hypoconnectivity across the anterior–posterior and interhemispheric connections), coupled with poor neuropsychological performance and increased impulsivity. These findings may aid in designing intervention programs for AUD. Nevertheless, our study has several limitations that future studies may aim to overcome: First, the age difference between AUD and CTL groups was significant as the groups were not matched for age. Despite this limitation on the age difference, the findings may still be valid as there were no systematic correlations across age and the top significant variables. However, we do acknowledge that age matching across the groups may be crucial as functional connectivity changes due to a neuropsychiatric condition, as in the case of autism spectrum disorders, may show opposing patterns during different developmental stages [127]. Alternatively, future studies may consider adding demographic factors (i.e., age, gender, race, education, etc.) in the classification model in order to determine the predictive significance of these factors. Second, the sample of the current study contained only males and therefore the generalizability of the findings may be limited. It is suggested that future studies use both age- and gender-matched groups. Third, the influence of a family history of AUD was not considered in the current study, and future studies may additionally examine family history information in order to explore whether the aberrations in FC are due to chronic alcohol consumption or preexisting neural endophenotypic features. Fourth, the range of neuropsychological testing was limited to only two tests, and would be strengthened by future studies that administered a comprehensive battery of neuropsychological tests to elucidate specific patterns of deficits and their interactions across different domains. Fifth, the current study has used a single measure (BIS) of impulsivity, while the inclusion of other related traits (e.g., sensation seeking, delay discounting, etc.) may shed more light on the etiological connections among these variables in the development and/or maintenance of AUD. Sixth, studies may explore a range of disorders in the addiction spectrum, which can include both substance and behavioral addiction, in order to identify common neural substrates underlying the spectrum as well as distinct effects of specific substance or behavior. Finally, multimodal measures of brain connectivity, including structural MRI (white matter fiber tracts) and EEG measures, may help our understanding of the complex relationships between structural and functional brain connectivity [128] and their role in AUD, and these studies are underway in our lab. More synthesis across various brain imaging methods will be essential not only for cross-validating the findings across different modalities but also for interpreting them in the light of one another.

Author Contributions

Conceptualization: C.K., B.P., B.A.A., A.K.P.; Methodology: C.K., B.P., B.A.A., A.K.P., S.K., D.B.C., A.T.S.; Data Collection: A.T.S., B.A.A., E.B.; Data Curation: B.A.A., C.K.; Formal Analysis: C.K., B.A.A.; Manuscript Preparation: C.K., B.A.A., B.P.; Review & Editing: B.P., B.A.A., A.K.P., S.K., G.P., J.L.M., D.B.C., A.T.S.; Funding Acquisition: B.P. All authors have read and agreed to the published version of the manuscript.

Funding

This research work was funded by the National Institute on Alcohol Abuse and Alcoholism (NIAAA) of the National Institutes of Health (NIH) through the grant (R01 AA002686) to Bernice Porjesz (PI).

Acknowledgments

In memory of Henri Begleiter, founder and longtime mentor of the Neurodynamics Laboratory, we acknowledge with great admiration his seminal scientific contributions to the field. We are sincerely indebted to his charismatic leadership and luminous guidance, truly inspired by his scientific mission and vision, and highly motivated to carry forward the work he fondly cherished. We are grateful for the valuable technical assistance of Carlene Haynes, Joyce Alonzia, Chamion Thomas, Alec Musial, and Kristina Horne.

Conflicts of Interest

The authors declare no conflict of interest.

Appendix A

Table A1. Concepts and parameters used in Random Forest classification method.
Trees: Decision trees whose results are aggregated into one final result for classifying the factors or outcomes. Each tree is constructed based on a random (bootstrapped) subsample of the observations.
Node: A point in a tree, where a split occurs as a result of a ‘test’ on an attribute leading to binary outcomes (e.g., whether a coin flip results in head or tail). A binary split at a node partitions the data from the parent node into two daughter nodes.
Branch: The outcome of the test resulting in a split or two branches in a classification tree.
Leaf: A terminal node that has no children or branches.
Random Forest ensemble: Aggregation of individual decision trees in order to combine predictions (votes) from each tree. The class/group/outcome with most votes becomes the RF model’s prediction.
Bagging: It’s the short form of ‘bootstrap aggregating’, which is a method to improve classification by combining classifications of randomly generated training sets.
Out of bag (OOB) estimate: The observations that are not part of the bootstrap subsample are referred to as out-of-bag (OOB) observations. The OOB error refers to the classification error based on this subsample and serves as a validation of Random Forest model accuracy.
Gini (mean) decrease: It represents the importance of a specific feature/predictor/variable (Vi) for the classification or prediction. It’s the mean decrease in node impurity (classification error) of Vi. A higher Gini decrease indicates higher variable importance for Vi.
Accuracy decrease: Mean decrease in prediction accuracy after Vi is not taken into account.
Mean minimal depth: It refers to the number of nodes along the shortest path from the root node down to the nearest leaf node. Smaller depth for the Vi indicates its higher importance.
Mtry: A preset number of features/variables/predictors randomly selected (from the entire list) for splitting at each node in the construction of each decision tree.
ntree: A preset total number of trees to grow for a given model. Larger ‘ntree’ normally produce more stable models and more reliable predictions.
Number of nodes: Total number of nodes that use Vi for splitting (it is usually equal to number of trees if trees are shallow).
Times a root: Total number of trees in which Vi is used for splitting the root node (i.e., the whole sample is divided into two based on the value of Vi).
p value: probability value of hypothesis testing based on a one-sided binomial test that indicates whether the observed number of successes (number of nodes in which Vi was used for splitting) exceeds the theoretical number of successes if they were random.

References

  1. O’Brien, C.P.; McLellan, A.T. Myths about the treatment of addiction. Lancet 1996, 347, 237–240. [Google Scholar] [CrossRef]
  2. Koob, G.F. Neurocircuitry of alcohol addiction: Synthesis from animal models. Handb. Clin. Neurol. 2014, 125, 33–54. [Google Scholar]
  3. Oscar-Berman, M. Neuropsychological vulnerabilities in chronic alcoholism. In Review of NIAAA’s Neuroscience and Behavioral Research Portfolio. National Institute on Alcohol Abuse and Alcoholism (NIAAA) Research Monograph No. 34; Noronha, A., Eckardt, M.J., Warren, K., Eds.; NIAAA: Bethesda, MD, USA, 2000; pp. 437–471. [Google Scholar]
  4. Zahr, N.M.; Pfefferbaum, A. Alcohol’s Effects on the Brain: Neuroimaging Results in Humans and Animal Models. Alcohol. Res. 2017, 38, 183–206. [Google Scholar] [PubMed]
  5. Pfefferbaum, A.; Sullivan, E.V. Disruption of brain white matter microstructure by excessive intracellular and extracellular fluid in alcoholism: Evidence from diffusion tensor imaging. Neuropsychopharmacology 2005, 30, 423–432. [Google Scholar] [CrossRef] [PubMed]
  6. Pandey, A.K.; Ardekani, B.A.; Kamarajan, C.; Zhang, J.; Chorlian, D.B.; Byrne, K.N.; Pandey, G.; Meyers, J.L.; Kinreich, S.; Stimus, A.; et al. Lower Prefrontal and Hippocampal Volume and Diffusion Tensor Imaging Differences Reflect Structural and Functional Abnormalities in Abstinent Individuals with Alcohol Use Disorder. Alcohol. Clin. Exp. Res. 2018, 42, 1883–1896. [Google Scholar] [CrossRef] [PubMed]
  7. Stavro, K.; Pelletier, J.; Potvin, S. Widespread and sustained cognitive deficits in alcoholism: A meta-analysis. Addict. Biol. 2013, 18, 203–213. [Google Scholar] [CrossRef]
  8. Le Berre, A.P.; Fama, R.; Sullivan, E.V. Executive Functions, Memory, and Social Cognitive Deficits and Recovery in Chronic Alcoholism: A Critical Review to Inform Future Research. Alcohol. Clin. Exp. Res. 2017, 41, 1432–1443. [Google Scholar] [CrossRef]
  9. Fede, S.J.; Grodin, E.N.; Dean, S.F.; Diazgranados, N.; Momenan, R. Resting state connectivity best predicts alcohol use severity in moderate to heavy alcohol users. Neuroimage Clin. 2019, 22, 101782. [Google Scholar] [CrossRef]
  10. Zhu, X.; Cortes, C.R.; Mathur, K.; Tomasi, D.; Momenan, R. Model-free functional connectivity and impulsivity correlates of alcohol dependence: A resting-state study. Addict. Biol. 2017, 22, 206–217. [Google Scholar] [CrossRef] [Green Version]
  11. Zhu, X.; Du, X.; Kerich, M.; Lohoff, F.W.; Momenan, R. Random forest based classification of alcohol dependence patients and healthy controls using resting state MRI. Neurosci. Lett. 2018, 676, 27–33. [Google Scholar] [CrossRef]
  12. Volkow, N.D.; Baler, R.D. Brain imaging biomarkers to predict relapse in alcohol addiction. JAMA Psychiatry 2013, 70, 661–663. [Google Scholar] [CrossRef] [PubMed]
  13. Zakiniaeiz, Y.; Scheinost, D.; Seo, D.; Sinha, R.; Constable, R.T. Cingulate cortex functional connectivity predicts future relapse in alcohol dependent individuals. Neuroimage Clin. 2017, 13, 181–187. [Google Scholar] [CrossRef] [PubMed]
  14. Bzdok, D.; Meyer-Lindenberg, A. Machine Learning for Precision Psychiatry: Opportunities and Challenges. Biol. Psychiatry Cogn. Neurosci. Neuroimaging 2018, 3, 223–230. [Google Scholar] [CrossRef] [PubMed] [Green Version]
  15. Janssen, R.J.; Mourao-Miranda, J.; Schnack, H.G. Making Individual Prognoses in Psychiatry Using Neuroimaging and Machine Learning. Biol. Psychiatry Cogn. Neurosci. Neuroimaging 2018, 3, 798–808. [Google Scholar] [CrossRef]
  16. Cho, G.; Yim, J.; Choi, Y.; Ko, J.; Lee, S.H. Review of Machine Learning Algorithms for Diagnosing Mental Illness. Psychiatry Investig. 2019, 16, 262–269. [Google Scholar] [CrossRef] [PubMed] [Green Version]
  17. Mumtaz, W.; Vuong, P.L.; Xia, L.; Malik, A.S.; Rashid, R.B.A. An EEG-based machine learning method to screen alcohol use disorder. Cogn. Neurodyn. 2017, 11, 161–171. [Google Scholar] [CrossRef] [Green Version]
  18. Kinreich, S.; Meyers, J.L.; Maron-Katz, A.; Kamarajan, C.; Pandey, A.K.; Chorlian, D.B.; Zhang, J.; Pandey, G.; Subbie-Saenz de Viteri, S.; Pitti, D.; et al. Predicting risk for Alcohol Use Disorder using longitudinal data with multimodal biomarkers and family history: A machine learning study. Mol. Psychiatry 2019. [Google Scholar] [CrossRef] [Green Version]
  19. Obermeyer, Z.; Emanuel, E.J. Predicting the Future—Big Data, Machine Learning, and Clinical Medicine. N. Engl. J. Med. 2016, 375, 1216–1219. [Google Scholar] [CrossRef] [Green Version]
  20. Sarica, A.; Cerasa, A.; Quattrone, A. Random Forest Algorithm for the Classification of Neuroimaging Data in Alzheimer’s Disease: A Systematic Review. Front. Aging Neurosci. 2017, 9, 329. [Google Scholar] [CrossRef]
  21. Rashidi, H.H.; Tran, N.K.; Betts, E.V.; Howell, L.P.; Green, R. Artificial Intelligence and Machine Learning in Pathology: The Present Landscape of Supervised Methods. Acad. Pathol. 2019, 6, 2374289519873088. [Google Scholar] [CrossRef]
  22. Breiman, L. Random forests. Mach. Learn. 2001, 45, 5–32. [Google Scholar] [CrossRef] [Green Version]
  23. Deco, G.; Jirsa, V.; Friston, K.J. The dynamical structural basis of brain activity. In Principles of Brain Dynamics: Global State Interactions; MIT Press: Cambridge, MA, USA, 2012. [Google Scholar]
  24. Sepulcre, J.; Sabuncu, M.R.; Johnson, K.A. Network assemblies in the functional brain. Curr. Opin. Neurol. 2012, 25, 384–391. [Google Scholar] [CrossRef] [PubMed] [Green Version]
  25. Stam, C.J. Characterization of anatomical and functional connectivity in the brain: A complex networks perspective. Int. J. Psychophysiol. 2010, 77, 186–194. [Google Scholar] [CrossRef] [PubMed]
  26. Cabeza, R.; Nyberg, L. Imaging cognition II: An empirical review of 275 PET and fMRI studies. J. Cogn. Neurosci. 2000, 12, 1–47. [Google Scholar] [CrossRef] [PubMed]
  27. Bassett, D.S.; Bullmore, E.T. Human brain networks in health and disease. Curr. Opin. Neurol. 2009, 22, 340–347. [Google Scholar] [CrossRef] [Green Version]
  28. Stam, C.J.; van Straaten, E.C. The organization of physiological brain networks. Clin. Neurophysiol. 2012, 123, 1067–1087. [Google Scholar] [CrossRef]
  29. Bressler, S.L.; Menon, V. Large-scale brain networks in cognition: Emerging methods and principles. Trends Cogn. Sci. 2010, 14, 277–290. [Google Scholar] [CrossRef]
  30. van den Heuvel, M.P.; Sporns, O. Network hubs in the human brain. Trends Cogn. Sci. 2013, 17, 683–696. [Google Scholar] [CrossRef]
  31. Wig, G.S.; Schlaggar, B.L.; Petersen, S.E. Concepts and principles in the analysis of brain networks. Ann. N. Y. Acad. Sci. 2011, 1224, 126–146. [Google Scholar] [CrossRef]
  32. Menon, V. Large-scale brain networks and psychopathology: A unifying triple network model. Trends Cogn. Sci. 2011, 15, 483–506. [Google Scholar] [CrossRef]
  33. Volkow, N.D.; Wang, G.J.; Tomasi, D.; Baler, R.D. Unbalanced neuronal circuits in addiction. Curr. Opin. Neurobiol. 2013, 23, 639–648. [Google Scholar] [CrossRef] [Green Version]
  34. Chen, A.C.; Porjesz, B.; Rangaswamy, M.; Kamarajan, C.; Tang, Y.; Jones, K.A.; Chorlian, D.B.; Stimus, A.T.; Begleiter, H. Reduced frontal lobe activity in subjects with high impulsivity and alcoholism. Alcohol. Clin. Exp. Res. 2007, 31, 156–165. [Google Scholar] [CrossRef] [PubMed]
  35. Lawrence, A.J.; Luty, J.; Bogdan, N.A.; Sahakian, B.J.; Clark, L. Impulsivity and response inhibition in alcohol dependence and problem gambling. Psychopharmacology 2009, 207, 163–172. [Google Scholar] [CrossRef] [PubMed] [Green Version]
  36. Aragues, M.; Jurado, R.; Quinto, R.; Rubio, G. Laboratory paradigms of impulsivity and alcohol dependence: A review. Eur. Addict. Res. 2011, 17, 64–71. [Google Scholar] [CrossRef] [PubMed]
  37. Jung, Y.C.; Schulte, T.; Muller-Oehring, E.M.; Namkoong, K.; Pfefferbaum, A.; Sullivan, E.V. Compromised frontocerebellar circuitry contributes to nonplanning impulsivity in recovering alcoholics. Psychopharmacology 2014, 231, 4443–4453. [Google Scholar] [CrossRef] [PubMed] [Green Version]
  38. Wang, J.; Fan, Y.; Dong, Y.; Ma, M.; Ma, Y.; Dong, Y.; Niu, Y.; Jiang, Y.; Wang, H.; Wang, Z.; et al. Alterations in Brain Structure and Functional Connectivity in Alcohol Dependent Patients and Possible Association with Impulsivity. PLoS ONE 2016, 11, e0161956. [Google Scholar] [CrossRef]
  39. van den Heuvel, M.P.; Hulshoff Pol, H.E. Exploring the brain network: A review on resting-state fMRI functional connectivity. Eur. Neuropsychopharmacol. 2010, 20, 519–534. [Google Scholar] [CrossRef] [PubMed]
  40. Khosla, M.; Jamison, K.; Ngo, G.H.; Kuceyeski, A.; Sabuncu, M.R. Machine learning in resting-state fMRI analysis. Magn. Reson. Imaging 2019, 64, 101–121. [Google Scholar] [CrossRef] [Green Version]
  41. Raichle, M.E. The restless brain: How intrinsic activity organizes brain function. Philos. Trans. R. Soc. Lond. B Biol. Sci. 2015, 370, 20140172. [Google Scholar] [CrossRef]
  42. Biswal, B.B.; Mennes, M.; Zuo, X.N.; Gohel, S.; Kelly, C.; Smith, S.M.; Beckmann, C.F.; Adelstein, J.S.; Buckner, R.L.; Colcombe, S.; et al. Toward discovery science of human brain function. Proc. Natl. Acad. Sci. USA 2010, 107, 4734–4739. [Google Scholar] [CrossRef] [Green Version]
  43. Barch, D.M.; Carter, C.S. Functional and Structural Brain Connectivity in Psychopathology. Biol. Psychiatry Cogn. Neurosci. Neuroimaging 2016, 1, 196–198. [Google Scholar] [CrossRef]
  44. Lubrini, G.; Martin-Montes, A.; Diez-Ascaso, O.; Diez-Tejedor, E. Brain disease, connectivity, plasticity and cognitive therapy: A neurological view of mental disorders. Neurologia 2018, 33, 187–191. [Google Scholar] [CrossRef]
  45. Chanraud, S.; Pitel, A.L.; Pfefferbaum, A.; Sullivan, E.V. Disruption of functional connectivity of the default-mode network in alcoholism. Cereb. Cortex 2011, 21, 2272–2281. [Google Scholar] [CrossRef]
  46. Camchong, J.; Stenger, V.A.; Fein, G. Resting-state synchrony in short-term versus long-term abstinent alcoholics. Alcohol. Clin. Exp. Res. 2013, 37, 794–803. [Google Scholar] [CrossRef] [Green Version]
  47. Muller-Oehring, E.M.; Jung, Y.C.; Pfefferbaum, A.; Sullivan, E.V.; Schulte, T. The Resting Brain of Alcoholics. Cereb. Cortex 2015, 25, 4155–4168. [Google Scholar] [CrossRef] [Green Version]
  48. Kim, S.; Im, S.; Lee, J.; Lee, S.G. Disrupted Control Network Connectivity in Abstinent Patients with Alcohol Dependence. Psychiatry Investig. 2017, 14, 325–332. [Google Scholar] [CrossRef] [Green Version]
  49. Zhang, R.; Volkow, N.D. Brain default-mode network dysfunction in addiction. Neuroimage 2019, 200, 313–331. [Google Scholar] [CrossRef]
  50. Whitfield-Gabrieli, S.; Ford, J.M. Default mode network activity and connectivity in psychopathology. Annu. Rev. Clin. Psychol. 2012, 8, 49–76. [Google Scholar] [CrossRef]
  51. Crews, F.T.; Boettiger, C.A. Impulsivity, frontal lobes and risk for addiction. Pharmacol. Biochem. Behav. 2009, 93, 237–247. [Google Scholar] [CrossRef] [PubMed] [Green Version]
  52. Jentsch, J.D.; Ashenhurst, J.R.; Cervantes, M.C.; Groman, S.M.; James, A.S.; Pennington, Z.T. Dissecting impulsivity and its relationships to drug addictions. Ann. N. Y. Acad. Sci. 2014, 1327, 1–26. [Google Scholar] [CrossRef] [Green Version]
  53. Parsons, O.A. Neuropsychological deficits in alcoholics: Facts and fancies. Alcohol. Clin. Exp. Res. 1977, 1, 51–56. [Google Scholar] [CrossRef] [PubMed]
  54. Parsons, O.A.; Butters, N.; Nathan, P.E. Neuropsychology of Alcoholism: Implications for Diagnosis and Treatment; The Guilford Press: New York, NY, USA, 1987; p. 414. [Google Scholar]
  55. Tarter, R.E.; Ryan, C.M. Neuropsychology of alcoholism. Etiology, phenomenology, process, and outcome. Recent Dev. Alcohol. 1983, 1, 449–469. [Google Scholar] [PubMed]
  56. Oscar-Berman, M. Neuropsychological consequences of long-term chronic alcoholism. Am. Sci. 1980, 68, 410–419. [Google Scholar]
  57. Kamarajan, C.; Rangaswamy, M.; Manz, N.; Chorlian, D.B.; Pandey, A.K.; Roopesh, B.N.; Porjesz, B. Topography, power, and current source density of theta oscillations during reward processing as markers for alcohol dependence. Hum. Brain Mapp. 2012, 33, 1019–1039. [Google Scholar] [CrossRef] [Green Version]
  58. Cyders, M.A.; Dzemidzic, M.; Eiler, W.J.; Coskunpinar, A.; Karyadi, K.; Kareken, D.A. Negative urgency and ventromedial prefrontal cortex responses to alcohol cues: FMRI evidence of emotion-based impulsivity. Alcohol. Clin. Exp. Res. 2014, 38, 409–417. [Google Scholar] [CrossRef] [Green Version]
  59. Fineberg, N.A.; Chamberlain, S.R.; Goudriaan, A.E.; Stein, D.J.; Vanderschuren, L.J.; Gillan, C.M.; Shekar, S.; Gorwood, P.A.; Voon, V.; Morein-Zamir, S.; et al. New developments in human neurocognition: Clinical, genetic, and brain imaging correlates of impulsivity and compulsivity. CNS Spectr. 2014, 19, 69–89. [Google Scholar] [CrossRef]
  60. Bickel, W.K.; Jarmolowicz, D.P.; Mueller, E.T.; Gatchalian, K.M.; McClure, S.M. Are executive function and impulsivity antipodes? A conceptual reconstruction with special reference to addiction. Psychopharmacology 2012, 221, 361–387. [Google Scholar] [CrossRef] [Green Version]
  61. Bucholz, K.K.; Cadoret, R.; Cloninger, C.R.; Dinwiddie, S.H.; Hesselbrock, V.M.; Nurnberger, J.I., Jr.; Reich, T.; Schmidt, I.; Schuckit, M.A. A new, semi-structured psychiatric interview for use in genetic linkage studies: A report on the reliability of the SSAGA. J. Stud. Alcohol. 1994, 55, 149–158. [Google Scholar] [CrossRef]
  62. Folstein, M.F.; Folstein, S.E.; McHugh, P.R. “Mini-mental state”. A practical method for grading the cognitive state of patients for the clinician. J. Psychiatr. Res. 1975, 12, 189–198. [Google Scholar] [CrossRef]
  63. Shallice, T. Specific impairments of planning. Philos. Trans. R. Soc. Lond. B Biol. Sci. 1982, 298, 199–209. [Google Scholar]
  64. Berch, D.B.; Krikorian, R.; Huha, E.M. The Corsi block-tapping task: Methodological and theoretical considerations. Brain Cogn. 1998, 38, 317–338. [Google Scholar] [CrossRef] [PubMed] [Green Version]
  65. Milner, B. Interhemispheric differences in the localization of psychological processes in man. Br. Med. Bull. 1971, 27, 272–277. [Google Scholar] [CrossRef] [PubMed]
  66. Davis, H.P.; Keller, F. Colorado Assessment Tests (CATs); Version 1.2; Colorado Assessment Tests: Colorado Springs, CO, USA, 2002. [Google Scholar]
  67. Patton, J.H.; Stanford, M.S.; Barratt, E.S. Factor structure of the Barratt impulsiveness scale. J. Clin. Psychol. 1995, 51, 768–774. [Google Scholar] [CrossRef]
  68. Stanford, M.S.; Mathias, C.W.; Dougherty, D.M.; Lake, S.L.; Anderson, N.E.; Patton, J.H. Fifty years of the Barratt Impulsiveness Scale: An update and review. Personal. Individ. Differ. 2009, 47, 385–395. [Google Scholar] [CrossRef]
  69. Ardekani, B.A.; Braun, M.; Hutton, B.F.; Kanno, I.; Iida, H. A fully automatic multimodality image registration algorithm. J. Comput. Assist. Tomogr. 1995, 19, 615–623. [Google Scholar] [CrossRef]
  70. Cox, R.W. AFNI: Software for analysis and visualization of functional magnetic resonance neuroimages. Comput. Biomed. Res. 1996, 29, 162–173. [Google Scholar] [CrossRef]
  71. Ardekani, B.A.; Bappal, A.; D’Angelo, D.; Ashtari, M.; Lencz, T.; Szeszko, P.R.; Butler, P.D.; Javitt, D.C.; Lim, K.O.; Hrabe, J.; et al. Brain morphometry using diffusion-weighted magnetic resonance imaging: Application to schizophrenia. Neuroreport 2005, 16, 1455–1459. [Google Scholar] [CrossRef] [Green Version]
  72. Klein, A.; Andersson, J.; Ardekani, B.A.; Ashburner, J.; Avants, B.; Chiang, M.C.; Christensen, G.E.; Collins, D.L.; Gee, J.; Hellier, P.; et al. Evaluation of 14 nonlinear deformation algorithms applied to human brain MRI registration. Neuroimage 2009, 46, 786–802. [Google Scholar] [CrossRef] [Green Version]
  73. Joshi, S.; Davis, B.; Jomier, M.; Gerig, G. Unbiased diffeomorphic atlas construction for computational anatomy. Neuroimage 2004, 23 (Suppl. S1), S151–S160. [Google Scholar] [CrossRef]
  74. Koay, C.G.; Carew, J.D.; Alexander, A.L.; Basser, P.J.; Meyerand, M.E. Investigation of anomalous estimates of tensor-derived quantities in diffusion tensor imaging. Magn. Reson. Med. 2006, 55, 930–936. [Google Scholar] [CrossRef]
  75. Andrews-Hanna, J.R.; Smallwood, J.; Spreng, R.N. The default network and self-generated thought: Component processes, dynamic control, and clinical relevance. Ann. N. Y. Acad. Sci. 2014, 1316, 29–52. [Google Scholar] [CrossRef]
  76. Imperatori, C.; Della Marca, G.; Brunetti, R.; Carbone, G.A.; Massullo, C.; Valenti, E.M.; Amoroso, N.; Maestoso, G.; Contardi, A.; Farina, B. Default Mode Network alterations in alexithymia: An EEG power spectra and connectivity study. Sci. Rep. 2016, 6, 36653. [Google Scholar] [CrossRef]
  77. Thatcher, R.W.; North, D.M.; Biver, C.J. LORETA EEG phase reset of the default mode network. Front. Hum. Neurosci. 2014, 8, 529. [Google Scholar] [CrossRef]
  78. Buckner, R.L.; Andrews-Hanna, J.R.; Schacter, D.L. The brain’s default network: Anatomy, function, and relevance to disease. Ann. N. Y. Acad. Sci. 2008, 1124, 1–38. [Google Scholar] [CrossRef] [Green Version]
  79. Pascual-Marqui, R.D.; Lehmann, D.; Koukkou, M.; Kochi, K.; Anderer, P.; Saletu, B.; Tanaka, H.; Hirata, K.; John, E.R.; Prichep, L.; et al. Assessing interactions in the brain with exact low-resolution electromagnetic tomography. Philos. Trans. R. Soc. A Math. Phys. Eng. Sci. 2011, 369, 3768–3784. [Google Scholar] [CrossRef]
  80. Whitfield-Gabrieli, S.; Nieto-Castanon, A. Conn: A functional connectivity toolbox for correlated and anticorrelated brain networks. Brain Connect. 2012, 2, 125–141. [Google Scholar] [CrossRef] [Green Version]
  81. Dansereau, C.; Benhajali, Y.; Risterucci, C.; Pich, E.M.; Orban, P.; Arnold, D.; Bellec, P. Statistical power and prediction accuracy in multisite resting-state fMRI connectivity. Neuroimage 2017, 149, 220–232. [Google Scholar] [CrossRef] [Green Version]
  82. Goel, E.; Abhilasha, E.; Goel, E.; Abhilasha, E. Random forest: A review. Int. J. Adv. Res. Comput. Sci. Softw. Eng. 2017, 7, 251–257. [Google Scholar] [CrossRef]
  83. Qi, Y. Random Forest for Bioinformatics. In Ensemble Machine Learning; Zhang, C., Ma, Y., Eds.; Springer: Boston, MA, USA, 2012; pp. 307–323. [Google Scholar]
  84. Strobl, C.; Malley, J.; Tutz, G. An introduction to recursive partitioning: Rationale, application, and characteristics of classification and regression trees, bagging, and random forests. Psychol. Methods 2009, 14, 323–348. [Google Scholar] [CrossRef] [Green Version]
  85. Breiman, L.; Cutler, A. Random Forest. Available online: https://www.stat.berkeley.edu/~breiman/RandomForests/cc_home.htm#ooberr (accessed on 1 June 2019).
  86. Nee, D.E.; D’Esposito, M. The hierarchical organization of the lateral prefrontal cortex. Elife 2016, 5, e12112. [Google Scholar] [CrossRef]
  87. van Noordt, S.J.; Segalowitz, S.J. Performance monitoring and the medial prefrontal cortex: A review of individual differences and context effects as a window on self-regulation. Front. Hum. Neurosci. 2012, 6, 197. [Google Scholar] [CrossRef] [PubMed] [Green Version]
  88. Alexander, W.H.; Brown, J.W. Medial prefrontal cortex as an action-outcome predictor. Nat. Neurosci. 2011, 14, 1338–1344. [Google Scholar] [CrossRef]
  89. Tang, W.; Jbabdi, S.; Zhu, Z.; Cottaar, M.; Grisot, G.; Lehman, J.F.; Yendiki, A.; Haber, S.N. A connectional hub in the rostral anterior cingulate cortex links areas of emotion and cognitive control. Elife 2019, 8, e43761. [Google Scholar] [CrossRef] [PubMed]
  90. Moselhy, H.F.; Georgiou, G.; Kahn, A. Frontal lobe changes in alcoholism: A review of the literature. Alcohol Alcohol. 2001, 36, 357–368. [Google Scholar] [CrossRef] [PubMed] [Green Version]
  91. Ratti, M.T.; Bo, P.; Giardini, A.; Soragna, D. Chronic alcoholism and the frontal lobe: Which executive functions are imparied? Acta Neurol. Scand. 2002, 105, 276–281. [Google Scholar] [CrossRef]
  92. Buhler, M.; Mann, K. Alcohol and the human brain: A systematic review of different neuroimaging methods. Alcohol. Clin. Exp. Res. 2011, 35, 1771–1793. [Google Scholar] [CrossRef]
  93. Oscar-Berman, M.; Marinkovic, K. Alcohol: Effects on neurobehavioral functions and the brain. Neuropsychol. Rev. 2007, 17, 239–257. [Google Scholar] [CrossRef] [PubMed]
  94. Contreras-Rodriguez, O.; Pujol, J.; Batalla, I.; Harrison, B.J.; Soriano-Mas, C.; Deus, J.; Lopez-Sola, M.; Macia, D.; Pera, V.; Hernandez-Ribas, R.; et al. Functional Connectivity Bias in the Prefrontal Cortex of Psychopaths. Biol. Psychiatry 2015, 78, 647–655. [Google Scholar] [CrossRef]
  95. Philippi, C.L.; Pujara, M.S.; Motzkin, J.C.; Newman, J.; Kiehl, K.A.; Koenigs, M. Altered resting-state functional connectivity in cortical networks in psychopathy. J. Neurosci. 2015, 35, 6068–6078. [Google Scholar] [CrossRef]
  96. Korponay, C.; Pujara, M.; Deming, P.; Philippi, C.; Decety, J.; Kosson, D.S.; Kiehl, K.A.; Koenigs, M. Impulsive-antisocial psychopathic traits linked to increased volume and functional connectivity within prefrontal cortex. Soc. Cogn. Affect. Neurosci. 2017, 12, 1169–1178. [Google Scholar] [CrossRef] [Green Version]
  97. Bos, D.J.; Oranje, B.; Achterberg, M.; Vlaskamp, C.; Ambrosino, S.; de Reus, M.A.; van den Heuvel, M.P.; Rombouts, S.; Durston, S. Structural and functional connectivity in children and adolescents with and without attention deficit/hyperactivity disorder. J. Child Psychol. Psychiatry 2017, 58, 810–818. [Google Scholar] [CrossRef] [PubMed]
  98. Li, F.; He, N.; Li, Y.; Chen, L.; Huang, X.; Lui, S.; Guo, L.; Kemp, G.J.; Gong, Q. Intrinsic brain abnormalities in attention deficit hyperactivity disorder: A resting-state functional MR imaging study. Radiology 2014, 272, 514–523. [Google Scholar] [CrossRef] [PubMed] [Green Version]
  99. Begleiter, H.; Porjesz, B. What is inherited in the predisposition toward alcoholism? A proposed model. Alcohol. Clin. Exp. Res. 1999, 23, 1125–1135. [Google Scholar] [CrossRef] [PubMed]
  100. Mars, R.B.; Neubert, F.X.; Noonan, M.P.; Sallet, J.; Toni, I.; Rushworth, M.F. On the relationship between the “default mode network” and the “social brain”. Front. Hum. Neurosci. 2012, 6, 189. [Google Scholar] [CrossRef] [Green Version]
  101. Luo, Y.; Kong, F.; Qi, S.; You, X.; Huang, X. Resting-state functional connectivity of the default mode network associated with happiness. Soc. Cogn. Affect. Neurosci. 2016, 11, 516–524. [Google Scholar] [CrossRef] [PubMed] [Green Version]
  102. Sun, H.; Luo, L.; Yuan, X.; Zhang, L.; He, Y.; Yao, S.; Wang, J.; Xiao, J. Regional homogeneity and functional connectivity patterns in major depressive disorder, cognitive vulnerability to depression and healthy subjects. J. Affect. Disord. 2018, 235, 229–235. [Google Scholar] [CrossRef]
  103. Huang, Y.; Mohan, A.; De Ridder, D.; Sunaert, S.; Vanneste, S. The neural correlates of the unified percept of alcohol-related craving: A fMRI and EEG study. Sci. Rep. 2018, 8, 923. [Google Scholar] [CrossRef]
  104. Zanto, T.P.; Gazzaley, A. Fronto-parietal network: Flexible hub of cognitive control. Trends Cogn. Sci. 2013, 17, 602–603. [Google Scholar] [CrossRef] [Green Version]
  105. Cole, M.W.; Repovs, G.; Anticevic, A. The frontoparietal control system: A central role in mental health. Neuroscientist 2014, 20, 652–664. [Google Scholar] [CrossRef] [Green Version]
  106. Chow, H.M.; Kaup, B.; Raabe, M.; Greenlee, M.W. Evidence of fronto-temporal interactions for strategic inference processes during language comprehension. Neuroimage 2008, 40, 940–954. [Google Scholar] [CrossRef]
  107. Poustka, L.; Jennen-Steinmetz, C.; Henze, R.; Vomstein, K.; Haffner, J.; Sieltjes, B. Fronto-temporal disconnectivity and symptom severity in children with autism spectrum disorder. World J. Biol. Psychiatry 2012, 13, 269–280. [Google Scholar] [CrossRef]
  108. John, J.P. Fronto-temporal dysfunction in schizophrenia: A selective review. Indian J. Psychiatry 2009, 51, 180–190. [Google Scholar] [CrossRef] [PubMed]
  109. Leroux, E.; Delcroix, N.; Dollfus, S. Left fronto-temporal dysconnectivity within the language network in schizophrenia: An fMRI and DTI study. Psychiatry Res. 2014, 223, 261–267. [Google Scholar] [CrossRef]
  110. Urbain, C.; Vogan, V.M.; Ye, A.X.; Pang, E.W.; Doesburg, S.M.; Taylor, M.J. Desynchronization of fronto-temporal networks during working memory processing in autism. Hum. Brain Mapp. 2016, 37, 153–164. [Google Scholar] [CrossRef] [PubMed]
  111. Wang, M.; Zheng, H.; Du, X.; Dong, G. Mapping Internet gaming disorder using effective connectivity: A spectral dynamic causal modeling study. Addict. Behav. 2019, 90, 62–70. [Google Scholar] [CrossRef]
  112. Tang, R.; Razi, A.; Friston, K.J.; Tang, Y.Y. Mapping Smoking Addiction Using Effective Connectivity Analysis. Front. Hum. Neurosci. 2016, 10, 195. [Google Scholar] [CrossRef] [PubMed] [Green Version]
  113. Muller-Oehring, E.M.; Le Berre, A.P.; Serventi, M.; Kalon, E.; Haas, A.L.; Padula, C.B.; Schulte, T. Brain activation to cannabis- and alcohol-related words in alcohol use disorder. Psychiatry Res. Neuroimaging 2019, 294, 111005. [Google Scholar] [CrossRef] [PubMed]
  114. Zorlu, N.; Karavul Ucman, T.; Gelal, F.; Colak Kalayci, C.; Polat, S.; Saricicek, A.; Kurtgoz Zorlu, P.; Gulseren, S. Abnormal white matter integrity in long-term abstinent alcohol dependent patients. Psychiatry Res. 2014, 224, 42–48. [Google Scholar] [CrossRef] [PubMed]
  115. Monnig, M.A.; Tonigan, J.S.; Yeo, R.A.; Thoma, R.J.; McCrady, B.S. White matter volume in alcohol use disorders: A meta-analysis. Addict. Biol. 2013, 18, 581–592. [Google Scholar] [CrossRef] [Green Version]
  116. Crespi, C.; Galandra, C.; Canessa, N.; Manera, M.; Poggi, P.; Basso, G. Microstructural damage of white-matter tracts connecting large-scale networks is related to impaired executive profile in alcohol use disorder. Neuroimage Clin. 2019, 25, 102141. [Google Scholar] [CrossRef]
  117. Day, A.M.; Kahler, C.W.; Ahern, D.C.; Clark, U.S. Executive Functioning in Alcohol Use Studies: A Brief Review of Findings and Challenges in Assessment. Curr. Drug Abus. Rev. 2015, 8, 26–40. [Google Scholar] [CrossRef] [PubMed]
  118. Krueger, R.F.; Hicks, B.M.; Patrick, C.J.; Carlson, S.R.; Iacono, W.G.; McGue, M. Etiologic connections among substance dependence, antisocial behavior, and personality: Modeling the externalizing spectrum. J. Abnorm. Psychol. 2002, 111, 411–424. [Google Scholar] [CrossRef] [PubMed]
  119. Iacono, W.G.; Malone, S.M.; McGue, M. Substance use disorders, externalizing psychopathology, and P300 event-related potential amplitude. Int. J. Psychophysiol. 2003, 48, 147–178. [Google Scholar] [CrossRef]
  120. Moeller, F.G.; Barratt, E.S.; Fischer, C.J.; Dougherty, D.M.; Reilly, E.L.; Mathias, C.W.; Swann, A.C. P300 event-related potential amplitude and impulsivity in cocaine-dependent subjects. Neuropsychobiology 2004, 50, 167–173. [Google Scholar] [CrossRef] [PubMed]
  121. Carlson, S.R.; Thai, S.; McLarnon, M.E. Visual P3 amplitude and self-reported psychopathic personality traits: Frontal reduction is associated with self-centered impulsivity. Psychophysiology 2009, 46, 100–113. [Google Scholar] [CrossRef]
  122. Harmon-Jones, E.; Barratt, E.S.; Wigg, C. Impulsiveness, aggression, reading, and the P300 of the event-related potential. Personal. Individ. Differ. 1997, 22, 439–445. [Google Scholar] [CrossRef]
  123. Gropper, S.; Spengler, S.; Stuke, H.; Gawron, C.K.; Parnack, J.; Gutwinski, S.; Wiers, C.E.; Bermpohl, F. Behavioral impulsivity mediates the relationship between decreased frontal gray matter volume and harmful alcohol drinking: A voxel-based morphometry study. J. Psychiatr. Res. 2016, 83, 16–23. [Google Scholar] [CrossRef]
  124. Lejuez, C.W.; Magidson, J.F.; Mitchell, S.H.; Sinha, R.; Stevens, M.C.; de Wit, H. Behavioral and biological indicators of impulsivity in the development of alcohol use, problems, and disorders. Alcohol. Clin. Exp. Res. 2010, 34, 1334–1345. [Google Scholar] [CrossRef] [Green Version]
  125. Lee, J.Y.; Park, S.M.; Kim, Y.J.; Kim, D.J.; Choi, S.W.; Kwon, J.S.; Choi, J.S. Resting-state EEG activity related to impulsivity in gambling disorder. J. Behav. Addict. 2017, 6, 387–395. [Google Scholar] [CrossRef] [Green Version]
  126. Herrera-Diaz, A.; Mendoza-Quinones, R.; Melie-Garcia, L.; Martinez-Montes, E.; Sanabria-Diaz, G.; Romero-Quintana, Y.; Salazar-Guerra, I.; Carballoso-Acosta, M.; Caballero-Moreno, A. Functional Connectivity and Quantitative EEG in Women with Alcohol Use Disorders: A Resting-State Study. Brain Topogr. 2016, 29, 368–381. [Google Scholar] [CrossRef]
  127. Uddin, L.Q.; Supekar, K.; Menon, V. Reconceptualizing functional brain connectivity in autism from a developmental perspective. Front. Hum. Neurosci. 2013, 7, 458. [Google Scholar] [CrossRef] [PubMed] [Green Version]
  128. Uddin, L.Q. Complex relationships between structural and functional brain connectivity. Trends Cogn. Sci. 2013, 17, 600–602. [Google Scholar] [CrossRef] [PubMed] [Green Version]
Figure 1. Seed regions of the DMN consisting of 6 regions in the left hemisphere (blue beads) and 6 homologous regions in the right hemisphere (red beads), as listed in Table 1. Axial (top), coronal (front), and sagittal (left side) views are shown. (PCC–Posterior cingulate cortex; ACC–Anterior cingulate cortex; IPL–Inferior parietal lobule; PFC–Prefrontal cortex; LTC–Lateral temporal cortex; PHG–Parahippocampal gyrus; L–Left; R–Right; A–Anterior; P–Posterior; S–Superior; I–Inferior).
Brainsci 10 00115 g001
Figure 2. The multi-way importance plot showing the top significant variables (labelled and marked with black circles) that contributed to the classification of AUD from CTL individuals based on the following measures: the Gini decrease, the number of trees, and the p-values. Fourteen DMN connections, two neuropsychological variables, and all four impulsivity scores were significant (circled and labelled red and green dots). BIS–Barratt Impulsivity Scale; MI–Motor impulsivity; NP–Non-planning; AI–Attentional impulsivity; Tot–Total; Span_Fw–Span forward; TotCor_Fw–Total correct forward; s1-s12–DMN seeds 1-12 as listed in Table 2.
Brainsci 10 00115 g002
Figure 3. The distribution of minimal depth among the trees of the forest for the significant variables is shown in different colors for each level of minimal depth. The mean minimal depth in the distribution for each variable is marked by a vertical black bar overlapped by its value inside a box. A lower mean minimal depth of a functional connectivity (FC) variable represents a higher number of observations (participants) categorized in a specific group on the basis of the variable. The top significant variables (14 DMN connections, two neuropsychological scores, and all four BIS scores) followed the same rank in the plot as in Table 3, which is ordered based on p-values.
Brainsci 10 00115 g003
Figure 4. Illustration of rankings of variables based on any of the two RF parameters of importance (inside the left and bottom panels showing distribution of the rankings of all predictor variables marked with black dots along a blue trend line) as well as the respective correlation coefficients across rankings of any two parameters (inside the right and top panels). It is shown that all RF parameters of importance were found to have very high correlations among each other, suggesting that these parameters are highly reliable at ranking the importance of variables in group classification.
Brainsci 10 00115 g004
Figure 5. Significant DMN connections that contributed to the Random Forest classification of AUD from CTL individuals based on importance parameters including the p-value (p < 0.01), as listed in Table 3. These connections (i.e., edges) across the seed regions (i.e., nodes) within an anatomical brain template are shown: (A) axial (top) view; (B) coronal (front) view; and (C) sagittal (left side) view. The blue and red beads represent left and right-sided nodes, respectively, and the edges in orange and cyan lines represent hyper- and hypo-connectivity, respectively, in the AUD compared to the CTL group.
Brainsci 10 00115 g005
Figure 6. Correlation matrix showing associations among the top significant variables. The values within each cell represent the bivariate Pearson correlation between the variable on its vertical axis and the variable on its horizontal axis. The correlation values are color coded (red/pink shades represent negative r-values, blue/cyan shades indicate positive r-values, darker shades represent relatively higher magnitudes) and significant correlations have been marked with asterisks (*p < 0.05; **p < 0.01; and ***p < 0.001).
Brainsci 10 00115 g006
Table 1. Demographic and clinical characteristics of the sample.
VariableAUDCTL
n *MeanSDn *MeanSD
Age (in years)3041.427.313027.444.74
Education (in Years)3011.932.353015.771.87
Age of onset (regular alcohol use)3015.772.581220.503.80
Alcohol: Drinks/day (heavy alcohol use period)3012.0810.02122.881.93
Alcohol: Days/month (heavy alcohol use period)3020.309.01123.353.64
Alcohol: Drinks (last 6 months)302.686.61182.611.98
Alcohol: Days (last 6 months)303.978.02182.943.62
Length of Abstinence (in months)3022.4328.16181.94.99
Tobacco: Times/day (last 6 months)209.905.8062.331.63
Tobacco: Days/month (last 6 months)2028.354.83614.1713.82
Marijuana: Times in last 6 months1098.8091.38418.7527.61
* n refers to the number of subjects included in these mean and SD calculations for each variable. Individuals who did not consume alcohol or drugs were not included in the respective calculations.
Table 2. Default Mode Network (DMN) seed regions and the Montreal Neurological Institute (MNI) coordinates, as referenced from the exact Low Resolution Electromagnetic Tomography (eLORETA) software.
SeedRegion NameRegion CodeBAMNI (X)MNI (Y)MNI (Z)
s1Left posterior cingulate cortexL.PCC23−10−4525
s2Right posterior cingulate cortexR.PCC2310−4525
s3Left anterior cingulate cortexL.ACC32−104510
s4Right anterior cingulate cortexR.ACC32104510
s5Left inferior parietal lobuleL.IPL40−55−5520
s6Right inferior parietal lobuleR.IPL4055−5520
s7Left prefrontal cortexL.PFC46−452525
s8Right prefrontal cortexR.PFC46452525
s9Left lateral temporal cortexL.LTC21−55−15−20
s10Right lateral temporal cortexR.LTC2155−15−20
s11Left parahippocampal gyrusL.PHG36−25−30−20
s12Right parahippocampal gyrusR.PHG3625−30−20
Table 3. Random Forest (RF) importance parameters (mean minimal depth, number of nodes, number of trees, times a root, accuracy decrease, Gini decrease, and p-value) and the direction of significance for the top significant variables (p < 0.05) are shown. All significant variables that were important to classify individuals into either the alcohol use disorder (AUD) group or the control (CTL) group have been listed. The order of these listed variables is based on p-values.
VariableMean Minimal DepthNo. of NodesNo. of TreesTimes a RootAccuracy DecreaseGini Decreasep ValueDirection
BIS_Total1.0000118115500.02652.0285<0.0000AUD > CTL
BIS_NP1.4343114110450.01561.4792<0.0000AUD > CTL
BIS_MI1.6723110106270.01171.4611<0.0000AUD > CTL
s1–s5 (L.PCC–L.IPL)2.0023103101270.00621.0920<0.0000AUD > CTL
s4–s8 (R.ACC–R.PFC)1.782910098330.00511.2818<0.0000AUD > CTL
s3–s7 (L.ACC–L.PFC)2.39307574250.00800.9634<0.0000AUD > CTL
s2–s4 (R.PCC–R.ACC)2.9542726870.00300.6109<0.0000CTL > AUD
BIS_AI2.92776463180.00420.63160.0019AUD > CTL
s1–s8 (L.PCC–R.PFC)3.1205636180.00040.50230.0029CTL > AUD
s6–s9 (R.IPL–L.LTC)3.0683626190.00390.59940.0044CTL > AUD
Span_Fw (VST)2.73086259290.00590.76700.0044CTL > AUD
TotCor_Fw (VST)2.76566259240.00830.74810.0044CTL > AUD
s1–s4 (L.PCC–R.ACC)2.86486160160.00220.69030.0065CTL > AUD
s2–s5 (R.PCC–L.IPL)3.1569615913-0.00060.52760.0065AUD > CTL
s3–s9 (L.ACC–L.LTC)3.13596158120.00070.54590.0065CTL > AUD
s4–s9 (R.ACC–L.LTC)3.1395615950.00320.44230.0065CTL > AUD
s8–s10 (R.PFC–R.LTC)3.1983575613-0.00090.59010.0268CTL > AUD
s3–s4 (L.ACC–R.ACC)3.3493565230.00070.33130.0368AUD > CTL
s5–s8 (L.IPL–R.PFC)3.3390565430.00030.37920.0368CTL > AUD
s7–s10 (L.PFC–R.LTC)3.2817565570.00220.47460.0368CTL > AUD
L–Left; R–Right; PCC–Posterior cingulate cortex; ACC–Anterior cingulate cortex; IPL–Inferior parietal lobule; PFC–Prefrontal cortex; LTC–Lateral temporal cortex; VST–Visual Span Test.
Table 4. Correlations between the age of the participant and the significant variables in each group and the total sample.
VariableAUDCTLALL §
rprprp
BIS_AI0.10060.5970−0.13710.46990.01960.8829
BIS_MI0.23460.21210.11560.54320.19930.1302
BIS_NP0.02550.89360.21040.26440.09260.4854
BIS_Tot0.13890.46430.10600.57720.12740.3363
s1–s4 (L.PCC–R.ACC)−0.24290.1958−0.19150.3107−0.22620.0849
s1–s5 (L.PCC–L.IPL)−0.13800.4669−0.01080.9547−0.09100.4932
s1–s8 (L.PCC–R.PFC)−0.22730.22700.04880.7979−0.12450.3475
s2–s4 (R.PCC–R.ACC)−0.28340.1291−0.14910.4315−0.23170.0774
s2–s5 (R.PCC–L.IPL)−0.18360.3316−0.06770.7223−0.13140.3212
s3–s4 (L.ACC–R.ACC)−0.26580.15570.37900.0389 *−0.09140.4910
s3–s7 (L.ACC–L.PFC)0.00330.98600.02270.90510.00980.9415
s3–s9 (L.ACC–L.LTC)0.24210.19740.18600.32510.22320.0892
s4–s8 (R.ACC–R.PFC)0.02420.8991−0.03230.86550.00490.9703
s4–s9 (R.ACC–L.LTC)−0.04950.79520.12760.50160.00720.9570
s5–s8 (L.IPL–R.PFC)−0.20070.28760.18770.3206−0.08500.5222
s6–s9 (R.IPL–L.LTC)−0.32330.0814−0.26040.1646−0.29560.0230 *
s7–s10 (L.PFC–R.LTC)−0.17320.36020.19740.2957−0.06290.6362
s8–s10 (R.PFC–R.LTC)−0.07450.6957−0.10710.5732−0.08360.5290
Span_Fw (VST)−0.39380.0313 *−0.04290.8219−0.23930.0679
TotCor_Fw (VST)−0.41780.0216 *−0.02310.9038−0.23830.0692
L–Left; R–Right; PCC–Posterior cingulate cortex; ACC–Anterior cingulate cortex; IPL–Inferior parietal lobule; PFC–Prefrontal cortex; LTC–Lateral temporal cortex; VST–Visual Span Test. (*, p < 0.05; §, Based on partial correlation adjusted for group effect).

