
Nestling Diet of Two Sympatric Insectivorous Passerines in Different Habitats—A Metabarcoding Study
by
 , ,
, ,
Daniel Höhn
1,
Juan F. Masello
1,
Marc N. Kümmel
2,
Sven Griep
2,
Alexander Goesmann
2 and
Petra Quillfeldt
1,* 1
Department of Animal Ecology & Systematics, Justus Liebig University, Heinrich-Buff-Ring 26, 35392 Giessen, Germany
2
Department of Bioinformatics & Systems Biology, Justus Liebig University, Heinrich-Buff-Ring 58, 35392 Giessen, Germany
*
Author to whom correspondence should be addressed.
Birds 2024, 5(1), 67-89; https://doi.org/10.3390/birds5010005
Submission received: 23 August 2023
/
Revised: 2 January 2024
/
Accepted: 9 January 2024
/
Published: 23 January 2024
(This article belongs to the Special Issue Feature Papers of Birds 2022–2023)
Abstract
:Simple Summary
In everchanging landscapes with intense land use for agriculture, forestry and settlements, songbirds need to adapt their feeding and breeding behaviour according to changing habitats and food supplies. Blue and Great Tits occur in various habitats from forest to park-like sites and strongly rely on caterpillars to feed their offspring. Using genetic analyses of Blue and Great Tit droppings, we compared the diet composition of nestlings among forest, urban parks, and meadows with scattered fruit trees (traditional orchards). Additionally, we compared the food availability in the trees of each habitat to the respective nestling diets. Both bird species showed a diverse diet dominated by butterflies in all habitats. Moth components in the diet were most similar between forest and orchard sites, while components of other insect-like prey were most similar between orchard and urban sites. Both bird species especially selected three major moth families at all sites and alongside two families of sawflies in the orchard and forest sites. Our results on nestling diet and prey preferences provide further insights in the feeding behaviours of Blue and Great Tits among changing anthropogenic landscapes. Moreover, our genetic approach using bird droppings provides a baseline to support insect monitoring.
Abstract
Increasing landscape transformations and urbanisation affect insectivorous bird populations in various ways such as food availability, breeding phenology, or reproductive success. Especially during the breeding season, many passerine birds rely on the availability of caterpillars as the main prey for their nestlings. Previous studies suggested that similar diet preferences of sympatric species may result in interspecific competition, as demonstrated for Blue and Great Tits in forest habitats. However, nestling diet and prey preferences in other habitats are not fully understood. Prey availability, especially caterpillars, is lower in cities than in forests, thus influencing prey choice and interspecific competition. Here we used faecal DNA metabarcoding to investigate if nestling diet composition of the two sympatric species Blue Cyanistes caeruleus and Great Tits Parus major varied among species and different habitats (forest, traditional orchards, and urban parks). Furthermore, we examined food availability by DNA barcoding of the arboreal arthropod communities among habitats and compared them to the nestling diet to infer parental prey selectivity. The study was carried out in central Germany from 2018 to 2019. Blue and Great Tits showed a diverse diet which was dominated by Lepidoptera in all habitats. Lepidopteran diet components were most similar between forest and orchard sites, as were the components with other arthropods between orchard and urban sites. Both tit species showed selectivity for the lepidopteran families Geometridae and Tortricidae in all habitats, and for Noctuidae (Lepidoptera), Tenthredinidae and Braconidae (Hymenoptera) in forest and orchard sites. As the tits showed preferences for mainly families of Lepidoptera, and Hymenoptera, our approach provides a baseline to support monitoring of these groups.
1. Introduction
Intensified land use in agriculture and forestry are considered the main cause of global change and biodiversity loss through the conversion of complex natural ecosystems to simplified ecosystems [1,2]. Intense land use has caused declines in biodiversity through the loss, modification, and fragmentation of habitats [3]. The reduction in plant species richness that follows intensive agriculture results in changes in the community composition, particularly among herbivorous insects and their natural predators [4].
In recent years, widespread declines in insect fauna have occurred around the world, which could cause the extinction of 40% of the world’s insect species within a few decades [5,6]. These declines were also apparent in Germany, where a decrease of 76% in flying insect biomass in protected areas was observed between 1989 and 2016 [7]. In grasslands and forests, arthropods declined markedly not only in abundance and number of species, but also in overall biomass [6]. Recent research indicates that the main drivers of terrestrial insect declines are consequences of agricultural intensification combined with adversely synergistic factors like climate change and an increase in urbanisation, or biological factors like pathogens and introduced species [5,8]. While the recent worldwide declines not only concern specialists, but also generalist and common insect species, it is anticipated that the loss of insect diversity and abundance could provoke cascading effects on food webs and threaten ecosystem services [5,7]. Most European birds feed on insects and occasionally on other invertebrates, especially during the breeding season when they feed their nestlings [9,10,11]. As a result, the decline in insects also affects insectivorous bird guilds. Population trends in Germany showed that bird species that feed on small insects and spiders are particularly affected by population declines, notably migratory species [10]. Across Europe, 13% of insectivorous birds declined in the period 1990–2015, which was associated with agricultural intensification and loss of grassland habitat [11].
Increasing urbanisation has caused some wild bird species to adapt to urban habitats and colonise both urban and natural habitats [12,13]. However, the ecological conditions differ from their natural environments. Urban birds are challenged by fragmented habitats, different tree species composition, human disturbance, altered microclimates and different feeding conditions, in particular lower arthropod prey availability [12,14,15].
Great Tits Parus major and Blue Tits Cyanistes caeruleus are two species that breed in both, natural and man-made habitats. Both tit species are common insectivorous passerine birds of the Western Palearctic, which nest in cavities. They are suitable bird models for long-term studies due to their propensity to breed in nest boxes [16,17,18]. Blue Tits compete with Great Tits for breeding cavities and are suppressed by Great Tits when cavity supply is scarce [17]. Apart from nesting sites, Blue and Great Tits also compete for similar food resources [17,19,20]. Both species are almost entirely insectivorous during the breeding season and feed their offspring mainly with Lepidopteran larvae and Araneae [21,22,23]. Lepidoptera belong to the most important tree defoliating insects and are often seen as pests when occurring in high densities [24,25]. Insectivorous predators like tits serve as natural pest control while functioning as a stabilizing factor in endemic insect densities [24,26]. Since tits have large broods, they need plentiful of food supplies for their nestlings [27,28]. Both Great and Blue Tits are foliage-gleaners and forage mainly on twigs, buds and leaves during breeding season [29,30]. While both tits prefer large caterpillars, Blue Tits switch to smaller but more abundant caterpillars when competing for food with Great Tits [31]. However, when caterpillar food supply is scarce, both species feed their nestlings additionally with other arthropods. In this case, Great Tits feed their nestlings also with Araneae or imagos of Lepidoptera and Diptera, while Blue Tits switch to Araneae and Hemiptera [16,17]. Particularly in early nestling stages, tits feed Araneae to their offspring [22,32,33]. Though both tit species compete for similar resources, they continuously co-exist in various habitats.
Previous studies that observed differences in breeding success between forest and urban sites linked the lower reproductive success in urban sites to lower prey availability [34,35,36] (but see also [37]). To measure the availability of caterpillars in the field, frass drop counts using caterpillar faeces to estimate their biomass per leaf area following Fischbacher et al. [38] have been used as a standard method [35,39]. Moreover, collecting arthropods from trees or branches has been applied in several studies to assess prey availability [22,38,40]. Common methods to study the diet of tit nestlings include camera recordings [16] or collecting prey items directly from the chicks using neck-collars to prevent them from swallowing [23,41,42]. The neck collar method was applied as a standard method for many years [41]. But the method is rather invasive and according to observations tit parents tend to remove larger prey from the gullet when it is prevented from swallowing [32]. As neck collar samples and faecal samples can provide similar results, faecal samples are more recommended as they are a less-invasive and easily accessible method [43]. Despite that, neck collar samples showed a lower detectability of, e.g., Hymenoptera, than faecal samples [43]. When using camera recordings, most studies determined prey items either to family or to order level while some items could not be determined [44,45,46].
The emergence of next-generation sequencing and metabarcoding of faecal DNA enables a non-invasive method for analysing the diet composition of generalist predators on a fine taxonomic resolution [47,48,49]. In recent years, these molecular methods have been broadly used to analyse the diet composition of various vertebrates like mammals [48,50,51], fish [52] or birds [53,54,55]. Most recently, metabarcoding has been used to identify arthropod prey of tits in Finnish mixed forest [56], in urban and forest sites [57] and in adults prior to breeding [58]. Metabarcoding furthermore provides a method to analyse food webs by examining available and consumed prey [56]. Moreover, it has been suggested, that the faeces of generalist predators can serve as ‘biodiversity capsules’, as they may contain a representative sample of the potential prey occurring in the foraging area [59]. In this study, we analysed the bird–insect food webs of Blue and Great Tit nestlings in different habitats to reflect parental foraging choices in response to differences in arthropod diversity and abundance. Furthermore, we examined whether tits could serve as bio-diversity capsules to monitor the arthropod diversity in their breeding habitats considering global insect decline. To achieve this, we analysed faecal samples through metabarcoding and tested whether the diet differs among habitats and between tit species. In particular, we studied the following hypotheses: (1) the arthropod prey differs in diets of Blue and Great Tits; (2) the prey differs among habitats (forest, orchards and urban sites), and (3) the diet composition in tit faecal samples reflects the prey availability on trees.
2. Materials and Methods
2.1. Study Sites and Nest Boxes
We conducted this study over two consecutive breeding seasons (2018–2019) on nest-box breeding tit populations in different habitats within and close to the city of Giessen (Hesse, Germany; 50°35′0″ N, 8°40′0″ E; Figure 1). Giessen is in the centre of Hesse along the course of the river Lahn, a geographical region of forested low mountain ranges with a humid–temperate climate. The city covers an area of roughly 73 km2 with around 94,000 inhabitants and a population density of 1300/km2.
The nest boxes were installed in forest and urban habitats in 2013. The nest boxes in the traditional orchards were added in 2014 and consist of four sites of extensively managed meadows with scattered fruit trees (i.e., traditional orchard or ‘Streuobstwiesen’ habitats, hereafter called ‘orchard sites’). The subplots of the study sites varied in tree density (see Figure S1); therefore, plots of the same habitat type were pooled to analyse habitat differences. The forest sites, 20 hectares in total, are located 3.5 km south of Giessen at the foot of the local mountain Schiffenberg in a forest matrix; and bisected by a road. The sites consist of managed mixed deciduous forest dominated by Common Beech Fagus sylvatica interspersed with scattered trees of Common Oak Quercus robur, Common Hornbeam Carpinus betulus, Scots Pine Pinus silvestris, Cornish Oak Quercus petraea and Silver Birch Betula pendula. The site includes scattered wet patches with small ponds and dense understory of young trees or shrubs like Common Hawthorn Crataegus monogyna or Blackthorn Prunus spinosa.
The orchard sites are located 7–14 km away from Giessen in a matrix between urban periphery and arable land and within the districts of the neighbouring town of Pohlheim. They cover a total area of 10 hectares dominated by cultivated forms of Apple Malus domestica and in parts by Sweet and Sour Cherries Prunus avium and P. cerasus. Apple and other fruit trees are interspersed with Common Plum Prunus x domestica, Common Walnut Juglans regia and Horse-chestnut Aesculus hippocastanum. The grassland below the fruit trees was extensively grazed by sheep, no pesticides were used. The edges of the managed meadows are lined with small groups of hedges with shrubs like Common Hawthorn or Blackthorn.
The urban habitats investigated in Giessen included the botanical garden of the university (3.2 ha), an urban park formerly used as a cemetery (8.3 ha) and the university campus of natural sciences (9.5 ha). These sites cover an area of 21 hectares in total and are frequently used by passersby. The urban habitats are arranged as parks that include local tree species like beech F. sylvatica spp., Common and Cornish Oak, Silver Birch, or poplars Populus sp. and non-native tree species like London Plane Platanus x acerifolia, or Northern Red Oak Quercus rubra. Trees are interspersed with groups of cultivated shrubs like Forsythia x intermedia, Rhododendron sp. or Ilex aquifolium. The botanical garden and the urban park have a variety of non-native coniferous and deciduous tree species. Furthermore, the campus of natural sciences is the only urban habitat that also contains cherry and apple trees. The botanical garden and the urban park are located in the centre of the city, while smaller green spaces, tree groups and gardens create steppingstones within the urban matrix. The university campus is located at the southern edge of the city in an ~380 m vicinity to the woodland and natural reserve Bergwerkswald. In addition, there are further managed green spaces and an isolated patch of arable land on the eastern side of the campus beyond an intersecting road.
The weather during the two-year period was similar in April (incubation), with mean temperatures of 12.4 °C (2018) and 10.1 °C (2019). This was 4 °C and 2 °C above the long-term mean [60]. May (chick-rearing) temperatures had mean values of 16.0 °C (2018) and 11.2 °C (2019). Thus, 2019 was warmer (4 °C), while 2018 was slightly colder (1 °C) than the long-term mean. Precipitation was slightly below average, except in May 2019, when 40% more precipitation than on average was registered [60].
2.2. Faeces Collection and DNA Extraction from Faeces
We inspected nest boxes at least once a week during the breeding season from 20 March until the last broods fledged in late June/early July to obtain parameters of breeding phenology. Chicks were individually marked with aluminium rings and measured for other study purposes. While taking measurements, we collected faecal samples mainly from spontaneous defecation in the hand. The faeces of tit nestlings are excreted as a faecal sac with a thin membrane layer that coats faeces and urine. In this study, we collected faecal sacs of chicks aged 5–15 days during the breeding seasons in 2018 and 2019. Before and after handling, the chicks were kept briefly in cloth bags to reduce stress levels. After the handling of each nest, we checked for defecation in the cloth bags and collected potential droppings as well. To avoid contaminations by previous defecations, we used a clean bag for each nests. The faecal samples were immediately transferred to centrifuge tubes and stored in a cooling bag with cold packs to prevent DNA degradation. After a maximum of 3 h, the faecal samples were stored in a cold chamber at −20 °C until DNA extraction. Analysed samples in this study were collected from the end of April until the beginning of July, but mainly during May.
We extracted DNA from faecal samples using QIAamp® Fast DNA Stool Kit Mini from Qiagen (Venlo, The Netherlands) according to a slightly adjusted extraction protocol. Extracted DNA was eluted and stored in 50 µL Qiagen ATE buffer solution (Tris-CL 10 mM, EDTA 0.1 mM, NaN3 0.04%).
2.3. Primer Performance and Selection
We tested two arthropod-specific primers for metabarcoding with Illumina. Both approaches designed primers to target short fragments of the mitochondrial cytochrome c oxidase subunit 1 (CO1) barcode region for amplification of presumably degraded mtDNA in faeces (see Table S3). Zeale et al. [48] used the primer set ZBJ-ArtF1c/ZBJ-ArtR2c (hereafter ZBJ-Art) to determine arthropod prey in bats. Jusino et al. [61] employed a new primer set LCO1490/CO1-CFMRa (hereafter ANML) but tested both primer sets with Ion Torrent NGS technology. According to Jusino and colleagues [61], the ANML primer set showed a higher success rate in identifying different arthropod groups than the primers ZBJ-Art.
We analysed 16 faecal samples corresponding to the breeding season 2018 with the two primer pairs ZBJ-Art and ANML. Due to filtering steps to avoid false positives and contamination (see Data processing), only 15 samples were left for further analysis in the repeated run with ANML. Within the 15 samples, using ZBJ-Art, we found 10 species belonging to two taxonomic orders, and using ANML, 18 species belonging to six orders (Figure S2). Most of the identified species belonged to the order Lepidoptera (ZBJ-Art 9 species; ANML 10 species). The taxonomic resolution at species level (i.e., the ratio of taxa at the species level to the total number of identified taxa) was higher for ANML (100%) than for ZBJ-Art (71%). Despite the similar number of Lepidoptera species, most identified taxa differed between the two primer sets and only two Lepidoptera taxa were determined in both approaches. Moreover, the sample size of faeces processed with ZBJ-Art primers was reduced due to sequencing and filtering steps, especially regarding the Blue Tit samples (Table S4). Hence, we selected ANML for further DNA amplification.
2.4. PCR Amplification of Prey DNA from Faeces
For the first amplification step we used the ANML primer set with attached adapters (P5, P7) for Illumina Sequencing. We performed PCR amplifications in single reactions using 2 × GoTaq® Long PCR Master Mix (Promega, Madison, WI, USA) for primers with a reaction volume of 20 µL. Reaction mix included 10 µL GoTaq® Long PCR Master Mix, 2 µL of each primer (10 µM), 2 µL template and 4 µL of water for molecular biology (conditions see Table S3). PCR success was checked for all samples using capillary electrophoresis (QIAxcel Advanced system, Qiagen N.V., Venlo, The Netherlands).
2.5. DNA Purification, Index PCR and Sequencing
To remove unincorporated primers and nucleotides from PCR reactions, PCR products were purified using the Illustra™ ExoproStar 1-Step Kit (Cytiva Global Life Sciences Solutions USA LLC, Marlborough, MA, USA) according to the provided protocol. After purification, we performed index PCRs to mark sequences individually with specific dual indices (i5, i7) which were added to adapters. PCR was again performed in single reactions with a reaction volume of 25 µL. The reaction mix consisted of 12.5 µL 2 × GoTaq® Long PCR Master Mix (Promega), 2.5 µL of index primer i5 (10 µM), 2.5 µL of index primer i7 (10 µM), 2.5 µL template and 5.0 µL of water for molecular biology. Thermal cycling conditions for index PCR were 95 °C for 3 min, followed by 8 cycles of: 95 °C for 30 s, 55 °C for 30 s and 72 °C for 30 s, and final extension at 72 °C for 5 min.
We performed a final clean-up and normalisation step for the products of index PCR with SequalPrepTM Normalization Plate (96) Kit (Invitrogen, San Diego, CA, USA). We then used 2 µL of the normalised samples for the NGS library. Finally, the NGS library was sequenced on a MiSeq desktop sequencer using 250-bp paired-end reads (Illumina, San Diego, CA, USA) at SEQ-IT GmbH & Co., KG (Kaiserslautern, Germany).
2.6. Arthropod Samples from Trees
In each habitat, we cut 2–3 branches of 1 m length from trees during the nestling period in 2019 (5 trees in the forest, 6 in the habitats with more diverse tree species, Table S2). Samples were taken from predominant tree species in each habitat: Common Beech and oaks in forest sites. In the orchard sites, we collected branches from cherry and apple trees. In urban sites, we sampled from Broad-leafed Lime Tilia platyphyllos, Pedunculate Oak, Silver Birch, Silver poplar, cherry, and apple trees. The nest sites and samples trees were close to each other, and not close to a habitat edge. Before cutting, branches were covered with a 120 L plastic bag to prevent arthropods from falling off the branch. After branch collection, plastic bags were knotted tight and either directly examined in the lab or stored overnight in 4 °C cooling chamber to slow down insect metabolism and mobility. In such cases, the branches were then examined for arthropods the following day. In the laboratory, all arthropods were collected from branches and pre-sorted into three categories (I) caterpillars (including Symphyta larvae), (II) Araneae and (III) other arthropods. Subsequently, collected samples of each category were sorted into parataxonomic units (PU) based on easily recognisable morphological features see [62]. If possible, PUs were already determined to species level or to a higher taxonomic level using a stereo microscope.
As recommended by Emerson et al. [62], we used four samples of each PU in each habitat as representatives for genetic analysis. In case a PU contained less than four samples, we took the maximum number available. Samples were analysed genetically using a barcode region for mitochondrial DNA (mtDNA) sequencing in the cytochrome oxidase subunit 1 (CO1) gene. We extracted DNA of selected PUs according to protocol based on Martínez et al. [63] with around 25 mg of arthropod tissue. For insects, we used abdominal segments to reduce bacterial contamination from the digestive tract. Regarding Araneae, we used 1–2 legs for the DNA extraction. Tiny arthropods that weighed around 25 mg like Aphididae, nymphs or tiny Araneae were used as whole. During extraction DNA was precipitated with ammonium acetate and nucleic acids were purified using NZYGelpure purification kit (NZYTech, Lisbon, Portugal). DNA was finally eluted in 50 µL AE buffer (10 mM Tris-Cl, 0.5 mM EDTA, pH 9.0; Qiagen, Venlo, The Netherlands). We amplified DNA with standard PCR in single reactions in a 20 µL total PCR volume containing 10 µL innuMIX Standard PCR MasterMix (Analytik Jena, Jena, Germany), 2 µL of purified water, 1 µL of a 10 µM aliquot of each primer and 2µL DNA template. Initially we used primers ZBJ-ArtF1c and ZBJ-ArtR2c (see [48]). For negative PCRs we subsequently used either primers LCO1490/HCO2198 (see [64]) or primer set ANML: LCO1490/CO1-CFMRa (see [61]). PCR was carried out under the following conditions: Initial denaturation at 95 °C for 3 min; repeated 35 cycles (denaturation at 94 °C for 30 s, primer annealing at 53 °C for 30 s and primer extension at 72 °C for 30 s) and final extension at 72 °C for 10 min. For primers LCO1490/CO1-CFMRa we adjusted the primer-annealing temperature to 46 °C. PCR success was checked using capillary electrophoresis of the QIAxcel Advanced system. Positive PCR products were Sanger-sequenced with both the forward and reverse primers by MicroSynth SeqLab (Göttingen, Germany). The sequences were examined and edited with CLC Main Workbench v. 7.6.4 (Qiagen N.V.). Forward and reverse sequences were assembled, ambiguous or mismatched nucleotides were edited, and consensus sequences were created. In case consensus sequences could not be created, single-strand sequences were edited in the same way and the sequence with least nucleotide mismatches was used for species identification.
We used the National Center for Biotechnology Information (NCBI) nucleotide BLAST algorithm [65] to match PU sequences to reference sequences in the NCBI GenBank nucleotide database. We determined PUs to species level only with a BLASTn assignment match greater than or equal to 98%. Otherwise, higher taxonomic level was determined for the respective sample. We classified PU groups as determined if (a) at least two samples were analysed until nucleotide BLAST and showed the same taxon or (b) if most of the analysed PUs were identified as the same taxon (see Table S5). If only one out of several PU samples could be identified with nucleotide BLAST or if taxa within a PU were mixed, we categorised them as ambiguous PUs (see Table S6). For PUs where amplification failed, no proper sequences were created or none of the analysed samples could be determined, we considered those PUs as ‘not identifiable’. Additionally, samples where only endoparasites were matched in BLASTn were also considered as ‘not identifiable’.
2.7. Data Processing—Bioinformatic Analyses of Sequences from Faecal Samples
As previously described [66], we used a custom workflow in GALAXY [67,68]) to transform the raw Illumina sequence data into a list of molecular operational taxonomic units (MOTUs) with assigned taxonomy. These steps included: assessing sequence quality with FASTQC [69], adapter and quality trimming of the paired-end reads with TRIMMOMATIC (minimum quality score of 20 over a sliding window of 4 bp [70]; merging of the overlapping paired-end read pairs using FLASH [71], converting sequence files to FASTA with the FASTX-Toolkit (http://hannonlab.cshl.edu/fastx_toolkit, accessed on 22 August 2023), and extracting amplicons in MOTHUR [72]. We used USEARCH [73] to delete identical replicates (dereplicate; derep_fulllength), to detect and remove chimeric sequences (uchime_denovo) and to cluster sequences into MOTUs. We applied a filtering step for index reads with a quality score threshold of 26 to reduce index misassignments and thus sample crosstalk as recommended by Wright & Vetsigian [74]. Using the BLASTn algorithm [65] we matched MOTU sequences to reference sequences in the NCBI GenBank database, using a cut-off of 90% minimum sequence identity and a maximum e-value of 0.00001. After that, we discarded MOTUs that corresponded to regular fieldwork contaminants in faecal samples, such as bacteria, soil fungi, human or predator DNA [55]. MOTUs were accepted in a sample only if they contained a minimum of five sequences. Taxonomic assignment was based on the percentage similarity of the query and the reference sequences. We only retained sequences with a BLASTn assignment match greater than 98% [55].
Next, we proceeded with additional filtering steps to avoid false positives or possible contamination and to obtain more reliable data as described by [75]: We discarded all sequences for which the total number of counts was less than 1% of the most common sequence. Additionally, we also discarded sequences where the number of counts per sample was always lower than 10. Following these filtering steps, we checked the distribution ranges of the detected taxa based on the Global Biodiversity Information Facility (GBIF) and Fauna Europaea. For taxa whose distribution was out of range (e.g., in the United States), we selected the next higher taxonomic level with distribution in Germany. Besides positive samples, also non-template controls (NTCs) were prepared and sent in for sequencing. Subsequently, the reads of analysed samples were adjusted in data-processing steps according to NTC reads to control for potential contamination. The reads in each sample were only accepted if they were at least double the reads of NTCs, otherwise they counted as zero. Thus, following these filtering steps, the sample size was slightly reduced (Table 1). For a distribution among the study sites of each habitat, see Table S1a.
2.8. Data Processing—Statistical Analyses and Biodiversity Indices
Statistical analyses were conducted with R [76]. In this study we pursued a conservative approach with qualitative data (presence only), as sequencing reads do not necessarily reflect relative quantities of consumed prey [49,53]. Based on this approach, Fisher’s exact tests were performed to compare frequencies in the occurrence of prey items in diet.
We analysed differences in diet composition among habitats and species by first comparing biodiversity indices. Hence, we calculated Shannon diversity (H’) and evenness (E) to measure the diversity of ingested prey taxa [77]. Furthermore, we compared diet composition among habitats and between bird species with Jaccard similarity index (CCJ) on family and species level [78]. In a second approach, we tested for differences in diet composition with permutation tests in the R package VEGAN [79]. For the visualisation of habitat differences in arthropod communities and diet compositions, we applied non-metric multidimensional scaling (NMDS, function metaMDS in the R package VEGAN). NMDS uses rank orders to combine information from multiple dimensions into, usually, two dimensions, in order to be visualised and interpreted. This method is considered as the most reliable, unrestricted ordination method in community ecology [80,81]. The function metaMDS permitted us to inspect the agreement between the two-dimension configuration and the original configuration through a stress parameter. If the stress is <0.05 the agreement is excellent, <0.1 is very good, and <0.2 is a good representation. All stress values in the present tests were ≤0.2. We performed permutational multivariate analysis of variance using distance matrices (PERMANOVA) using the function adonis. Nest was included as a fixed factor in the models. We checked for the multivariate homogeneity of group dispersions (variances) with the function betadisper. All p-values in the present tests were >0.05, suggesting that the assumption of homogeneity of group dispersion was met. PERMANOVA were performed to detect differences in diet composition among habitats and nests. We estimated parental prey preferences using Manly’s resource selection index and the relative selectivity measure Bi [82]. The resource selection function (wi = used/available) and the used and available proportions were calculated for each habitat and species using the function widesI in the adehabitatHS 0.3.15 package in R with data type design I [83]. Groups that were found either only in diet or in tree samples were not included in the analyses of a given habitat or tit species. Selectivity was assumed when Manly’s resource selection index was greater than 1 and the proportion used exceeded the proportion available.
3. Results
Overall, we found 93 arthropod taxa in the faecal samples of Blue (n = 56) and Great Tit (n = 57) nestlings with a taxonomic resolution on species level of 98% (detected taxa see Tables S8 and S9). We detected 85 taxa within 56 samples in the diet of Blue Tit and 76 taxa in 57 samples of Great Tit nestlings.
3.1. Diet Compositions of Nestlings
We found seven different arthropod orders for both tit species (Lepidoptera, Hymenoptera, Araneae, Diptera, Hemiptera, Coleoptera and Orthoptera) and one additional species of Neuroptera for Great Tits. The prey communities of Blue and Great Tit nestlings showed similar Shannon diversities (H’) in each habitat, with high evenness (E > 0.85) (Table S9).
Lepidoptera was the most common arthropod order which was detected in all faecal samples (FO = 100%). The most frequent Lepidoptera families were Lasiocampidae, Geometridae, Tortricidae and Noctuidae (Table 2). The most frequent species in the diet across all habitats was the Lackey Moth Malacosoma neustria (Lasiocampidae, FO > 50% in all cases). We detected two Lepidoptera species listed on the Red List of Germany, Agrochola nitida and Griposia aprilina. In Germany A. nitida is classified as ‘vulnerable’ and was identified in two faecal samples in the urban sites (in 2018). G. aprilina is classified as ‘near threatened’ and was identified in 15 samples across all habitats (in 2019).
Following Lepidoptera, the orders Hymenoptera and Araneae were among the most frequent arthropod orders in the diet. Among these the families Braconidae (Hymenoptera), Tenthredinidae (Hymenoptera) and Philodromidae (Araneae) were most frequent. Other arthropod orders were mostly detected in less than half of the faecal samples (Table 2, Figure 2).
3.2. Differences in Diet Composition
The diet composition differed among habitats, among nests, between tit species and among prey groups (Lepidoptera and other arthropods); however, there was substantial overlap. At the order level, Hymenoptera were more frequent in the orchard than in the forest sites in Blue Tit samples (p.adjust = 0.029, Fisher’s exact test; Figure 2). While in the urban sites, we detected more Araneae in Blue than in Great Tits’ diet (p = 0.021, Fisher’s exact test; Figure 2). At the family level, we found considerable overlap with minor differences among habitats based on the Jaccard index, NMDS and permutation analyses (Table 3, Figure 3; Figures S3 and S4). Lepidoptera diet components were most similar between forest and orchard sites, while other arthropod components were most similar between orchard and urban sites. In general, lepidopteran diet components showed more similarities among habitats than the other arthropod components based on Jaccard indices and distances in NMDS ordination (Table 3, Figure 3; Figures S3 and S4). Similarly, when comparing tit species across habitats, the lepidopteran components were more similar than the other arthropod components (Table S10). Particularly between forest and orchard sites, lepidopteran components were very similar (CCJ = 0.80–0.91). In contrast, permutation analyses and Fisher’s exact tests revealed interspecific differences in diet composition (Figure 4; Figure S5, Table S11). Moreover, diet components of Blue Tits seemed less similar among habitats than in Great Tits, illustrated by larger distances among points (Figure 4). At the species level, differences among habitats and species became even more pronounced, as shown by the lower Jaccard indices (Tables S10 and S12). Moreover, in the Blue Tit diet Lepidopteran components were most similar between orchard and urban sites. Diet composition was influenced by habitat and nest, with nest providing a stronger explanatory role, yet the habitat effect persisted (see Table S13).
3.3. Tree Samples—Availability of Arboreal Prey
In total, we collected 851 individuals from 18 tree samples. The arthropods from tree samples were pre-sorted in 136 parataxonomic units (PUs) or morphotypes. We were able to determine to species or higher taxonomic level 106 (77.9%) of these PUs, which involved 697 individual arthropods (in 17 out of 18 tree samples), resulting in 88 species (Table S5). For 15 PUs we could not assign a definite taxon and labelled those as ambiguous PUs (see Table S6).
The composition and availability of arboreal arthropods differed among habitats (permutation tests, F2, 14 = 2.0, R2 = 0.22, p = 0.023). The arthropod composition at family level was most similar between orchard and urban sites, showing closer proximity and overlaps in NMDS ordination (Figure 3C and Figure S6). We found the highest number of individuals of Lepidoptera and arthropods in total in the orchard sites (Table S5). The occurrence of Lepidoptera differed among sites (Table S5 but see also Figure S6). Overall, most frequent lepidopteran taxa were Geometridae, Noctuidae, Tortricidae and most frequent non-Lepidoptera were Aphididae (Hemiptera), Curculionidae (Coleoptera) and Philodromidae (Araneae). In comparison, diet and arthropod composition differed among habitats, however diets were more similar than arboreal arthropod composition in the tree samples.
3.4. Parental Prey Selectivity
We examined prey selectivity with Manly’s selectivity index and based on the frequencies of occurrence of diet and tree samples (Tables S19 and S20). Blue and Great Tits had some preference for Lepidoptera, Hymenoptera and Araneae. Both tits showed a tendency to prefer Geometridae (Lepidoptera, 6 of 6 species-habitat combinations) and Tortricidae (Lepidoptera, 6 of 6 species-habitat combinations) across all habitats and for Noctuidae (Lepidoptera, 4 of 4 species-habitat combinations), Tenthredinidae and Braconidae (both: Hymenoptera, 4 of 4 species-habitat combinations) in forest and orchard sites (Figure 5). Moreover, both tits also showed selectivity for Philodromidae (Araneae, 4 of 4 tests) in forest and urban sites. Particularly tiny arthropods like Collembola, Psocodea or Polyxenida were absent from diet and seemed to be avoided by Blue and Great Tits (Figure 5).
4. Discussion
In this study, metabarcoding data showed a diverse arthropod diet dominated by moth species in all habitats. Both bird species mostly fed on three major moth families in all sites. The moths taken were most similar between forest and orchard sites, while components of other arthropod prey were most similar between orchard and urban sites.
4.1. Diet Composition
As described in previous studies, we also found a diverse diet in Blue and Great Tits across different arthropod orders [17,27,29]. Lepidopteran caterpillars dominated nestling diet also in our study. They are the preferred prey for nestlings as they require shorter handling time and are easier to ingest than other arthropods [84,85]. Furthermore, they contain more water and carotenoids than other prey and are thus considered high quality food items [85,86,87]. Previous studies showed that Lepidoptera constitute the largest component in the nestling diet of tits in European forests [46,88,89]. Also in suburban sites, Lepidoptera can form the largest part in diet [16]. The main diet with caterpillars is complemented by other arthropod components when caterpillars are scarce [17]. The other arthropod orders we detected seem to play a minor role besides Lepidoptera [27,29,90].
The most frequent species in diet of tits was the Lackey Moth Malacosoma neustria (Lasiocampidae), a hairy and colourful caterpillar which usually occurs in orchards or forests [91,92]. Initially it was assumed that insectivorous songbirds rarely consume hairy caterpillars [44,93]. However, caterpillars of M. neustria have been found in the diet of Great but not in Blue Tits [44]. Thus, our study might be the first documenting also Blue Tits feeding M. neustria to their nestlings. However, this finding needs to be treated with some caution. Although many MOTUs (>1800) had M. neustria as best hit in the BLAST search, only several of those had an identity of 100%, and most between 98−99%. It is therefore possible that these belong to a related species which is not represented in GenBank (see below: Methodological considerations).
In this study, Hymenopterans were the second most important arthropod component in the diet by frequency of occurrence. The families Tenthredinidae (group of Symphyta) and Braconidae (braconid wasps) were the most frequent. Symphyta have eruciform larvae and are therefore often assigned to the prey category caterpillars in studies on the foraging behaviour of tits. Particularly on camera recordings of Symphyta larvae cannot be distinguished from lepidopteran caterpillars [94,95]. Symphyta larvae may represent the second most frequent food source beside true lepidopteran caterpillars [96]. However, it seems they rather serve as complementing dietary component as they may contain less carotenoids than lepidopteran larvae [87,97]. The parasitoid wasps Braconidae, a frequent prey in our orchard and urban sites, infest among others Lepidopteran larvae [98]. Since we have not found any previous studies which report the foraging on this parasitoid group, they might have been ingested through their hosts, i.e., secondary consumption [99]. Alongside Hymenoptera, Araneae (Araneae) also occurred frequently in the diet. Araneae seem to be an important diet component of many insectivorous birds due to their nutrients, with high levels of protein and amino acids [23,40,100]. Both tit species feed especially young nestlings with Araneae [16,32,33]. Particularly, the amino acid content (taurine) in Araneae seems to be essential for the development of the nestlings [40,100].
4.2. Differences in Diet Composition
Diet composition was affected by habitat and nest, with nest providing a stronger explanatory factor, yet the habitat effect persisted. Based on the detected nest variations, a possible effect of pseudo-replication by nest siblings is therefore negligible. Thus, it indicates, there is variation not only among habitats but also within each habitat. The preferred habitats of Blue and Great Tits are deciduous forest with oak cover (e.g., [28,101]). Previous studies showed that diet differed between oak and pine forest [32,46], and between deciduous forest and urban sites due to higher caterpillar supply in the deciduous forest [57,102]. Hence, tits may rely on a more generalist diet in less favourable habitats [46,57]. We found differences in diet composition among habitats, between tit species and component groups (Lepidoptera and other arthropods). Still, our results also showed overlaps in diet composition. The lepidopteran components were most similar between forest and orchard sites and other arthropod components between orchard and urban sites. Our findings indicate that the sampled orchard sites ranged between forest and urban sites in terms of food composition.
In line with previous studies, we found that nestling diets between Great and Blue Tits were different but showed overlaps [19,103,104]. Within the same habitat, where both species occupy different habitat niches, diet contained similar invertebrate species and differed annually within each species [26,42]. Interestingly, we found high similarities in diet composition based on pairwise comparisons with Jaccard indices (Table S10). Particularly, lepidopteran components were remarkably similar between Blue and Great Tits. However, NMDS ordination and permutation analyses indicated differences between species (Figure 4). It must be considered though, that Jaccard indices only compare the species composition of communities with no regard paid to individual samples, while NMDS ordination plots the samples in space according to their composition. We found more overlaps in lepidopteran components than in other arthropod components due to larger distances within other arthropod components in the ordination. Thus, it seems that Blue and Great Tits forage for similar lepidopteran diet but choose different non-lepidopteran arthropods to compensate for caterpillar scarcity. In previous studies, Blue Tits apparently provide more Araneae to nestlings [42,44,105]. In addition, Great Tits deliver larger prey items to their nestlings than Blue Tits [30,103,106].
4.3. Tree Samples—Availability of Arboreal Prey
We found differences among habitats in the arboreal arthropod composition. Our results indicate that forest and urban sites differ the most, whereas orchard sites range in between. Previous studies already indicated that caterpillar biomass is higher in forest than in urban sites [35,102,107]. Due to the higher occurrence of non-native tree species, urban sites may offer less favourable feeding conditions for phytophagous insects [35,108]. Fruit trees on the other hand, may benefit the diversity of canopy arthropod community through their structural complexity and heterogeneity [109]. In terms of structural elements, orchards represent an intermediate position between forest and open cultivated landscapes [110]. Additionally, arthropod communities in orchards may be influenced by surrounding and adjacent natural vegetation like woodlands [109,111]. Our orchard collection site was surrounded by woodland, while our urban collection site also included fruit trees. Therefore, it seems plausible that our orchard site ranged between forest and urban sites in terms of arthropod composition.
4.4. Parental Prey Selectivity and Suitability as ‘Biodiversity Capsules’
The diets of Great and Blue Tits differed among habitats, however, only in some components. This tendency was also reflected in parental prey selectivity. We found consistent selectivity for tortricid and geometrid moths across all habitats and for noctuid moths in forest and orchard sites. In previous studies, these lepidopteran families were also the most frequent in the diet [44,58,103]. Hence, the preference for certain lepidopteran groups is not limited to preferred habitats in forests but is also evident in man-made habitats. In addition, our results demonstrated selectivity for hymenopteran families Tenthredinidae and Braconidae. As mentioned before, they play a complementing role in diet (Tenthredinidae) or may be ingested via their caterpillar host (Braconidae). As infested larvae seem to be more immobile and conspicuous, they are potentially easier to capture [106]. The altered appearance and behaviour of the infested caterpillars and subsequent ingestion of the host could therefore be the reason for the selectivity of this group in the diet.
Selectivity for additional groups in each habitat may indicate local dietary specialisation (see [58]). Apart from that, most particularly tiny prey items were avoided in diet or rarely taken (e.g., Aphididae) suggesting a preference for larger and possibly more nutrient-rich prey. These small items are not considered as important food items. They are small and uneconomical to collect and provide a poor substitute for high quality prey [106,112]. It must be considered however, that some groups could not be included in the selectivity tests when they did not occur in the collected tree samples. Since for the selectivity tests proportions of used and available resources are calculated and thus available proportions may not equal zero. Otherwise, groups like Lasiocampidae (Lepidoptera) would have indicated selectivity as their frequencies of occurrence exceeded that of the tree samples (Tables S19 and S20).
In view of technological advances in molecular methods, Boyer et al. [59] suggested that the faeces of generalist predators may contain a representative sample of potential prey in their foraging area and hence may serve as ‘biodiversity capsule’ for monitoring purposes. Our study demonstrates that Blue and Great Tit nestlings have a diverse diet but prefer specific insect species within the orders Lepidoptera and Hymenoptera. Consequently, nestling faeces of Blue and Great Tits may serve as ‘biodiversity capsules’ for these selected groups. Particularly for inaccessible, rare, or endangered species of Lepidoptera and Hymenoptera, this non-invasive approach could provide a tool to detect population changes.
4.5. Methodological Considerations
In recent years, Next generation sequencing (NGS) approaches were increasingly applied to investigate the diet of different animals [113], including seabirds [55,65,114] or landbirds, such as tits [56,57,58]. DNA barcode approaches can help to identify and distinguish species by using a public sequence database to match barcodes to species identity [115]. However, these databases are still incomplete at present and the lack of reference sequences in the barcode repositories limits the use of metabarcoding [115,116]. Moreover, a high number of well-differentiated species has similar or even identical COI sequences, which may be over-looked in a DNA barcoding approach [117]. Thus, DNA barcoding is also limited by the accuracy of matching DNA barcodes to species identities. These limitations may lead to misidentifications. In the example of M. neustria in our study, the most abundant species in the diet, most MOTU clusters had a species identity of 98–99%. Thus, various species of the same genus or even of different genera could have been present in the diet. However, no additional species were suggested, which indicates a taxon sampling gap [115,117] for this family. However, compared to traditional methods based on morphological identification from neck collar samples [41] or video recordings [27,44], the molecular approach still offers a higher taxonomic resolution [49,57,113].
4.6. Study Limitations
In addition to the methodological limitations of the metabarcoding approach, a follow-up study would benefit from a more comprehensive analysis on how the vegetation and differences in the phenology (timing) influences the food availability. In such a study, effects of the tree composition and vegetation structures could be studied in more detail, and, e.g., used to explain differences among nests as well as inter-year differences. Furthermore, the sample sizes both of fecal samples as well as vegetation samples could be enlarged, and inter-year differences could be taken into account in a larger sample. The age of chicks could further play a role in the prey choice, as may weather events and habitat edge effects.
5. Conclusions
We demonstrate that the nestling diet composition of Blue and Great Tit nestlings differs among habitats and between species, however only in some taxonomic groups. Our results indicate that the diet differs the most in the composition of non-lepidopteran arthropods that complement the main lepidopteran diet. We suggest that the composition of these arthropods differs depending on the tit species and the respective habitat type. Our study shows that the arthropod composition in the diet differed less among habitats than the composition of available arboreal arthropods. This suggests that the tits species searched for similar prey despite different habitats with different prey compositions. For future research, long-term studies on the diet composition would be necessary to investigate interspecific and inter-habitat differences as well as particularly annual variations in more detail.
We confirmed that Blue and Great Tits preferred certain lepidopteran families. Additionally, we demonstrated that these preferences were not only limited to forests as their preferred habitat, but also were evident in man-made habitats such as orchard and urban sites. Moreover, we showed that both tit species selectively fed Symphyta (i.e., Tenthredinidae) to their nestlings in all study sites. Because of the prey selectivity, we suggest that the nestling faeces of Blue and Great Tits are not suitable to monitor entire arthropod communities. Nevertheless, our approach is suitable to monitor population changes in the orders of Lepidoptera and Hymenoptera selectively taken by the tits. Hence, our study serves as a baseline for using bird faeces as a tool to support the monitoring of prey diversity and population changes.
Supplementary Materials
The following are available online at https://www.mdpi.com/article/10.3390/birds5010005/s1: Table S1: Sample sizes of successfully sequenced samples, separately for the different study sites in each habitat type. From each tree, two branches were cut and analysed., Table S2: Tree composition among the three habitats. Dominant tree species are underlined and sampled tree species are marked in bold, Table S3: Overview of primers and Annealing temperature, Table S4: Sample size nestling faeces from breeding season 2018, Table S5: Arboreal arthropod composition among habitats in breeding season 2019 with number of individuals, Table S6: Ambiguous parataxonomic units (PU) of arboreal arthropod samples, Table S7: Diet composition in nestling faeces concerning Lepidoptera with prevalence and frequencies of occurrence, Table S8: Diet composition in nestling faeces concerning other arthropods with prevalence and frequencies of occurrence, Table S9: Biodiversity of all dietary components among habitats on species level, Table S10: Comparison of biodiversity in diet composition between tit species, Table S11: Output of Fisher’s exact test for differences in diet composition between tit species, Table S12: Biodiversity of diet composition among habitats on species level grouped by Lepidoptera and other arthropods, Table S13: Output of Permutational Multivariate Analysis of Variance (PERMANOVA), Table S14: Frequencies of occurrence of arboreal arthropod and Blue Tit diet components, Table S15: Frequencies of occurrence of arboreal arthropod and Great Tit diet components. Figures S1 a-l: Aerial photos of the respective study sites via Google Earth, Figure S2: Primer comparison by number of detected species in nestling faecal samples, Figure S3: NMDS ordinations of Blue Tit diet components, Figure S4: NMDS ordinations of Great Tit diet components, Figure S5: NMDS ordinations of nestling diet components between Blue and Great Tits, Figure S6: NMDS ordination of arboreal arthropod communities among different habitats.
Author Contributions
Conceptualization, D.H. and P.Q.; methodology, D.H. and P.Q.; software, M.N.K., S.G. and A.G.; validation, D.H. and P.Q.; formal analysis, D.H. and J.F.M.; investigation, D.H.; resources, P.Q. and A.G.; data curation, D.H.; writing—original draft preparation, D.H.; writing—review and editing, D.H., J.F.M. and P.Q.; visualization, D.H.; supervision, P.Q.; project administration, D.H. and P.Q.; funding acquisition, P.Q. D.H.: Concept and design of the study, data collection & data analysis, interpretation of results, manuscript drafting & writing; P.Q.: Concept and design of the study, data analysis, interpretation of results, supervision; M.N.K., S.G. and A.G.: development and maintenance of the Galaxy tool; J.F.M.: data processing steps of bioinformatics. All authors have read and agreed to the published version of the manuscript.
Funding
Funding for this study was granted from the Ecological Society of Germany, Austria, and Switzerland (Gesellschaft für Ökologie e.V.).
Institutional Review Board Statement
All applicable international, national, and/or institutional guidelines for the care and use of animals were followed. The study involved free-ranging individuals and was approved by the German Bird Ringing Scheme Helgoland (Institute of Avian Research‚ Vogelwarte Helgoland, Wilhelmshaven). A bird handling and ringing licence was granted from Ethic Committee Name: Staatliche Vogelschutzwarte. Approval Code: not applicable. Approval Date: 31 August 2015 and 13 July 2018. In addition, an animal experimental permit was issued by: Ethic Committee Name: Regierungspräsidium Gießen. Approval Code: G 77/2016. Approval Date: 14 February 2017.
Data Availability Statement
Raw data of the current study are available from the corresponding author.
Acknowledgments
We are grateful for the funding provided by the Ecological Society of Germany, Austria, and Switzerland (Gesellschaft für Ökologie e.V.). We thank all the field assistants who helped with the field work, including all the BSc and MSc candidates who have been involved in the project. We also want to thank all benefactors for the provision of additional nest boxes. We thank the editor and three anonymous reviewers for helpful comments on the manuscript.
Conflicts of Interest
The authors declare no conflicts of interest.
References
- Sala, O.E.; Chapin, F.S.; Armesto, J.J.; Berlow, E.; Bloomfield, J.; Dirzo, R.; Huber-Sanwald, E.; Huenneke, L.F.; Jackson, R.B.; Kinzig, A.; et al. Global Biodiversity Scenarios for the Year 2100. Science 2000, 287, 1770–1774. [Google Scholar] [CrossRef]
- Tscharntke, T.; Klein, A.M.; Kruess, A.; Steffan-Dewenter, I.; Thies, C. Landscape Perspectives on Agricultural Intensification and Biodiversity—Ecosystem Service Management. Ecol. Lett. 2005, 8, 857–874. [Google Scholar] [CrossRef]
- Foley, J.A.; DeFries, R.; Asner, G.P.; Barford, C.; Bonan, G.; Carpenter, S.R.; Chapin, F.S.; Coe, M.T.; Daily, G.C.; Gibbs, H.K.; et al. Global Consequences of Land Use. Science 2005, 309, 570–574. [Google Scholar] [CrossRef]
- Matson, P.A. Agricultural Intensification and Ecosystem Properties. Science 1997, 277, 504–509. [Google Scholar] [CrossRef]
- Sánchez-Bayo, F.; Wyckhuys, K.A.G. Worldwide Decline of the Entomofauna: A Review of Its Drivers. Biol. Conserv. 2019, 232, 8–27. [Google Scholar] [CrossRef]
- Seibold, S.; Gossner, M.M.; Simons, N.K.; Blüthgen, N.; Müller, J.; Ambarlı, D.; Ammer, C.; Bauhus, J.; Fischer, M.; Habel, J.C.; et al. Arthropod Decline in Grasslands and Forests Is Associated with Landscape-Level Drivers. Nature 2019, 574, 671–674. [Google Scholar] [CrossRef]
- Hallmann, C.A.; Foppen, R.P.B.; van Turnhout, C.A.M.; de Kroon, H.; Jongejans, E. Declines in Insectivorous Birds Are Associated with High Neonicotinoid Concentrations. Nature 2014, 511, 341–343. [Google Scholar] [CrossRef]
- Habel, J.C.; Samways, M.J.; Schmitt, T. Mitigating the Precipitous Decline of Terrestrial European Insects: Requirements for a New Strategy. Biodivers. Conserv. 2019, 28, 1343–1360. [Google Scholar] [CrossRef]
- Bauer, H.-G.; Bezzel, E.; Fiedler, W. Das Kompendium Der Vögel Mitteleuropas, Volume 2: Passeriformes—Sperlingsvögel, 2nd ed.; AULA-Verlag: Wiebelsheim, Germany, 2005; Volume 2, ISBN 9783891046487. [Google Scholar]
- Wahl, J.; Dröschmeister, R.; Gerlach, B.; Grüneberg, C.; Langgemach, T.; Trautmann, S.; Sudfeldt, C. Vögel in Deutschland—2014; DDA, BfN, LAG VSW: Münster, Germany, 2015; ISBN 9783981554359. [Google Scholar]
- Bowler, D.E.; Heldbjerg, H.; Fox, A.D.; de Jong, M.; Böhning-Gaese, K. Long-Term Declines of European Insectivorous Bird Populations and Potential Causes. Conserv. Biol. 2019, 33, 1120–1130. [Google Scholar] [CrossRef]
- Bańbura, J.; Bańbura, M. Blue Tits Cyanistes Caeruleus and Great Tits Parus Major As Urban Habitat Breeders. Int. Stud. Sparrows 2012, 36, 66–72. [Google Scholar] [CrossRef]
- Jokimäki, J.; Suhonen, J.; Jokimäki-Kaisanlahti, M.L.; Carbó-Ramírez, P. Effects of Urbanization on Breeding Birds in European Towns: Impacts of Species Traits. Urban Ecosyst. 2016, 19, 1565–1577. [Google Scholar] [CrossRef]
- Chace, J.F.; Walsh, J.J. Urban Effects on Native Avifauna: A Review. Landsc. Urban Plan. 2006, 74, 46–69. [Google Scholar] [CrossRef]
- Seress, G.; Liker, A. Habitat Urbanization and Its Effects on Birds. Acta Zool. Acad. Sci. Hungaricae 2015, 61, 373–408. [Google Scholar] [CrossRef]
- Cowie, R.J.; Hinsley, S.A. Feeding Ecology of Great Tits (Parus Major) and Blue Tits (Parus caeruleus), Breeding in Suburban Gardens. J. Anim. Ecol. 1988, 57, 611–626. [Google Scholar] [CrossRef]
- Glutz von Blotzheim, U.N.; Bauer, K.M. Handbuch Der Vögel Mitteleuropas. Band 13/1; Aula-Verlag: Wiesbaden, Germany, 1993; ISBN 3923527004. [Google Scholar]
- Newton, I. The Recent Declines of Farmland Bird Populations in Britain: An Appraisal of Causal Factors and Conservation Actions. Ibis 2004, 146, 579–600. [Google Scholar] [CrossRef]
- Minot, E.O. Effects of Interspecific Competition for Food in Breeding Blue and Great Tits. J. Anim. Ecol. 1981, 50, 375. [Google Scholar] [CrossRef]
- Dhondt, A.A.; Adriaensen, F. Experiments on Competition between Great and Blue Tit: Effects on Blue Tit Reproductive Success and Population Processes. Ostrich 1999, 70, 39–48. [Google Scholar] [CrossRef]
- Perrins, C.M. Tits and Their Caterpillar Food Supply. Ibis 1991, 133, 49–54. [Google Scholar] [CrossRef]
- Naef-Daenzer, L.; Naef-Daenzer, B.; Nager, R.G. Prey Selection and Foraging Performance of Breeding Great Tits Parus Major in Relation to Food Availability. J. Avian Biol. 2000, 31, 206–214. [Google Scholar] [CrossRef]
- Pagani-Núñez, E.; Ruiz, I.; Quesada, J.; Negro, J.J.; Senar, J.C. The Diet of Great Tit Parus Major Nestlings in a Mediterranean Iberian Forest: The Important Role of Spiders. Anim. Biodivers. Conserv. 2011, 34, 355–361. [Google Scholar] [CrossRef]
- Mols, C.M.M.; Visser, M.E. Great Tits Can Reduce Caterpillar Damage in Apple Orchards. J. Appl. Ecol. 2002, 39, 888–899. [Google Scholar] [CrossRef]
- Powell, C.; Lill, A.; Johnstone, C.P. Body Condition and Chronic Stress in Urban and Rural Noisy Miners. Open Ornithol. J. 2013, 6, 25–31. [Google Scholar] [CrossRef]
- Krištín, A. Trophische Beziehungen Zwischen Singvögeln Und Wirbellosen Im Eichen-Buchenwald Zur Brutzeit. Der. Ornithol. Beobachter. 1992, 89, 157–169. [Google Scholar]
- Royama, T. Factors Governing the Hunting Behaviour and Selection of Food by the Great Tit (Parus major L.). J. Anim. Ecol. 1970, 39, 619–668. [Google Scholar] [CrossRef]
- Stenning, M. The Blue Tit; T & AD Poyser: London, UK, 2018. [Google Scholar]
- Betts, M.M. The Food of Titmice in Oak Woodland. J. Anim. Ecol. 1955, 24, 282. [Google Scholar] [CrossRef]
- Ceia, R.S.; Machado, R.A.; Ramos, J.A. Nestling Food of Three Hole-Nesting Passerine Species and Experimental Increase in Their Densities in Mediterranean Oak Woodlands. Eur. J. For. Res. 2016, 135, 839–847. [Google Scholar] [CrossRef]
- Török, J. Food Segregation in Three Hole-Nesting Bird Species during the Breeding Season. Ardea 1986, 74, 129–136. [Google Scholar]
- Van Balen, J.H. A Comparative Sudy of the Breeding Ecology of the Great Tit Parus Major in Different Habitats. Ardea 1973, 61, 1–93. [Google Scholar] [CrossRef]
- García-Navas, V.; Ferrer, E.S.; Sanz, J.J. Prey Selectivity and Parental Feeding Rates of Blue Tits Cyanistes Caeruleus in Relation to Nestling Age. Bird Study 2012, 59, 236–242. [Google Scholar] [CrossRef]
- Solonen, T. Breeding of the Great Tit and Blue Tit in Urban and Rural Habitats in Southern Finland. Ornis Fenn. 2001, 78, 49–60. [Google Scholar]
- Seress, G.; Hammer, T.; Bókony, V.; Vincze, E.; Preiszner, B.; Pipoly, I.; Sinkovics, C.; Evans, K.L.; Liker, A. Impact of Urbanization on Abundance and Phenology of Caterpillars and Consequences for Breeding in an Insectivorous Bird. Ecol. Appl. 2018, 28, 1143–1156. [Google Scholar] [CrossRef] [PubMed]
- Wawrzyniak, J.; Glądalski, M.; Kaliński, A.; Bańbura, M.; Markowski, M.; Skwarska, J.; Zieliński, P.; Bańbura, J. Differences in the Breeding Performance of Great Tits Parus Major between a Forest and an Urban Area: A Long Term Study on First Clutches. Eur. Zool. J. 2020, 87, 294–309. [Google Scholar] [CrossRef]
- Vaugoyeau, M.; Adriaensen, F.; Artemyev, A.; Bańbura, J.; Barba, E.; Biard, C.; Blondel, J.; Bouslama, Z.; Bouvier, J.C.; Camprodon, J.; et al. Interspecific Variation in the Relationship between Clutch Size, Laying Date and Intensity of Urbanization in Four Species of Hole-Nesting Birds. Ecol. Evol. 2016, 6, 5907–5920. [Google Scholar] [CrossRef] [PubMed]
- Fischbacher, M.; Naef-Daenzer, B.; Naef-Daenzer, L. Estimating Caterpillar Density on Trees by Collection of Frass Droppings. Ardea 1998, 86, 121–129. [Google Scholar]
- Mägi, M.; Mänd, R.; Tamm, H.; Sisask, E.; Kilgas, P.; Tilgar, V. Low Reproductive Success of Great Tits in the Preferred Habitat: A Role of Food Availability. Ecoscience 2009, 16, 145–157. [Google Scholar] [CrossRef]
- Arnold, K.E.; Ramsay, S.L.; Henderson, L.; Larcombe, S.D. Seasonal Variation in Diet Quality: Antioxidants, Invertebrates and Blue Tits Cyanistes Caeruleus. Biol. J. Linn. Soc. 2010, 99, 708–717. [Google Scholar] [CrossRef]
- Cholewa, M.; Wesołowski, T. Nestling Food of European Hole-Nesting Passerines: Do We Know Enough to Test the Adaptive Hypotheses on Breeding Seasons? Acta Ornithol. 2011, 46, 105–116. [Google Scholar] [CrossRef]
- Grzędzicka, E. Habitat and Diet Variability of Two Coexisting Tit Species in Central European Forests. Bird Study 2018, 65, 52–61. [Google Scholar] [CrossRef]
- Tanneberger, F.; Flinks, H.; Arbeiter, S.; Minets, M.; Hegemann, A. Diet Analysis of Wetland Passerine Nestlings Using Neck Collars or Faecal Sampling Produces Similar Results. Ardea 2017, 105, 145–152. [Google Scholar] [CrossRef]
- García-Navas, V.; Ferrer, E.S.; Sanz, J.J. Prey Choice, Provisioning Behaviour, and Effects of Early Nutrition on Nestling Phenotype of Titmice. Ecoscience 2013, 20, 9–18. [Google Scholar] [CrossRef]
- Caprio, E.; Rolando, A. Management Systems May Affect the Feeding Ecology of Great Tits Parus Major Nesting in Vineyards. Agric. Ecosyst. Environ. 2017, 243, 67–73. [Google Scholar] [CrossRef]
- Serrano-Davies, E.; Sanz, J.J. Habitat Structure Modulates Nestling Diet Composition and Fitness of Blue Tits Cyanistes Caeruleus in the Mediterranean Region. Bird Study 2017, 64, 295–305. [Google Scholar] [CrossRef]
- Symondson, W.O.C. Molecular Identification of Prey in Predator Diets. Mol. Ecol. 2002, 11, 627–641. [Google Scholar] [CrossRef] [PubMed]
- Zeale, M.R.K.; Butlin, R.K.; Barker, G.L.A.; Lees, D.C.; Jones, G. Taxon-Specific PCR for DNA Barcoding Arthropod Prey in Bat Faeces. Mol. Ecol. Resour. 2011, 11, 236–244. [Google Scholar] [CrossRef]
- Pompanon, F.; Deagle, B.E.; Symondson, W.O.C.; Brown, D.S.; Jarman, S.N.; Taberlet, P. Who Is Eating What: Diet Assessment Using next Generation Sequencing. Mol. Ecol. 2012, 21, 1931–1950. [Google Scholar] [CrossRef]
- Deagle, B.E.; Kirkwood, R.; Jarman, S.N. Analysis of Australian Fur Seal Diet by Pyrosequencing Prey DNA in Faeces. Mol. Ecol. 2009, 18, 2022–2038. [Google Scholar] [CrossRef]
- O’Rourke, D.R.; Mangan, M.T.; Mangan, K.E.; Bokulich, N.A.; MacManes, M.D.; Foster, J.T. Lord of the Diptera (and Moths and a Spider): Molecular Diet Analyses and Foraging Ecology of Indiana Bats in Illinois. Front. Ecol. Evol. 2021, 9, 623655. [Google Scholar] [CrossRef]
- Morley, S.A.; Foley, M.M.; Duda, J.J.; Beirne, M.M.; Paradis, R.L.; Johnson, R.C.; McHenry, M.L.; Elofson, M.; Sampson, E.M.; McCoy, R.E.; et al. Shifting Food Web Structure during Dam Removal—Disturbance and Recovery during a Major Restoration Action. PLoS ONE 2020, 15, e0239198. [Google Scholar] [CrossRef]
- Trevelline, B.K.; Latta, S.C.; Marshall, L.C.; Nuttle, T.; Porter, B.A. Molecular Analysis of Nestling Diet in a Long-Distance Neotropical Migrant, the Louisiana Waterthrush (Parkesia motacilla). Auk 2016, 133, 415–428. [Google Scholar] [CrossRef]
- Dunn, J.C.; Stockdale, J.E.; Moorhouse-Gann, R.J.; McCubbin, A.; Hipperson, H.; Morris, A.J.; Grice, P.V.; Symondson, W.O.C. The Decline of the Turtle Dove: Dietary Associations with Body Condition and Competition with Other Columbids Analysed Using High-Throughput Sequencing. Mol. Ecol. 2018, 27, 3386–3407. [Google Scholar] [CrossRef]
- Kleinschmidt, B.; Burger, C.; Dorsch, M.; Nehls, G.; Heinänen, S.; Morkūnas, J.; Žydelis, R.; Moorhouse-Gann, R.J.; Hipperson, H.; Symondson, W.O.C.; et al. The Diet of Red-Throated Divers (Gavia stellata) Overwintering in the German Bight (North Sea) Analysed Using Molecular Diagnostics. Mar. Biol. 2019, 166, 77. [Google Scholar] [CrossRef]
- Rytkönen, S.; Vesterinen, E.J.; Westerduin, C.; Leviäkangas, T.; Vatka, E.; Mutanen, M.; Välimäki, P.; Hukkanen, M.; Suokas, M.; Orell, M. From Feces to Data: A Metabarcoding Method for Analyzing Consumed and Available Prey in a Bird-Insect Food Web. Ecol. Evol. 2018, 9, 631–639. [Google Scholar] [CrossRef] [PubMed]
- Jarrett, C.; Powell, L.L.; McDevitt, H.; Helm, B.; Welch, A.J. Bitter Fruits of Hard Labour: Diet Metabarcoding and Telemetry Reveal That Urban Songbirds Travel Further for Lower-Quality Food. Oecologia 2020, 193, 377–388. [Google Scholar] [CrossRef] [PubMed]
- Shutt, J.D.; Nicholls, J.A.; Trivedi, U.H.; Burgess, M.D.; Stone, G.N.; Hadfield, J.D.; Phillimore, A.B. Gradients in Richness and Turnover of a Forest Passerine’s Diet Prior to Breeding: A Mixed Model Approach Applied to Faecal Metabarcoding Data. Mol. Ecol. 2020, 29, 1199–1213. [Google Scholar] [CrossRef]
- Boyer, S.; Cruickshank, R.H.; Wratten, S.D. Faeces of Generalist Predators as “Biodiversity Capsules”: A New Tool for Biodiversity Assessment in Remote and Inaccessible Habitats. Food Webs 2015, 3, 1–6. [Google Scholar] [CrossRef]
- Hessisches Landesamt für Naturschutz, Umwelt und Geologie (HLNUG), Klimaportal Hessen. Available online: https://klimaportal.hlnug.de/witterungsbericht (accessed on 1 October 2021).
- Jusino, M.A.; Banik, M.T.; Palmer, J.M.; Wray, A.K.; Xiao, L.; Pelton, E.; Barber, J.R.; Kawahara, A.Y.; Gratton, C.; Peery, M.Z.; et al. An Improved Method for Utilizing High-Throughput Amplicon Sequencing to Determine the Diets of Insectivorous Animals. Mol. Ecol. Resour. 2019, 19, 176–190. [Google Scholar] [CrossRef]
- Emerson, B.C.; Casquet, J.; López, H.; Cardoso, P.; Borges, P.A.V.; Mollaret, N.; Oromí, P.; Strasberg, D.; Thébaud, C. A Combined Field Survey and Molecular Identification Protocol for Comparing Forest Arthropod Biodiversity across Spatial Scales. Mol. Ecol. Resour. 2017, 17, 694–707. [Google Scholar] [CrossRef]
- Martínez, J.; Martínez-de la Puente, J.; Herrero, J.; Del Cerro, S.; Lobato, E.; Rivero-de Aguilar, J.; Vásquez, R.A.; Merino, S. A Restriction Site to Differentiate Plasmodium and Haemoproteus Infections in Birds: On the Inefficiency of General Primers for Detection of Mixed Infections. Parasitology 2009, 136, 713–722. [Google Scholar] [CrossRef]
- Folmer, O.; Black, M.; Hoeh, W.; Lutz, R.; Vrijenhoek, R. DNA Primers for Amplification of Mitochondrial Cytochrome c Oxidase Subunit I from Diverse Metazoan Invertebrates. Mol. Mar. Biol. Biotechnol. 1994, 3, 294–299. [Google Scholar] [CrossRef]
- Altschul, S.F.; Gish, W.; Miller, W.; Myers, E.W.; Lipman, D.J. Basic Local Alignment Search Tool. J. Mol. Biol. 1990, 215, 403–410. [Google Scholar] [CrossRef]
- Masello, J.F.; Barbosa, A.; Kato, A.; Mattern, T.; Medeiros, R.; Stockdale, J.E.; Kümmel, M.N.; Bustamante, P.; Belliure, J.; Benzal, J.; et al. How Animals Distribute Themselves in Space: Energy Landscapes of Antarctic Avian Predators. Mov. Ecol. 2021, 9, 24. [Google Scholar] [CrossRef] [PubMed]
- Department of Bioinformatics & Systems Biology (Justus Liebig University, Giessen), Galaxy Giessen. Available online: https://www.computational.bio.uni-giessen.de/galaxy (accessed on 1 October 2020).
- Afgan, E.; Baker, D.; Batut, B.; van den Beek, M.; Bouvier, D.; Cech, M.; Chilton, J.; Clements, D.; Coraor, N.; Grüning, B.A.; et al. The Galaxy Platform for Accessible, Reproducible and Collaborative Biomedical Analyses: 2018 Update. Nucleic Acids Res. 2018, 46, W537–W544. [Google Scholar] [CrossRef] [PubMed]
- Babraham Institute Cambridge, Braham Bioinformatics. Available online: http://www.bioinformatics.babraham.ac.uk/projects/fastqc (accessed on 1 October 2020).
- Bolger, A.M.; Lohse, M.; Usadel, B. Trimmomatic: A Flexible Trimmer for Illumina Sequence Data. Bioinformatics 2014, 30, 2114–2120. [Google Scholar] [CrossRef] [PubMed]
- Magoč, T.; Salzberg, S.L. FLASH: Fast Length Adjustment of Short Reads to Improve Genome Assemblies. Bioinformatics 2011, 27, 2957–2963. [Google Scholar] [CrossRef] [PubMed]
- Schloss, P.D.; Westcott, S.L.; Ryabin, T.; Hall, J.R.; Hartmann, M.; Hollister, E.B.; Lesniewski, R.A.; Oakley, B.B.; Parks, D.H.; Robinson, C.J.; et al. Introducing Mothur: Open-Source, Platform-Independent, Community-Supported Software for Describing and Comparing Microbial Communities. Appl. Environ. Microbiol. 2009, 75, 7537–7541. [Google Scholar] [CrossRef]
- Edgar, R.C. Search and Clustering Orders of Magnitude Faster than BLAST. Bioinformatics 2010, 26, 2460–2461. [Google Scholar] [CrossRef]
- Wright, E.S.; Vetsigian, K.H. Quality Filtering of Illumina Index Reads Mitigates Sample Cross-Talk. BMC Genom. 2016, 17, 876. [Google Scholar] [CrossRef]
- Quéméré, E.; Hibert, F.; Miquel, C.; Lhuillier, E.; Rasolondraibe, E.; Champeau, J.; Rabarivola, C.; Nusbaumer, L.; Chatelain, C.; Gautier, L.; et al. A DNA Metabarcoding Study of a Primate Dietary Diversity and Plasticity across Its Entire Fragmented Range. PLoS ONE 2013, 8, e58971. [Google Scholar] [CrossRef]
- R Core Team. R: A Language and Environment for Statistical Computing; R Core Team: Vienna, Austria, 2020. [Google Scholar]
- Shannon, C.E. A Mathematical Theory of Communication. Bell Syst. Tech. J. 1948, 27, 379–423. [Google Scholar] [CrossRef]
- Jaccard, P. The Distribution of the Flora in the Alpine Zone. New Phytol. 1912, 11, 37–50. [Google Scholar] [CrossRef]
- Oksanen, J.; Blanchet, F.G.; Friendly, M.; Kindt, R.; Legendre, P.; McGlinn, D.; Minchin, P.R.; O’Hara, R.B.; Simpson, G.L.; Solymos, P.; et al. Vegan: Community Ecology Package, R Package Version 2.5-6 2019. Available online: https://cran.r-project.org/web/packages/vegan/vegan.pdf (accessed on 19 December 2023).
- Faith, D.P.; Minchin, P.R.; Belbin, L. Compositional Dissimilarity as a Robust Measure of Ecological Distance. Vegetatio 1987, 69, 57–68. [Google Scholar] [CrossRef]
- Minchin, P.R. An Evaluation of the Relative Robustness of Techniques for Ecological Ordination. Vegetatio 1987, 69, 89–107. [Google Scholar] [CrossRef]
- Manly, B.; McDonald, L.; Thomas, D.; McDonald, T.; Erickson, W. Resource Selection by Animals: Statistical Design and Analysis for Field Studies, 2nd ed.; Kluwer Academic Publishers: Dordrecht, The Netherlands, 2002; ISBN 1-4020-0677-2. [Google Scholar]
- Calenge, C. The Package “Adehabitat” for the R Software: A Tool for the Analysis of Space and Habitat Use by Animals. Ecol. Modell. 2006, 197, 516–519. [Google Scholar] [CrossRef]
- Banbura, J.; Lambrechts, M.M.; Blondel, J.; Perret, P.; Cartan-Son, M. Food Handling Time of Blue Tit Chicks: Constraints and Adaptation to Different Prey Types. J. Avian Biol. 1999, 30, 263–270. [Google Scholar] [CrossRef]
- Tremblay, I.; Thomas, D.; Blondel, J.; Perret, P.; Lambrechts, M.M. The Effect of Habitat Quality on Foraging Patterns, Provisioning Rate and Nestling Growth in Corsican Blue Tits Parus Caeruleus. Ibis 2005, 147, 17–24. [Google Scholar] [CrossRef]
- Wilkin, T.A.; King, L.E.; Sheldon, B.C. Habitat Quality, Nestling Diet, and Provisioning Behaviour in Great Tits Parus Major. J. Avian Biol. 2009, 40, 135–145. [Google Scholar] [CrossRef]
- Eeva, T.; Helle, S.; Salminen, J.-P.; Hakkarainen, H. Carotenoid Composition of Invertebrates Consumed by Two Insectivorous Bird Species. J. Chem. Ecol. 2010, 36, 608–613. [Google Scholar] [CrossRef]
- García-Navas, V.; Sanz, J.J. The Importance of a Main Dish: Nestling Diet and Foraging Behaviour in Mediterranean Blue Tits in Relation to Prey Phenology. Oecologia 2011, 165, 639–649. [Google Scholar] [CrossRef]
- Wesołowski, T.; Rowiński, P. Do Blue Tits Cyanistes Caeruleus Synchronize Reproduction with Caterpillar Peaks in a Primeval Forest? Bird Study 2014, 61, 231–245. [Google Scholar] [CrossRef]
- Cramp, S.; Perrins, C.M. Handbook of the Birds of Europe, the Middle East and North Africa. The Birds of the Western Palearctic. Vol. VII, Flycatchers to Shrikes; Oxford University Press: Oxford, UK, 1993. [Google Scholar]
- Kovačević, Ž. Die Nahrungswahl Und Das Auftreten Der Pflanzenschädlinge. Anz. Für Schädlingskd. 1956, 29, 97–101. [Google Scholar] [CrossRef]
- Deschka, G.; Wimmer, J. Die Schmetterlingsfauna Der Kreuzmauer (Insecta: Lepidoptera). Beiträge Zur Naturkd. Oberösterreichs 2000, 9, 65–186. [Google Scholar]
- Reichholf, J.H. Der Ringelspinner Malacosoma Neustria: Früher Gefürchteter Schädling Und Nun Eine Seltenheit. Berichte Des Naturwissenschaftlichen Ver. Für Schwab. e.V. 2009, 113, 58–63. [Google Scholar]
- Kübler, S. Nahrungsökologie Stadtlebender Vogelarten Entlang Eines Urbangradienten; Humboldt University of Berlin: Berlin, Germany, 2006; Volume 44. [Google Scholar]
- Marciniak, B.; Nadolski, J.; Nowakowska, M.; Loga, B.; Bańbura, J. Habitat and Annual Variation in Arthropod Abundance Affects Blue Tit Cyanistes Caeruleus Reproduction. Acta Ornithol. 2007, 42, 53–62. [Google Scholar] [CrossRef]
- Ilyina, T.A.; Kerimov, A.B.; Zagubizhenko, M.V.; Maksimov, G.V. Seasonal Dynamics of Leaf-Eating Insects Biomass and Its Influence on Carotenoid Content in Feathers of Great Tit Nestlings. Russ. J. Ecol. 2013, 44, 507–514. [Google Scholar] [CrossRef]
- Sillanpää, S.; Salminen, J.-P.P.; Lehikoinen, E.; Toivonen, E.; Eeva, T. Carotenoids in a Food Chain along a Pollution Gradient. Sci. Total Environ. 2008, 406, 247–255. [Google Scholar] [CrossRef] [PubMed]
- Schmidt, J.O. Wasps. In Encyclopedia of Insects; Resh, V.H., Cardé, R.T., Eds.; Elsevier Science & Technology: Amsterdam, The Netherlands, 2009; pp. 1049–1051. [Google Scholar]
- Verkuil, Y.I.; Nicolaus, M.; Ubels, R.; Dietz, M.M.; Samplonius, J.M.; Galema, A.; Kiekebos, K.; De Knijff, P.; Both, C. DNA Metabarcoding Successfully Quantifies Relative Abundances of Arthropod Taxa in Songbird Diets: A Validation Study Using Camera-Recorded Diets. bioRxiv 2020. [Google Scholar] [CrossRef]
- Ramsay, S.L.; Houston, D.C. Amino Acid Composition of Some Woodland Arthropods and Its Implications for Breeding Tits and Other Passerines. Ibis 2003, 145, 227–232. [Google Scholar] [CrossRef]
- Mänd, R.; Tilgar, V.; Lõhmus, A.; Leivits, A. Providing Nest Boxes for Hole-Nesting Birds—Does Habitat Matter? Biodivers. Conserv. 2005, 14, 1823–1840. [Google Scholar] [CrossRef]
- Pollock, C.J.; Capilla-Lasheras, P.; McGill, R.A.R.; Helm, B.; Dominoni, D.M. Integrated Behavioural and Stable Isotope Data Reveal Altered Diet Linked to Low Breeding Success in Urban-Dwelling Blue Tits (Cyanistes caeruleus). Sci. Rep. 2017, 7, 5014. [Google Scholar] [CrossRef]
- Nour, N.; Currie, D.; Matthysen, E.; Van Damme, R.; Dhondt, A.A. Effects of Habitat Fragmentation on Provisioning Rates, Diet and Breeding Success in Two Species of Tit (Great Tit and Blue Tit). Oecologia 1998, 114, 522–530. [Google Scholar] [CrossRef]
- Török, J.; Tóth, L. Asymmetric Competition between Two Tit Species: A Reciprocal Removal Experiment. J. Anim. Ecol. 1999, 68, 338–345. [Google Scholar] [CrossRef]
- Navalpotro, H.; Pagani–Núñez, E.; Hernández–Gómez, S.; Senar, J.C. Comparing Prey Composition and Prey Size Delivered to Nestlings by Great Tits, Parus Major, and Blue Tits, Cyanistes Caeruleus, in a Mediterranean Sclerophyllous Mixed Forest. Anim. Biodivers. Conserv. 2016, 39, 129–139. [Google Scholar] [CrossRef]
- Gibb, J.A.; Betts, M.M. Food and Food Supply of Nestling Tits (Paridae) in Breckland Pine. J. Anim. Ecol. 1963, 32, 489–533. [Google Scholar] [CrossRef]
- Glądalski, M.; Bańbura, M.; Kaliński, A.; Markowski, M.; Skwarska, J.; Wawrzyniak, J.; Zieliński, P.; Cyżewska, I.; Bańbura, J. Differences in the Breeding Success of Blue Tits Cyanistes Caeruleus between a Forest and an Urban Area: A Long-Term Study. Acta Ornithol. 2017, 52, 59–68. [Google Scholar] [CrossRef]
- Clem, C.S.; Held, D.W. Species Richness of Eruciform Larvae Associated with Native and Alien Plants in the Southeastern United States. J. Insect Conserv. 2015, 19, 987–997. [Google Scholar] [CrossRef]
- Simon, S.; Bouvier, J.C.; Debras, J.F.; Sauphanor, B. Biodiversity and Pest Management in Orchard Systems. A Review. Agron. Sustain. Dev. 2010, 30, 139–152. [Google Scholar] [CrossRef]
- Müller, W.; Hess, R.; Nievergelt, B. Die Obstgärten Und Ihre Vogelwelt Im Kanton Zürich. Der Ornitol. Beob. 1988, 85, 123–157. [Google Scholar]
- Altieri, M.A.; Schmidt, L.L. The Dynamics of Colonizing Arthropod Communities at the Interface of Abandoned, Organic and Commercial Apple Orchards and Adjacent Woodland Habitats. Agric. Ecosyst. Environ. 1986, 16, 29–43. [Google Scholar] [CrossRef]
- Mackenzie, J.A.; Hinsley, S.A.; Harrison, N.M. Parid Foraging Choices in Urban Habitat and Their Consequences for Fitness. Ibis 2014, 156, 591–605. [Google Scholar] [CrossRef]
- Vesterinen, E.J.; Ruokolainen, L.; Wahlberg, N.; Peña, C.; Roslin, T.; Laine, V.N.; Vasko, V.; Sääksjärvi, I.E.; Norrdahl, K.; Lilley, T.M. What You Need Is What You Eat? Prey Selection by the Bat Myotis Daubentonii. Mol. Ecol. 2016, 25, 1581–1594. [Google Scholar] [CrossRef]
- Jarman, S.N.; McInnes, J.C.; Faux, C.; Polanowski, A.M.; Marthick, J.; Deagle, B.E.; Southwell, C.; Emmerson, L. Adélie Penguin Population Diet Monitoring by Analysis of Food DNA in Scats. PLoS ONE 2013, 8, e82227. [Google Scholar] [CrossRef] [PubMed]
- Hestetun, J.T.; Bye-Ingebrigtsen, E.; Nilsson, R.H.; Glover, A.G.; Johansen, P.O.; Dahlgren, T.G. Significant Taxon Sampling Gaps in DNA Databases Limit the Operational Use of Marine Macrofauna Metabarcoding. Mar. Biodivers. 2020, 50, 70. [Google Scholar] [CrossRef]
- Kvist, S. Barcoding in the Dark?: A Critical View of the Sufficiency of Zoological DNA Barcoding Databases and a Plea for Broader Integration of Taxonomic Knowledge. Mol. Phylogenet. Evol. 2013, 69, 39–45. [Google Scholar] [CrossRef] [PubMed]
- Wiemers, M.; Fiedler, K. Does the DNA Barcoding Gap Exist?—A Case Study in Blue Butterflies (Lepidoptera: Lycaenidae). Front. Zool. 2007, 4, 8. [Google Scholar] [CrossRef]
Figure 1.
Study sites in urban (black), forest (green), and orchard (yellow) habitats around the city of Giessen in central Hesse (Germany). For a distribution of the sample sizes among the study sites, see Tables S1 and S2.
Figure 1.
Study sites in urban (black), forest (green), and orchard (yellow) habitats around the city of Giessen in central Hesse (Germany). For a distribution of the sample sizes among the study sites, see Tables S1 and S2.

Figure 2.
Prey composition of Blue and Great Tits in different habitats. Frequency of occurrence (FO) of detected arthropod prey was analysed on order level. Orders are sorted by frequency (Lep = Lepidoptera, Hym = Hymenoptera, Ara = Araneae, Dip = Diptera, Hem = Hemiptera, Col = Coleoptera, Neu = Neuroptera). Significant differences are marked with * (Fisher’s exact test).

Figure 3.
Habitat differences in arthropod composition on family level, using non-metric multidimensional scaling (NMDS), and projected in two dimensions (NMDS1, NMDS2): (A) Great Tit nestling diet with Lepidoptera components only, (B) with other arthropod components and (C) arthropod communities on trees. Figures show spider diagrams with 99% confidence ellipses. Habitats are marked with symbols and colours (forest = green triangles, orchard = yellow squares, urban sites = black crosses).

Figure 4.
Inter-specific differences in the nestling diets of Blue Tits (blue) and Great Tits (red) using non-metric multidimensional scaling (NMDS) projected in two dimensions (NMDS1/NMDS2). Diet compositions are grouped on family level: (A) all prey taxa, (B) Lepidoptera components only and (C) other arthropod components in forest (triangles), orchards (squares), and urban sites (crosses). Figures show spider diagrams with 99% confidence ellipses.

Figure 5.
Manly’s selectivity index for dietary components in the nestling diet of Blue (a–c); and Great Tits (d–f) in different habitats. Error bars show 95% confidence interval. A selectivity index greater than 1 indicates a selectivity over the availability in the habitat.
Figure 5.
Manly’s selectivity index for dietary components in the nestling diet of Blue (a–c); and Great Tits (d–f) in different habitats. Error bars show 95% confidence interval. A selectivity index greater than 1 indicates a selectivity over the availability in the habitat.


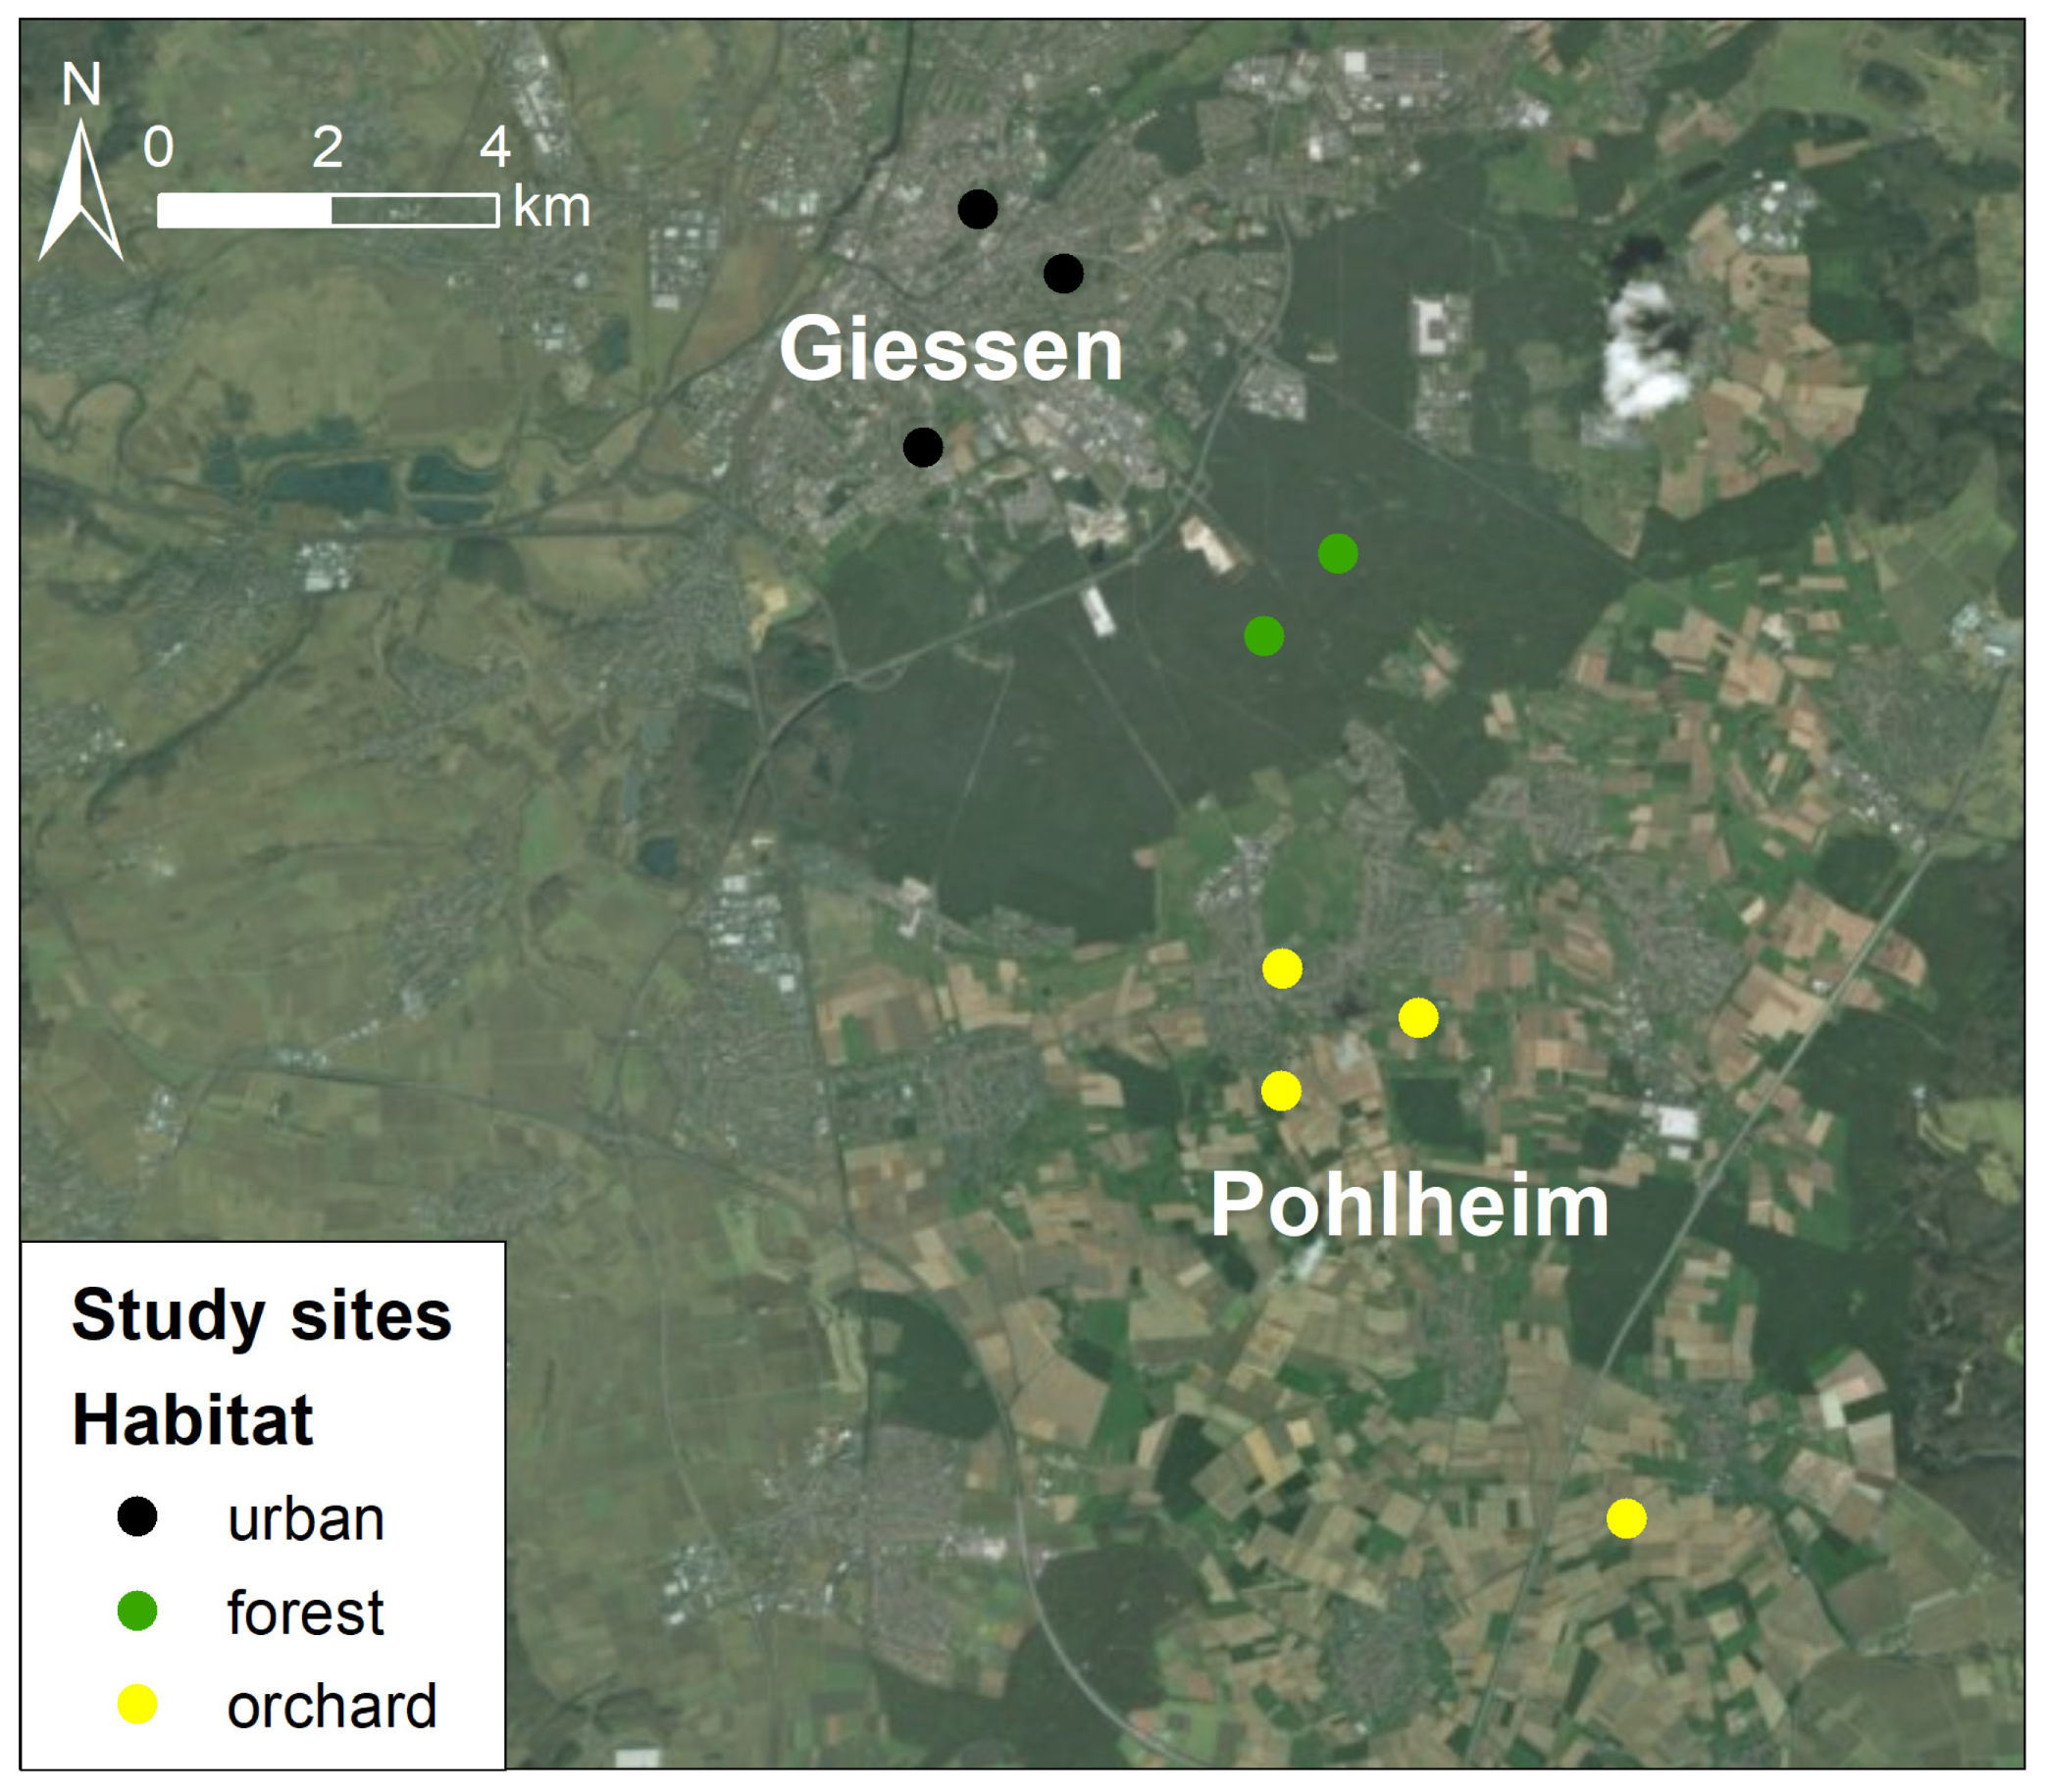
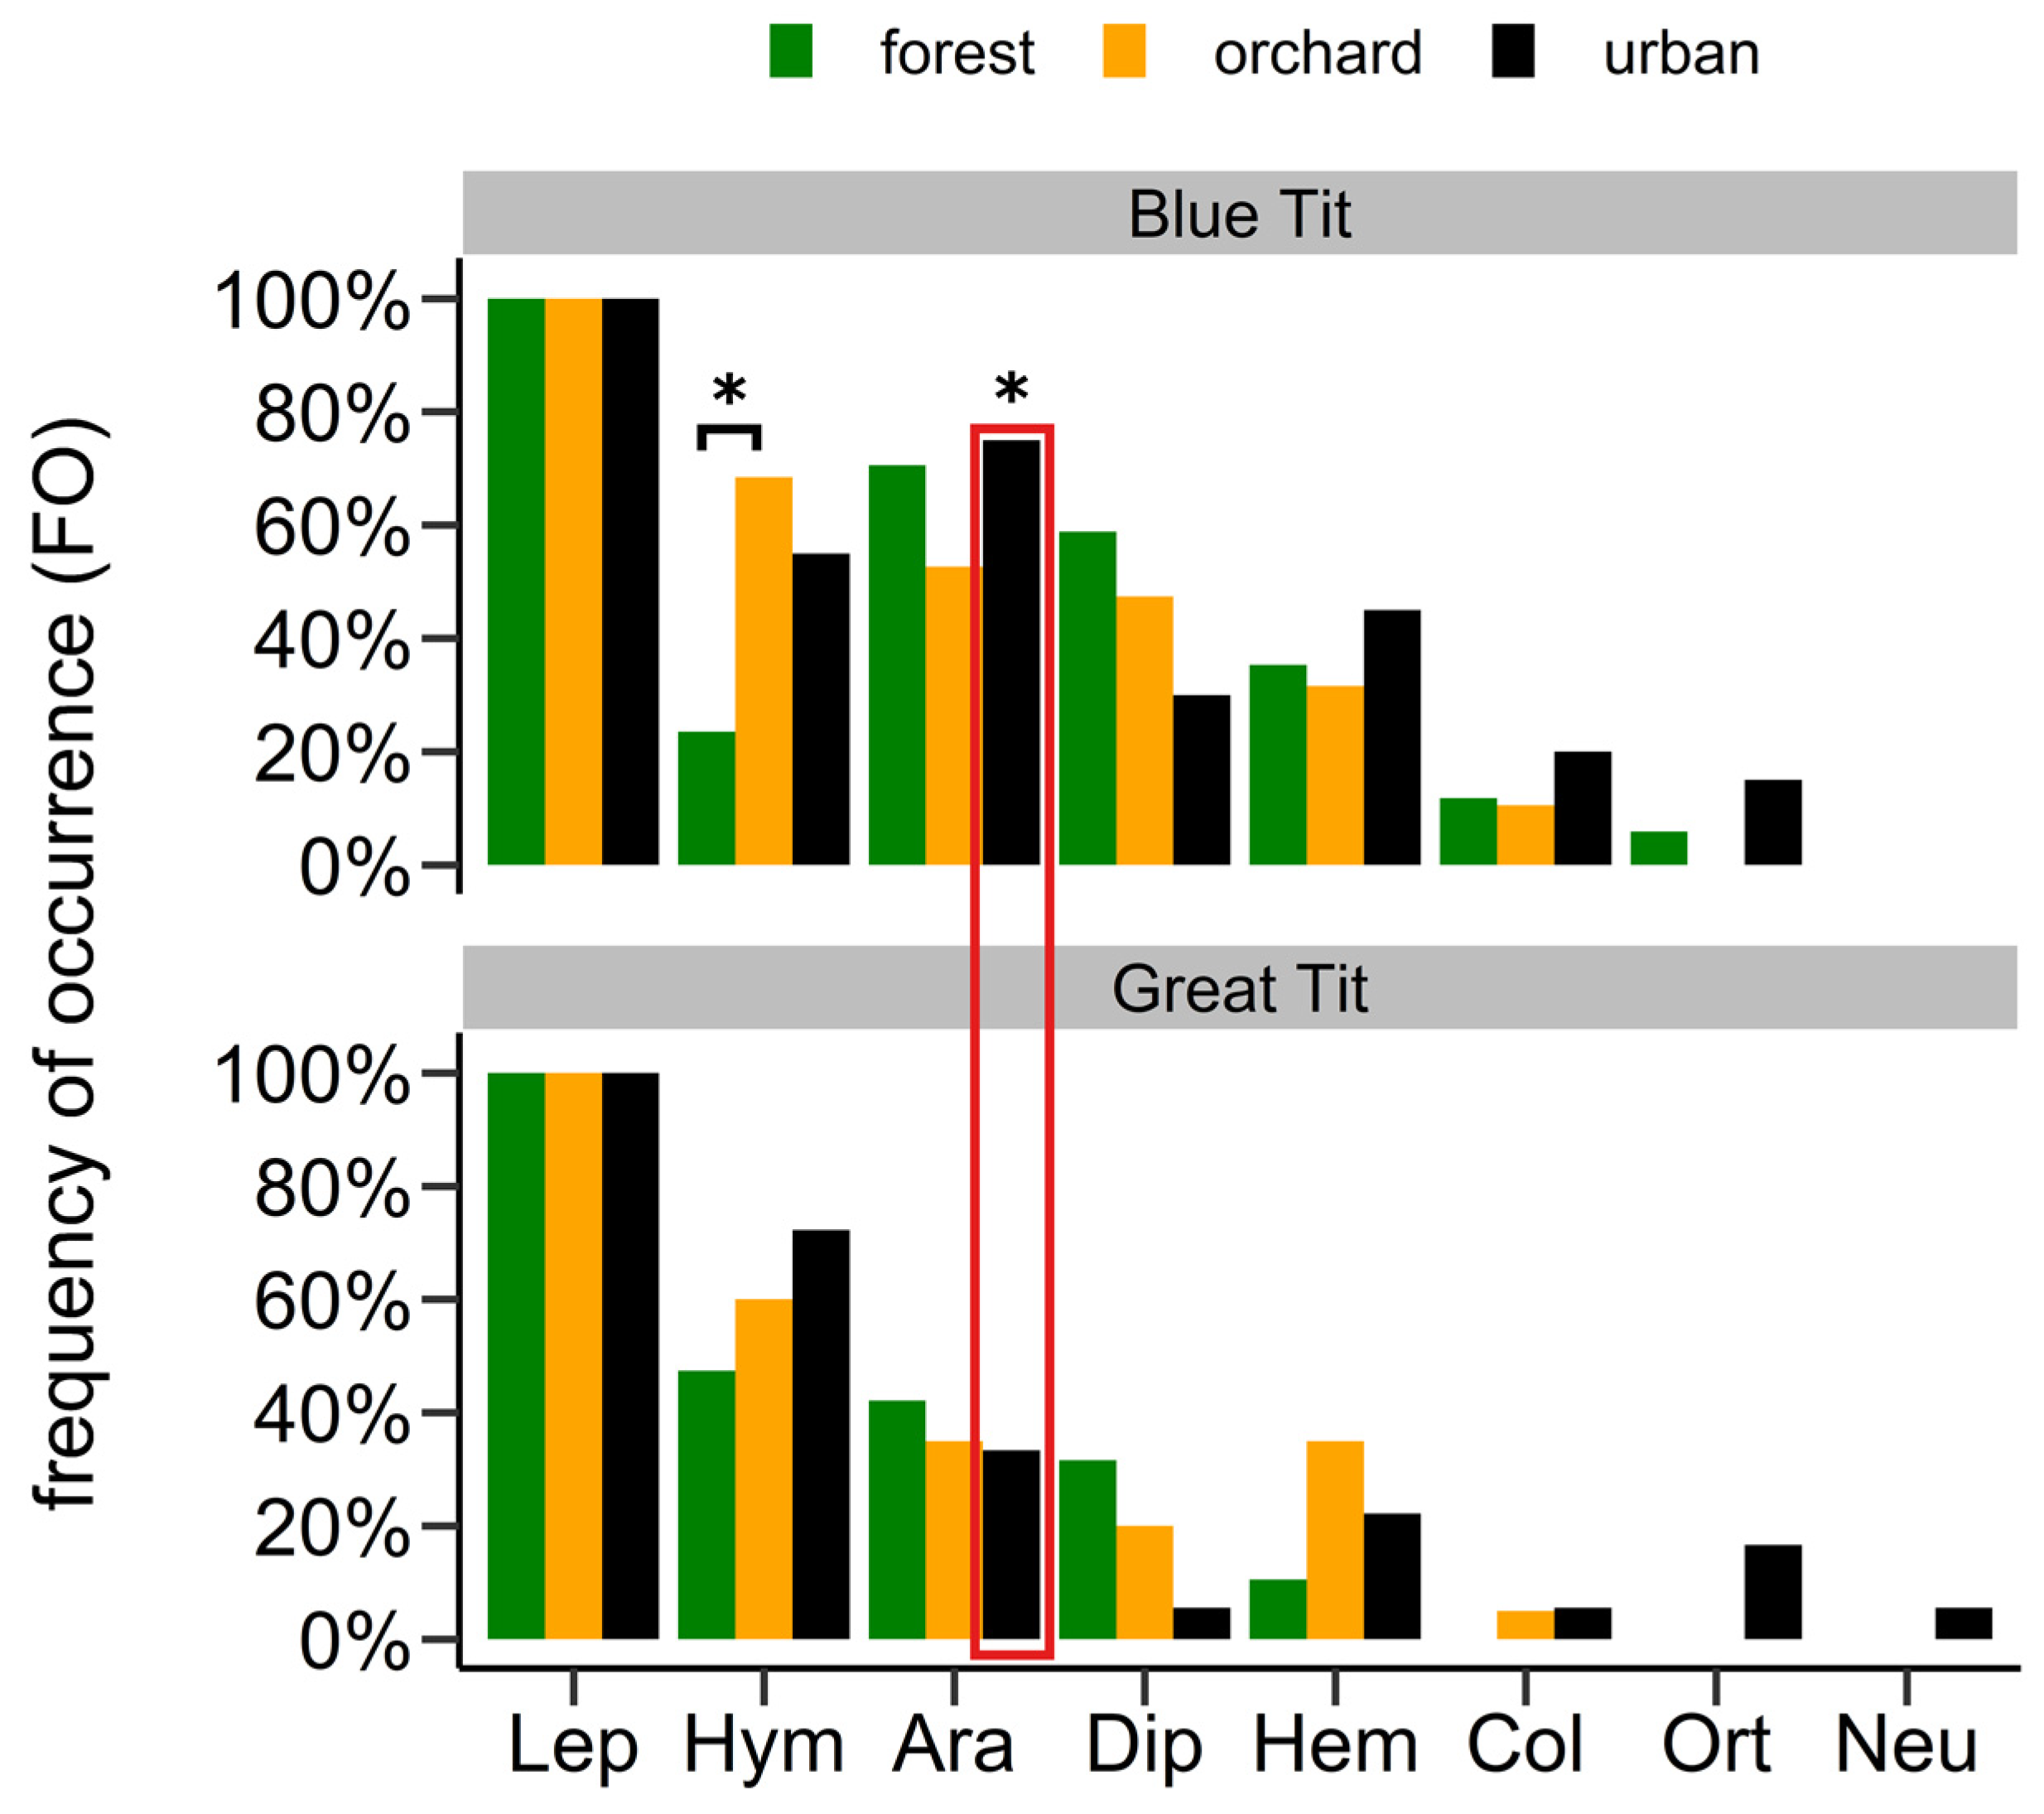
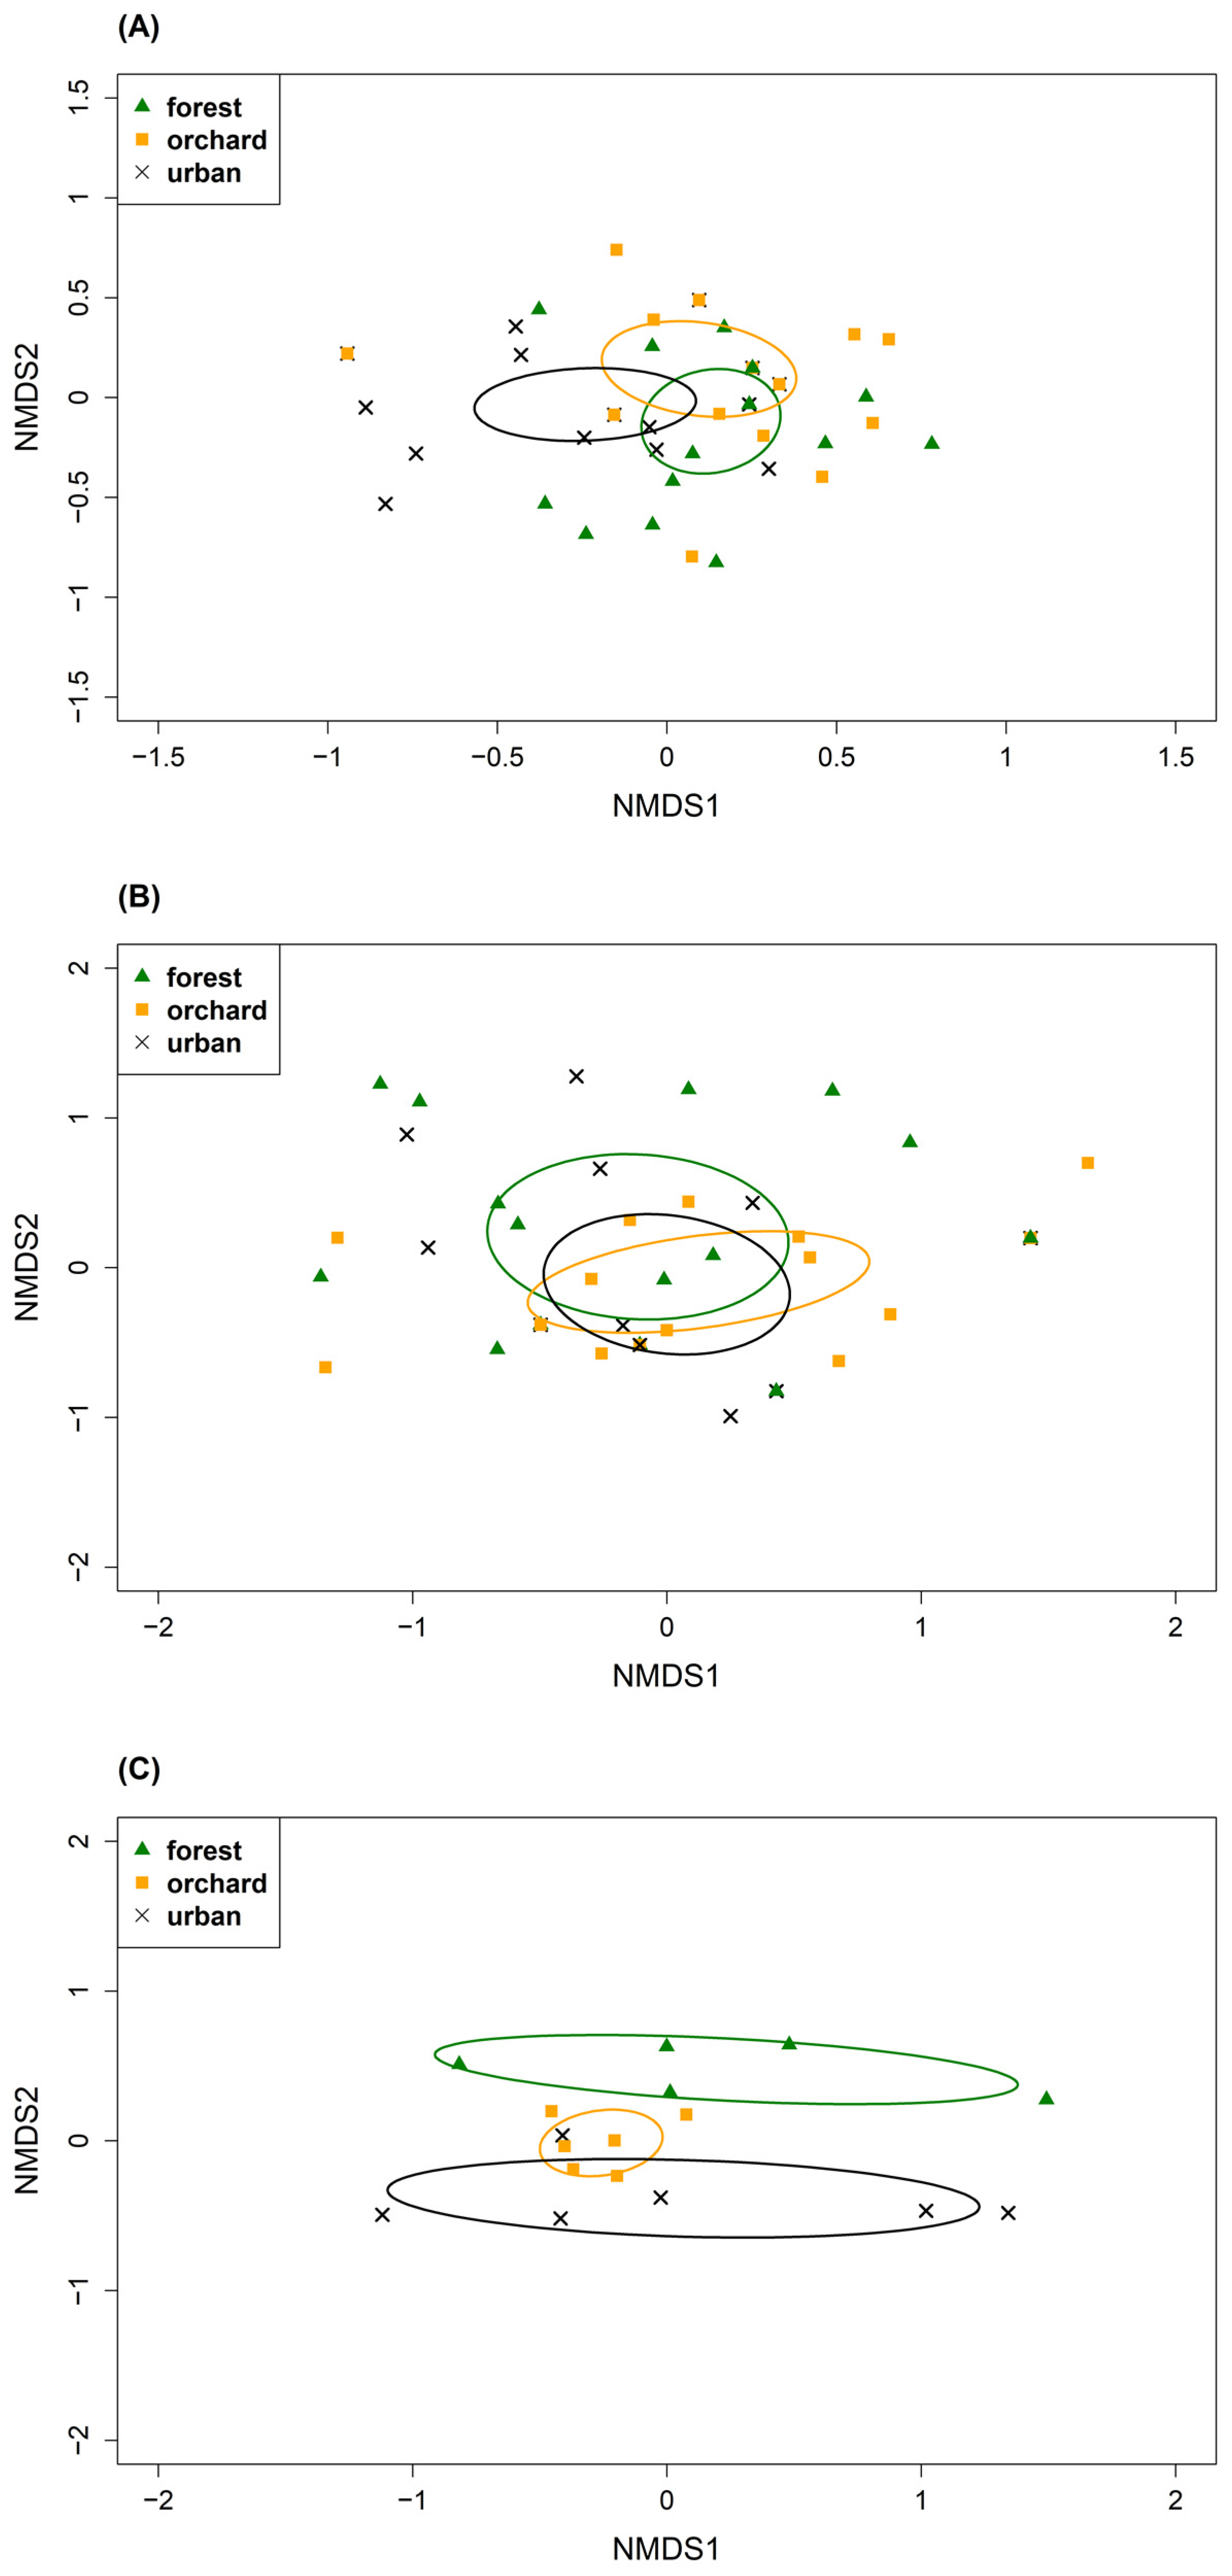
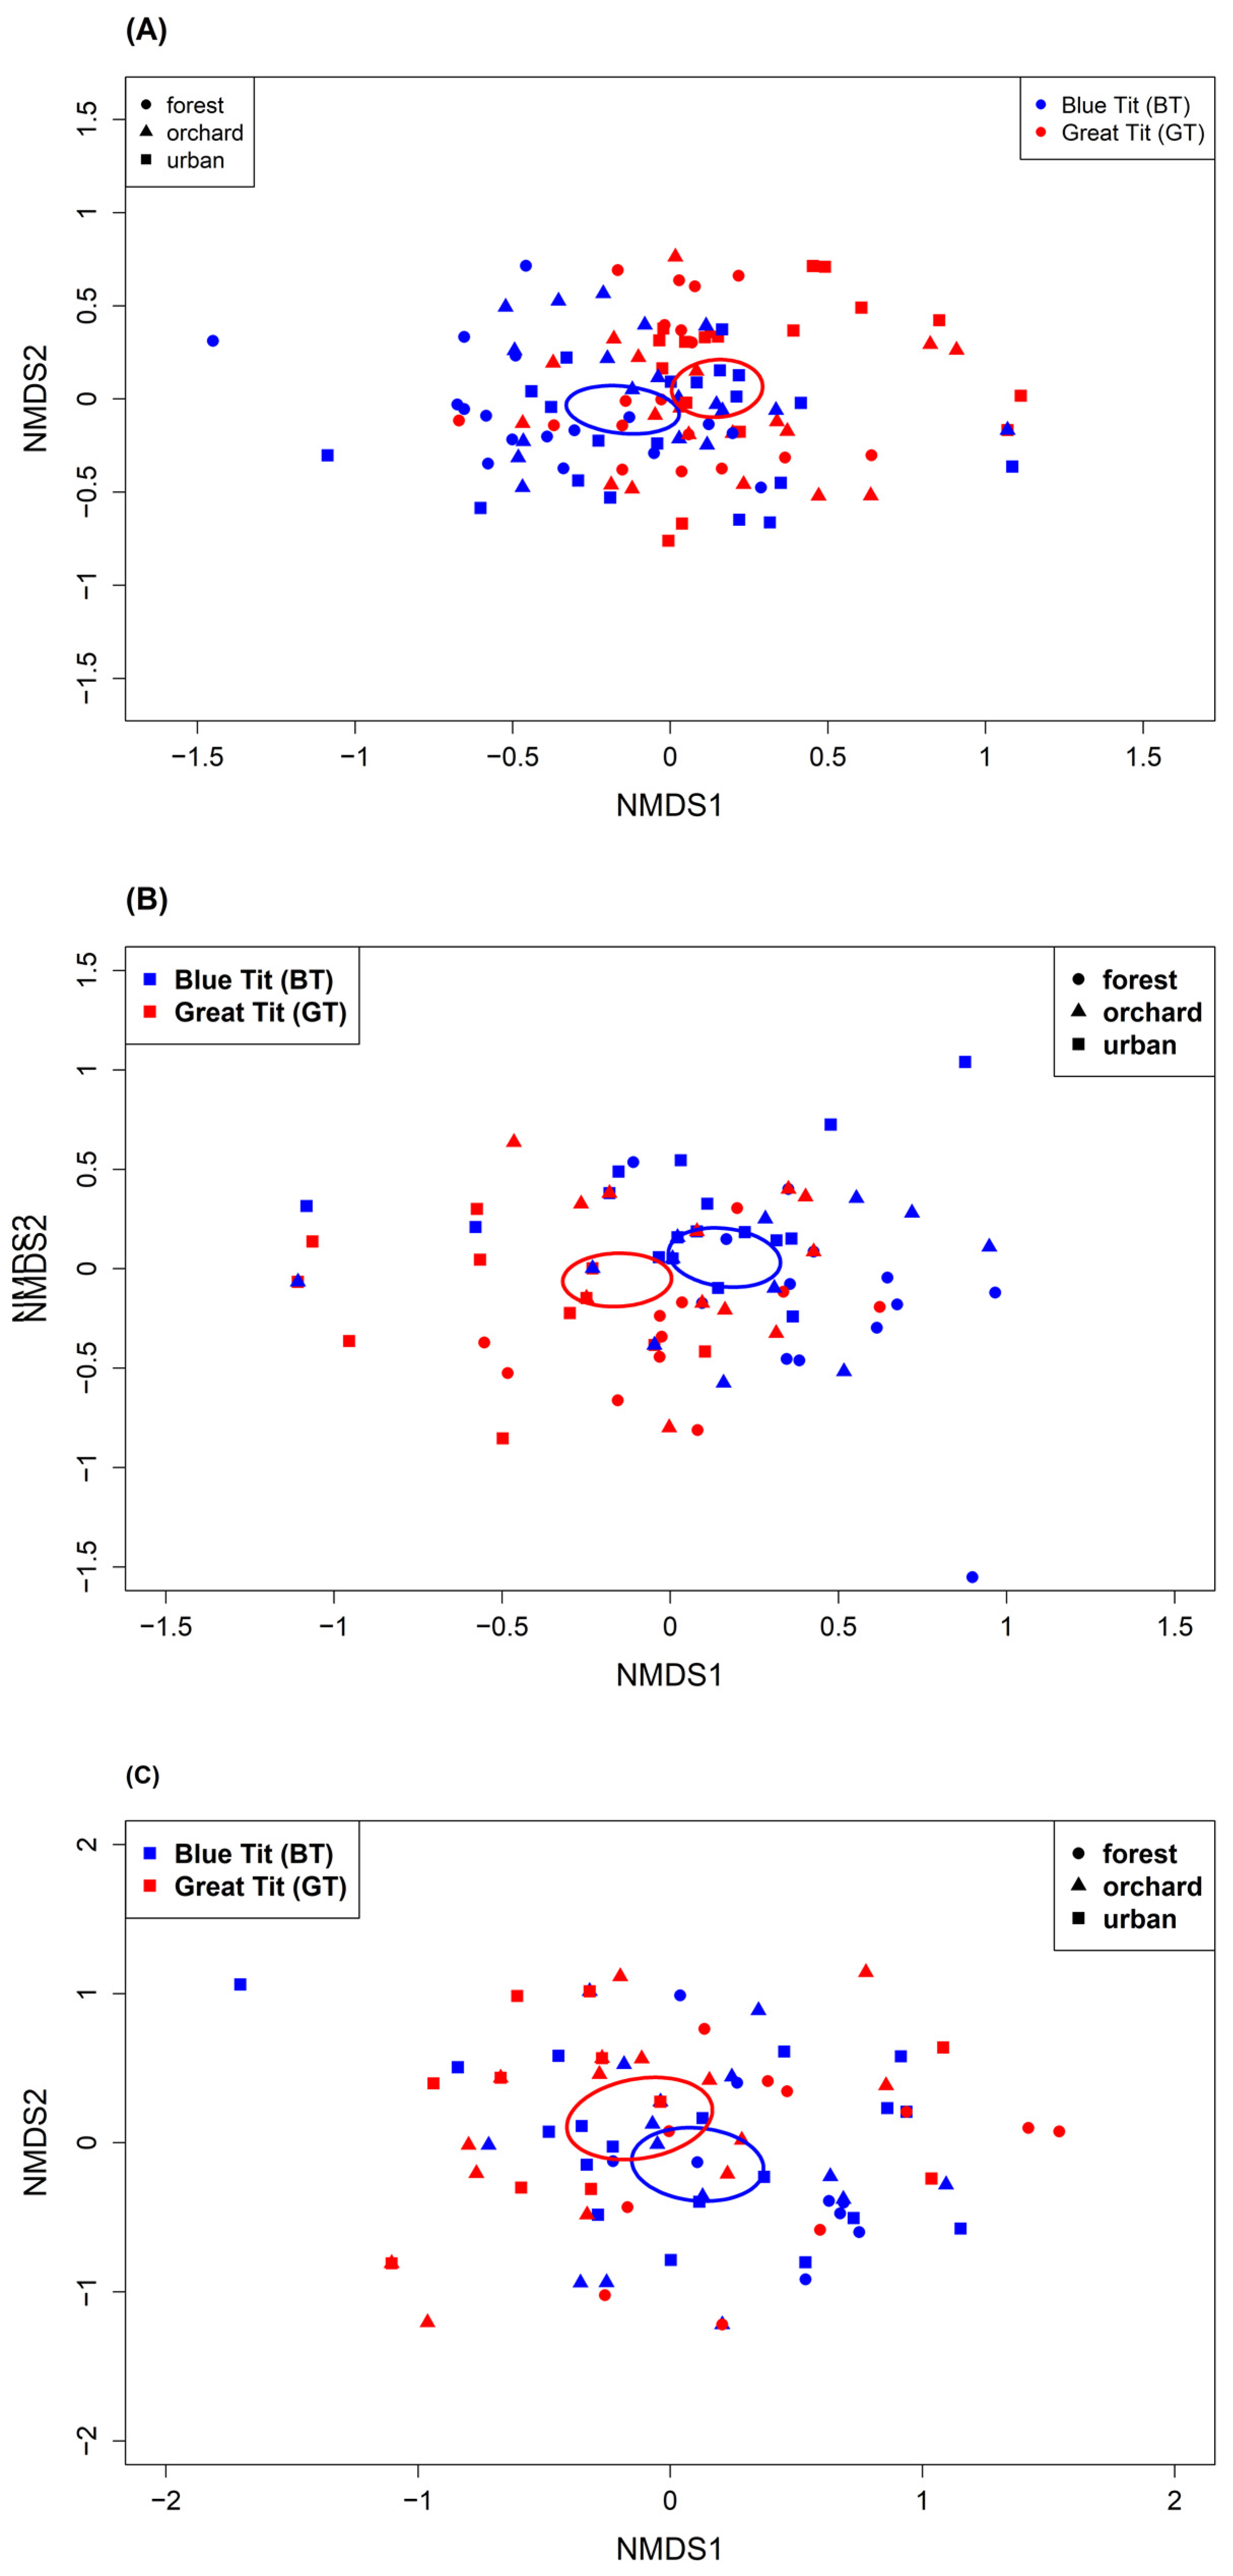
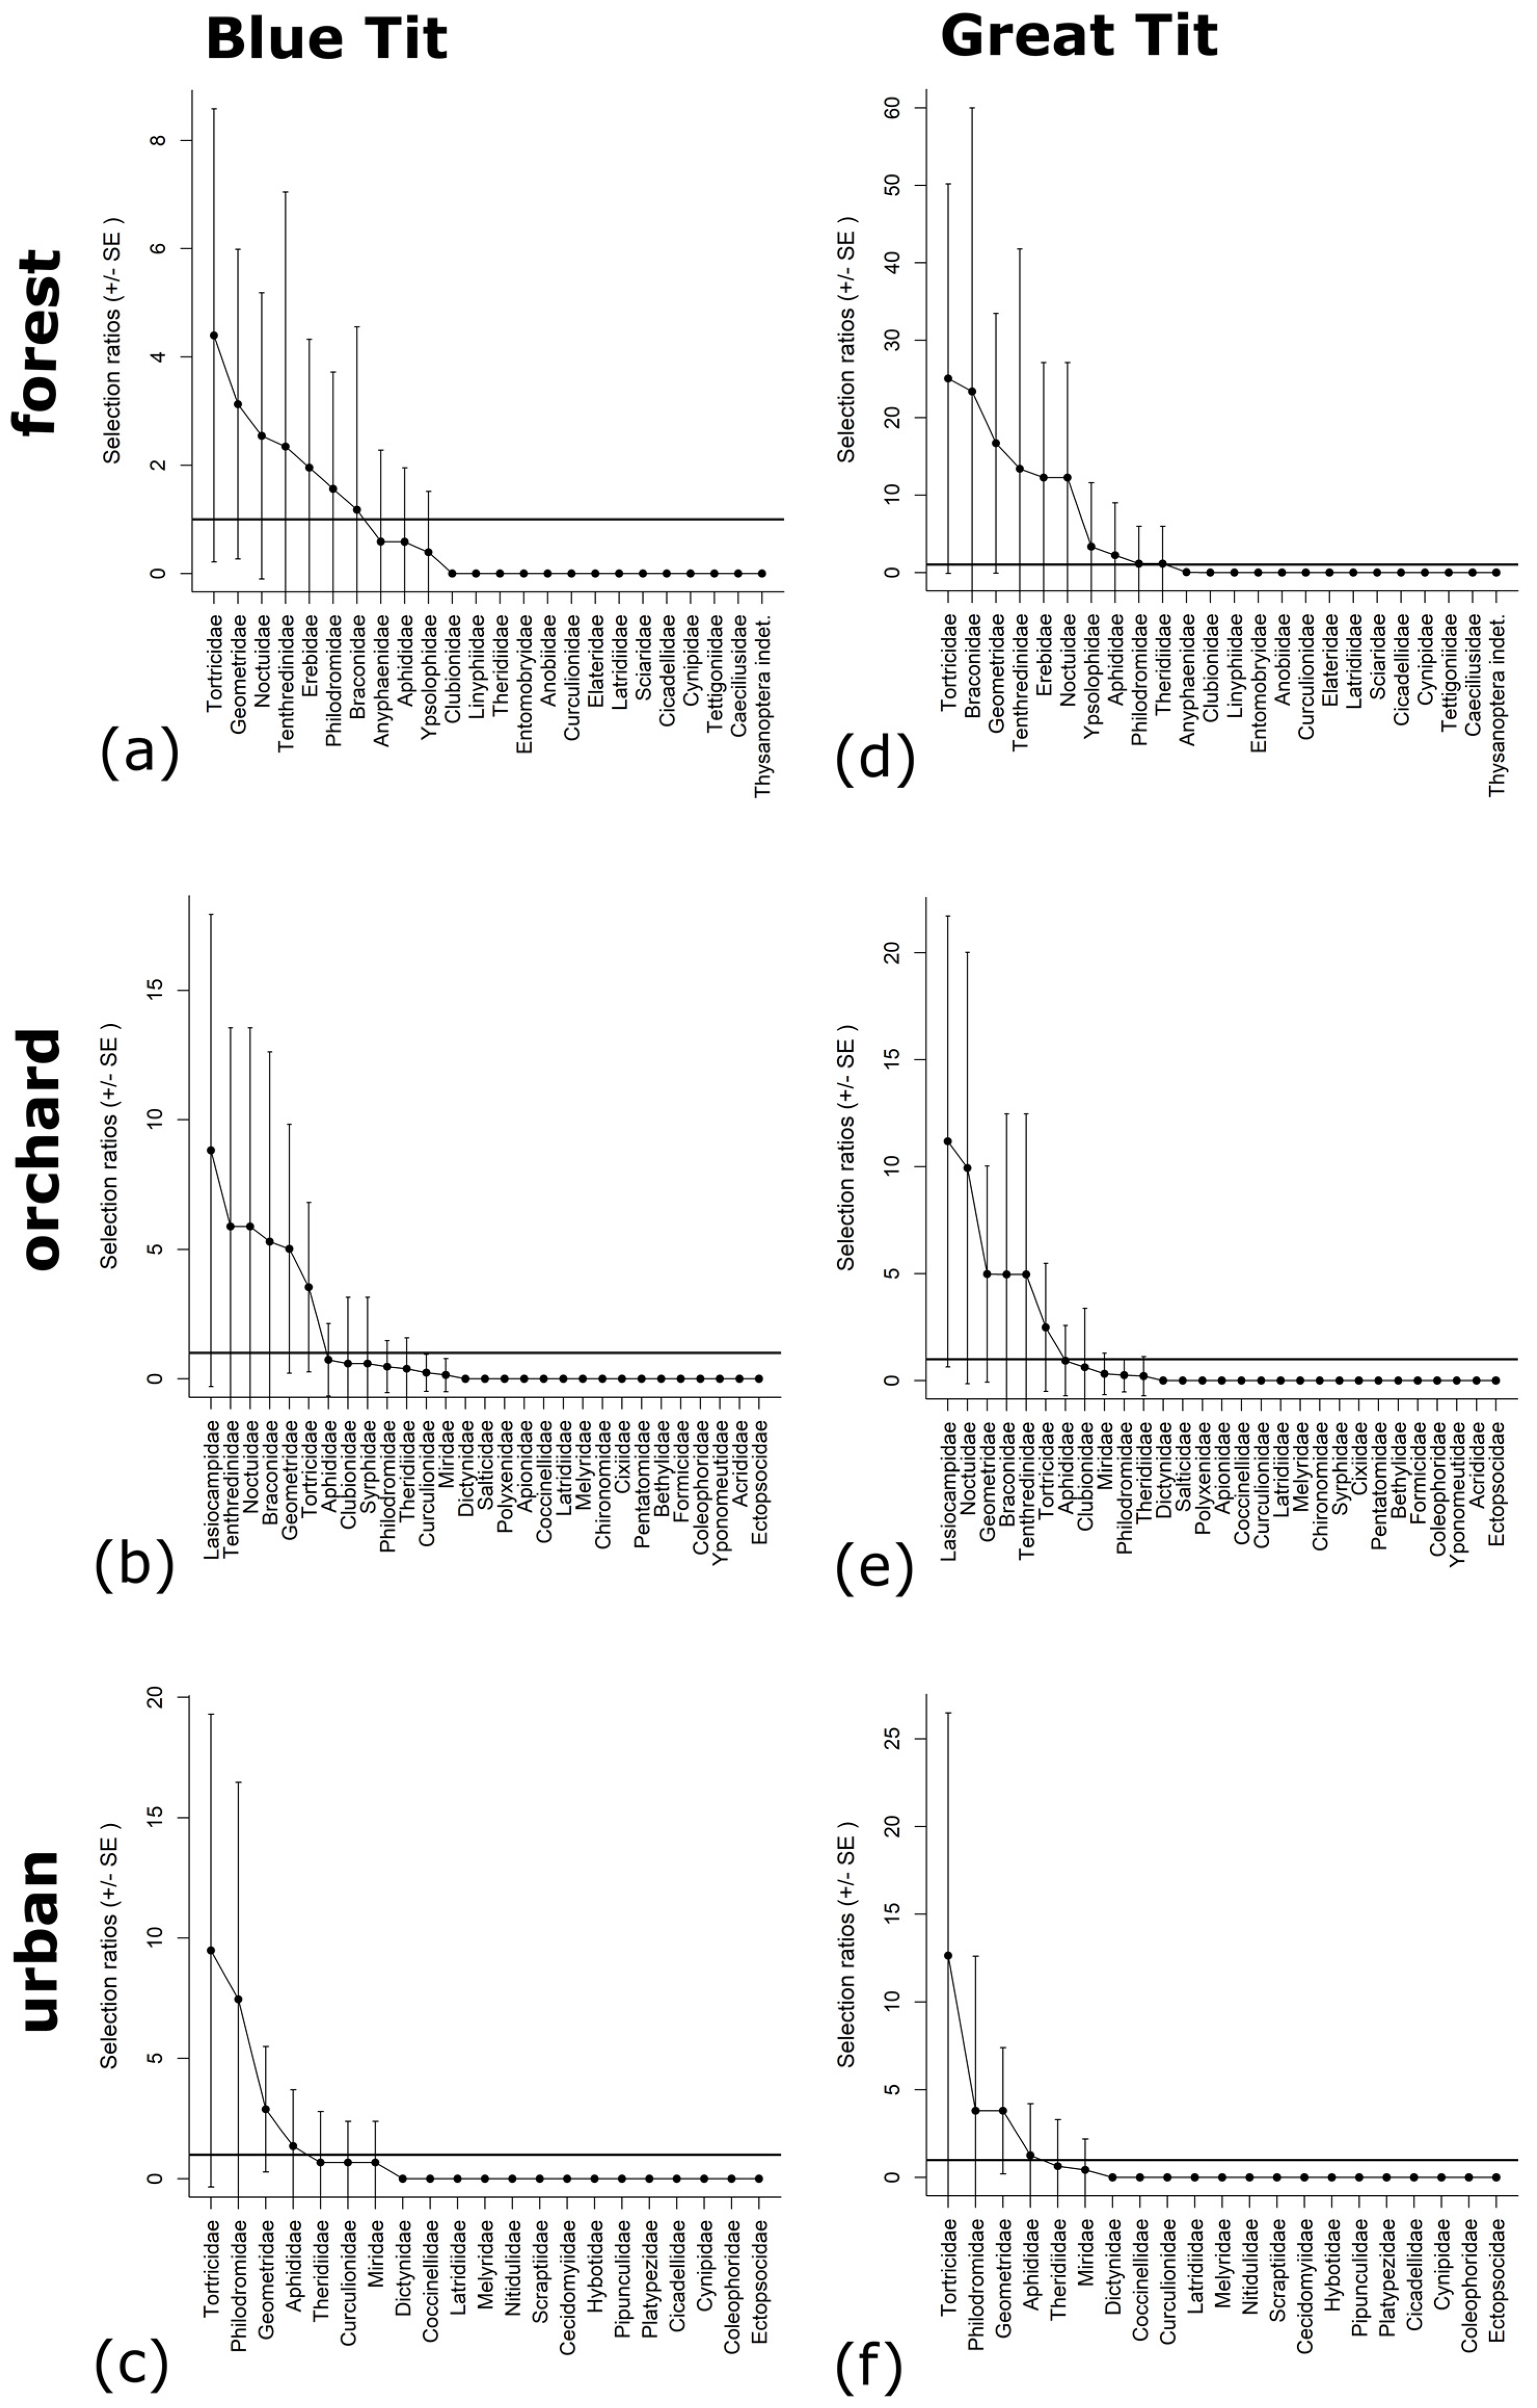
Table 1.
Sample sizes of nestling faeces from breeding season 2019 in each sample processing step amplified with ANML adapter primers and index primers. Nest numbers of final samples are given in brackets.
Table 1.
Sample sizes of nestling faeces from breeding season 2019 in each sample processing step amplified with ANML adapter primers and index primers. Nest numbers of final samples are given in brackets.
| Blue Tit | Great Tit | |||||
|---|---|---|---|---|---|---|
| Sample Processing Steps | Forest | Orchard | Urban | Forest | Orchard | Urban |
| (1) PCR products in NGS Library for sequencing | 20 | 19 | 20 | 20 | 20 | 20 |
| (2) successfully sequenced samples | 17 | 19 | 20 | 19 | 20 | 18 |
| (3) after manual filtering steps to avoid false positives | 17 (11) | 19 (12) | 20 (15) | 19 (10) | 20 (17) | 18 (15) |
Table 2.
Diet composition of Blue and Great Tit nestlings in the breeding season 2019 in forest, orchard and urban habitats (primer ANML). MOTUs in faecal samples are grouped at family level and summarized for prevalence (Prev) and frequency of occurrence (% FO). n = number of faecal samples with at least one detected MOTU.
| % FO | Blue Tit | Great Tit | |||||||
|---|---|---|---|---|---|---|---|---|---|
| Prev All | All | Forest | Orchard | Urban | Forest | Orchard | Urban | ||
| Order | Family | n = 113 | n = 113 | n = 17 | n = 19 | n = 20 | n = 19 | n = 20 | n = 18 |
| Araneae | Anyphaenidae | 14 | 12.4 | 11.8 | 5.3 | 20.0 | 15.8 | 20.0 | |
| Araneae | Araneidae | 8 | 7.1 | 17.6 | 21.1 | 5.3 | |||
| Araneae | Clubionidae | 6 | 5.3 | 5.3 | 10.0 | 5.0 | 11.1 | ||
| Araneae | Philodromidae | 29 | 25.7 | 47.1 | 21.1 | 55.0 | 5.3 | 10.0 | 16.7 |
| Araneae | Theridiidae | 7 | 6.2 | 10.5 | 10.0 | 5.3 | 5.0 | 5.6 | |
| Araneae | Thomisidae | 27 | 23.9 | 47.1 | 26.3 | 20.0 | 26.3 | 15.0 | 11.1 |
| Coleoptera | Buprestidae | 3 | 2.7 | 5.0 | 5.0 | 5.6 | |||
| Coleoptera | Curculionidae | 5 | 4.4 | 10.5 | 15.0 | ||||
| Coleoptera | Elateridae | 1 | 0.9 | 5.6 | |||||
| Coleoptera | Tenebrionidae | 2 | 1.8 | 11.8 | |||||
| Diptera | Asilidae | 1 | 0.9 | 5.3 | |||||
| Diptera | Muscidae | 3 | 2.7 | 11.8 | 5.0 | ||||
| Diptera | Phoridae | 1 | 0.9 | 5.0 | |||||
| Diptera | Psychodidae | 1 | 0.9 | 5.0 | |||||
| Diptera | Syrphidae | 6 | 5.3 | 11.8 | 5.3 | 5.0 | 5.3 | 5.6 | |
| Diptera | Tachinidae | 32 | 28.3 | 58.8 | 47.4 | 25.0 | 21.1 | 15.0 | 5.6 |
| Hemiptera | Aphididae | 25 | 22.1 | 17.6 | 26.3 | 30.0 | 10.5 | 30.0 | 16.7 |
| Hemiptera | Miridae | 10 | 8.8 | 17.6 | 5.3 | 15.0 | 10.0 | 5.6 | |
| Hemiptera | Pentatomidae | 1 | 0.9 | 5.0 | |||||
| Hymenoptera | Apidae | 4 | 3.5 | 5.9 | 10.0 | 5.6 | |||
| Hymenoptera | Braconidae | 46 | 40.7 | 11.8 | 47.4 | 45.0 | 36.8 | 40.0 | 61.1 |
| Hymenoptera | Ichneumonidae | 1 | 0.9 | 5.3 | |||||
| Hymenoptera | Tenthredinidae | 42 | 37.2 | 23.5 | 52.6 | 35.0 | 21.1 | 40.0 | 50.0 |
| Lepidoptera | Chimabachidae | 3 | 2.7 | 17.6 | |||||
| Lepidoptera | Crambidae | 1 | 0.9 | 5.3 | |||||
| Lepidoptera | Drepanidae | 12 | 10.6 | 29.4 | 5.3 | 15.8 | 15.0 | ||
| Lepidoptera | Erebidae | 36 | 31.9 | 58.8 | 21.1 | 10.0 | 57.9 | 20.0 | 27.8 |
| Lepidoptera | Geometridae | 93 | 82.3 | 94.1 | 89.5 | 85.0 | 78.9 | 80.0 | 66.7 |
| Lepidoptera | Lasiocampidae | 97 | 85.8 | 58.8 | 78.9 | 90.0 | 94.7 | 90.0 | 100.0 |
| Lepidoptera | Lycaenidae | 14 | 12.4 | 23.5 | 5.3 | 25.0 | 5.3 | 10.0 | 5.6 |
| Lepidoptera | Noctuidae | 73 | 64.6 | 76.5 | 52.6 | 85.0 | 57.9 | 80.0 | 33.3 |
| Lepidoptera | Notodontidae | 19 | 16.8 | 17.6 | 5.3 | 25.0 | 21.1 | 15.0 | 16.7 |
| Lepidoptera | Pyralidae | 18 | 15.9 | 35.3 | 21.1 | 30.0 | 5.3 | 5.0 | |
| Lepidoptera | Tortricidae | 84 | 74.3 | 88.2 | 94.7 | 70.0 | 78.9 | 60.0 | 55.6 |
| Lepidoptera | Yponomeutidae | 1 | 0.9 | 5.0 | |||||
| Lepidoptera | Ypsolophidae | 30 | 26.5 | 11.8 | 15.8 | 35.0 | 15.8 | 35.0 | 44.4 |
| Neuroptera | Hemerobiidae | 1 | 0.9 | 5.6 | |||||
| Orthoptera | Acrididae | 7 | 6.2 | 5.9 | 15.0 | 16.7 | |||
Table 3.
Comparison of biodiversity at the family level grouped by (a) Lepidoptera; and (b) other arthropods in the diet of Blue and Great Tit nestlings among forest, orchard and urban sites.
Table 3.
Comparison of biodiversity at the family level grouped by (a) Lepidoptera; and (b) other arthropods in the diet of Blue and Great Tit nestlings among forest, orchard and urban sites.
| Species | Habitat | Shannon Index H’ | Evenness E | Jaccard Similarity Index CCJ | ||
|---|---|---|---|---|---|---|
| Orchard | Urban | |||||
| (a) Lepidoptera | Blue Tit | forest | 2.2 | 0.92 | 0.83 | 0.75 |
| orchard | 1.9 | 0.81 | 0.75 | |||
| urban | 2.1 | 0.89 | ||||
| Great Tit | forest | 2.0 | 0.86 | 1.00 | 0.80 | |
| orchard | 2.0 | 0.87 | 0.80 | |||
| urban | 1.9 | 0.90 | ||||
| (b) other arthopods | Blue Tit | forest | 2.4 | 0.91 | 0.56 | 0.58 |
| orchard | 2.3 | 0.88 | 0.67 | |||
| urban | 2.5 | 0.91 | ||||
| Great Tit | forest | 2.2 | 0.90 | 0.47 | 0.44 | |
| orchard | 2.7 | 0.89 | 0.61 | |||
| urban | 2.5 | 0.84 | ||||
Disclaimer/Publisher’s Note: The statements, opinions and data contained in all publications are solely those of the individual author(s) and contributor(s) and not of MDPI and/or the editor(s). MDPI and/or the editor(s) disclaim responsibility for any injury to people or property resulting from any ideas, methods, instructions or products referred to in the content. |
© 2024 by the authors. Licensee MDPI, Basel, Switzerland. This article is an open access article distributed under the terms and conditions of the Creative Commons Attribution (CC BY) license (https://creativecommons.org/licenses/by/4.0/).
Share and Cite
MDPI and ACS Style
Höhn, D.; Masello, J.F.; Kümmel, M.N.; Griep, S.; Goesmann, A.; Quillfeldt, P. Nestling Diet of Two Sympatric Insectivorous Passerines in Different Habitats—A Metabarcoding Study. Birds 2024, 5, 67-89. https://doi.org/10.3390/birds5010005
AMA Style
Höhn D, Masello JF, Kümmel MN, Griep S, Goesmann A, Quillfeldt P. Nestling Diet of Two Sympatric Insectivorous Passerines in Different Habitats—A Metabarcoding Study. Birds. 2024; 5(1):67-89. https://doi.org/10.3390/birds5010005
Chicago/Turabian StyleHöhn, Daniel, Juan F. Masello, Marc N. Kümmel, Sven Griep, Alexander Goesmann, and Petra Quillfeldt. 2024. "Nestling Diet of Two Sympatric Insectivorous Passerines in Different Habitats—A Metabarcoding Study" Birds 5, no. 1: 67-89. https://doi.org/10.3390/birds5010005