
A Bird in the Hand Is Worth Two in the Bush: Bird Visibility as a Predictor of the Perception of Birds by Humans


Department of Biology, University of Tübingen, Auf der Morgenstelle 24, D-72076 Tübingen, Germany
*
Author to whom correspondence should be addressed.
Birds 2024, 5(1), 24-37; https://doi.org/10.3390/birds5010002
Submission received: 29 September 2023
/
Revised: 20 December 2023
/
Accepted: 22 December 2023
/
Published: 28 December 2023
(This article belongs to the Special Issue Birds and People)
Abstract
:Simple Summary
Human aspects of birds are becoming increasingly popular because birds fulfil an important function for human well-being. Recent studies used ecological indicators, like species richness or diversity, but specific species traits are usually not studied. Here, we studied two new variables, visibility duration and obstruction, which are relevant to human–bird encounters. Visibility measures, if and for how long a bird is visible. Obstruction measures to what extent the bird is concealed by vegetation. We collected behavioral data using focal animal sampling. This was combined with an assessment where experts scored the visibility of the different species on a scale from 1 to 5. We present data for 68 bird species, how visible and obstructed they are, and we assume that this may have an influence on the perception of the species by humans. The most important factor of visibility duration was species identity. Concerning obstruction, 34% of the variance was explained by species identity. A cluster analysis on the species level led to a three-cluster solution. The mean expert assessment significantly correlated positively with visibility duration (r = 0.803) and negatively with obstruction (r = −0.422). The behavioral trait of visibility may be an important aspect in the analysis of human–bird encounters but also for ecological bird studies.
Abstract
Human dimensions of birds are becoming increasingly popular. One aspect is charismatic species and their impact on nature conservation, and the other is the positive impact of birds on human well-being. Studies exploring these relationships are mostly based on species richness, but specific species traits are usually not studied. Here, we propose two new variables, visibility duration, and obstruction, being relevant to human–bird encounters. Visibility measures if and for how long a bird is visible. Obstruction measures to what extent the bird is concealed by vegetation. We collected behavioral data using focal animal sampling (3 min with blocks of 15 s, one-zero sampling). Additionally, species identity, sex, flocking (yes/no) and observation distance were collected. This was combined with an assessment where three experts scored the visibility of the different species on a scale from 1 to 5. The most significant predictor of visibility duration was species identity with an explained variance of 44%. Concerning obstruction, 34% of the variance was explained by species identity. Sex and flocking were not significant. A cluster analysis on the species level led to a three-cluster solution. The mean expert assessment correlated positively with visibility duration (r = 0.803) and negatively with obstruction (r = −0.422). The behavioral trait of visibility may be an important aspect in the analysis of human–bird encounters but also ecological bird studies.
1. Introduction
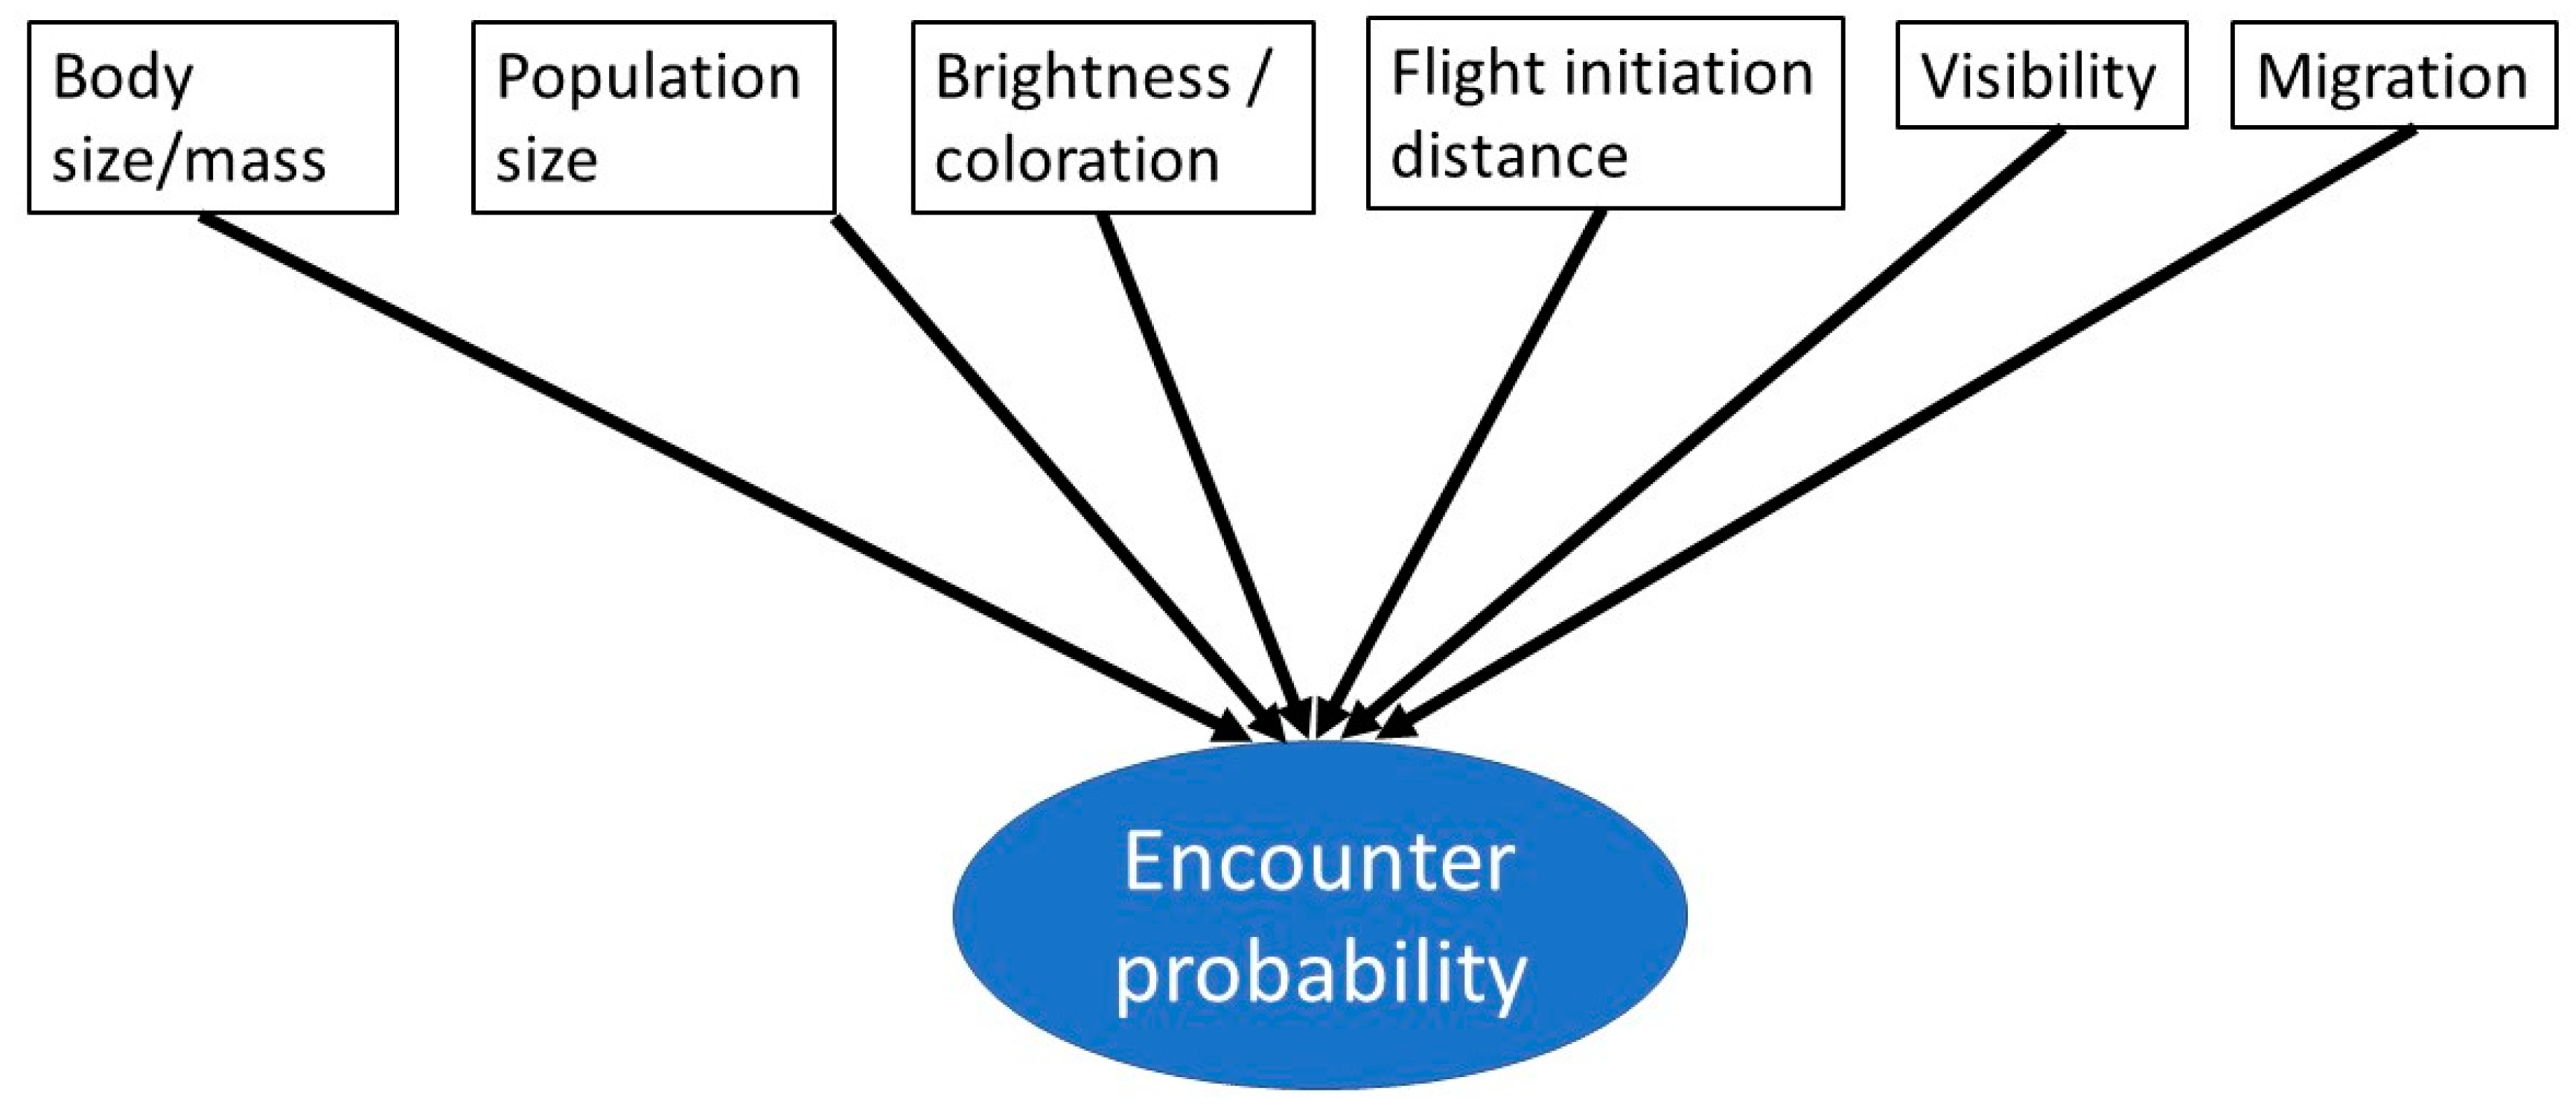
Human dimensions of wildlife, especially of birds, are an increasingly popular research topic [1,2,3,4,5]. One aspect may be the function of charismatic and/or iconic species for nature conservation purposes [6,7]. Another is centered within the framework of ecosystem services [8,9,10], showing the positive impact of bird species, such as, for example, bird song, on human health and well-being [11]. A general overview of bird–human relations has been recently provided by Tubelis [5]. This author refers to different human–bird interactions ([5], Figure 7, therein), which are related to the encounter probability of a given species. Encounter probability refers to the probability of encountering a given species in nature. Encounter probability is related to abundance, distribution, reaction to humans, size, behavior, and conspicuous plumage. This encounter probability is important to studying human–bird encounters, but not much has been published on this topic yet [12,13]. Based on this previous work, we propose an additional aspect to study human–bird encounters, namely visibility and obstruction of a bird species within the framework of encounter probability.
1.1. Why Encounter Probability Matters
Many studies showed a decline in biodiversity, avian richness, and abundance [14]. In line with the decrease in biodiversity, the term “Extinction of Experience” was coined to reflect that, in addition, the human experience of or encounter with biodiversity (and birds as part of it) also decreases significantly [15]. This means that both the species richness, diversity or abundance, as well as the knowledge of species, are declining in parallel. Thus, people encounter fewer species and individuals because of the biodiversity loss, but, in addition, nature-related knowledge is decreasing independently. While this extinction of experience as a whole is well-known, details on specific species are not readily available, meaning that there is some basic and unspecified knowledge that experience with nature in toto is decreasing, but details about species knowledge or experience of it are less known. However, to assess the human experience of birds, an encounter probability could serve as an important additional measure of experience that goes beyond simple measures of bird species richness or bird species diversity.
Further evidence comes from human psychological restoration in nature [3]. High species richness or high perceived biodiversity has a positive impact on human psychological restoration and well-being [16], but it is yet unknown which species are most relevant for this effect. Johansson et al. [17] therefore developed a framework to integrate wildlife presence and activity into the psychological or ecosystem service models that address the link between nature and psychological restoration. Thus, this acknowledges the importance of wildlife as a key feature of restoration in nature [17]. This is supported by recent studies on leisure and recreation, where respondents found that considering species as a highlight leads to higher visitor satisfaction and psychological restoration [3]. In addition to those studies focusing on species richness, abundance or diversity, which are general measures, an encounter probability of individual species might help to study the influence of discrete species on human well-being more deeply, because species that may be encountered with a high probability may have a stronger impact on psychological restoration.
1.2. The Theoretical Framing of Bird Encounter Probability
In two previous studies, Randler et al. [18] and Tan et al. [13] created an encounter probability score to explain the knowledge of park visitors, and the authors found that species with a high encounter probability were indeed better known by visitors. Components of this encounter score were abundance (number of breeding pairs in the park or number of individuals), body size, coloration, brightness, and tameness [18]. For example, a large bird like the Grey Heron (Ardea cinerea), which has a high encounter probability as it is quite common, can be encountered throughout the year and has a low flight initiation distance, whereas a rare warbler species (e.g., Aquatic Warbler Acrocephalus paludicola) has a low encounter probability as it is living in the swamps, is generally rare, and is a summer visitor. Intuitively, such an encounter probability might explain why some birds are well-known by the public or may have a higher impact on psychological restoration. However, two variables are not yet available in this framework and will be developed here: visibility duration and obstruction. These variables take behavior into account because some other species’ traits, such as body size or breeding populations, are elements of an encounter score but not behavioral traits. This visibility variable adds to the already existing variables for encounter probability in a meaningful way (Figure 1).
1.3. The Importance of Behavior on Visibility
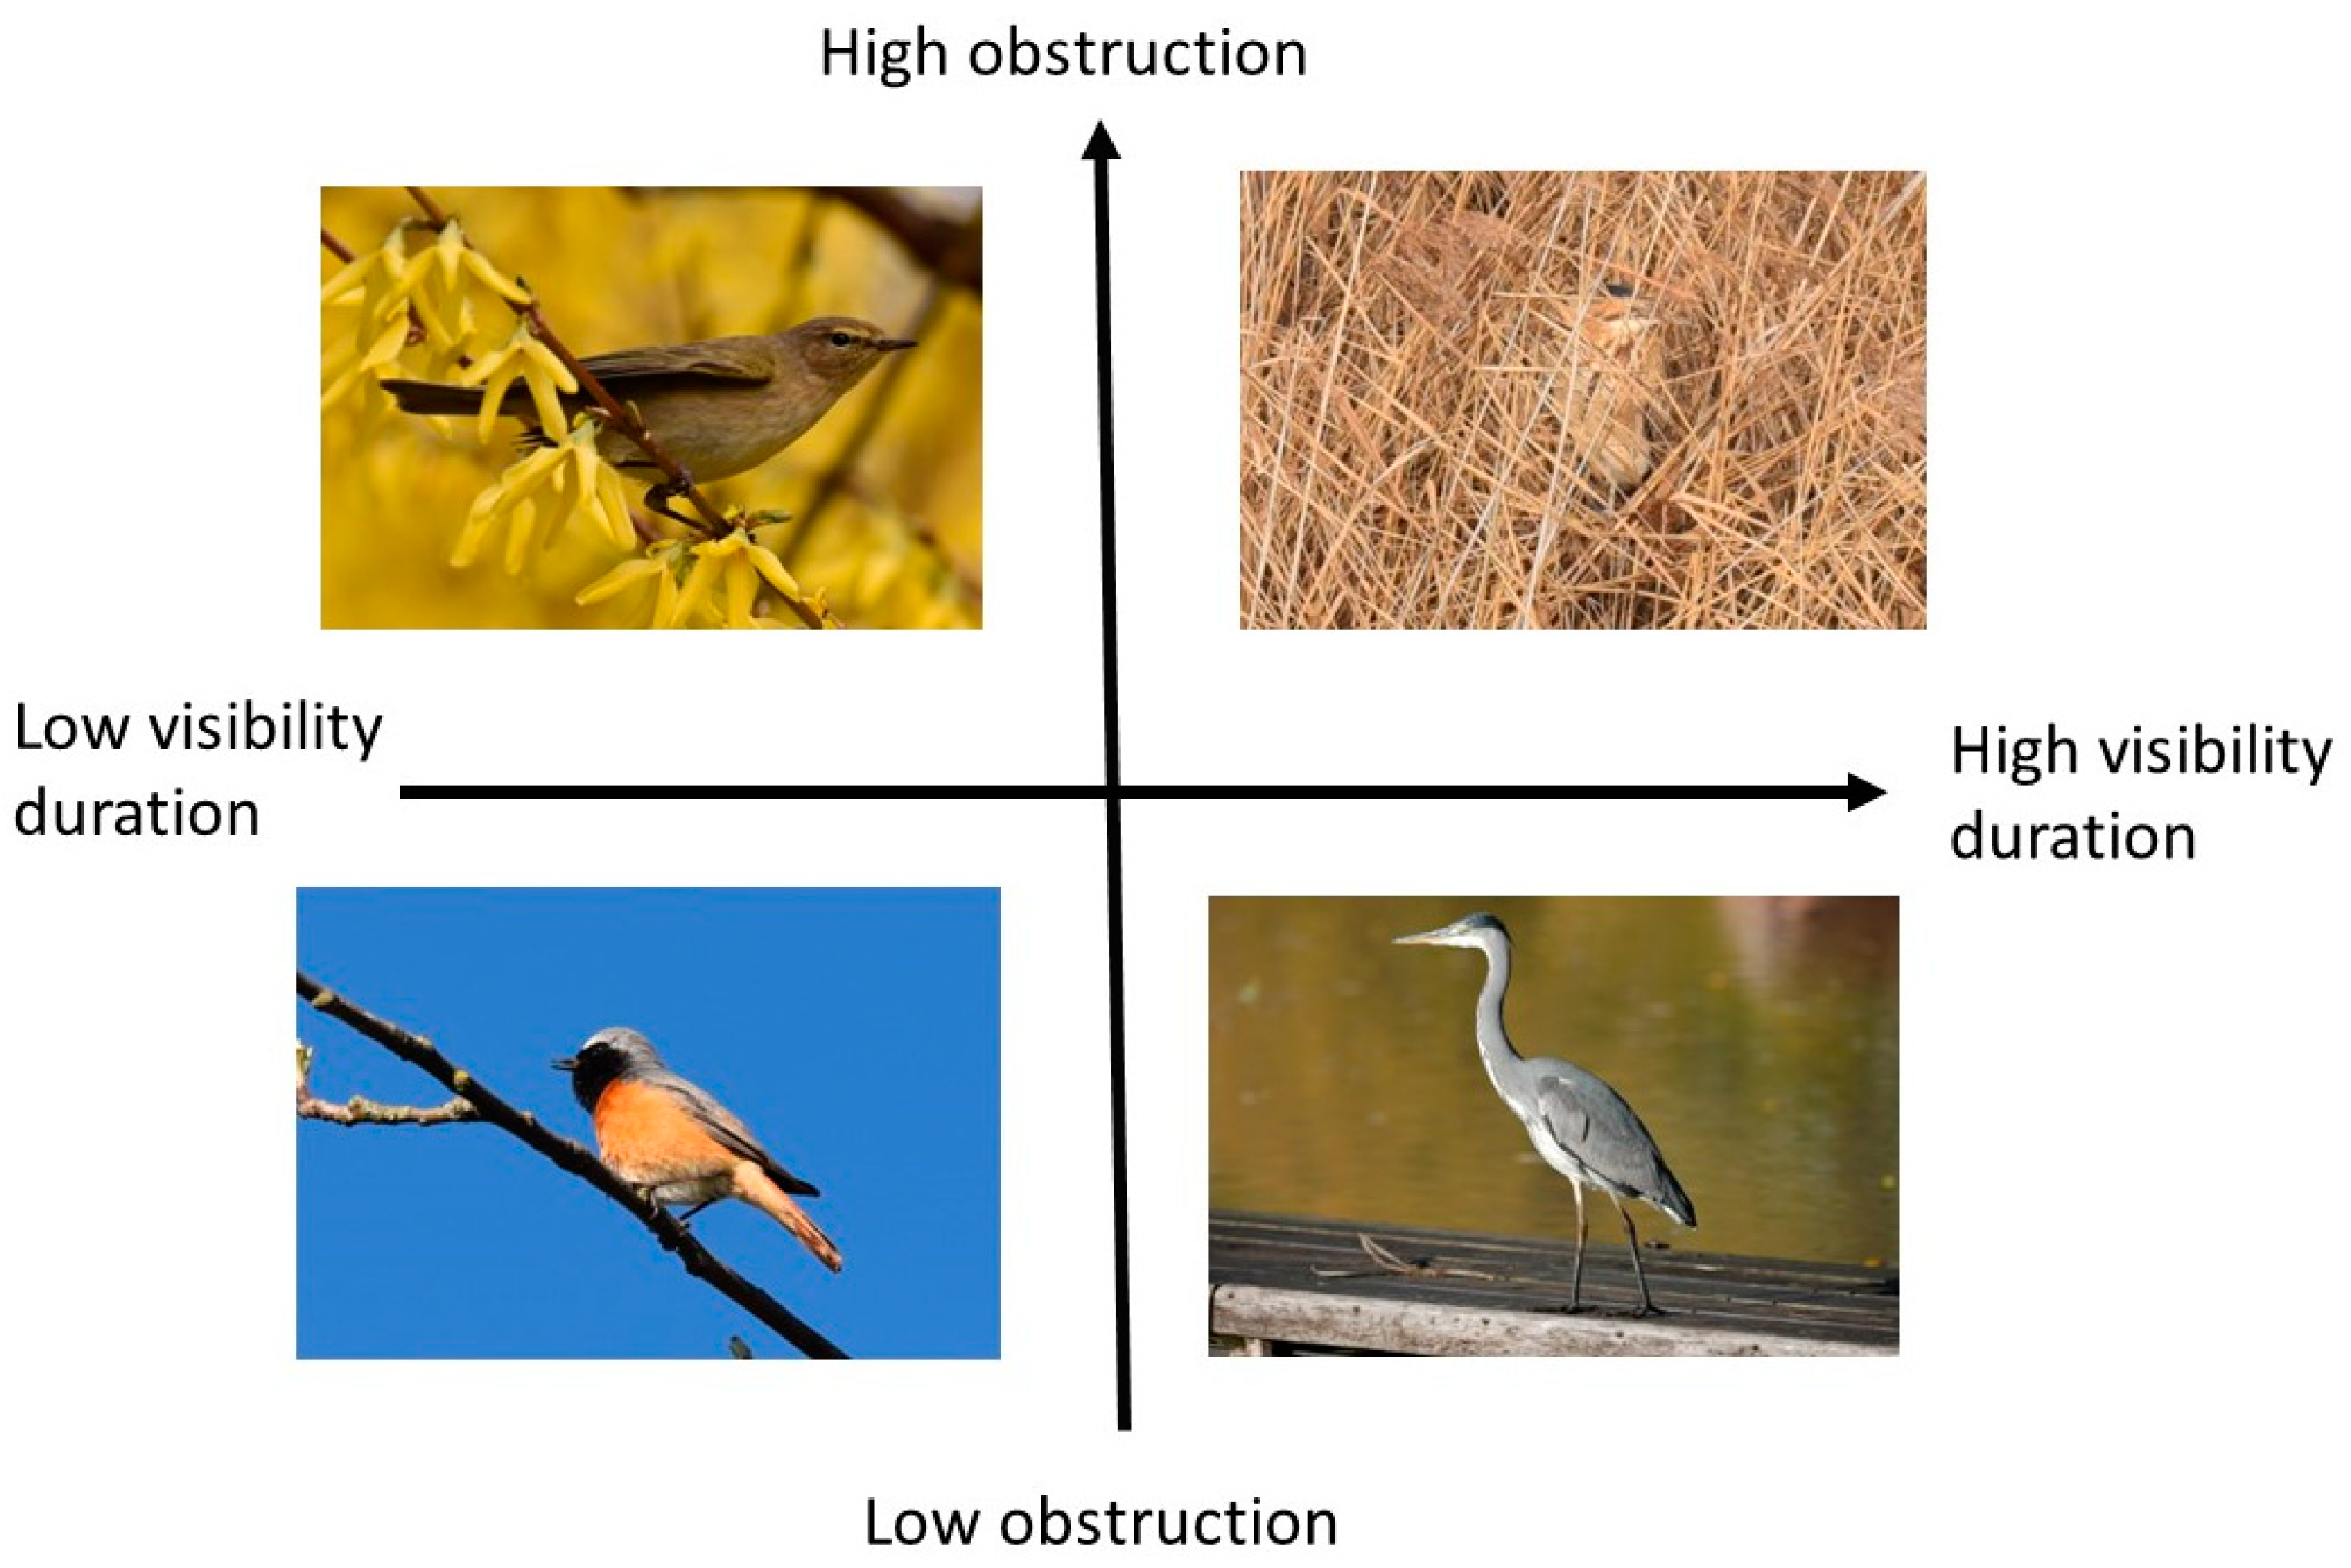
Behavioral patterns are usually less accounted for in studies on species traits. Visibility consists of two variables. Variable A (visibility duration) refers to the behavioral component, e.g., if a species is more static (e.g., Grey Heron) or hectic (e.g., Common Chiffchaff Phylloscopus collybita). This calculates the probability of a sighting within a fixed time—is the bird visible and for how long? Variable B is related to obstruction or concealment, another behavioral component that is related to hiding behavior or feeding. This variable measures to what extent the bird in question is concealed by vegetation. To illustrate these two variables, we postulate a theoretical model of visibility (long and short duration) and obstruction (low and high obstruction; Figure 2). Typical theoretical examples are the Grey Heron with a long duration and a low obstruction, the Common Redstart (Phoenicurus phoenicurus) with a low concealment but shorter visibility duration, the Common Chiffchaff with a low duration and high obstruction, and, finally, species like the Great Bittern (Botaurus stellaris) with a long visibility duration but a very high obstruction.
1.4. Goals of the Study
In this study, we developed the method of visibility scoring by collecting and presenting data on visibility duration and obstruction of different bird species by a behavioral sampling method. Further, we controlled for covariates and established values for the different species. To add external validity to the newly proposed variables, we applied an expert assessment with three experts, and we correlated the results with species traits like coloration and body mass.
2. Materials and Methods
2.1. Study Area
We chose eBird hotspots around Tübingen as study sites and also used ornitho.de to locate additional sites. The area has an elevation of about 400–600 m and is dominated by agricultural landscapes, forests (mainly broadleaf), and some larger watersheds, like lakes and ponds. The Neckar River stretches across the study area. Urbanization is confined to some smaller cities with 90,000 (Tübingen) to 120,000 (Reutlingen) inhabitants, with larger, more rural areas. The climate in Tübingen is about average for Baden–Württemberg. The mean annual temperature is 9.0 °C, and the long-term average annual rainfall of 741 mm is also about the average of Baden–Württemberg.
2.2. Fieldwork
The variables studied are depicted in Table 1. The new variable visibility measures how long and to what extent a bird is visible when it is present. The field procedure was adapted from the flight initiation studies (see, e.g., ref. [19]), but without the aim of flushing the birds. Birds were encountered using two different methods: (a) by walking around slowly and observing birds without flushing them, but to observe their undisturbed behavior, and (b) by sitting and waiting, e.g., on platforms or good birding spots. However, we cannot exclude that we did not flush a bird, because birds can leave an area before an observer detects the individual. Haphazard sampling was used, i.e., walking or waiting until a bird was visually or acoustically detected and then observed. Once a bird was detected the observer started the stopwatch. We used the focal animal sampling methods based on Martin & Bateson [20].
We observed the bird and noted its behavior. One category that is intended for the time not having seen the animal during the observation period is “time out”. In fact, “time out” is used as a waste category in classical behavioral biology because no behavior can be reported, but this category gained importance in our study, where we applied the “time out” category for the visibility duration. The “time out” category becomes an important and useful measure to study which species can be observed for longer periods and which cannot. We observed the birds for a standardized observation period of three minutes and assessed every 15 s whether the bird was visible or not in the last 15 s (following a one-zero sampling method; [20]). If the bird was visible during 15 s (1-0), the proportion of the body covered by vegetation or other obstructions was simultaneously scored as an obstruction score. Obstruction index was adopted from Boyer et al. [21] and Randler [22]. The minimum amount of obstruction during a 15 s sampling period was always used. Data of birds flying by were also collected because some species are rather skulk and can often be seen only during short flights (e.g., Sparrowhawk, Accipiter nisus). For every observation, it was noted whether it was possible to observe the whole period, whether the birds were leaving (flying away, hiding in dense vegetation), or whether it was flying by. Birds that were unintendedly flushed by the observer were not sampled.
Alternatively, when a bird was located precisely within a 2 m diameter and not seen despite three minutes of searching because it was fully hidden, the value zero was assigned for visibility duration. Additional variables were flock size, sex (in dichromatic species), whether the bird was detected first visually or acoustically and the distance between bird and observer measured in meters with the Nikon Aculon distance meter. As there are seasonal variations, e.g., due to leaf development in Central Europe, we restricted the study period to May/June when all bird species, including summer residents (migrants), are present in Central Europe [23]. In summary, we collected data for 68 bird species with at least ten observations each and a maximum of 22 observations.
2.3. Validation of the Observational Data with an Expert Assessment
In addition, we assessed the bird visibility with an expert assessment (three people), following the basic method of [24]. We chose experts with expertise in birds. These experts were part of the “medium to higher knowledge” segment of the German birder population and were able to visually identify between 100 and 200 species without a book or an app, which places their knowledge above the average birder [25]. For comparison: On average, birders who were not members of the highly specialized Club 300 were able to identify about 100 bird species, while members of Club 300 were able to identify about 450 on average [25]. Thus, our experts can be considered highly knowledgeable but not at an extremely high specialized level. The experts received a list of the 68 bird species with the following instruction: “Based purely on behavior—i.e., not considering plumage coloration, body size, flight distance, or abundance—what is the likelihood of actually seeing this bird species when it is present? Please refer to the months of May/June”. (Original German Version: “Rein vom Verhalten her gesehen—also ohne Berücksichtigung von Gefiederfärbung, Körpergröße, Fluchtdistanz oder Häufigkeit—wie hoch ist die Wahrscheinlichkeit, dass man diese Vogelart tatsächlich auch sehen kann, wenn sie anwesend ist? Beziehen Sie sich bitte auf die Monate Mai/Juni”). The experts scored the 68 bird species independently from each other. The score could range between 1 = very unlikely, to 5 = highly likely.
2.4. Additional Species Traits
To test for discriminant validity of body mass and coloration, we used data on the colorfulness of species and their body mass from the previous literature [4]. In that previous study, we took two approaches to study the coloration of birds., First, we used an expert assessment of three experts rating the brightness/colorfulness of species on a scale from 1–5 (high values, high colorfulness). This was combined with an assessment of lay persons (N = of 769 people; students and staff of the University of Tübingen) who estimated the color brightness of the bird species with a visual analogous scale that ranged from 0 to 100 (for details, please see the original publication [4]). Body mass was taken from [26].
2.5. Statistical Analysis
2.5.1. Fieldwork
It was not always possible to identify the sex of an observed individual (e.g., in monochromatic species); thus, for the linear modeling, sex was defined as male (N = 250) and female (N = 78) and undetermined as missing data (N = 609). Flock size was unequally distributed and therefore recoded as a single individual or individual in a flock. Observation distance and visibility score were slightly skewed towards higher values and were therefore log transformed. To control for some confounding effects, we applied a linear model based on an ANCOVA procedure with visibility duration and obstruction as dependent variables, and the sex of the bird, whether it was first detected by visual or acoustic cues, observation distance, flock size (single or in a flock), and species identity as fixed effect variables. For the post hoc tests, means and standard errors are presented.
For illustration of the variables, these were z-transformed, because visibility duration can reach values from 0 to 12, and obstruction reaches values from 1 to 5. To group the species into clusters, a two-step cluster analysis was used to establish the number of clusters to be specified, and, subsequently, a k means cluster analysis with the number of clusters suggested by the two-step analysis was calculated. SPSS 29 was used for all analyses.
2.5.2. Expert Assessment
For validation with the experts, we used Cronbach’s α as a measure of the reliability of the expert ratings. Correlations between visibility duration and obstruction from the fieldwork on the one side and the mean of the expert assessment on the other were analyzed with Pearson’s r correlation. For the correlation with species traits from the literature (body mass, coloration) we used Spearman’s rho because the literature data were not normally distributed.
3. Results
We collected data from 68 bird species, ranging from 10 to 22 observations per species (Appendix A, Table A1). Concerning visibility duration, only observation distance and species were significant predictors. The regression coefficient of distance was r = −0.735, T = −2.583, p = 0.011. However, species was the most important predictor with a partial eta-squared of 44% (Table 2).
Concerning obstruction, the individuals who were recognized first by sight had a lower obstruction (1.58 ± 0.12) than those first recognized by acoustic cues (2.09 ± 0.17). The variable species identity again produced a high amount of explained variance (34%; Table 3). Observation distance was also a significant predictor (p = 0.013). Importantly, there were no significant effects of sex and flock size.
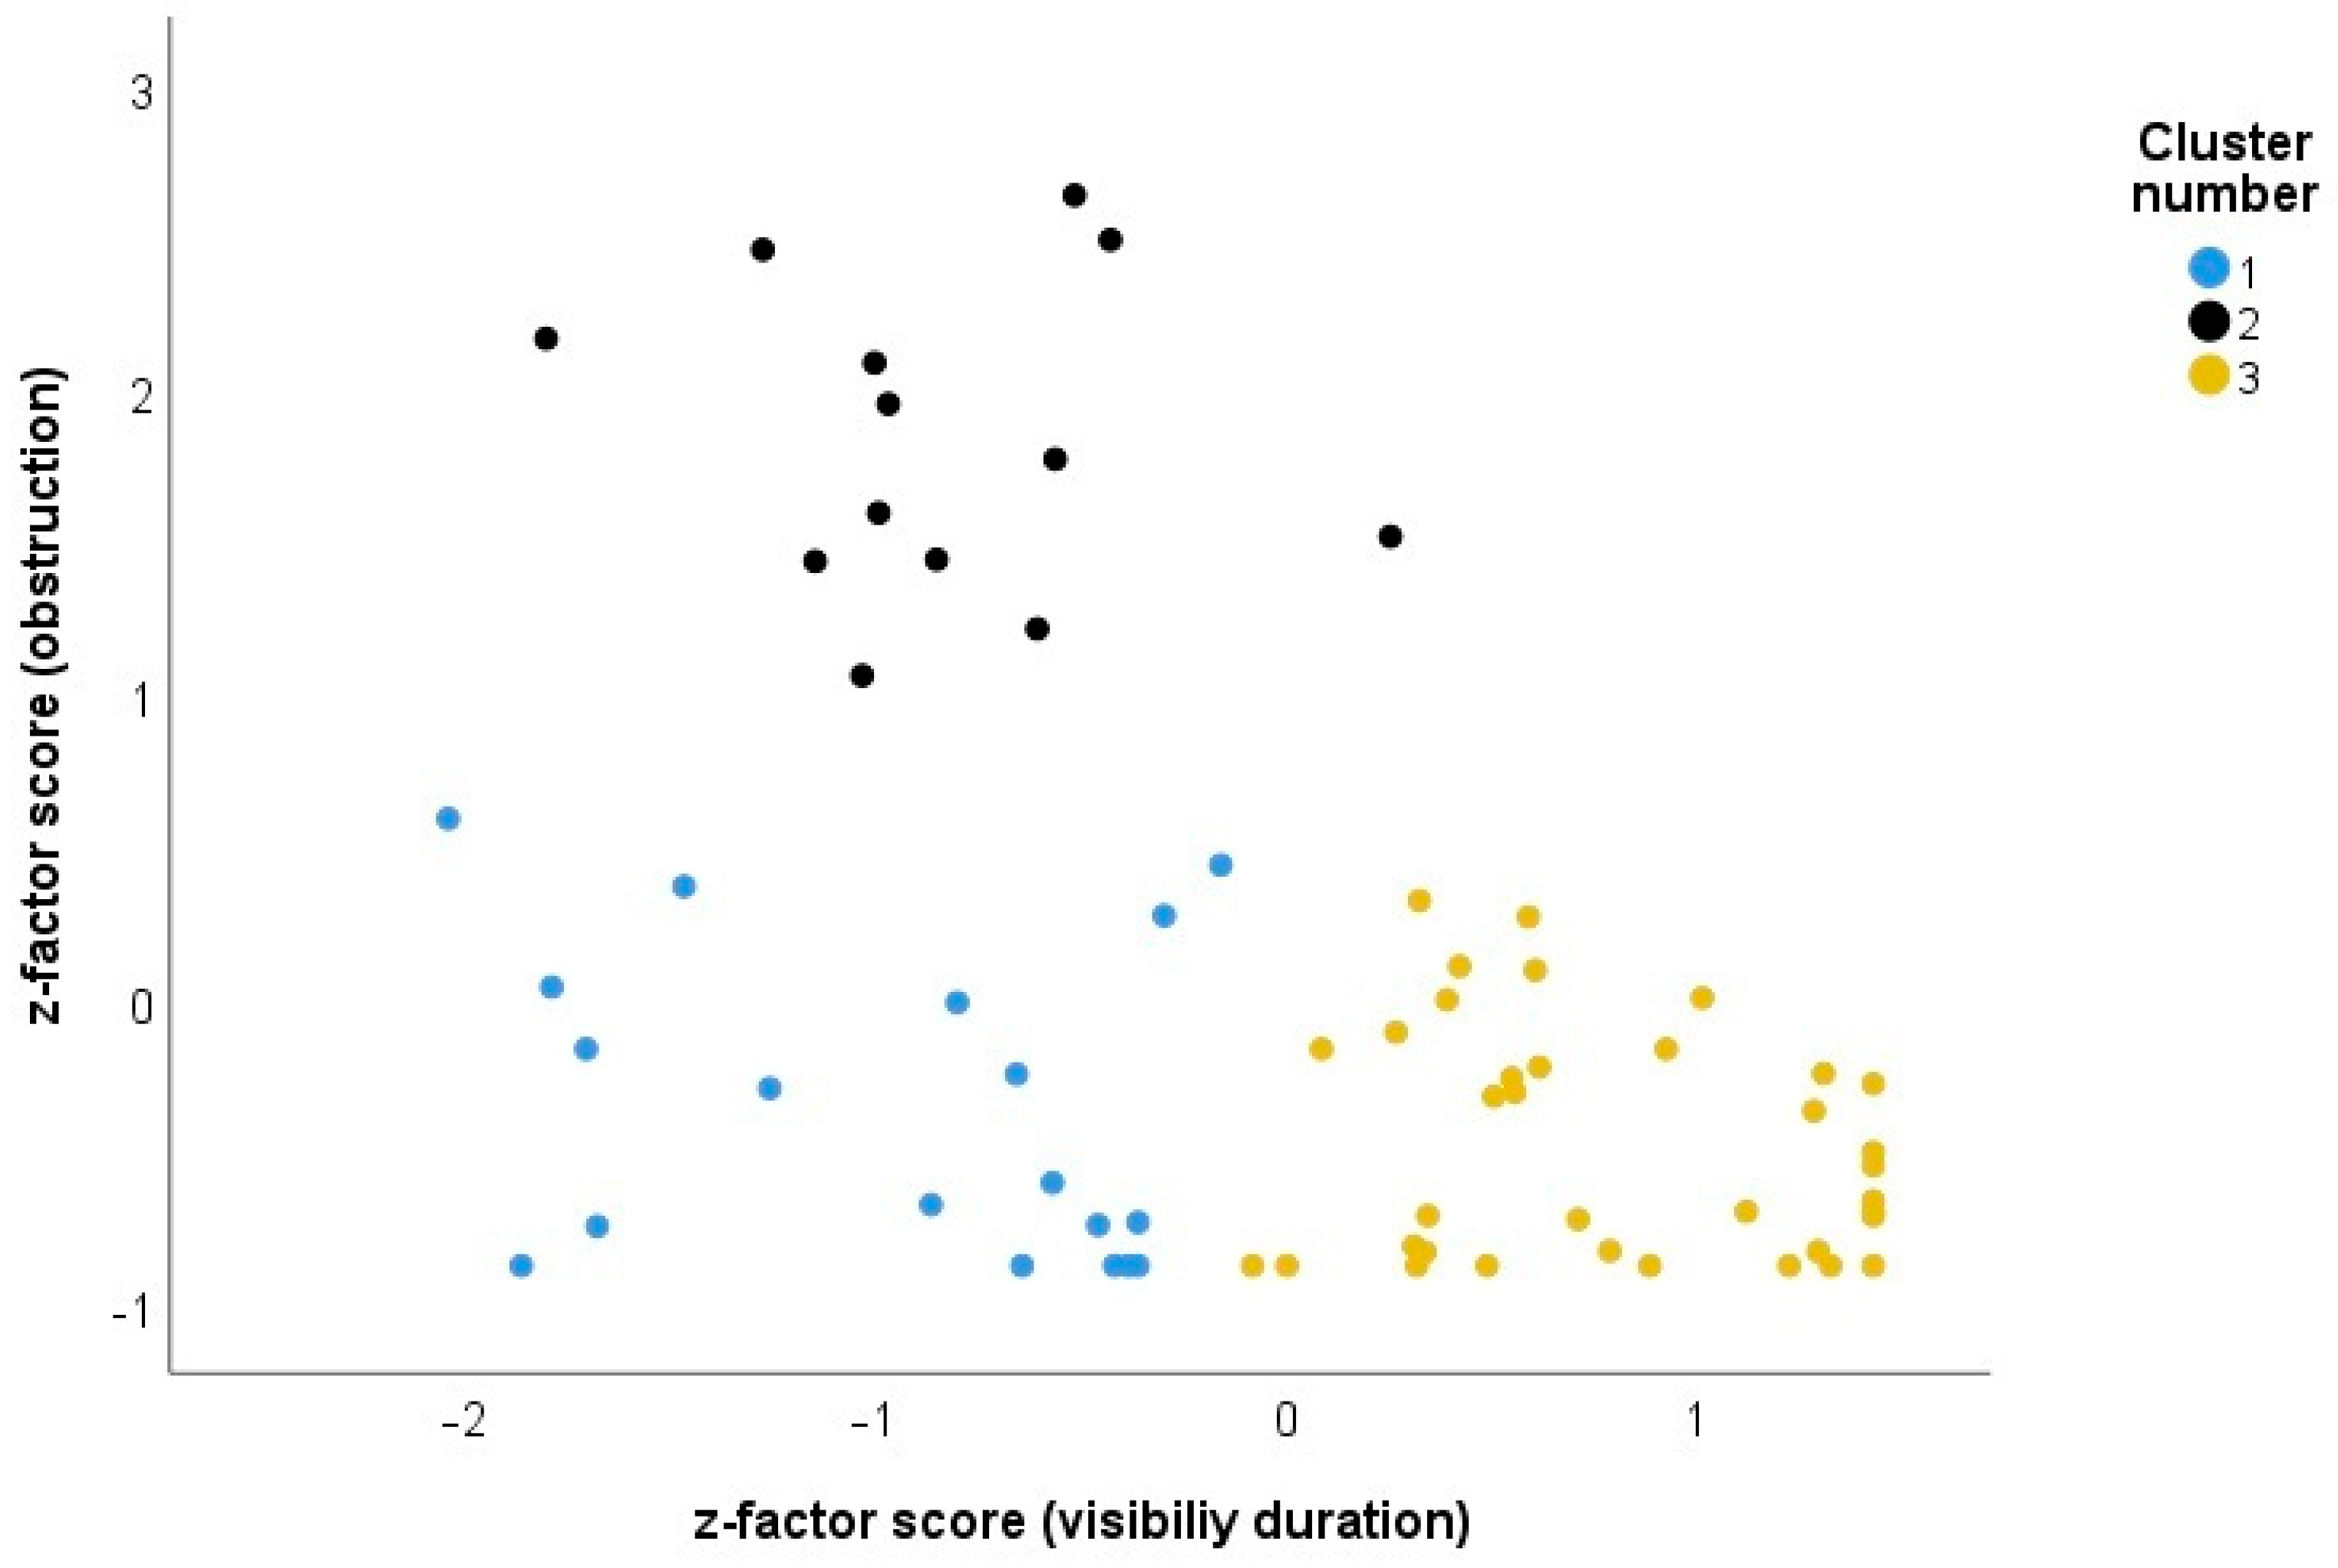
As species explained most of the variance, the data were analyzed at the species level. The two-step cluster analysis suggested a three-cluster solution (mean silhouette = 0.6, representing a good solution for the clusters). The clusters are shown in Figure 3. Cluster 1 (N = 19 species) represents bird species that have a low obstruction when visible, but whose visibility duration is rather short, such as, for example, the Common Kingfisher (Alcedo atthis). Cluster 2 refers to species that are highly obstructed and have shorter visibility periods (N = 13 species; e.g., Common Chiffchaff or Nuthatch Sitta europaea), and Cluster 3 refers to species that are easily visible due to longer visibility duration and lower obstruction (N = 36, e.g., White Stork, Ciconia ciconia). The three clusters were significantly different (One-way ANOVA for visibility duration: F2,65 = 86.23, p < 0.001, all post hoc tests p < 0.01; One-way ANOVA for obstruction: F2,65 = 137.82, p < 0.001, all post hoc tests p < 0.01) supporting the three-cluster solution.
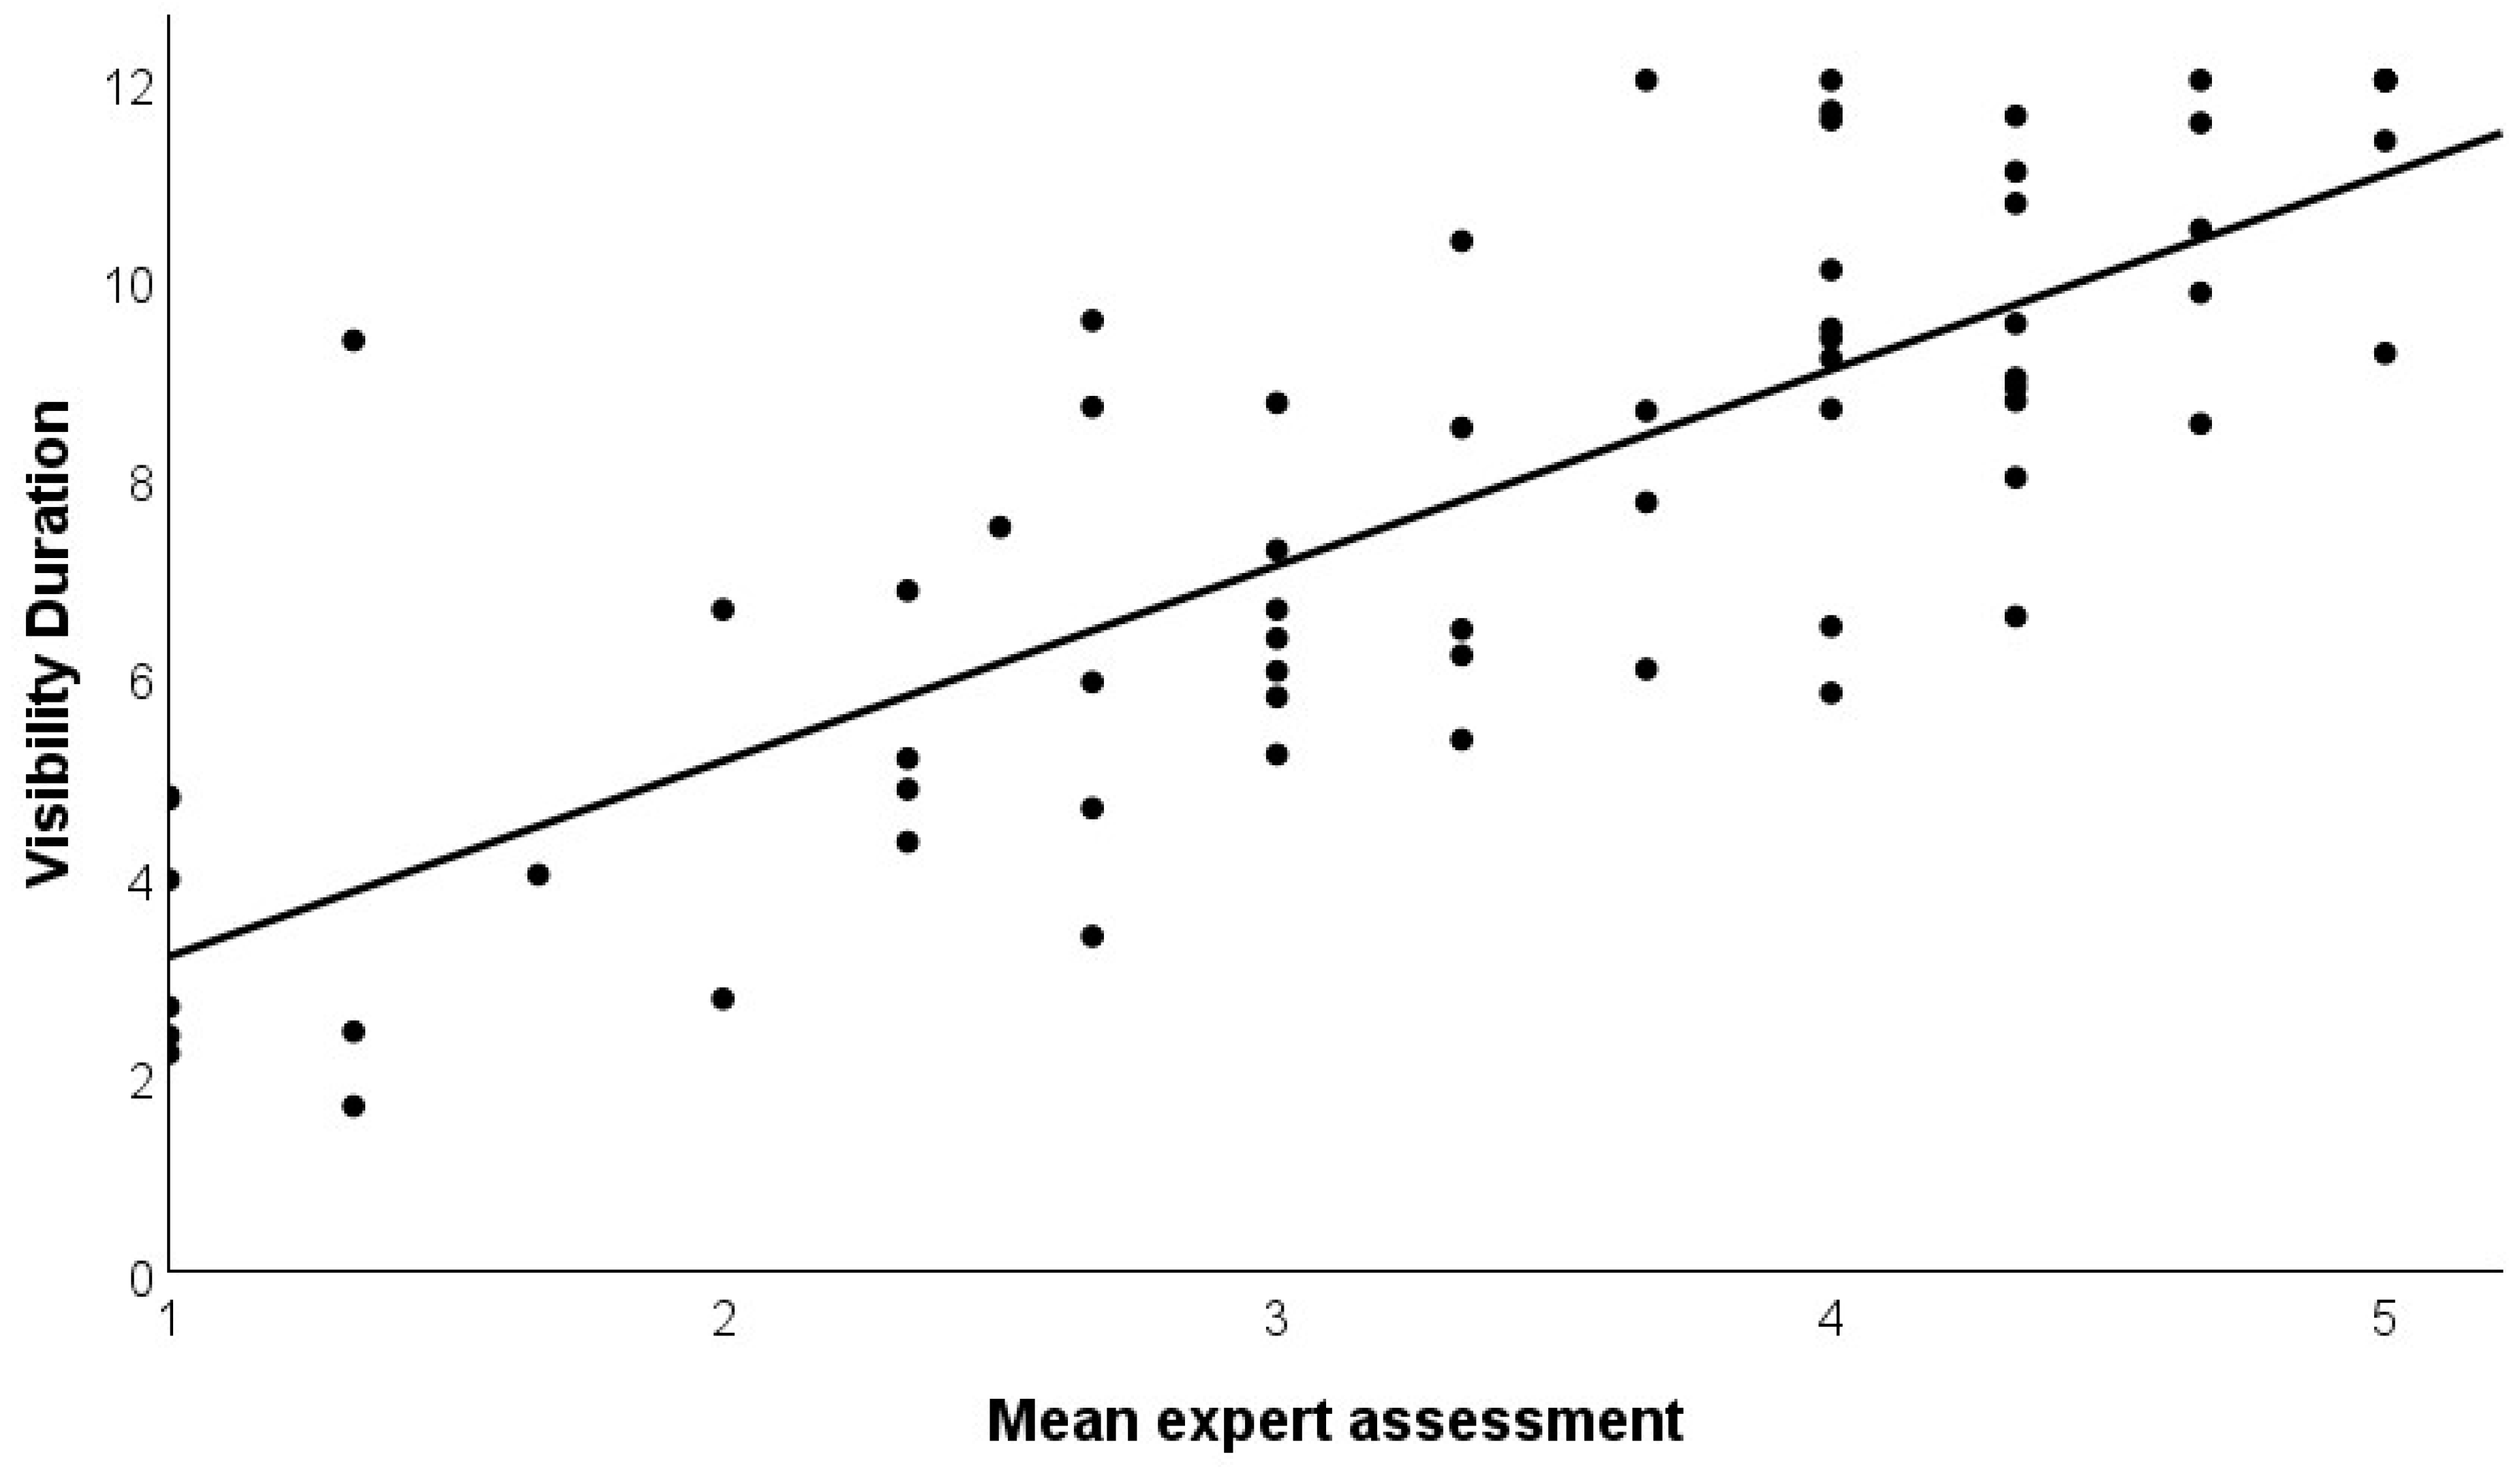
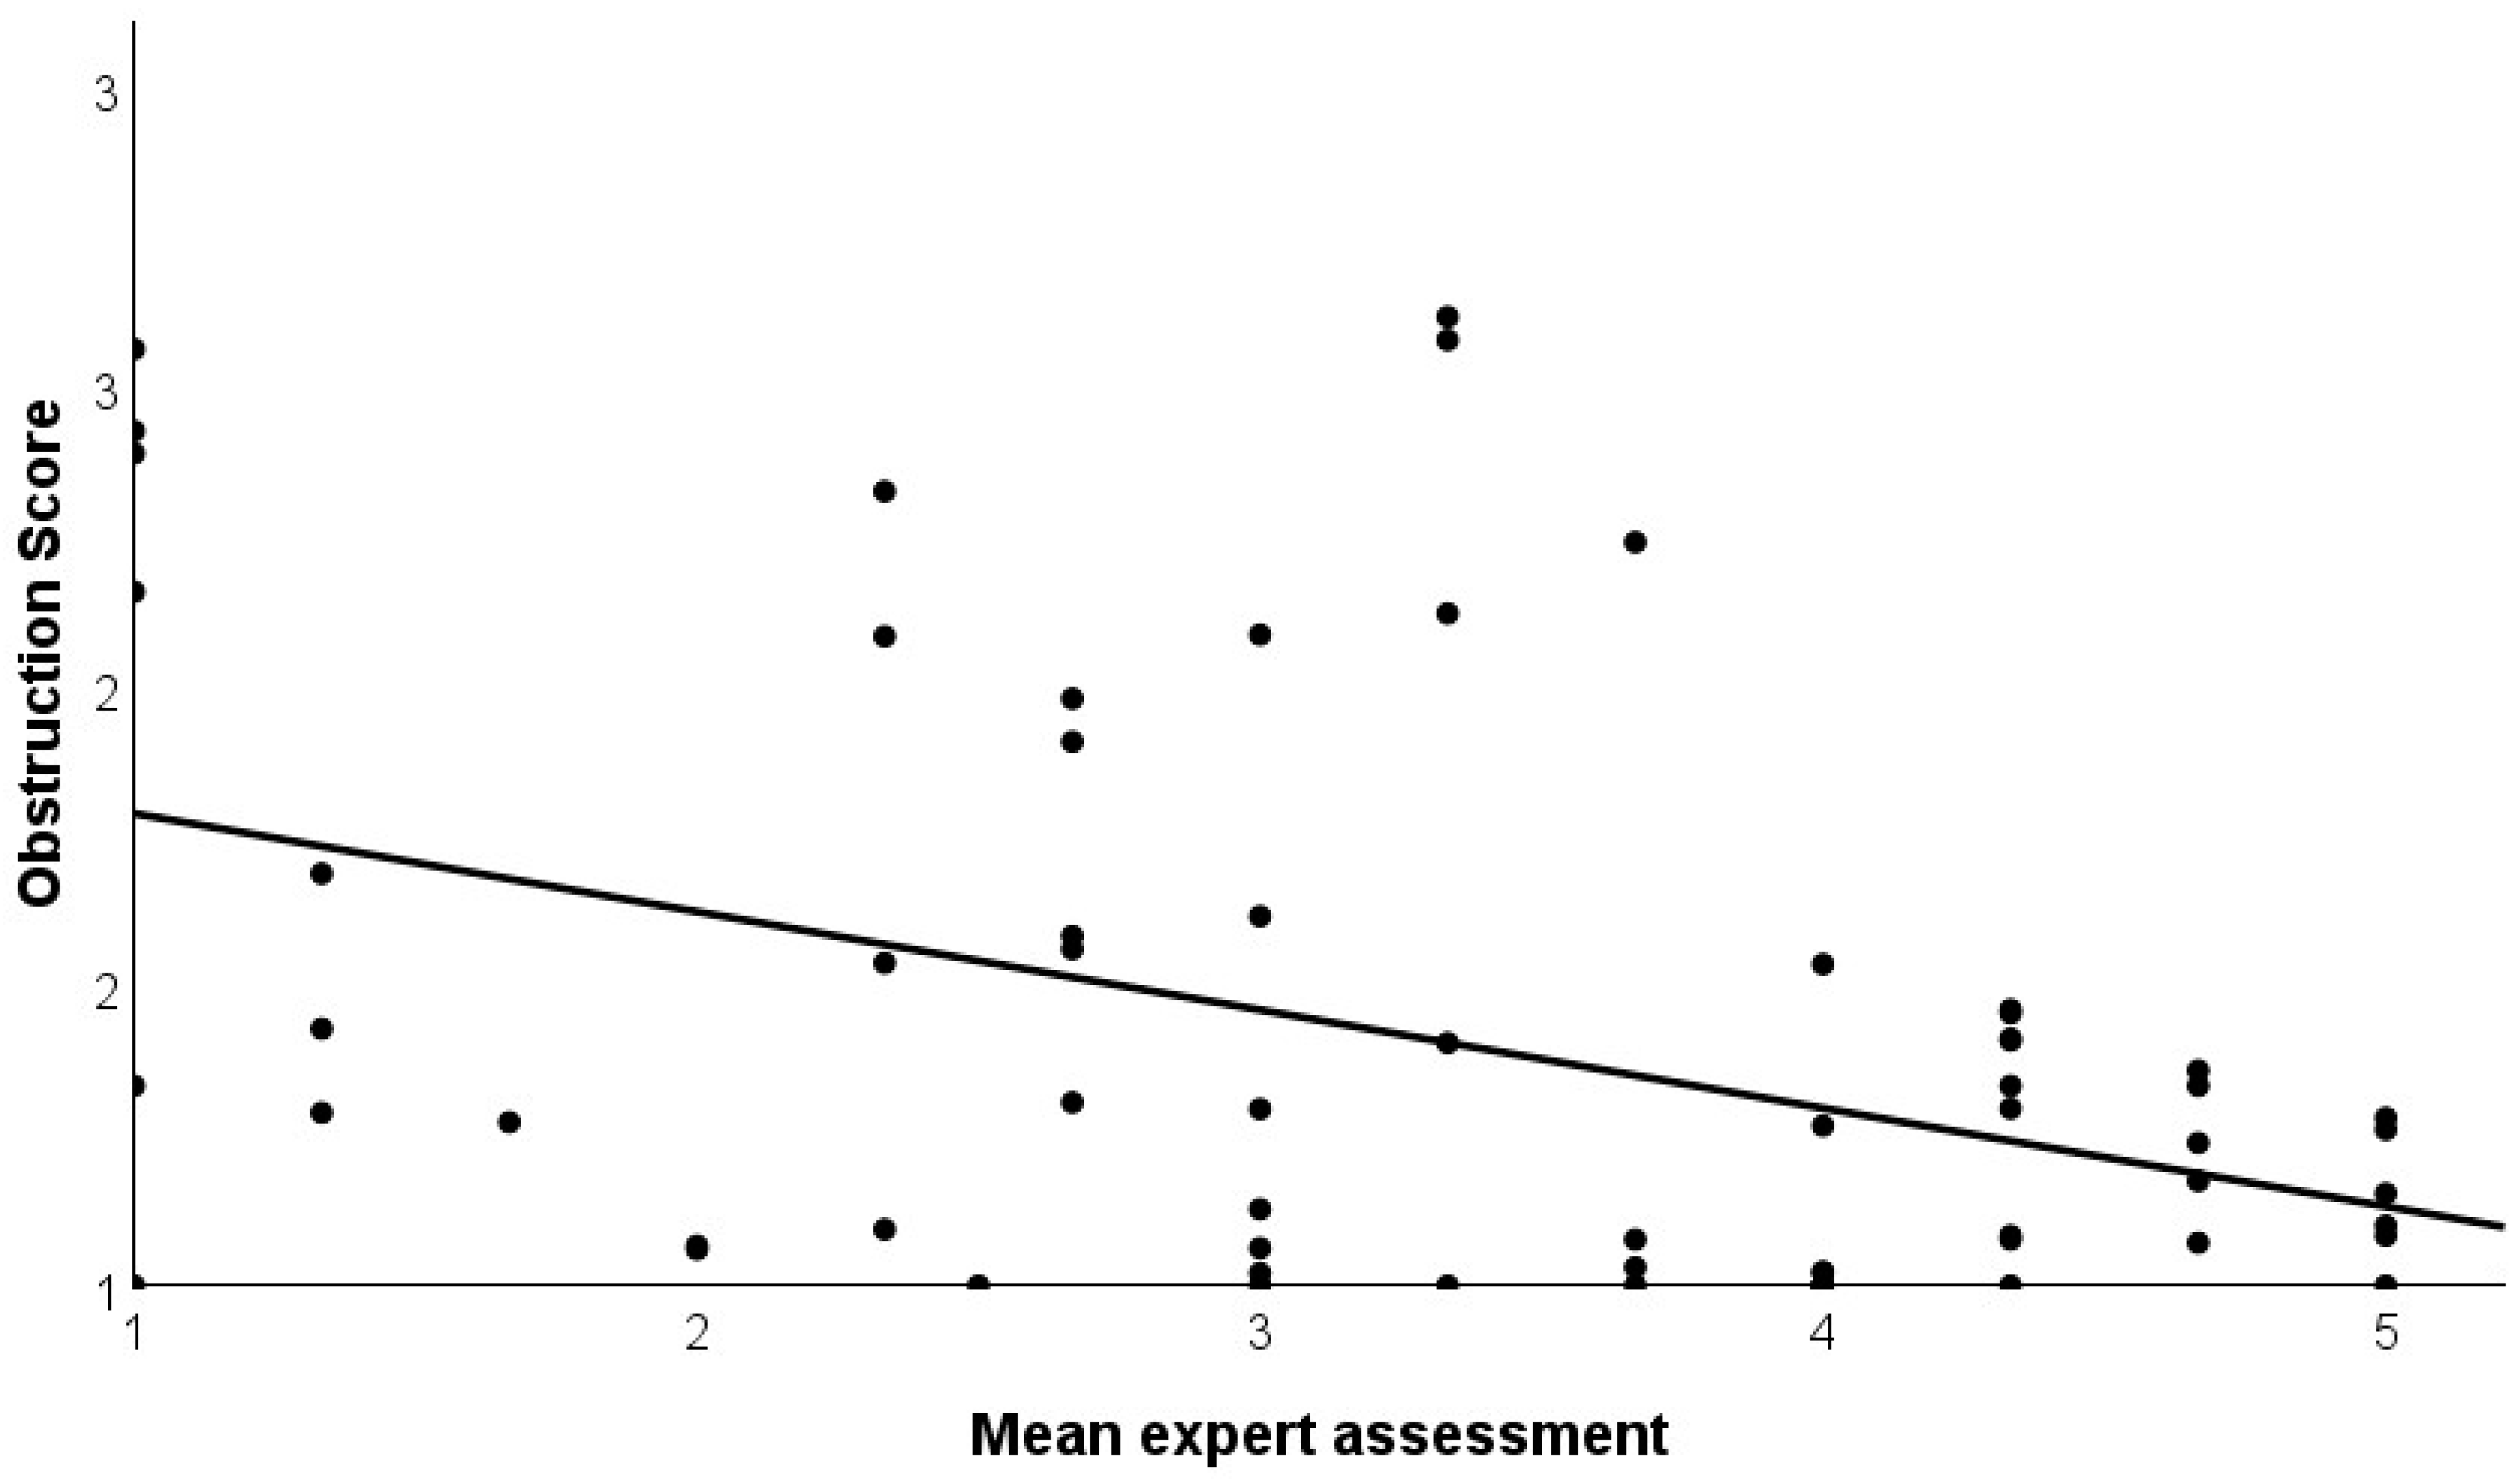
To further support the newly developed variables, we correlated the behavioral observations (visibility duration, obstruction) with the expert assessment of the visibility of the species. The three experts had a high agreement with Cronbach’s α = 0.919 (high reliability). In addition, the correlation coefficients between the three experts were 0.820; 0.756; and 0.796. The mean expert assessment significantly correlated positively with visibility duration (r = 0.803, p < 0.001, N = 68 species; Figure 4) and negatively with obstruction (r = −0.422, p < 0.001, N = 68 species, Figure 5).
Additionally, we checked whether the visibility and obstruction scores obtained by our behavioral observations and the expert assessment are related to the size or coloration of the respective species (Table 4). The visibility duration and the obstruction were unrelated to the coloration of the bird species, but body mass was, with a higher body mass related to a higher visibility duration and a lower obstruction. Both the expert assessment and the behavioral data were in agreement and yielded the same results.
4. Discussion
Here, we propose visibility duration and obstruction as species traits that can be measured with behavioral observations. The data may help to classify whether a species is easy to see or more hidden in the vegetation. Such behavioral traits add to the already existing databases of bird species that mainly focus on ecological or morphological factors (e.g., [27]). The behavioral trait of visibility duration may be an important aspect in the analysis of human–bird encounters [5]; therefore, it adds to our existing knowledge. In more detail, the data are valuable to assess the restorative qualities of bird species for humans and could be incorporated into studies that assess the value of biodiversity/bird diversity for humans [15,28]. For example, currently, urban green and blue spaces are usually grouped along a gradient of species richness or perceived species richness [3] to assess the restorative quality of a space, which is linked with psychological well-being. In addition to species richness or diversity, it might be also the encounter rate/probability, or especially the visibility of a species, that leads to a higher psychological restoration and a higher perceived species richness. This brings the species traits back into focus rather than just the ecological analysis based on simple or complex indicators, like species richness or diversity indices. For example, watching a group of Mallards (Anas platyrhynchos) may be more restorative than seeing a variety of different, but more hidden or more difficult-to-identify wader or warbler species. Hence, measuring the visibility score could help in establishing a meaningful wildlife experience for people [3].
Moreover, the species trait for visibility duration and obstruction may be even more useful in purely scientific studies in ecological terms, such as predator–prey interactions. The compound measure of encounter probability (Figure 1) may be used further for avian studies, e.g., on predation. Interspecies differences in encounter probability may be used to explain differential predation rates on these species. Such studies could be carried out with a comparative approach.
4.1. Confounders of Visibility Duration
Despite some confounding factors (see below), the highest explained variance was found in species identity (Table 3 and Table 4), rendering species the most important variable, which, in turn, suggests analyses on the species level because of the high interspecific variation. Also, sex and flocking were not significant predictors. However, observation distance was found to be negatively related to visibility duration and obstruction, meaning that birds with a higher observation distance could be observed better. This might be a bias that should be further investigated. In addition, behavioral traits, such as singing, flying or feeding, should also be taken into account in future studies.
Individuals who have been recognized first by sight had a lower obstruction than individuals first recognized by acoustic cues. Birds mostly discovered by their song (like for example Reed Warbler Acrocephalus scirpaceus) could often be shy species preferring a strongly obstructed habitat. Individuals first identified by sight are mostly larger individuals (like the grey heron), more explorative individuals or more tame individuals (like Mute Swans Cygnus olor). Additionally, in contrast to visual cues, acoustic cues are transmitted over long distances depending on the environment. A singing individual can not only be heard by the intraspecific individuals but also by heterospecific individuals including predators [29]. Hence, birds might choose a more obstructed position to sing to minimize predation risk. Indeed, Campos et al. [30] showed that concealed birds sing more than more exposed ones.
4.2. Clustering of the Species
Although there should be four clusters derived from the theoretical assumptions (Figure 2), species that have a long visibility duration and a high concealment or obstruction are lacking in the cluster approach. It might be the case that species might be acoustically easy to detect but are highly concealed and, hence, difficult to spot, but can still be observed for longer time periods once they have been spotted as they remain immobile for longer periods. Marsh birds (rails, bitterns, etc.), for example, are commonly monitored acoustically [31] since it is quite difficult to detect them visually as they are only found in emergent marsh vegetation and, additionally, display elusive behavior [32]. Since such species are difficult to discover, they might also lack in our cluster. Excluding them may not make sense because the invisibility of a species is also an important trait.
4.3. Validation with Expert Ratings
There was a high agreement between our observational data and the expert assessment. Species with long observation duration were scored highly visible by the experts. Further, highly obstructed species were negatively scored by experts. This validation approach shows that human assessments are a useful tool when it comes to studying species traits that are related to human–animal encounters [4,33]. This also is a valuable assessment of how laypeople could experience the perceivability of bird species.
4.4. Limitations
One study caveat is that only species that have been recorded by sight or sound could be used for this analysis. Some cryptic species are both camouflaged or hidden in the bush and usually quiet, like the Jack Snipe (Lymnocryptes minimus). These species usually have a low flight initiation distance, which makes encountering them extremely difficult, because they are cryptic and flush only at the last few meters or even centimeters because they rely on their crypsis. Such species could not be studied in the behavioral approach as they were simply not detected by the observers. This, however, is a well-known problem in bird surveys. A study by Kulaga and Budgka [34] for example comparing the number of detected bird species between observers and an automated sound recorder revealed that observers detected more species than recorders in farmland, but not in the forest. This indicates that there might be an observer bias towards species inhabiting more open landscapes. One solution would be tagged birds, that are fitted with GPS trackers or other devices. Another way would be to rely on expert assessment of these species, given, the high correlation between the observational data in this study on visibility duration and the scores of the expert assessment. Another problem is the handling of flying birds and species, because many birds are easier to observe during flight, e.g., circling raptors. This study is only concerned with a visual encounter probability, and acoustic cues are not analyzed. Bird songs can have positive effects on human well-being without seeing the bird species in question [11], e.g., in Common Nightingales Luscinia megarhynchos.
Currently, our findings may be applicable to breeding grounds, though not necessarily to non-breeding grounds, as species may occupy different habitats in different regions during their annual cycle (North–South), where vegetation and thus obstruction may differ. Also, in resident birds in the temperate zones, obstruction in winter may be lower compared to summer. In addition, the season is important as habitat preference is more flexible outside the breeding season. Some waders may breed in the forest with a lot of vegetation but are on mudflats in winter. The findings, therefore, may be locally applicable and seasonally restricted. This could be improved in future studies.
5. Conclusions
These data on visibility and obstruction can be used and applied in other situations and for other studies. It may also be important to collect such data from other geographical regions, but also to assess seasonal changes, because many species show circannual fluctuations in behavior [35]. We further hypothesize that bird species with lower visibility should be less well-known by the general public and may have a lower impact on recreational values, e.g., in psychological restoration [36]. When it comes to an educational perspective, we suggest identifying species with a high encounter rate, high visibility, and low obstruction in everyday life. These species may be used for teaching and raising awareness and for fighting the extinction of experience.
Author Contributions
T.H., J.V. and C.R. contributed to the conception and design of the study. C.R. and T.H. conducted the observational studies. T.H. and J.V. performed the expert assessment. C.R. performed the statistical analysis. C.R. and N.K. discussed the statistical analysis. C.R. wrote the first draft of the manuscript. N.K., T.H., J.V. and C.R. wrote sections of the manuscript. All authors have read and agreed to the published version of the manuscript.
Funding
This research received no external funding.
Institutional Review Board Statement
The study was carried out in an ethical and responsible manner according to German law and to the law of the federal state of Baden–Württemberg.
Informed Consent Statement
Not applicable.
Data Availability Statement
Data is contained within the article.
Acknowledgments
We acknowledge support from R. Randler for the assessment of the species.
Conflicts of Interest
The authors declare no conflicts of interest.
Appendix A

Table A1.
List of the bird species (in alphabetical order) studied concerning visibility duration and obstruction. Mean and standard deviation (SD), and sample size are given. Study site was Tübingen, SW Germany, May/June 2023.
Table A1.
List of the bird species (in alphabetical order) studied concerning visibility duration and obstruction. Mean and standard deviation (SD), and sample size are given. Study site was Tübingen, SW Germany, May/June 2023.
| Scientific Name | Visibility | N | SD | Obstruction | N | SD |
|---|---|---|---|---|---|---|
| Acrocephalus arundinaceus | 2.67 | 12 | 2.67 | 1.33 | 9 | 0.56 |
| Aegithalos caudatus | 4.86 | 14 | 3.01 | 2.33 | 13 | 1.05 |
| Alauda arvensis | 4.00 | 12 | 4.00 | 1.27 | 11 | 0.47 |
| Alcedo atthis | 2.75 | 12 | 2.30 | 1.06 | 11 | 0.20 |
| Alopochen aegyptiacus | 12.00 | 13 | 0.00 | 1.15 | 13 | 0.38 |
| Anas platyrhynchos | 12.00 | 21 | 0.00 | 1.17 | 21 | 0.45 |
| Anser anser | 12.00 | 14 | 0.00 | 1.28 | 14 | 0.43 |
| Apus apus | 8.69 | 16 | 4.06 | 1.00 | 16 | 0.00 |
| Ardea cinerea | 11.39 | 18 | 2.15 | 1.00 | 18 | 0.00 |
| Aythya fuligula | 12.00 | 16 | 0.00 | 1.00 | 16 | 0.00 |
| Buteo buteo | 7.75 | 12 | 4.12 | 1.00 | 12 | 0.00 |
| Carduelis carduelis | 5.79 | 14 | 3.87 | 1.29 | 14 | 0.82 |
| Chloris chloris | 7.27 | 11 | 3.61 | 1.62 | 11 | 0.51 |
| Choicocephalus ridibundus | 12.00 | 13 | 0.00 | 1.08 | 13 | 0.28 |
| Ciconia ciconia | 11.64 | 22 | 1.33 | 1.30 | 22 | 0.88 |
| Coleus monedula | 8.91 | 11 | 3.42 | 1.41 | 11 | 0.48 |
| Columba livia f. domestica | 9.86 | 14 | 3.53 | 1.07 | 14 | 0.27 |
| Columba oenas | 6.60 | 10 | 5.72 | 1.00 | 9 | 0.00 |
| Columba palumbus | 9.55 | 11 | 4.01 | 1.45 | 11 | 0.69 |
| Corvus cornix | 10.76 | 17 | 2.77 | 1.41 | 17 | 0.78 |
| Corvus corone | 10.50 | 16 | 2.34 | 1.33 | 16 | 0.71 |
| Cuculus canorus | 2.20 | 10 | 3.65 | 1.00 | 7 | 0.00 |
| Cyanistes caeruleus | 6.21 | 14 | 3.98 | 2.65 | 14 | 0.77 |
| Cygnus olor | 12.00 | 15 | 0.00 | 1.08 | 15 | 0.18 |
| Delichon urbicum | 6.50 | 12 | 4.66 | 1.00 | 12 | 0.00 |
| Dendrocopus major | 4.67 | 18 | 3.34 | 1.91 | 18 | 0.89 |
| Emberiza citrinella | 8.71 | 14 | 4.05 | 1.56 | 14 | 0.95 |
| Erithacus rubecula | 5.94 | 17 | 3.93 | 1.98 | 15 | 1.00 |
| Falco tinnunculus | 8.67 | 12 | 3.99 | 1.03 | 12 | 0.10 |
| Fringilla coelebs | 8.50 | 12 | 3.50 | 2.12 | 12 | 1.06 |
| Fulica atra | 11.57 | 14 | 1.60 | 1.24 | 14 | 0.62 |
| Gallinula chloropus | 5.36 | 11 | 3.85 | 1.40 | 9 | 0.71 |
| Garrulus glandarius | 5.21 | 14 | 4.69 | 2.09 | 14 | 0.95 |
| Hirundo rustica | 5.83 | 12 | 4.00 | 1.00 | 12 | 0.00 |
| Lanius collurio | 6.67 | 15 | 4.39 | 1.07 | 15 | 0.26 |
| Linaria cannabina | 5.17 | 12 | 2.89 | 1.09 | 12 | 0.29 |
| Luscinia megarhynchos | 1.67 | 12 | 1.78 | 1.69 | 8 | 0.88 |
| Mareca strepera | 11.69 | 13 | 0.75 | 1.00 | 13 | 0.00 |
| Merops apiaster | 9.40 | 15 | 3.23 | 1.27 | 15 | 0.46 |
| Milvus migrans | 9.20 | 10 | 3.55 | 1.00 | 10 | 0.00 |
| Milvus milvus | 8.77 | 13 | 3.35 | 1.08 | 13 | 0.28 |
| Motacilla alba | 9.00 | 13 | 2.31 | 1.46 | 13 | 0.85 |
| Motacilla cinerea | 6.67 | 12 | 4.33 | 1.00 | 12 | 0.00 |
| Motacilla flava | 6.38 | 16 | 4.37 | 1.06 | 16 | 0.17 |
| Netta rufina | 11.60 | 15 | 0.83 | 1.02 | 15 | 0.06 |
| Parus major | 6.07 | 15 | 3.49 | 2.24 | 15 | 0.86 |
| Passer domesticus | 8.54 | 13 | 3.69 | 1.36 | 13 | 0.66 |
| Passer montanus | 6.47 | 15 | 2.95 | 2.58 | 15 | 1.02 |
| Phalacrocorax carbo | 11.08 | 12 | 3.18 | 1.08 | 12 | 0.29 |
| Phoenicurus ochruros | 6.05 | 19 | 3.66 | 1.13 | 19 | 0.42 |
| Phoenicurus phoenicurus | 6.86 | 14 | 3.80 | 1.54 | 14 | 0.95 |
| Phylloscopus collybita | 4.76 | 17 | 3.68 | 2.39 | 16 | 0.77 |
| Pica pica | 9.50 | 12 | 2.94 | 1.54 | 12 | 0.85 |
| Picus viridis | 3.38 | 13 | 3.73 | 1.58 | 12 | 1.16 |
| Podiceps cristatus | 10.09 | 11 | 2.95 | 1.02 | 11 | 0.08 |
| Saxicola rubicola | 7.50 | 14 | 4.03 | 1.00 | 14 | 0.00 |
| Sitta europaea | 4.33 | 12 | 3.55 | 2.08 | 12 | 0.81 |
| Sturnus vulgaris | 8.00 | 15 | 3.55 | 1.33 | 15 | 0.63 |
| Sylvia atricapilla | 3.95 | 20 | 3.25 | 2.56 | 18 | 1.05 |
| Sylvia borin | 2.38 | 13 | 1.94 | 2.43 | 9 | 1.20 |
| Sylvia curruca | 4.79 | 14 | 4.04 | 2.16 | 11 | 1.57 |
| Tachybaptus ruficollis | 10.38 | 13 | 3.20 | 1.00 | 13 | 0.00 |
| Tadorna ferruginea | 12.00 | 10 | 0.00 | 1.10 | 10 | 0.32 |
| Troglodytes troglodytes | 2.42 | 12 | 3.78 | 1.43 | 7 | 0.79 |
| Turdus merula | 9.25 | 16 | 3.11 | 1.26 | 16 | 0.58 |
| Turdus philomelos | 9.38 | 13 | 3.60 | 1.29 | 13 | 0.45 |
| Turdus pilaris | 8.75 | 12 | 4.67 | 1.02 | 12 | 0.07 |
| Vanellus vanellus | 9.58 | 12 | 3.87 | 1.31 | 12 | 0.44 |
References
- Champness, B.S.; Fitzsimons, J.A.; Kendal, D.; Palmer, G.C. Perceptions of Birds by Urban Residents in an Australian Regional City and Implications for Conservation. Birds 2023, 4, 262–276. [Google Scholar] [CrossRef]
- Fisher, J.C.; Dallimer, M.; Irvine, K.N.; Aizlewood, S.G.; Austen, G.E.; Fish, R.D.; King, P.M. Human well-being responses to species’ traits. Nat. Sustain. 2023, 6, 1219–1227. [Google Scholar] [CrossRef]
- Randler, C.; Friedrich, S.; Koch, S. Psychological restoration, place attachment and satisfaction in birders and non-birding visitors. J. Outdoor Recreat. Tour. 2023, 44, 100679. [Google Scholar] [CrossRef]
- Randler, C.; Staller, N.; Kalb, N.; Tryjanowski, P. Charismatic Species and Birdwatching: Advanced Birders Prefer Small, Shy, Dull, and Rare Species. Anthrozoös 2023, 36, 427–445. [Google Scholar] [CrossRef]
- Tubelis, D.P. Spatiotemporal Distribution of Photographic Records of Brazilian Birds Available in the WikiAves Citizen Science Database. Birds 2023, 4, 28–45. [Google Scholar] [CrossRef]
- Ducarme, F.; Luque, G.M.; Courchamp, F. What are “charismatic species” for conservation biologists. BioSci. Master Rev. 2013, 10, 1–8. [Google Scholar]
- Sergio, F.; Newton, I.A.N.; Marchesi, L.; Pedrini, P. Ecologically justified charisma: Preservation of top predators delivers biodiversity conservation. J. Appl. Ecol. 2006, 43, 1049–1055. [Google Scholar] [CrossRef]
- Whelan, C.J.; Wenny, D.G.; Marquis, R.J. Ecosystem services provided by birds. Ann. N. Y. Acad. Sci. 2008, 1134, 25–60. [Google Scholar] [CrossRef]
- Whelan, C.J.; Şekercioğlu, Ç.H.; Wenny, D.G. Why birds matter: From economic ornithology to ecosystem services. J. Ornithol. 2015, 156, 227–238. [Google Scholar] [CrossRef]
- McGinlay, J.; Parsons, D.J.; Morris, J.; Hubatova, M.; Graves, A.; Bradbury, R.B.; Bullock, J.M. Do charismatic species groups generate more cultural ecosystem service benefits? Ecosyst. Serv. 2017, 27, 15–24. [Google Scholar] [CrossRef]
- Ratcliffe, E.; Gatersleben, B.; Sowden, P.T. Bird sounds and their contributions to perceived attention restoration and stress recovery. J. Environ. Psychol. 2013, 36, 221–228. [Google Scholar] [CrossRef]
- Leong, R.A.; Fung, T.K.; Sachidhanandam, U.; Drillet, Z.; Edwards, P.J.; Richards, D.R. Use of structural equation modeling to explore influences on perceptions of ecosystem services and disservices attributed to birds in Singapore. Ecosyst. Serv. 2020, 46, 101211. [Google Scholar] [CrossRef]
- Tan, X.; Yan, P.; Liu, Z.; Qin, H.; Jiang, A. Demographics, behaviours, and preferences of birdwatchers and their implications for avitourism and avian conservation: A case study of birding in Nonggang, Southern China. Glob. Ecol. Conserv. 2023, 46, e02552. [Google Scholar] [CrossRef]
- Morrison, C.A.; Auniņš, A.; Benkő, Z.; Brotons, L.; Chodkiewicz, T.; Chylarecki, P.; Escandell, V.; Eskildsen, D.P.; Gamero, A.; Herrando, S.; et al. Bird population declines and species turnover are changing the acoustic properties of spring soundscapes. Nat. Commun. 2021, 12, 6217. [Google Scholar] [CrossRef] [PubMed]
- Soga, M.; Gaston, K.J. The ecology of human–nature interactions. Proc. R. Soc. B 2020, 287, 20191882. [Google Scholar] [CrossRef] [PubMed]
- Houlden, V.; Jani, A.; Hong, A. Is biodiversity of greenspace important for human health and wellbeing? A bibliometric analysis and systematic literature review. Urban For. Urban Green. 2021, 66, 127385. [Google Scholar] [CrossRef]
- Johansson, M.; Flykt, A.; Frank, J.; Hartig, T. Appraisals of wildlife during restorative opportunities in local natural settings. Front. Environ. Sci. 2021, 9, 635757. [Google Scholar] [CrossRef]
- Randler, C.; Höllwarth, A.; Schaal, S. Urban park visitors and their knowledge of animal species. Anthrozoös 2007, 20, 65–74. [Google Scholar] [CrossRef]
- Blumstein, D.T. Developing an evolutionary ecology of fear: How life history and natural history traits affect disturbance tolerance in birds. Anim. Behaviour. 2006, 71, 389–399. [Google Scholar] [CrossRef]
- Bateson, M.; Martin, P. Measuring Behaviour: An Introductory Guide; Cambridge University Press: Cambridge, UK, 2021. [Google Scholar]
- Boyer, J.S.; Hass, L.L.; Lurie, M.H.; Blumstein, D.T. Effect of visibility on time allocation and escape decisions in crimson rosellas. Aust. J. Zool. 2006, 54, 363–367. [Google Scholar] [CrossRef]
- Randler, C. Risk assessment by crow phenotypes in a hybrid zone. J. Ethol. 2008, 26, 309–316. [Google Scholar] [CrossRef]
- Bauer, H.G.; Bezzel, E.; Fiedler, W. Das Kompendium der Vögel Mitteleuropas. Alles über Biologie, Gefährdung und Schutz; Aula Verlag: Wiebelsheim, Germany, 2005. [Google Scholar]
- Randler, C. Frequency of bird hybrids: Does detectability make all the difference? J. Ornithol. 2004, 145, 123–128. [Google Scholar] [CrossRef]
- Randler, C. Elite Recreation Specialization and Motivations among Birdwatchers: The Case of Club 300 Members. Int. J. Sociol. Leis. 2023, 6, 209–223. [Google Scholar] [CrossRef]
- Ladle, R.J.; Jepson, P.; Correia, R.A.; Malhado, A.C. A culturomics approach to quantifying the salience of species on the global internet. People Nat. 2019, 1, 524–532. [Google Scholar] [CrossRef]
- Tobias, J.A.; Sheard, C.; Pigot, A.L.; Devenish, A.J.; Yang, J.; Sayol, F.; Neate-Clegg, M.H.C.; Alioravainen, N.; Weeks, T.L.; Barber, R.A.; et al. AVONET: Morphological, ecological and geographical data for all birds. Ecol. Lett. 2022, 25, 581–597. [Google Scholar] [CrossRef]
- Fuller, R.A.; Irvine, K.N.; Devine-Wright, P.; Warren, P.H.; Gaston, K.J. Psychological benefits of greenspace increase with biodiversity. Biol. Lett. 2007, 3, 390–394. [Google Scholar] [CrossRef]
- Møller, A.P.; Nielsen, J.T.; Garamszegi, L.Z. Song post exposure, song features, and predation risk. Behav. Ecol. 2006, 17, 155–163. [Google Scholar] [CrossRef]
- Campos, D.P.; Bander, L.A.; Raksi, A.; Blumstein, D.T. Perch exposure and predation risk: A comparative study in passerines. Acta Ethol. 2009, 12, 93–98. [Google Scholar] [CrossRef]
- Conway, C.J.; Gibbs, J.P. Summary of Intrinsic and Extrinsic Factors Affecting Detection Probability of Marsh Birds. Wetlands 2011, 31, 403–411. [Google Scholar] [CrossRef]
- Tozer, D.C.; Drake, K.L.; Falconer, C.M. Modeling detection probability to improve marsh bird surveys in southern Canada and the Great Lakes states. Avian Conserv. Ecol. 2016, 11, 3. [Google Scholar] [CrossRef]
- Härtel, T.; Vanhöfen, J.; Randler, C. Selection of Indicator Bird Species as a Baseline for Knowledge Assessment in Biodiversity Survey Studies. Animals 2023, 13, 2230. [Google Scholar] [CrossRef] [PubMed]
- Kułaga, K.; Budka, M. Bird species detection by an observer and an autonomous sound recorder in two different environments: Forest and farmland. PLoS ONE 2019, 14, e0211970. [Google Scholar] [CrossRef] [PubMed]
- Scott, M.; Robinson, W.D. Mobbing behavior of songbirds in response to calls of an ambush-predator, the Northern Pygmy-Owl. Front. Ecol. Evol. 2023, 11, 1092323. [Google Scholar] [CrossRef]
- Randler, C.; Vanhöfen, J.; Härtel, T.; Neunhoeffer, F.; Engeser, C.; Fischer, C. Psychological restoration depends on curiosity, motivation, and species richness during a guided bird walk in a suburban blue space. Front. Psychol. 2023, 14, 1176202. [Google Scholar] [CrossRef]

Figure 2.
A theoretical model to depict visibility as a function of obstruction and visibility duration. Bird species, clockwise: Common Chiffchaff (Phylloscopus collybita), Great Bittern (Botaurus stellaris), Grey Heron (Ardea cinerea), Common Redstart (Phoenicurus phoenicurus) (photo credits: C. Randler.).

Figure 3.
Cluster solution of the k means cluster analysis. Cluster 1 (blue) represents species with a low obstruction and short visibility duration, cluster 2 (black) is highly obstructed species with a short visibility duration, and cluster 3 (orange) has a low obstruction and a long visibility duration.

Figure 4.
Correlation of mean expert assessment of the visibility of bird species in SW Germany and visibility duration. The variables show a significant positive correlation (r = 0.803, p < 0.001).
Figure 4.
Correlation of mean expert assessment of the visibility of bird species in SW Germany and visibility duration. The variables show a significant positive correlation (r = 0.803, p < 0.001).

Figure 5.
Correlation of mean expert assessment of the visibility of bird species in SW Germany and obstruction score. The variables show a significant negative correlation (r = −0.422, p < 0.001).
Figure 5.
Correlation of mean expert assessment of the visibility of bird species in SW Germany and obstruction score. The variables show a significant negative correlation (r = −0.422, p < 0.001).

Table 1.
Overview of the variables collected in the study and their measurements.
| Dependent Variable | Measurement | Question |
|---|---|---|
| Visibility duration | 3 min, split into twelve 15 s periods | How long is the individual visible to the observer? |
| Obstruction | Minimum percentage of obstruction, 3 min, split into twelve 15 s periods | To what extent is the individual obstructed by vegetation? |
| Predictor variable | ||
| Species | Bird species | Do bird species differ in visibility/obstruction? |
| Sex | Male/female in dichromatic species | Are there sex differences? |
| Flock | Flocking yes/no | Is the bird a member of a flock/group or single? |
| Detection mode | Acoustic/visual | Was the bird discovered by acoustic or visual cues? |
| Observation distance | In meters | Does the distance between observer and bird influence visibility? |
| Behavior | In flight or not | Was the bird in flight or not? |
Table 2.
Predictors of the visibility duration based on a linear model with visibility duration as dependent variable, sex (male/female), flock (single or in a flock), mode of detection (visual or acoustic), and species as fixed factors, and observation distance as the covariate. ** indicates p > 0.01, *** p < 0.001.
| Source of Variance | Type III Sum of Squares | df | Mean of Squares | F | Sig. | Partial Eta-Squared |
|---|---|---|---|---|---|---|
| Sex | 0.011 | 1 | 0.011 | 0.232 | 0.631 | 0.002 |
| Flock | 0.036 | 1 | 0.036 | 0.750 | 0.388 | 0.006 |
| Detection mode | 0.033 | 1 | 0.033 | 0.683 | 0.410 | 0.005 |
| Species | 5.109 | 33 | 0.155 | 3.193 | <0.001 *** | 0.440 |
| Observation distance | 0.305 | 1 | 0.305 | 6.296 | 0.013 ** | 0.045 |
Table 3.
Predictors of obstruction based on a linear model with visibility duration as dependent variable, sex (male/female), flock (single or in a flock), mode of detection (visual or acoustic), species as fixed factors, and observation distance as a covariate. ** indicates p > 0.01, *** p < 0.001.
| Source of Variance | Type III Sum of Squares | df | Mean of Squares | F | Sig. | Partial Eta-Squared |
|---|---|---|---|---|---|---|
| Sex | 0.003 | 1 | 0.003 | 0.004 | 0.949 | <0.009 |
| Flock | 0.039 | 1 | 0.039 | 0.057 | 0.812 | <0.009 |
| Detection mode | 3.926 | 1 | 3.926 | 5.769 | 0.018 ** | 0.041 |
| Species | 47.579 | 33 | 1.442 | 2.118 | 0.001 *** | 0.343 |
| Observation distance | 4.54 | 1 | 4.540 | 6.670 | 0.011 ** | 0.047 |
Table 4.
Correlations between the expert assessment (mean score, this study) and the observational variables visibility and obstruction with data on colorfulness and body mass obtained from previous work [4].
Table 4.
Correlations between the expert assessment (mean score, this study) and the observational variables visibility and obstruction with data on colorfulness and body mass obtained from previous work [4].
| Mean Expert Assessment | Visibility Duration | Obstruction | ||
|---|---|---|---|---|
| Coloration assessment by experts | Spearman rho | −0.116 | −0.176 | 0.085 |
| P | 0.345 | 0.152 | 0.489 | |
| N | 68 | 68 | 68 | |
| Assessment of brightness (by lay people) | Spearman rho | −0.146 | −0.205 | 0.249 |
| P | 0.376 | 0.210 | 0.126 | |
| N | 39 | 39 | 39 | |
| Body mass | Spearman rho | 0.701 | 0.757 | −0.412 |
| P | <0.001 | <0.001 | <0.001 | |
| N | 68 | 68 | 68 |
Disclaimer/Publisher’s Note: The statements, opinions and data contained in all publications are solely those of the individual author(s) and contributor(s) and not of MDPI and/or the editor(s). MDPI and/or the editor(s) disclaim responsibility for any injury to people or property resulting from any ideas, methods, instructions or products referred to in the content. |
© 2023 by the authors. Licensee MDPI, Basel, Switzerland. This article is an open access article distributed under the terms and conditions of the Creative Commons Attribution (CC BY) license (https://creativecommons.org/licenses/by/4.0/).
Share and Cite
MDPI and ACS Style
Randler, C.; Härtel, T.; Kalb, N.; Vanhöfen, J. A Bird in the Hand Is Worth Two in the Bush: Bird Visibility as a Predictor of the Perception of Birds by Humans. Birds 2024, 5, 24-37. https://doi.org/10.3390/birds5010002
AMA Style
Randler C, Härtel T, Kalb N, Vanhöfen J. A Bird in the Hand Is Worth Two in the Bush: Bird Visibility as a Predictor of the Perception of Birds by Humans. Birds. 2024; 5(1):24-37. https://doi.org/10.3390/birds5010002
Chicago/Turabian StyleRandler, Christoph, Talia Härtel, Nadine Kalb, and Janina Vanhöfen. 2024. "A Bird in the Hand Is Worth Two in the Bush: Bird Visibility as a Predictor of the Perception of Birds by Humans" Birds 5, no. 1: 24-37. https://doi.org/10.3390/birds5010002