Article

A Sensitive Hydroquinone Amperometric Sensor Based on a Novel Palladium Nanoparticle/Porous Silicon/Polypyrrole-Carbon Black Nanocomposite

by
Abdullah Alrashidi
1,
Anas M. El-Sherif
1,
Jahir Ahmed
2,3,
M. Faisal
2,3,
Mabkhoot Alsaiari
2,4,
Jari S. Algethami
2,3,
Mohamed I. Moustafa
1,
Abdulaziz A. M. Abahussain
5 and
Farid A. Harraz
2,4,*
1
Engineering College, Northern Border University, Arar 91431, Saudi Arabia
2
Promising Centre for Sensors and Electronic Devices (PCSED), Advanced Materials and Nano-Research Centre, Najran University, Najran 11001, Saudi Arabia
3
Department of Chemistry, Faculty of Science and Arts, Najran University, Najran 11001, Saudi Arabia
4
Empty Quarter Research Unit, Department of Chemistry, Faculty of Science and Arts at Sharurah, Najran University, Sharurah 68342, Saudi Arabia
5
Department of Chemical Engineering, College of Engineering, King Saud University, Riyadh 11451, Saudi Arabia
*
Author to whom correspondence should be addressed.
Biosensors 2023, 13(2), 178; https://doi.org/10.3390/bios13020178
Submission received: 13 December 2022 / Revised: 17 January 2023 / Accepted: 19 January 2023 / Published: 23 January 2023
(This article belongs to the Special Issue Nanomaterials and Their Applications in Sensing and Biosensing)

Abstract

:
Exposure to hydroquinone (HQ) can cause various health hazards and negative impacts on the environment. Therefore, we developed an efficient electrochemical sensor to detect and quantify HQ based on palladium nanoparticles deposited in a porous silicon-polypyrrole-carbon black nanocomposite (Pd@PSi−PPy−C)-fabricated glassy carbon electrode. The structural and morphological characteristics of the newly fabricated Pd@PSi−PPy−C nanocomposite were investigated utilizing FESEM, TEM, EDS, XPS, XRD, and FTIR spectroscopy. The exceptionally higher sensitivity of 3.0156 μAμM−1 cm−2 and a low limit of detection (LOD) of 0.074 μM were achieved for this innovative electrochemical HQ sensor. Applying this novel modified electrode, we could detect wide-ranging HQ (1–450 μM) in neutral pH media. This newly fabricated HQ sensor showed satisfactory outcomes during the real sample investigations. During the analytical investigation, the Pd@PSi−PPy−C/GCE sensor demonstrated excellent reproducibility, repeatability, and stability. Hence, this work can be an effective method in developing a sensitive electrochemical sensor to detect harmful phenol derivatives for the green environment.

1. Introduction

Hydroquinone (HQ) is widely utilized in various industries including textiles, pharmaceuticals, dyes, oil refinery, cosmetics, and others [1]. Therefore, HQ certainly pollutes the environment and causes a critical hazard to human health [2,3]. Even moderate HQ contact can cause a nuisance, fatigue, haziness, vomiting, etc., [4]. Therefore, the HQ is designated as one of the common hazards in the environment by the US Environmental Protection Agency and the European Union [5]. Consequently, there is an urgent need to develop an effective technique to detect HQ from environmental samples. So far, several HQ determination methods have been reported such as the spectrophotometric method [6], fluorimetric method [7], HPLC [8], GC-MS [9], and electrochemical methods [10,11,12,13]. However, the interference effect from closely related pollutants was frequently observed in spectrophotometric detections. Furthermore, the HPLC and GC-MS require huge amounts of costly solvents, sophisticated instruments, and expert hands. Due to these various challenges and slowness, these techniques are unsuitable for on-site detection. Furthermore, fluorimetric determinations often fail to reproduce investigation results. However, the electrochemical determinations have numerous benefits such as their handy nature, and being sensitive, cost-effective, suitable for on-site detection, etc., [14,15,16,17]. Therefore, the electrochemical technique would be an effective substitute HQ determination method.
Unfortunately, HQ determination using common electrodes such as GCE, PtE, and AuE is challenging due to the poor response. Moreover, metal electrodes often suffer from overpotential. Thus, it becomes crucial to design new nanomaterials to fabricate electrodes to obtain an extraordinary electrocatalytic property towards HQ. Recently, considerable efforts have been made to determine various analytes by electrochemical techniques using chemically modified electrodes (CMEs) because of their consistency, short-response-time, cost-effectiveness, simplicity, higher sensitivity, and exclusively in-situ detection [18]. Nowadays, electrode fabrication using different types of nanoparticles of transition metal oxides or sulfides, nanocomposites, conducting polymers, etc., becomes crucial [19,20,21]. Recently, porous silicon (PSi) and PSi–based nanocomposites such as SWCNTs-PSi, PSi-mesoporous carbon, Mn2O3@PSi, Ag@PSi-PANI, etc., have been used in the determination of pollutants because of their cost-effectiveness, non-toxic nature, and over-accessibility [22,23,24]. Lately, several nanostructured material-based electrochemical sensors for HQ detection have been reported [15,25]. In addition, conducting polymers such as polypyrrole, polyaniline, and polythiophene have been widely utilized as electrode modifiers because of their consistency as the host material [16,26,27]. Recently, researchers showed huge interest in electrode fabrication utilizing polymers and surfactants because of their amazing electrochemical properties [28,29]. Currently, researchers have fabricated electrodes using hybrid materials containing noble metals, silicon, carbon, metal oxides, etc., with different conducting polymers to obtain the improved electrochemical activities of hybrid nanomaterials [30,31]. Such hybrid materials are appropriate for many applications such as organo-electronic, sensing, photocatalysis, energy-storage device, supercapacitor, solar cell, bioengineering applications, etc., [32,33,34]. Additionally, polypyrrole (PPy)-doped carbon black (C) with PSi and PdNPs hybrid nanomaterial was never used in an electrochemical-sensing application. Therefore, herein, we devoted our efforts to design and develop an effective HQ sensor by utilizing the Pd@PSi−PPy−C/GCE.

2. Materials and Methods

2.1. Materials

Powdered silicon (~40 µm), NaH2PO4, Na2HPO4, HF, HNO3, palladium chloride, polypyrrole-doped carbon black, and hydroquinone were purchased from Sigma Aldrich and used as received. We utilized double-distilled water for preparing all the solutions. The XPS for the Pd@PSi−PPy−C was achieved utilizing the MgKα spectrometer (JEOL, JPS 9200) under the following conditions: pass energy = 50 eV (wide-scan) and 30 eV (narrow-scan), voltage = 10 kV, and current = 20 mA. XRD spectra were recorded using the PANalytical X-ray diffractometer using Cu Kα1/2, λα1 = 154.060 p.m., λα2 = 154.439 p.m. radiation. A Perkin Elmer 100 spectrometer was used to record the FTIR spectra from the PSi and Pd@PSi−PPy−C nanocomposite. FE-SEM investigations were performed using an FE-scanning electron microanalyzer (JEOL-6300F, 5 kV). The elemental analysis of the as-grown Pd@PSi−PPy−C was performed by EDS (JEOL, Japan). TEM micrographs were taken at 200 kV using a JEOL JEM-2100F-UHR field emission instrument fitted out with a Gatan GIF 2001 energy filter and 1 k-CCD camera. Electrochemical investigations were performed utilizing a Zahner Zennium potentiostat (German).

2.2. Synthesis of the PSi, PSi−PPy-C, and Pd@PSi−PPy-C Nanocomposite

First, 2.0 g of powdered silicon was disseminated in 20 mL 48% HF and 80 mL distilled water. Then, 10 mL 70% HNO3 was added to the beaker dropwise under mild stirring at ambient conditions [35]. The production of nitrogen dioxide vapor indicated the end of stain etching method. We collected the PSi nanoparticles (NPs) by decantation followed by washing 2–3 times using distilled water. Finally, we dried the PSiNPs at 65 °C for 8 h. The following reaction occurred during the stain etching method:
3Si + 4HNO3 + 18HF → 3H2SiF6 + 4NO + 8H2O
We used a facile sonication method to synthesize the PSi−PPy−C nanocomposite containing 5 wt% PPy−C polymer. For this, 0.4 g PSiNPs and 0.02 g PPy−C were carefully mixed and then dispersed in 80 mL distilled water with a mild sonication for ~30 min. Lastly, the PSi−PPy−C nanocomposite was collected and dried at 60 °C.
Later, we deposited 1% PdNPs onto the PSi-PPy-C nanocomposite utilizing a photo-deposition method. Herein, 0.2 g PSi-PPy-C was disseminated in 1% methanol solution (v/v) and stirred for 5 min. Then, 500 µL of a palladium solution comprising 0.004 g palladium was added dropwise to this 1% methanol solution. Finally, we irradiated light for 24 hrs in mildly stirred conditions using a UV source from a Philips Hg lamp (illumination intensity at 350 nm: 2.0 mWcm−2). We collected this 1%Pd@PSi−PPy−C nanocomposite via decantation and dried it at 60 °C. This as-grown 1% Pd@PSi−PPy−C is denoted as Pd@PSi−PPy−C in this work.

2.3. Modification of Glassy Carbon Working Electrode Using Pd@PSi−PPy−C Nanocomposite

Glassy carbon electrodes (GCEs) were cleaned, respectively, utilizing 1 µm diamond followed by 0.05 µm alumina. Later, GCEs were modified with the Pd@PSi–Ppy–C nanocomposite utilizing the Nafion solution. In the fabrication process, a 3.0 mg Pd@PSi–PPy–C was homogeneously mixed in 0.05 mL Nafion-0.45 mL propan-2-ol mixture and then optimized 1.5 µL suspension was cautiously transferred to clean, polished GCEs and dried at 60 °C for 20 min. Such modified GCEs are denoted as Pd@PSi−PPy−C/GCE. For the control experiments, PSi/GCE, and PSi-PPy-C/GCE were also fabricated by similar procedures. A standard 3-electrode electrochemical cell was used where a Pd@PSi−PPy−C/GCE, Ag/AgCl, and a platinum spiral were utilized as a working electrode, a reference electrode, and a counter electrode, respectively. The electrochemical investigations of HQ (1–700 µM) were carried out using cyclic voltammetry (CV), electrochemical impedance spectroscopy (EIS), and amperometry at room temperature utilizing 0.1 M PBS of pH 7.0.

3. Results and Discussion

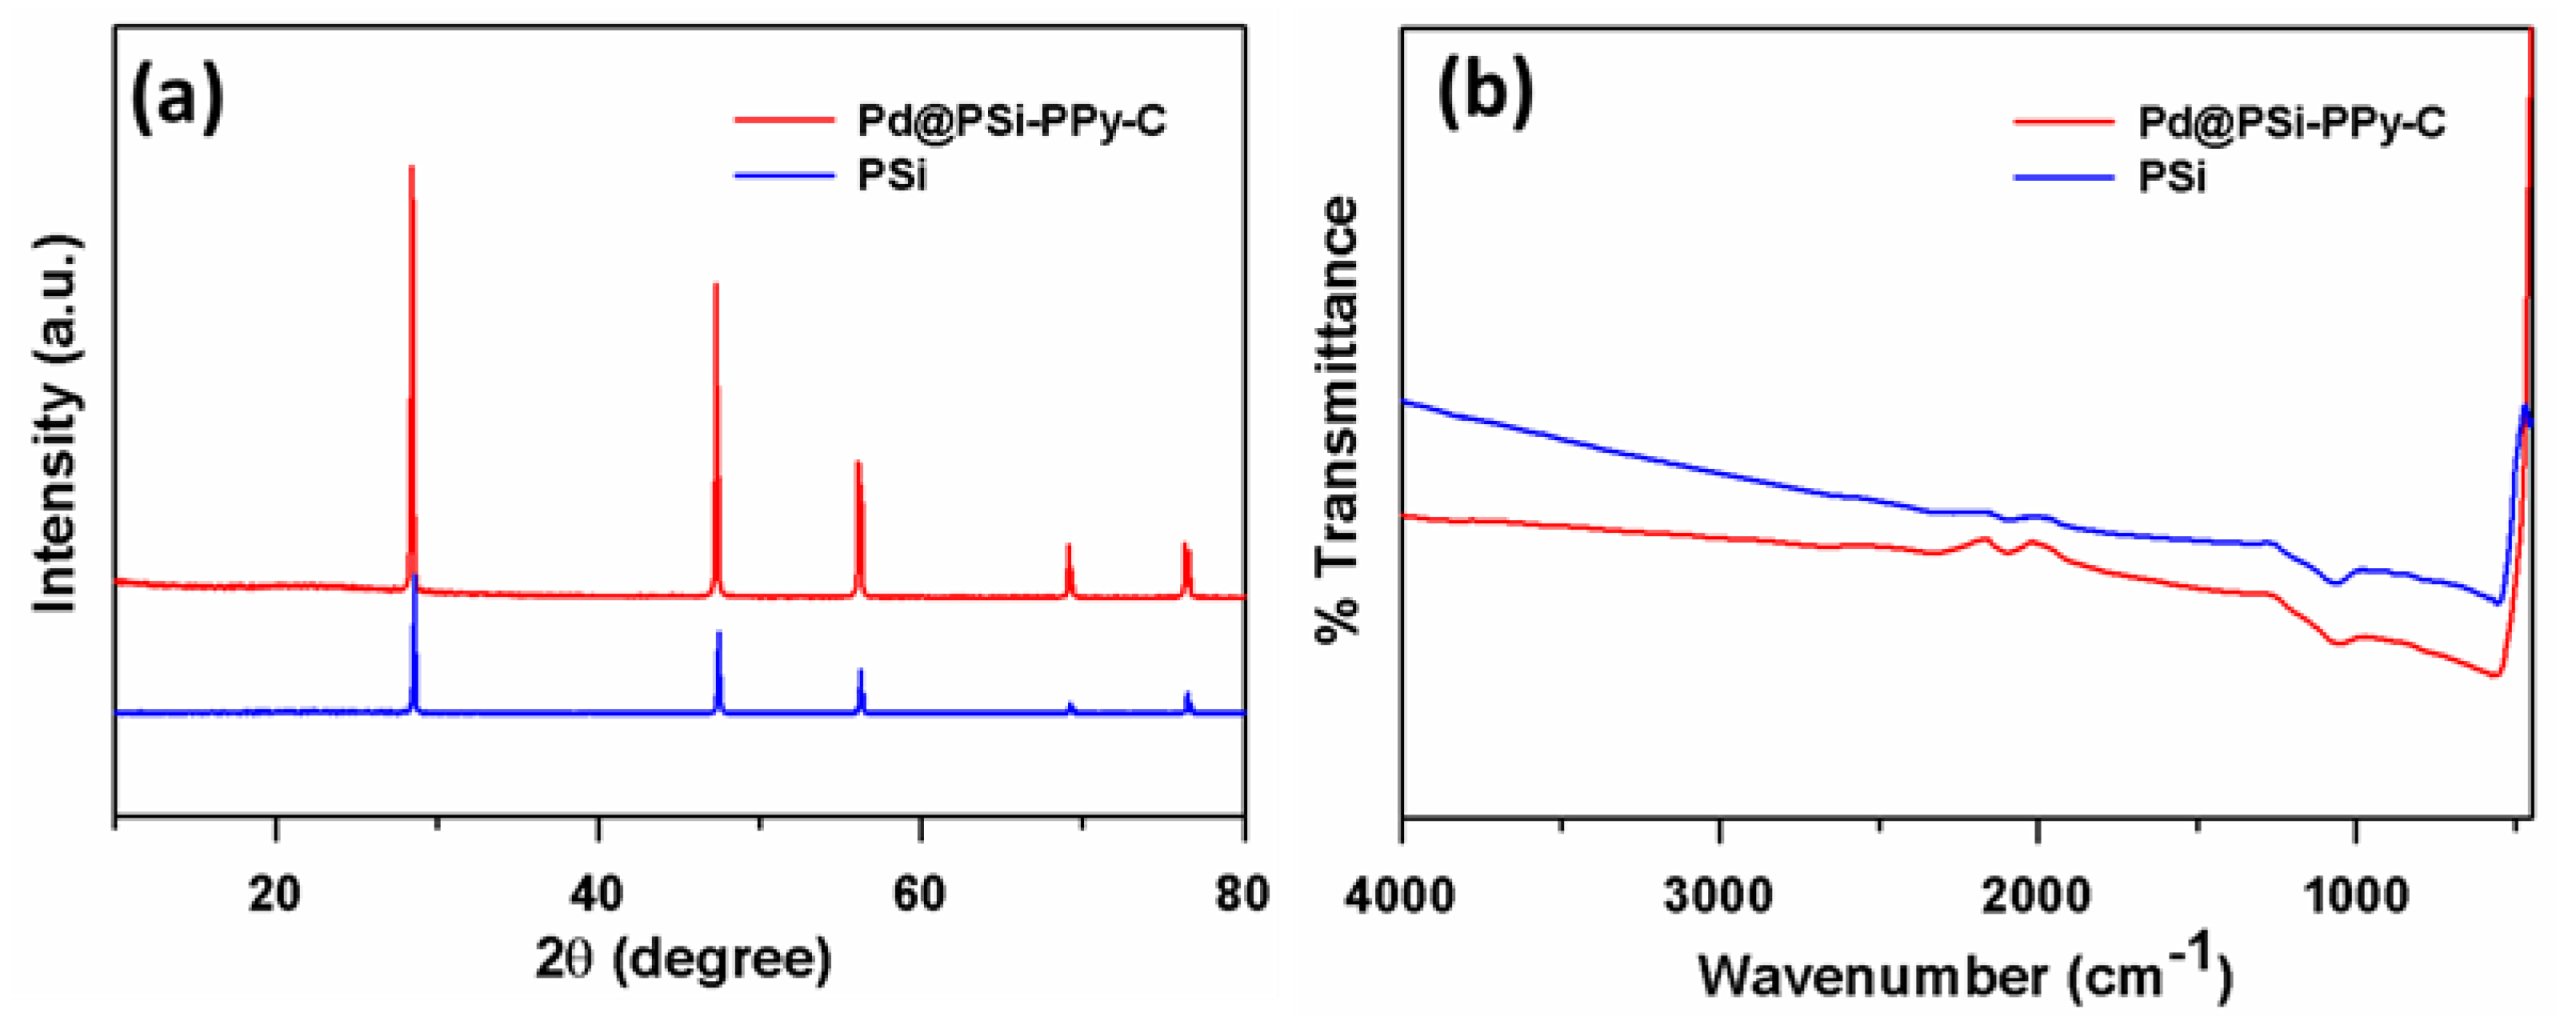
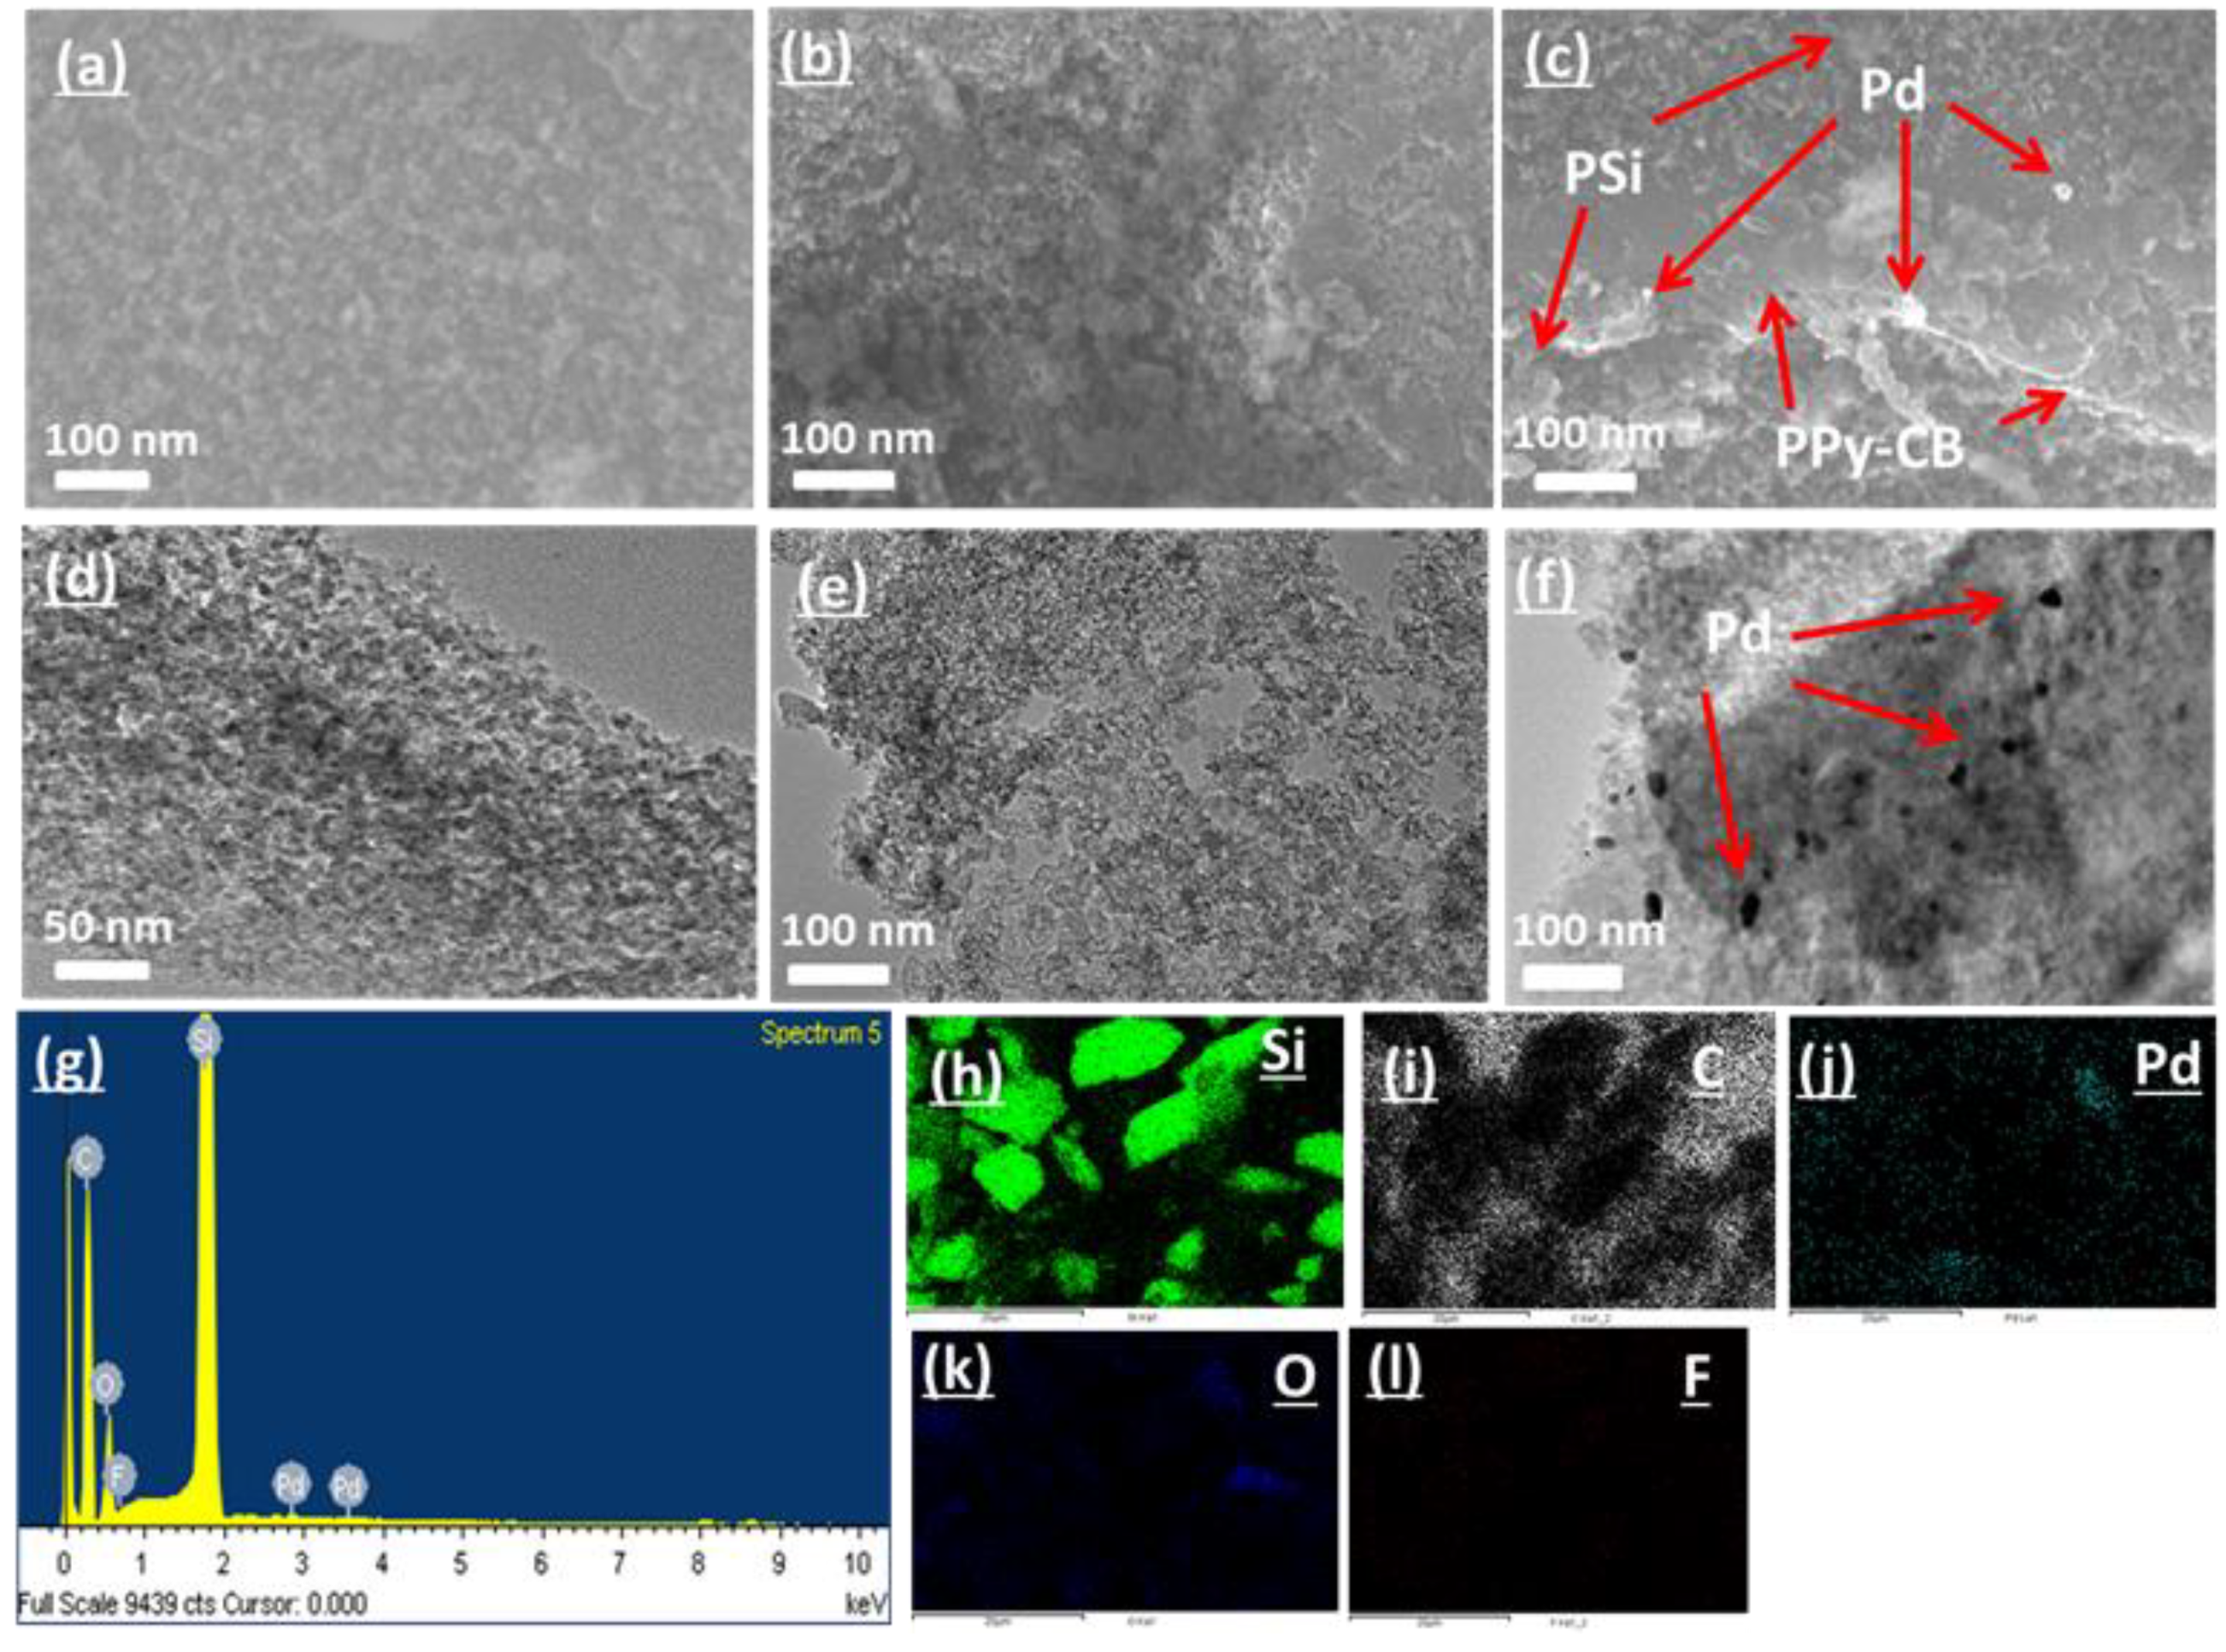
3.1. Characterization of the Pd@PSi−PPy−C Nanocomposite

XPS was used to study the purity and structure of Pd@PSi−PPy−C. From the XPS study presented in Figure 1a–f, it is clear that this Pd@PSi−PPy−C nanocomposite was composed of Si, Pd, C, N, and O atoms only. The Pd-3d spectrum shows two well-resolved peaks (Figure 1b) that appeared at 337.2 and 342.1 eV and that can be correlated to Pd3d5/2 and Sb3d3/2, respectively. These are also consistent with the binding energies of Pd3d [36]. In the fine scan of the Si-2p XPS spectrum (Figure 1c), the peaks at 99.5 and 103.2 eV were correlated to Si2p3/2 and Si2p1/2, respectively [37]. In the deconvoluted C-1s spectrum (Figure 1d), three peaks appeared at 284.1, 285.4, and 288.1 eV, and of these, the peaks at 284.1 and 285.4 eV could be consigned to C–C and C-O-H bonds, respectively [38,39], and the remaining peak at 288.1 eV was related to COOH [40]. A previous report recommended that the C-1s peak appearing at 285.4 eV was also correlated to the C–N bonds of PPy [41]. A deconvolution plot of the N-1s spectrum (Figure 1e) displayed a peak at 399.9 eV that was related to the C–N bond of PPy moiety [42]. Figure 1f shows two peaks that appeared at 533.1 and 533.7 eV from the deconvoluted O1s spectrum that could be correlated to Si-O and C-O bonds, respectively [43].
In the XRD patterns (Figure 2a), the diffraction bands that appeared at 2θ = 28.3°, 47.3°, 56.0°, 69.1°, and 76.3° were related to (2 2 0), (3 1 1), (4 0 0), (3 3 1), and (4 2 2) lattice planes for Si (JCPDS # 27-1402), respectively [44]. The carbon-related peak of carbon black present in the Pd@PSi–PPy–C often appeared at 2θ = 24.3°, which was correlated to (0 0 2) plane [21], which is not properly visible in Figure 2a due to its sluggish intensity. Because of the low palladium content (1%) in Pd@PSi–PPy–C, the PdNPs peaks were not visible in the XRD patterns; however, the presence of PdNPs in the Pd@PSi–PPy–C was confirmed by XPS, EDS, SEM, and TEM. Figure 2b displays the FTIR investigation results of the Pd@PSi–PPy–C nanocomposite. Characteristic PSi NPs’ vibrational bands appearing at 2287 and 2095 cm−1 could be correlated to Si–H2 and Si–H stretching modes of vibration, respectively [45]. Distinct FTIR peaks that appeared at 1075 and 559 cm−1 were attributed to asymmetric Si–O stretching modes of vibrations [46,47].
The morphology and surface structure of PSi, PSi-PPy−C, and the Pd@PSi−PPy-C nanocomposite were explored by FESEM (Figure 3a–c). The Pd@PSi−PPy−C nanocomposite consisted of PdNPs that were dispersed randomly on the porous polymeric sheet structure of PSi−PPy−C. The average diameter of PdNPs was estimated as 18 nm. TEM images in Figure 3d–f displayed a more clear morphology of PSi, PSi−PPy−C, and Pd@PSi−PPy−C, where a gathering of spherical PdNPs dispersed on sheet-like structures of PSi−PPy−C. The porous nature of the PSi and the dispersed PdNPs having an average particle size of ~19 nm was evidently labelled in the TEM micrographs. Elemental compositions of the Pd@PSi−PPy−C nanocomposite were investigated by EDS (Figure 3g) and confirmed that the Pd@PSi−PPy−C nanocomposite consisted of Pd, Si, C, F, and O only and their weight percentages were 0.97%, 50.64%, 38.47%, 0.07%, and 9.85%, respectively. Elemental mapping Figure 3h–l also confirmed the constituents of the Pd@PSi−PPy−C nanocomposite. This elemental composition of the Pd@PSi−PPy−C nanocomposite is well-matched to the above XPS and XRD results.

3.2. Hydroquinone Sensor Development

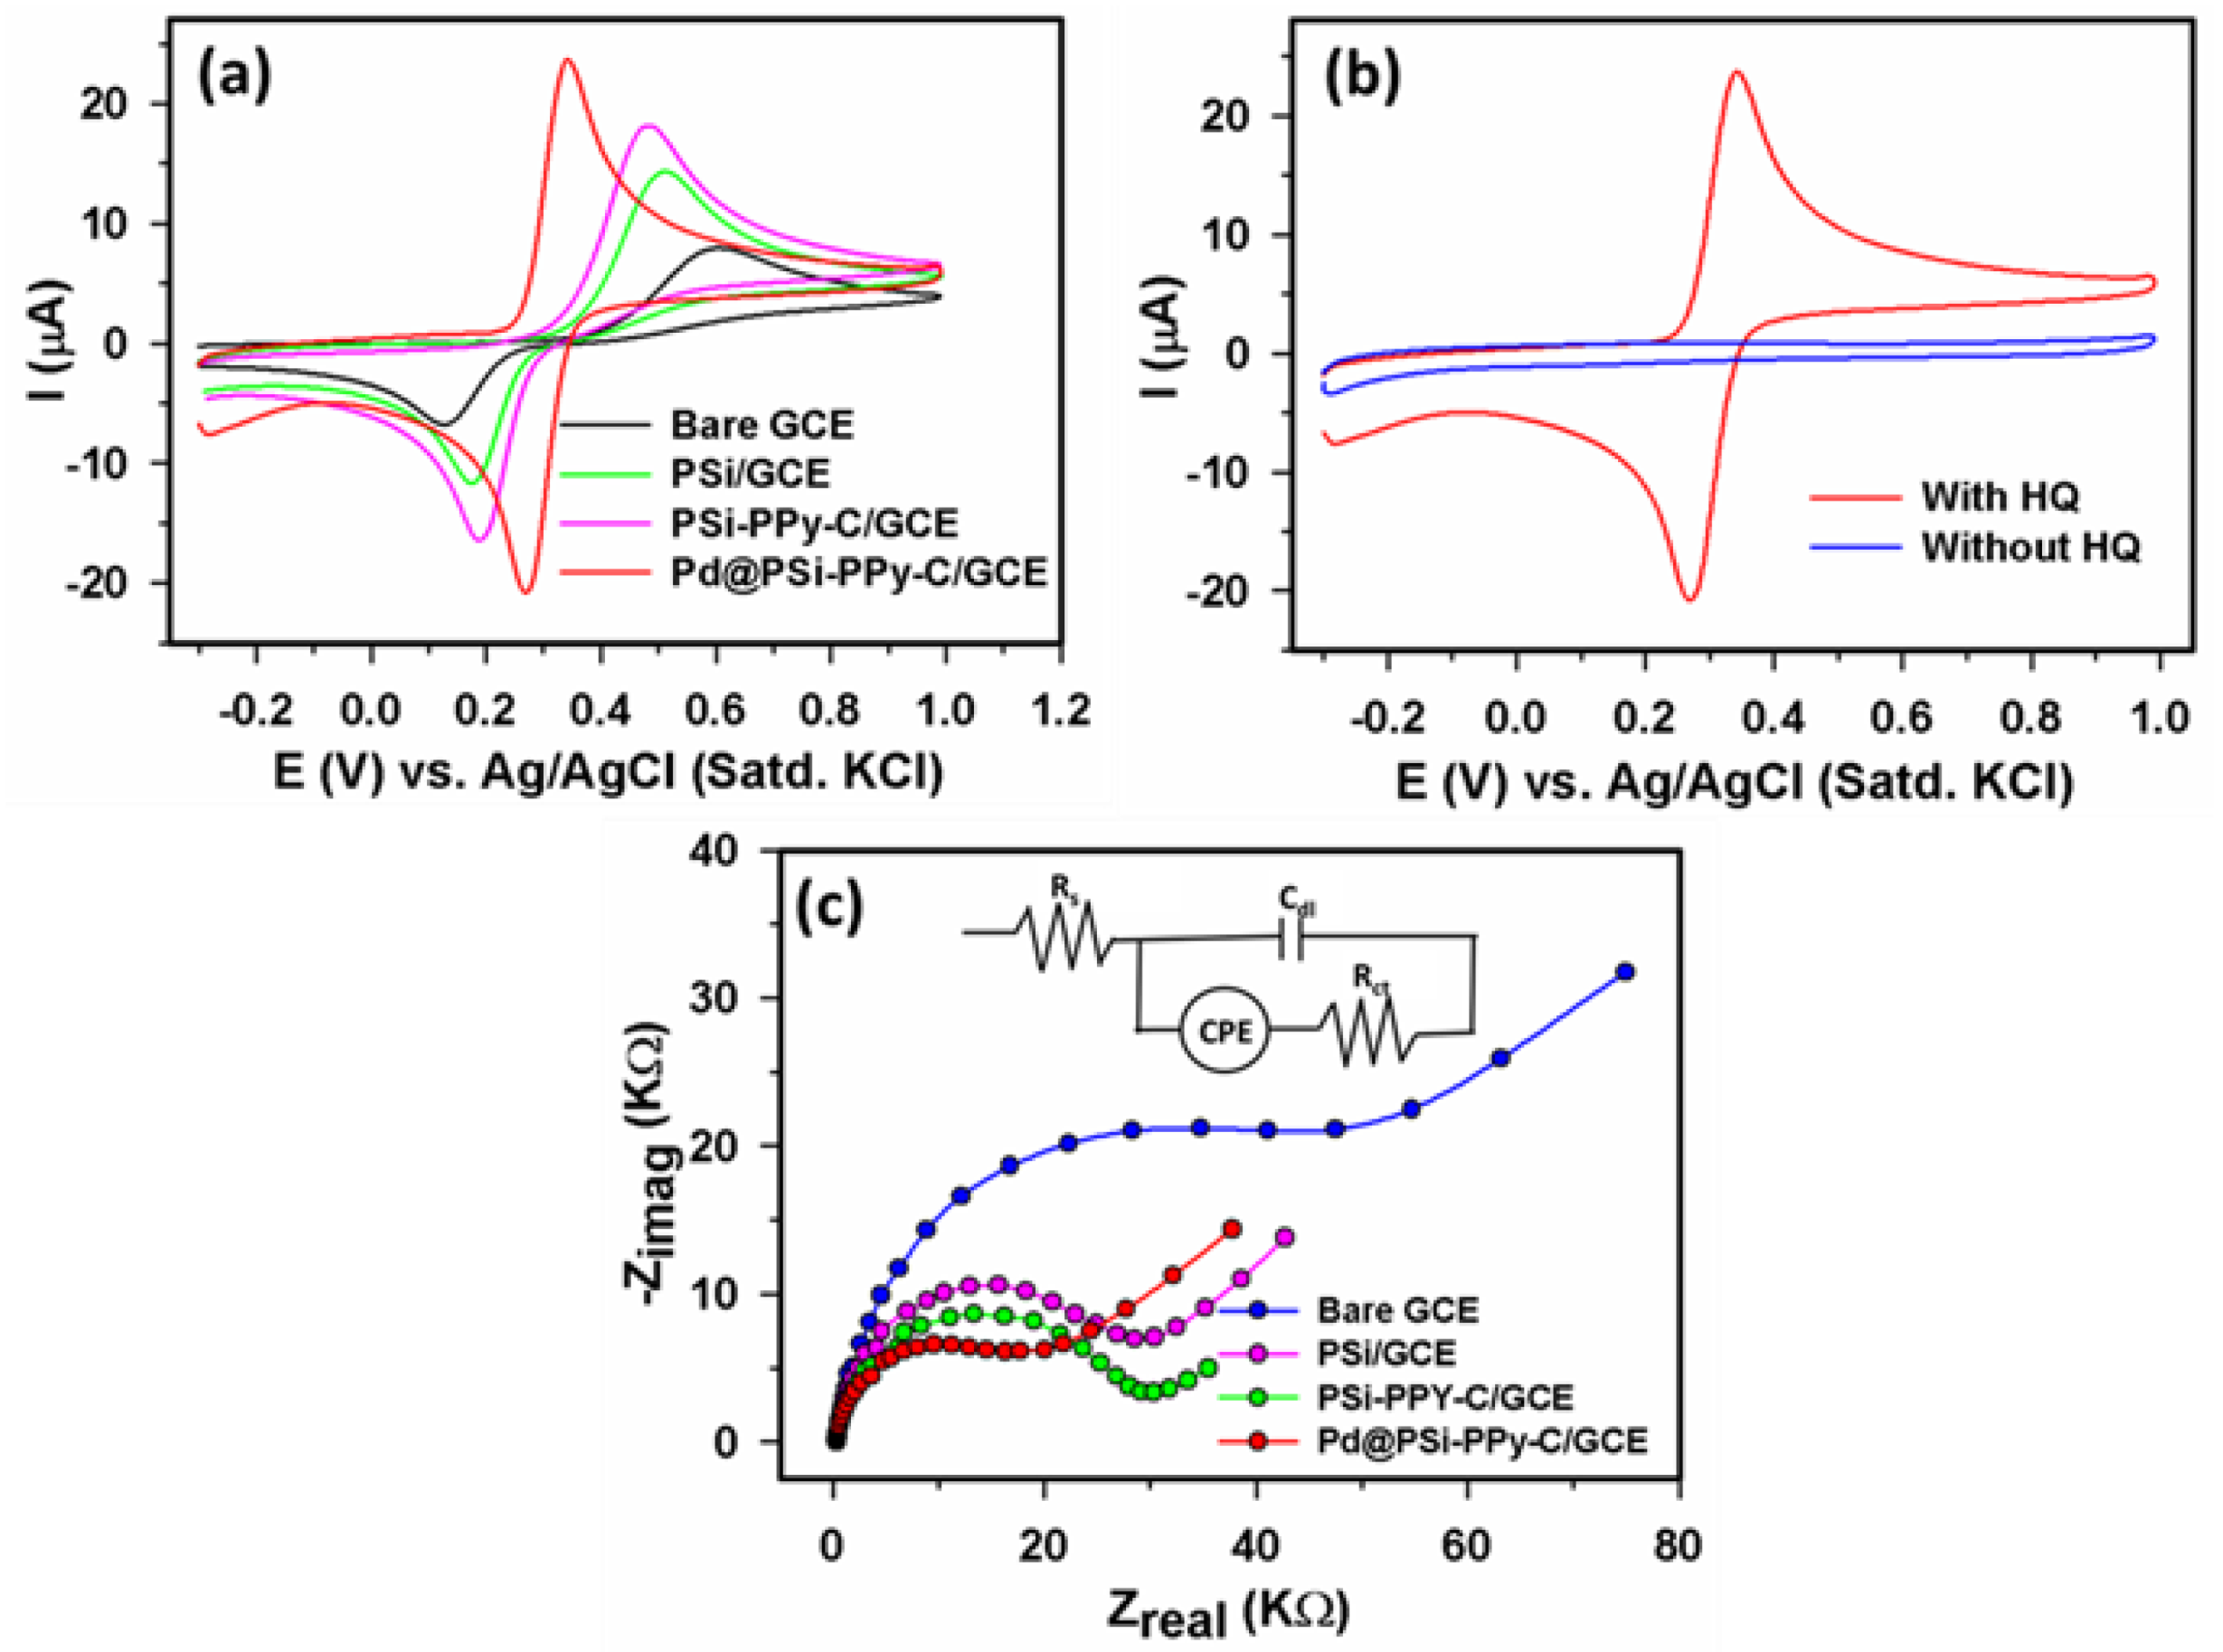
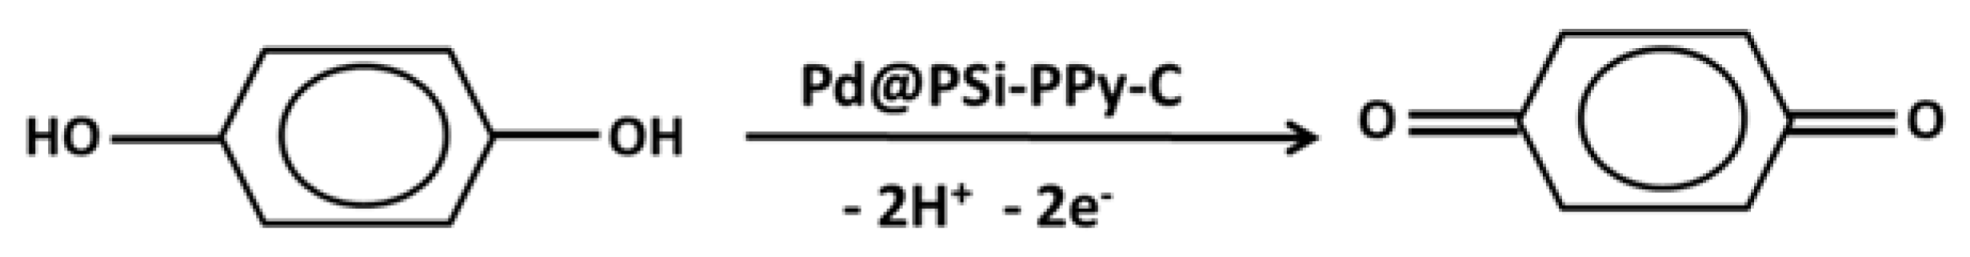
3.2.1. Electrochemical Investigation of Pd@PSi−PPy−C/GCE

We explored the electrochemical activities of fabricated electrodes by cyclic voltammetry (CV) and electrochemical impedance spectroscopy (EIS). Figure 4a displays a weak CV output resulting from the bare GCE with 350 µM HQ at +0.61 V. PSi/GCE and PSi−PPy−C/GCE electrodes produced an improved CV response in the presence of 350 µM HQ at +0.52 V and +0.49 V, respectively vs. Ag/AgCl; however, the significantly improved CV result at +0.34 V was attained for Pd@PSi−PPy−C/GCE. Therefore, it was confirmed that the Pd@PSi−PPy−C/GCE electrode showed the best electrocatalytic activities during the HQ detection compared to other electrodes specified in Figure 4a. Hence, we nominated the Pd@PSi−PPy−C/GCE electrode as the HQ sensor in this work. Additionally, for the Pd@PSi−PPy−C/GCE electrode, a distinctive CV peak was achieved with 350 µM HQ, but, in the absence of HQ, no response was observed (Figure 4b) that further established the effective electrochemical properties of the Pd@PSi−PPy−C/GCE HQ sensor. Figure 4c shows the EIS Nyquist plots for the bare GCE, PSi/GCE, PSi−PPy−C/GCE, and Pd@PSi−PPy−C/GCE and the corresponding equivalent circuit is given in the inset. A low semicircular diameter obtained for the Pd@PSi−PPy−C/GCE suggested a lowered Rct value (32 kΩ) of this electrode compared to the bare GCE (78 kΩ), PSi/GCE (47 kΩ), and PSi−PPy−C/GCE (39 kΩ) [48,49]. Therefore, we conclude that the Pd@PSi−PPy−C/GCE electrode exhibited enhanced electron transfer capability in comparison to other electrodes examined in Figure 4c.
To explore the electrochemical oxidation of HQ, we studied the pH effect in the range of 6.0–8.0 in the presence of 350 µM HQ. Figure 5a,b show that the Ipa value gradually increased for pH 6.0–7.0, whereas a decreasing trend for pH 7.0–8.0 was detected, and thus the optimal Ipa was observed at pH ~ 7.0 in Figure 5b. Consequently, pH 7.0 was fixed for the rest of the experiments in this work. Figure 5c displays a straight line plot of Epa vs. pH having the regression Equation (1).
Epa(V) = 0.6732−0.0520pH     (R2 = 0.9881)
Figure 5c shows that for the examined pH range of 6.0–8.0, a gradient −52 mV per pH unit was very close to the theoretical value −59, confirming that the transferred electron and proton numbers associated with this HQ oxidation were equivalent [16,24].
The scan rate (υ) study in Figure 6a shows the CVs of 350 µM HQ recorded for varying scan rates (40–380 mVs−1) utilizing the Pd@PSi−PPy−C/GCE electrode. The Ipa value in Figure 6a increased with increasing υ, while the Epa values were only slightly shifted in the positive directions. Figure 6b exhibits the nonlinear variation of Ipa vs. υ indicating that the HQ oxidation did not follow a surface-controlled process [50,51]. Moreover, for υ > 0.04 Vs−1, a linear Ipa vs. υ1/2 curve was also obtained in Figure 6c, confirming a diffusion-controlled process [5,52,53,54] according to the following Equation (2).
Ipa(µA) = 99.6886 υ1/2 (V1/2s−1/2) + 1.2246     (R2 = 0.9998)
Again, Figure 6d displays a linear relation between log(Ipa) and log(υ) with the following Equation (3) confirming the diffusion-controlled process [11].
log[Ipa (µA)] = 0.4837 log [υ (Vs−1)] + 1.9995    (R2 = 0.9997)
Furthermore, in Figure 6e, another linear plot of Epa vs. log(υ) was achieved with the following Equation (4).
Epa(V) = 0.0356 log[υ (Vs−1)] + 0.3879     (R2 = 0.9874)
Figure 6a exhibits that for υ < 150 mVs−1, [Epa–Epc]/2 stayed nearly the same as 48.3 mV. Therefore, at the 50 mVs−1 scan rate, [Epa–Epc]/2 can be taken as 90.5/nα mV [1], and thus the number of transferred electrons (nα) was calculated as 1.87 ≈ 2. Thus, we decided that the HQ oxidation at the Pd@PSi–PPy–C/GCE sensor was involved in transferring two electrons. Therefore, the scan rate and the pH studies established that the HQ oxidation at the Pd@PSi–PPy–C/GCE sensor was a combination of two-electron plus two-protons, which is in line with the literature [1].

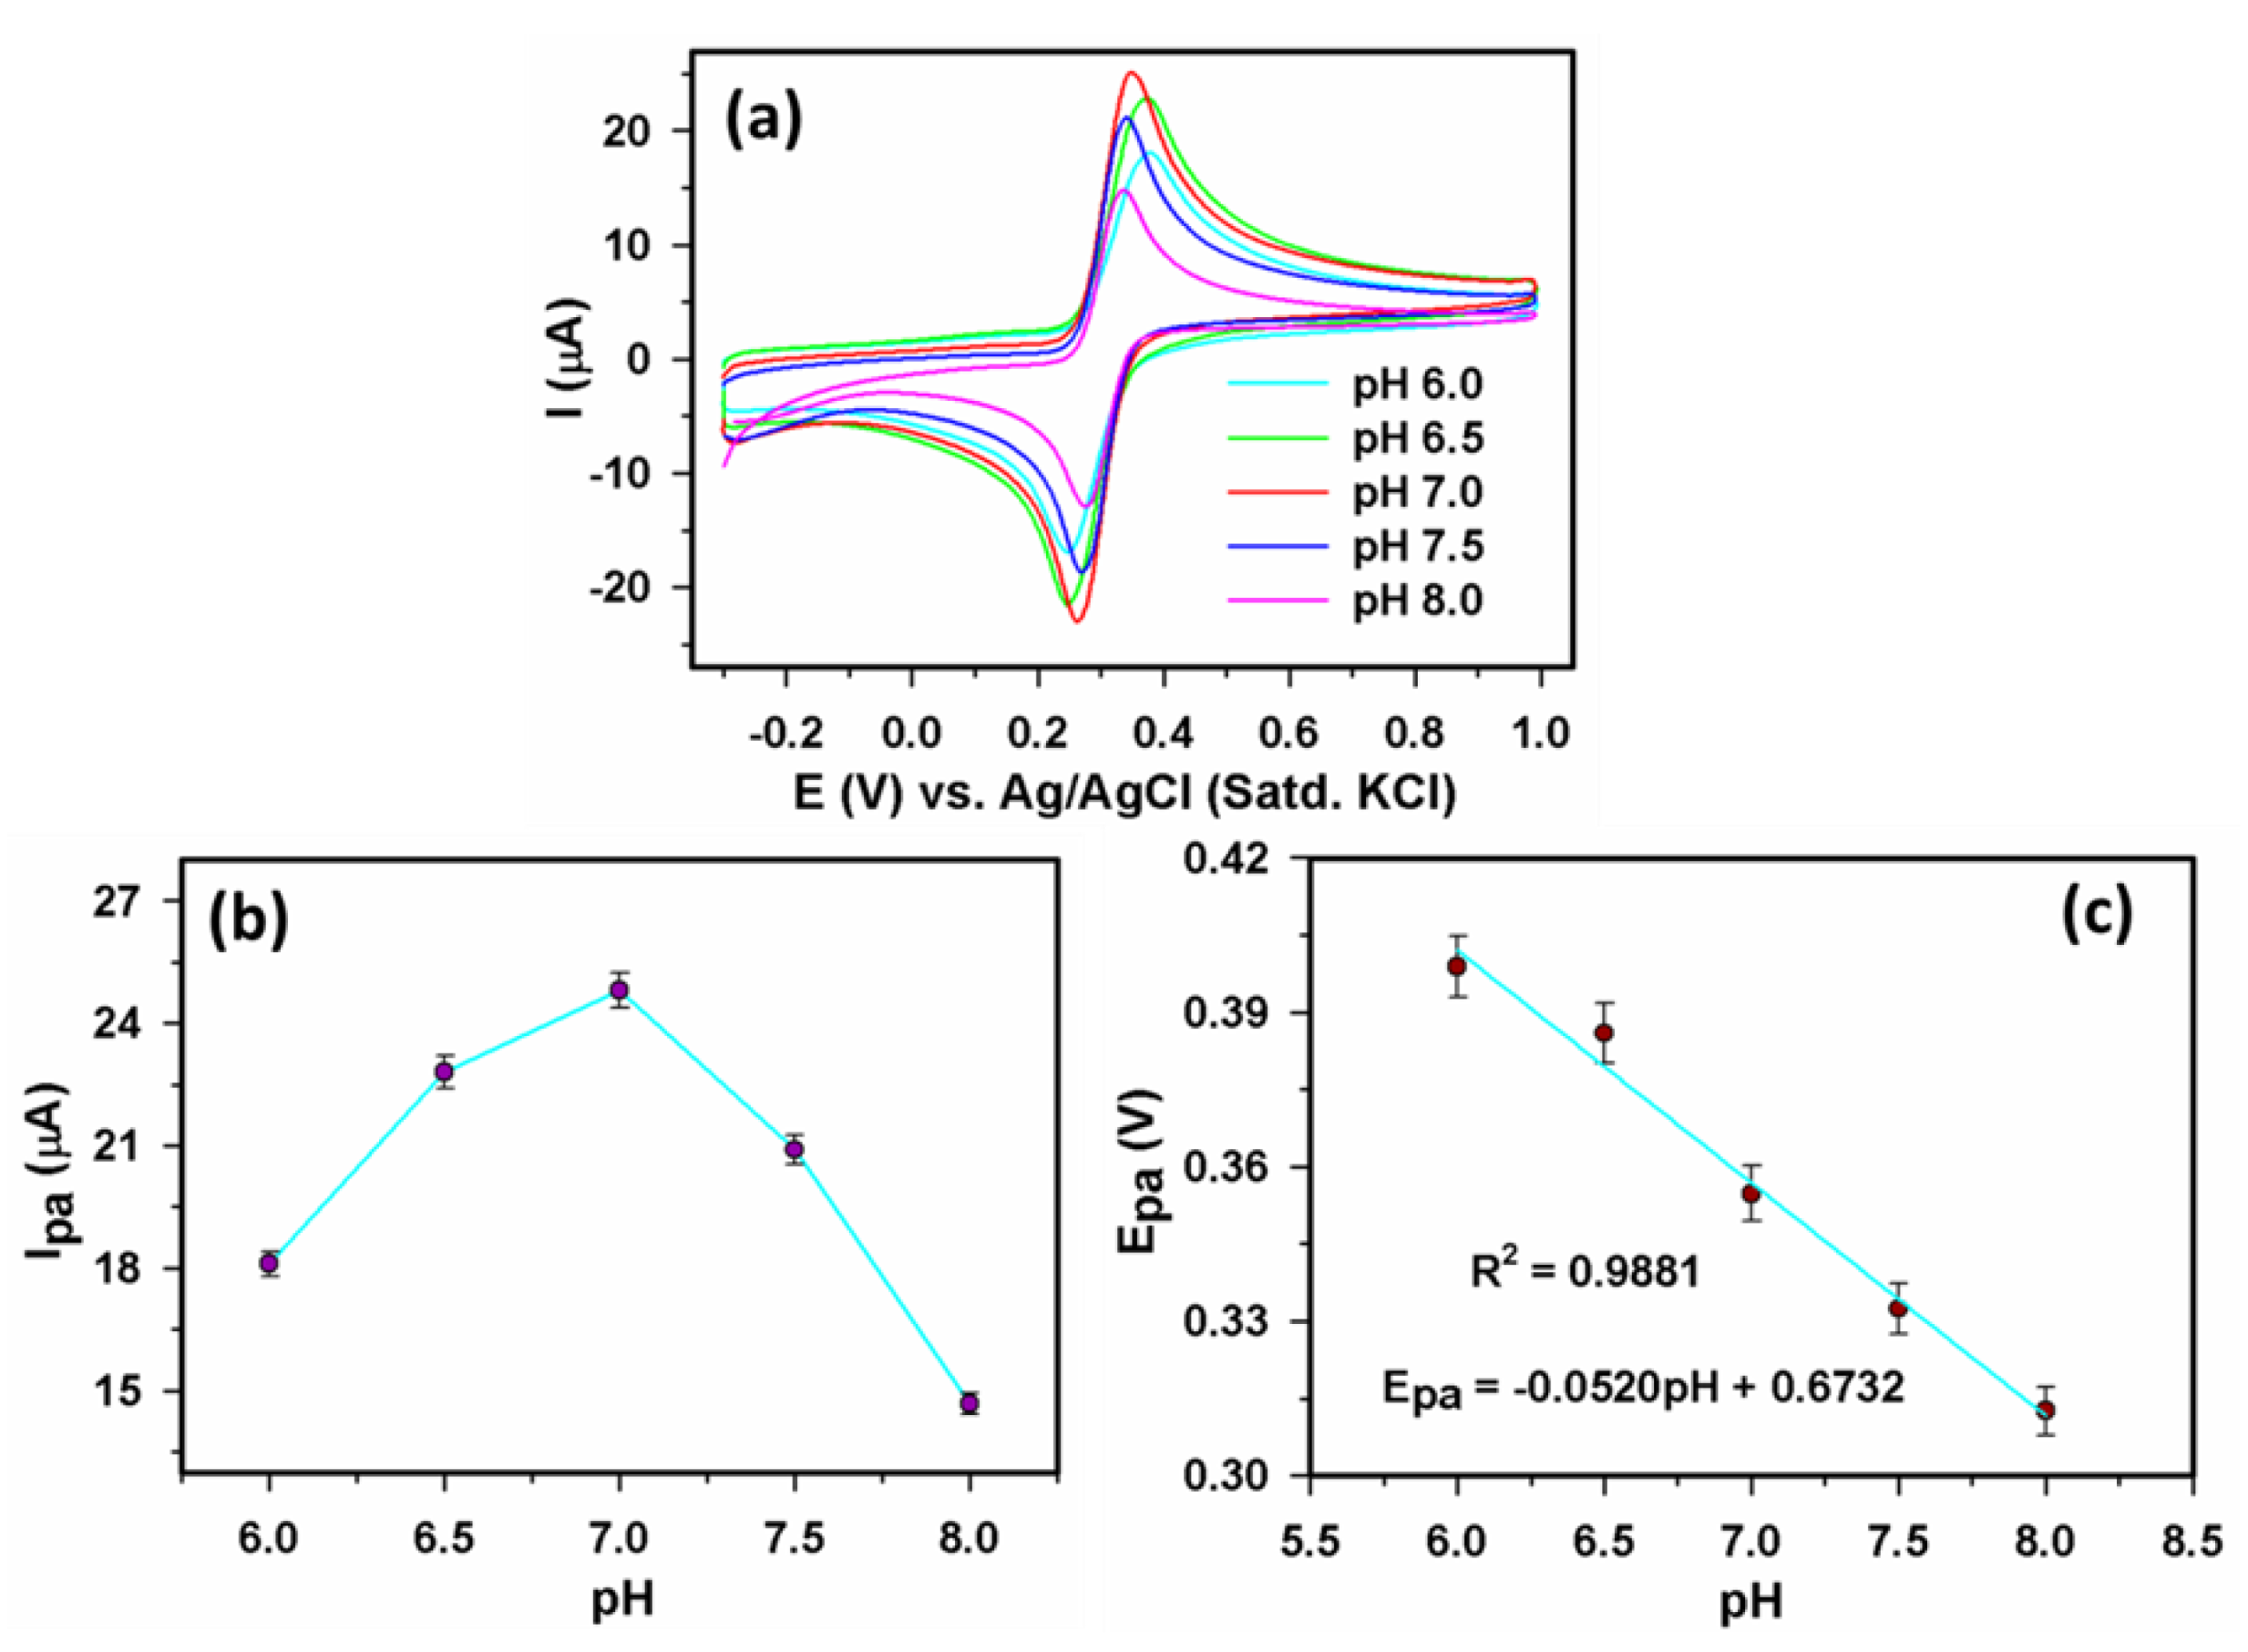
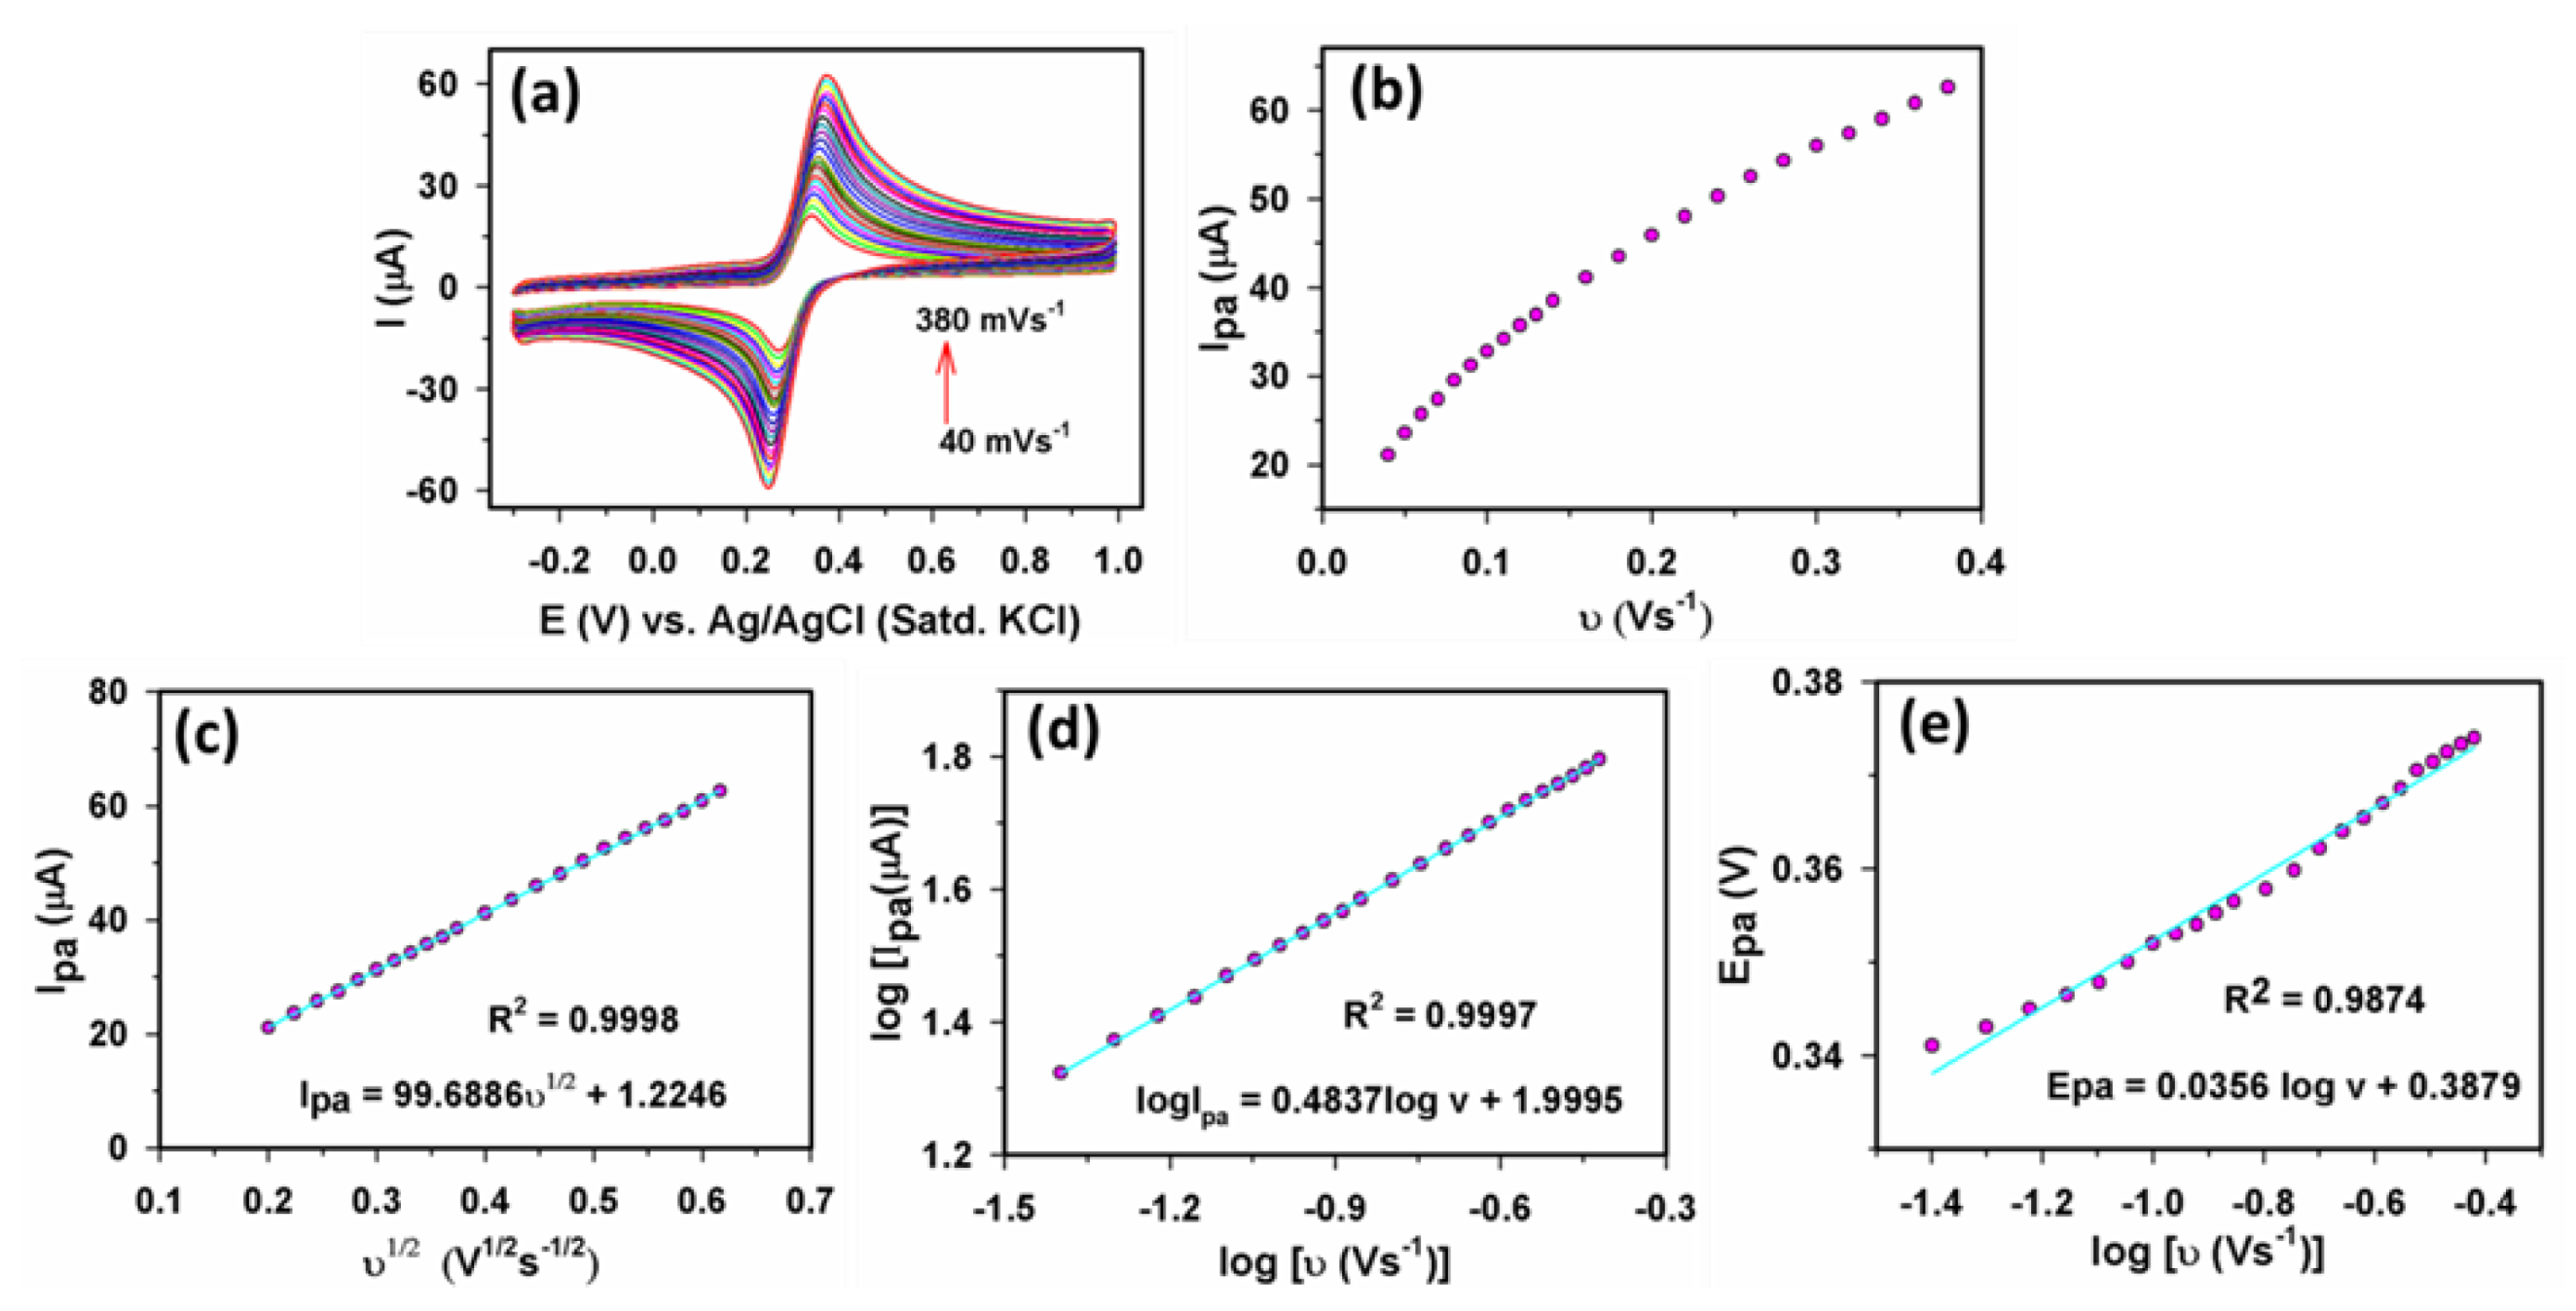
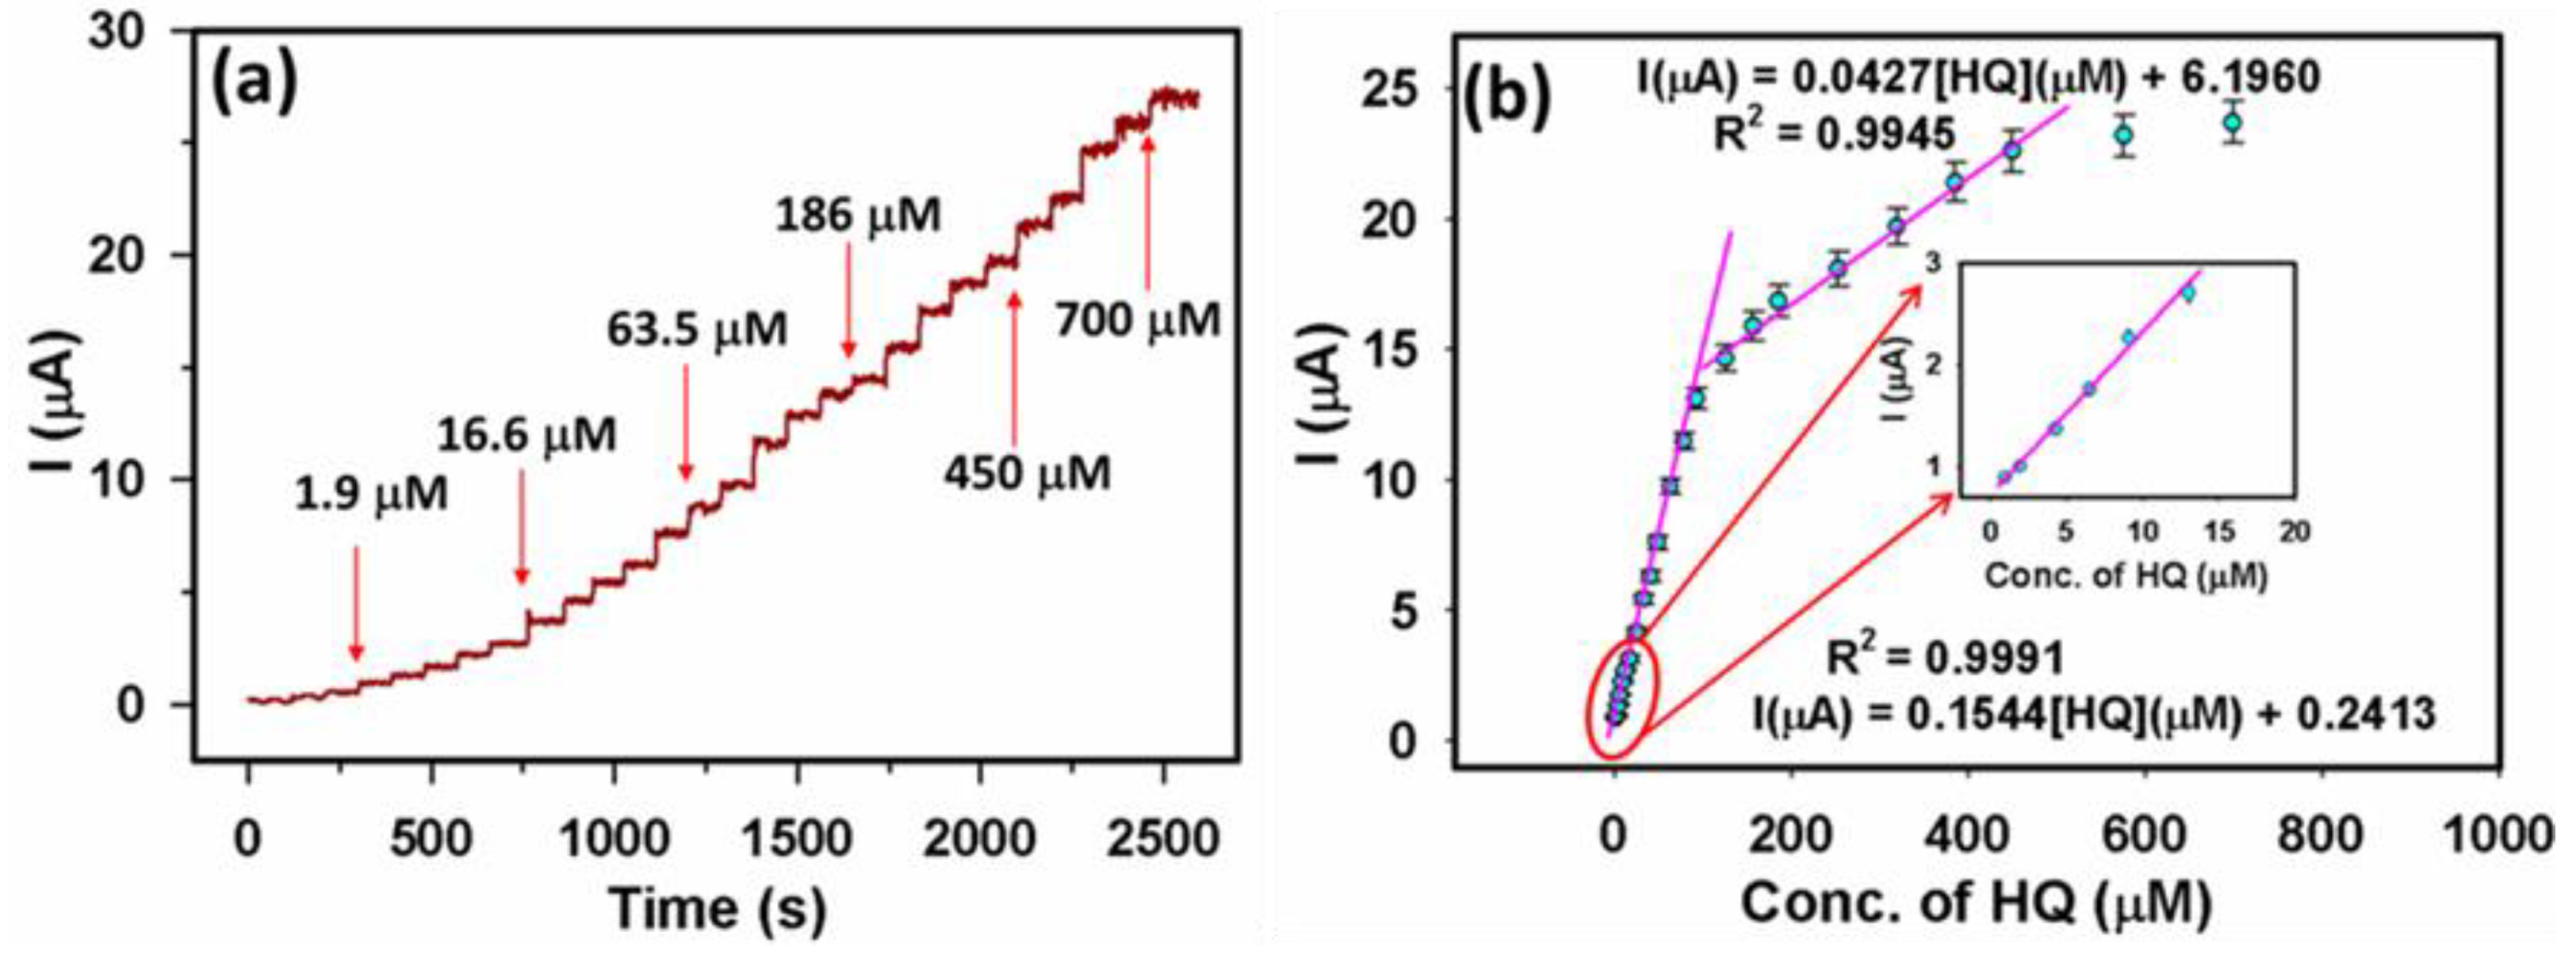
3.2.2. Determination of Sensor Parameters for the Pd@PSi–PPy–C/GCE Sensor

We used the amperometric technique to explore the sensor performance of the Pd@PSi–PPy–C/GCE sensor. The amperometric (it) response was acquired at the optimized potential of +0.35 V with successive HQ additions with varying concentrations (1–700 µM). Figure 7a displays the amperometric i-t curve accomplished with HQ using the Pd@PSi−PPy−C/GCE assembly. Here, for each HQ addition, the current response reached ~96% of its highest current in only 6 s. Figure 7b displays two linear segments in the calibration plot: for the lower concentration region, 1–13 µM HQ, and for the higher concentration part, 13–450 µM HQ plotted based on the amperometric responses having the following Equations (5) and (6), respectively.
I(μA) = 0.1544 [HQ](µM) + 0.2413     (R2 = 0.9991)
I(μA) = 0.0427 [HQ](µM) + 6.1960     (R2 = 0.9945)
Thus, the linear dynamic range (LDR) for the Pd@PSi–PPy–C/GCE sensor was obtained as 1–450 µM. Furthermore, the estimated sensitivity value for the Pd@PSi−PPy−C/GCE sensor was achieved as 3.0156 µAµM–1cm−2, the LOD calculated as ~ 0.074 μM (S/N = 3), and the limit of quantification (LOQ) as 0.227 µM. For the sensitivity calculation, we used the equation sensitivity = S/Aeff [11], where Aeff denotes the surface area of the active electrode (0.0512 cm2) as presented in the electronic supplementary materials [55]. The LOD and LOQ were estimated using equations LOD = 3.3(Sb/S) and LOQ = 10(Sb/S), respectively [56,57]; herein, the Sb (0.0035) stands for RSD of five blank runs and S represents the slope of the calibration curve.
In electrochemical kinetics, electrocatalytic activities depend on two factors: (i) the intensification of the current responses and (ii) the reduction of overpotential during the electrooxidation. Consequently, we tried to enhance the electrochemical property of the active electrode by fabricating the working GCEs with the active Pd@PSi−PPy−C nanocomposite. The obtained results confirmed that this Pd@PSi−PPy−C/GCE sensor effectively fulfills both of the above-mentioned factors. The above Figure 4a shows a more substantial negative shift of Epa and massive Ipa increase from the Pd@PSi−PPy−C/GCE sensor than other electrodes employed here. Actually, we attained ~3 times the Ipa value than the bare GCE during the HQ oxidation at the Pd@PSi−PPy−C/GCE.

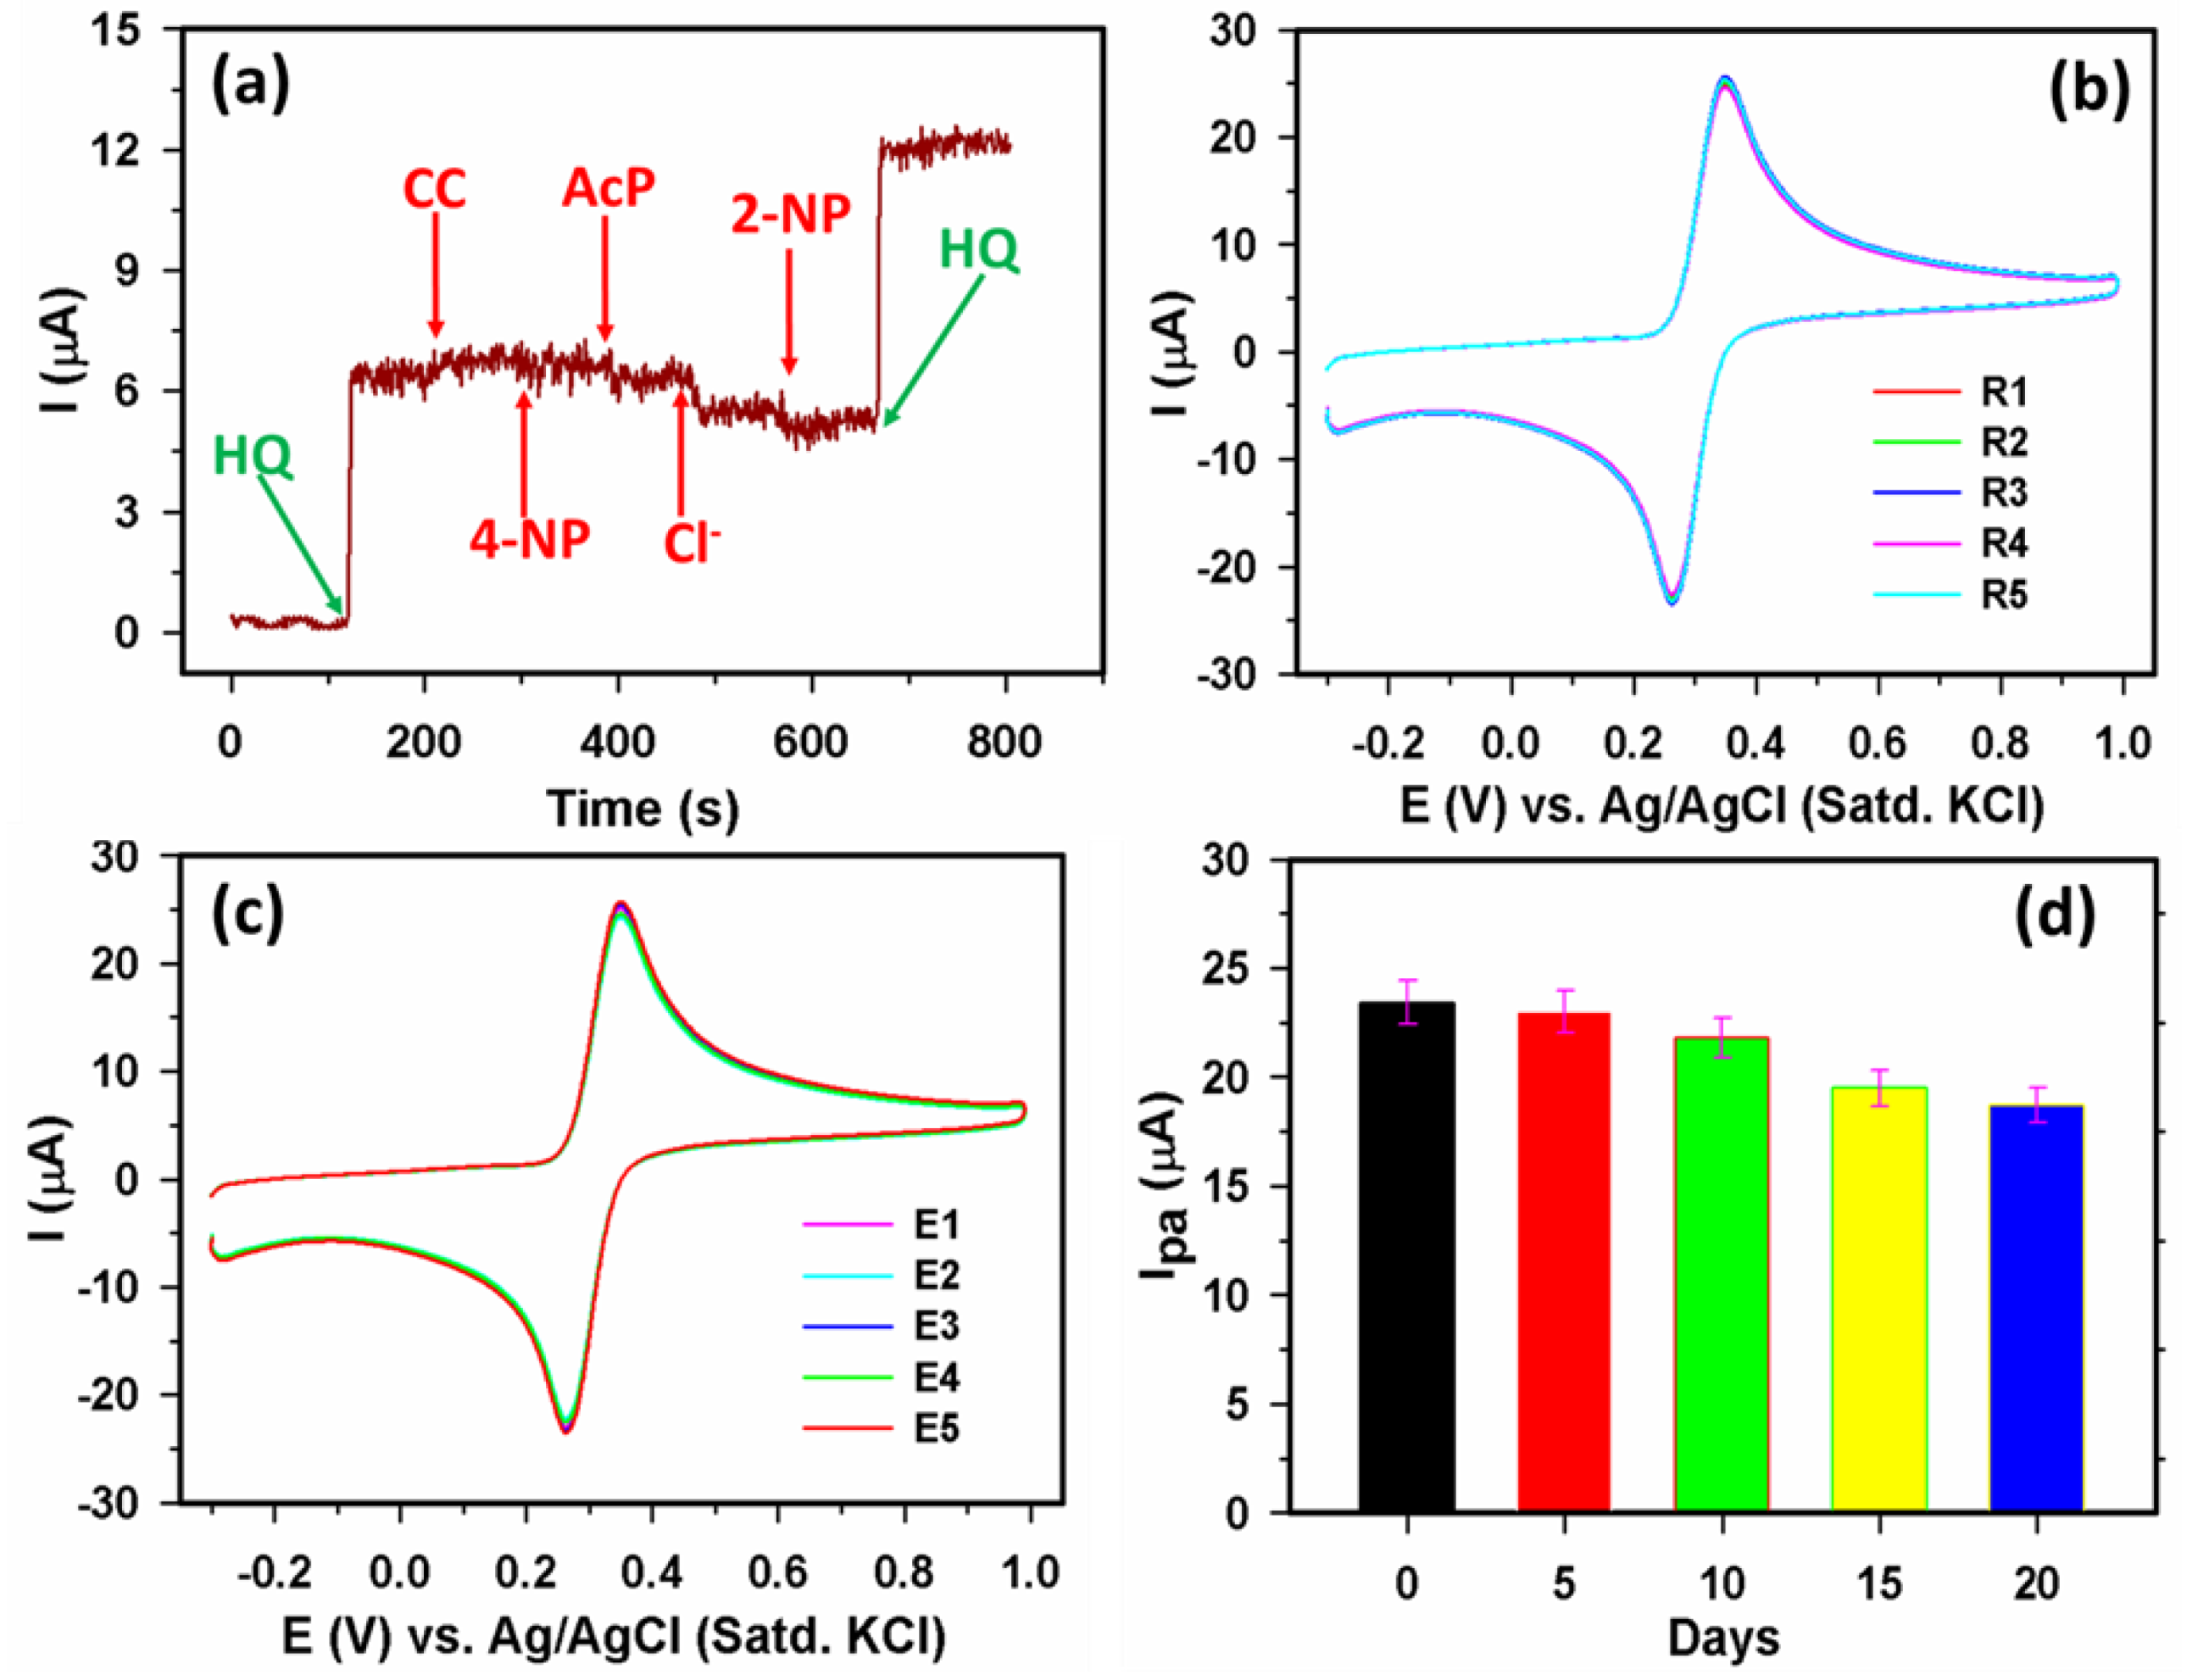
3.2.3. Selectivity, Repeatability, Reproducibility, and Stability of Modified Electrodes

For the verification of selectivity of the Pd@PSi−PPy−C/GCE sensor using common interfering chemicals such as catechol (CC), 4-nitrophenol (4-NP), 2-nitrophenol, (2-NP), 4-acetamidophenol (AcP), and Cl ions, the amperometric response was noted with 20 μM HQ with the same quantity of each interfering chemical (Figure 8a). Herein, the HQ addition produced a current response, but for the interfering chemicals, an insignificant response was observed. Thus, we confirmed the selectivity of the Pd@PSi−PPy−C/GCE sensor in HQ determination. Additionally, other sensor parameters of Pd@PSi−PPy−C/GCE were also studied utilizing CV using 350 µM HQ at the 0.04 Vs−1 scan rate. Figure 8b displays the repeatability study, in which the newly modified Pd@PSi−PPy−C/GCE electrode was utilized in determining 350 μM HQ. An almost-identical CV response was achieved in five runs having 3.8% RSD establishing excellent repeatability. Figure 8c shows a reproducibility investigation for the Pd@PSi−PPy−C/GCE sensor, in which five freshly fabricated Pd@PSi−PPy−C/GCE electrodes were utilized. The CV results showed a 4.2% RSD for Ipa variations, confirming excellent reproducibility. Following the fabrication of the Pd@PSi−PPy−C/GCE sensor, we collected CVs every fifth day in a row to test the stability and kept it at ambient conditions. A bar graph of the stability analysis is shown in Figure 8d. It reveals that after 20 days of storage at ambient conditions, the CV response remained at, or near, 85% of its initial value, and the Pd@PSi−PPy−C/GCE surface remained undamaged.
When the HQ molecule touched the Pd@PSi−PPy−C surface, an electrooxidation reaction occurred. Due to the reducing properties of HQ molecules, the electron donation from HQ to the conduction band of the Pd@PSi−PPy−C nanocomposite can occur, which ultimately enhances the Pd@PSi−PPy−C/GCE sensor’s conductivity. Thus, the CV responses are improved. The current Pd@PSi−PPy−C/GCE sensor showed an extreme sensitivity during HQ detection compared to existing HQ sensors as shown in Table 1 [4,58,59,60,61,62,63,64].
Therefore, it is concluded that the Pd@PSi−PPy−C nanocomposite is exceptionally efficient to oxidize HQ. The Pd@PSi−PPy−C nanocomposite provides an encouraging nano-environment in HQ detection. The PSi, PPy−C, and combined PSi−PPy−C nanocomposites are p-type semiconductors [24]. Hence, a combined PdNPs and PSi−PPy−C may generate metal-semiconductor (MS) junctions that provide synergistic effects [65]. A low Rct value of Pd@PSi−PPy−C/GCE as achieved from the EIS spectrum (Figure 4c) further confirms the synergistic effects between PdNPs and PSi−PPy−C. Such a combination might produce an electron donor–acceptor pair resulting in a potential development at the MS junction, which may lead to a decrease in the energy barrier in the oxidation process [35]. Such a Pd@PSi−PPy−C nanocomposite–HQ interaction may be the main reason that makes the Pd@PSi−PPy−C/GCE appropriate in HQ detection. During the HQ oxidation, the dispersed PdNPs onto the PSi- PPy-C surface expedite HQ molecules’ congregation at the electrode/solution interface, and this increases the electrode sensitivity in HQ sensing [66]. The effective Pd@PSi−PPy−C nanocomposite–HQ interactions enable the Pd@PSi−PPy−C/GCE sensor appropriate for HQ determination. Furthermore, the enhanced performance of the currently developed Pd@PSi−PPy−C/GCE-based HQ sensor is also likely related to the efficient attachment of the active nanocomposite onto the GCE surface, which provides a 56% higher effective surface area than the bare, unmodified GCE, facilitating a rapid electron transfer during the electrooxidation of HQ. Scheme 1 denotes the electrooxidation of HQ at the Pd@PSi−PPy−C/GCE assembly.

3.2.4. Real Sample Investigation

To confirm the sensor electrode appropriateness, we detected HQ from spiked tap water utilizing the Pd@PSi−PPy−C/GCE sensor via a standard addition method. Herein, equal volumes of HQ solutions (varying concentrations) and tap water were mixed individually, and we recorded the CV responses in PBS utilizing the Pd@PSi−PPy−C/GCE sensor. Table 2 summarizes the results achieved, which demonstrated that the Pd@PSi−PPy−C/GCE sensor exhibited ~100% recovery of HQ. Consequently, we concluded that the Pd@PSi−PPy−C/GCE assembly is suitable, precise, and consistent for the determination of HQ from a real sample.
Herein, during the HQ detection, the electrochemical response progressively increased with the increasing HQ concentrations. Thus, HQ became oxidized at the Pd@PSi−PPy−C/GCE sensor surface by losing two electrons to the conduction band of the Pd@PSi−PPy−C nanocomposite that originated the electrochemical response [1]. Therefore, the overall senor activity of the Pd@PSi−PPy−C/GCE can be presented as in Scheme 2.

4. Conclusions

We successfully synthesized and systematically characterized a new ternary Pd@PSi−PPy−C nanocomposite via facile stain etching, sonication, and photodeposition procedures. An electrochemical hydroquinone sensor with extremely high sensitivity was designed using the Pd@PSi−PPy−C−fabricated GCE. A significantly high sensitivity value indicated the suitability of the Pd@PSi−PPy−C/GCE sensor in determining the wide-ranging HQ. Exceptional promising features of the Pd@PSi−PPy−C/GCE sensor including outstanding stability and lower LOD established the prospective of the ternary Pd@PSi−PPy−C nanocomposite during HQ detection and quantification. The reliability of this newly designed HQ sensor was confirmed utilizing spiked tap water investigations with promising analytical results. Therefore, the ternary Pd@PSi−PPy−C nanocomposite-based electrochemical sensor design method paves a new route to develop efficient electrochemical sensors to detect and quantify pollutants.

Supplementary Materials

The following supporting information can be downloaded at: https://www.mdpi.com/article/10.3390/bios13020178/s1, Figure S1: (a) CVs recorded using the Pd@PSi−PPy−C/GCE electrode in 5 mM [Fe(CN)6]3-/4- in 0.1 M KCl (b) Corresponding Ipa vs. ʋ1/2 plots for the Pd@PSi−PPy−C/GCE electrode.

Author Contributions

Conceptualization, J.A. and F.A.H.; methodology, J.A., M.F., M.A. and J.S.A.; validation, A.A., A.M.E.-S., M.I.M. and A.A.M.A.; formal analysis, J.A., M.F. and J.S.A.; investigation, J.A., M.A. and F.A.H.; resources, A.A. and A.M.E.-S.; data curation, A.A., A.M.E.-S., M.I.M. and A.A.M.A.; writing—original draft preparation, J.A.; writing—review and editing, A.A., A.M.E.-S., M.F., M.A., J.S.A., M.I.M., A.A.M.A. and F.A.H.; supervision, F.A.H.; project administration, A.A., A.M.E.-S. and M.A.; funding acquisition, A.A. and A.M.E.-S. All authors have read and agreed to the published version of the manuscript.

Funding

This research was funded by grant no. ENGA-2022-11-1953 from the Deanship of Scientific Research at Northern Border University, Arar, K.S.A.

Institutional Review Board Statement

Not applicable.

Informed Consent Statement

Not applicable.

Data Availability Statement

Data will be applicable upon request.

Acknowledgments

The authors gratefully acknowledge the approval and the support of this research study by grant no. ENGA-2022-11-1953 from the Deanship of Scientific Research at Northern Border University, Arar, K.S.A.

Conflicts of Interest

The authors declare no conflict of interest.

References

  1. Ahmed, J.; Rahman, M.M.; Siddiquey, I.A.; Asiri, A.M.; Hasnat, M.A. Efficient Hydroquinone Sensor Based on Zinc, Strontium and Nickel Based Ternary Metal Oxide (TMO) Composites by Differential Pulse Voltammetry. Sens. Actuators B Chem. 2018, 256, 383–392. [Google Scholar] [CrossRef]
  2. Abu-Zied, B.M.; Alam, M.M.; Asiri, A.M.; Ahmed, J.; Rahman, M.M. Efficient Hydroquinone Sensor Development Based on Co3O4 Nanoparticle. Microchem. J. 2020, 157, 104972. [Google Scholar] [CrossRef]
  3. Chetankumar, K.; Kumara Swamy, B.E.; Sharma, S.C.; Hariprasad, S.A. An Efficient Electrochemical Sensing of Hazardous Catechol and Hydroquinone at Direct Green 6 Decorated Carbon Paste Electrode. Sci. Rep. 2021, 11, 1–13. [Google Scholar] [CrossRef] [PubMed]
  4. Cotchim, S.; Promsuwan, K.; Dueramae, M.; Duerama, S.; Dueraning, A.; Thavarungkul, P.; Kanatharana, P.; Limbut, W. Development and Application of an Electrochemical Sensor for Hydroquinone in Pharmaceutical Products. J. Electrochem. Soc. 2020, 167, 155528. [Google Scholar] [CrossRef]
  5. Ahmed, J.; Rahman, M.M.; Siddiquey, I.A.; Asiri, A.M.; Hasnat, M.A. Efficient Bisphenol-A Detection Based on the Ternary Metal Oxide (TMO) Composite by Electrochemical Approaches. Electrochim. Acta 2017, 246, 597–605. [Google Scholar] [CrossRef]
  6. Rashid, M.A.; Rahman, M.; Mahmud, A.S.M.O.; Morshed, A.S.; Haque, M.M.; Hossain, M.M. UV-Vis Spectrophotometer as an Alternative Technique for the Determination of Hydroquinone in Vinyl Acetate Monomer. Photochem 2022, 2, 435–447. [Google Scholar] [CrossRef]
  7. Wang, Y.; Yue, Q.; Tao, L.; Zhang, C.; Li, C.-Z. Fluorometric Determination of Hydroquinone by Using Blue Emitting N/S/P-Codoped Carbon Dots. Mikrochim. Acta 2018, 185, 550. [Google Scholar] [CrossRef]
  8. Galimany-Rovira, F.; Pérez-Lozano, P.; Suñé-Negre, J.M.; García-Montoya, E.; Miñarro, M.; Ticó, J.R. Development and Validation of a New RP-HPLC Method for the Simultaneous Determination of Hydroquinone, Kojic Acid, Octinoxate, Avobenzone, BHA and BHT in Skin-Whitening Cream. Anal. Methods 2016, 8, 1170–1180. [Google Scholar] [CrossRef]
  9. Dursunoğlu, B.; Yuca, H.; Güvenalp, Z.; Gözcü, S.; Yilmaz, B. Simultaneous Determination of Arbutin and Hydroquinone in Different Herbal Slimming Products Using Gas Chromatography-Mass Spectrometry. Turk. J. Pharm. Sci. 2018, 15, 298–303. [Google Scholar] [CrossRef]
  10. Ahmad, K.; Kumar, P.; Mobin, S.M. A Highly Sensitive and Selective Hydroquinone Sensor Based on a Newly Designed N-RGO/SrZrO3 Composite. Nanoscale Adv. 2020, 2, 502–511. [Google Scholar] [CrossRef]
  11. Ahmed, J.; Faisal, M.; Jalalah, M.; Alsareii, S.A.; Harraz, F.A. Novel Polypyrrole-Carbon Black Doped ZnO Nanocomposite for Efficient Amperometric Detection of Hydroquinone. J. Electroanal. Chem. 2021, 898, 115631. [Google Scholar] [CrossRef]
  12. Wang, C.; Zhao, P.; Zhang, L.; Wang, Y.; Fu, Q.; Li, R.; Li, J.; Li, C.; Xie, Y.; Fei, J. Switched Electrochemical Sensor for Hydroquinone Based on RGO@Au, Monoclinic BiVO4 and Temperature-Sensitive Polymer Composite Material. Microchem. J. 2022, 179, 107412. [Google Scholar] [CrossRef]
  13. Lu, Z.; Wang, Y.; Zhu, Y.; Hasebe, Y.; Zhang, Z. Popcorn-Derived Porous Carbon Based Electrochemical Sensor for Simultaneous Determination of Hydroquinone, Catechol and Nitrite. ChemistrySelect 2022, 7, e202200148. [Google Scholar] [CrossRef]
  14. Kudr, J.; Nguyen, H.V.; Gumulec, J.; Nejdl, L.; Blazkova, I.; Ruttkay-Nedecky, B.; Hynek, D.; Kynicky, J.; Adam, V.; Kizek, R. Simultaneous Automatic Electrochemical Detection of Zinc, Cadmium, Copper and Lead Ions in Environmental Samples Using a Thin-Film Mercury Electrode and an Artificial Neural Network. Sensors 2015, 15, 592–610. [Google Scholar] [CrossRef] [Green Version]
  15. Rahman, M.M.; Ahmed, J.; Asiri, A.M.; Alamry, K.A. Fabrication of a Hydrazine Chemical Sensor Based on Facile Synthesis of Doped NZO Nanostructure Materials. New J. Chem. 2020, 44, 13018–13029. [Google Scholar] [CrossRef]
  16. Ahmed, J.; Faisal, M.; Jalalah, M.; Alsaiari, M.; Alsareii, S.A.; Harraz, F.A. An Efficient Amperometric Catechol Sensor Based on Novel Polypyrrole-Carbon Black Doped α-Fe2O3 Nanocomposite. Colloids Surf. A Physicochem. Eng. Asp. 2021, 619, 126469. [Google Scholar] [CrossRef]
  17. Subhan, M.A.; Chandra Saha, P.; Ahmed, J.; Asiri, A.M.; Al-Mamun, M.; Rahman, M.M. Development of an Ultra-Sensitive Para -Nitrophenol Sensor Using Tri-Metallic Oxide MoO2.Fe3O4.CuO Nanocomposites. Mater. Adv. 2020, 1, 2831–2839. [Google Scholar] [CrossRef]
  18. Khoshfetrat, S.M.; Seyed Dorraji, P.; Shayan, M.; Khatami, F.; Omidfar, K. Smartphone-Based Electrochemiluminescence for Visual Simultaneous Detection of RASSF1A and SLC5A8 Tumor Suppressor Gene Methylation in Thyroid Cancer Patient Plasma. Anal. Chem. 2022, 94, 8005–8013. [Google Scholar] [CrossRef]
  19. Abdullah, M.M.; Faisal, M.; Ahmed, J.; Harraz, F.A.; Jalalah, M.; Alsareii, S.A. Sensitive Detection of Aqueous Methanol by Electrochemical Route Using Mesoporous α-Fe2O3 Doped CdSe Nanostructures Modified Glassy Carbon Electrode. J. Electrochem. Soc. 2021, 168, 057525. [Google Scholar] [CrossRef]
  20. Rahman, M.M.; Ahmed, J.; Asiri, A.M.; Alfaifi, S.Y.M.; Marwani, H.M. Development of Methanol Sensor Based on Sol-Gel Drop-Coating Co3O4&middot;CdO&middot;ZnO Nanoparticles Modified Gold-Coated &micro;-Chip by Electro-Oxidation Process. Gels 2021, 7, 235. [Google Scholar]
  21. Rahman, M.M.; Ahmed, J.; Asiri, A.M. Ultra-Sensitive, Selective, and Rapid Carcinogenic 1,2-Diaminobenzene Chemical Determination Using Sol–Gel Coating Low-Dimensional Facile CuS Modified-CNT Nanocomposites by Electrochemical Approach. Microchem. J. 2022, 175, 107230. [Google Scholar] [CrossRef]
  22. Ahmed, J.; Faisal, M.; Alsareii, S.A.; Jalalah, M.; Alsaiari, M.; Harraz, F.A. Mn2O3 Nanoparticle-Porous Silicon Nanocomposite Based Amperometric Sensor for Sensitive Detection and Quantification of Acetaminophen in Real Samples. Ceram. Int. 2022, 49, 933–943. [Google Scholar] [CrossRef]
  23. Ahmed, J.; Rashed, A.; Faisal, M.; Harraz, F.A.; Jalalah, M.; Alsareii, A. Novel SWCNTs-Mesoporous Silicon Nanocomposite as Efficient Non-Enzymatic Glucose Biosensor. Appl. Surf. Sci. 2021, 552, 149477. [Google Scholar] [CrossRef]
  24. Ahmed, J.; Faisal, M.; Harraz, F.A.; Jalalah, M.; Alsareii, S.A. Porous Silicon-Mesoporous Carbon Nanocomposite Based Electrochemical Sensor for Sensitive and Selective Detection of Ascorbic Acid in Real Samples. J. Taiwan Inst. Chem. Eng. 2021, 125, 360–371. [Google Scholar] [CrossRef]
  25. Subhan, M.A.; Chandra Saha, P.; Sumon, S.A.; Ahmed, J.; Asiri, A.M.; Rahman, M.M.; Al-Mamun, M. Enhanced Photocatalytic Activity and Ultra-Sensitive Benzaldehyde Sensing Performance of a SnO2·ZnO·TiO2 Nanomaterial. RSC Adv. 2018, 8, 33048–33058. [Google Scholar] [CrossRef] [Green Version]
  26. Rashed, M.A.; Ahmed, J.; Faisal, M.; Alsareii, S.A.; Jalalah, M.; Harraz, F.A. Highly Sensitive and Selective Thiourea Electrochemical Sensor Based on Novel Silver Nanoparticles/Chitosan Nanocomposite. Colloids Surf. A Physicochem. Eng. Asp. 2022, 644, 128879. [Google Scholar] [CrossRef]
  27. Rashed, M.A.; Ahmed, J.; Faisal, M.; Alsareii, S.A.; Jalalah, M.; Tirth, V.; Harraz, F.A. Surface Modification of CuO Nanoparticles with Conducting Polythiophene as a Non-Enzymatic Amperometric Sensor for Sensitive and Selective Determination of Hydrogen Peroxide. Surf. Interfaces 2022, 31, 101998. [Google Scholar] [CrossRef]
  28. Lu, Z.; Zhong, J.; Zhang, Y.; Sun, M.; Zou, P.; Du, H.; Wang, X.; Rao, H.; Wang, Y. MOF-Derived Co3O4/FeCo2O4 Incorporated Porous Biomass Carbon: Simultaneous Electrochemical Determination of Dopamine, Acetaminophen and Xanthine. J. Alloys Compd. 2021, 858, 157701. [Google Scholar] [CrossRef]
  29. Raril, C.; Manjunatha, J.G. A Simple Approach for the Electrochemical Determination of Vanillin at Ionic Surfactant Modified Graphene Paste Electrode. Microchem. J. 2020, 154, 104575. [Google Scholar] [CrossRef]
  30. Ahmed, J.; Faisal, M.; Alsareii, S.A.; Harraz, F.A. Highly Sensitive and Selective Non-Enzymatic Uric Acid Electrochemical Sensor Based on Novel Polypyrrole-Carbon Black-Co3O4 Nanocomposite. Adv. Compos. Hybrid Mater. 2022, 5, 920–933. [Google Scholar] [CrossRef]
  31. Rashed, M.A.; Faisal, M.; Ahmed, J.; Alsareii, S.A.; Jalalah, M.; Harraz, F.A. Highly Sensitive and Selective Amperometric Hydrazine Sensor Based on Au Nanoparticle-Decorated Conducting Polythiophene Prepared via Oxidative Polymerization and Photo-Reduction Techniques. J. Saudi Chem. Soc. 2022, 26, 101480. [Google Scholar] [CrossRef]
  32. Faisal, M.; Rashed, M.A.; Ahmed, J.; Alsaiari, M.; Jalalah, M.; Alsareii, S.A.; Harraz, F.A. Au Nanoparticles Decorated Polypyrrole-Carbon Black/g-C3N4 Nanocomposite as Ultrafast and Efficient Visible Light Photocatalyst. Chemosphere 2022, 287, 131984. [Google Scholar] [CrossRef]
  33. Umar, A.; Kumar, R.; Algadi, H.; Ahmed, J.; Jalalah, M.; Ibrahim, A.A.; Harraz, F.A.; Alsaiari, M.A.; Albargi, H. Highly Sensitive and Selective 2-Nitroaniline Chemical Sensor Based on Ce-Doped SnO2 Nanosheets/Nafion-Modified Glassy Carbon Electrode. Adv. Compos. Hybrid Mater. 2021, 4, 1015–1026. [Google Scholar] [CrossRef]
  34. Faisal, M.; Rashed, M.A.; Ahmed, J.; Alsaiari, M.; Alkorbi, A.S.; Jalalah, M.; Alsareii, S.A.; Harraz, F.A. Rapid Photodegradation of Linezolid Antibiotic and Methylene Blue Dye over Pt Nanoparticles/Polypyrrole-Carbon Black/ZnO Novel Visible Light Photocatalyst. J. Environ. Chem. Eng. 2021, 9, 106773. [Google Scholar] [CrossRef]
  35. Ahmed, J.; Faisal, M.; Alsareii, S.A.; Jalalah, M.; Harraz, F.A. A Novel Gold-Decorated Porous Silicon-Poly(3-Hexylthiophene) Ternary Nanocomposite as a Highly Sensitive and Selective Non-Enzymatic Dopamine Electrochemical Sensor. J. Alloys Compd. 2022, 931, 167403. [Google Scholar] [CrossRef]
  36. Wei, F.; Liu, J.; Zhu, Y.-N.; Wang, X.-S.; Cao, C.-Y.; Song, W.-G. In Situ Facile Loading of Noble Metal Nanoparticles on Polydopamine Nanospheres via Galvanic Replacement Reaction for Multifunctional Catalysis. Sci. China Chem. 2017, 60, 1236–1242. [Google Scholar] [CrossRef]
  37. Ahmed, J.; Faisal, M.; Alsareii, S.A.; Jalalah, M.; Harraz, F.A. Sensitive Electrochemical Detection of Thiourea Utilizing a Novel Silver Nanoparticle-Decorated Porous Silicon-Polyaniline Nanocomposite. J. Electrochem. Soc. 2022, 169, 87507. [Google Scholar] [CrossRef]
  38. Gongalsky, M.B.; Kargina, J.V.; Cruz, J.F.; Sánchez-Royo, J.F.; Chirvony, V.S.; Osminkina, L.A.; Sailor, M.J. Formation of Si/SiO2 Luminescent Quantum Dots From Mesoporous Silicon by Sodium Tetraborate/Citric Acid Oxidation Treatment. Front. Chem. 2019, 7, 165. [Google Scholar] [CrossRef] [Green Version]
  39. Chen, Y.; Niu, Y.; Tian, T.; Zhang, J.; Wang, Y.; Li, Y.; Qin, L.C. Microbial Reduction of Graphene Oxide by Azotobacter Chroococcum. Chem. Phys. Lett. 2017, 677, 143–147. [Google Scholar] [CrossRef] [Green Version]
  40. Yu, L.; Zhang, P.; Dai, H.; Chen, L.; Ma, H.; Lin, M.; Shen, D. An Electrochemical Sensor Based on Co3O4 Nanosheets for Lead Ions Determination. RSC Adv. 2017, 7, 39611–39616. [Google Scholar] [CrossRef] [Green Version]
  41. Xu, H.; Hai, Z.; Diwu, J.; Zhang, Q.; Gao, L.; Cui, D.; Zang, J.; Liu, J.; Xue, C. Synthesis and Microwave Absorption Properties of Core-Shell Structured Co3O4-PANI Nanocomposites. J. Nanomater. 2015, 2015, 845983. [Google Scholar] [CrossRef]
  42. Zhang, J.; Shu, D.; Zhang, T.; Chen, H.; Zhao, H.; Wang, Y.; Sun, Z.; Tang, S.; Fang, X.; Cao, X. Capacitive Properties of PANI/MnO2 Synthesized via Simultaneous-Oxidation Route. J. Alloys Compd. 2012, 532, 1–9. [Google Scholar] [CrossRef]
  43. Faisal, M.; Rashed, M.A.; Ahmed, J.; Alhmami, M.A.M.; Khan, M.K.A.; Jalalah, M.; Alsareii, S.A.; Harraz, F.A. Pt Nanoparticles Decorated Chitosan/ZnTiO3: Ternary Visible-Light Photocatalyst for Ultrafast Treatment of Insecticide Imidacloprid and Methylene Blue. J. Taiwan Inst. Chem. Eng. 2022, 133, 104266. [Google Scholar] [CrossRef]
  44. Ahmed, J.; Faisal, M.; Harraz, F.A.; Jalalah, M.; Alsareii, S.A. Development of an Amperometric Biosensor for Dopamine Using Novel Mesoporous Silicon Nanoparticles Fabricated via a Facile Stain Etching Approach. Phys. E Low-Dimens. Syst. Nanostruct. 2022, 135, 114952. [Google Scholar] [CrossRef]
  45. Zhang, D.X.; Yoshikawa, C.; Welch, N.G.; Pasic, P.; Thissen, H.; Voelcker, N.H. Spatially Controlled Surface Modification of Porous Silicon for Sustained Drug Delivery Applications. Sci. Rep. 2019, 9, 1367. [Google Scholar] [CrossRef] [Green Version]
  46. Ben Slama, S.; Hajji, M.; Ezzaouia, H. Crystallization of Amorphous Silicon Thin Films Deposited by PECVD on Nickel-Metalized Porous Silicon. Nanoscale Res. Lett. 2012, 7, 464. [Google Scholar] [CrossRef] [Green Version]
  47. Martín-Palma, R.J.; Manso-Silván, M.; Torres-Costa, V. Biomedical Applications of Nanostructured Porous Silicon: A Review. J. Nanophotonics 2010, 4, 042502. [Google Scholar] [CrossRef]
  48. Mousavi, M.F.; Amiri, M.; Noori, A.; Khoshfetrat, S.M. A Prostate Specific Antigen Immunosensor Based on Biotinylated-Antibody/Cyclodextrin Inclusion Complex: Fabrication and Electrochemical Studies. Electroanalysis 2017, 29, 2818–2831. [Google Scholar] [CrossRef]
  49. Mehdi, S.; Hashemi, P.; Afkhami, A.; Hajian, A.; Bagheri, H. Sensors and Actuators: B. Chemical Cascade Electrochemiluminescence-Based Integrated Graphitic Carbon Nitride-Encapsulated Metal-Organic Framework Nanozyme for Prostate-Specific Antigen Biosensing. Sens. Actuators B Chem. 2021, 348, 130658. [Google Scholar] [CrossRef]
  50. El-Raheem, H.A.; Hassan, R.Y.A.; Khaled, R.; Farghali, A.; El-Sherbiny, I.M. New Sensing Platform of Poly(Ester-Urethane)Urea Doped with Gold Nanoparticles for Rapid Detection of Mercury Ions in Fish Tissue. RSC Adv. 2021, 11, 31845–31854. [Google Scholar] [CrossRef]
  51. Mirzaei, B.; Zarrabi, A.; Noorbakhsh, A.; Amini, A.; Makvandi, P. A Reduced Graphene Oxide-β-Cyclodextrin Nanocomposite-Based Electrode for Electrochemical Detection of Curcumin. RSC Adv. 2021, 11, 7862–7872. [Google Scholar] [CrossRef]
  52. Kokab, T.; Shah, A.; Khan, M.A.; Nisar, J.; Ashiq, M.N. Electrochemical Sensing Platform for the Simultaneous Femtomolar Detection of Amlodipine and Atorvastatin Drugs. RSC Adv. 2021, 11, 27135–27151. [Google Scholar] [CrossRef]
  53. Chang, F.; Wang, H.; He, S.; Gu, Y.; Zhu, W.; Li, T.; Ma, R. Simultaneous Determination of Hydroquinone and Catechol by a Reduced Graphene Oxide-Polydopamine-Carboxylated Multi-Walled Carbon Nanotube Nanocomposite. RSC Adv. 2021, 11, 31950–31958. [Google Scholar] [CrossRef]
  54. Rajendran, J.; Reshetilov, A.N.; Sundramoorthy, A.K. An Electrochemically Exfoliated Graphene/Poly(3,4-Ethylenedioxythiophene) Nanocomposite-Based Electrochemical Sensor for the Detection of Nicotine. Mater. Adv. 2021, 2, 3336–3345. [Google Scholar] [CrossRef]
  55. Rison, S.; Rajeev, R.; Bhat, V.S.; Mathews, A.T.; Varghese, A.; Hegde, G. Non-Enzymatic Electrochemical Determination of Salivary Cortisol Using ZnO-Graphene Nanocomposites. RSC Adv. 2021, 11, 37877–37885. [Google Scholar] [CrossRef]
  56. Tareen, A.K.; Khan, K.; Ahmad, W.; Khan, M.F.; Khan, Q.U.; Liu, X. A Novel MnO-CrN Nanocomposite Based Non-Enzymatic Hydrogen Peroxide Sensor. RSC Adv. 2021, 11, 19316–19322. [Google Scholar] [CrossRef]
  57. Hsieh, Y.T.; Huang, S.C.; Lu, S.I.; Wang, H.H.; Chang, T.W.; Wang, C.C.; Lee, G.H.; Chuang, Y.C. Electrochemical Characterization of and Theoretical Insight into a Series of 2D MOFs, [M(Bipy)(C4O4)(H2O)2]·3H2O (M = Mn (1), Fe (2), Co (3) and Zn (4)), for Chemical Sensing Applications. RSC Adv. 2021, 11, 26516–26522. [Google Scholar] [CrossRef]
  58. Soltani, H.; Pardakhty, A.; Ahmadzadeh, S. Determination of Hydroquinone in Food and Pharmaceutical Samples Using a Voltammetric Based Sensor Employing NiO Nanoparticle and Ionic Liquids. J. Mol. Liq. 2016, 219, 63–67. [Google Scholar] [CrossRef]
  59. Liu, Y.; Liao, H.; Zhou, Y.; Du, Y.; Wei, C.; Zhao, J.; Sun, S.; Loo, J.S.C.; Xu, Z.J. Fe2O3 Nanoparticle/SWCNT Composite Electrode for Sensitive Electrocatalytic Oxidation of Hydroquinone. Electrochim. Acta 2015, 180, 1059–1067. [Google Scholar] [CrossRef]
  60. Mashhadizadeh, M.H.; Kalantarian, S.M.; Azhdeh, A. A Novel Electrochemical Sensor for Simultaneous Determination of Hydroquinone, Catechol, and Resorcinol Using a Carbon Paste Electrode Modified by Zn-MOF, Nitrogen-Doped Graphite, and AuNPs. Electroanalysis 2021, 33, 160–169. [Google Scholar] [CrossRef]
  61. Siew Ming, S.; Gowthaman, N.S.K.; Lim, H.N.; Arul, P.; Narayanamoorthi, E.; Ibrahim, I.; Jaafar, H.; Abraham John, S. Aluminium MOF Fabricated Electrochemical Sensor for the Ultra-Sensitive Detection of Hydroquinone in Water Samples. J. Electroanal. Chem. 2021, 883, 115067. [Google Scholar] [CrossRef]
  62. Zhong, M.; Dai, Y.; Fan, L.; Lu, X.; Kan, X. A Novel Substitution -Sensing for Hydroquinone and Catechol Based on a Poly(3-Aminophenylboronic Acid)/MWCNTs Modified Electrode. Analyst 2015, 140, 6047–6053. [Google Scholar] [CrossRef] [PubMed]
  63. Aqsa, S.; Bukhari, B.; Nasir, H.; Pan, L.; Tasawar, M.; Sohail, M. Supramolecular Assemblies of Carbon Nanocoils and Tetraphenylporphyrin Derivatives for Sensing of Catechol and Hydroquinone in Aqueous Solution. Sci. Rep. 2021, 11, 5044. [Google Scholar] [CrossRef]
  64. Feng, S.; Zhang, Y.; Zhong, Y.; Li, Y.; Li, S. Simultaneous Determination of Hydroquinone and Catechol Using Covalent Layer-by-Layer Self-Assembly of Carboxylated-MWNTs. J. Electroanal. Chem. 2014, 733, 1–5. [Google Scholar] [CrossRef]
  65. Ong, P.-L.; Euler, W.B.; Levitsky, I.A. Hybrid Solar Cells Based on Single-Walled Carbon Nanotubes/Si Heterojunctions. Nanotechnology 2010, 21, 105203. [Google Scholar] [CrossRef] [Green Version]
  66. Łuczak, T.; Osińska, M. New Self-Assembled Layers Composed with Gold Nanoparticles, Cysteamine and Dihydrolipoic Acid Deposited on Bare Gold Template for Highly Sensitive and Selective Simultaneous Sensing of Dopamine in the Presence of Interfering Ascorbic and Uric Acids. J. Solid State Electrochem. 2017, 21, 747–758. [Google Scholar] [CrossRef]
Figure 1. (a) Survey XPS spectrum of Pd@PSi−PPy−C nanocomposite. (b) Fine scan XPS spectrum of Pd-3d, (c) Si-2p, (d) C-1s, (e) N-1s, and (f) O-1s orbitals of Pd@PSi−PPy−C nanocomposite.
Biosensors 13 00178 g001
Figure 2. Structural and optical evaluation of Pd@PSi–PPy–C nanocomposite: (a) XRD patterns and (b) FTIR spectra.
Biosensors 13 00178 g002
Figure 3. Morphological and elemental analyses: FESEM image from (a) PSi, (b) PSi−PPy−C, (c) Pd@PSi−PPy−C; TEM micrograph from (d) PSi, (e) PSi−PPy−C, (f) Pd@PSi−PPy−C; (g) EDS spectrum of Pd@PSi−PPy−C; (hl) elemental mapping of Pd@PSi−PPy−C nanocomposite.
Biosensors 13 00178 g003
Figure 4. For control experiments, CVs acquired at scan rate 0.04 Vs–1 in 0.1 M PBS (pH 7.0): (a) CVs from bare GCE, PSi/GCE, PSi−PPy−C/GCE, Pd@PSi−PPy−C/GCE with 350 µM HQ; (b) CVs from the Pd@PSi–PPy–C/GCE with 350 µM HQ and without HQ; and (c) EIS Nyquist plots recorded for different electrodes in 1.0 mM [Fe(CN)6]3−/4− in 0.1 M KCl at +0.50 V, at a signal amplitude 10 mV and a frequency ranging from 0.1 Hz to 100 KHz. The inset shows the corresponding equivalent circuit.
Biosensors 13 00178 g004
Figure 5. (a) CVs acquired for 350 µM HQ in 0.1 M PBS for varying pH (6.0–8.0) at 0.04 Vs−1 scan rate, (b) Ipa vs. pH, and (c) Epa vs. pH.
Biosensors 13 00178 g005
Figure 6. Exploration of the effect of scan rate for Pd@PSi–PPy–C/GCE electrode: (a) CVs for different scan rates (40–380 mVs−1) in the presence of 350 μM HQ (b) Ipa vs. υ, (c) Ipa vs. υ , (d) log(Ipa) vs. log(υ), and (e) Epa vs. log(υ).
Biosensors 13 00178 g006
Figure 7. (a) Amperometric responses recorded at +0.35 V utilizing Pd@PSi–PPy–C/GCE sensor with HQ (1–700 µM) and (b) corresponding calibration plot.
Biosensors 13 00178 g007
Figure 8. (a) Amperometric (i-t) response recorded at +0.35 V utilizing Pd@PSi−PPy−C/GCE upon successive additions of 20 µM of HQ, CC, 4-NP, AcP, Cl, 2-NP, and HQ; (b) repeatability study; (c) reproducibility study; and (d) stability study.
Biosensors 13 00178 g008
Scheme 1. Schematic representation of electrochemical oxidation of HQ at Pd@PSi−PPy−C/GCE sensor electrode.
Biosensors 13 00178 sch001
Scheme 2. Schematic representation of nanocomposite synthesis and HQ detection at the Pd@PSi−PPy−C/GCE sensor.
Biosensors 13 00178 sch002
Table 1. Comparison of main sensor parameters of the currently developed sensor electrode toward HQ detection by the electrochemical approach with various modified reported electrodes.
MaterialMethodLDR/μMLOD/
µM
Sensitivity/
μAμM−1
Ref.
Gr–COOHASV0.1–400.041.390[4]
NiO/ILs.SWV0.1–5000.050.3425[58]
Fe2O3/SWCNTDPV1–2600.51.24[59]
Au–gC3N4–MOFDPV0.005–50.001-[60]
Al–MOFAmp0.5–15000.0671.4714 *[61]
pAPBA/MWCNTsDPV0.5–400.2-[62]
CNCs/Zn–TPPDPV25–15000.90.4800 *[63]
c–MWNTsDPV10–1202.3-[64]
Pd@PSi–PPy–CAmp1–13
13–450
0.074
-
3.0156
0.8340 *
This work
* = μAμM−1cm−2, CNCs = carbon nanocoils, TPP = tetraphenylporphyrin, pAPBA = poly(3-amino-phenyl boronic acid), Gr-COOH = carboxylic acid-functionalized graphene, ILs = ionic liquids, Au-gC3N4-MOF = Zn-MOF-nitrogen doped graphite-Au NPs, ASV = anodic stripping voltammetry.
Table 2. HQ detection and quantification from spiked tap water using the currently developed Pd@PSi−PPy−C-modified GCE.
Real SampleHQ Added (μM)HQ Detected (μM)Recovery (%)RSD (%)
(n = 3)
Tap water109.6396.33.76
2019.9299.64.18
3029.6898.93.85
Disclaimer/Publisher’s Note: The statements, opinions and data contained in all publications are solely those of the individual author(s) and contributor(s) and not of MDPI and/or the editor(s). MDPI and/or the editor(s) disclaim responsibility for any injury to people or property resulting from any ideas, methods, instructions or products referred to in the content.

