A review of Optical Point-of-Care devices to Estimate the Technology Transfer of These Cutting-Edge Technologies

 , ,
, ,  ,
,  , , , , , ,
Abstract
:1. Introduction
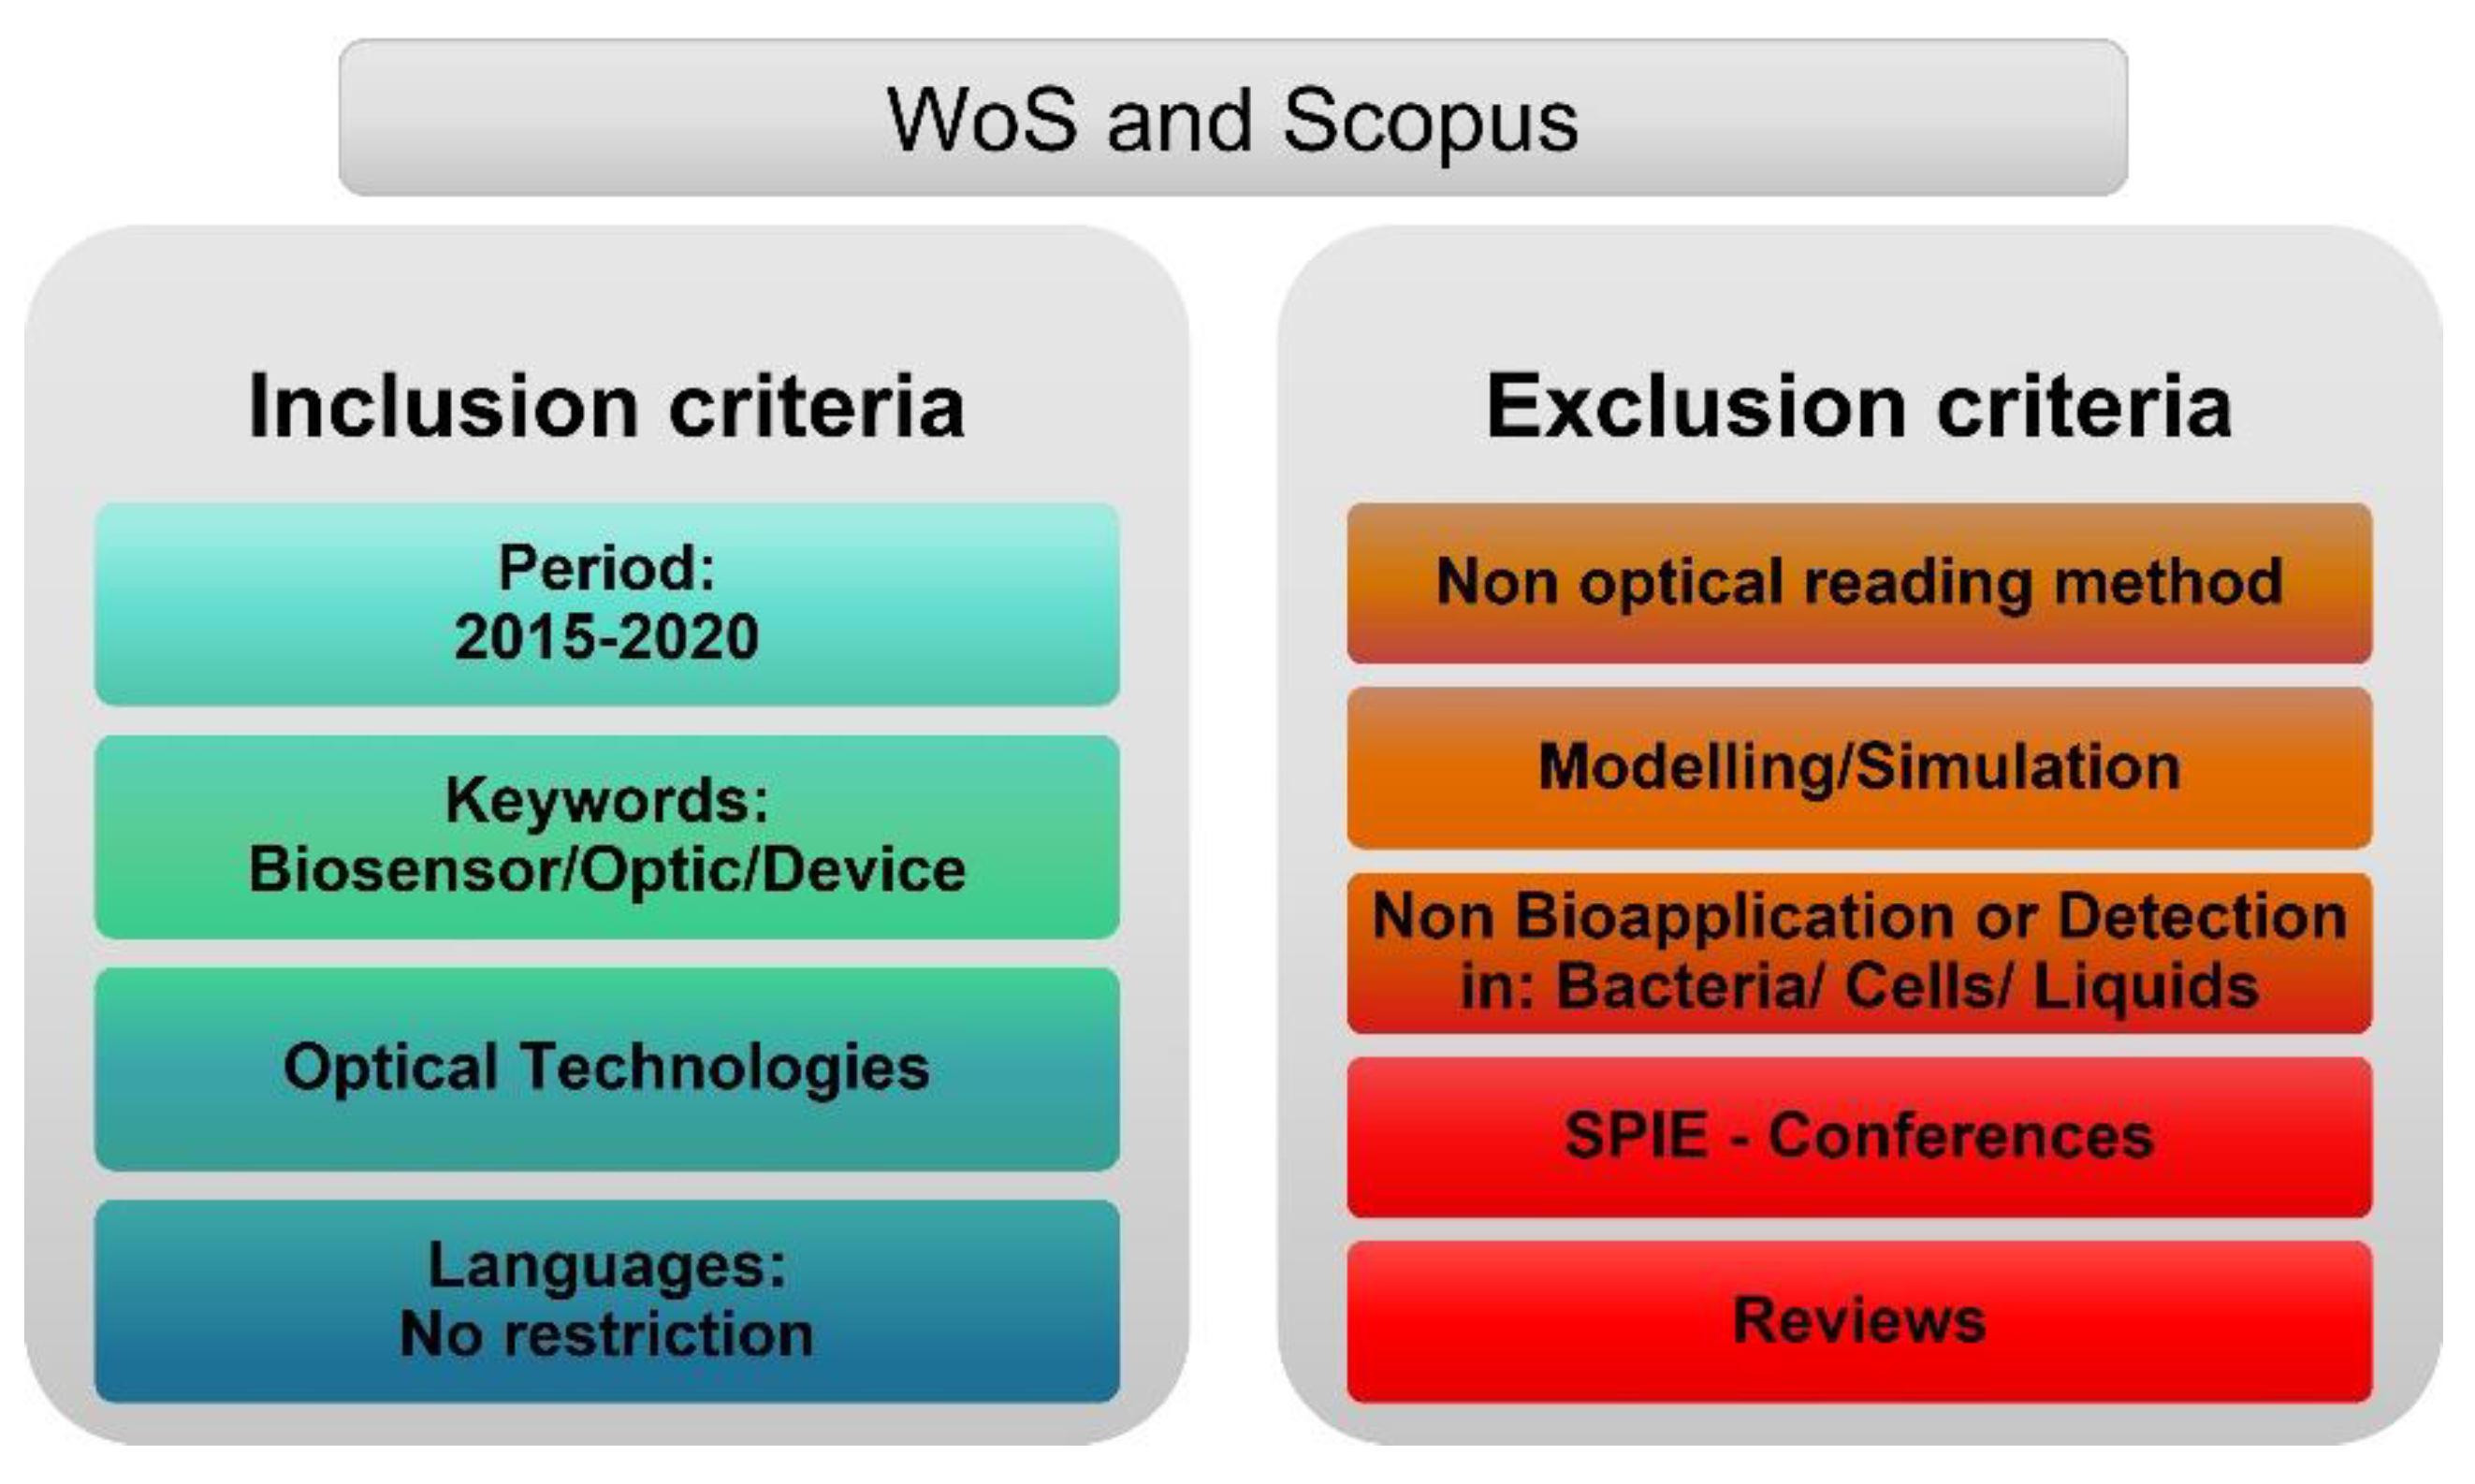
2. Methods
2.1. Classification of Optical Read-Out Devices—Overview of the Principle and Applications
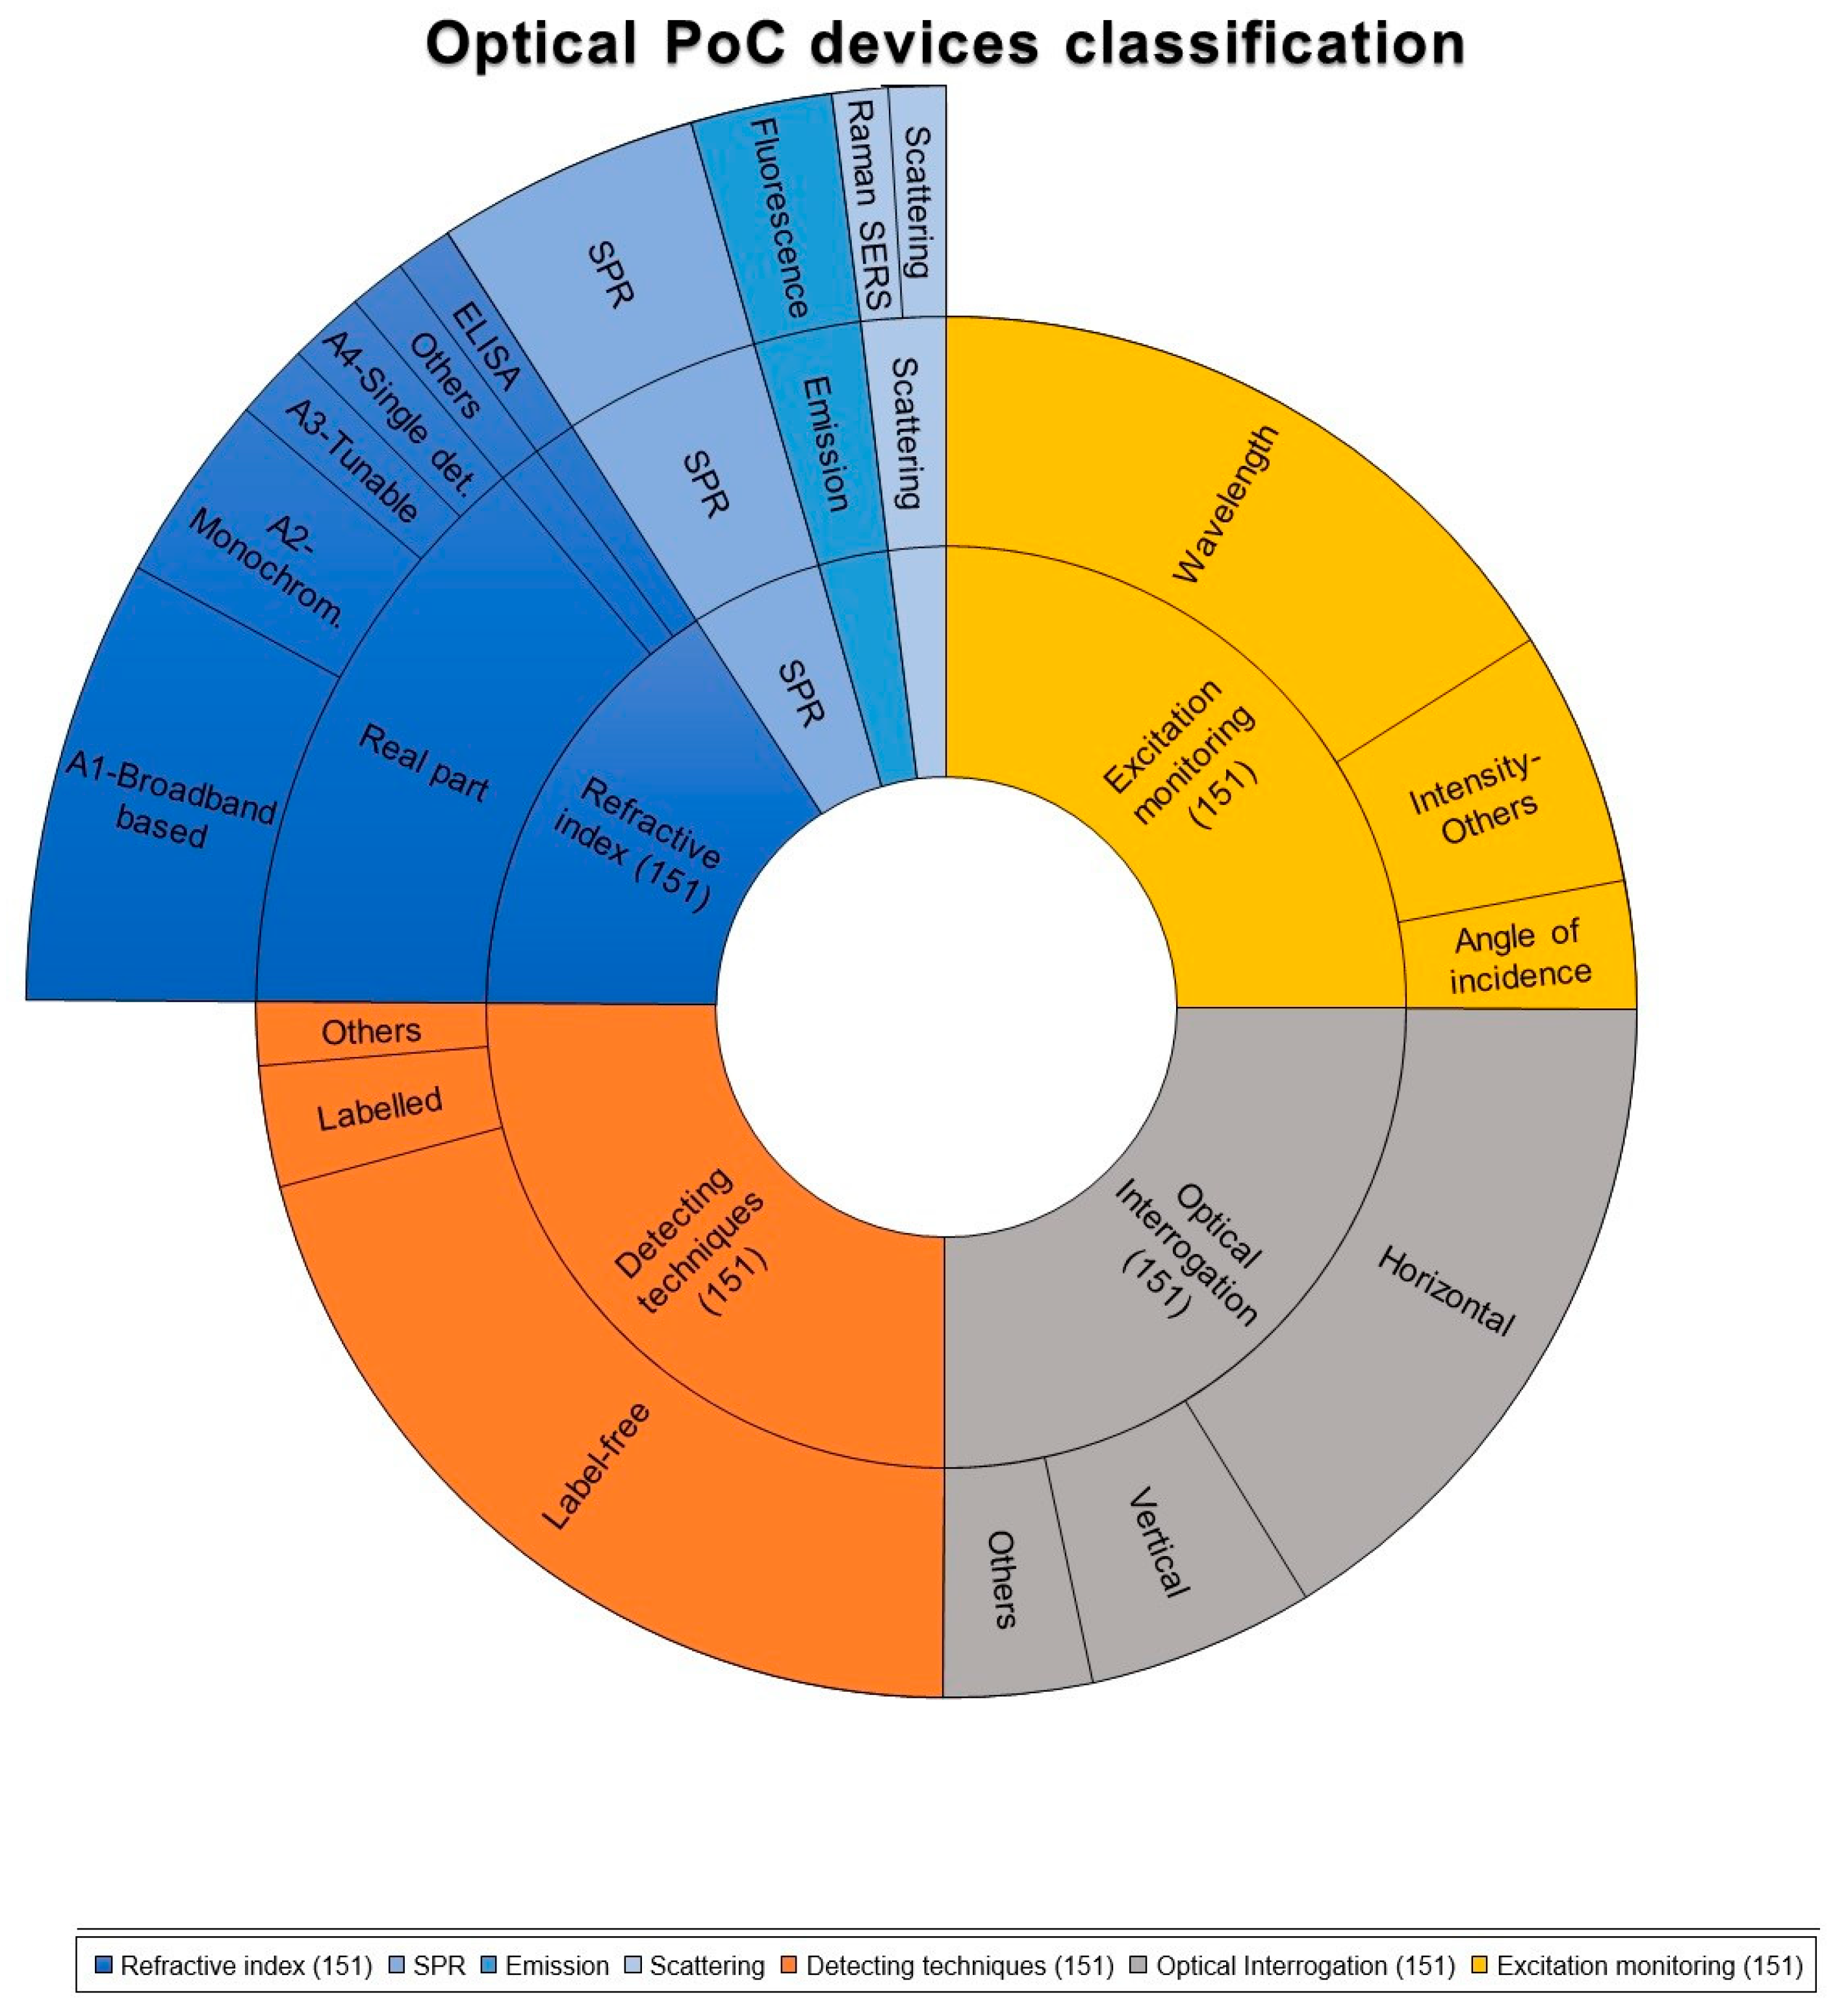
2.1.1. Classification Based on the Detecting Techniques
2.1.2. Classification Based on the Excitation Monitoring
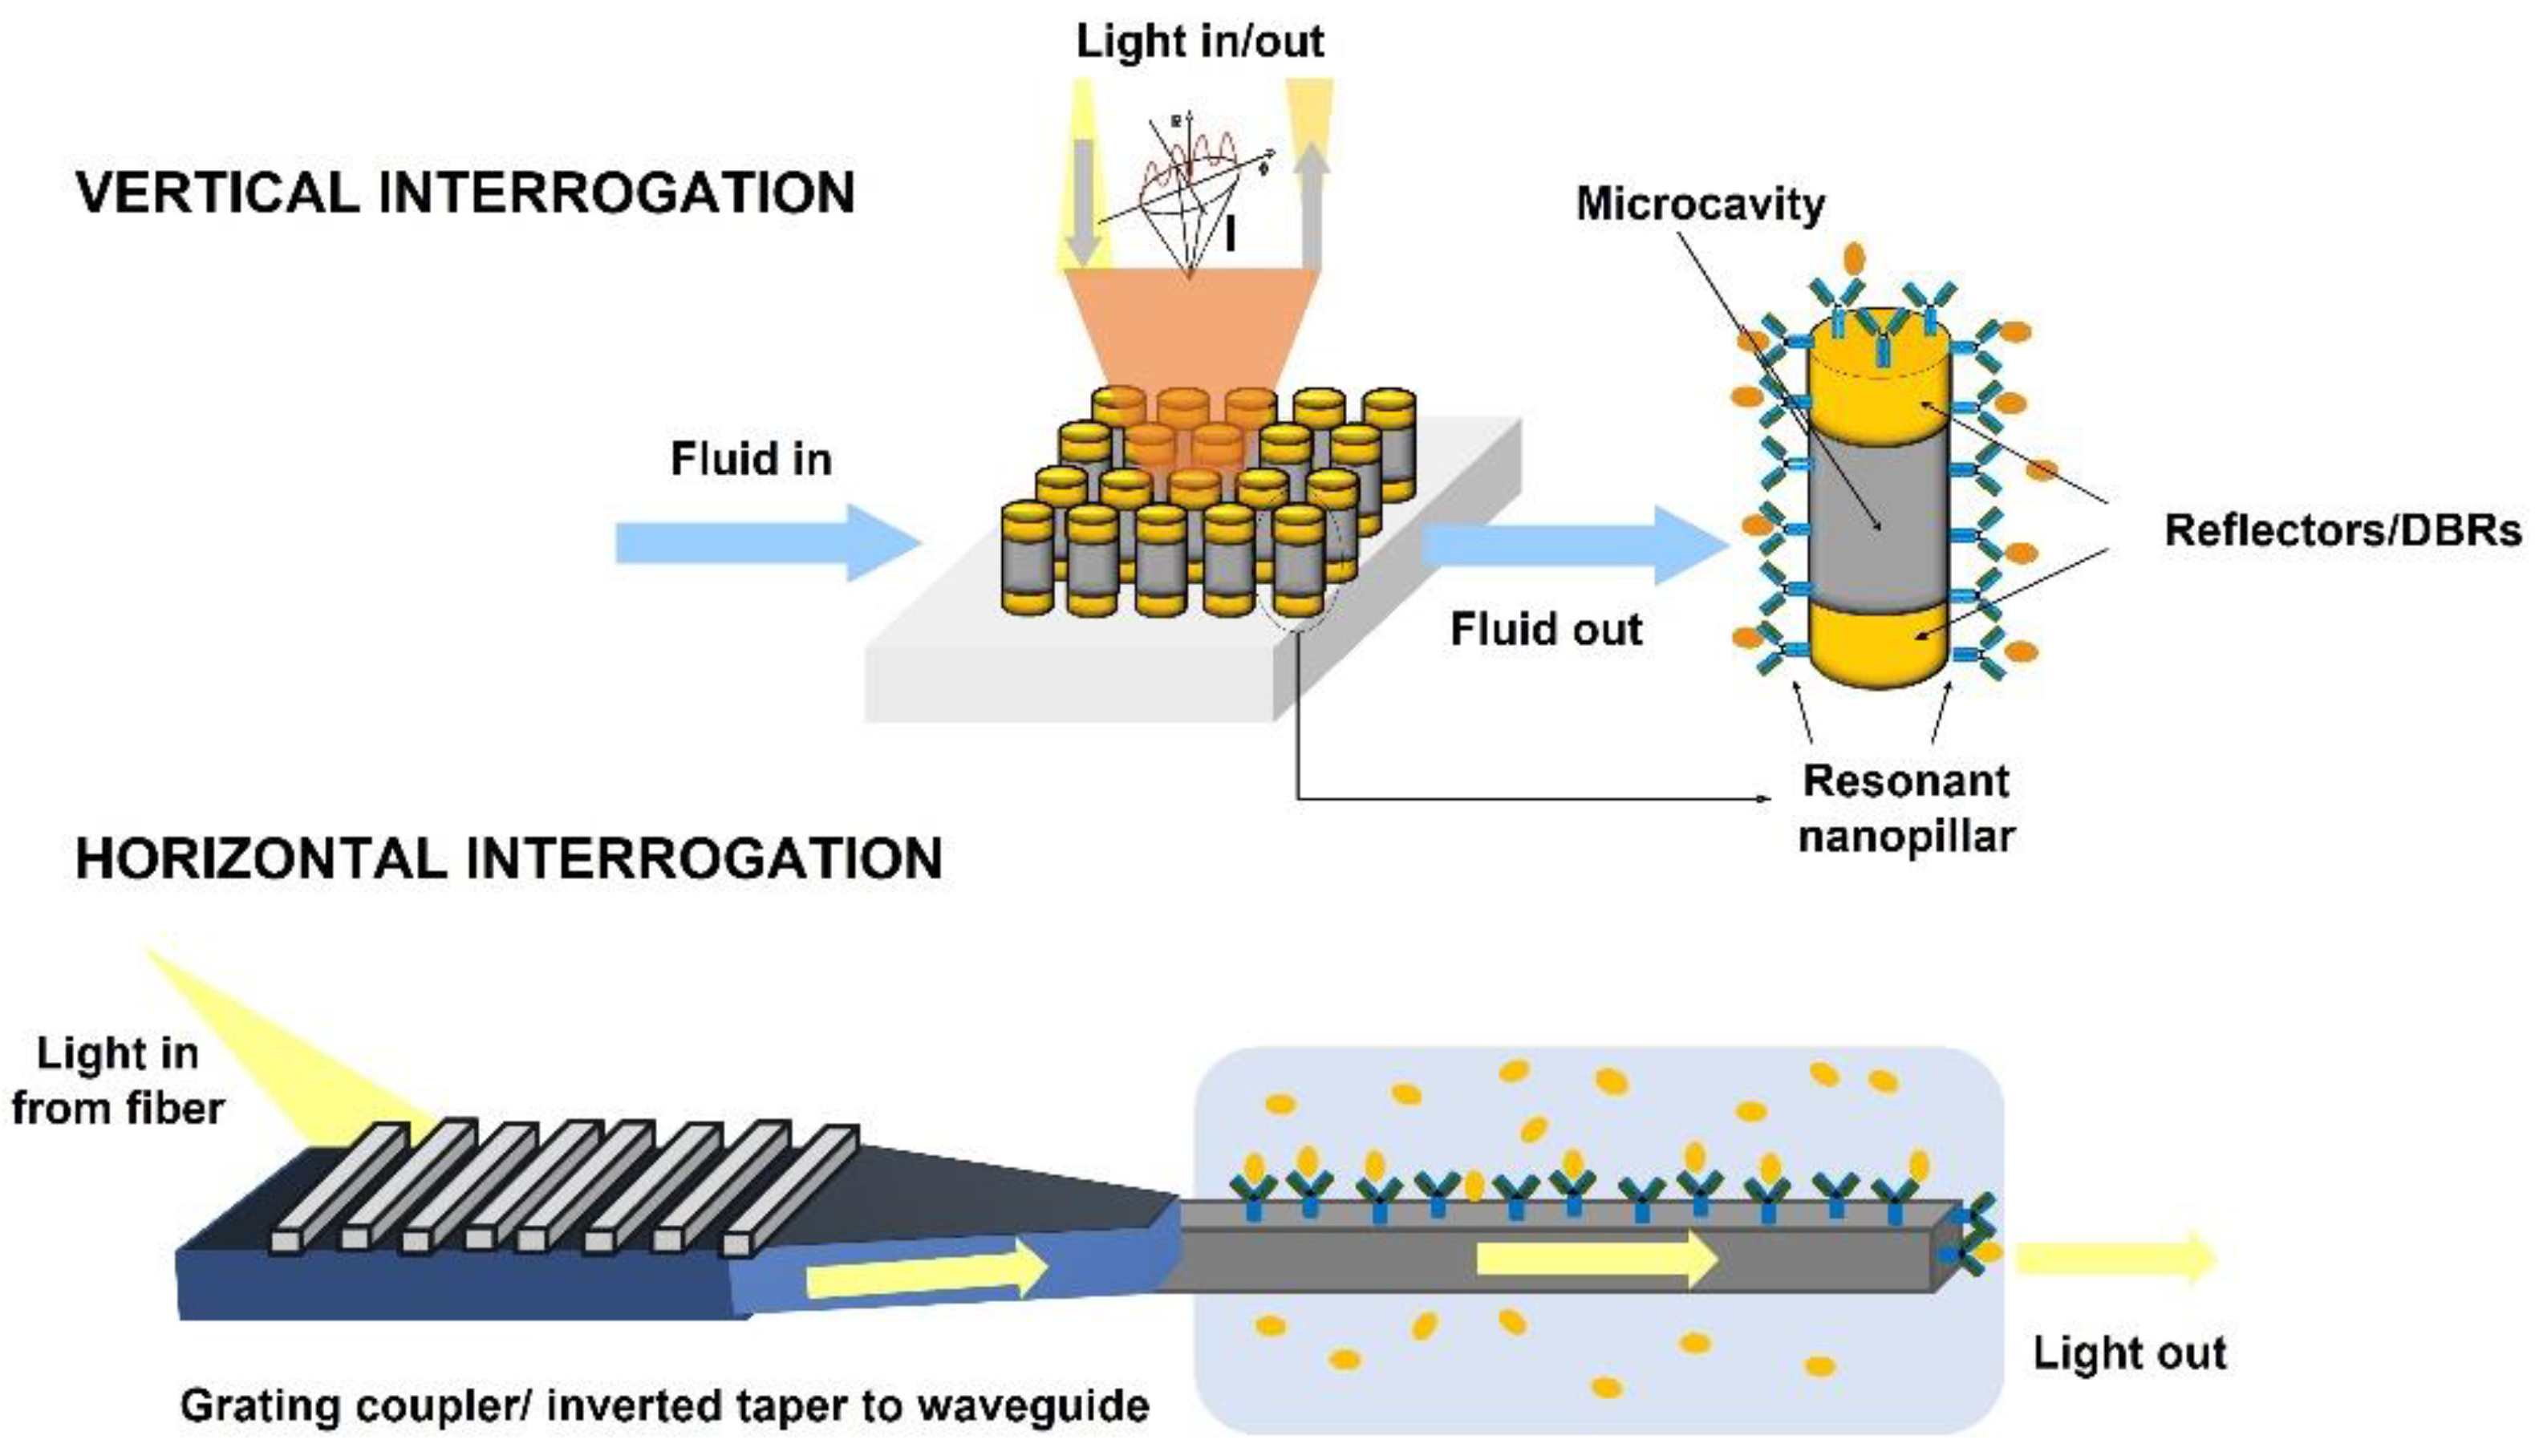
2.1.3. Classification Based on the Optical Interrogation
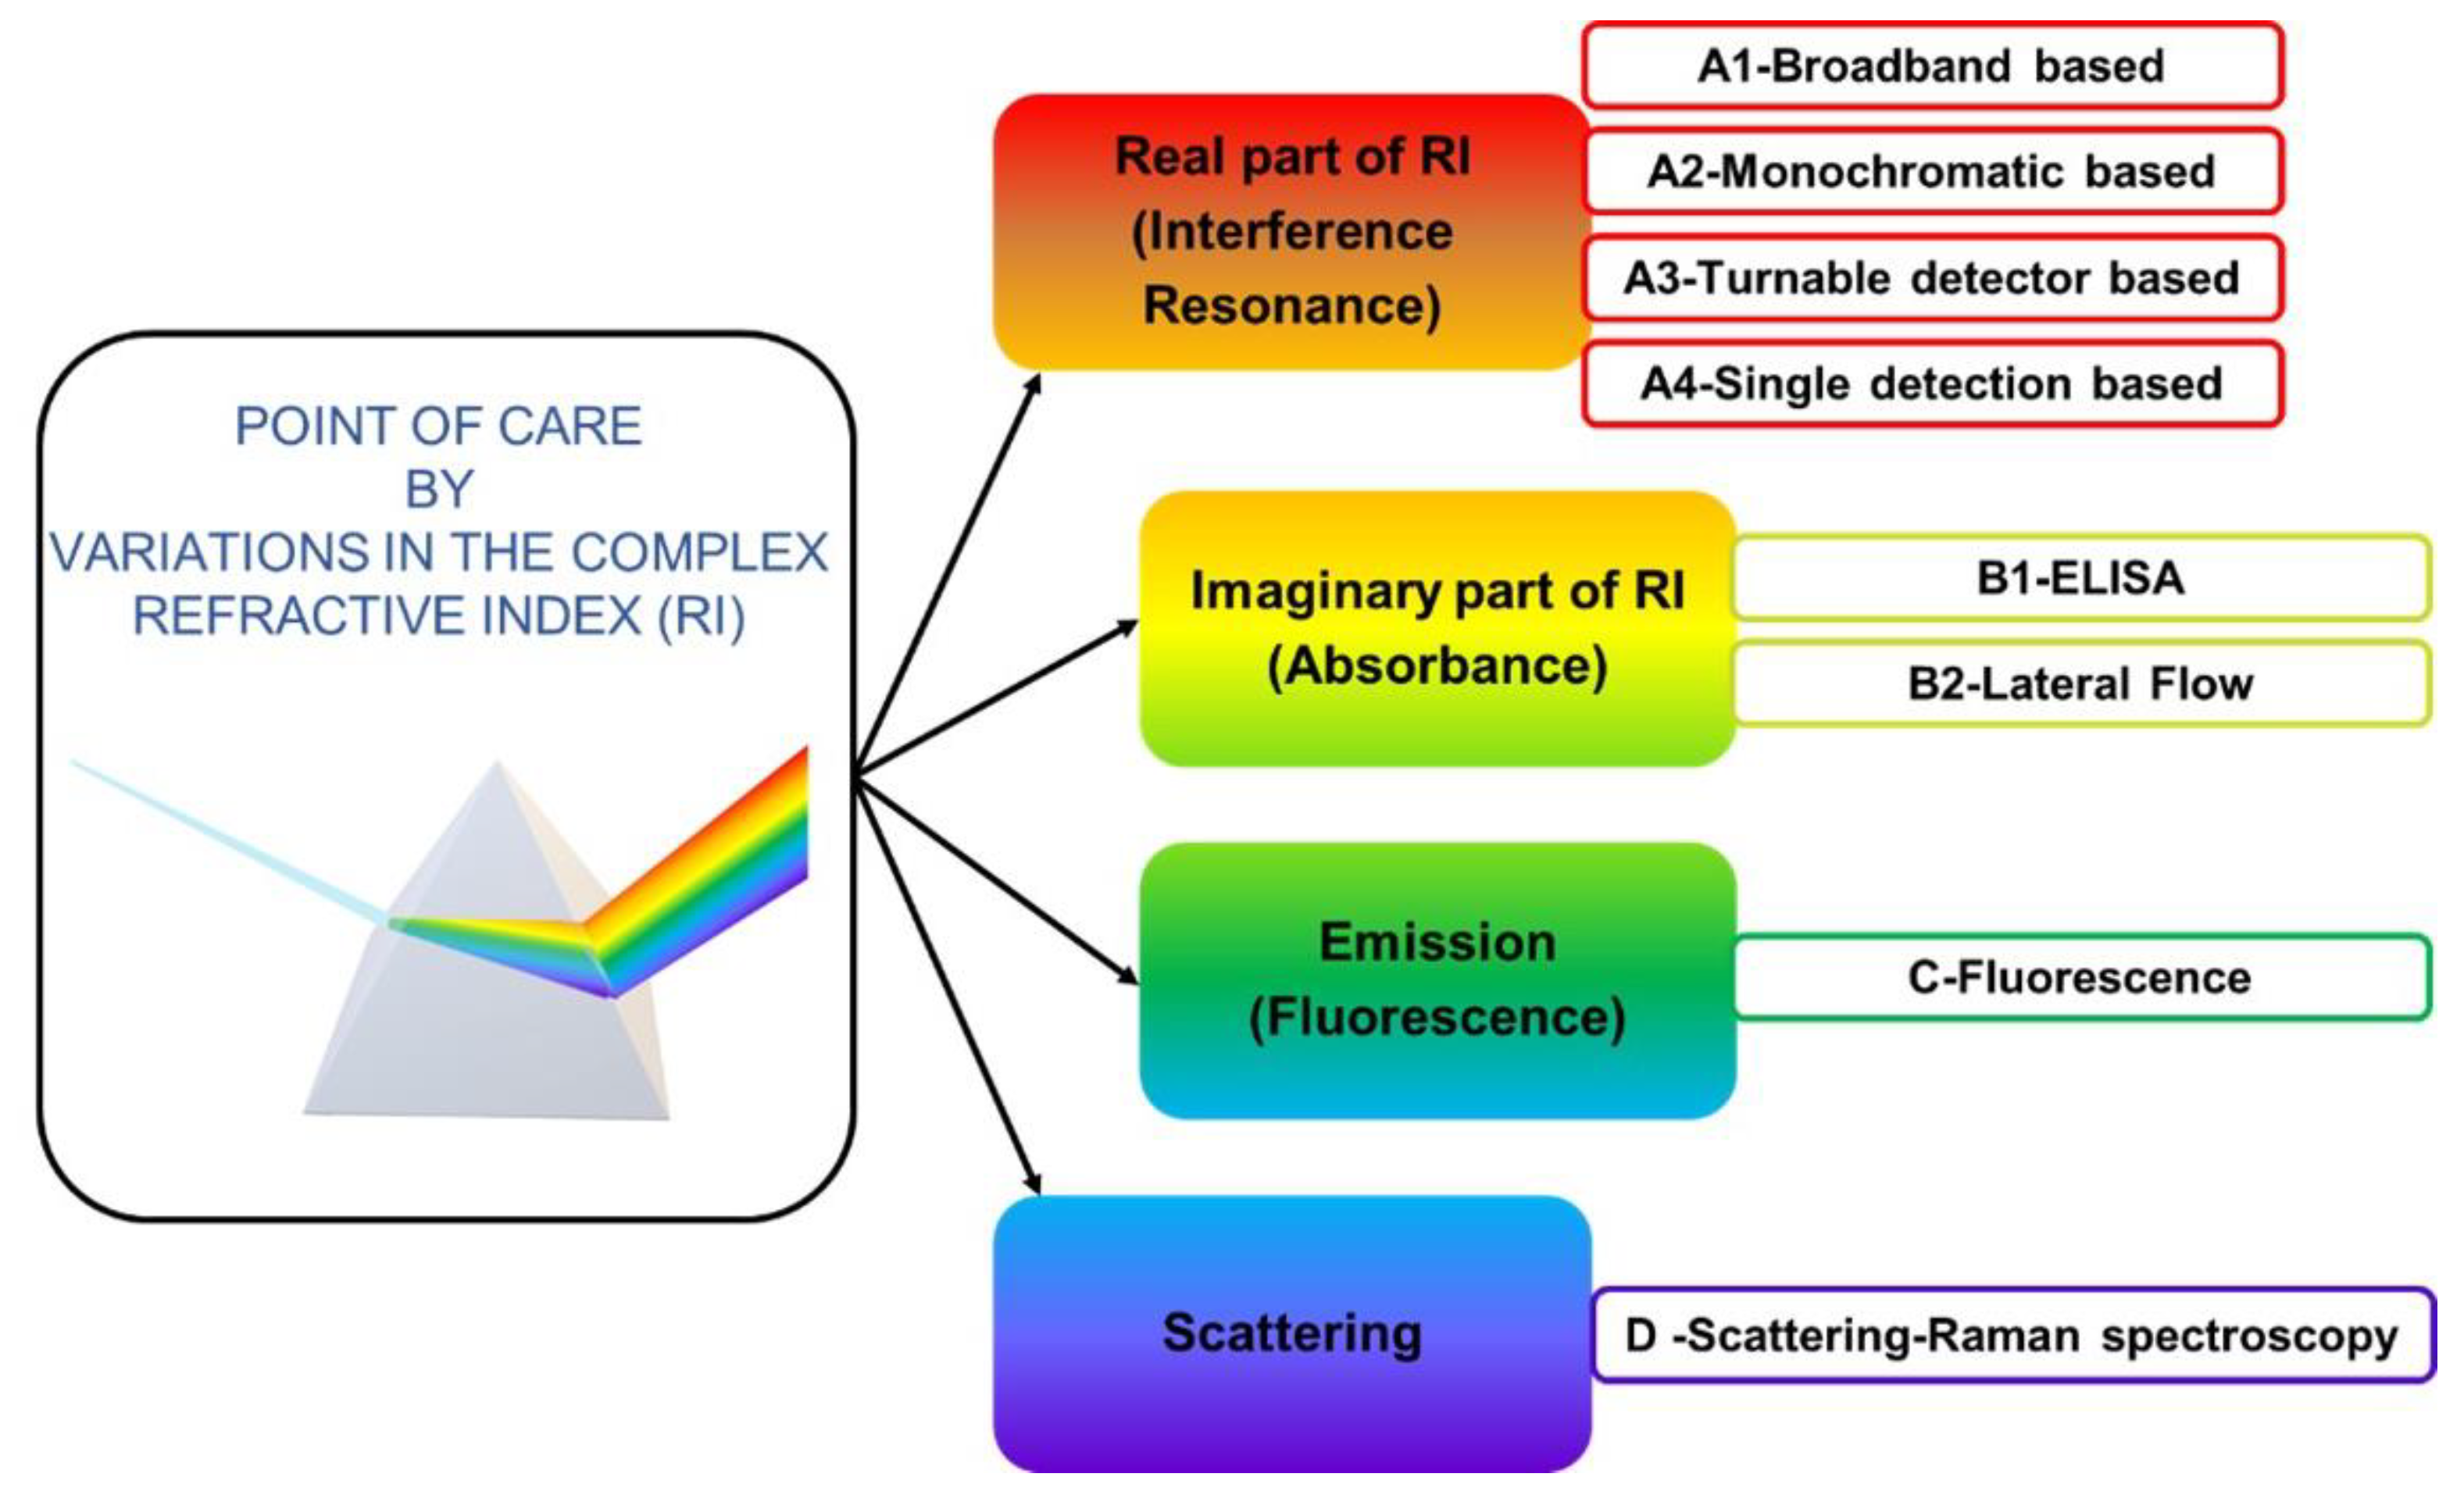
2.1.4. Classification Based on the Variation of the Complex Refractive Index
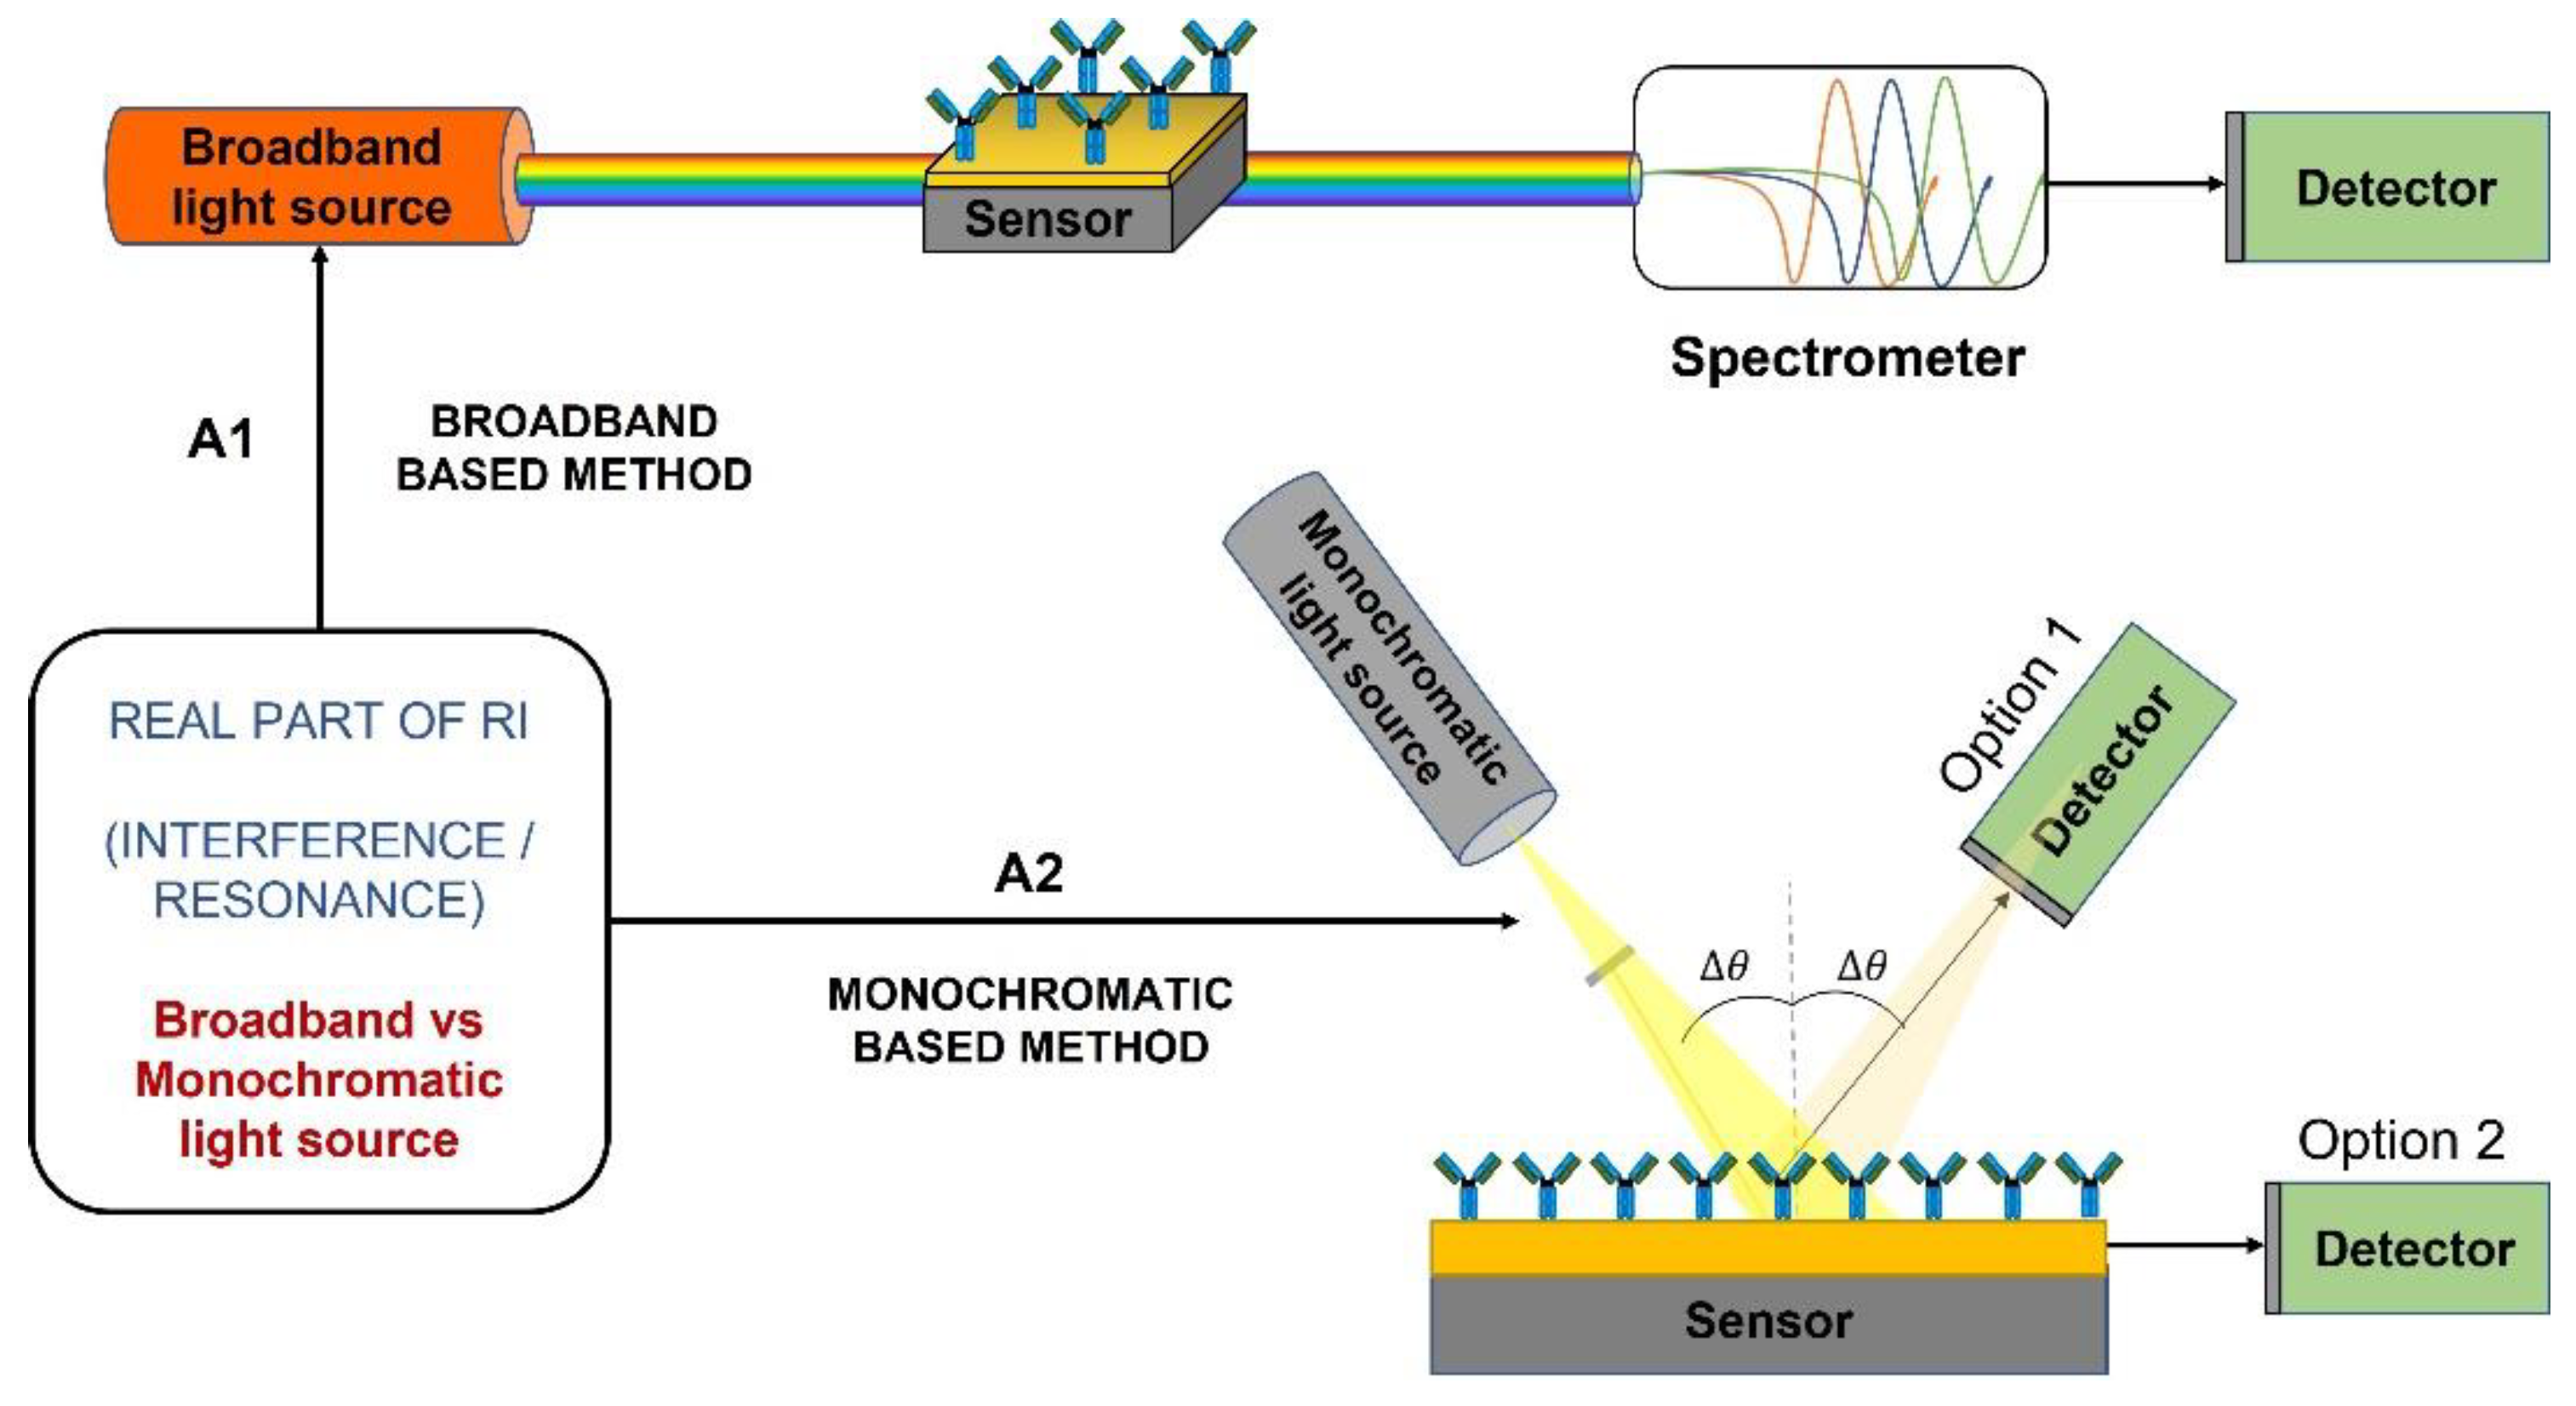
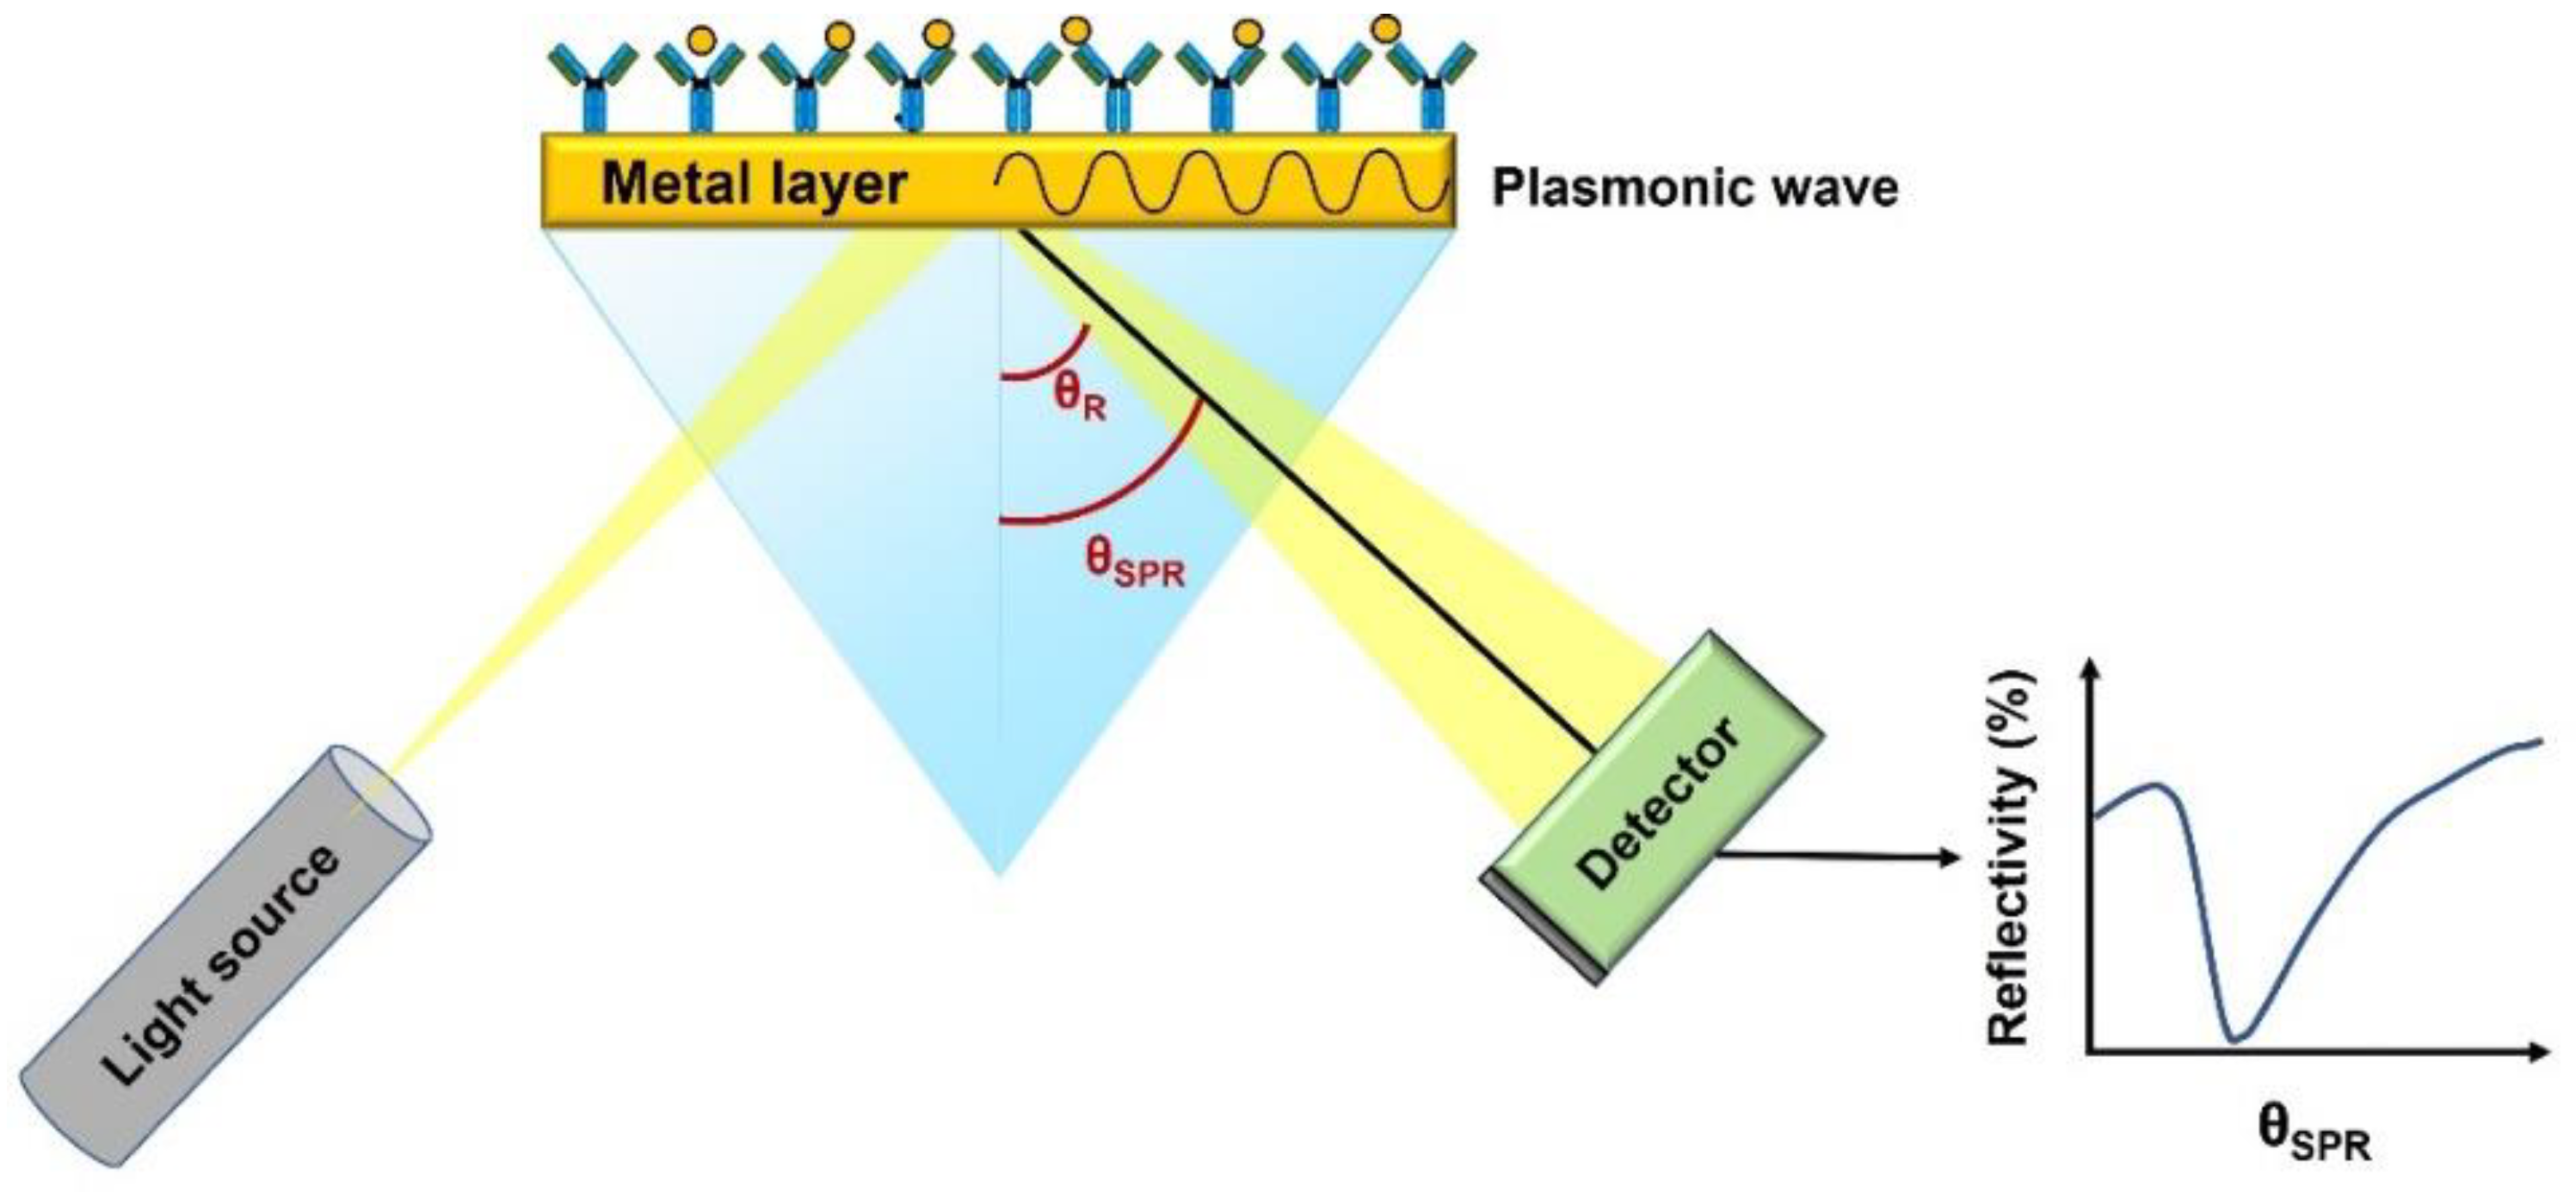
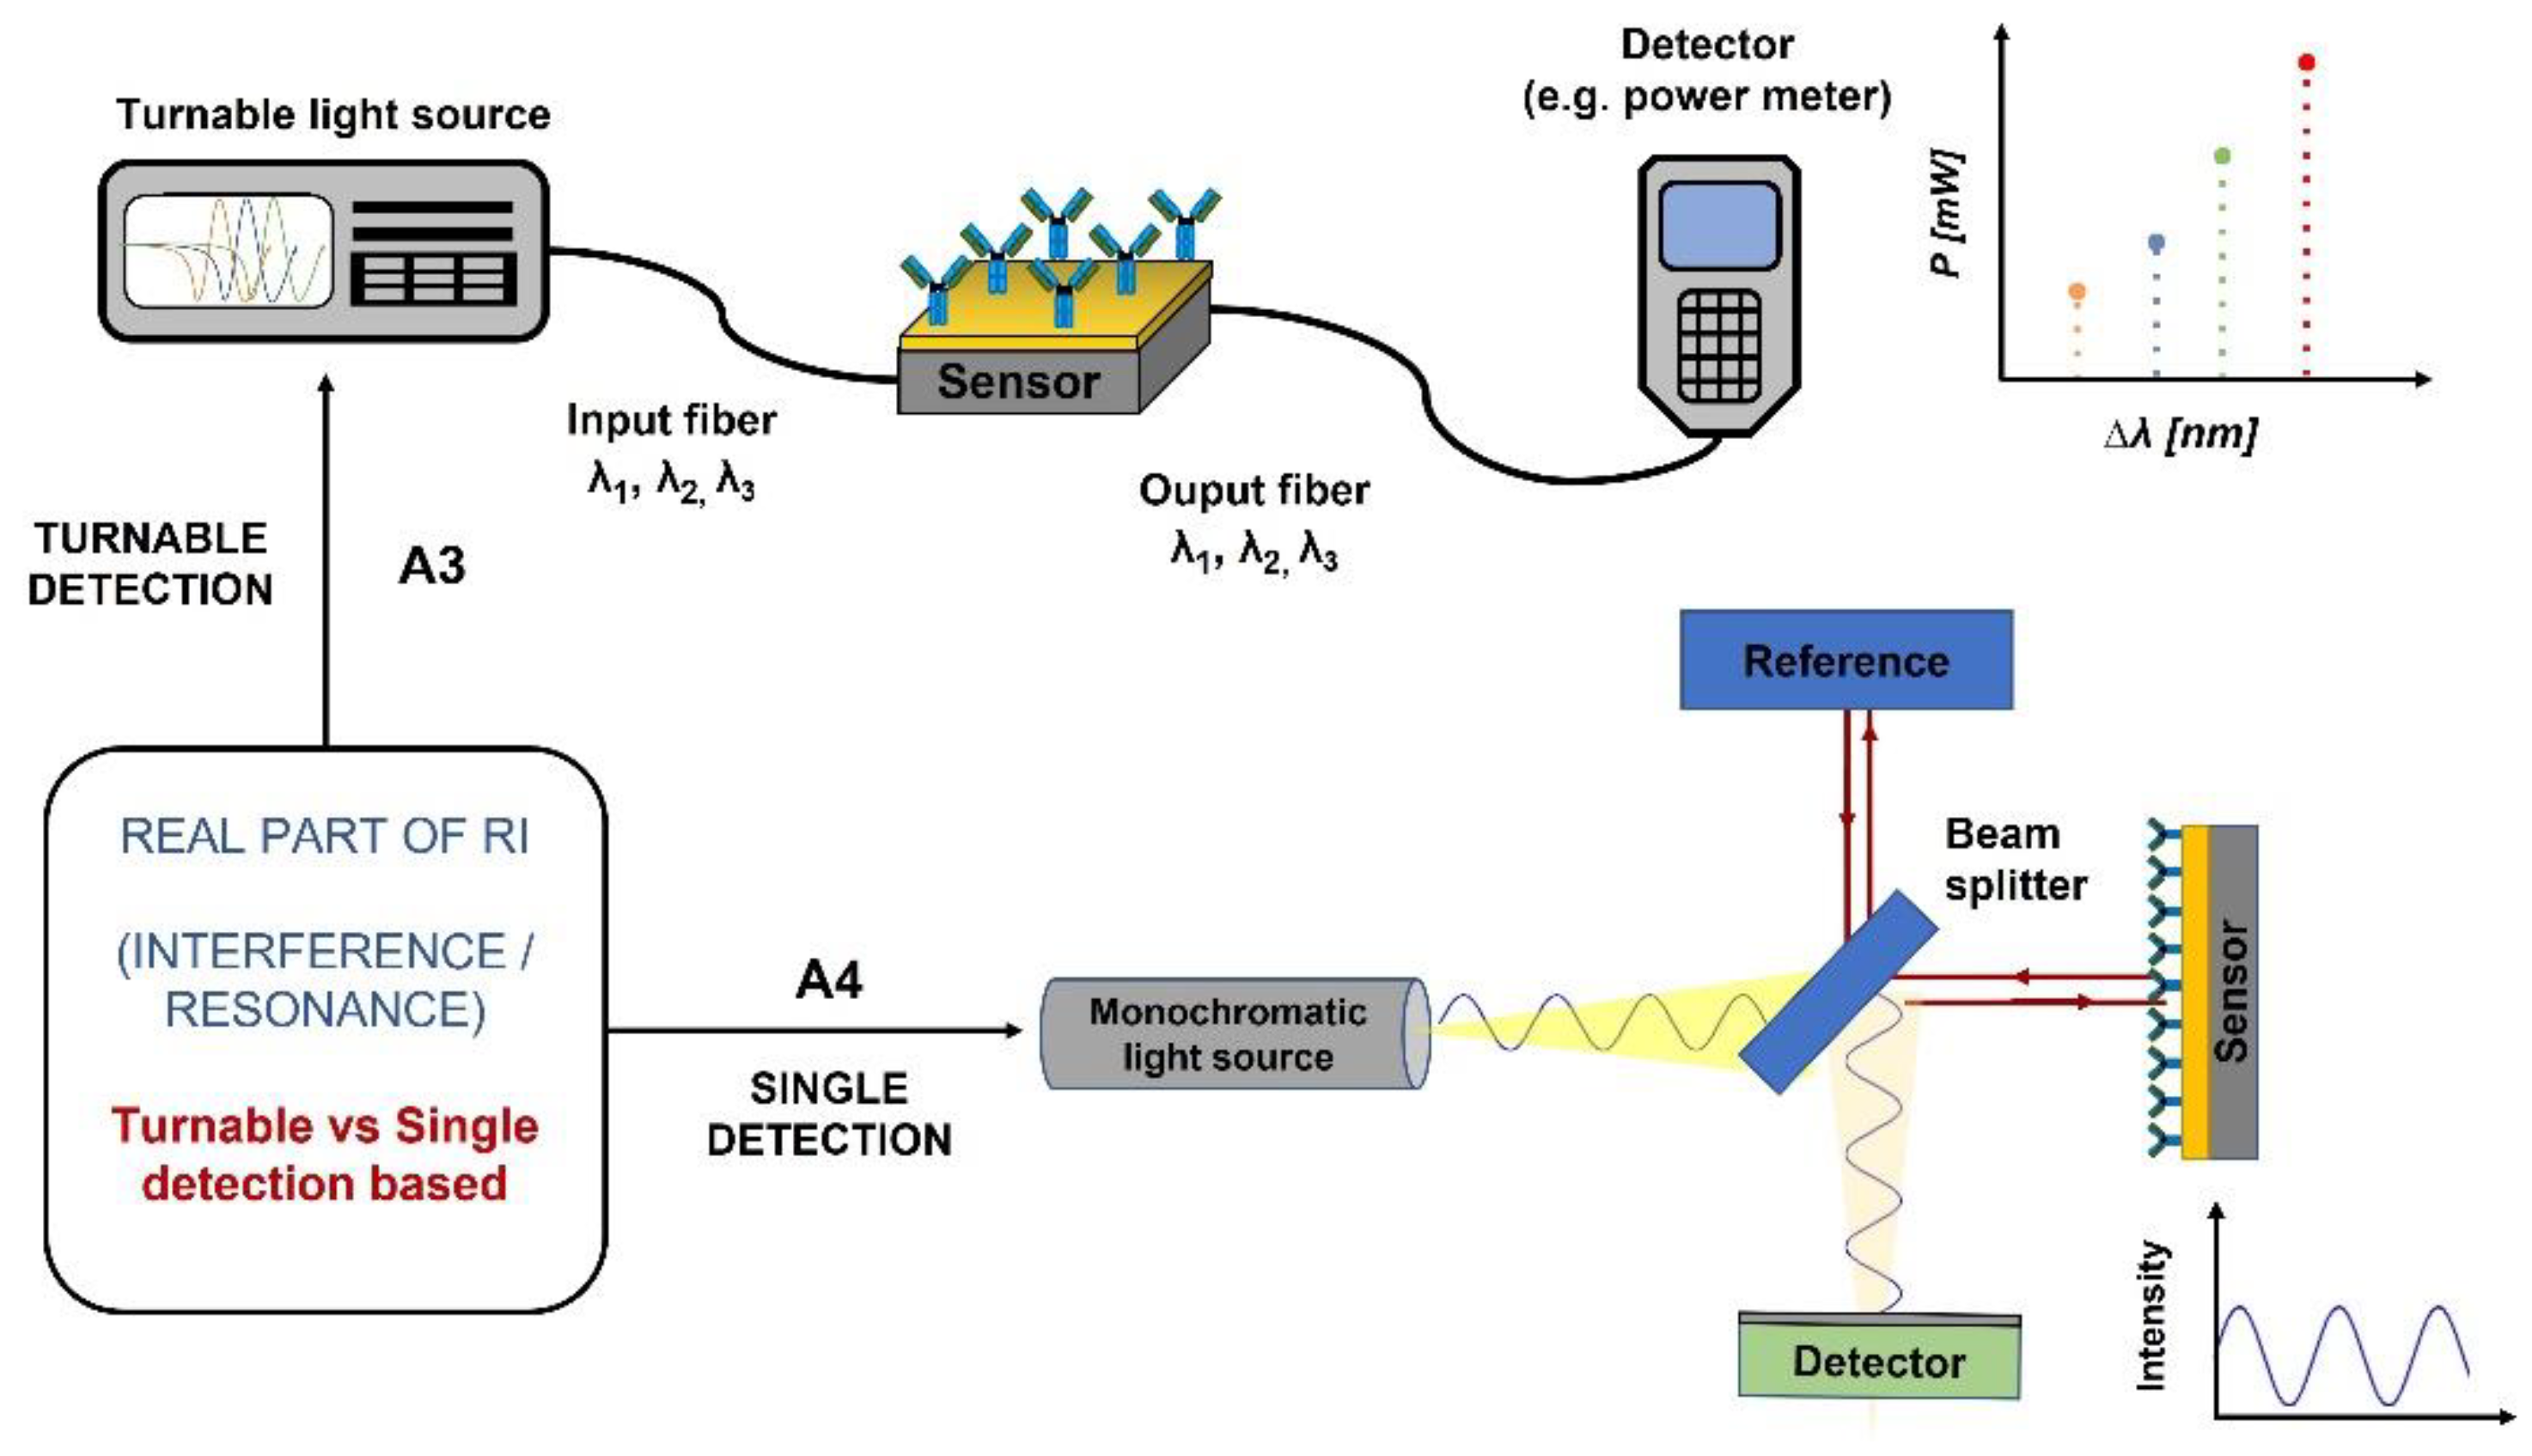
Real Part of RI—Interference/Resonance (A)
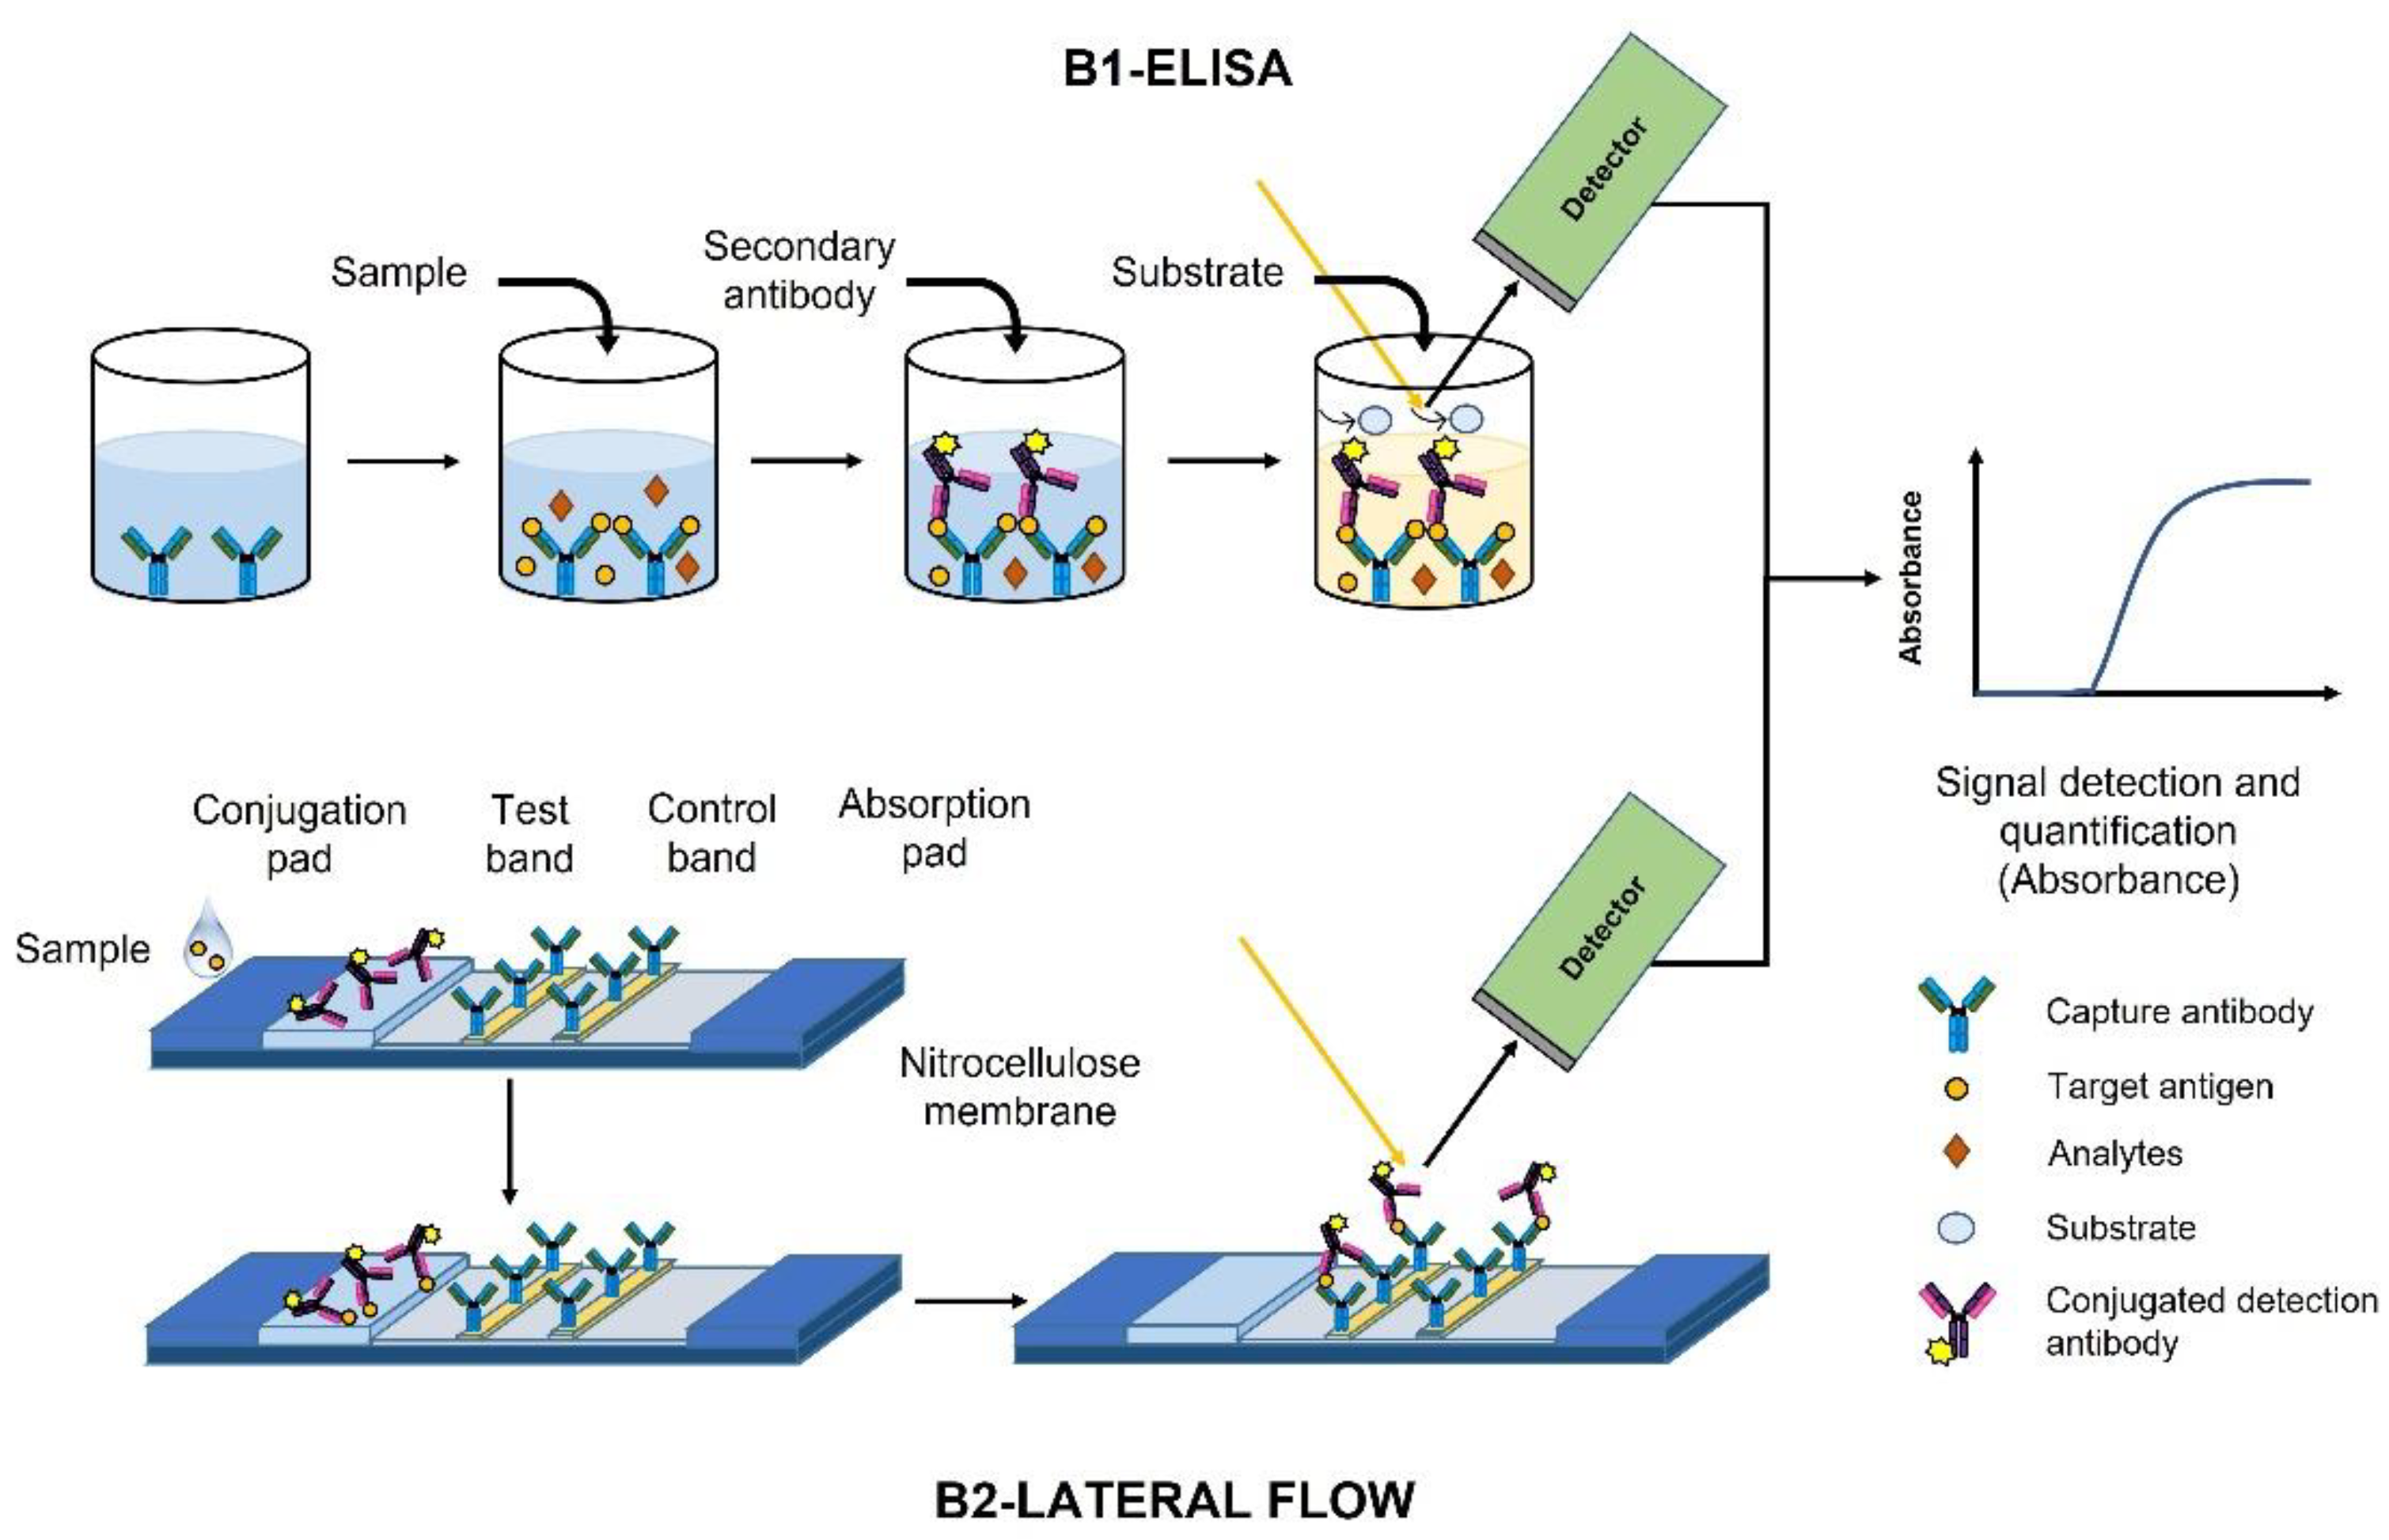
Imaginary Part of RI—Absorbance (B)
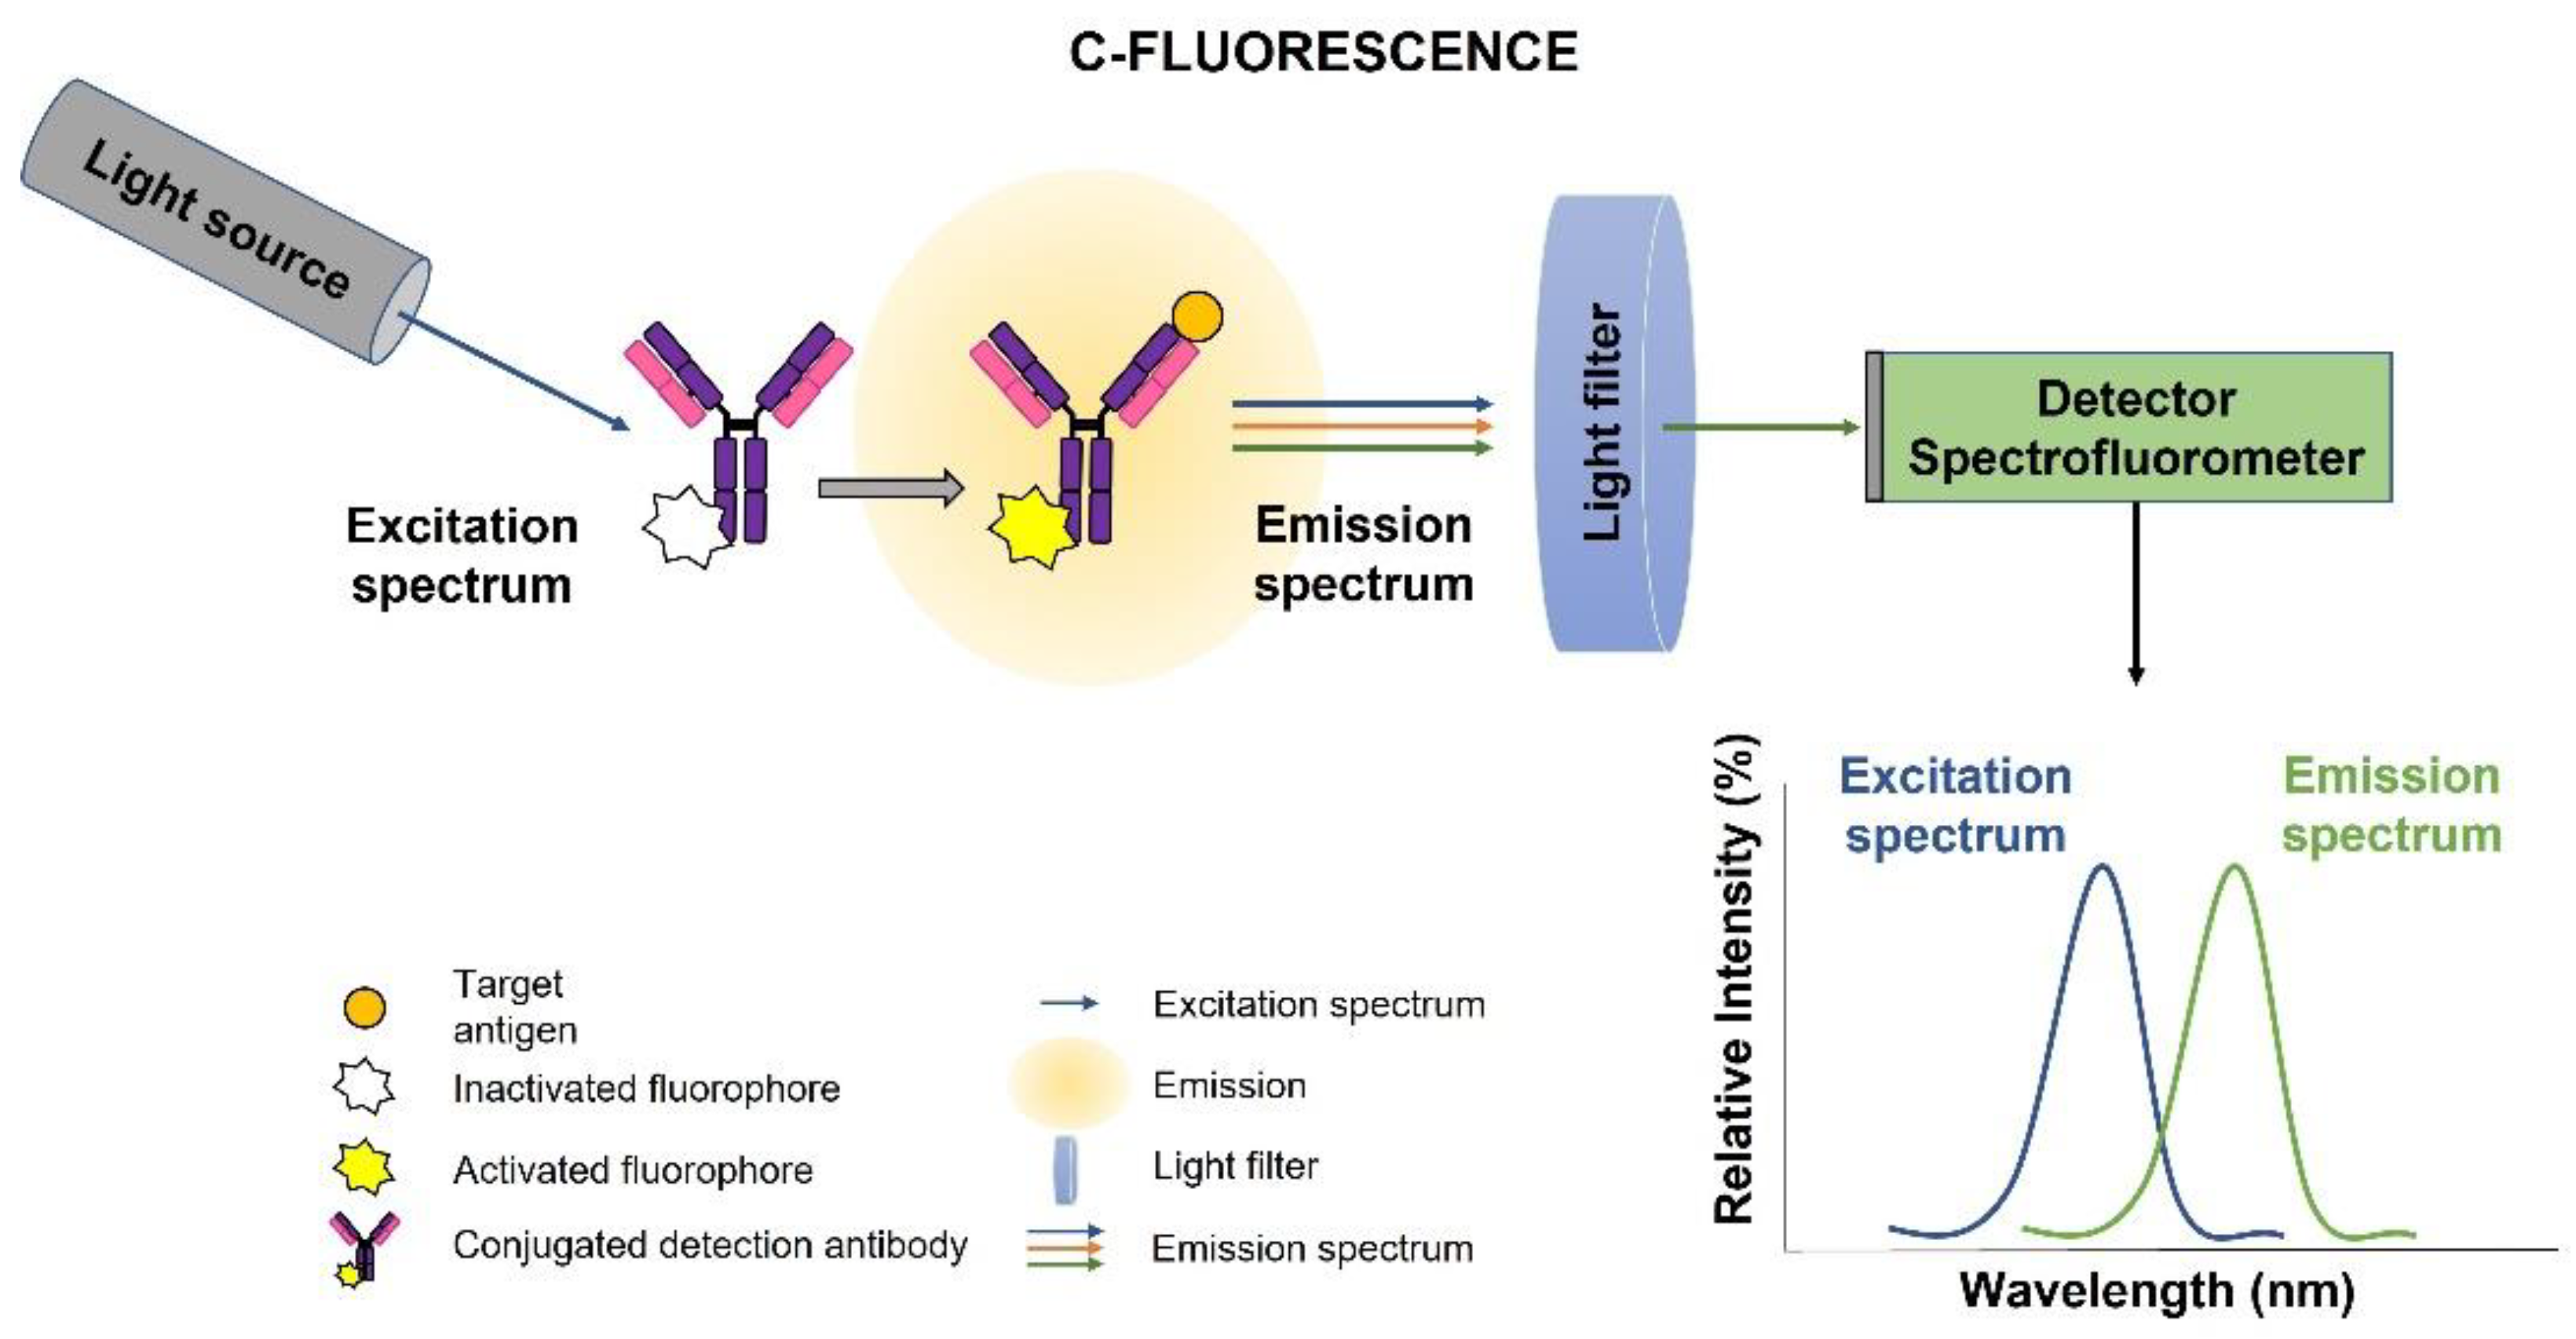
Emission–Fluorescence (C)
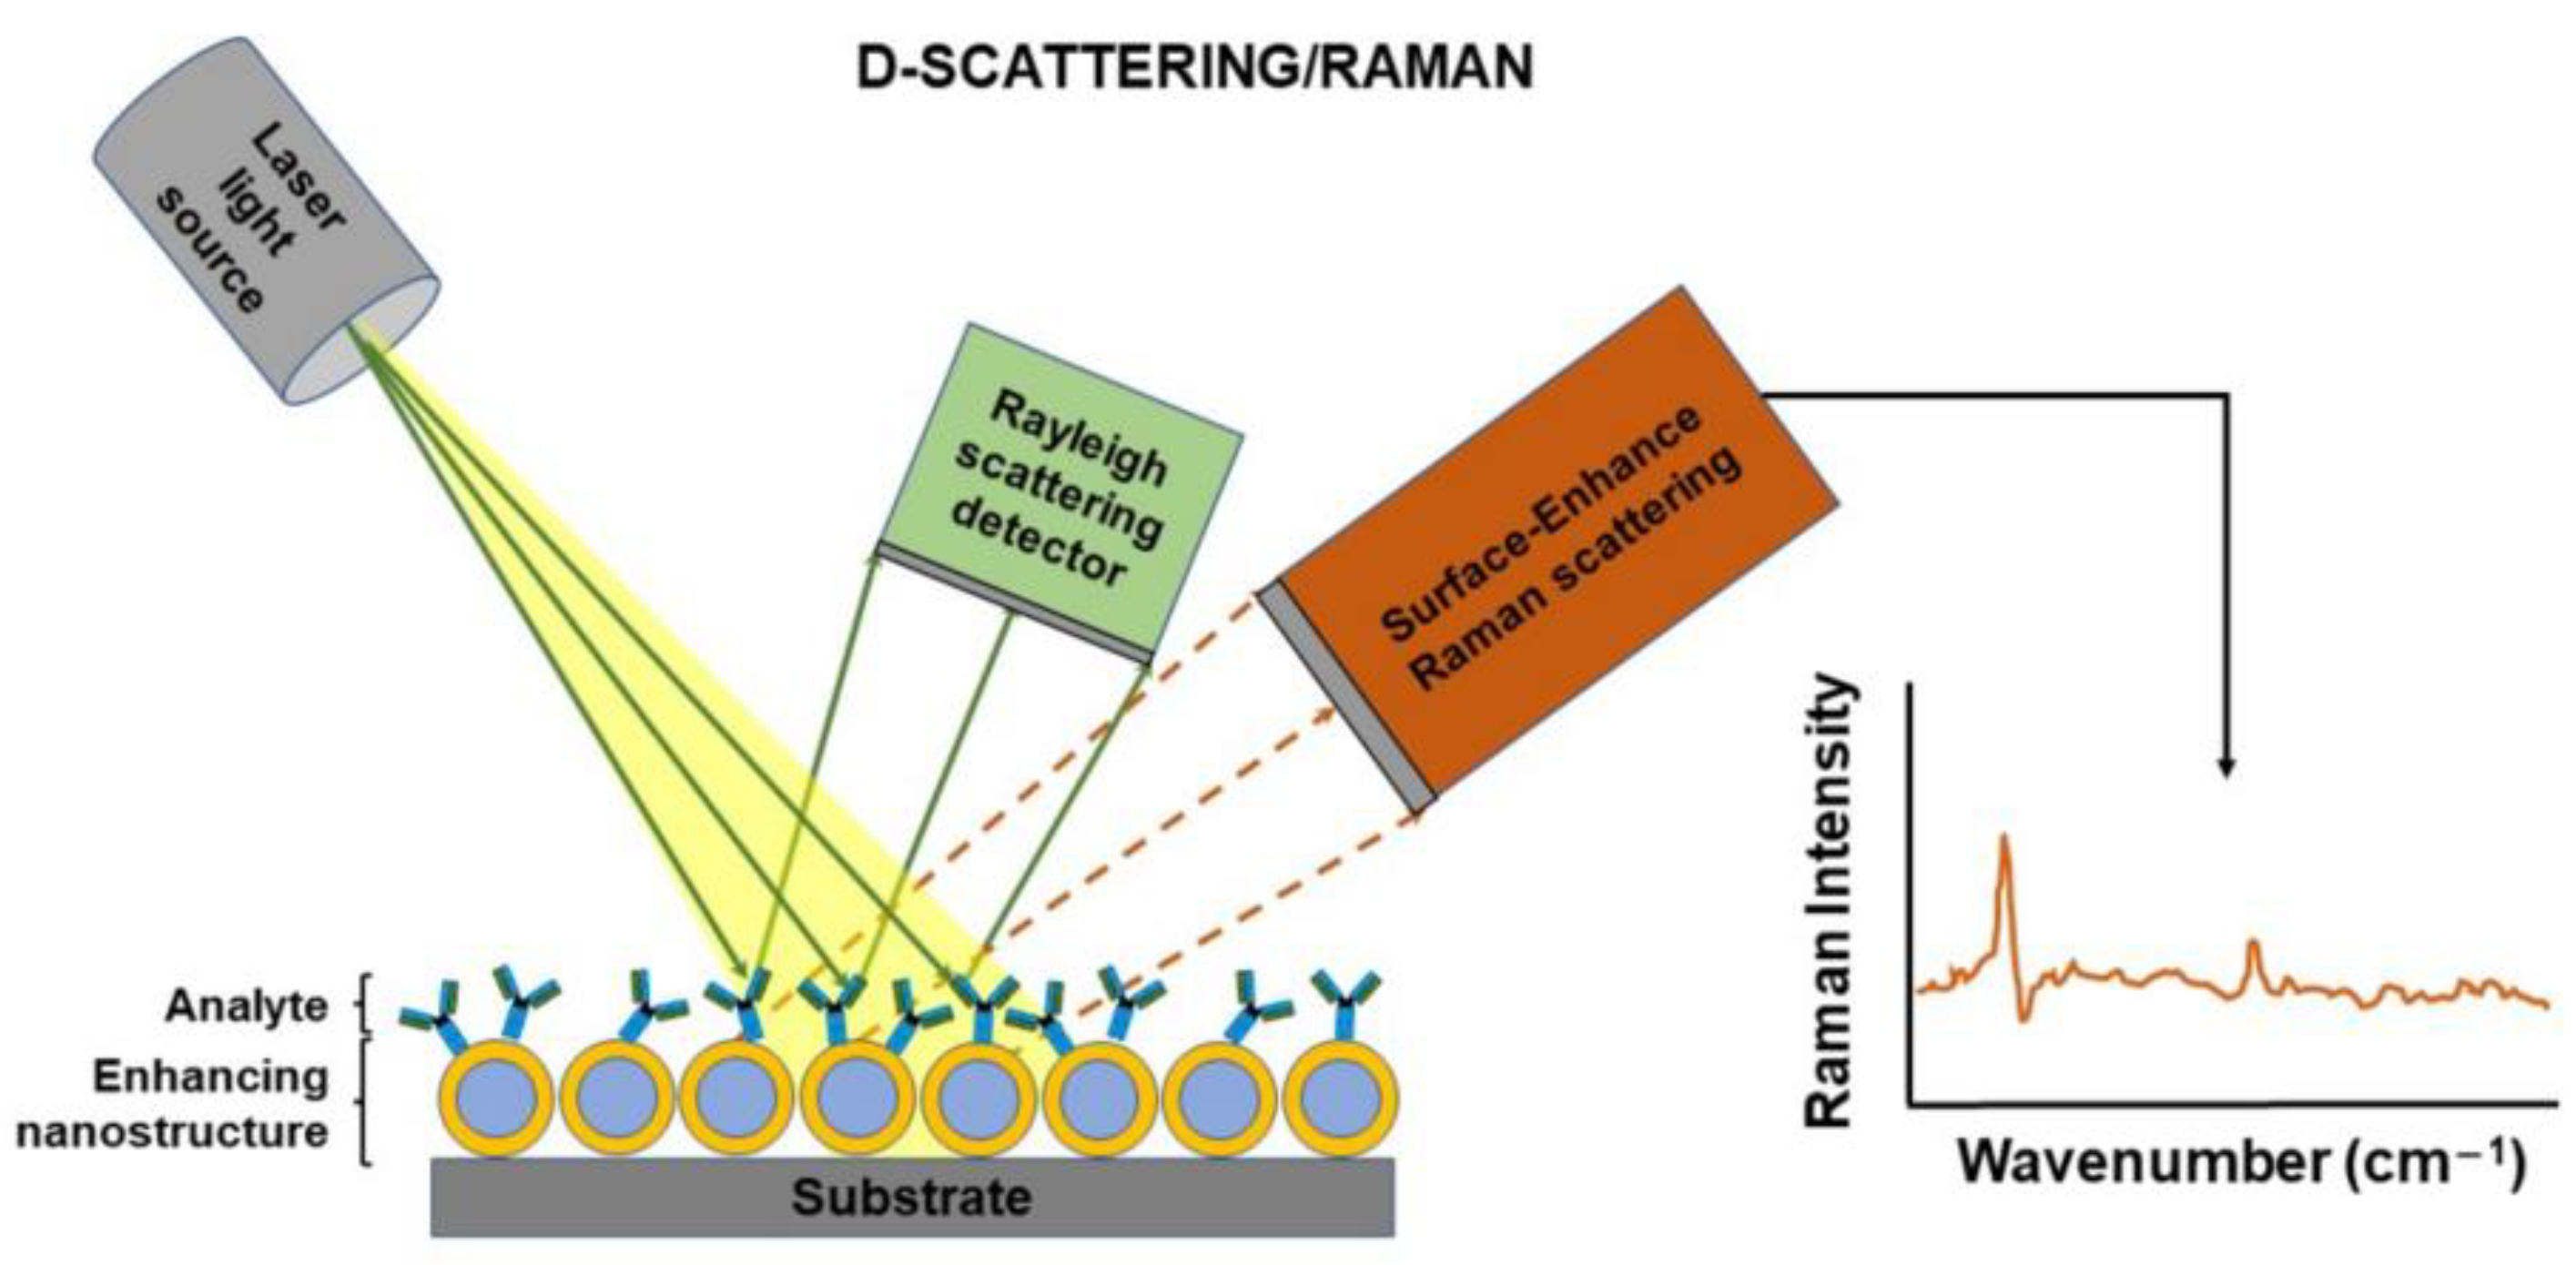
Scattering-Raman Spectroscopy (D)
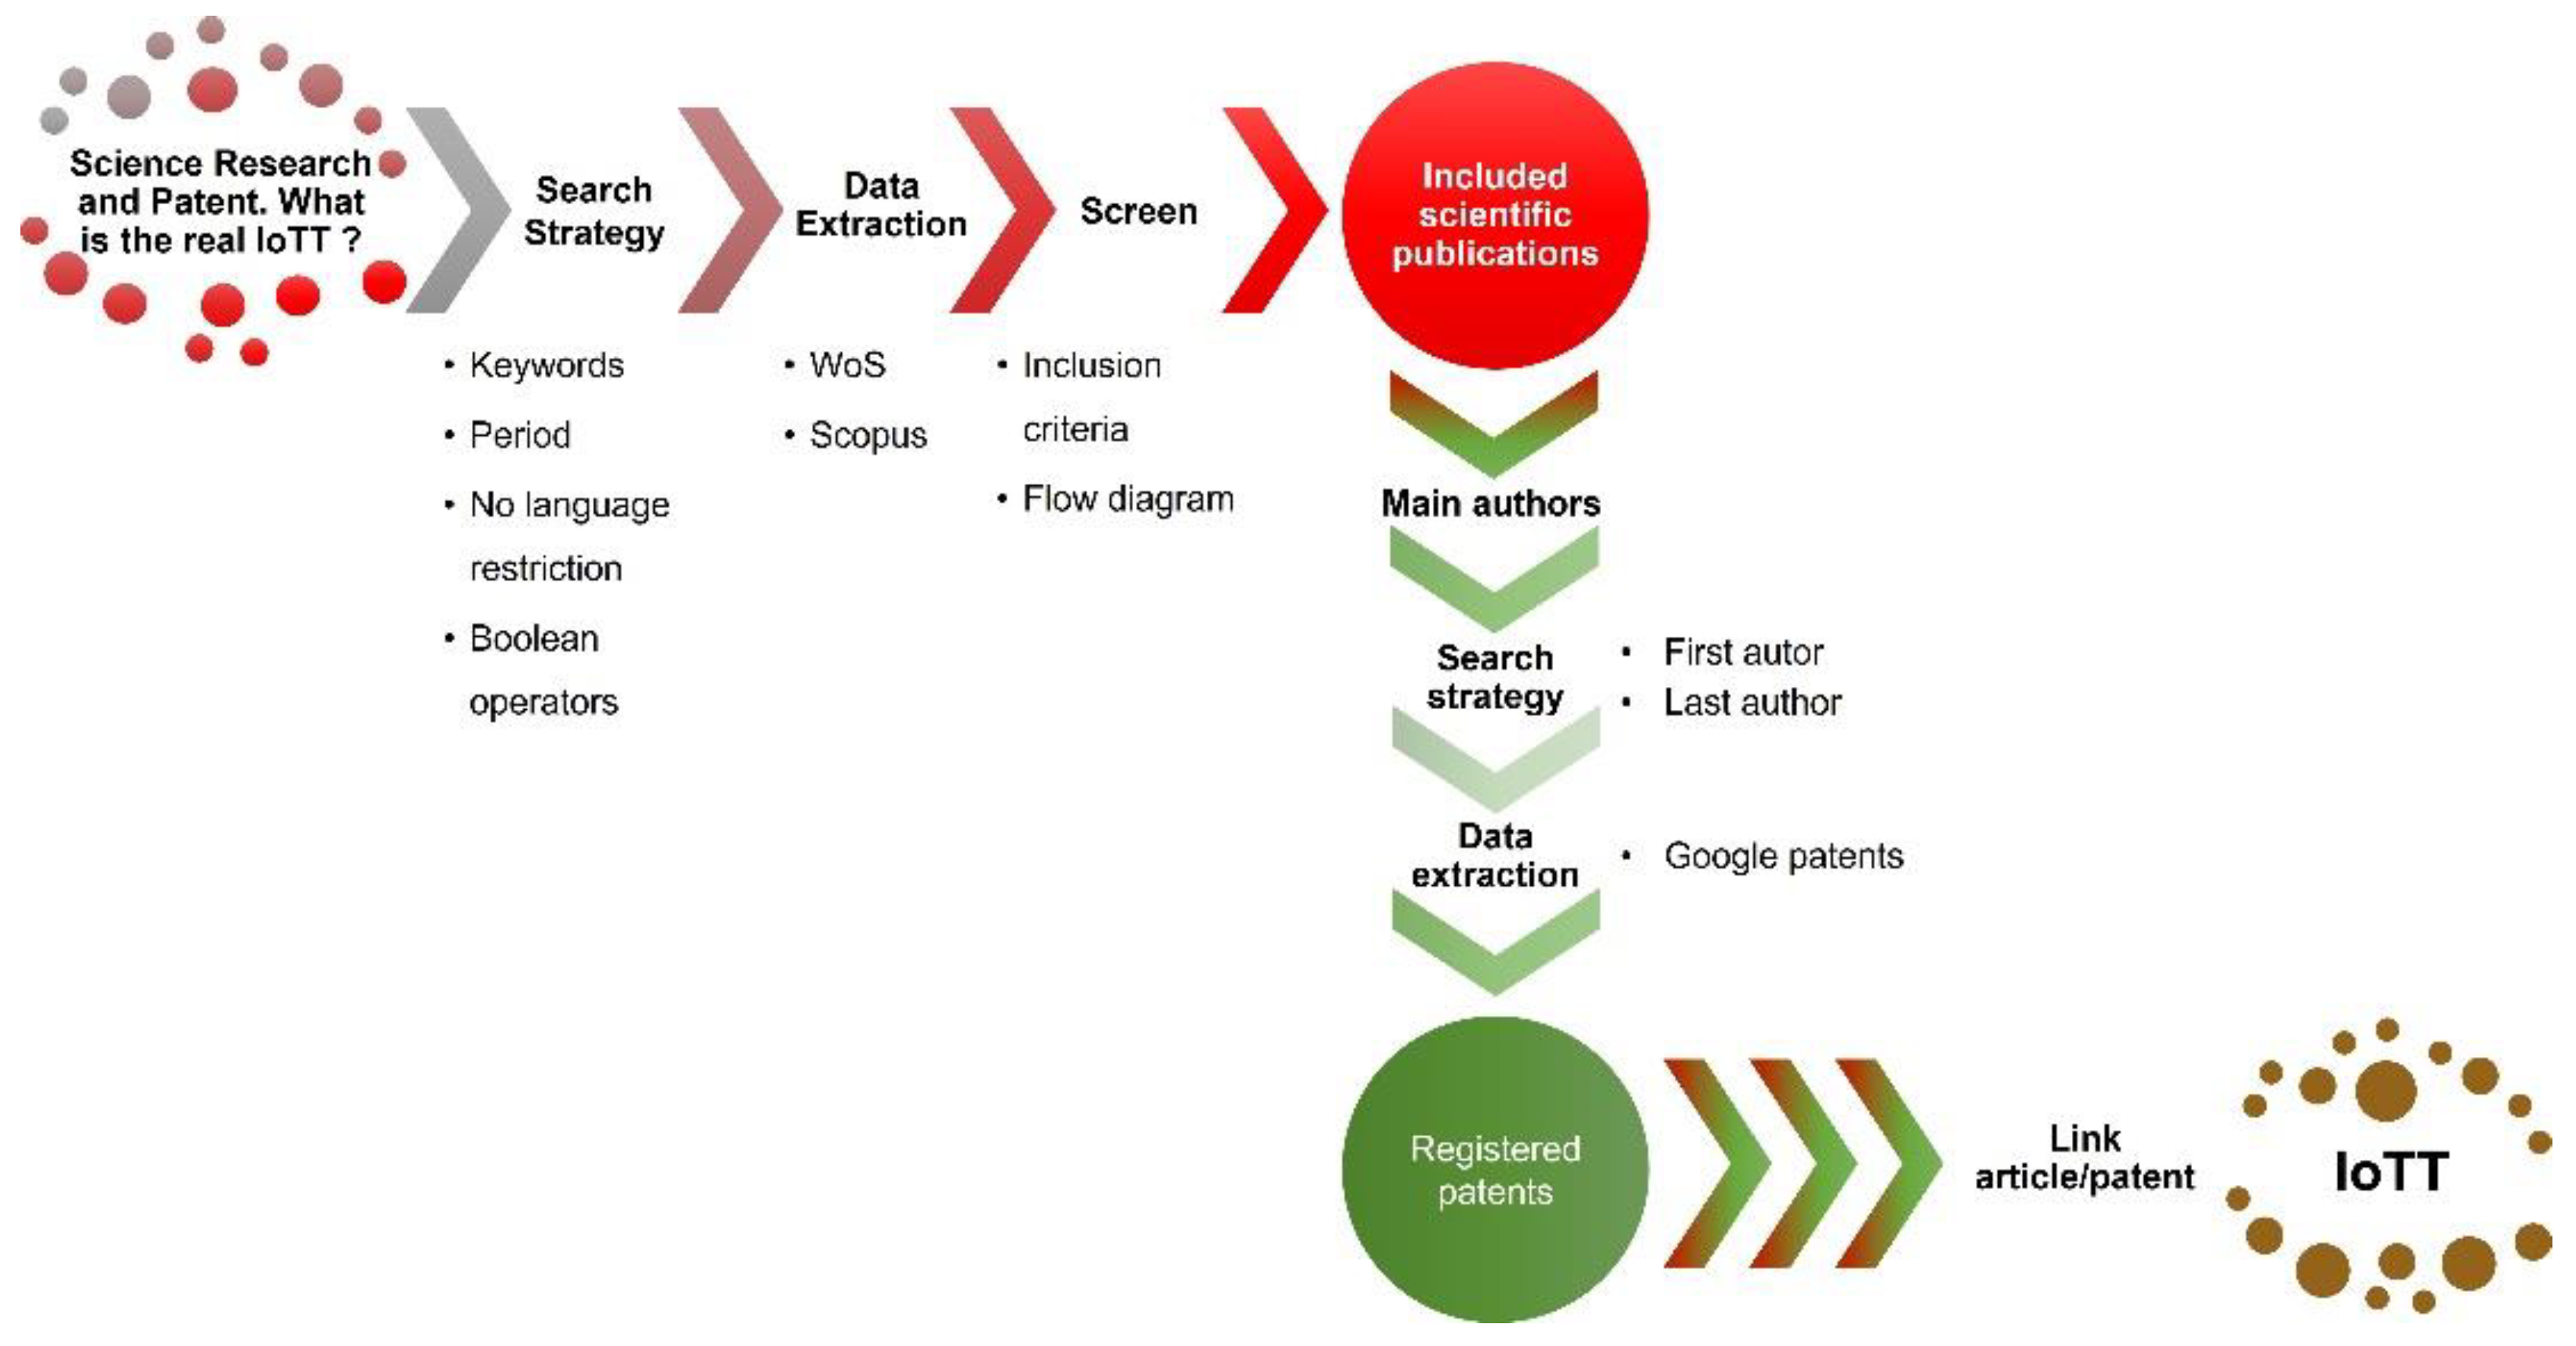
2.2. IoTT Methodology
2.2.1. Scientific Publications Search Strategy
2.2.2. Patent Search Strategy
2.2.3. IoTT Calculation
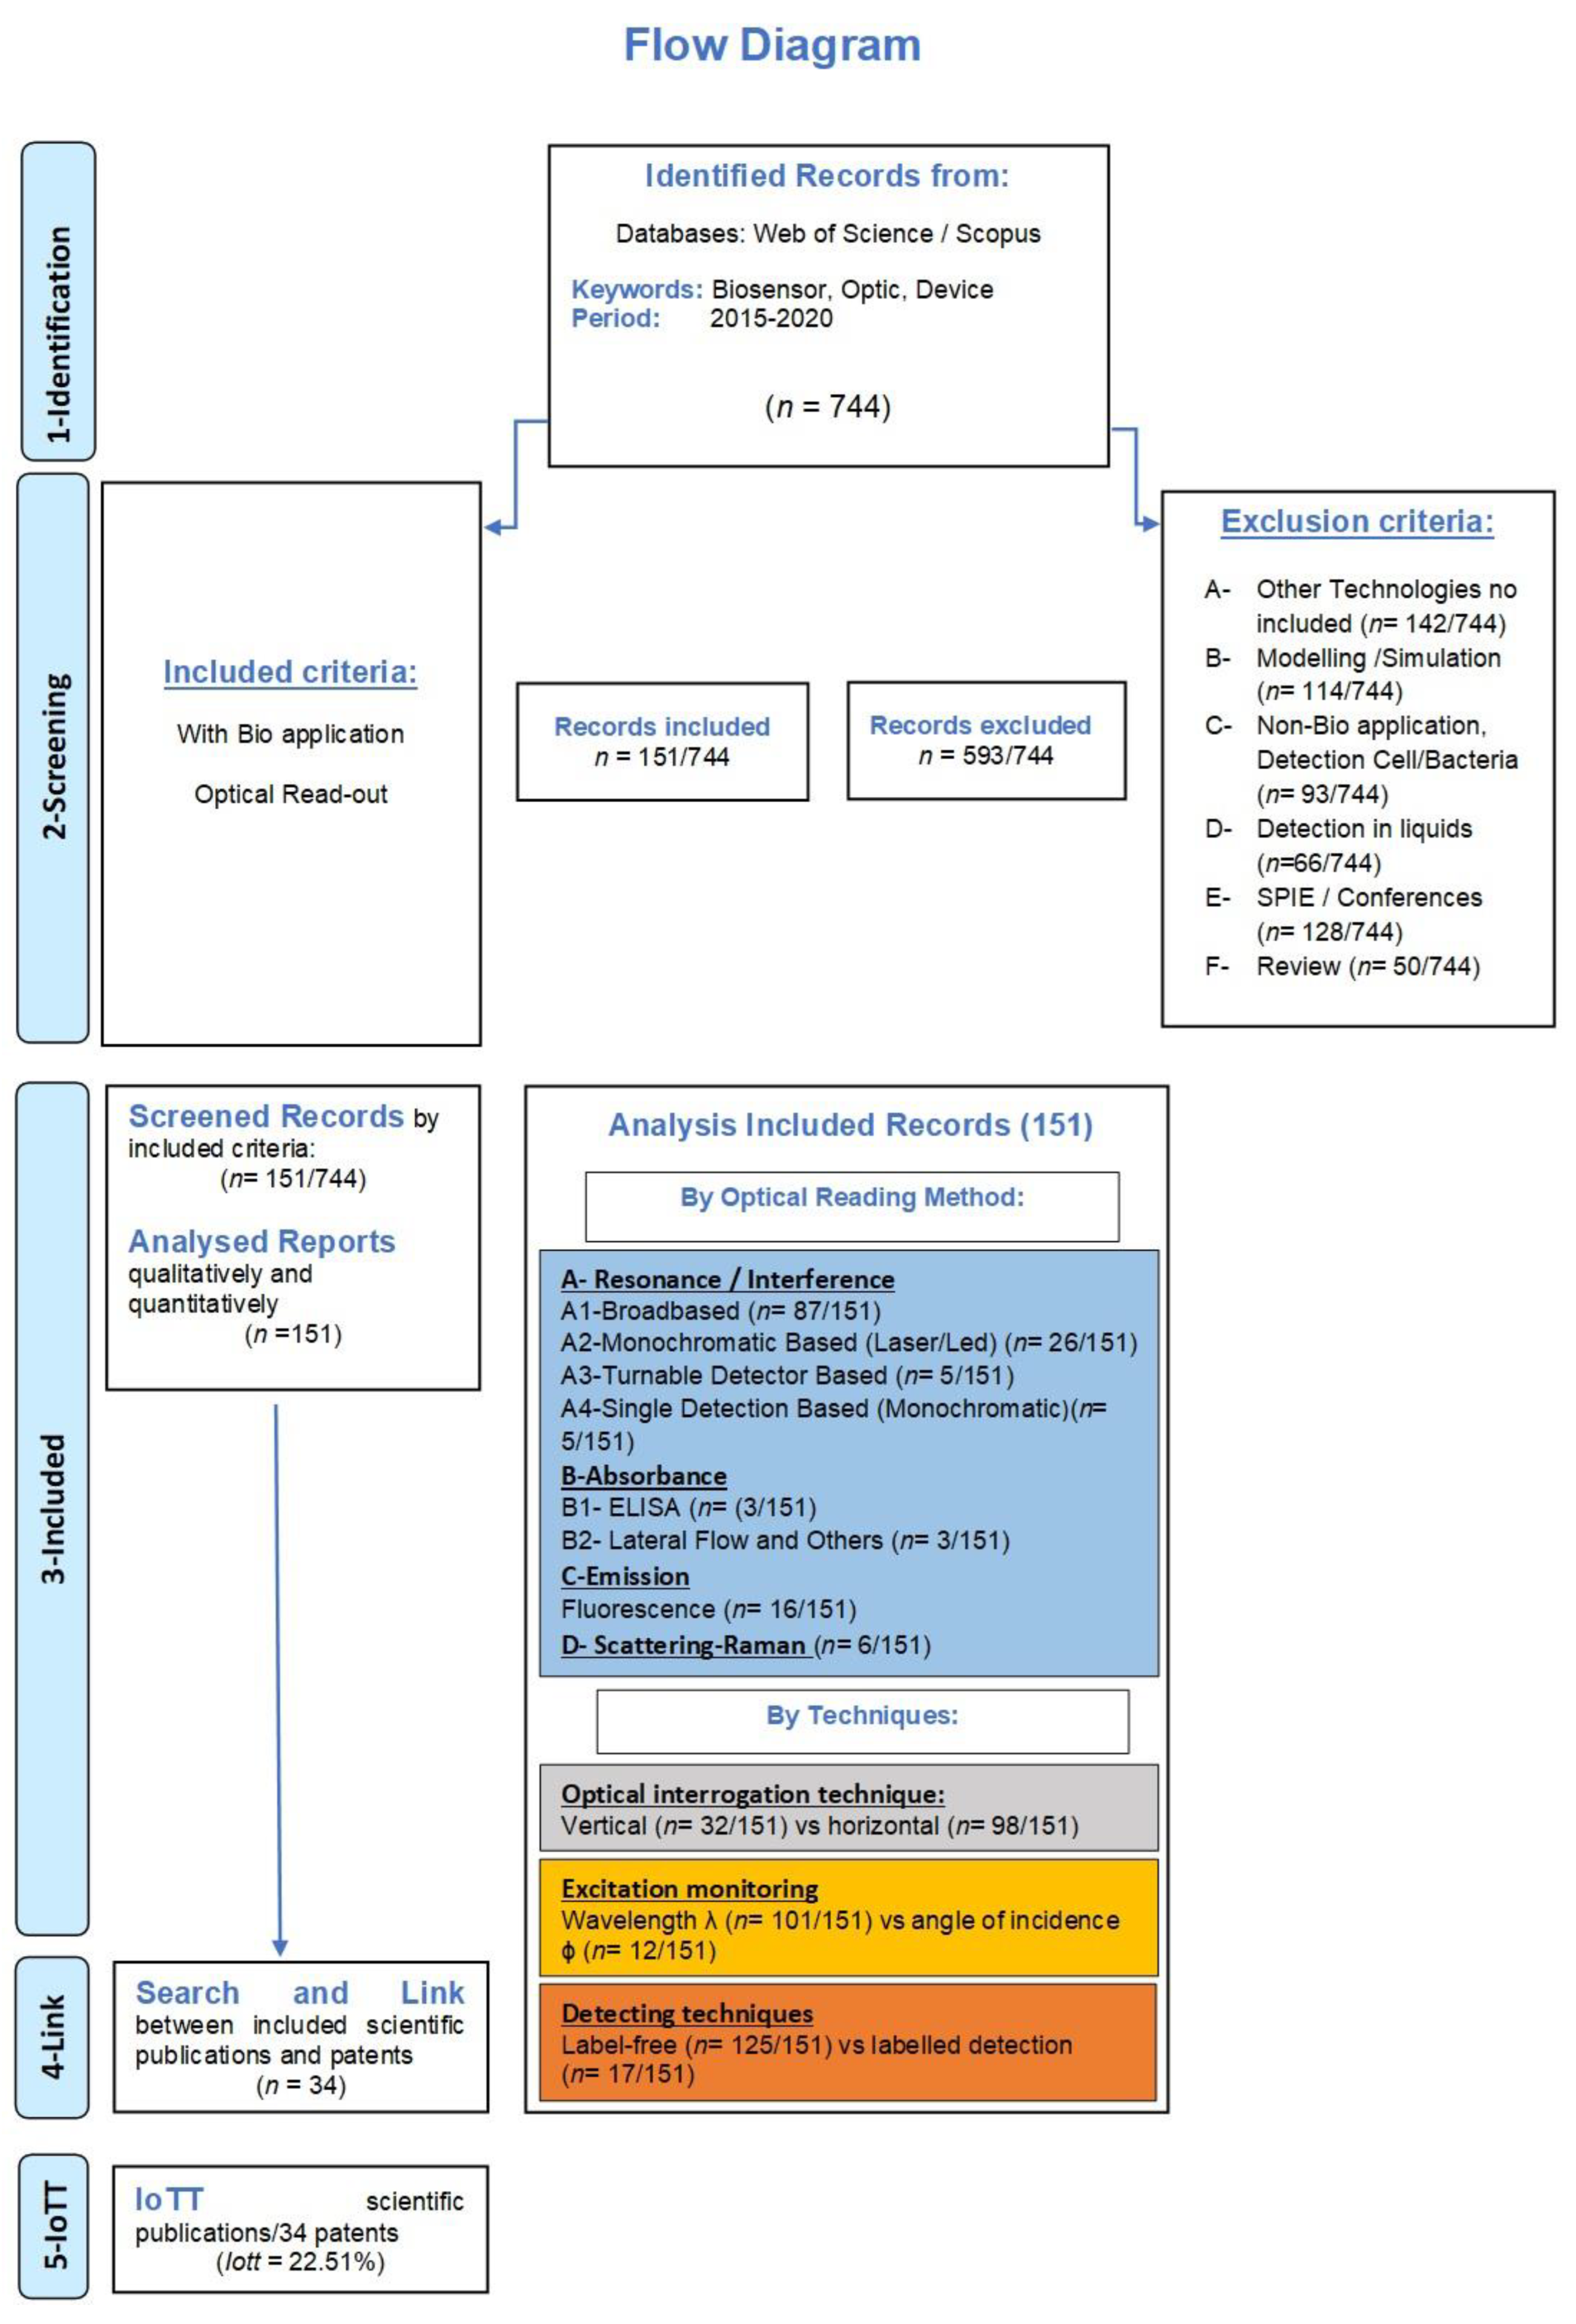
3. Results
3.1. Results of Scientific Publications
Classification of the Scientific Articles

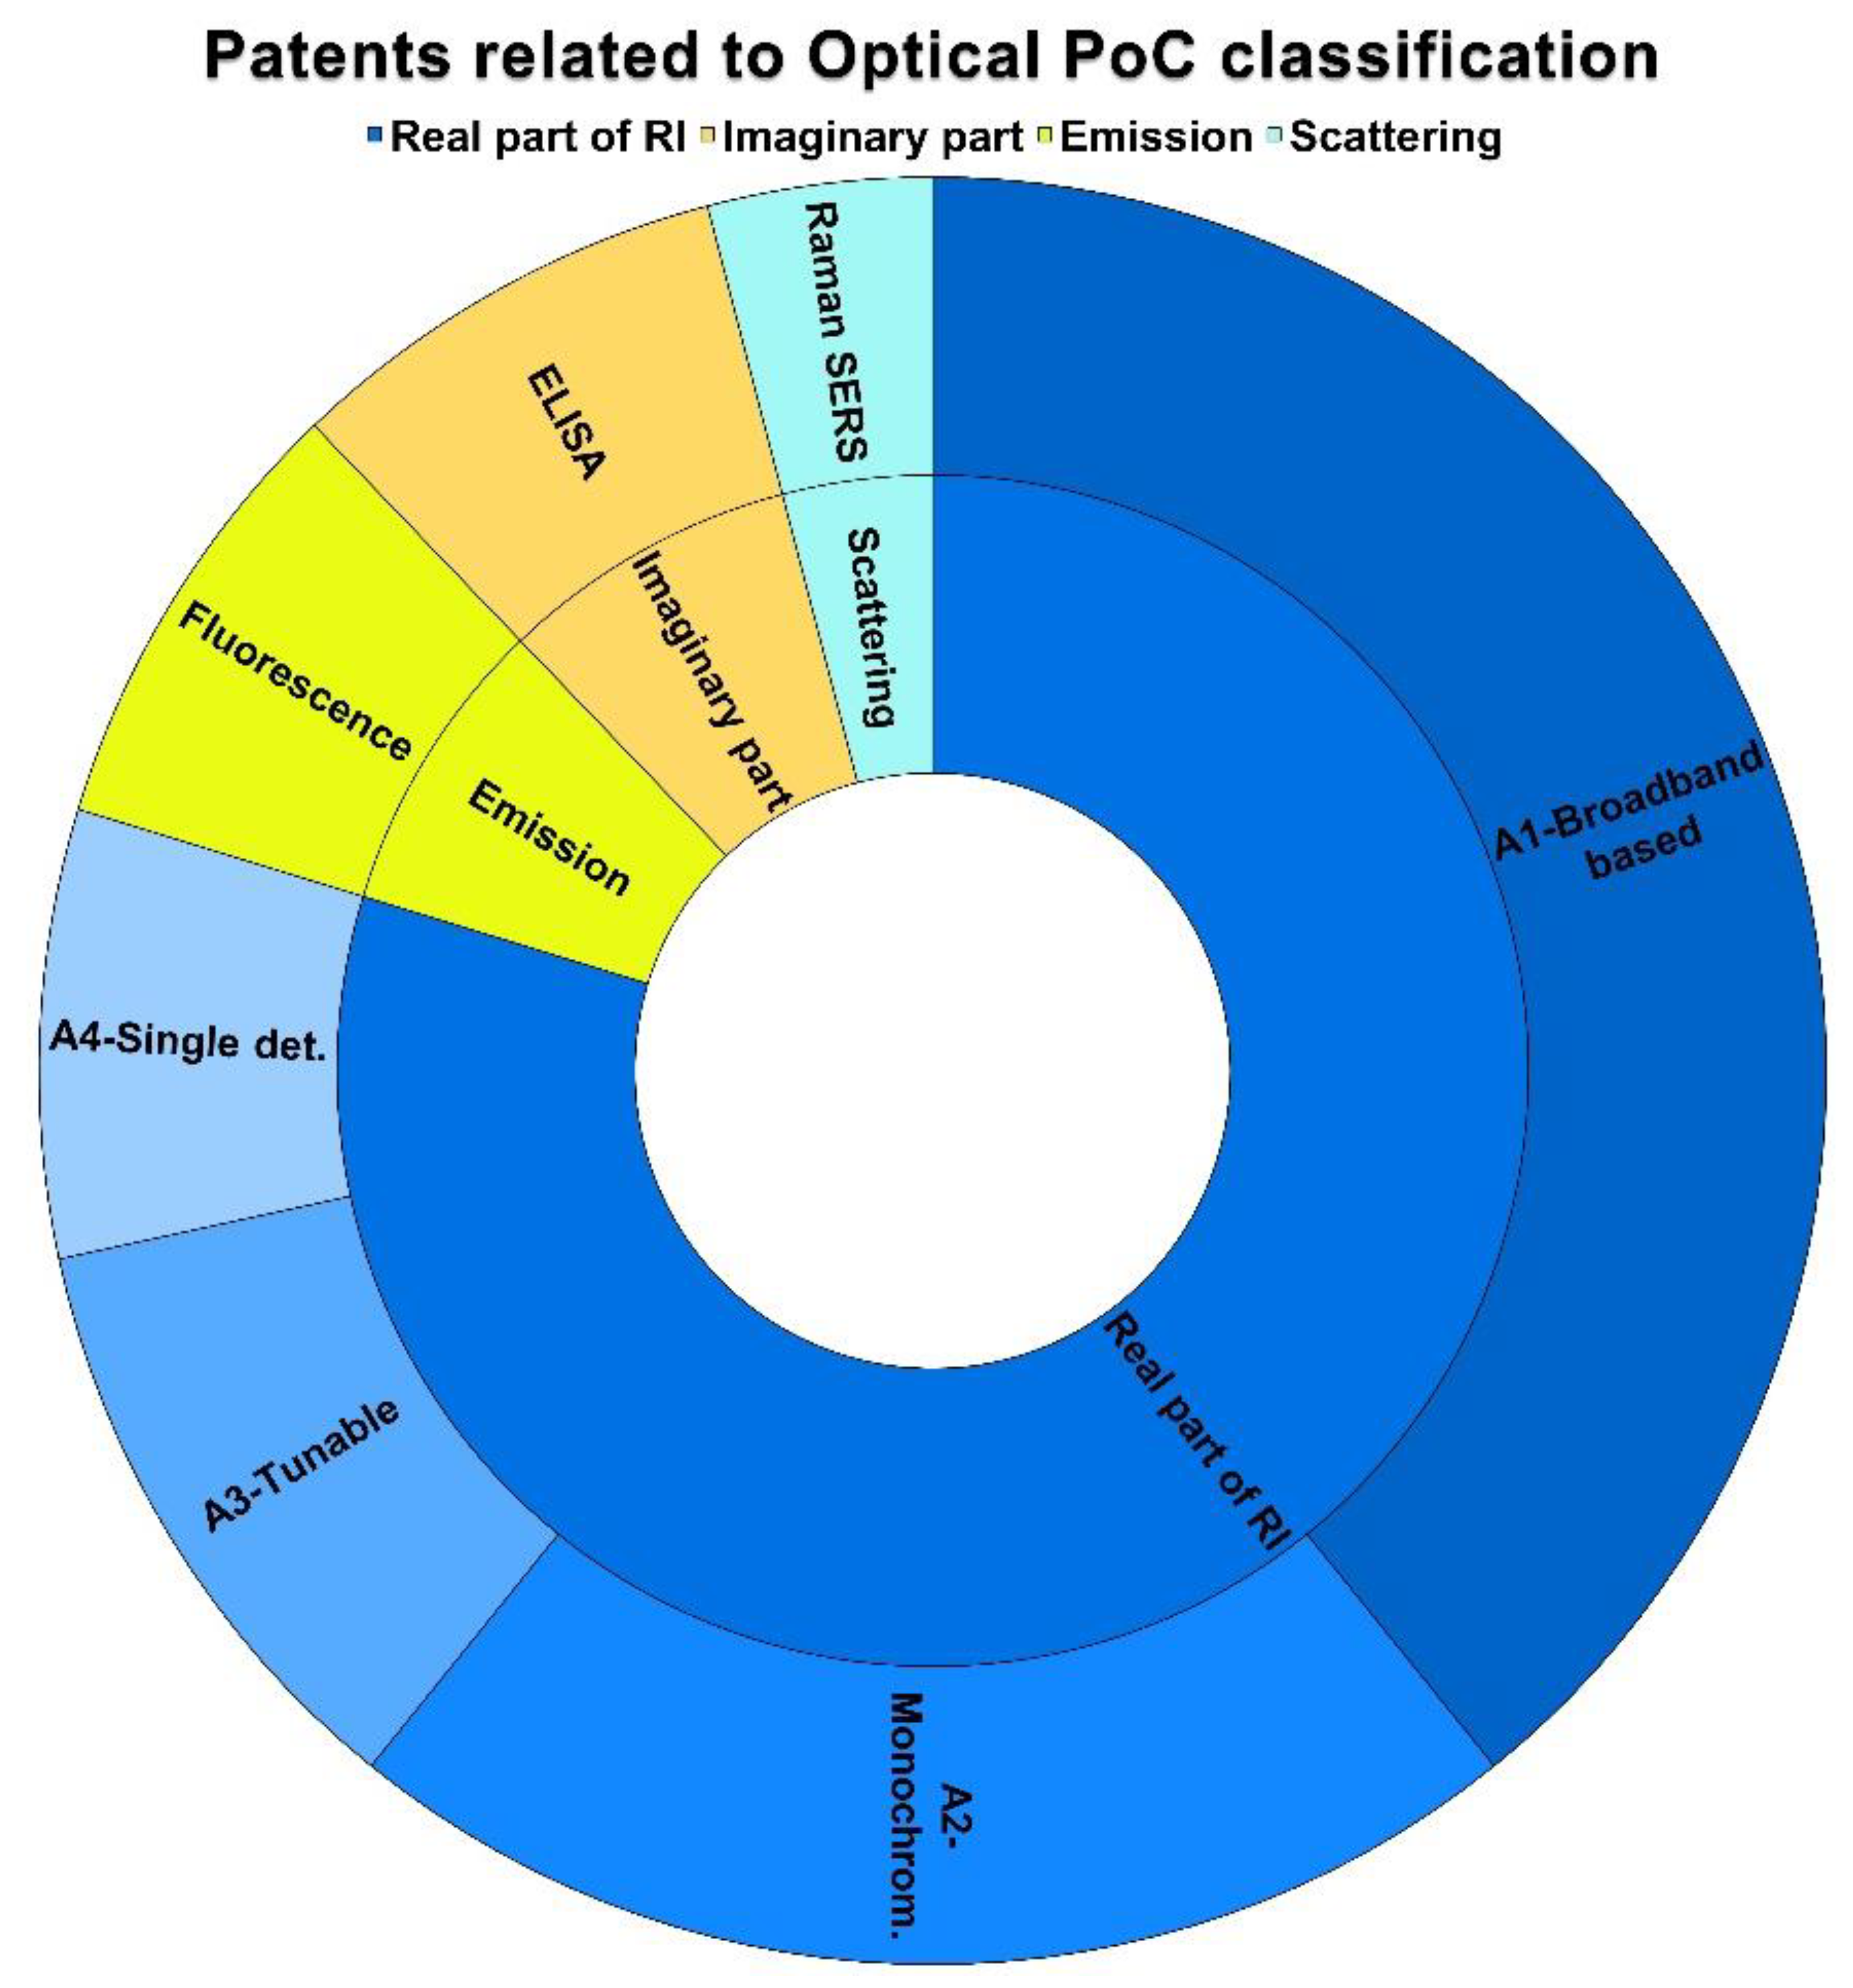
3.2. Results of Patents
3.3. IoTT Result
4. Discussion
5. Conclusions
Supplementary Materials
Author Contributions
Funding
Institutional Review Board Statement
Informed Consent Statement
Data Availability Statement
Acknowledgments
Conflicts of Interest
References
- Chen, Y.T.; Lee, Y.C.; Lai, Y.H.; Lim, J.C.; Huang, N.T.; Lin, C.T.; Huang, J.J. Review of Integrated Optical Biosensors for Point-Of-Care Applications. Biosensors 2020, 10, 209. [Google Scholar] [CrossRef] [PubMed]
- Ligler, F.S.; Gooding, J.J. Lighting Up Biosensors: Now and the Decade to Come. Anal. Chem. 2019, 91, 8732–8738. [Google Scholar] [CrossRef]
- Perez-Molina, E.; Loizides, F. Novel Data Structure and Visualization Tool for Studying Technology Evolution Based on Patent Information: The DTFootprint and the TechSpectrogram. World Pat. Inf. 2021, 64, 102009. [Google Scholar] [CrossRef]
- Dziallas, M.; Blind, K. Innovation Indicators throughout the Innovation Process: An Extensive Literature Analysis. Technovation 2019, 80–81, 3–29. [Google Scholar] [CrossRef]
- Martino, J.P. A Review of Selected Recent Advances in Technological Forecasting. Technol. Forecast. Soc. Change 2003, 70, 719–733. [Google Scholar] [CrossRef]
- Mann, D.L. Better Technology Forecasting Using Systematic Innovation Methods. Technol. Forecast. Soc. Change 2003, 70, 779–795. [Google Scholar] [CrossRef]
- Holgado, M.; Sanza, F.J.; López, A.; Lavín, Á.; Casquel, R.; Laguna, M.F. Description of an Advantageous Optical Label-Free Biosensing Interferometric Read-out Method to Measure Biological Species. Sensors 2014, 14, 3675–3689. [Google Scholar] [CrossRef]
- Gerbin, A.; Drnovsek, M. Determinants and Public Policy Implications of Academic-Industry Knowledge Transfer in Life Sciences: A Review and a Conceptual Framework. J. Technol. Transf. 2016, 41, 979–1076. [Google Scholar] [CrossRef]
- Azagra-Caro, J.M.; González-Salmerón, L.; Marques, P. Fiction Lagging behind or Non-Fiction Defending the Indefensible? University–Industry (et Al.) Interaction in Science Fiction. J. Technol. Transf. 2020, 46, 1889–1916. [Google Scholar] [CrossRef]
- Vashist, S.K.; Luppa, P.B.; Yeo, L.Y.; Ozcan, A.; Luong, J.H.T. Emerging Technologies for Next-Generation Point-of-Care Testing. Trends Biotechnol. 2015, 33, 692–705. [Google Scholar] [CrossRef]
- Pierce, M.C.; Weigum, S.E.; Jaslove, J.M.; Richards-Kortum, R.; Tkaczyk, T.S. Optical Systems for Point-of-Care Diagnostic Instrumentation: Analysis of Imaging Performance and Cost. Ann. Biomed. Eng. 2014, 42, 231–240. [Google Scholar] [CrossRef] [PubMed] [Green Version]
- Obahiagbon, U.; Blain Christen, J.M. Considerations for Low-Cost Reader Design and Label Selection for Lateral Flow Assays. In Proceedings of the 2018 IEEE Biomedical Circuits and Systems Conference, BioCAS 2018—Proceedings, Cleveland, OH, USA, 17–19 October 2018; Institute of Electrical and Electronics Engineers Inc.: Piscataway, NJ, USA, 2018. [Google Scholar]
- Otoo, J.A.; Schlappi, T.S. Reassured Multiplex Diagnostics: A Critical Review and Forecast. Biosensors 2022, 12, 124. [Google Scholar] [CrossRef] [PubMed]
- Hussain, S.; Zhao, H.; Zhou, L.; Zhou, X.; Iyer, P.K.; Lv, F.; Liu, L.; Wang, S. An Optoelectronic Device for Rapid Monitoring of Creatine Kinase Using Cationic Conjugated Polyelectrolyte. Adv. Mater. Technol. 2019, 4, 1900361. [Google Scholar] [CrossRef]
- Asha, A.; Vma, M.; Neveditha, M.; Srinivas, G.S.; Shashank, R.; Narayan, K. Modeling and Analysis of ARROW Waveguide for Point of Care Diagnostic Application. In Proceedings of the 2nd International Conference on Trends in Electronics and Informatics, ICOEI 2018, Tirunelveli, India, 11–12 May 2018; Institute of Electrical and Electronics Engineers Inc.: Piscataway, NJ, USA, 2018; pp. 951–954. [Google Scholar]
- Qin, W.; Wang, K.; Xiao, K.; Hou, Y.; Lu, W.; Xu, H.; Wo, Y.; Feng, S.; Cui, D. Carcinoembryonic Antigen Detection with “Handing”-Controlled Fluorescence Spectroscopy Using a Color Matrix for Point-of-Care Applications. Biosens. Bioelectron. 2017, 90, 508–515. [Google Scholar] [CrossRef]
- Zarei, M. Infectious Pathogens Meet Point-of-Care Diagnostics. Biosens. Bioelectron. 2018, 106, 193–203. [Google Scholar] [CrossRef]
- Leary, J.F. Design of Point-of-Care (POC) Microfluidic Medical Diagnostic Devices. In Proceedings of the Microfluidics, BioMEMS, and Medical Microsystems XVI, San Francisco, CA, USA, 27–29 January 2018; Gray, B.L., Becker, H., Eds.; SPIE: Bellingham, WA, USA, 2018; p. 30. [Google Scholar]
- Berner, M.; Hilbig, U.; Schubert, M.B.; Gauglitz, G. Laser-Induced Fluorescence Detection Platform for Point-of-Care Testing. Meas. Sci. Technol. 2017, 28, 085701. [Google Scholar] [CrossRef]
- Rajan, N.K.; Rajauria, S.; Ray, T.; Pennathur, S.; Cleland, A.N. A Simple Microfluidic Aggregation Analyzer for the Specific, Sensitive and Multiplexed Quantification of Proteins in a Serum Environment. Biosens. Bioelectron. 2016, 77, 1062–1069. [Google Scholar] [CrossRef] [Green Version]
- Hong, J.; Sung, G.Y. Screening for Kidney Malfunction Using Injection Moulded Plastic Urinalysis Cartridge. Biochip J. 2016, 10, 111–117. [Google Scholar] [CrossRef]
- Jagannadh, V.K.; Srinivasan, R.; Gorthi, S.S. A Semi-Automated, Field-Portable Microscopy Platform for Clinical Diagnostic Applications. AIP Adv. 2015, 5, 084902. [Google Scholar] [CrossRef] [Green Version]
- Leary, J.F. Design of Portable Ultraminiature Flow Cytometers for Medical Diagnostics. In Proceedings of the Imaging, Manipulation, and Analysis of Biomolecules, Cells, and Tissues XVI, San Francisco, CA, USA, 29–31 January 2018; Farkas, D.L., Nicolau, D.V., Leif, R.C., Eds.; SPIE: Bellingham, WA, USA, 2018; p. 29. [Google Scholar]
- Maigler, M.V.; Holgado, M.; Laguna, M.F.; Sanza, F.J.; Santamaria, B.; Lavin, A.; Espinosa, R.L. A New Device Based on Interferometric Optical Detection Method for Label-Free Screening of C-Reactive Protein. IEEE Trans. Instrum. Meas. 2018, 68, 3193–3199. [Google Scholar] [CrossRef]
- Craw, P.; Mackay, R.E.; Naveenathayalan, A.; Hudson, C.; Branavan, M.; Sadiq, S.T.; Balachandran, W. A Simple, Low-Cost Platform for Real-Time Isothermal Nucleic Acid Amplification. Sensors 2015, 15, 23418–23430. [Google Scholar] [CrossRef] [PubMed] [Green Version]
- Yang, Y.; Gu, Y.; Ge, S.; Tang, Z.; Qiu, X. Development of a Quantifiable Optical Reader for Lateral Flow Immunoassay. In Proceedings of the Proceedings—2015 8th International Conference on BioMedical Engineering and Informatics, BMEI 2015, Shenyang, China, 14–16 October 2015; IEEE: Piscataway, NJ, USA, 2016; pp. 344–349. [Google Scholar]
- Lertvachirapaiboon, C.; Baba, A.; Shinbo, K.; Kato, K. A Smartphone-Based Surface Plasmon Resonance Platform. Anal. Methods 2018, 10, 4732–4740. [Google Scholar] [CrossRef]
- Chin, C.D.; Linder, V.; Sia, S.K. Commercialization of Microfluidic Point-of-Care Diagnostic Devices. Lab Chip 2012, 12, 2118–2134. [Google Scholar] [CrossRef]
- Point-of-Care Diagnostics Market. Grand View Research´s Report. Available online: https://www.grandviewresearch.com/info/about-us (accessed on 19 November 2022).
- Giannetti, A.; Adinolfi, B.; Berneschi, S.; Berrettoni, C.; Chiavaioli, F.; Tombelli, S.; Trono, C.; Baldini, F. Optical Sensing in POCT: The Contribution of the Institute of Applied Physics of the Italian CNR. LaboratoriumsMedizin 2017, 41, 251–256. [Google Scholar] [CrossRef]
- Understanding Industrial Property. Available online: https://www.wipo.int/edocs/pubdocs/en/wipo_pub_895_2016.pdf (accessed on 22 September 2010).
- Espinosa, R.L.; Laguna, M.F.; Fernández, F.; Santamaria, B.; Sanza, F.J.; Maigler, M.V.; Álvarez-Millán, J.J.; Canalejas-Tejero, V.; Holgado, M. A Proof-of-Concept of Label-Free Biosensing System for Food Allergy Diagnostics in Biophotonic Sensing Cells: Performance Comparison with ImmunoCAP. Sensors 2018, 18, 2686. [Google Scholar] [CrossRef] [PubMed] [Green Version]
- Holgado, M.; Barrios, C.A.; Ortega, F.J.; Sanza, F.J.; Casquel, R.; Laguna, M.F.; Bañuls, M.J.; López-Romero, D.; Puchades, R.; Maquieira, A. Label-Free Biosensing by Means of Periodic Lattices of High Aspect Ratio SU-8 Nano-Pillars. Biosens. Bioelectron. 2010, 25, 2553–2558. [Google Scholar] [CrossRef]
- Holgado, M.; Maigler, M.V.; Santamaría, B.; Hernandez, A.L.; Lavín, A.; Laguna, M.F.; Sanza, F.J.; Granados, D.; Casquel, R.; Portilla, J.; et al. Towards Reliable Optical Label-Free Point-of-Care (PoC) Biosensing Devices. Sens. Actuators B Chem. 2016, 236, 765–772. [Google Scholar] [CrossRef]
- Casquel, R. Biosensors Based on Vertically Interrogated Optofluidic Sensing Cells. Ph.D. Thesis, Universidad Politécnica de Madrid, Madrid, Spain, 2012. [Google Scholar]
- Santamaría, B. Development and Optimization of an Optical Label-Free Biosensor for Ocular Pathologies. Ph.D. Thesis, Universidad Politécnica de Madrid, Madrid, Spain, 2020. [Google Scholar]
- Homola, J.; Yee, S.S.; Gauglitz, G. Surface Plasmon Resonance Sensors: Review. Sens. Actuators B Chem. 1999, 54, 3–15. [Google Scholar] [CrossRef]
- Nguyen, H.H.; Park, J.; Kang, S.; Kim, M. Surface Plasmon Resonance: A Versatile Technique for Biosensor Applications. Sensors 2015, 15, 10481–10510. [Google Scholar] [CrossRef] [Green Version]
- Wild, D.; John, R.; Sheehan, C.; Binder, S.; He, J. David Wild Eds. The Immunoassay Handbook. Theory and Applications of Ligand Binding, ELISA and Related Techniques 2013 (3)—Copy; Newnes: London, UK, 2013; ISBN 9780080970370. [Google Scholar]
- Wu, C.W. S-Shaped Long Period Fiber Grating Glucose Concentration Biosensor Based on Immobilized Glucose Oxidase. Optik 2020, 203, 163960. [Google Scholar] [CrossRef]
- Wu, Y.; Zhang, Y.; Xu, Z.; Guo, X.; Yang, W.; Zhang, X.; Liao, Y.; Fan, M. A Portable Smartphone-Based System for the Detection of Blood Calcium Using Ratiometric Fluorescent Probes. Biosensors 2022, 12, 917. [Google Scholar] [CrossRef] [PubMed]
- Long, D.A. The Raman Effect: A Unified Treatment of the Theory of Raman Scattering by Molecules; Wiley: Chichester, UK, 2002; Volume 8, ISBN 0471490288. [Google Scholar]
- Jones, R.R.; Hooper, D.C.; Zhang, L.; Wolverson, D.; Valev, V.K. Raman Techniques: Fundamentals and Frontiers. Nanoscale Res. Lett. 2019, 14, 231. [Google Scholar] [CrossRef] [PubMed] [Green Version]
- Esposito, F.; Sansone, L.; Taddei, C.; Campopiano, S.; Giordano, M.; Iadicicco, A. Ultrasensitive Biosensor Based on Long Period Grating Coated with Polycarbonate-Graphene Oxide Multilayer. Sens. Actuators B Chem. 2018, 274, 517–526. [Google Scholar] [CrossRef]
- Willis, G.B.; Smith, T.W.; Shariff-Marco, S.; English, N. Overview of the Special Issue on Surveying the Hard-to-Reach. J. Off. Stat. 2014, 30, 171–176. [Google Scholar] [CrossRef] [Green Version]
- Page, M.J.; McKenzie, J.E.; Bossuyt, P.M.; Boutron, I.; Hoffmann, T.C.; Mulrow, C.D.; Shamseer, L.; Tetzlaff, J.M.; Akl, E.A.; Brennan, S.E.; et al. The PRISMA 2020 Statement: An Updated Guideline for Reporting Systematic Reviews. BMJ 2021, 372, n71. [Google Scholar] [CrossRef]
- Bogaerts, W.; Taillaert, D.; Luyssaert, B.; Dumon, P.; Campenhout, J.V.; Bienstman, P.; Thourhout, D.V.; Baets, R.; Wiaux, V.; Beckx, S. Basic Structures for Photonic Integrated Circuits in Silicon-on-Insulator. Opt. Express 2004, 12, 1583. [Google Scholar] [CrossRef]
- Zanchetta, G.; Lanfranco, R.; Giavazzi, F.; Bellini, T.; Buscaglia, M. Emerging Applications of Label-Free Optical Biosensors. Nanophotonics 2017, 6, 627–645. [Google Scholar] [CrossRef]
- Fang, Y. The Development of Label-Free Cellular Assays for Drug Discovery. Expert Opin. Drug Discov. 2011, 6, 1285–1298. [Google Scholar] [CrossRef]
- Casquel, R.; Holgado, M.; Laguna, M.F.; Hernández, A.L.; Santamaría, B.; Lavín, Á.; Tramarin, L.; Herreros, P. Engineering Vertically Interrogated Interferometric Sensors for Optical Label-Free Biosensing. Anal. Bioanal. Chem. 2020, 412, 3285–3297. [Google Scholar] [CrossRef] [Green Version]
- Tang, J.; Li, Z.; Xie, M.; Zhang, Y.; Long, W.; Long, S.; Wen, T.; Fang, Z.; Zhu, W.; Zheng, H.; et al. Optical Fiber Bio-Sensor for Phospholipase Using Liquid Crystal. Biosens. Bioelectron. 2020, 170, 112547. [Google Scholar] [CrossRef]
- Chiang, C.Y.; Huang, T.T.; Wang, C.H.; Huang, C.J.; Tsai, T.H.; Yu, S.N.; Chen, Y.T.; Hong, S.W.; Hsu, C.W.; Chang, T.C.; et al. Fiber Optic Nanogold-Linked Immunosorbent Assay for Rapid Detection of Procalcitonin at Femtomolar Concentration Level. Biosens. Bioelectron. 2020, 151, 111871. [Google Scholar] [CrossRef] [PubMed]
- Taib, M.; Tan, L.L.; Abd Karim, N.H.; Ta, G.C.; Heng, L.Y.; Khalid, B. Reflectance Aptasensor Based on Metal Salphen Label for Rapid and Facile Determination of Insulin. Talanta 2020, 207, 120321. [Google Scholar] [CrossRef] [PubMed]
- Sarwar, M.; Leichner, J.; Naja, G.M.; Li, C.Z. Smart-Phone, Paper-Based Fluorescent Sensor for Ultra-Low Inorganic Phosphate Detection in Environmental Samples. Microsyst. Nanoeng. 2019, 5, 56. [Google Scholar] [CrossRef] [PubMed] [Green Version]
- Guliy, O.I.; Velichko, N.S.; Fedonenko, Y.P.; Bunin, V.D. Use of an Electro-Optical Sensor and Phage Antibodies for Immunodetection of Herbaspirillum. Talanta 2019, 202, 362–368. [Google Scholar] [CrossRef]
- Alshammari, A.H.; Kirwa, A.; Dunbar, A.; Grell, M. Adaptive and Sensitive Fibre-Optic Fluorimetric Transducer for Air- and Water-Borne Analytes. Talanta 2019, 199, 40–45. [Google Scholar] [CrossRef] [PubMed]
- Surendran, V.; Chiulli, T.; Manoharan, S.; Knisley, S.; Packirisamy, M.; Chandrasekaran, A. Acoustofluidic Micromixing Enabled Hybrid Integrated Colorimetric Sensing, for Rapid Point-of-Care Measurement of Salivary Potassium. Biosensors 2019, 9, 73. [Google Scholar] [CrossRef] [Green Version]
- Lin, H.; Li, M.; Ding, L.; Huang, J. A Fiber Optic Biosensor Based on Hydrogel-Immobilized Enzyme Complex for Continuous Determination of Cholesterol and Glucose. Appl. Biochem. Biotechnol. 2019, 187, 1569–1580. [Google Scholar] [CrossRef]
- Song, D.; Yang, R.; Wang, H.; Fang, S.; Liu, Y.; Long, F.; Zhu, A. Development of Dual-Color Total Internal Reflection Fluorescence Biosensor for Simultaneous Quantitation of Two Small Molecules and Their Affinity Constants with Antibodies. Biosens. Bioelectron. 2019, 126, 824–830. [Google Scholar] [CrossRef]
- Yang, R.; Song, D.; Fang, S.; Liu, Y.; Zhou, X.; Long, F.; Zhu, A. Development of Novel Portable and Reusable Fiber Optical Chemiluminescent Biosensor and Its Application for Sensitive Detection of Microcystin-LR. Biosens. Bioelectron. 2018, 121, 27–33. [Google Scholar] [CrossRef]
- Wang, Q.; Wang, B.T. Surface Plasmon Resonance Biosensor Based on Graphene Oxide/Silver Coated Polymer Cladding Silica Fiber. Sens. Actuators B Chem. 2018, 275, 332–338. [Google Scholar] [CrossRef]
- Li, K.; Zhou, W.; Zeng, S. Optical Micro/Nanofiber-Based Localized Surface Plasmon Resonance Biosensors: Fiber Diameter Dependence. Sensors 2018, 18, 3295. [Google Scholar] [CrossRef] [PubMed] [Green Version]
- Semerádtová, A.; Štofik, M.; Neděla, O.; Staněk, O.; Slepička, P.; Kolská, Z.; Malý, J. A Simple Approach for Fabrication of Optical Affinity-Based Bioanalytical Microsystem on Polymeric PEN Foils. Colloids Surf. B Biointerfaces 2018, 165, 28–36. [Google Scholar] [CrossRef] [PubMed]
- Torelli, E.; Manzano, M.; Srivastava, S.K.; Marks, R.S. DNA Origami Nanorobot Fiber Optic Genosensor to TMV. Biosens. Bioelectron. 2018, 99, 209–215. [Google Scholar] [CrossRef] [PubMed] [Green Version]
- Liu, Y. Application of Fiber Optic Biosensor in Detection of Sports Analeptic. Int. J. Bioautom. 2018, 22, 301–314. [Google Scholar] [CrossRef] [Green Version]
- Dong, T.; Pires, N.M.M. Immunodetection of Salivary Biomarkers by an Optical Microfluidic Biosensor with Polyethylenimine-Modified Polythiophene-C70 Organic Photodetectors. Biosens. Bioelectron. 2017, 94, 321–327. [Google Scholar] [CrossRef]
- Li, X.; Zhang, Y.; Xue, B.; Kong, X.; Liu, X.; Tu, L.; Chang, Y.; Zhang, H. A SERS Nano-Tag-Based Fiber-Optic Strategy for in Situ Immunoassay in Unprocessed Whole Blood. Biosens. Bioelectron. 2017, 92, 517–522. [Google Scholar] [CrossRef]
- Vafapour, Z.; Keshavarz, A.; Ghahraloud, H. The Potential of Terahertz Sensing for Cancer Diagnosis. Heliyon 2020, 6, e05623. [Google Scholar] [CrossRef]
- Nair, A.M.; Dhawangale, A.; Chandra, S.; Shekhawat, L.K.; Rathore, A.S.; Mukherji, S. Polymer-Coated Fiber Optic Sensor as a Process Analytical Tool for Biopharmaceutical Impurity Detection. IEEE Trans. Instrum. Meas. 2020, 69, 7666–7674. [Google Scholar] [CrossRef]
- Yuan, H.; Ji, W.; Chu, S.; Liu, Q.; Guang, J.; Sun, G.; Zhang, Y.; Han, X.; Masson, J.F.; Peng, W. Au Nanoparticles as Label-Free Competitive Reporters for Sensitivity Enhanced Fiber-Optic SPR Heparin Sensor. Biosens. Bioelectron. 2020, 154, 112039. [Google Scholar] [CrossRef]
- Kumar, S.; Singh, R.; Zhu, G.; Yang, Q.; Zhang, X.; Cheng, S.; Zhang, B.; Kaushik, B.K.; Liu, F.Z. Development of Uric Acid Biosensor Using Gold Nanoparticles and Graphene Oxide Functionalized Micro-Ball Fiber Sensor Probe. IEEE Trans. Nanobiosci. 2020, 19, 173–182. [Google Scholar] [CrossRef]
- Cennamo, N.; D’Agostino, G.; Arcadio, F.; Perri, C.; Porto, G.; Biasiolo, A.; Zeni, L. Measurement of MIPs Responses Deposited on Two SPR-POF Sensors Realized by Different Photoresist Buffer Layers. IEEE Trans. Instrum. Meas. 2020, 69, 1464–1473. [Google Scholar] [CrossRef]
- Panda, A.; Pukhrambam, P.D.; Keiser, G. Performance Analysis of Graphene-Based Surface Plasmon Resonance Biosensor for Blood Glucose and Gas Detection. Appl. Phys. A Mater. Sci. Process. 2020, 126, 153. [Google Scholar] [CrossRef]
- Vicente, A.; Santano, D.; Zubiate, P.; Urrutia, A.; Del Villar, I.; Zamarreño, C.R. Lossy Mode Resonance Sensors Based on Nanocoated Multimode-Coreless-Multimode Fibre. Sens. Actuators B Chem. 2020, 304, 126955. [Google Scholar] [CrossRef]
- Tong, K.; Cai, Z.; Wang, J.; Liu, Y. D-Type Photonic Crystal Fiber Sensor Based on Metal Nanowire Array. Optik 2020, 218, 165010. [Google Scholar] [CrossRef]
- Kadhim, R.A.; Yuan, L.; Xu, H.; Wu, J.; Wang, Z. Highly Sensitive D-Shaped Optical Fiber Surface Plasmon Resonance Refractive Index Sensor Based on Ag-α-Fe2O3Grating. IEEE Sens. J. 2020, 20, 9816–9824. [Google Scholar] [CrossRef]
- Puneeth, S.B.; Puranam, S.A.; Goel, S. 3-D Printed Integrated and Automated Electro-Microfluidic Viscometer for Biochemical Applications. IEEE Trans. Instrum. Meas. 2019, 68, 2648–2655. [Google Scholar] [CrossRef]
- Amoosoltani, N.; Yasrebi, N.; Farmani, A.; Zarifkar, A. A Plasmonic Nano-Biosensor Based on Two Consecutive Disk Resonators and Unidirectional Reflectionless Propagation Effect. IEEE Sens. J. 2020, 20, 9097–9104. [Google Scholar] [CrossRef]
- Vikas; Gupta, S.; Tejavath, K.; Verma, R.K. Urea Detection Using Bio-Synthesized Gold Nanoparticles: An SPR/LSPR Based Sensing Approach Realized on Optical Fiber. Opt. Quantum Electron. 2020, 52, 278. [Google Scholar] [CrossRef]
- Wang, Q.; Jing, J.Y.; Wang, X.Z.; Niu, L.Y.; Zhao, W.M. A D-Shaped Fiber Long-Range Surface Plasmon Resonance Sensor with High Q-Factor and Temperature Self-Compensation. IEEE Trans. Instrum. Meas. 2020, 69, 2218–2224. [Google Scholar] [CrossRef]
- Chen, S.; Liu, Y.; Yu, Q.; Peng, W. Microcapillary-Based Integrated LSPR Device for Refractive Index Detection and Biosensing. J. Light. Technol. 2020, 38, 2485–2492. [Google Scholar] [CrossRef]
- Śmietana, M.; Koba, M.; Sezemsky, P.; Szot-Karpińska, K.; Burnat, D.; Stranak, V.; Niedziółka-Jönsson, J.; Bogdanowicz, R. Simultaneous Optical and Electrochemical Label-Free Biosensing with ITO-Coated Lossy-Mode Resonance Sensor. Biosens. Bioelectron. 2020, 154, 112050. [Google Scholar] [CrossRef] [PubMed]
- Desmet, C.; Vindas, K.; Meza, R.A.; Garrigue, P.; Voci, S.; Sojic, N.; Maziz, A.; Courson, R.; Malaquin, L.; Leichle, T.; et al. Multiplexed Remote SPR Detection of Biological Interactions through Optical Fiber Bundles. Sensors 2020, 20, 511. [Google Scholar] [CrossRef] [PubMed] [Green Version]
- Niu, L.Y.; Wang, Q.; Jing, J.Y.; Zhao, W.M. Sensitivity Enhanced D-Type Large-Core Fiber SPR Sensor Based on Gold Nanoparticle/Au Film Co-Modification. Opt. Commun. 2019, 450, 287–295. [Google Scholar] [CrossRef]
- Kim, H.M.; Park, J.H.; Lee, S.K. Fiber Optic Sensor Based on ZnO Nanowires Decorated by Au Nanoparticles for Improved Plasmonic Biosensor. Sci. Rep. 2019, 9, 15605. [Google Scholar] [CrossRef] [PubMed] [Green Version]
- Fernández-Gavela, A.; Herranz, S.; Chocarro, B.; Falke, F.; Schreuder, E.; Leeuwis, H.; Heideman, R.G.; Lechuga, L.M. Full Integration of Photonic Nanoimmunosensors in Portable Platforms for On-Line Monitoring of Ocean Pollutants. Sens. Actuators B Chem. 2019, 297, 126758. [Google Scholar] [CrossRef]
- Benmerkhi, A.; Bouchemat, M.; Bouchemat, T. Computational Study of Photonic Crystal Resonator for Biosensor Application. Frequenz 2019, 73, 307–316. [Google Scholar] [CrossRef]
- Lobry, M.; Lahem, D.; Loyez, M.; Debliquy, M.; Chah, K.; David, M.; Caucheteur, C. Non-Enzymatic D-Glucose Plasmonic Optical Fiber Grating Biosensor. Biosens. Bioelectron. 2019, 142, 111506. [Google Scholar] [CrossRef] [Green Version]
- Mohammed, N.A.; Hamed, M.M.; Khalaf, A.A.M.; Alsayyari, A.; El-Rabaie, S. High-Sensitivity Ultra-Quality Factor and Remarkable Compact Blood Components Biomedical Sensor Based on Nanocavity Coupled Photonic Crystal. Results Phys. 2019, 14, 102478. [Google Scholar] [CrossRef]
- Kumar, S.; Singh, R.; Kaushik, B.K.; Chen, N.K.; Yang, Q.S.; Zhang, X. Lspr-Based Cholesterol Biosensor Using Hollow Core Fiber Structure. IEEE Sens. J. 2019, 19, 7399–7406. [Google Scholar] [CrossRef]
- Wang, Q.; Jing, J.Y.; Wang, B.T. Highly Sensitive SPR Biosensor Based on Graphene Oxide and Staphylococcal Protein A Co-Modified TFBG for Human IgG Detection. IEEE Trans. Instrum. Meas. 2018, 68, 3350–3357. [Google Scholar] [CrossRef]
- Rakhshani, M.R. Fano Resonances Based on Plasmonic Square Resonator with High Figure of Merits and Its Application in Glucose Concentrations Sensing. Opt. Quantum Electron. 2019, 51, 287. [Google Scholar] [CrossRef]
- Liu, K.; Zhang, J.; Jiang, J.; Xu, T.; Wang, S.; Chang, P.; Zhang, Z.; Ma, J.; Liu, T. MoSe2-Au Based Sensitivity Enhanced Optical Fiber Surface Plasmon Resonance Biosensor for Detection of Goat-Anti-Rabbit IgG. IEEE Access 2020, 8, 660–668. [Google Scholar] [CrossRef]
- Yang, W.; Yu, J.; Xi, X.; Sun, Y.; Shen, Y.; Yue, W.; Zhang, C.; Jiang, S. Preparation of Graphene/ITO Nanorod Metamaterial/u-Bent-Annealing Fiber Sensor and DNA Biomolecule Detection. Nanomaterials 2019, 9, 1154. [Google Scholar] [CrossRef] [PubMed] [Green Version]
- Zhang, Y.J.; Hsu, J.C.; Tsao, J.H.; Sun, Y.S. Fabrication of a Bare Optical Fiber-Based Biosensor. Micromachines 2019, 10, 522. [Google Scholar] [CrossRef] [PubMed] [Green Version]
- Elsherif, M.; Hassan, M.U.; Yetisen, A.K.; Butt, H. Hydrogel Optical Fibers for Continuous Glucose Monitoring. Biosens. Bioelectron. 2019, 137, 25–32. [Google Scholar] [CrossRef]
- Zhou, L.; Liu, C.; Sun, Z.; Mao, H.; Zhang, L.; Yu, X.; Zhao, J.; Chen, X. Black Phosphorus Based Fiber Optic Biosensor for Ultrasensitive Cancer Diagnosis. Biosens. Bioelectron. 2019, 137, 140–147. [Google Scholar] [CrossRef]
- Theint, H.T.; Walsh, J.E.; Wong, S.T.; Von, K.; Shitan, M. Development of an Optical Biosensor for the Detection of Trypanosoma Evansi and Plasmodium Berghei. Spectrochim. Acta Part A Mol. Biomol. Spectrosc. 2019, 218, 348–358. [Google Scholar] [CrossRef] [PubMed]
- Allsop, T.D.P.; Neal, R.; Wang, C.; Nagel, D.A.; Hine, A.V.; Culverhouse, P.; Ania Castañón, J.D.; Webb, D.J.; Scarano, S.; Minunni, M. An Ultra-Sensitive Aptasensor on Optical Fibre for the Direct Detection of Bisphenol A. Biosens. Bioelectron. 2019, 135, 102–110. [Google Scholar] [CrossRef]
- Sadani, K.; Nag, P.; Mukherji, S. LSPR Based Optical Fiber Sensor with Chitosan Capped Gold Nanoparticles on BSA for Trace Detection of Hg (II) in Water, Soil and Food Samples. Biosens. Bioelectron. 2019, 134, 90–96. [Google Scholar] [CrossRef]
- Lao, J.; Han, L.; Wu, Z.; Zhang, X.; Huang, Y.; Tang, Y.; Guo, T. Gold Nanoparticle-Functionalized Surface Plasmon Resonance Optical Fiber Biosensor: In Situ Detection of Thrombin with 1 N·M Detection Limit. J. Light. Technol. 2019, 37, 2748–2755. [Google Scholar] [CrossRef]
- Zhang, X.; Liu, B.; Zhang, H.; Song, B.; Wu, J.; Duan, S. Label-Free Detection of DNA Hybridization Utilizing. J. Light. Technol. 2019, 37, 2762–2767. [Google Scholar] [CrossRef]
- Chen, X.; Nan, Y.; Ma, X.; Liu, H.; Liu, W.; Shi, L.; Guo, T. In-Situ Detection of Small Biomolecule Interactions Using a Plasmonic Tilted Fiber Grating Sensor. J. Light. Technol. 2019, 37, 2792–2799. [Google Scholar] [CrossRef]
- Liu, Y.; Li, P.; Zhang, N.; Chen, S.; Liu, Z.; Guang, J. A Compact Biosensor for Binding Kinetics Analysis of Protein-Protein Interaction. IEEE Sens. J. 2019, 19, 11955–11960. [Google Scholar] [CrossRef]
- Natesan, A.; Kuppusamy, P.G.; Gopal, T.R.; Dhasarathan, V.; Aly, A.H. Tricore Photonic Crystal Fibre Based Refractive Index Sensor for Glucose Detection. IET Optoelectron. 2019, 13, 118–123. [Google Scholar] [CrossRef]
- Kaushik, S.; Tiwari, U.K.; Deep, A.; Sinha, R.K. Two-Dimensional Transition Metal Dichalcogenides Assisted Biofunctionalized Optical Fiber SPR Biosensor for Efficient and Rapid Detection of Bovine Serum Albumin. Sci. Rep. 2019, 9, 6987. [Google Scholar] [CrossRef] [Green Version]
- Zeininger, L.; Weyandt, E.; Savagatrup, S.; Harvey, K.S.; Zhang, Q.; Zhao, Y.; Swager, T.M. Waveguide-Based Chemo- and Biosensors: Complex Emulsions for the Detection of Caffeine and Proteins. Lab Chip 2019, 19, 1327–1331. [Google Scholar] [CrossRef] [Green Version]
- Dash, S.P.; Patnaik, S.K.; Tripathy, S.K. Investigation of a Low Cost Tapered Plastic Fiber Optic Biosensor Based on Manipulation of Colloidal Gold Nanoparticles. Opt. Commun. 2019, 437, 388–391. [Google Scholar] [CrossRef]
- Sreekanth, K.V.; Sreejith, S.; Alapan, Y.; Sitti, M.; Lim, C.T.; Singh, R. Microfluidics Integrated Lithography-Free Nanophotonic Biosensor for the Detection of Small Molecules. Adv. Opt. Mater. 2019, 7, 1801313. [Google Scholar] [CrossRef]
- Manoharan, H.; Kalita, P.; Gupta, S.; Sai, V.V.R. Plasmonic Biosensors for Bacterial Endotoxin Detection on Biomimetic C-18 Supported Fiber Optic Probes. Biosens. Bioelectron. 2019, 129, 79–86. [Google Scholar] [CrossRef] [PubMed]
- Kamuri, M.F.; Abidin, Z.Z.; Yaacob, M.H.; Hamidon, M.N.; Yunus, N.A.M.; Kamarudin, S. Separation and Detection of Escherichia Coli and Saccharomyces Cerevisiae Using a Microfluidic Device Integrated with an Optical Fibre. Biosensors 2019, 9, 40. [Google Scholar] [CrossRef]
- Sancho-Fornes, G.; Avella-Oliver, M.; Carrascosa, J.; Fernandez, E.; Brun, E.M.; Maquieira, Á. Disk-Based One-Dimensional Photonic Crystal Slabs for Label-Free Immunosensing. Biosens. Bioelectron. 2019, 126, 315–323. [Google Scholar] [CrossRef] [PubMed]
- Li, Z.; Zhu, Y.; Hao, Y.; Gao, M.; Lu, M.; Stein, A.; Park, A.H.A.; Hone, J.C.; Lin, Q.; Yu, N. Hybrid Metasurface-Based Mid-Infrared Biosensor for Simultaneous Quantification and Identification of Monolayer Protein. ACS Photonics 2019, 6, 501–509. [Google Scholar] [CrossRef]
- Zhu, X.; Wang, R.; Xia, K.; Zhou, X.; Shi, H. Nucleic Acid Functionalized Fiber Optic Probes for Sensing in Evanescent Wave: Optimization and Application. RSC Adv. 2019, 9, 2316–2324. [Google Scholar] [CrossRef] [PubMed] [Green Version]
- Sypabekova, M.; Korganbayev, S.; González-Vila, Á.; Caucheteur, C.; Shaimerdenova, M.; Ayupova, T.; Bekmurzayeva, A.; Vangelista, L.; Tosi, D. Functionalized Etched Tilted Fiber Bragg Grating Aptasensor for Label-Free Protein Detection. Biosens. Bioelectron. 2019, 146, 111765. [Google Scholar] [CrossRef]
- Bekmurzayeva, A.; Dukenbayev, K.; Shaimerdenova, M.; Bekniyazov, I.; Ayupova, T.; Sypabekova, M.; Molardi, C.; Tosi, D. Etched Fiber Bragg Grating Biosensor Functionalized with Aptamers for Detection of Thrombin. Sensors 2018, 18, 4298. [Google Scholar] [CrossRef] [Green Version]
- Ayyanar, N.; Khalil, A.E.; Hameed, M.F.O.; Thavasi Raja, G.; Obayya, S.S.A. Enhanced Sensitivity of Hemoglobin Sensor Using Dual-Core Photonic Crystal Fiber. Opt. Quantum Electron. 2018, 50, 453. [Google Scholar] [CrossRef]
- Lee, Y.; Song, H.; Ahn, H.; Choi, J.R.; Kim, K. Rapid and Real-Time Diagnosis of Hypoalbuminemia Using an Extraordinary Optical Transmission Biosensor. Sens. Actuators B Chem. 2018, 274, 595–600. [Google Scholar] [CrossRef]
- Ertürk, G.; Hedström, M.; Tümer, M.A.; Denizli, A.; Mattiasson, B. Real-Time Prostate-Specific Antigen Detection with Prostate-Specific Antigen Imprinted Capacitive Biosensors. Anal. Chim. Acta 2015, 891, 120–129. [Google Scholar] [CrossRef] [PubMed]
- Feng, F.; Chen, W.; Chen, D.; Lin, W.; Chen, S.-C. In-Situ Ultrasensitive Label-Free DNA Hybridization Detection Using Optical Fiber Specklegram. Sens. Actuators B Chem. 2018, 272, 160–165. [Google Scholar] [CrossRef]
- Guo, C.; Yang, X.; Shen, Z.; Wu, J.P.; Zhong, S.; He, Y.; Guan, T.; Chen, F. A Fluidic Biosensor Based on a Phase-Sensitive Low-Coherence Spectral-Domain Interferometer. Sensors 2018, 18, 3757. [Google Scholar] [CrossRef]
- Qiu, Y.; Tang, Y.; Li, B.; He, M. Rapid Detection of Cocaine Using Aptamer-Based Biosensor on an Evanescent Wave Fibre Platform. R. Soc. Open Sci. 2018, 5, 180821. [Google Scholar] [CrossRef] [PubMed] [Green Version]
- Kim, J.; Son, C.; Choi, S.; Yoon, W.J.; Ju, H. A Plasmonic Fiber Based Glucometer and Its Temperature Dependence. Micromachines 2018, 9, 506. [Google Scholar] [CrossRef] [PubMed] [Green Version]
- Zhu, Y.; Li, Z.; Hao, Z.; DiMarco, C.; Maturavongsadit, P.; Hao, Y.; Lu, M.; Stein, A.; Wang, Q.; Hone, J.; et al. Optical Conductivity-Based Ultrasensitive Mid-Infrared Biosensing on a Hybrid Metasurface. Light Sci. Appl. 2018, 7, 67. [Google Scholar] [CrossRef] [Green Version]
- Long, S.C.; Zhu, Y.R.; Hu, M.Y.; Qi, Y.F.; Jiang, Y.R.; Liu, B.; Zhang, X. Thin-Core Fiber-Optic Biosensor for DNA Hybridization Detection. Optoelectron. Lett. 2018, 14, 346–349. [Google Scholar] [CrossRef]
- Yu, S.; Ding, L.; Lin, H.; Wu, W.; Huang, J. A Novel Optical Fiber Glucose Biosensor Based on Carbon Quantum Dots-Glucose Oxidase_cellulose Acetate Complex Sensitive Film. Biosens. Bioelectron. 2019, 146, 111760. [Google Scholar] [CrossRef] [PubMed]
- Vaghela, C.; Kulkarni, M.; Aiyer, R.; Karve, M. LED-Based Portable Optical Biosensor for Measurement of Serum Urea Levels Using Urease Immobilized Agarose-Guar Gum Composite Film. IEEE Sens. J. 2018, 18, 7273–7280. [Google Scholar] [CrossRef]
- Tang, P.; Sun, G. Highly Sensitive Colorimetric Paper Sensor for Methyl Isothiocyanate (MITC): Using Its Toxicological Reaction. Sens. Actuators B Chem. 2018, 261, 178–187. [Google Scholar] [CrossRef]
- Zhang, X.; Wu, Z.; Liu, F.; Fu, Q.; Chen, X.; Xu, J.; Zhang, Z.; Huang, Y.; Tang, Y.; Guo, T.; et al. Hydrogen Peroxide and Glucose Concentration Measurement Using Optical Fiber Grating Sensors with Corrodible Plasmonic Nanocoatings. Biomed. Opt. Express 2018, 9, 1735. [Google Scholar] [CrossRef] [Green Version]
- Wei, W.; Nong, J.; Zhu, Y.; Zhang, G.; Wang, N.; Luo, S.; Chen, N.; Lan, G.; Chuang, C.J.; Huang, Y. Graphene/Au-Enhanced Plastic Clad Silica Fiber Optic Surface Plasmon Resonance Sensor. Plasmonics 2018, 13, 483–491. [Google Scholar] [CrossRef]
- Yusof, H.H.M.; Rahim, H.R.A.; Thokchom, S.; Dimyati, K.; Harun, S.W. Uric Acid Sensing Using Tapered Silica Optical Fiber Coated with Zinc Oxide Nanorods. Microw. Opt. Technol. Lett. 2018, 60, 645–650. [Google Scholar] [CrossRef]
- Yesilkoy, F.; Terborg, R.A.; Pello, J.; Belushkin, A.A.; Jahani, Y.; Pruneri, V.; Altug, H. Phase-Sensitive Plasmonic Biosensor Using a Portable and Large Field-of-View Interferometric Microarray Imager. Light Sci. Appl. 2018, 7, 17152. [Google Scholar] [CrossRef] [Green Version]
- Semwal, V.; Gupta, B.D. LSPR- and SPR-Based Fiber-Optic Cholesterol Sensor Using Immobilization of Cholesterol Oxidase over Silver Nanoparticles Coated Graphene Oxide Nanosheets. IEEE Sens. J. 2018, 18, 1039–1046. [Google Scholar] [CrossRef]
- Wang, W.; Mai, Z.; Chen, Y.; Wang, J.; Li, L.; Su, Q.; Li, X.; Hong, X. A Label-Free Fiber Optic SPR Biosensor for Specific Detection of C-Reactive Protein. Sci. Rep. 2017, 7, 16904. [Google Scholar] [CrossRef] [PubMed] [Green Version]
- Liu, Q.; Liu, Y.; Chen, S.; Wang, F.; Peng, W. A Low-Cost and Portable Dual-Channel Fiber Optic Surface Plasmon Resonance System. Sensors 2017, 17, 2797. [Google Scholar] [CrossRef] [PubMed] [Green Version]
- Wu, J.; Zhang, X.; Liu, B.; Zhang, H.; Song, B. Square-Microfiber-Integrated Biosensor for Label-Free DNA Hybridization Detection. Sens. Actuators B Chem. 2017, 252, 1125–1131. [Google Scholar] [CrossRef]
- Sharma, P.; Semwal, V.; Gupta, B.D. Highly Sensitive and Selective Localized Surface Plasmon Resonance Biosensor for Detecting Glutamate Realized on Optical Fiber Substrate Using Gold Nanoparticles. Photonics Nanostruct. Fundam. Appl. 2019, 37, 100730. [Google Scholar] [CrossRef]
- Zhang, C.; Li, Z.; Jiang, S.Z.; Li, C.H.; Xu, S.C.; Yu, J.; Li, Z.; Wang, M.H.; Liu, A.H.; Man, B.Y. U-Bent Fiber Optic SPR Sensor Based on Graphene/AgNPs. Sens. Actuators B Chem. 2017, 251, 127–133. [Google Scholar] [CrossRef]
- Long, K.D.; Woodburn, E.V.; Le, H.M.; Shah, U.K.; Lumetta, S.S.; Cunningham, B.T. Multimode Smartphone Biosensing: The Transmission, Reflection, and Intensity Spectral (TRI)-Analyzer. Lab Chip 2017, 17, 3246–3257. [Google Scholar] [CrossRef]
- Zhang, Y.; Wang, F.; Qian, S.; Liu, Z.; Wang, Q.; Gu, Y.; Wu, Z.; Jing, Z.; Sun, C.; Peng, W. A Novel Fiber Optic Surface Plasmon Resonance Biosensors with Special Boronic Acid Derivative to Detect Glycoprotein. Sensors 2017, 17, 2259. [Google Scholar] [CrossRef] [Green Version]
- Manaf, A.A.; Ghadiry, M.; Soltanian, R.; Ahmad, H.; Lai, C.K. Picomole Dopamine Detection Using Optical Chips. Plasmonics 2017, 12, 1505–1510. [Google Scholar] [CrossRef]
- Yan, H.; Yang, C.J.; Tang, N.; Zou, Y.; Chakravarty, S.; Roth, A.; Chen, R.T. Specific Detection of Antibiotics by Silicon-on-Chip Photonic Crystal Biosensor Arrays. IEEE Sens. J. 2017, 17, 5915–5919. [Google Scholar] [CrossRef]
- Ye, M.; Arakawa, T.; Chien, P.J.; Suzuki, T.; Toma, K.; Mitsubayashi, K. Acetone Biosensor Based on Fluorometry of Reduced Nicotinamide Adenine Dinucleotide Consumption in Reversible Reaction by Secondary Alcohol Dehydrogenase. IEEE Sens. J. 2017, 17, 5419–5425. [Google Scholar] [CrossRef]
- Sun, D.; Guo, T.; Guan, B.O. Label-Free Detection of DNA Hybridization Using a Reflective Microfiber Bragg Grating Biosensor with Self-Assembly Technique. J. Light. Technol. 2017, 35, 3354–3359. [Google Scholar] [CrossRef]
- Han, L.; Guo, T.; Xie, C.; Xu, P.; Lao, J.; Zhang, X.; Xu, J.; Chen, X.; Huang, Y.; Liang, X.; et al. Specific Detection of Aquaporin-2 Using Plasmonic Tilted Fiber Grating Sensors. J. Light. Technol. 2017, 35, 3360–3365. [Google Scholar] [CrossRef]
- Ribaut, C.; Loyez, M.; Larrieu, J.C.; Chevineau, S.; Lambert, P.; Remmelink, M.; Wattiez, R.; Caucheteur, C. Cancer Biomarker Sensing Using Packaged Plasmonic Optical Fiber Gratings: Towards in Vivo Diagnosis. Biosens. Bioelectron. 2017, 92, 449–456. [Google Scholar] [CrossRef] [PubMed]
- Azab, M.Y.; Hameed, M.F.O.; Nasr, A.M.; Obayya, S.S.A. Label Free Detection for DNA Hybridization Using Surface Plasmon Photonic Crystal Fiber Biosensor. Opt. Quantum Electron. 2018, 50, 68. [Google Scholar] [CrossRef]
- Cetin, A.E.; Topkaya, S.N. Plasmonic Diffraction Field Pattern Imaging Could Resolve Ultrasensitive Bioinformation. ACS Photonics 2019, 6, 2626–2635. [Google Scholar] [CrossRef]
- Cao, Y.; Wang, X.; Guo, T.; Ran, Y.; Feng, X.; Guan, B.O.; Yao, J. High-Resolution and Temperature-Compensational HER2 Antigen Detection Based on a Microwave Photonic Interrogation. Sens. Actuators B Chem. 2017, 245, 583–589. [Google Scholar] [CrossRef]
- Santamaría, B.; Laguna, M.F.; López-Romero, D.; Hernandez, A.L.; Sanza, F.J.; Lavín, Á.; Casquel, R.; Maigler, M.V.; Espinosa, R.L.; Holgado, M. Development towards Compact Nitrocellulose-Based Interferometric Biochips for Dry Eye Mmp9 Label-Free in-Situ Diagnosis. Sensors 2017, 17, 1158. [Google Scholar] [CrossRef] [PubMed]
- Phan, Q.H.; Lo, Y.L. Stokes-Mueller Matrix Polarimetry System for Glucose Sensing. Opt. Lasers Eng. 2017, 92, 120–128. [Google Scholar] [CrossRef]
- Jiang, S.; Li, Z.; Zhang, C.; Gao, S.; Li, Z.; Qiu, H.; Li, C.; Yang, C.; Liu, M.; Liu, Y. A Novel U-Bent Plastic Optical Fibre Local Surface Plasmon Resonance Sensor Based on a Graphene and Silver Nanoparticle Hybrid Structure. J. Phys. D Appl. Phys. 2017, 50, 165105. [Google Scholar] [CrossRef]
- Yoshida, S.; Ishihara, S.; Arakawa, T.; Kokubun, Y. Highly Sensitive Optical Biosensor Based on Silicon-Microring-Resonator-Loaded Mach-Zehnder Interferometer. Jpn. J. Appl. Phys. 2017, 56, 04CH08. [Google Scholar] [CrossRef] [Green Version]
- Ruan, J.-L.; Chen, C.; Shen, J.-H.; Zhao, X.-L.; Qian, S.-H.; Zhu, Z.-G. A Gelated Colloidal Crystal Attached Lens for Noninvasive Continuous Monitoring of Tear Glucose. Polymers 2017, 9, 125. [Google Scholar] [CrossRef] [PubMed] [Green Version]
- Liang, L.; Jin, L.; Ran, Y.; Sun, L.P.; Guan, B.O. Interferometric Detection of MicroRNAs Using a Capillary Optofluidic Sensor. Sens. Actuators B Chem. 2017, 242, 999–1006. [Google Scholar] [CrossRef]
- Chandra, S.; Bharadwaj, R.; Mukherji, S. Label Free Ultrasensitive Optical Sensor Decorated with Polyaniline Nanofibers: Characterization and Immunosensing Application. Sens. Actuators B Chem. 2017, 240, 443–450. [Google Scholar] [CrossRef]
- Herranz, S.; Fernandez Gavela, A.; Lechuga, L.M. Label-Free Biosensors Based on Bimodal Waveguide (BiMW) Interferometers. In Biosensors and Biodetection: Methods and Protocols Vol 1: Optical-Based Detectors, 2nd ed.; Rasooly, A., Prickril, B., Eds.; Humana Press: Totowa, NJ, USA, 2017; Volume 1571, pp. 161–185. [Google Scholar]
- Yoshida, S.; Ishihara, S.; Nishijima, Y.; Kokubun, Y.; Arakawa, T. Improved Sensitivity of Microring Resonator-Loadecl Mach-Zehnder Interferometer Biosensor. Sens. Mater. 2017, 29, 1241–1246. [Google Scholar] [CrossRef] [Green Version]
- Sharma, P.; Semwal, V.; Gupta, B.D. A Highly Selective LSPR Biosensor for the Detection of Taurine Realized on Optical Fiber Substrate and Gold Nanoparticles. Opt. Fiber Technol. 2019, 52, 101962. [Google Scholar] [CrossRef]
- Zeng, Y.; Wang, L.; Wu, S.Y.; He, J.; Qu, J.; Li, X.; Ho, H.P.; Gu, D.; Gao, B.Z.; Shao, Y. Wavelength-Scanning SPR Imaging Sensors Based on an Acousto-Optic Tunable Filter and a White Light Laser. Sensors 2017, 17, 90. [Google Scholar] [CrossRef] [Green Version]
- Gauri, S.; Abidin, Z.Z.; Kamuri, M.F.; Mahdi, M.A.; Md Yunus, N.A. Detection of Aeromonas Hydrophila Using Fiber Optic Microchannel Sensor. J. Sens. 2017, 2017, 8365189. [Google Scholar] [CrossRef] [Green Version]
- Gao, R.; Lu, D.F.; Cheng, J.; Jiang, Y.; Jiang, L.; Xu, J.D.; Qi, Z.M. Fiber Optofluidic Biosensor for the Label-Free Detection of DNA Hybridization and Methylation Based on an in-Line Tunable Mode Coupler. Biosens. Bioelectron. 2016, 86, 321–329. [Google Scholar] [CrossRef]
- Huang, J.; Li, M.; Zhang, P.; Zhang, P.; Ding, L. Temperature Controlling Fiber Optic Glucose Sensor Based on Hydrogel-Immobilized GOD Complex. Sens. Actuators B Chem. 2016, 237, 24–29. [Google Scholar] [CrossRef]
- Luo, Z.; Zhang, J.; Wang, Y.; Chen, J.; Li, Y.; Duan, Y. An Aptamer Based Method for Small Molecules Detection through Monitoring Salt-Induced AuNPs Aggregation and Surface Plasmon Resonance (SPR) Detection. Sens. Actuators B Chem. 2016, 236, 474–479. [Google Scholar] [CrossRef]
- Maldonado, J.; González-Guerrero, A.B.; Domínguez, C.; Lechuga, L.M. Label-Free Bimodal Waveguide Immunosensor for Rapid Diagnosis of Bacterial Infections in Cirrhotic Patients. Biosens. Bioelectron. 2016, 85, 310–316. [Google Scholar] [CrossRef] [Green Version]
- Na, H.-K.; Wi, J.-S.; Son, H.Y.; Ok, J.G.; Huh, Y.-M.; Lee, T.G. Discrimination of Single Nucleotide Mismatches Using a Scalable, Flexible, and Transparent Three-Dimensional Nanostructure-Based Plasmonic MiRNA Sensor with High Sensitivity. Biosens. Bioelectron. 2018, 113, 39–45. [Google Scholar] [CrossRef] [PubMed]
- Song, B.; Zhang, H.; Liu, B.; Lin, W.; Wu, J. Label-Free in-Situ Real-Time DNA Hybridization Kinetics Detection Employing Microfiber-Assisted Mach-Zehnder Interferometer. Biosens. Bioelectron. 2016, 81, 151–158. [Google Scholar] [CrossRef] [PubMed]
- Guo, T.; Liu, F.; Liang, X.; Qiu, X.; Huang, Y.; Xie, C.; Xu, P.; Mao, W.; Guan, B.O.; Albert, J. Highly Sensitive Detection of Urinary Protein Variations Using Tilted Fiber Grating Sensors with Plasmonic Nanocoatings. Biosens. Bioelectron. 2016, 78, 221–228. [Google Scholar] [CrossRef] [PubMed] [Green Version]
- Kehl, F.; Etlinger, G.; Gartmann, T.E.; Tscharner, N.S.R.U.; Heub, S.; Follonier, S. Introduction of an Angle Interrogated, MEMS-Based, Optical Waveguide Grating System for Label-Free Biosensing. Sens. Actuators B Chem. 2016, 226, 135–143. [Google Scholar] [CrossRef]
- Al-Jawdah, A.; Nabok, A.; Abu-Ali, H.; Catanante, G.; Marty, J.L.; Szekacs, A. Highly Sensitive Label-Free in Vitro Detection of Aflatoxin B1 in an Aptamer Assay Using Optical Planar Waveguide Operating as a Polarization Interferometer. Anal. Bioanal. Chem. 2019, 411, 7717–7724. [Google Scholar] [CrossRef] [PubMed] [Green Version]
- Tian, B.; Bejhed, R.S.; Svedlindh, P.; Strömberg, M. Blu-Ray Optomagnetic Measurement Based Competitive Immunoassay for Salmonella Detection. Biosens. Bioelectron. 2016, 77, 32–39. [Google Scholar] [CrossRef]
- Jin, Y.; Wong, K.H.; Granville, A.M. Developing Localized Surface Plasmon Resonance Biosensor Chips and Fiber Optics via Direct Surface Modification of PMMA Optical Waveguides. Colloids Surf. A Physicochem. Eng. Asp. 2016, 492, 100–109. [Google Scholar] [CrossRef]
- Mavrogiannis, N.; Crivellari, F.; Gagnon, Z.R. Label-Free Biomolecular Detection at Electrically Displaced Liquid Interfaces Using Interfacial Electrokinetic Transduction (IET). Biosens. Bioelectron. 2016, 77, 790–798. [Google Scholar] [CrossRef] [PubMed] [Green Version]
- Rampazzi, S.; Danese, G.; Leporati, F.; Marabelli, F. A Localized Surface Plasmon Resonance-Based Portable Instrument for Quick on-Site Biomolecular Detection. IEEE Trans. Instrum. Meas. 2016, 65, 317–327. [Google Scholar] [CrossRef]
- Chen, S.; Liu, Y.; Liu, Q.; Peng, W.; Abstract, A. Temperature-Compensating Fiber-Optic Surface Plasmon Resonance Biosensor. IEEE Photonics Technol. Lett. 2016, 28, 213–216. [Google Scholar] [CrossRef]
- Wang, F.; Anderson, M.; Bernards, M.T.; Hunt, H.K. PEG Functionalization of Whispering Gallery Mode Optical Microresonator Biosensors to Minimize Non-Specific Adsorption during Targeted, Label-Free Sensing. Sensors 2015, 15, 18040–18060. [Google Scholar] [CrossRef] [PubMed] [Green Version]
- Chen, Y.; Yu, F.; Yang, C.; Song, J.; Tang, L.; Li, M.; He, J.J. Label-Free Biosensing Using Cascaded Double-Microring Resonators Integrated with Microfluidic Channels. Opt. Commun. 2015, 344, 129–133. [Google Scholar] [CrossRef]
- Li, J.Y.; Lu, D.F.; Qi, Z.M.; Tong, Z. Tube Glass Waveguides Modified with Gold Nanoparticles for Application as a Simple Chemical and Biological Sensor. IEEE Sens. J. 2015, 15, 2917–2923. [Google Scholar] [CrossRef]
- Dante, S.; Duval, D.; Fariña, D.; González-Guerrero, A.B.; Lechuga, L.M. Linear Readout of Integrated Interferometric Biosensors Using a Periodic Wavelength Modulation. Laser Photonics Rev. 2015, 9, 248–255. [Google Scholar] [CrossRef] [Green Version]
- Dove Press. IJN-88963-a-Regenerative-Label-Free-Fiber-Optic-Sensor-Using-Surface-P; Dove Press: Macclesfield, UK, 2015; pp. 155–163. [Google Scholar]
- Sakamoto, H.; Minpou, Y.; Sawai, T.; Enami, Y.; Suye, S.I. A Novel Optical Biosensing System Using Mach–Zehnder-Type Optical Waveguide for Influenza Virus Detection. Appl. Biochem. Biotechnol. 2016, 178, 687–694. [Google Scholar] [CrossRef]
- Chen, S.; Liu, Y.; Liu, Q.; Peng, W. Localized Surface Plasmon Resonance-Based Micro-Capillary Biosensor. IEEE Photonics Technol. Lett. 2015, 28, 2195–2198. [Google Scholar] [CrossRef]
- Haughey, A.M.; McConnell, G.; Guilhabert, B.; Burley, G.A.; Dawson, M.D.; Laurand, N. Organic Semiconductor Laser Biosensor: Design and Performance Discussion. IEEE J. Sel. Top. Quantum Electron. 2016, 22, 6–14. [Google Scholar] [CrossRef]
- Nguyen, L.V.; Hill, K.; Warren-Smith, S.; Monro, T. Interferometric-Type Optical Biosensor Based on Exposed Core Microstructured Optical Fiber. Sens. Actuators B Chem. 2015, 221, 320–327. [Google Scholar] [CrossRef] [Green Version]
- Shi, S.; Wang, L.; Su, R.; Liu, B.; Huang, R.; Qi, W.; He, Z. A Polydopamine-Modified Optical Fiber SPR Biosensor Using Electroless-Plated Gold Films for Immunoassays. Biosens. Bioelectron. 2015, 74, 454–460. [Google Scholar] [CrossRef]
- Psarouli, A.; Salapatas, A.; Botsialas, A.; Petrou, P.S.; Raptis, I.; Makarona, E.; Jobst, G.; Tukkiniemi, K.; Sopanen, M.; Stoffer, R.; et al. Monolithically Integrated Broad-Band Mach-Zehnder Interferometers for Highly Sensitive Label-Free Detection of Biomolecules through Dual Polarization Optics. Sci. Rep. 2015, 5, 17600. [Google Scholar] [CrossRef]
- Su, J.; Goldberg, A.F.G.; Stoltz, B.M. Label-Free Detection of Single Nanoparticles and Biological Molecules Using Microtoroid Optical Resonators. Light Sci. Appl. 2016, 5, 2–7. [Google Scholar] [CrossRef] [PubMed] [Green Version]
- Vasilakis, N.; Papadimitriou, K.I.; Morgan, H.; Prodromakis, T. Modular Pressure and Flow Rate-Balanced Microfluidic Serial Dilution Networks for Miniaturised Point-of-Care Diagnostic Platforms. Sensors 2019, 19, 911. [Google Scholar] [CrossRef] [Green Version]
- Perhirin, S.; Auffret, Y. A Low Consumption Electronic System Developed for a 10km Long All-Optical Extension Dedicated to Sea Floor Observatories Using Power-over-Fiber Technology and SPI Protocol. Microw. Opt. Technol. Lett. 2013, 55, 2562–2568. [Google Scholar] [CrossRef]
- Liu, Y.; Liu, Q.; Chen, S.; Cheng, F.; Wang, H.; Peng, W. Surface Plasmon Resonance Biosensor Based on Smart Phone Platforms. Sci. Rep. 2015, 5, 12864. [Google Scholar] [CrossRef] [PubMed] [Green Version]
- Irawati, N.; Rahman, H.A.; Ahmad, H.; Harun, S.W. A PMMA Microfiber Loop Resonator Based Humidity Sensor with ZnO Nanorods Coating. Meas. J. Int. Meas. Confed. 2017, 99, 128–133. [Google Scholar] [CrossRef]
- Gonçalves, H.M.R.; Moreira, L.; Pereira, L.; Jorge, P.; Gouveia, C.; Martins-Lopes, P.; Fernandes, J.R.A. Biosensor for Label-Free DNA Quantification Based on Functionalized LPGs. Biosens. Bioelectron. 2016, 84, 30–36. [Google Scholar] [CrossRef] [PubMed] [Green Version]
- Manne, U.; Lin, Y.; Wei, J. Label-Free Detection of DNA Hybridization with A Compact LSPR-Based Fiber-Optic Sensor. Analyst 2017, 142, 1974–1981. [Google Scholar] [CrossRef]
- Chen, K.C.; Li, Y.L.; Wu, C.W.; Chiang, C.C. Glucose Sensor Using U-Shaped Optical Fiber Probe with Gold Nanoparticles and Glucose Oxidase. Sensors 2018, 18, 1217. [Google Scholar] [CrossRef] [PubMed] [Green Version]
- Usha, S.P.; Gupta, B.D. Urinary P-Cresol Diagnosis Using Nanocomposite of ZnO/MoS2 and Molecular Imprinted Polymer on Optical Fiber Based Lossy Mode Resonance Sensor. Biosens. Bioelectron. 2018, 101, 135–145. [Google Scholar] [CrossRef] [PubMed]
- Urrutia, A.; Bojan, K.; Marques, L.; Mullaney, K.; Goicoechea, J.; James, S.; Clark, M.; Tatam, R.; Korposh, S. Novel Highly Sensitive Protein Sensors Based on Tapered Optical Fibres Modified with Au-Based Nanocoatings. J. Sensors 2016, 2016, 8129387. [Google Scholar] [CrossRef] [Green Version]
- Wen, F.; Zhao, Y.; Yu, X.; Ren, Y. A Reflective Mirror Microcantilevers-Based Biosensor for Biochemical Detection. Optik 2016, 127, 2173–2176. [Google Scholar] [CrossRef]
- Wang, R.; Xiang, Y.; Zhou, X.; Liu, L.H.; Shi, H. A Reusable Aptamer-Based Evanescent Wave All-Fiber Biosensor for Highly Sensitive Detection of Ochratoxin A. Biosens. Bioelectron. 2015, 66, 11–18. [Google Scholar] [CrossRef]
- Chen, P.; Chung, M.T.; McHugh, W.; Nidetz, R.; Li, Y.; Fu, J.; Cornell, T.T.; Shanley, T.P.; Kurabayashi, K. Multiplex Serum Cytokine Immunoassay Using. Physiol. Behav. 2016, 176, 139–148. [Google Scholar] [CrossRef] [Green Version]
- Cennamo, N.; Donà, A.; Pallavicini, P.; D’Agostino, G.; Dacarro, G.; Zeni, L.; Pesavento, M. Sensitive Detection of 2,4,6-Trinitrotoluene by Tridimensional Monitoring of Molecularly Imprinted Polymer with Optical Fiber and Five-Branched Gold Nanostars. Sens. Actuators B Chem. 2015, 208, 291–298. [Google Scholar] [CrossRef]
- Nemiroski, A.; Ryou, M.; Thompson, C.C.; Westervelt, R.M. Swallowable Fluorometric Capsule for Wireless Triage of Gastrointestinal Bleeding. Lab Chip 2015, 15, 4479–4487. [Google Scholar] [CrossRef]
- Huang, Y.; Shi, Y.; Yang, H.Y.; Ai, Y. A Novel Single-Layered MoS2 Nanosheet Based Microfluidic Biosensor for Ultrasensitive Detection of DNA. Nanoscale 2015, 7, 2245–2249. [Google Scholar] [CrossRef]
- Goddard, N.J.; Dixon, H.J.; Toole, N.; Gupta, R. 3-D Printed Instrumentation for Point-of-Use Leaky Waveguide Biochemical Sensor. IEEE Trans. Instrum. Meas. 2020, 69, 6390–6398. [Google Scholar] [CrossRef]
- Zhu, Q.; Trau, D. PEG-Based Autonomous Capillary System with Integrated Microbead Array for Immunoassay. Mater. Sci. Eng. C 2017, 70, 1031–1038. [Google Scholar] [CrossRef] [PubMed]
- Kaushik, S.; Tiwari, U.K.; Pal, S.S.; Sinha, R.K. Rapid Detection of Escherichia Coli Using Fiber Optic Surface Plasmon Resonance Immunosensor Based on Biofunctionalized Molybdenum Disulfide (MoS 2 ) Nanosheets. Biosens. Bioelectron. 2019, 126, 501–509. [Google Scholar] [CrossRef]
- Unser, S.; Bruzas, I.; He, J.; Sagle, L. Localized Surface Plasmon Resonance Biosensing: Current Challenges and Approaches. Sensors 2015, 15, 15684–15716. [Google Scholar] [CrossRef] [PubMed]
- Sai, V.V.R.; Mukherji, S.; Kundu, T. Optical Fiber Probe. US8476007B2, 22 April 2014. Available online: https://patents.google.com/patent/US8703505 (accessed on 19 November 2022).
- Del Villar Fernández, I.; Ruiz Zamarreño, C.; Hernáez Sáenz de Záitigui, M.; Martín, A.S.; Maestro, F.J.M.; Raul, I. Sensores de Fibra Optica Recubierta. ES2363285B2, 3 May 2012. Available online: https://patents.google.com/patent/ES2363285B2/es?oq=ES2363285B2 (accessed on 19 November 2022).
- Guo, T.; Jie, W.; Lao, M.J.; Sun, P. Fiber Optic Sensing Apparatus, System, and Method for State of Charge Measurement in Energy Storage Devices. US20210025945A1, 12 April 2018. Available online: https://patents.google.com/patent/US20210025945A1/en?oq=US20210025945A1 (accessed on 19 November 2022).
- Strangi, G.; Sreekanth, K.V.; Gurkan, u.; Hinczewski, M.; Elkabbash, M.; de Luca, A. Optical Sensor Platform Employing Hyperbolic Metamaterials. US10533941B2, 14 January 2020. Available online: https://patents.google.com/patent/US10533941B2/en?oq=US10533941B2 (accessed on 19 November 2022).
- Oliver, J.M.A.; Javier, S.B.M.E.; Ángel, C.R.; Rosa, M.C.; Pla, P. Sensor Analítico y Método de Obtención del Mismo. WO2015118199A1, 13 August 2015. Available online: https://patents.google.com/patent/WO2015118199A1/es?oq=WO2015118199A1 (accessed on 19 November 2022).
- Lin, Q.; Zhu, Y.; Shang, J.; Zhang, Z.; Wang, X.; Yang, J.; Wang, C.; Rotti, P.G.; Engelhardt, J.F.; Hao, Z. Graphene-Based Nanosensor for Identifying Target Analytes. US20200196925A1, 25 June 2020. Available online: https://patents.google.com/patent/US20200196925A1/en?oq=US20200196925A1 (accessed on 19 November 2022).
- Shin, C.; Yip, K.; Chiang, C. Fiber Optic Sensing System. US7196318B2, 27 March 2007. Available online: https://patents.google.com/patent/US7196318B2/en?oq=US7196318B2 (accessed on 19 November 2022).
- Chiang, C.; Tsai, L. Fiber Optic Grating Measuring Device. US20100284646A1, 11 November 2010. Available online: https://patents.google.com/patent/US20100284646A1/en?oq=US20100284646A1 (accessed on 19 November 2022).
- Chakravarty, S.; Hosseini, A.; Chen, R.T. Packaged Chip for Multiplexing Photonic Crystal Microcavity Coupled Waveguide and Photonic Crystal Slot Waveguide Devices for Chip-Integrated Label-Free. US9164026B2, 20 October 2015. Available online: https://patents.google.com/patent/US9164026B2/en?oq=US9164026B2 (accessed on 19 November 2022).
- Joe, H.R.; Lu, S.P.; Paquet, S.; Yao, J.; Mihailov, S.J.; Oldham, J.; Caron, M. Photonic Tunable Filter and Corresponding Method of Filtering Electrical Signals. EP2228680A1, 15 September 2010. Available online: https://patents.google.com/patent/EP2228680A1/en?oq=EP2228680A1 (accessed on 19 November 2022).
- Bolaños, M.H.; del Campo, R.C.; Álvarez, C.M.; Moreno, J.L.O.; Heras, M.F.L.; Furio, M.M. Sistema de Detección Óptica Para Ensayos Biológicos de Alta Sensibilidad Sin Marcado. ES2574138T3, 15 June 2016. Available online: https://patents.google.com/patent/ES2574138T3/es?oq=ES2574138T3 (accessed on 19 November 2022).
- Manuel, O.R.; Francisco, Y.V.; Ángel, B.Q.; Agustín, R.G.; Miguel, H.B.; Luis, J.F.L. Sensor, Aparato y Procedimiento Para La Determinacion de La Consentracion de Solutos. WO2017072388A1, 16 May 2017. Available online: https://digital.csic.es/handle/10261/176255 (accessed on 19 November 2022).
- Holgado Bolaños, M. Photonic Device, Optical Logic Circuit Incorporting the Photonic Device and Method of Manufacturing Thereof. US20030072519A1, 17 April 2003. Available online: https://patents.google.com/patent/US20030072519A1/en?oq=US20030072519A1 (accessed on 19 November 2022).
- Albert, J.; Chen, C.; Shevchenko, Y.; Ivanov, A. Tilted Grating Sensor. US9857290B2, 2 January 2018. Available online: https://patents.google.com/patent/US9857290B2/en?oq=US9857290B2 (accessed on 19 November 2022).
- Belay, G.Y.; Hoving, W.; Ottevaere, H.; van der Put, A.; Weltjens, W.; Thienpont, H. Design of a Miniaturized Integrated Spectrometer for Spectral Tissue Sensing; Wyrowski, F., Sheridan, J.T., Meuret, Y., Eds.; SPIE: Bellingham, WA, USA, 2016; p. 98890S. [Google Scholar]
- Lescourret, V.G.; Sebastien, C.T.; Albert, A.J.; Fersht, J. Optical Fibre with Light Guide, Protective Coating and a Section Structured as an Optical Filter of the Bragg Grating Type, Has a Coating of UV-Crosslinked S. FR2847989A1, 25 February 2005. Available online: https://patents.google.com/patent/FR2847989B1/en (accessed on 19 November 2022).
- Raptis, I.; Misiakos, K.; Kakabakos, S.; Petrou, P.; Makarona, E.; Kitsara, M. Monolithically Integrated Physical Chemical and Biological Sensor Arrays Based on Broad-Band Mach-Zhender Interferometry. WO2009115847A1, 24 September 2009. [Google Scholar]
- John, G.R.; Nicholas, G. A Sensor. GB2587024A, 30 October 2019. Available online: https://patents.google.com/patent/GB2587024A/en?oq=GB2587024A (accessed on 19 November 2022).
- Moreno, J.L.O.; Bolaños, M.H.; Heras, M.F.L.; Furio, M.M.; del Campo, R.C.; Alvarez, C.M. Sistema de Deteccion Optica Para Bio-Ensayos de Alta Sensibilidad Sin Marcado. ES2334318B2, 28 November 2011. Available online: https://patents.google.com/patent/ES2334318B2/es?oq=ES2334318B2 (accessed on 19 November 2022).
- Butt, H.; Elsherif, M. Fiber Optic Integrated-Light Diffusers for Sensing Applications. US11143815B1, 12 October 2021. Available online: https://patents.google.com/patent/US11143815B1/en?oq=US11143815B1 (accessed on 19 November 2022).
- Ho, D.; Yan, W.; Wei, L.; Tian, Y. Determination of a Concentration of an Analyte in a Subject. US10405785B2, 10 September 2019. Available online: https://patents.google.com/patent/US10405785B2/en?oq=US10405785B2 (accessed on 19 November 2022).
- Seungki, L.; Daehong, J.; Hoyoung, L.; Young, P.; Hyeongmin, K. Surface Plasmon Resonance Sensor Device Using Microfluidic Channel and System Comprising the Same. IE20170055A1, 8 August 2018. Available online: https://patents.google.com/patent/IE20170055A1/en?oq=IE20170055A1 (accessed on 19 November 2022).
- Kim, M.G.; Lee, B.B.; Park, J.H.; Byun, J.Y. Reusable Optical Fiber Aptasensor Based on Photo-Thermal Effect. US20180136206A1, 20 April 2021. Available online: https://patents.google.com/patent/US20180136206A1/en?oq=US20180136206A1 (accessed on 19 November 2022).
- VSai, E.V.R.; Mukherji, S.; Kundu, T. Optical Fiber Probe. US8703505B2, 22 April 2014. Available online: https://patents.google.com/patent/US8703505B2/en?oq=US8703505B2 (accessed on 19 November 2022).
- Kehl, F.; Follonier, S. Measurement Method Based on an Optical Waveguide Sensor System. US20160146729A1, 26 May 2016. Available online: https://patents.google.com/patent/US20160146729A1/en?oq=US20160146729A1 (accessed on 19 November 2022).
- Shao, Y. Spectrum-Scanned SPR Imaging Detection System. US10578554B2, 3 March 2020. Available online: https://patents.google.com/patent/US10578554B2/en?oq=US10578554B2 (accessed on 19 November 2022).
- Monro, T.; Smith, S.W.; Vahid, S.A.; Ebendorff-Heidepriem, H.; Ruan, Y. Detección de Fluorescencia Usando Una Fibra Óptica. ES2579774T3, 16 August 2016. Available online: https://patents.google.com/patent/ES2579774T3/es?oq=ES2579774T3 (accessed on 19 November 2022).
- Monro, T.; Smith, S.W.; Vahid, S.A.; Ebendorff-Heidepriem, H.; Ruan, Y. Fluorescence Sensing Using a Microstructured Optical Fiber. EP2176645A1, 1 June 2016. Available online: https://patents.google.com/patent/EP2176645A1/en?oq=EP2176645A1 (accessed on 19 November 2022).
- Su, T.J. Label-Free Detection of Nanoparticles and Biological Molecules Using Microtoroid Optical Resonatiors. US20170322207A1, 4 June 2019. Available online: https://patents.google.com/patent/US2017032)2207A1/en?oq=US20170322207A1 (accessed on 19 November 2022).
- HeLei, J.; Li, J. Optical Sensor Based on a Broadband Light Source and Cascaded Waveguide Filters. US9052291B2, 9 June 2015. Available online: https://patents.google.com/patent/US9052291B2/en?oq=US9052291B2 (accessed on 19 November 2022).
- Strömberg, M.; Göransson, J.; Gunnarsson, K.; Nilsson, M.; Svedlindh, P.; Strømme, M. Magnetic Detection of Small Entities. EP2195461B1, 27 May 2015. Available online: https://patents.google.com/patent/EP2195461B1/en?oq=EP2195461B1 (accessed on 19 November 2022).
- Chau, L.; Chiang, C. Self-Referencing Fiber-Optic Localized Plasmon Resonance Sensing Device and System Thereof. US20110090506A1, 21 April 2011. Available online: https://patents.google.com/patent/US20110090506A1/en?oq=US20110090506A1 (accessed on 19 November 2022).
- Sun, G.; Ghanbari, S. Colorimetric Sensors for Alkylating Agents. WO2014193917A1, 4 December 2014. Available online: https://patents.google.com/patent/WO2014193917A1/en?oq=WO2014193917A1 (accessed on 19 November 2022).
- Dong, T.; Pires, N.M.M.; Yang, Z.; Chen, C.; Lonningdal, k.D.T.; Karlsen, H. On-Diaper Body Fluid Screening Device Dispositif de Dépistage de Fluide Corporel Dans Une Couche. EP3443345B1, 28 October 2020. Available online: https://patents.google.com/patent/EP3443345B1/en?oq=EP3443345B1 (accessed on 19 November 2022).
- Mitsubayashi, K.; Aoyagi, K. Biosensor and Method for Production Thereof. US20030164024A1, 4 September 2003. Available online: https://patents.google.com/patent/US20030164024A1/en?oq=US20030164024A1 (accessed on 19 November 2022).
- Thompson, C.C.; Westervelt, R.; Nemiroski, A.; Obstein, K.L. System and Method for Wireless Biosensor Monitoring. US20210204833A1, 8 July 2021. Available online: https://patents.google.com/patent/US20210204833A1/en?oq=US20210204833A1 (accessed on 19 November 2022).
- Chung, M.T.; Chen, P.; Kurabayashi, K.; Cornell, T.T.; Shanley, T.P. Systems and Methods for Performing Immunoassays. CA2976678A1, 25 August 2016. Available online: https://patents.google.com/patent/CA2976678A1/en?oq=CA2976678A1 (accessed on 19 November 2022).
- Kendall, M.A.F.; Fernando, G.; Chen, X.; Prow, T. Coating Method. US10022322B2, 17 July 2018. Available online: https://patents.google.com/patent/US10022322B2/en?oq=US10022322B2 (accessed on 19 November 2022).


| Classification | List of References | |
|---|---|---|
| Refractive index | A1—Broadband-based (38%) | [207,208,209,210,211,212,213,214,215,216,217,218,219,220,221,222,223] |
| A2—Monochromatic-based (22%) | [224,225,226,227,228,229,230,231] | |
| A3—Turnable detector-based (11%) | [232,233,234,235,236] | |
| A4—Single detection method (3%) | [237] | |
| ELISA (8%) | [238,239,240] | |
| Fluorescence (8%) | [241,242] | |
| Scattering (3%) | [243] | |
| Raman SERS (3%) | [244] | |
Publisher’s Note: MDPI stays neutral with regard to jurisdictional claims in published maps and institutional affiliations. |
© 2022 by the authors. Licensee MDPI, Basel, Switzerland. This article is an open access article distributed under the terms and conditions of the Creative Commons Attribution (CC BY) license (https://creativecommons.org/licenses/by/4.0/).
Share and Cite
Pioz, M.J.; Espinosa, R.L.; Laguna, M.F.; Santamaria, B.; Murillo, A.M.M.; Hueros, Á.L.; Quintero, S.; Tramarin, L.; Valle, L.G.; Herreros, P.; et al. A review of Optical Point-of-Care devices to Estimate the Technology Transfer of These Cutting-Edge Technologies. Biosensors 2022, 12, 1091. https://doi.org/10.3390/bios12121091
Pioz MJ, Espinosa RL, Laguna MF, Santamaria B, Murillo AMM, Hueros ÁL, Quintero S, Tramarin L, Valle LG, Herreros P, et al. A review of Optical Point-of-Care devices to Estimate the Technology Transfer of These Cutting-Edge Technologies. Biosensors. 2022; 12(12):1091. https://doi.org/10.3390/bios12121091
Chicago/Turabian StylePioz, María Jesús, Rocío L. Espinosa, María Fe Laguna, Beatriz Santamaria, Ana María M. Murillo, Álvaro Lavín Hueros, Sergio Quintero, Luca Tramarin, Luis G Valle, Pedro Herreros, and et al. 2022. "A review of Optical Point-of-Care devices to Estimate the Technology Transfer of These Cutting-Edge Technologies" Biosensors 12, no. 12: 1091. https://doi.org/10.3390/bios12121091