
Advancing Early Leukemia Diagnostics: A Comprehensive Study Incorporating Image Processing and Transfer Learning

 ,
, 
 and
and 
Abstract
:1. Introduction
- Development of Diverse ML and TL Models: We contribute a range of ML and TL models tailored for accurate and reliable binary and multiclass classification of leukemia cells. This diverse set of models provides flexibility and options for effective classification in different scenarios.
- Case Study with Two Datasets: Our research conducts a comprehensive case study by considering two datasets, offering a detailed analysis of the effectiveness of the experimental models. This approach ensures a robust evaluation, addressing the reliability and generalization aspects of the proposed models.
- Empirical Analysis for Model Evaluation: We present a detailed empirical analysis, evaluating the effectiveness and efficiency of each proposed model for accurate binary and multiclass classification of leukemia cells. This thorough evaluation contributes insights into the performance of each model, aiding in the selection of appropriate models for specific applications.
- Comparative Performance Analysis: To benchmark our models, we conduct a comprehensive analysis comparing the performance and efficiency of the TL model against ML classifiers. This comparative study highlights the strengths and advancements of our proposed models in the context of leukemia cell classification.
2. Related Works
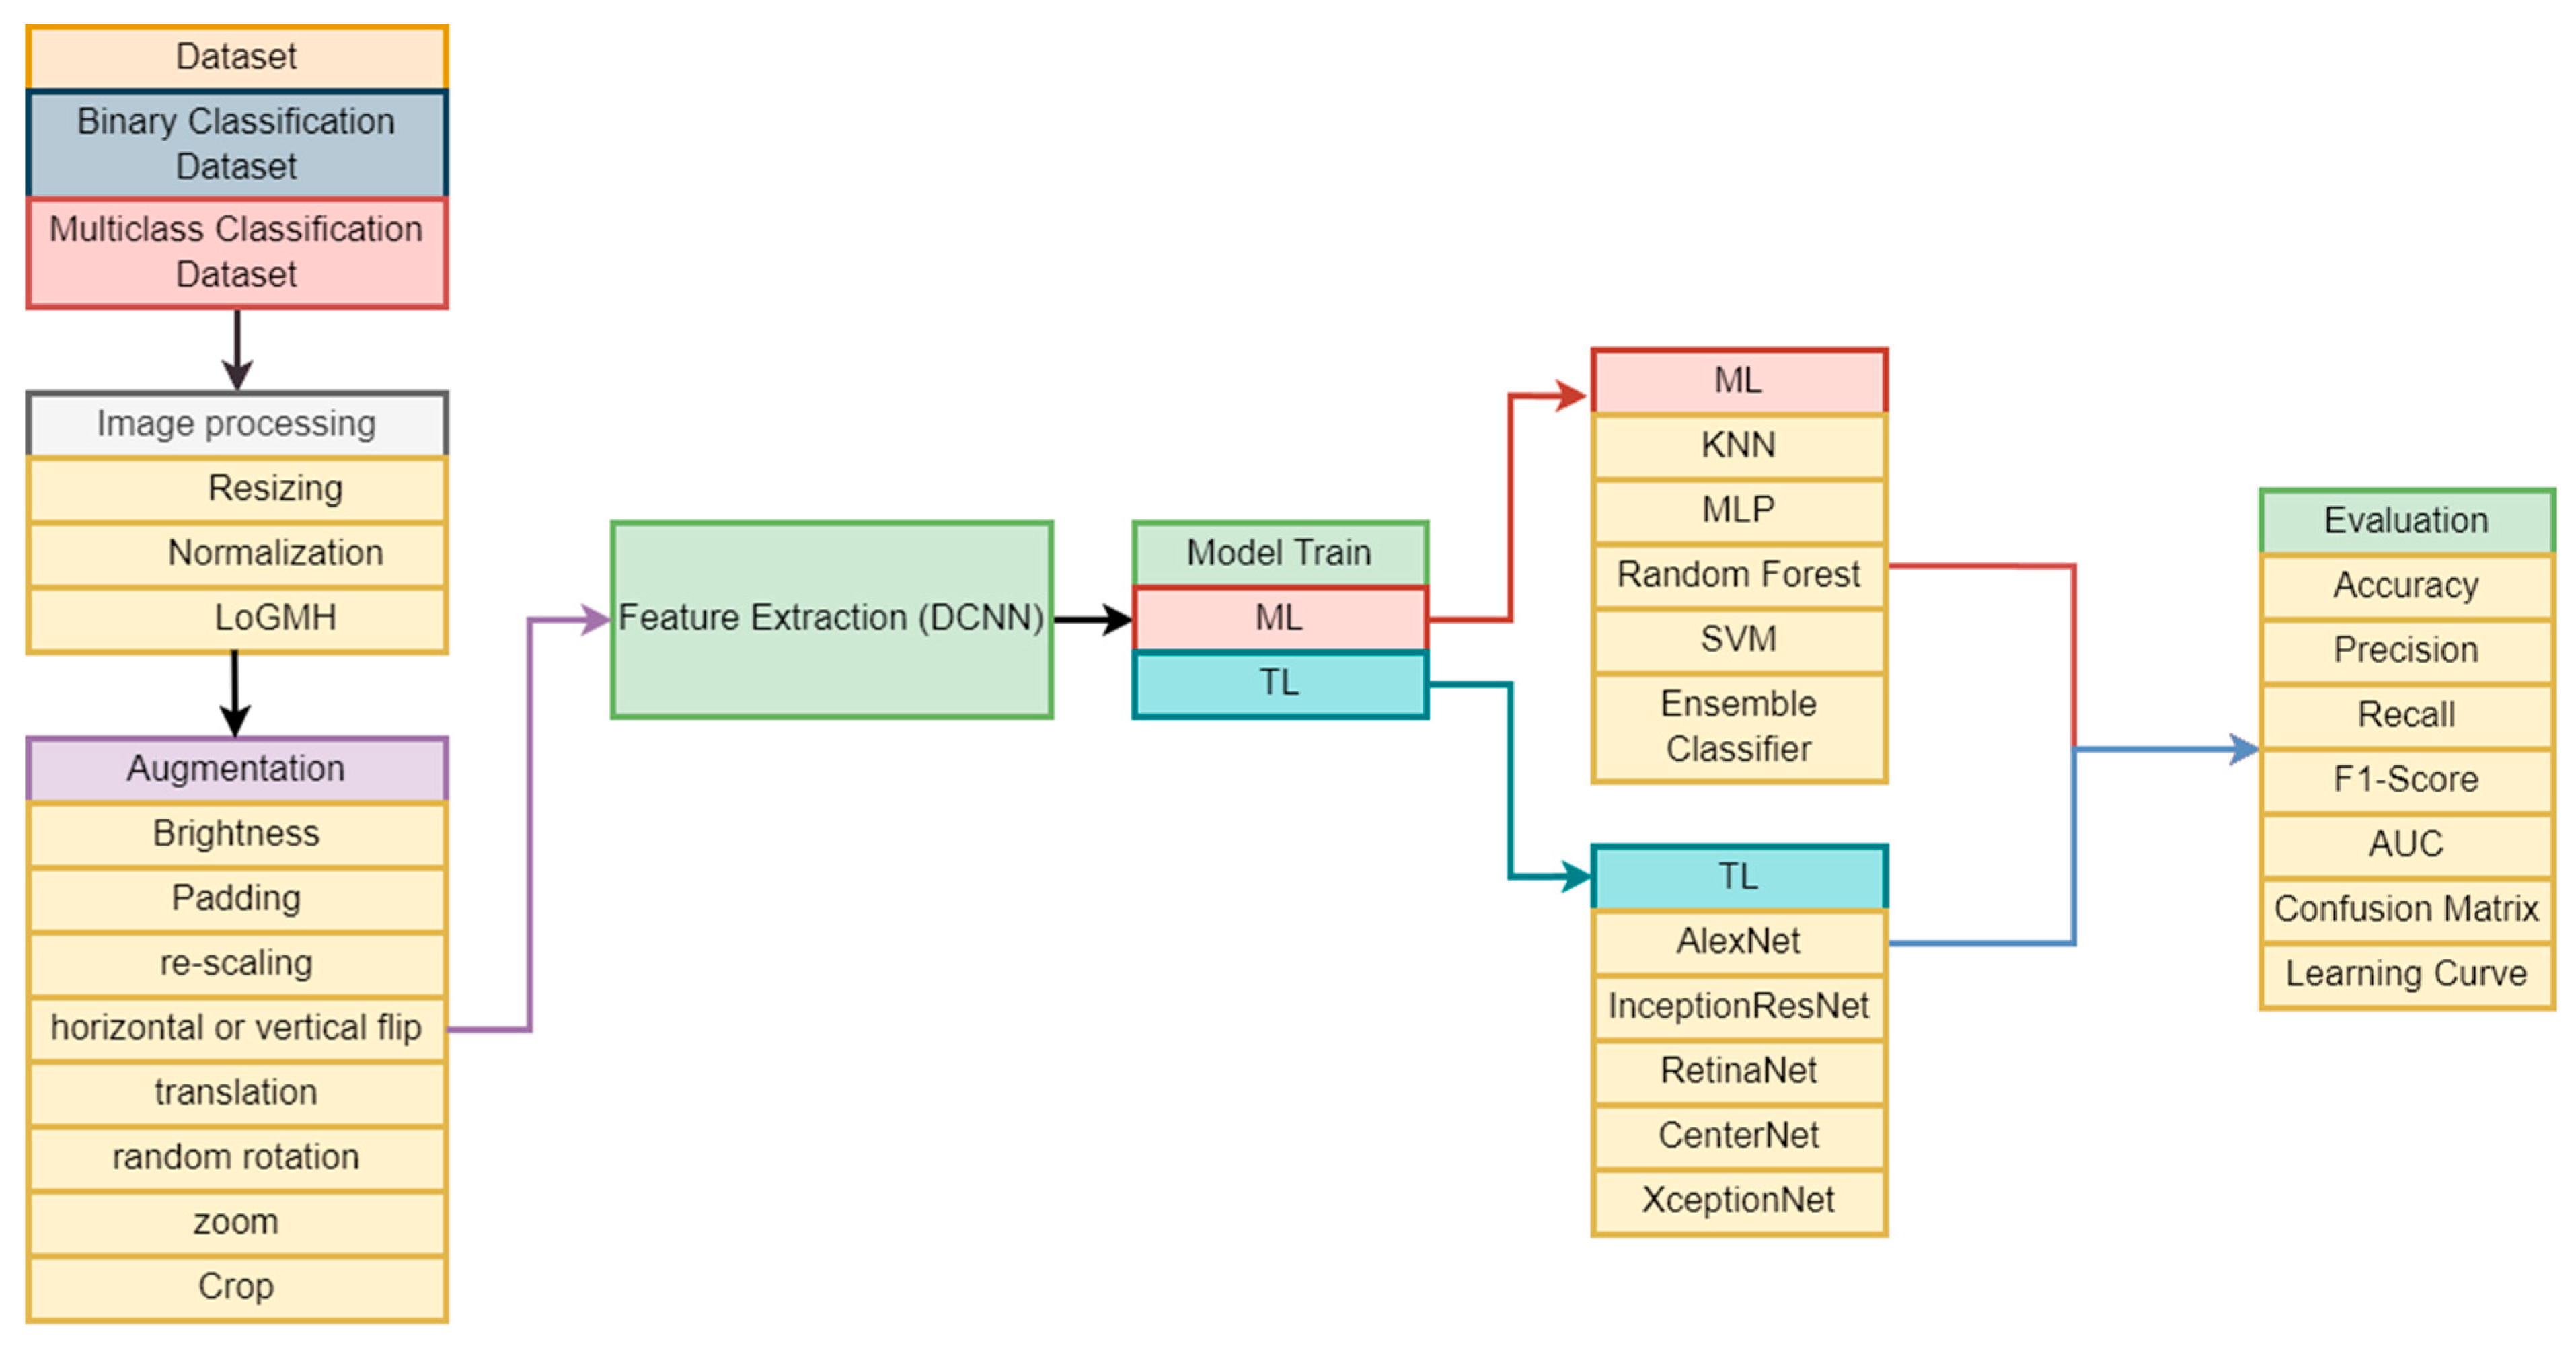
3. Materials and Methods
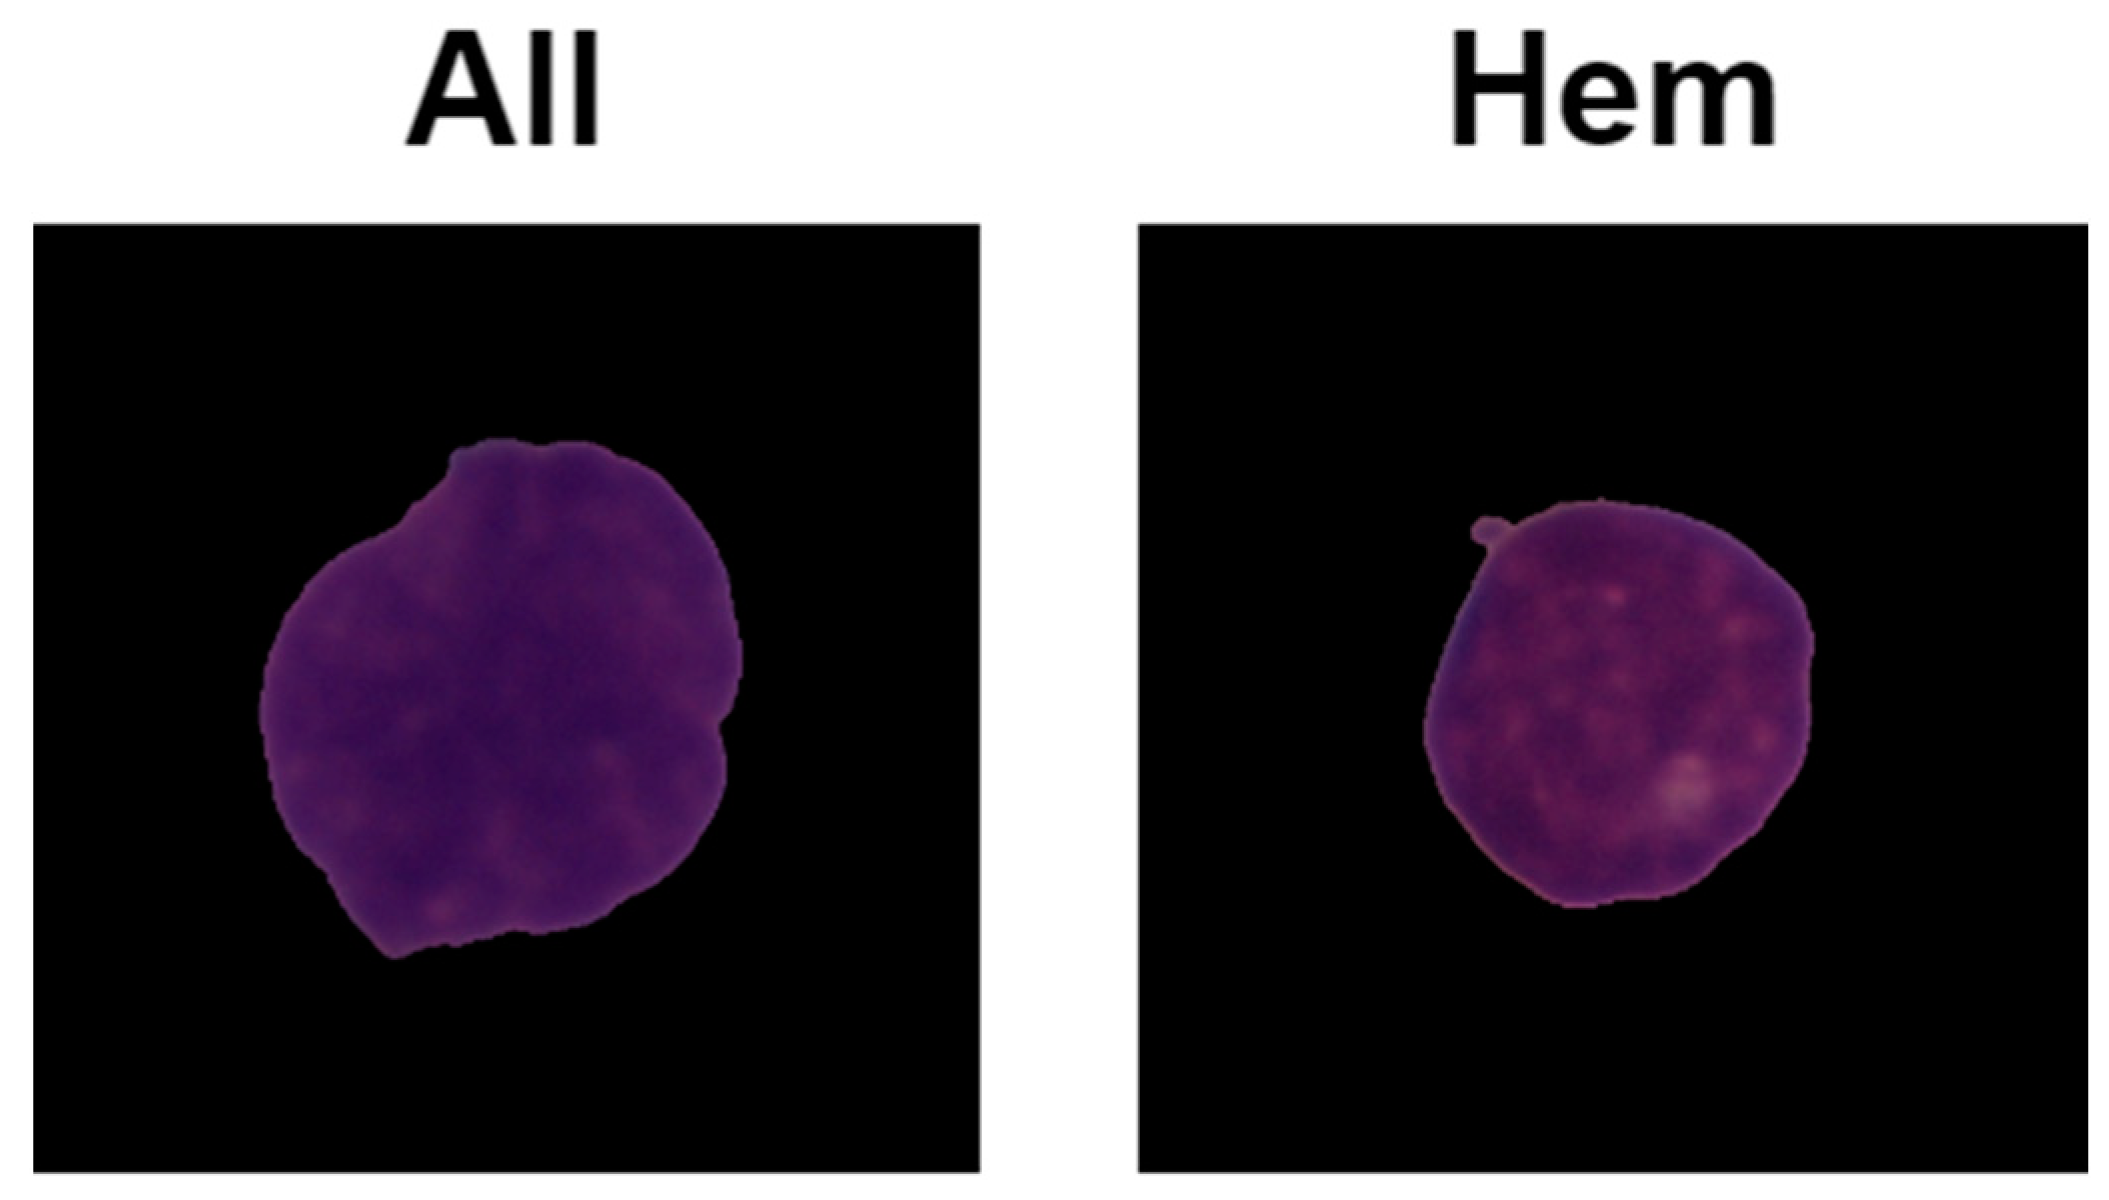
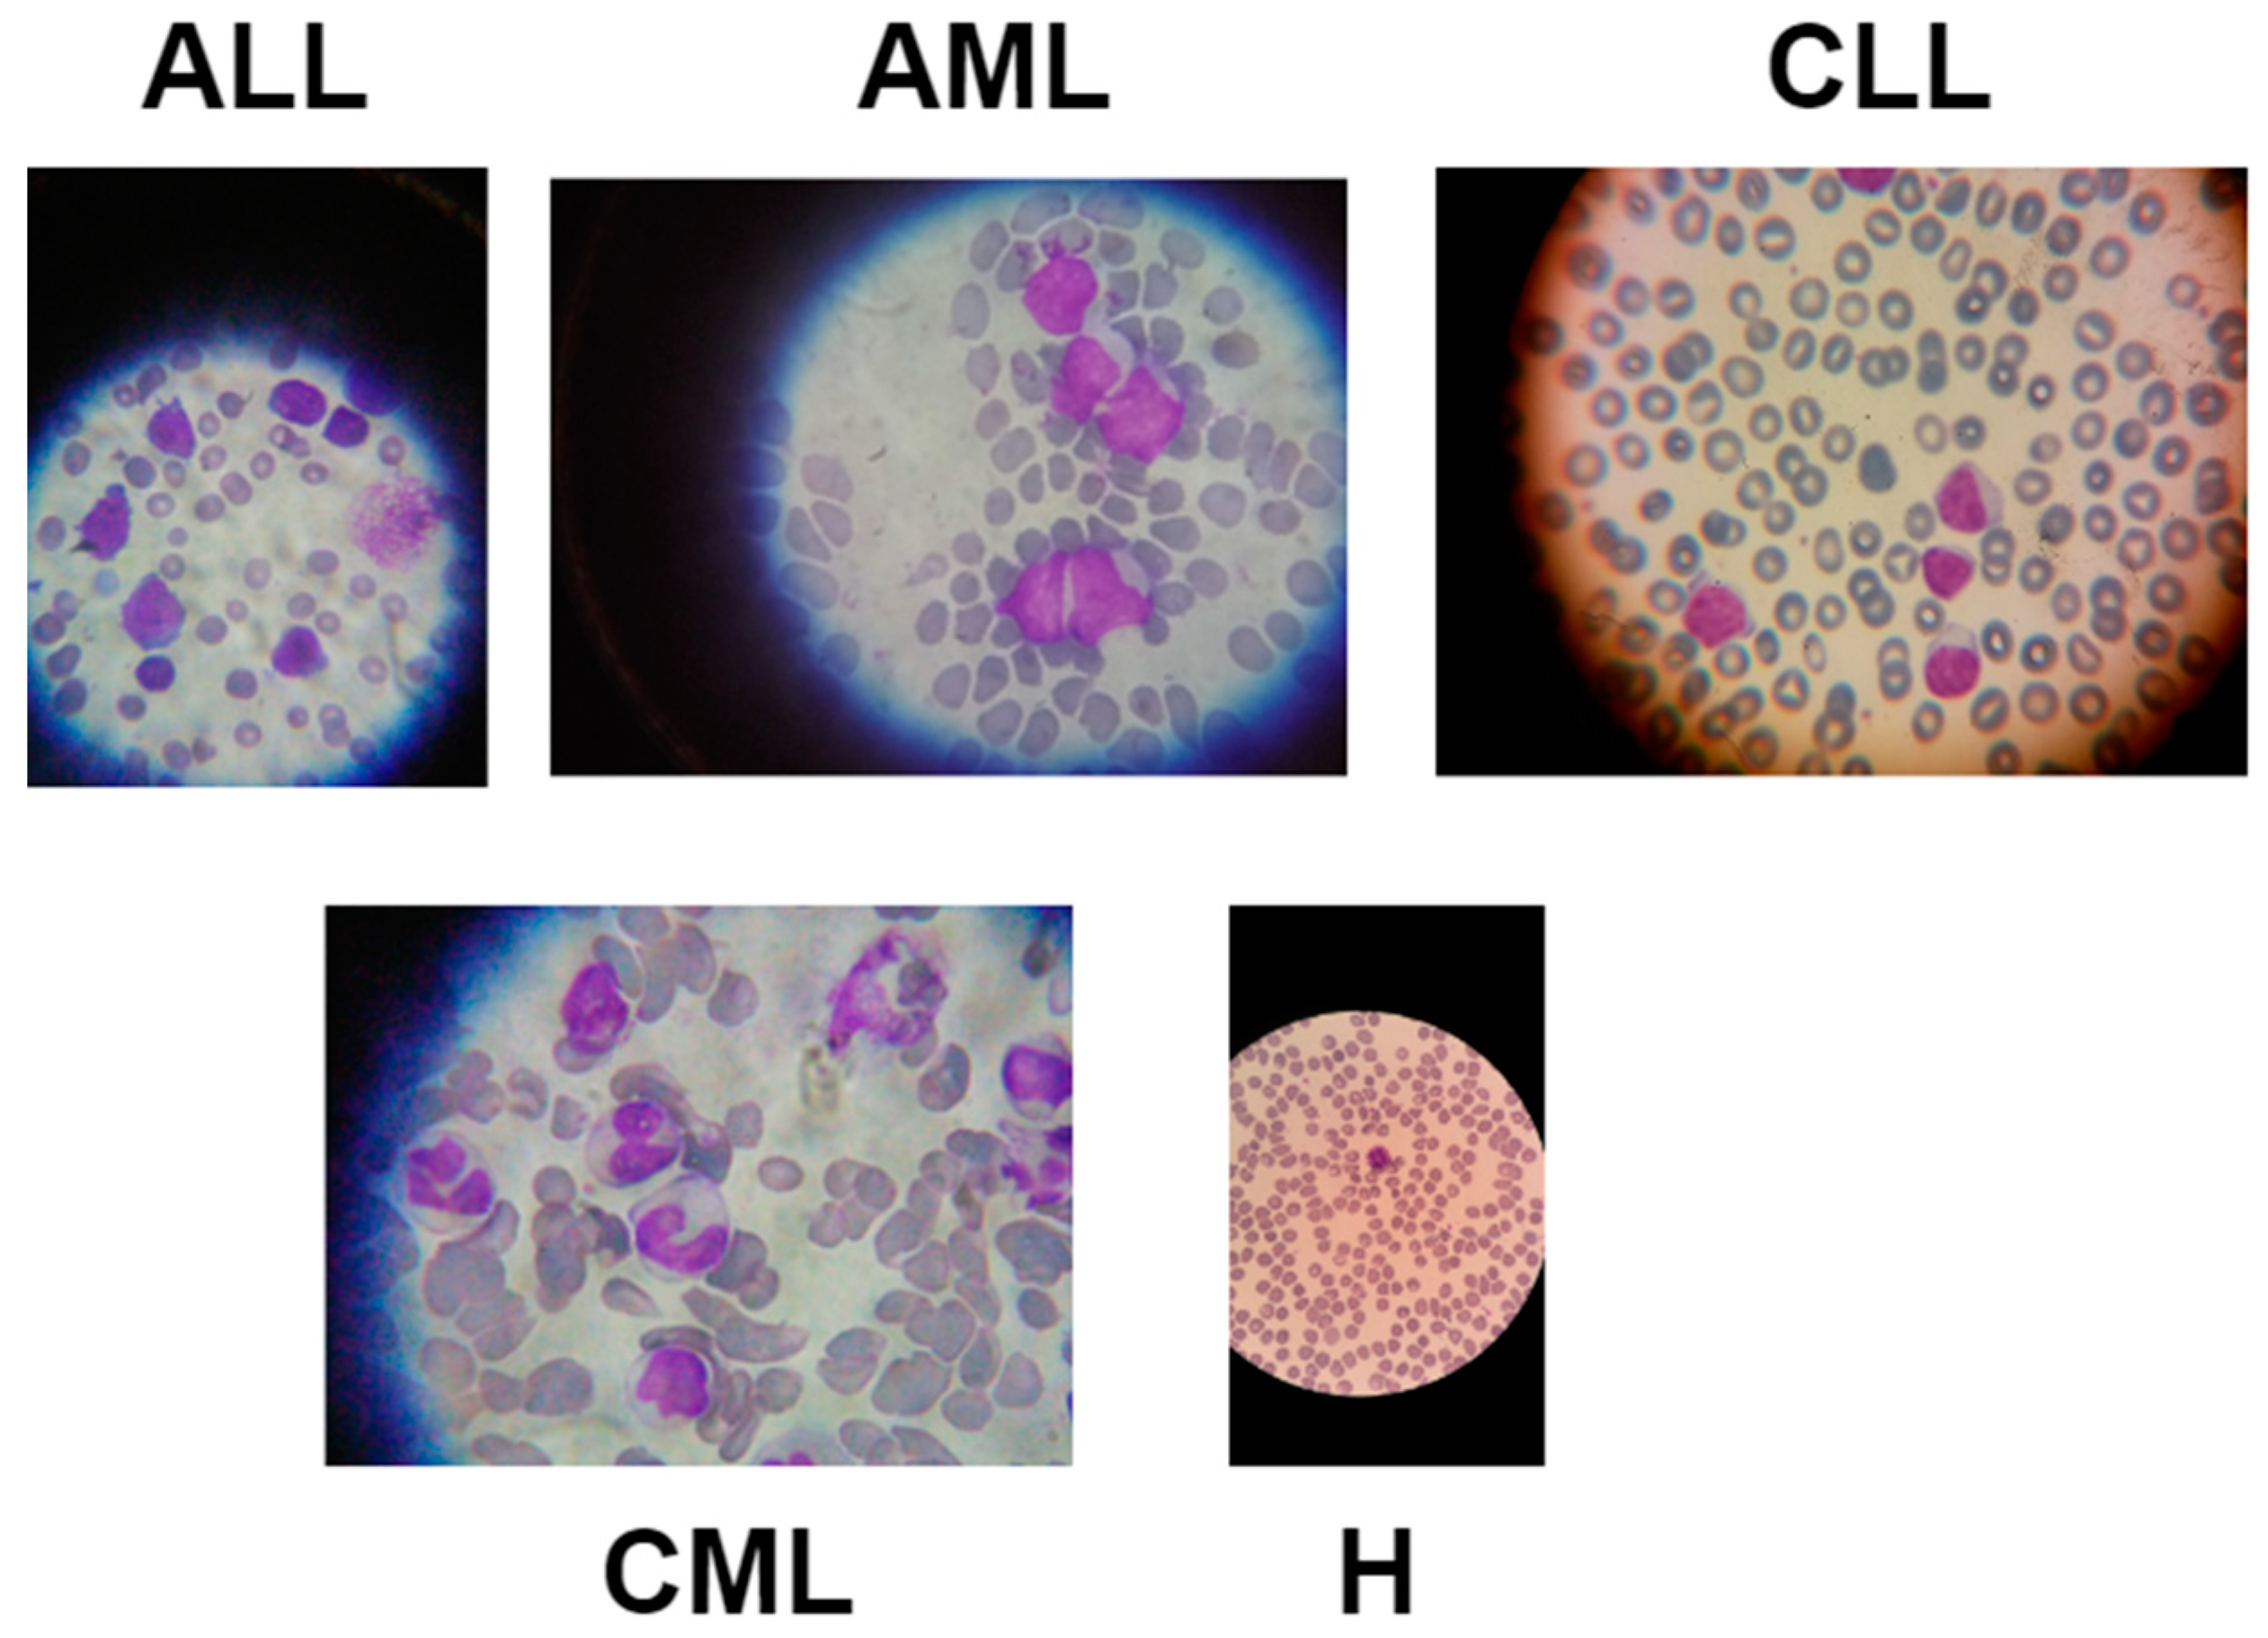
3.1. Data Description
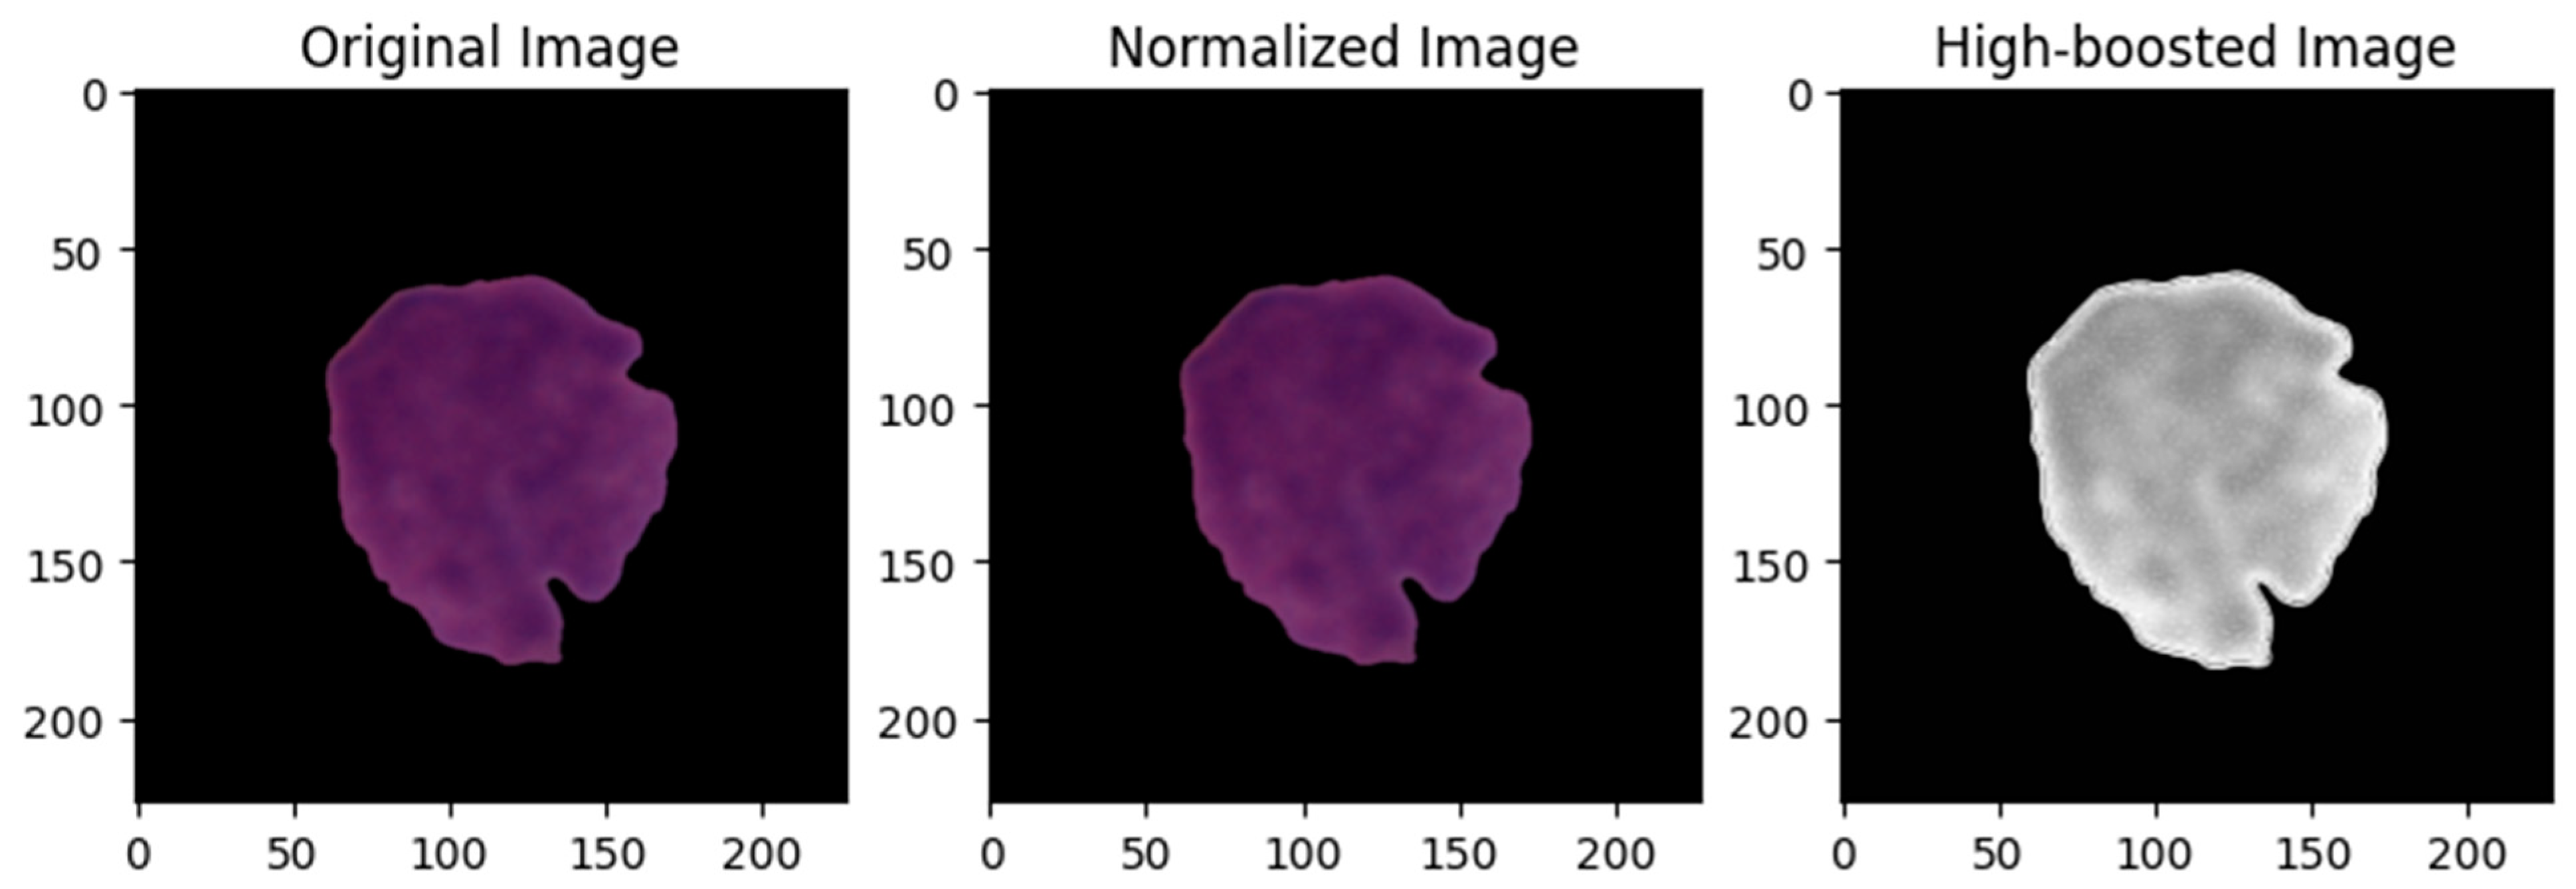
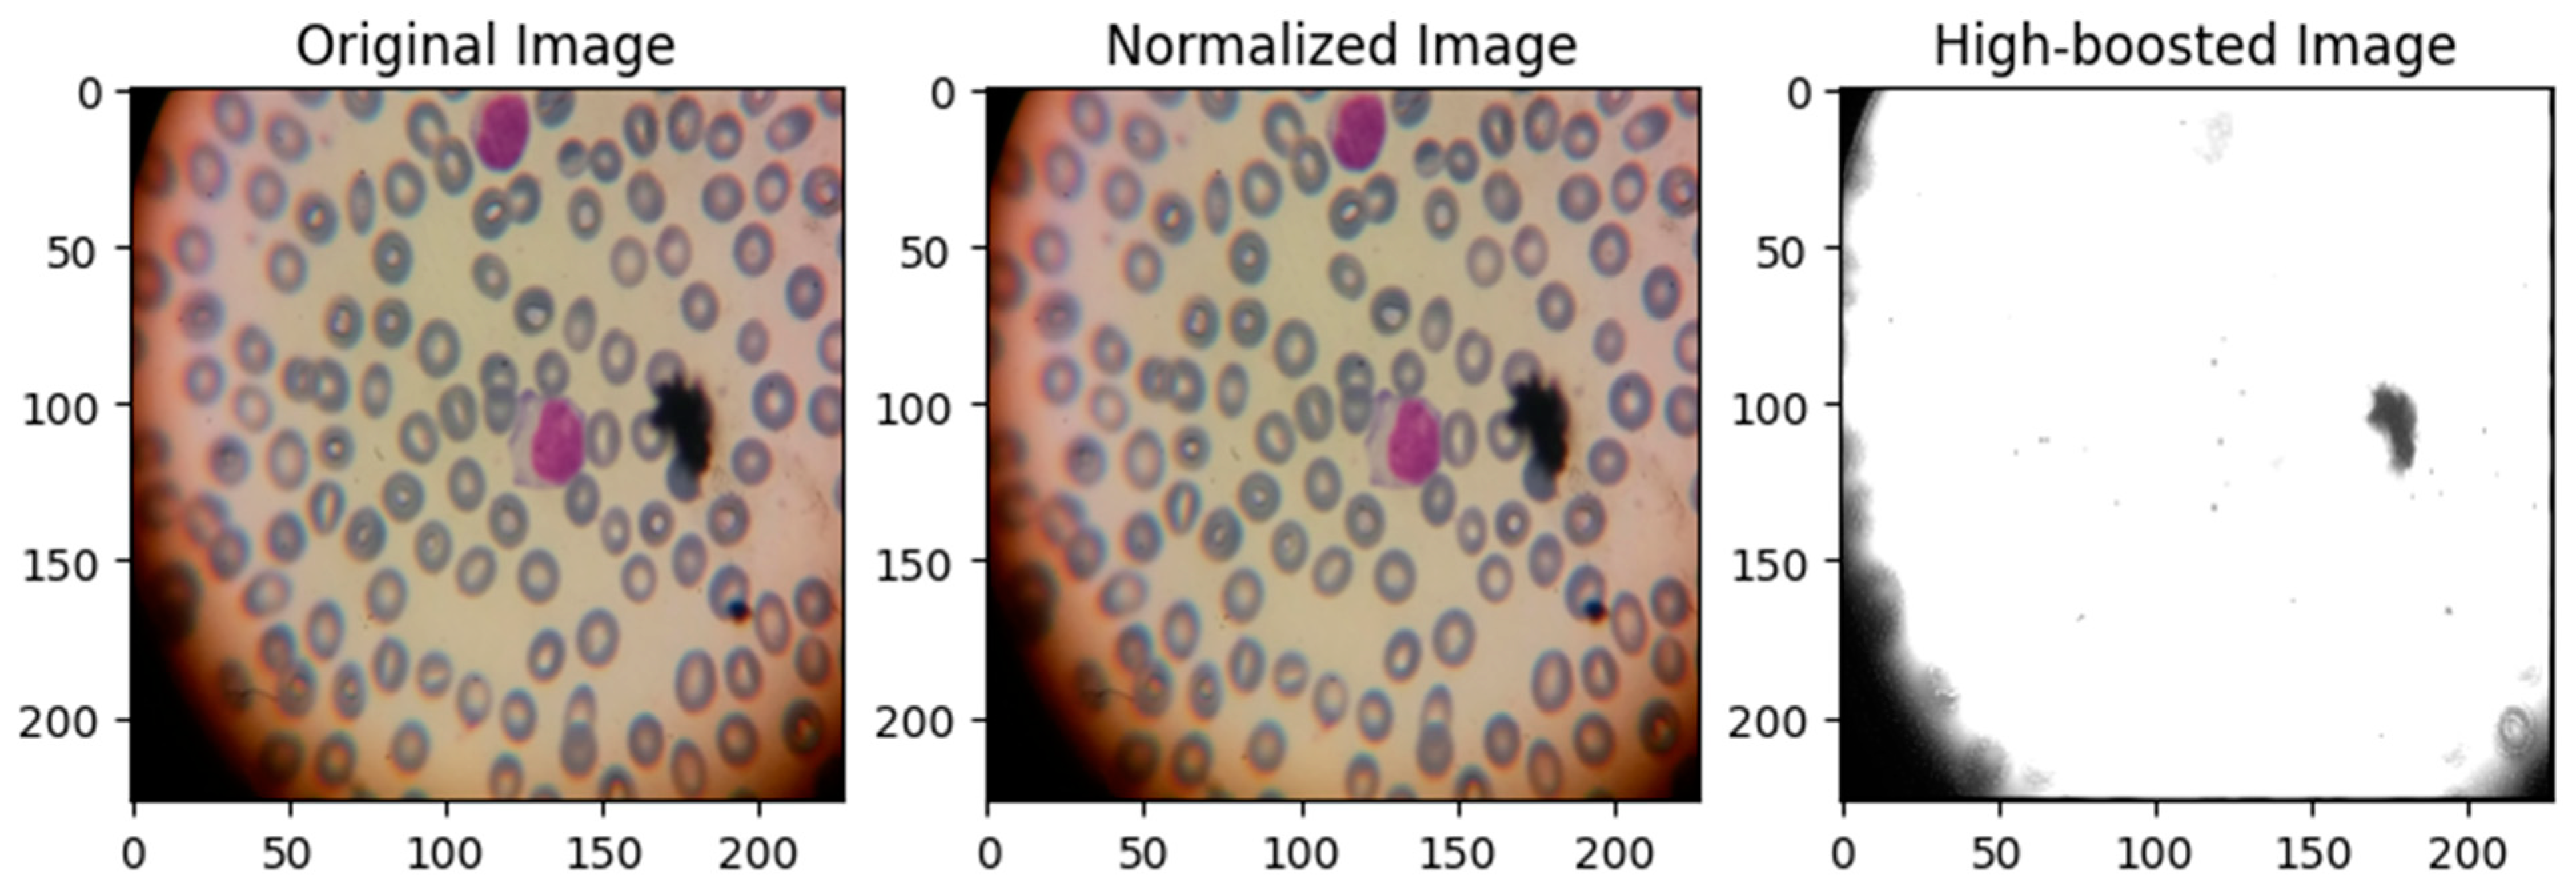
3.2. Image Preprocessing
3.3. Image Augmentation
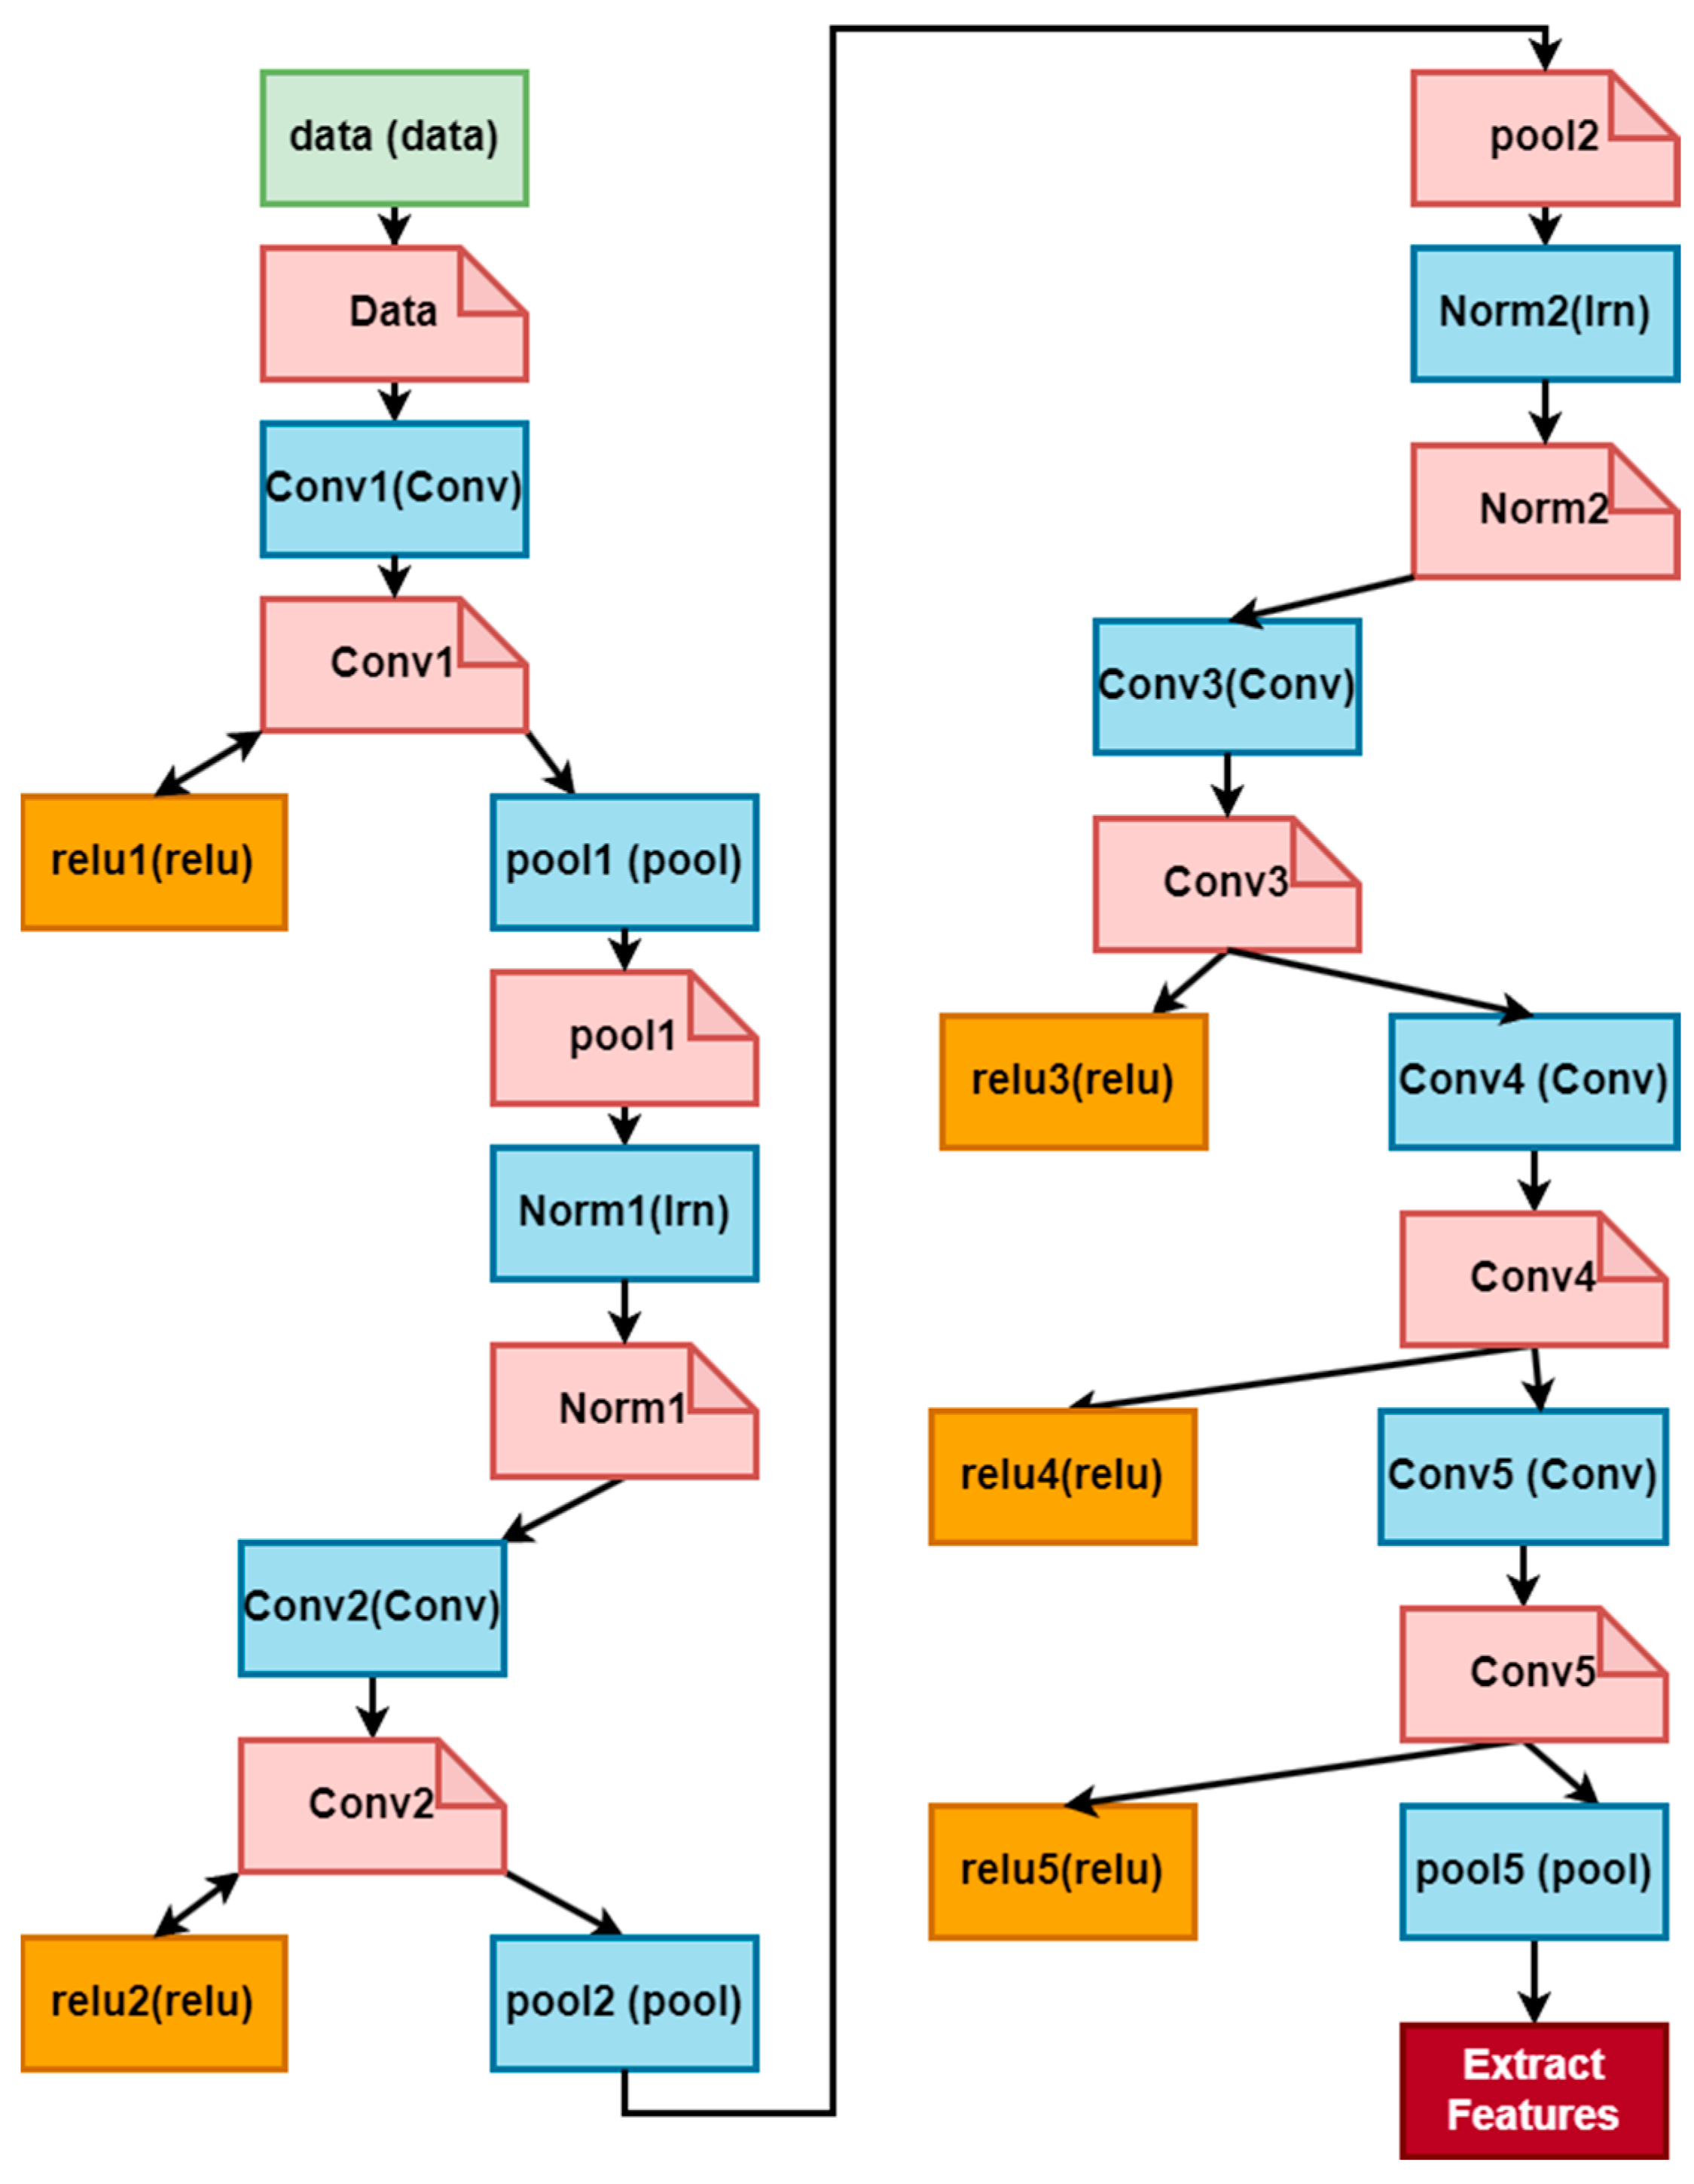
3.4. Feature Extraction Using DCNN
3.5. Experimental Models
3.5.1. ML Models
3.5.2. TL Models
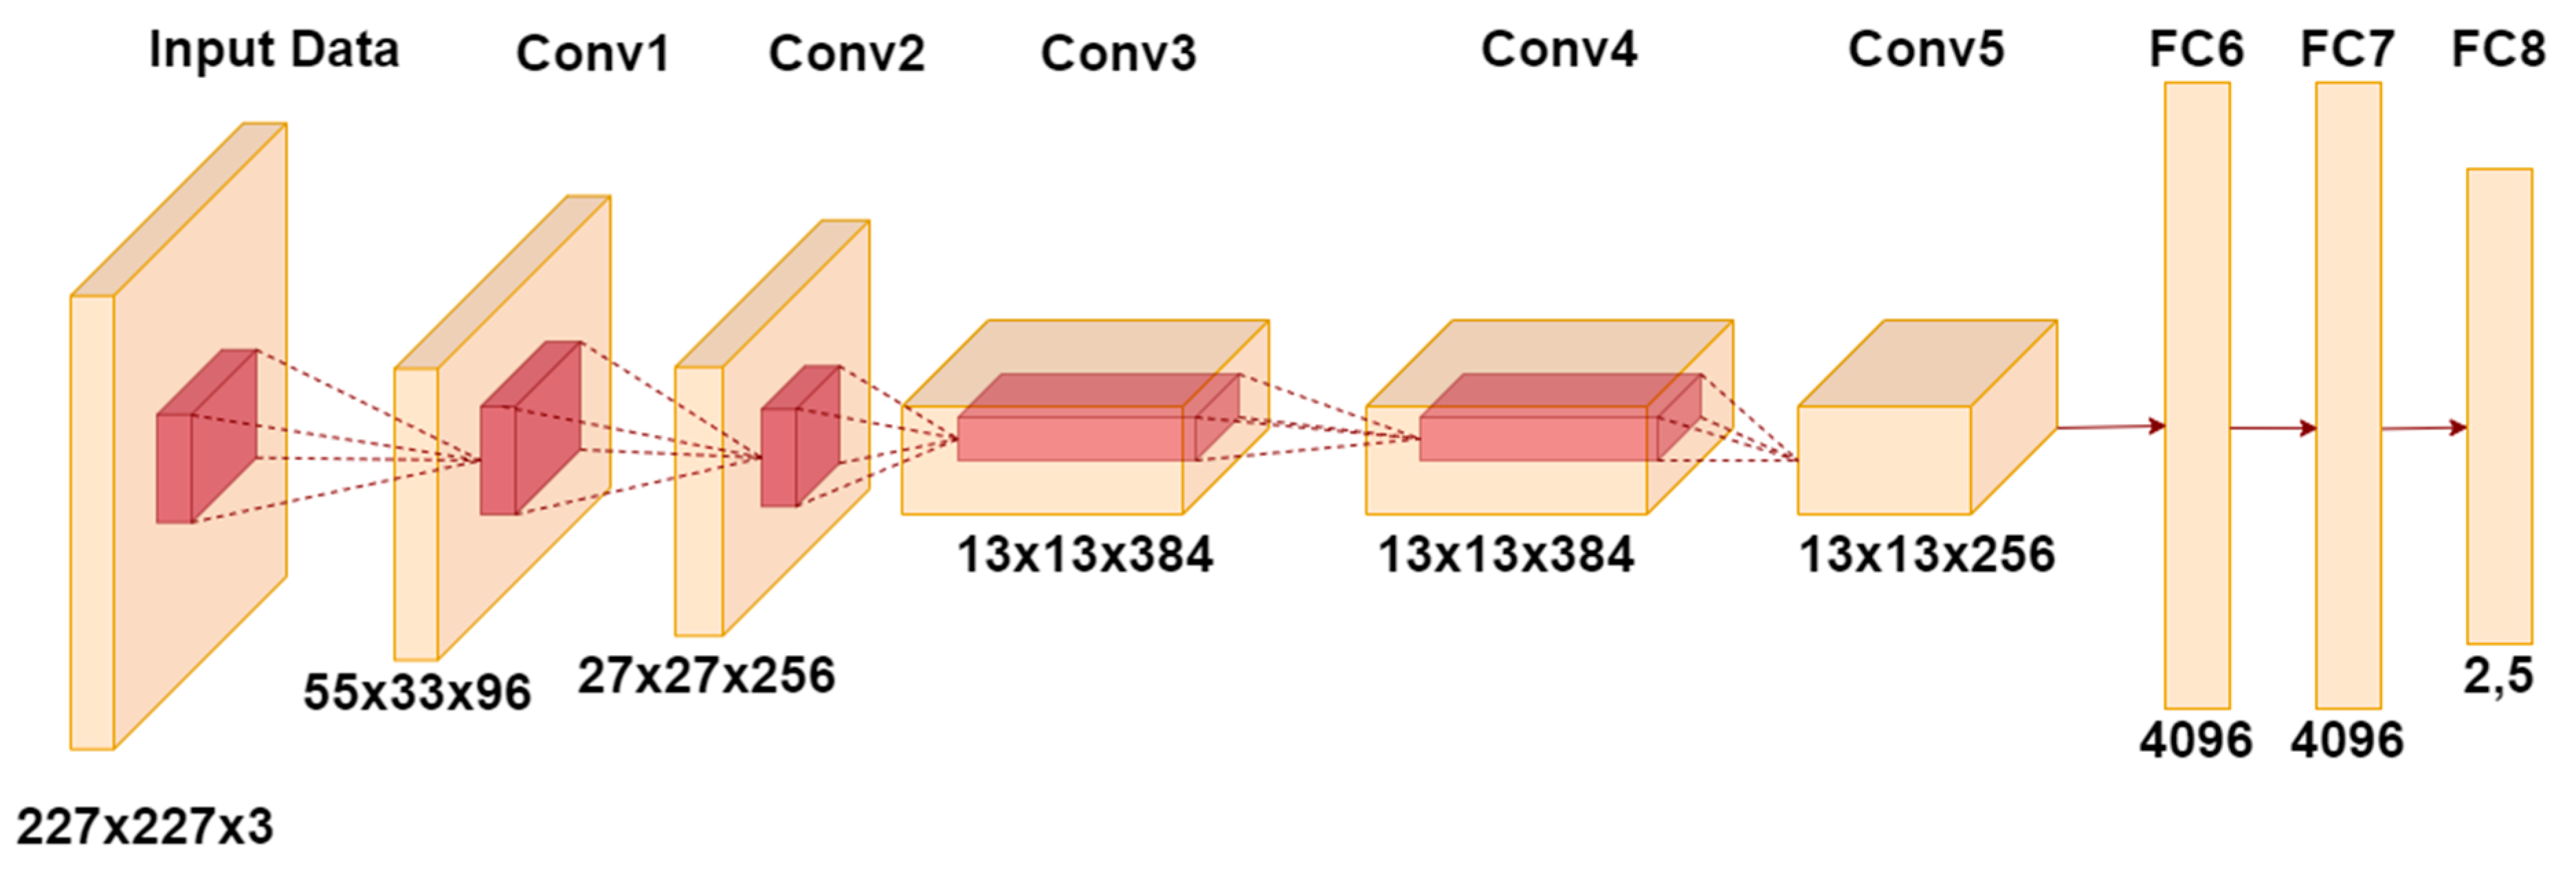
AlexNet
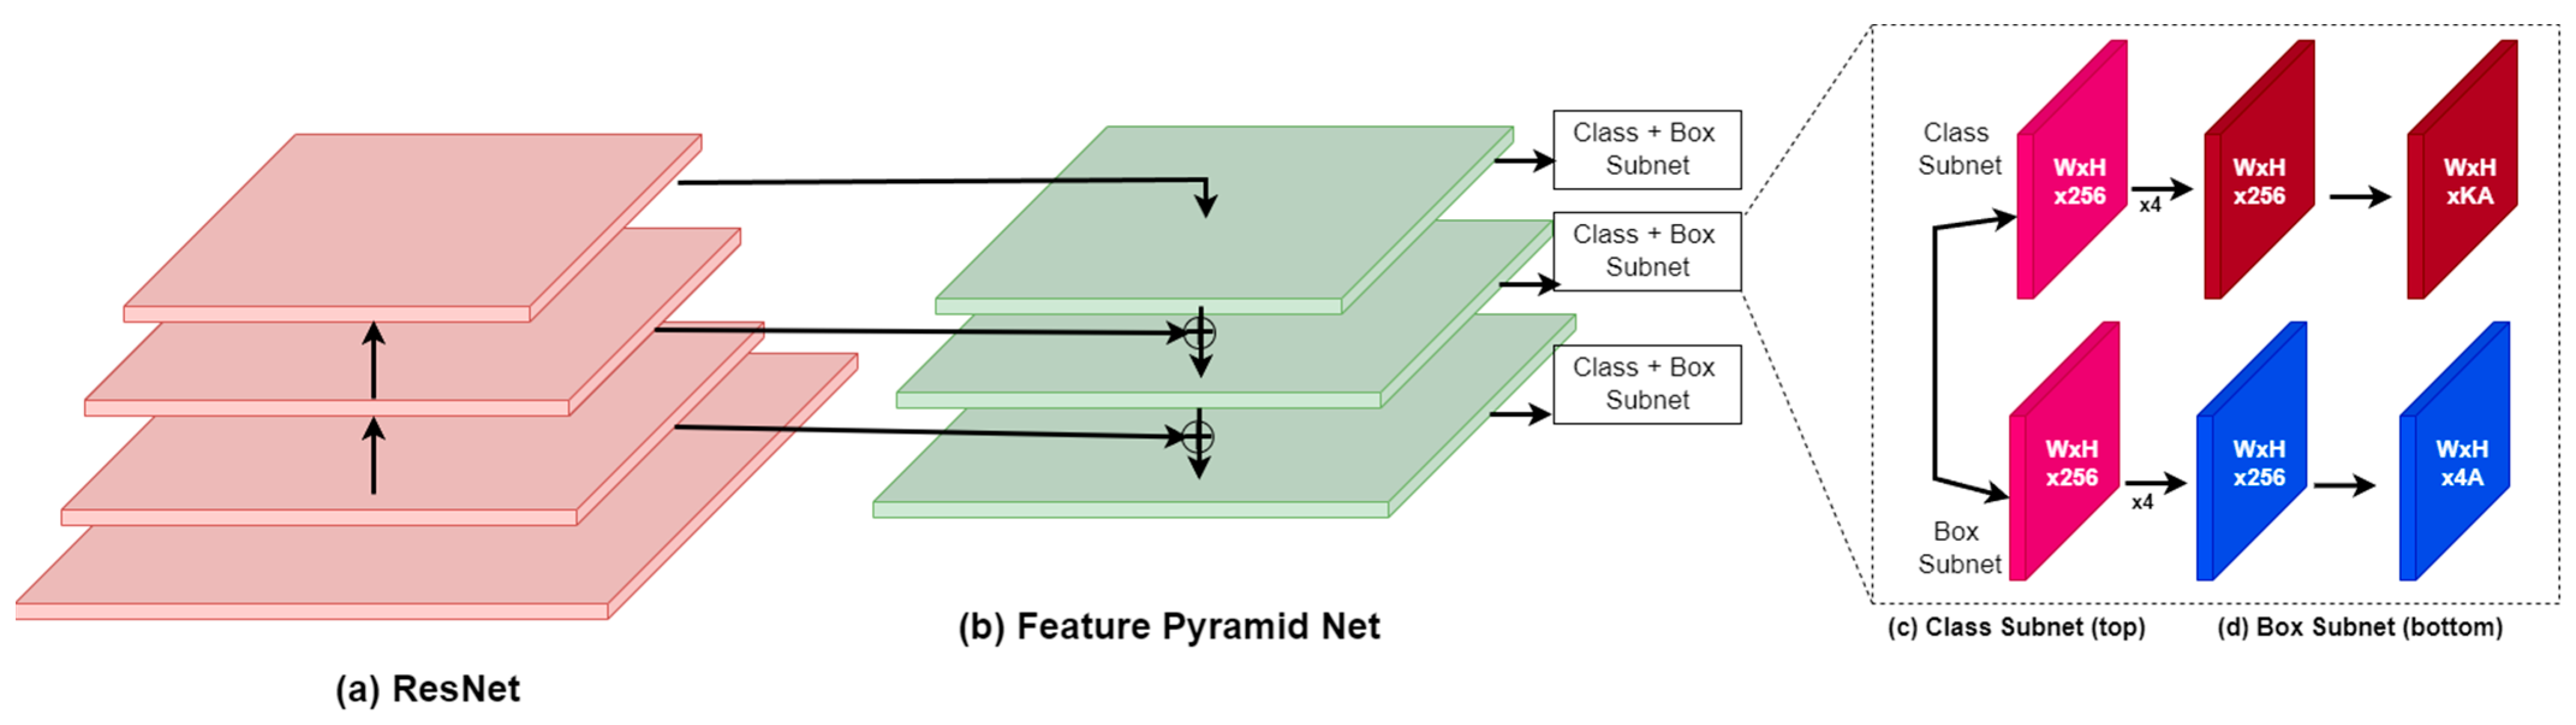
RetinaNet
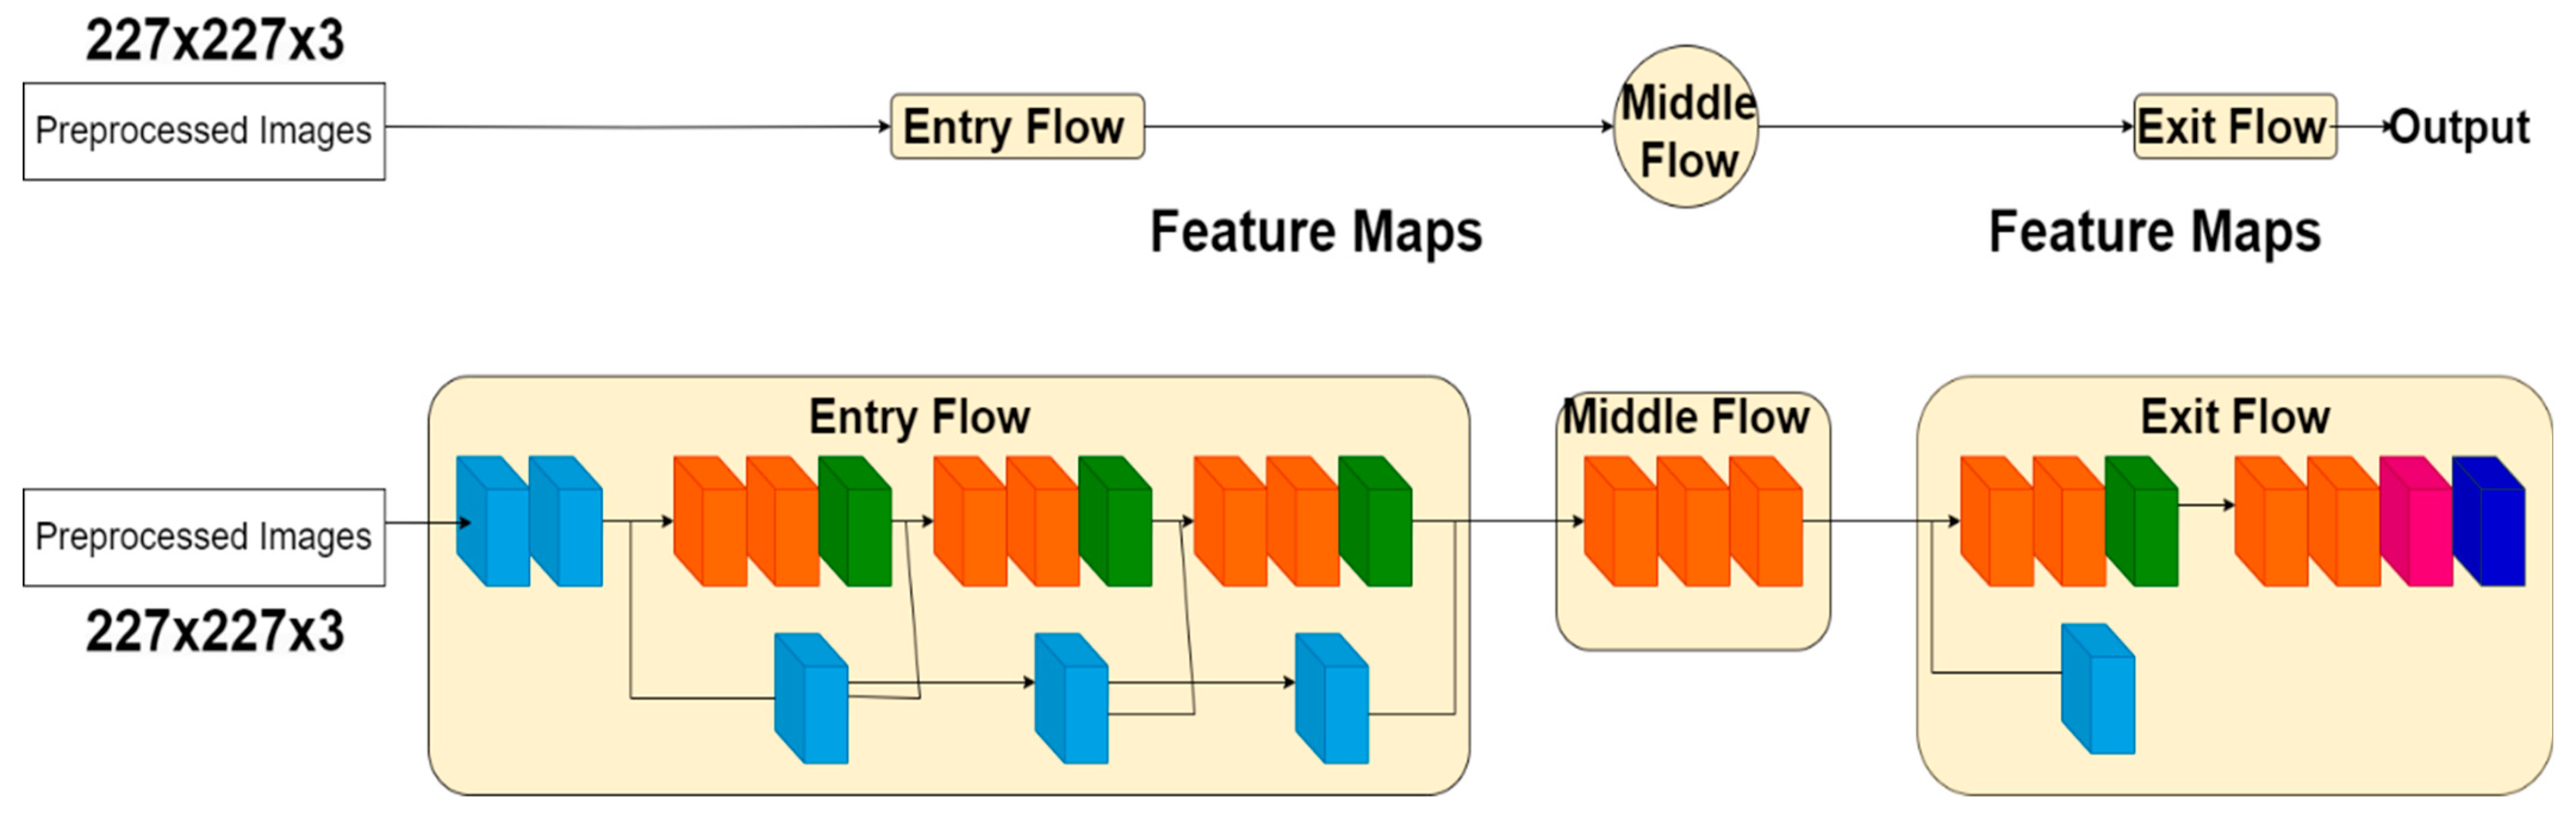
XceptionNet
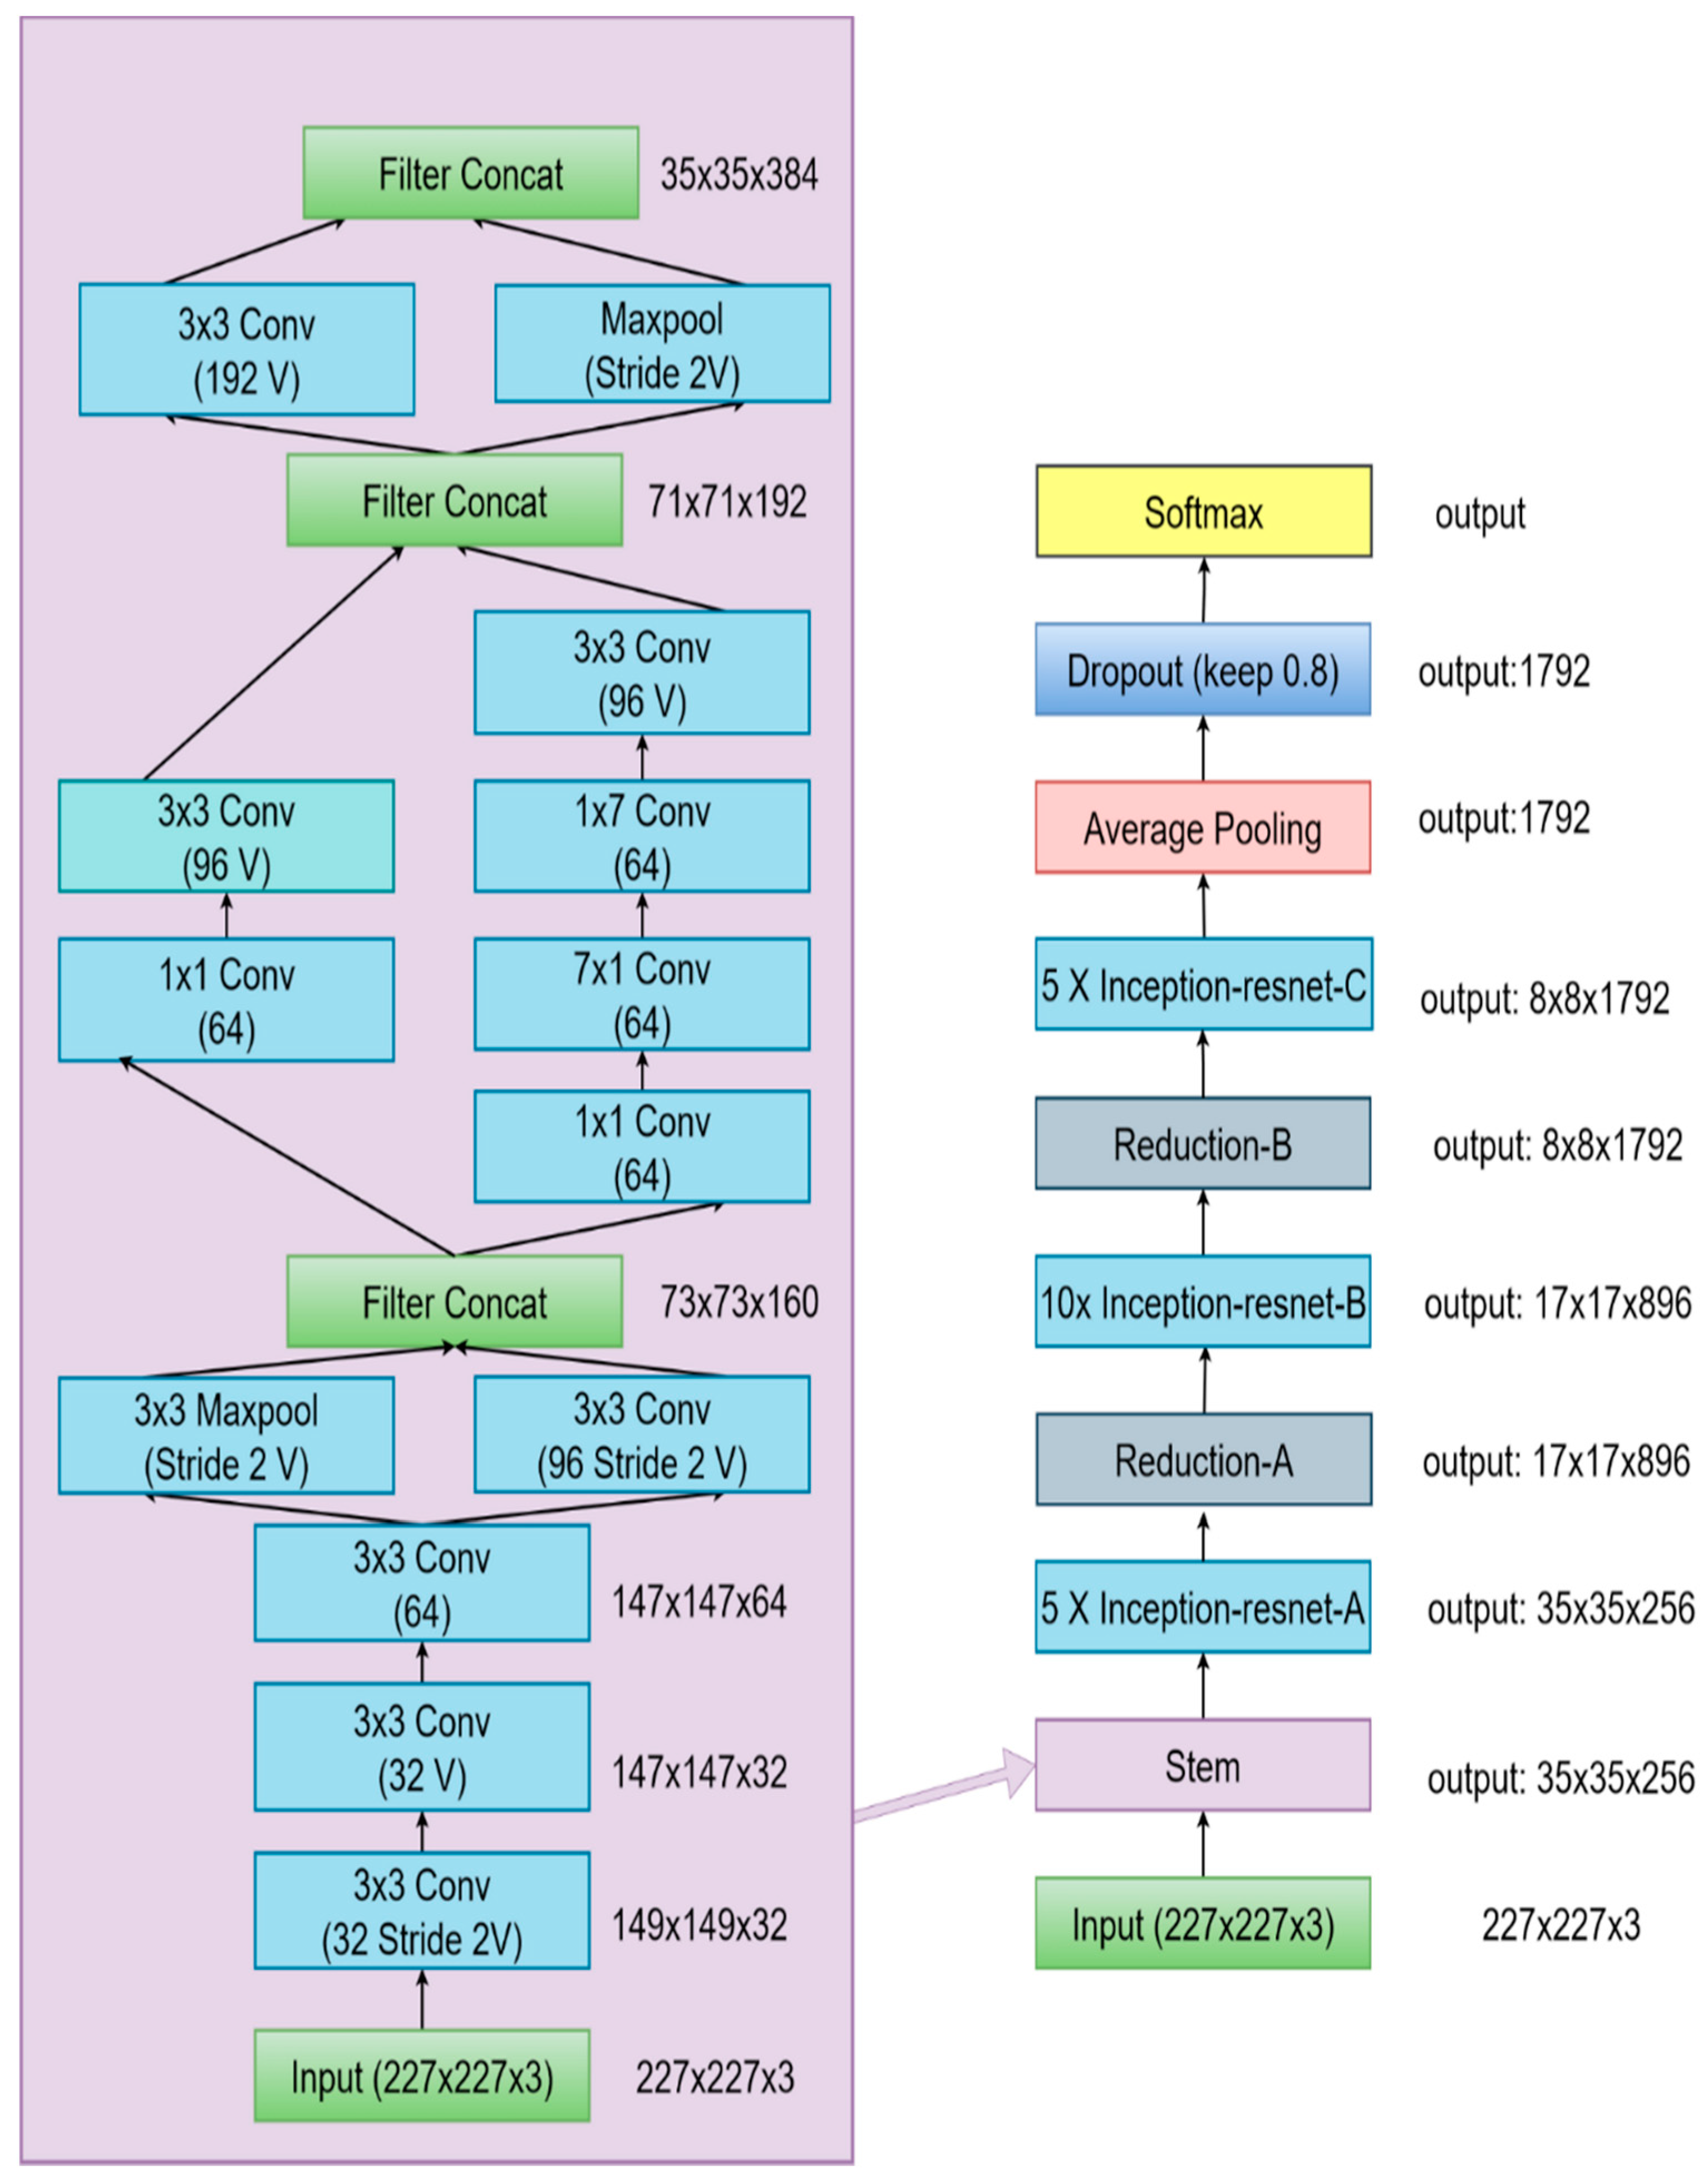
InceptionResNet
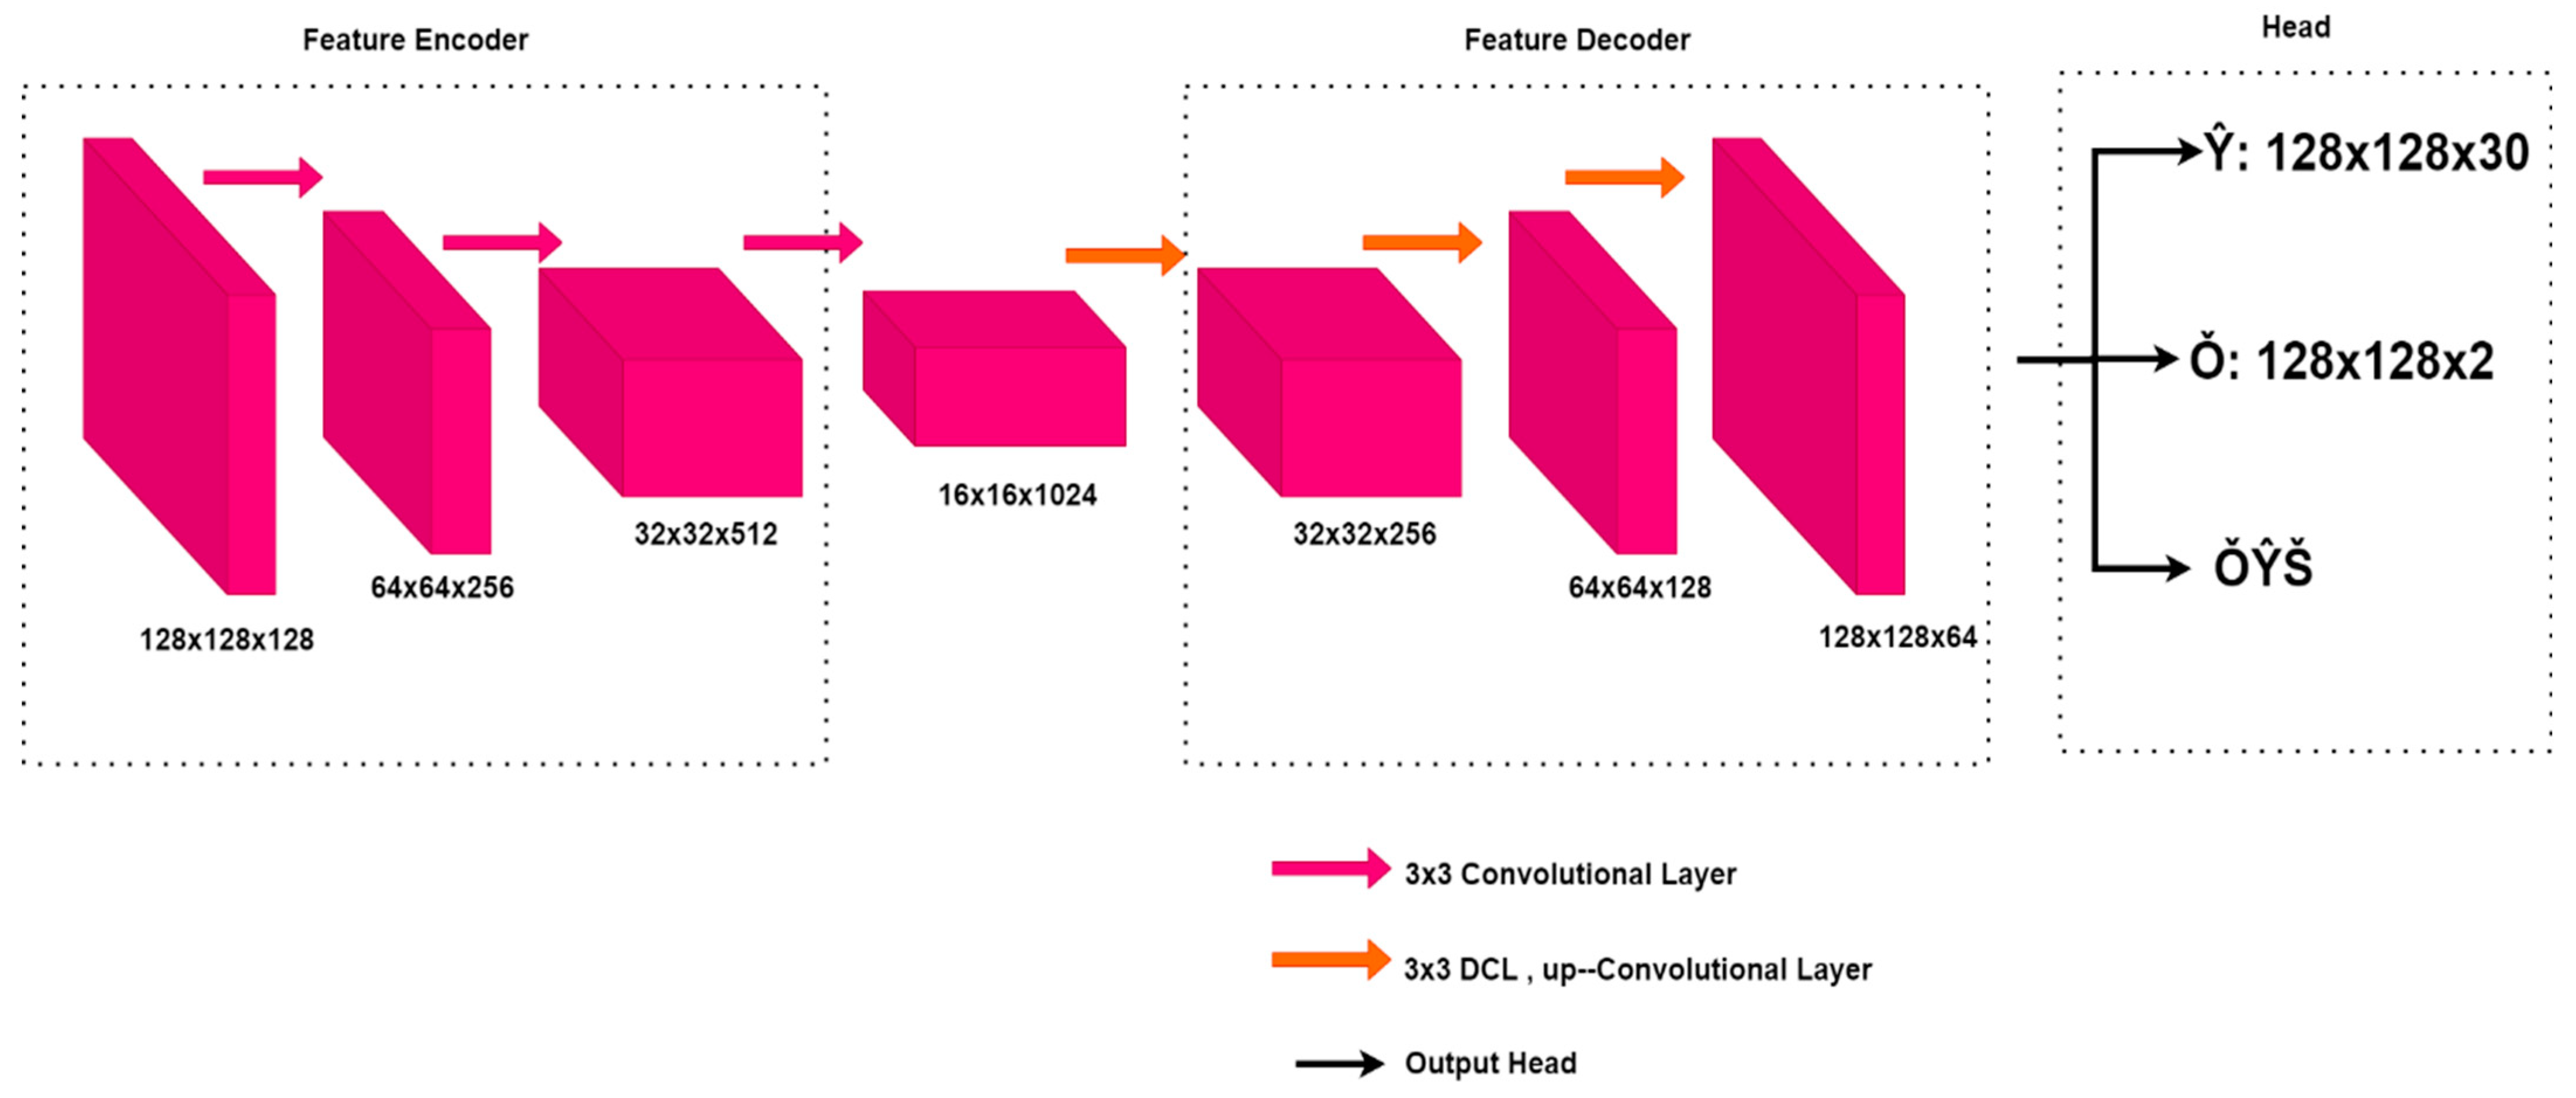
CenterNet
3.6. Training Parameters
3.7. Evaluation
- Accuracy: This metric evaluates the overall correctness of the model predictions by calculating the ratio of correctly predicted instances to the total instances.
- Precision: It evaluates the correctness of positive predictions made by the model, by determining the proportion of true positive predictions to the overall predicted positives.
- Recall (Sensitivity): Evaluates the model’s ability to accurately identify positive instances by comparing true positives to the total actual positives.
- The F1 score is a metric that combines precision and recall, providing a balanced evaluation. It is especially beneficial in situations where there is an uneven distribution of classes.
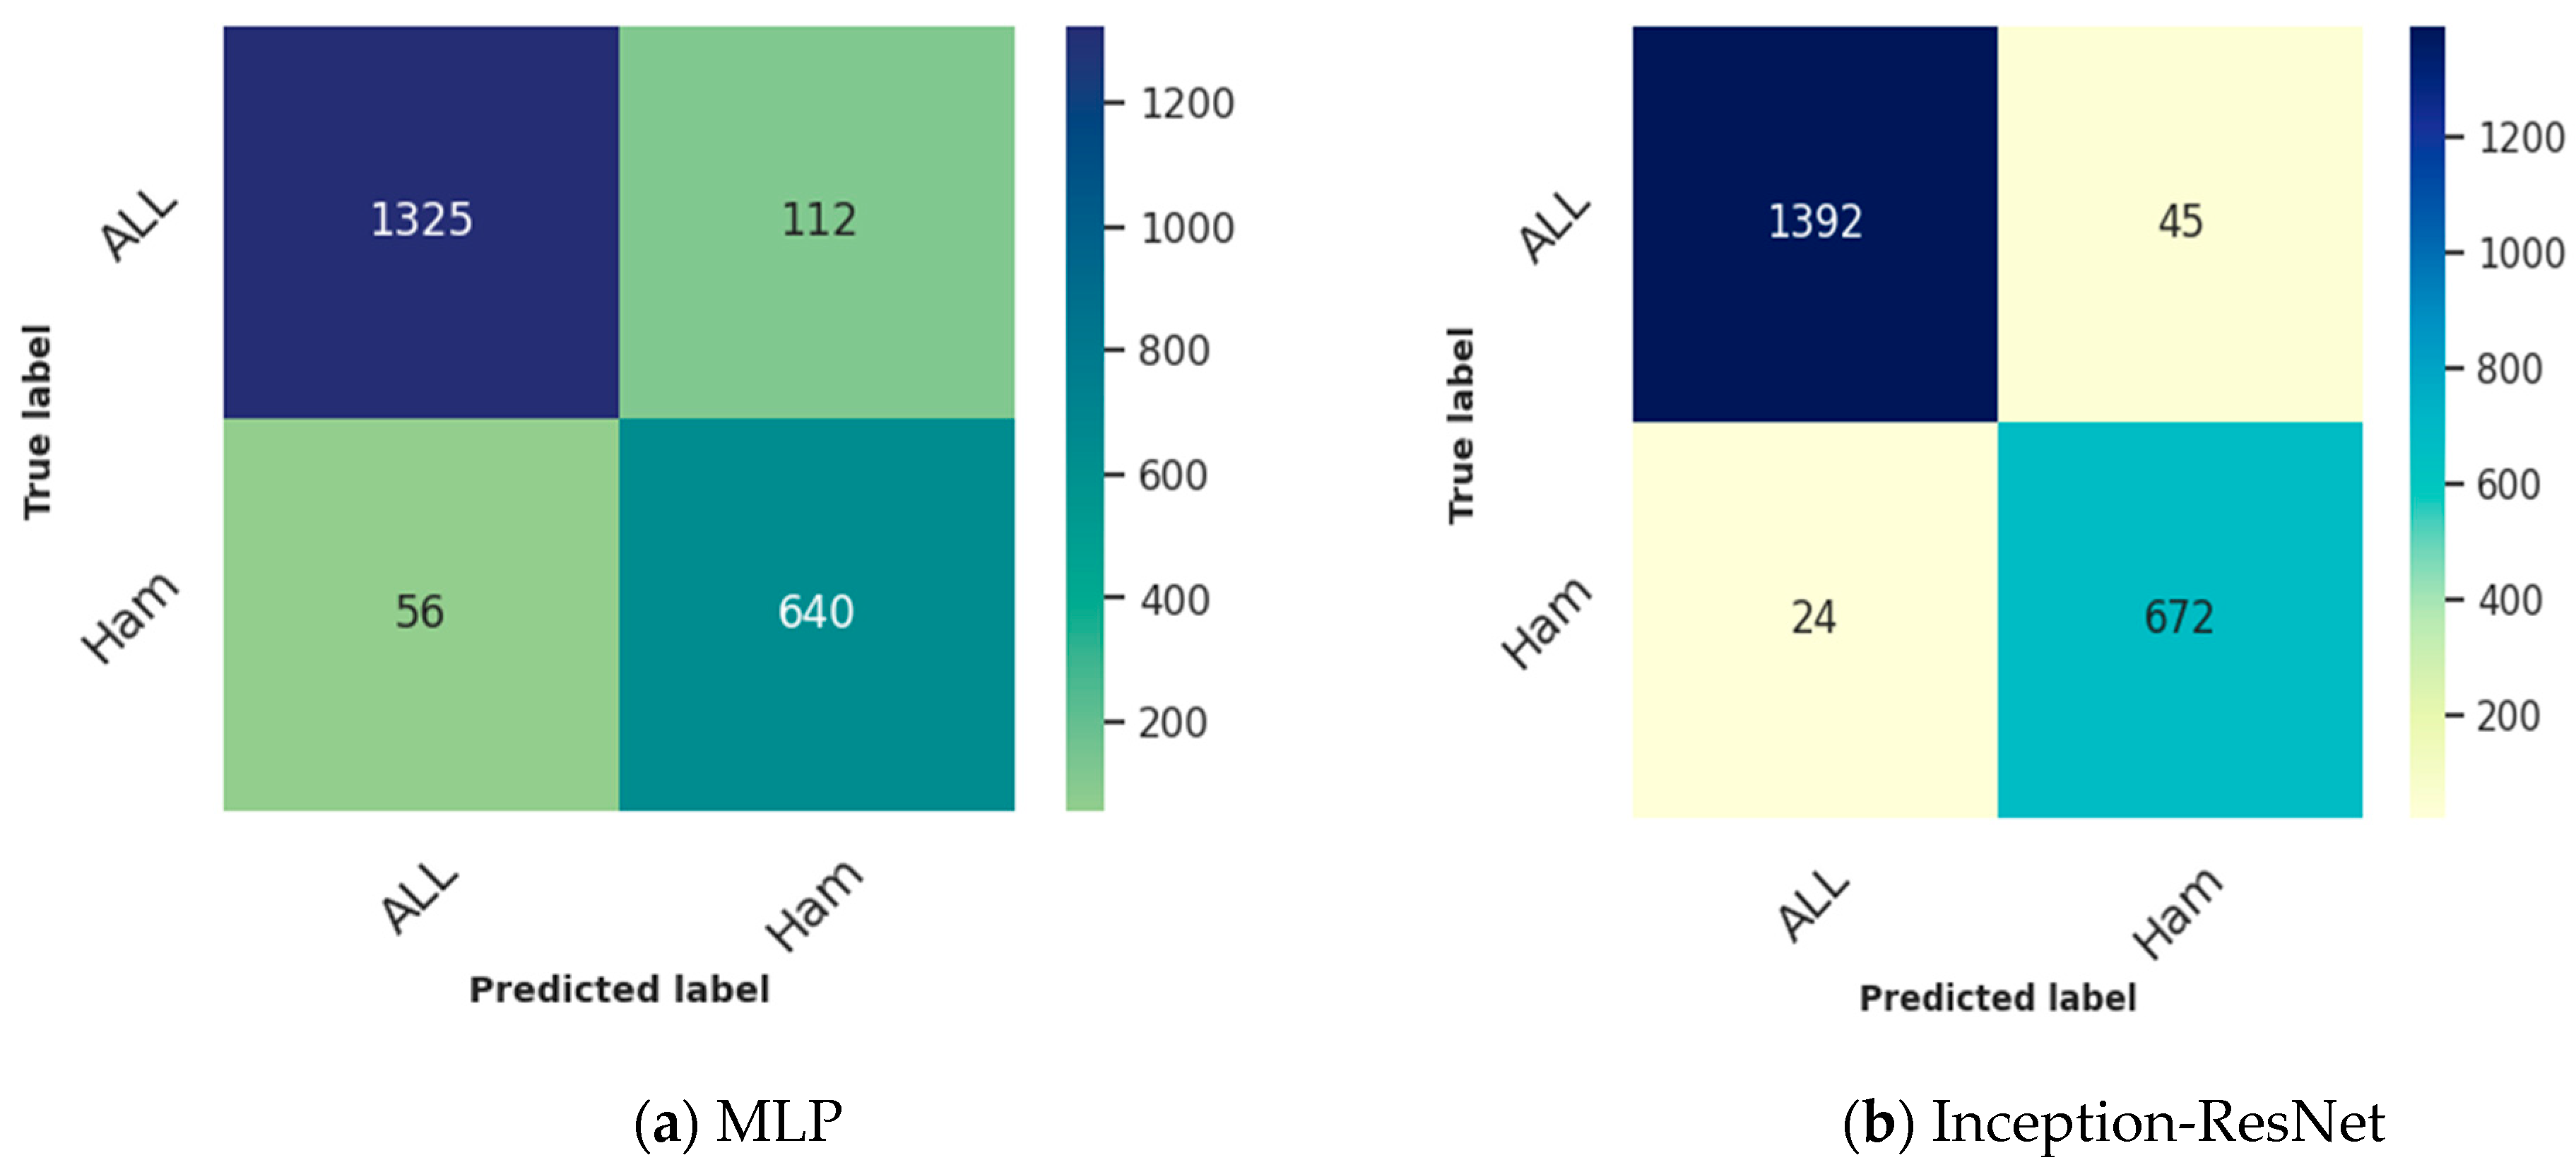
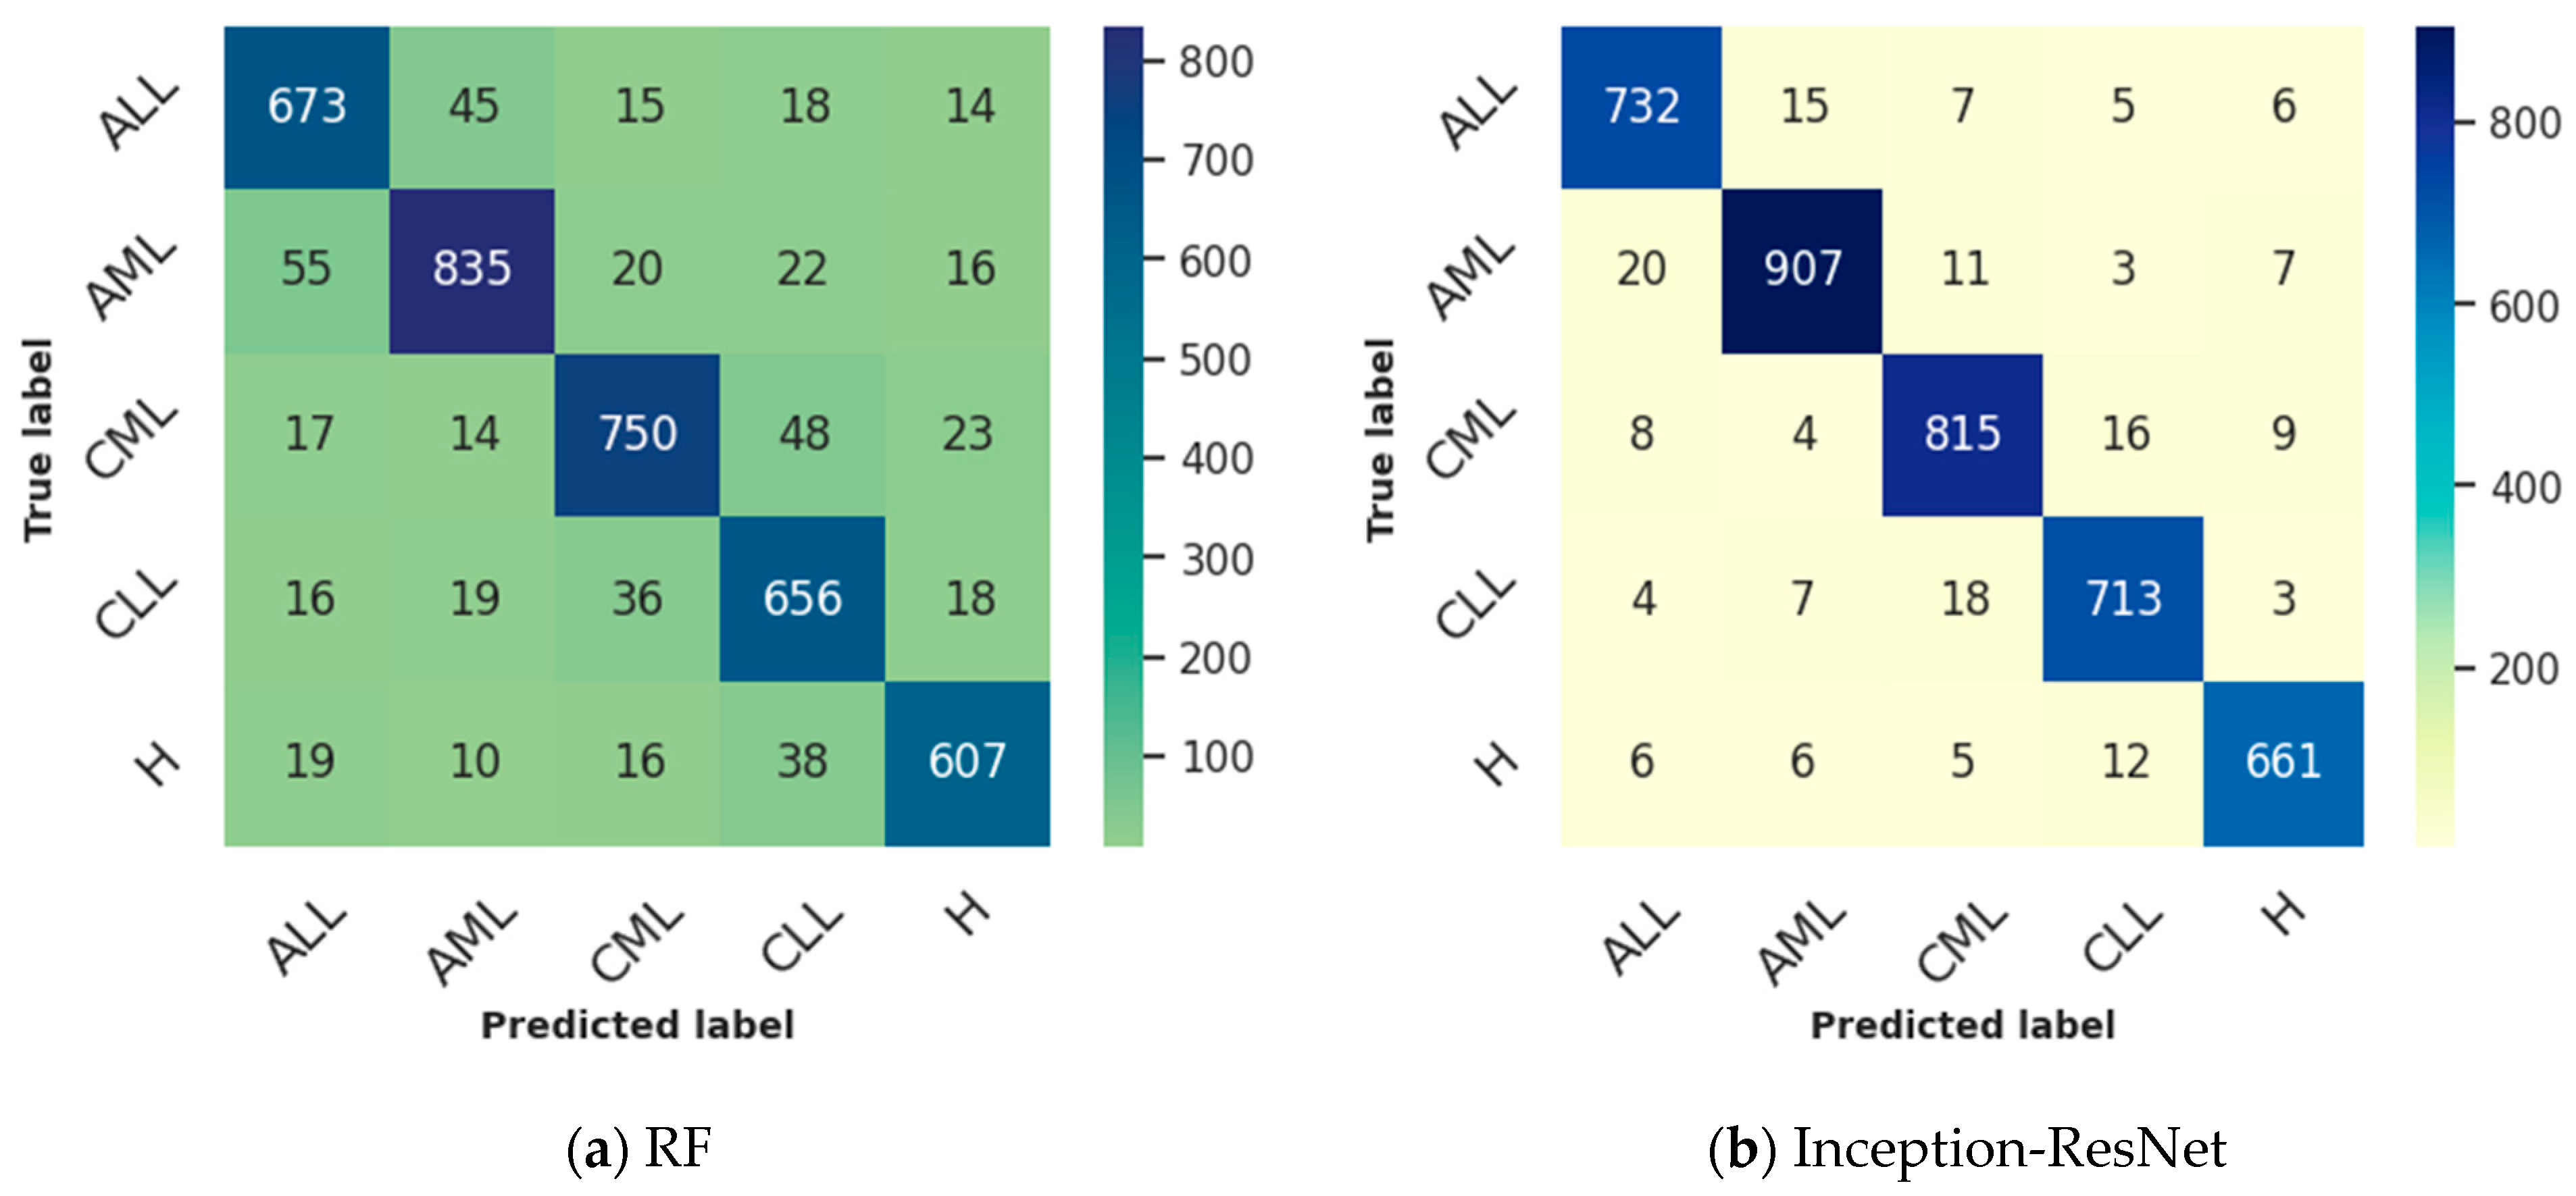
- The confusion matrix offers a comprehensive breakdown of the model’s predictions, showcasing accurate positives, accurate negatives, incorrect positives, and incorrect negatives. It provides a comprehensive analysis of the model’s advantages and disadvantages.
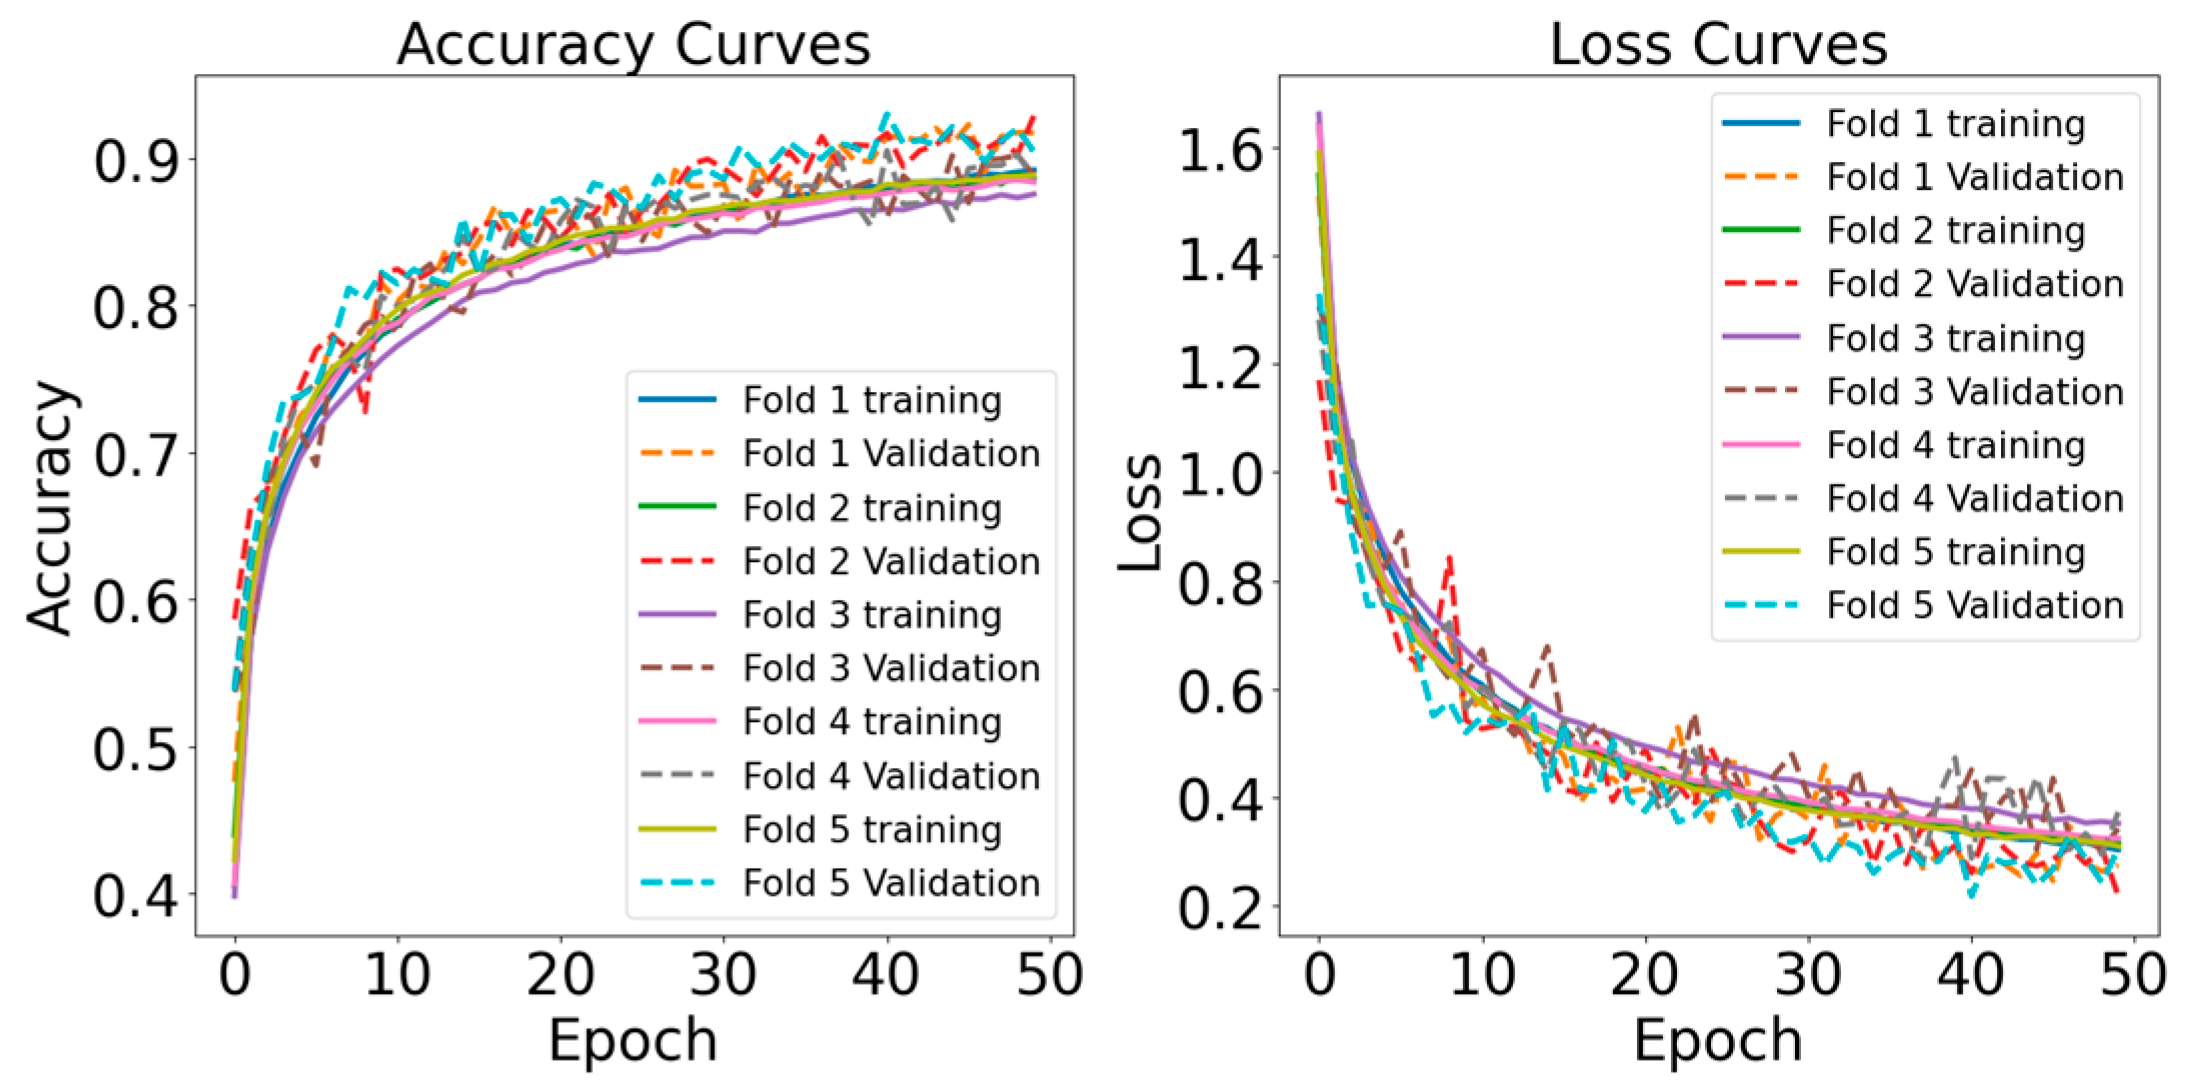
- Learning Curve: Learning curves illustrate the model’s performance over epochs, indicating the rate at which the model is acquiring knowledge from the training data. They assist in identifying problems such as overfitting or underfitting.
4. Result Analysis
4.1. Binary Classification Results
4.2. Multiclass Classification Results
4.3. State-of-the-Art Comparison
5. Discussion
6. Conclusions and Future Works
Author Contributions
Funding
Institutional Review Board Statement
Informed Consent Statement
Data Availability Statement
Conflicts of Interest
References
- Wang, R.C.; Wang, Z. Precision Medicine: Disease Subtyping and Tailored Treatment. Cancers 2023, 15, 3837. [Google Scholar] [CrossRef]
- Kolijn, P.M.; Langerak, A.W. Immune dysregulation as a leading principle for lymphoma development in diverse immunological backgrounds. Immunol. Lett. 2023, 263, 46–59. [Google Scholar] [CrossRef]
- Lee, S.Y.; Miller, K.M.; Kim, J.J. Clinical and Mechanistic Implications of R-Loops in Human Leukemias. Int. J. Mol. Sci. 2023, 24, 5966. [Google Scholar] [CrossRef]
- Klafke, N.; Bossert, J.; Kröger, B.; Neuberger, P.; Heyder, U.; Layer, M.; Winkler, M.; Idler, C.; Kaschdailewitsch, E.; Heine, R.; et al. Prevention and Treatment of Chemotherapy-Induced Peripheral Neuropathy (CIPN) with Non-Pharmacological Interventions: Clinical Recommendations from a Systematic Scoping Review and an Expert Consensus Process. Med. Sci. 2023, 11, 15. [Google Scholar] [CrossRef]
- Al Khatib, A.O.; El-Tanani, M.; Al-Obaidi, H. Inhaled Medicines for Targeting Non-Small Cell Lung Cancer. Pharmaceutics 2023, 15, 2777. [Google Scholar] [CrossRef]
- Yusufjanovich, E.U.; Irisbaevich, M.G.; Rafiqovich, Z.A.; Irsaliyevich, E.K. Evaluation of Effectiveness of Splenectomy in Chronic Leukemias. World Bull. Public Health 2023, 19, 79–83. [Google Scholar]
- Senapati, J.; Jabbour, E.; Kantarjian, H.; Short, N.J. Pathogenesis and management of accelerated and blast phases of chronic myeloid leukemia. Leukemia 2022, 37, 5–17. [Google Scholar] [CrossRef]
- Mustaqim, T.; Fatichah, C.; Suciati, N. Deep Learning for the Detection of Acute Lymphoblastic Leukemia Subtypes on Microscopic Images: A Systematic Literature Review. IEEE Access 2023, 11, 16108–16127. [Google Scholar] [CrossRef]
- Al-Bayati, A.M.S.; Al-Bayti, A.A.H.; Husain, V.I. A short review about chronic myeloid leukemia. J. Life Bio Sci. Res. 2023, 4, 15–19. [Google Scholar] [CrossRef]
- Elhadary, M.; Elshoeibi, A.M.; Badr, A.; Elsayed, B.; Metwally, O.; Elshoeibi, A.M.; Mattar, M.; Alfarsi, K.; AlShammari, S.; Alshurafa, A.; et al. Revolutionizing chronic lymphocytic leukemia diagnosis: A deep dive into the diverse applications of machine learning. Blood Rev. 2023, 62, 101134. [Google Scholar] [CrossRef]
- Rinaldi, I.; Winston, K. Chronic Myeloid Leukemia, from Pathophysiology to Treatment-Free Remission: A Narrative Literature Review. J. Blood Med. 2023, 14, 261–277. [Google Scholar] [CrossRef]
- Wang, S.A.; Jorgensen, J.L.; Hu, S.; Jia, F.; Li, S.; Loghavi, S.; Ok, C.Y.; Thakral, B.; Xu, J.; Medeiros, L.J.; et al. Validation of a 12-color flow cytometry assay for acute myeloid leukemia minimal/measurable residual disease detection. Cytom. B Clin. Cytom. 2023, 104, 356–366. [Google Scholar] [CrossRef]
- Timakova, A.; Ananev, V.; Fayzullin, A.; Makarov, V.; Ivanova, E.; Shekhter, A.; Timashev, P. Artificial Intelligence Assists in the Detection of Blood Vessels in Whole Slide Images: Practical Benefits for Oncological Pathology. Biomolecules 2023, 13, 1327. [Google Scholar] [CrossRef]
- Tan, P.; Chen, X.; Zhang, H.; Wei, Q.; Luo, K. Artificial intelligence aids in development of nanomedicines for cancer management. Semin. Cancer Biol. 2023, 89, 61–75. [Google Scholar] [CrossRef]
- Kassani, S.H.; Kassani, P.H.; Wesolowski, M.J.; Schneider, K.A.; Deters, R. A Hybrid Deep Learning Architecture for Leukemic B-lymphoblast Classification. In Proceedings of the ICTC 2019 10th International Conference on ICT Convergence: ICT Convergence Leading the Autonomous Future, Jeju, Republic of Korea, 16–18 October 2019; pp. 271–276. [Google Scholar] [CrossRef]
- Jiwani, N.; Gupta, K.; Pau, G.; Alibakhshikenari, M. Pattern Recognition of Acute Lymphoblastic Leukemia (ALL) Using Computational Deep Learning. IEEE Access 2023, 11, 29541–29553. [Google Scholar] [CrossRef]
- Simsek, E.; Badem, H.; Okumus, I.T. Leukemia Sub-Type Classification by Using Machine Learning Techniques on Gene Expression. In Proceedings of Sixth International Congress on Information and Communication Technology; Lecture Notes in Networks and Systems; Springer: Singapore, 2022; Volume 217, pp. 629–637. [Google Scholar] [CrossRef]
- Jagadev, P.; Virani, H.G. Detection of leukemia and its types using image processing and machine learning. In Proceedings of the International Conference on Trends in Electronics and Informatics, ICEI 2017, Tirunelveli, India, 11–12 May 2017; pp. 522–526. [Google Scholar] [CrossRef]
- Babaso, S.P.; Mishra, S.K.; Junnarkar, A. Leukemia Diagnosis Based on Machine Learning Algorithms. In Proceedings of the 2020 IEEE International Conference for Innovation in Technology, INOCON 2020, Bangluru, India, 6–8 November 2020. [Google Scholar] [CrossRef]
- Rahmani, A.M.; Yousefpoor, E.; Yousefpoor, M.S.; Mehmood, Z.; Haider, A.; Hosseinzadeh, M.; Ali Naqvi, R. Machine Learning (ML) in Medicine: Review, Applications, and Challenges. Mathematics 2021, 9, 2970. [Google Scholar] [CrossRef]
- Linardatos, P.; Papastefanopoulos, V.; Kotsiantis, S. Explainable AI: A Review of Machine Learning Interpretability Methods. Entropy 2021, 23, 18. [Google Scholar] [CrossRef]
- Zhuang, F.; Qi, Z.; Duan, K.; Xi, D.; Zhu, Y.; Zhu, H.; Xiong, H.; He, Q. A Comprehensive Survey on Transfer Learning. Proc. IEEE 2021, 109, 43–76. [Google Scholar] [CrossRef]
- Peirelinck, T.; Kazmi, H.; Mbuwir, B.V.; Hermans, C.; Spiessens, F.; Suykens, J.; Deconinck, G. Transfer learning in demand response: A review of algorithms for data-efficient modelling and control. Energy AI 2022, 7, 100126. [Google Scholar] [CrossRef]
- Hamidah; Rustam, Z.; Utama, S.; Siswantining, T. Multiclass classification of acute lymphoblastic leukemia microarrays data using support vector machine algorithms. J. Phys. Conf. Ser. 2020, 1490, 012027. [Google Scholar] [CrossRef]
- Fauzi, I.R.; Rustam, Z.; Wibowo, A. Multiclass classification of leukemia cancer data using Fuzzy Support Vector Machine (FSVM) with feature selection using Principal Component Analysis (PCA). J. Phys. Conf. Ser. 2021, 1725, 012012. [Google Scholar] [CrossRef]
- Dasariraju, S.; Huo, M.; McCalla, S. Detection and Classification of Immature Leukocytes for Diagnosis of Acute Myeloid Leukemia Using Random Forest Algorithm. Bioengineering 2020, 7, 120. [Google Scholar] [CrossRef]
- More, P.; Sugandhi, R. Automated and Enhanced Leucocyte Detection and Classification for Leukemia Detection Using Multi-Class SVM Classifier. Eng. Proc. 2023, 37, 36. [Google Scholar] [CrossRef]
- Kashef, A.; Khatibi, T.; Mehrvar, A. Treatment outcome classification of pediatric Acute Lymphoblastic Leukemia patients with clinical and medical data using machine learning: A case study at MAHAK hospital. Inf. Med. Unlocked 2020, 20, 100399. [Google Scholar] [CrossRef]
- Schouten, J.P.E.; Matek, C.; Jacobs, L.F.P.; Buck, M.C.; Bošnački, D.; Marr, C. Tens of images can suffice to train neural networks for malignant leukocyte detection. Sci. Rep. 2021, 11, 7995. [Google Scholar] [CrossRef]
- Rahman, W.; Faruque, M.G.G.; Roksana, K.; Sadi, A.H.M.S.; Rahman, M.M.; Azad, M.M. Multiclass blood cancer classification using deep CNN with optimized features. Array 2023, 18, 100292. [Google Scholar] [CrossRef]
- Ahmed, N.; Yigit, A.; Isik, Z.; Alpkocak, A. Identification of Leukemia Subtypes from Microscopic Images Using Convolutional Neural Network. Diagnostics 2019, 9, 104. [Google Scholar] [CrossRef]
- Saeed, U.; Kumar, K.; Khuhro, M.A.; Laghari, A.A.; Shaikh, A.A.; Rai, A. DeepLeukNet—A CNN based microscopy adaptation model for acute lymphoblastic leukemia classification. Multimed. Tools Appl. 2024, 83, 21019–21043. [Google Scholar] [CrossRef]
- Loey, M.; Naman, M.; Zayed, H. Deep Transfer Learning in Diagnosing Leukemia in Blood Cells. Computers 2020, 9, 29. [Google Scholar] [CrossRef]
- Ghongade, O.S.; Reddy, S.K.S.; Gavini, Y.C.; Tokala, S.; Enduri, M.K. Acute Lymphoblastic Leukemia Blood Cells Prediction Using Deep Learning & Transfer Learning Technique. Indones. J. Electr. Eng. Inform. 2023, 11, 778–790. [Google Scholar] [CrossRef]
- Abir, W.H.; Uddin, M.F.; Khanam, F.R.; Tazin, T.; Khan, M.M.; Masud, M.; Aljahdali, S. Explainable AI in Diagnosing and Anticipating Leukemia Using Transfer Learning Method. Comput. Intell. Neurosci. 2022, 2022, 5140148. [Google Scholar] [CrossRef]
- Gupta, R.; Gehlot, S.; Gupta, A. C-NMC: B-lineage acute lymphoblastic leukaemia: A blood cancer dataset. Med. Eng. Phys. 2022, 103, 103793. [Google Scholar] [CrossRef]
- Dharshini, P.; Guru, S. LEUKEMIA DATASET 0.2. Available online: https://www.kaggle.com/datasets/priyaadharshinivs062/leukemia-dataset-02 (accessed on 14 January 2024).
- Perveen, S.; Alourani, A.; Shahbaz, M.; Ashraf, U.; Hamid, I. A framework for Early Detection of Acute Lymphoblastic Leukemia and its Subtypes from Peripheral Blood Smear Images Using Deep Ensemble Learning Technique. IEEE Access 2024, 12, 29252–29268. [Google Scholar] [CrossRef]
- Sahu, A.; Das, P.K.; Meher, S.; Panda, R.; Abraham, A. An Efficient Deep Learning-Based Breast Cancer Detection Scheme with Small Datasets. In Intelligent Systems Design and Applications. ISDA 2022; Lecture Notes in Networks and Systems; Springer: Cham, Switzerland, 2023; Volume 717, pp. 39–48. [Google Scholar] [CrossRef]
- Sahu, A.; Das, P.K.; Meher, S. An automatic sparse-based deep cascade framework with multilayer representation for detecting breast cancer. Measurement 2024, 228, 114375. [Google Scholar] [CrossRef]
- Sahu, A.; Das, P.K.; Meher, S. An efficient deep learning scheme to detect breast cancer using mammogram and ultrasound breast images. Biomed. Signal Process. Control 2024, 87, 105377. [Google Scholar] [CrossRef]
- Das, P.K.; Diya, V.A.; Meher, S.; Panda, R.; Abraham, A. A Systematic Review on Recent Advancements in Deep and Machine Learning Based Detection and Classification of Acute Lymphoblastic Leukemia. IEEE Access 2022, 10, 81741–81763. [Google Scholar] [CrossRef]
- Haque, R.; Islam, N.; Tasneem, M.; Das, A.K. Multi-class sentiment classification on Bengali social media comments using machine learning. Int. J. Cogn. Comput. Eng. 2023, 4, 21–35. [Google Scholar] [CrossRef]
- Haque, R.; Parameshachari, B.D.; Hasan, M.K.; Sakib, A.H.; Rahman, A.U.; Islam, M.B. Scientific Article Classification: Harnessing Hybrid Deep Learning Models for Knowledge Discovery. In Proceedings of the 2023 International Conference on Ambient Intelligence, Knowledge Informatics and Industrial Electronics (AIKIIE), Ballari, India, 2–3 November 2023; pp. 1–7. [Google Scholar] [CrossRef]
- Haque, R.; Laskar, S.H.; Khushbu, K.G.; Hasan, M.J.; Uddin, J. Data-Driven Solution to Identify Sentiments from Online Drug Reviews. Computers 2023, 12, 87. [Google Scholar] [CrossRef]
- Haque, R.; Al Mamun, M.A.; Ratul, M.H.; Aziz, A.; Mittra, T. A Machine Learning Based Approach to Analyze Food Reviews from Bengali Text. In Proceedings of the 12th International Conference on Electrical and Computer Engineering, ICECE 2022, Dhaka, Bangladesh, 21–23 December 2022; pp. 80–83. [Google Scholar] [CrossRef]
- Haque, R.; Islam, N.; Islam, M.; Ahsan, M.M. A Comparative Analysis on Suicidal Ideation Detection Using NLP, Machine, and Deep Learning. Technologies 2022, 10, 57. [Google Scholar] [CrossRef]
- Islam, N.; Haque, R.; Pareek, P.K.; Islam, M.B.; Sajeeb, I.H.; Ratul, M.H. Deep Learning for Multi-Labeled Cyberbully Detection: Enhancing Online Safety. In Proceedings of the 2023 International Conference on Data Science and Network Security, ICDSNS 2023, Tiptur, India, 28–29 July 2023. [Google Scholar] [CrossRef]
- Krizhevsky, A.; Sutskever, I.; Hinton, G.E. ImageNet classification with deep convolutional neural networks. Commun. ACM 2017, 60, 84–90. [Google Scholar] [CrossRef]
- Shaheen, M.; Khan, R.; Biswal, R.R.; Ullah, M.; Khan, A.; Uddin, M.I.; Zareei, M.; Waheed, A. Acute Myeloid Leukemia (AML) Detection Using AlexNet Model. Complexity 2021, 2021, 6658192. [Google Scholar] [CrossRef]
- Lin, T.Y.; Goyal, P.; Girshick, R.; He, K.; Dollar, P. Focal Loss for Dense Object Detection. IEEE Trans. Pattern Anal. Mach. Intell. 2017, 42, 318–327. [Google Scholar] [CrossRef]
- Tan, G.; Guo, Z.; Xiao, Y. PA-RetinaNet: Path Augmented RetinaNet for Dense Object Detection. In Artificial Intelligence and Lecture Notes in Bioinformatics; Lecture Notes in Computer Science; Springer: Berlin/Heidelberg, Germany, 2019; Volume 11728, pp. 138–149. [Google Scholar] [CrossRef]
- Haryono, A.; Jati, G.; Jatmiko, W. Oriented object detection in satellite images using convolutional neural network based on ResNeXt. ETRI J. 2023. [Google Scholar] [CrossRef]
- Zhou, M.; Wu, K.; Yu, L.; Xu, M.; Yang, J.; Shen, Q.; Liu, B.; Shi, L.; Wu, S.; Dong, B. Development and Evaluation of a Leukemia Diagnosis System Using Deep Learning in Real Clinical Scenarios. Front. Pediatr. 2021, 9, 693676. [Google Scholar] [CrossRef]
- Wang, Y.; Wang, C.; Zhang, H.; Dong, Y.; Wei, S. Automatic Ship Detection Based on RetinaNet Using Multi-Resolution Gaofen-3 Imagery. Remote Sens. 2019, 11, 531. [Google Scholar] [CrossRef]
- Shaheed, K.; Abbas, Q.; Hussain, A.; Qureshi, I. Optimized Xception Learning Model and XgBoost Classifier for Detection of Multiclass Chest Disease from X-ray Images. Diagnostics 2023, 13, 2583. [Google Scholar] [CrossRef]
- Chand, S.; Vishwakarma, V.P. A novel Deep Learning Framework (DLF) for classification of Acute Lymphoblastic Leukemia. Multimed Tools Appl. 2022, 81, 37243–37262. [Google Scholar] [CrossRef]
- Kodipalli, A.; Guha, S.; Dasar, S.; Ismail, T. An inception-ResNet deep learning approach to classify tumours in the ovary as benign and malignant. Expert Syst. 2022, e13215. [Google Scholar] [CrossRef]
- Wang, H.; Xu, S.; Fang, K.B.; Dai, Z.S.; Wei, G.Z.; Chen, L.F. Contrast-enhanced magnetic resonance image segmentation based on improved U-Net and Inception-ResNet in the diagnosis of spinal metastases. J. Bone Oncol. 2023, 42, 100498. [Google Scholar] [CrossRef]
- Anilkumar, K.K.; Manoj, V.J.; Sagi, T.M. Automated detection of leukemia by pretrained deep neural networks and transfer learning: A comparison. Med. Eng. Phys. 2021, 98, 8–19. [Google Scholar] [CrossRef]
- Szegedy, C.; Ioffe, S.; Vanhoucke, V.; Alemi, A.A. Inception-v4, Inception-ResNet and the Impact of Residual Connections on Learning. Proc. AAAI Conf. Artif. Intell. 2017, 31, 4278–4284. [Google Scholar] [CrossRef]
- Guo, Y.; Lu, X. ST-CenterNet: Small Target Detection Algorithm with Adaptive Data Enhancement. Entropy 2023, 25, 509. [Google Scholar] [CrossRef]
- Xia, G.-S.; Bao, C.; Cao, J.; Hao, Q. AOGC: Anchor-Free Oriented Object Detection Based on Gaussian Centerness. Remote Sens. 2023, 15, 4690. [Google Scholar] [CrossRef]
- Nazir, T.; Nawaz, M.; Rashid, J.; Mahum, R.; Masood, M.; Mehmood, A.; Ali, F.; Kim, J.; Kwon, H.Y.; Hussain, A.; et al. Detection of Diabetic Eye Disease from Retinal Images Using a Deep Learning Based CenterNet Model. Sensors 2021, 21, 5283. [Google Scholar] [CrossRef]
- Karimi, D.; Warfield, S.K.; Gholipour, A. Transfer learning in medical image segmentation: New insights from analysis of the dynamics of model parameters and learned representations. Artif. Intell. Med. 2021, 116, 102078. [Google Scholar] [CrossRef]
- Xiao, T.; Singh, M.; Mintun, E.; Darrell, T.; Dollár, P.; Girshick, R. Early Convolutions Help Transformers See Better. Adv. Neural Inf. Process. Syst. 2021, 34, 30392–30400. [Google Scholar]
- Narkhede, M.V.; Bartakke, P.P.; Sutaone, M.S. A review on weight initialization strategies for neural networks. Artif. Intell. Rev. 2022, 55, 291–322. [Google Scholar] [CrossRef]
- Cohen, O.; Malka, O.; Ringel, Z. Learning curves for overparametrized deep neural networks: A field theory perspective. Phys. Rev. Res. 2021, 3, 023034. [Google Scholar] [CrossRef]
- Ferreira, C.A.; Melo, T.; Sousa, P.; Meyer, M.I.; Shakibapour, E.; Costa, P.; Campilho, A. Classification of Breast Cancer Histology Images Through Transfer Learning Using a Pre-trained Inception Resnet V2. In Artificial Intelligence and Lecture Notes in Bioinformatics; Lecture Notes in Computer Science; Springer: Cham, Switzerland, 2018; Volume 10882, pp. 763–770. [Google Scholar] [CrossRef]
- Claro, M.L.; de MSVeras, R.; Santana, A.M.; Vogado, L.H.S.; Junior, G.B.; de Medeiros, F.N.; Tavares, J.M.R. Assessing the impact of data augmentation and a combination of CNNs on leukemia classification. Inf. Sci. 2022, 609, 1010–1029. [Google Scholar] [CrossRef]
- Xiao, M.; Zhang, L.; Shi, W.; Liu, J.; He, W.; Jiang, Z. A visualization method based on the Grad-CAM for medical image segmentation model. In Proceedings of the 2021 International Conference on Electronic Information Engineering and Computer Science, EIECS 2021, Changchun, China, 23–26 September 2021; pp. 242–247. [Google Scholar] [CrossRef]
- Zhang, Y.; Hong, D.; McClement, D.; Oladosu, O.; Pridham, G.; Slaney, G. Grad-CAM helps interpret the deep learning models trained to classify multiple sclerosis types using clinical brain magnetic resonance imaging. J. Neurosci. Methods 2021, 353, 109098. [Google Scholar] [CrossRef]


| Technique | Models | Accuracy | Precision | Recall | F1 Score |
|---|---|---|---|---|---|
| ML | MLP | 92.26% | 92.59% | 92.38% | 92.81% |
| RF | 91.71% | 91.23% | 91.66% | 91.27% | |
| SVM | 88.37% | 88.11% | 88.44% | 88.79% | |
| KNN | 87.51% | 87.66% | 87.51% | 87.46% | |
| SGD | 85.36% | 85.59% | 85.74% | 85.65% | |
| TL | Inception-ResNet | 96.89% | 96.43% | 96.61% | 96.07% |
| XceptionNet | 95.41% | 95.24% | 95.93% | 95.21% | |
| AlexNet | 94.01% | 94.17% | 94.21% | 94.11% | |
| RetinaNet | 94.55% | 94.61% | 94.31% | 94.76% | |
| CenterNet | 93.35% | 93.68% | 93.29% | 93.45% |
| Technique | Models | Accuracy | Precision | Recall | F1 Score |
|---|---|---|---|---|---|
| ML | RF | 88.11% | 88.34% | 88.11% | 88.23% |
| MLP | 87.78% | 87.86% | 87.36% | 87.62% | |
| KNN | 86.35% | 86.35% | 86.64% | 86.91% | |
| SVM | 84.21% | 84.32% | 84.59% | 84.88% | |
| SGD | 85.44% | 85.87% | 85.49% | 85.94% | |
| TL | InceptionResNet | 95.79% | 95.33% | 95.41% | 95.89% |
| AlexNet | 94.29% | 94.49% | 94.92% | 94.29% | |
| XceptionNet | 93.56% | 93.32% | 93.93% | 93.66% | |
| CenterNet | 93.98% | 93.93% | 93.91% | 93.96% | |
| RetinaNet | 91.91% | 91.93% | 91.76% | 91.66% |
Disclaimer/Publisher’s Note: The statements, opinions and data contained in all publications are solely those of the individual author(s) and contributor(s) and not of MDPI and/or the editor(s). MDPI and/or the editor(s) disclaim responsibility for any injury to people or property resulting from any ideas, methods, instructions or products referred to in the content. |
© 2024 by the authors. Licensee MDPI, Basel, Switzerland. This article is an open access article distributed under the terms and conditions of the Creative Commons Attribution (CC BY) license (https://creativecommons.org/licenses/by/4.0/).
Share and Cite
Haque, R.; Al Sakib, A.; Hossain, M.F.; Islam, F.; Ibne Aziz, F.; Ahmed, M.R.; Kannan, S.; Rohan, A.; Hasan, M.J. Advancing Early Leukemia Diagnostics: A Comprehensive Study Incorporating Image Processing and Transfer Learning. BioMedInformatics 2024, 4, 966-991. https://doi.org/10.3390/biomedinformatics4020054
Haque R, Al Sakib A, Hossain MF, Islam F, Ibne Aziz F, Ahmed MR, Kannan S, Rohan A, Hasan MJ. Advancing Early Leukemia Diagnostics: A Comprehensive Study Incorporating Image Processing and Transfer Learning. BioMedInformatics. 2024; 4(2):966-991. https://doi.org/10.3390/biomedinformatics4020054
Chicago/Turabian StyleHaque, Rezaul, Abdullah Al Sakib, Md Forhad Hossain, Fahadul Islam, Ferdaus Ibne Aziz, Md Redwan Ahmed, Somasundar Kannan, Ali Rohan, and Md Junayed Hasan. 2024. "Advancing Early Leukemia Diagnostics: A Comprehensive Study Incorporating Image Processing and Transfer Learning" BioMedInformatics 4, no. 2: 966-991. https://doi.org/10.3390/biomedinformatics4020054