
The Traumatic Inoculation Process Affects TSPO Radioligand Uptake in Experimental Orthotopic Glioblastoma
 , , , , , , , , add
Show full author list
, , , , , , , , add
Show full author list
Abstract
:1. Introduction
2. Materials and Methods
2.1. Study Design
2.2. Animal Model and Sham Injection/Tumor Inoculation
2.3. Positron Emission Tomography (PET)
2.4. Autoradiography (ARG), Haematoxylin and Eosin (H&E) Staining, and Immunohistochemistry (IHC)
2.5. Statistical Analysis
3. Results
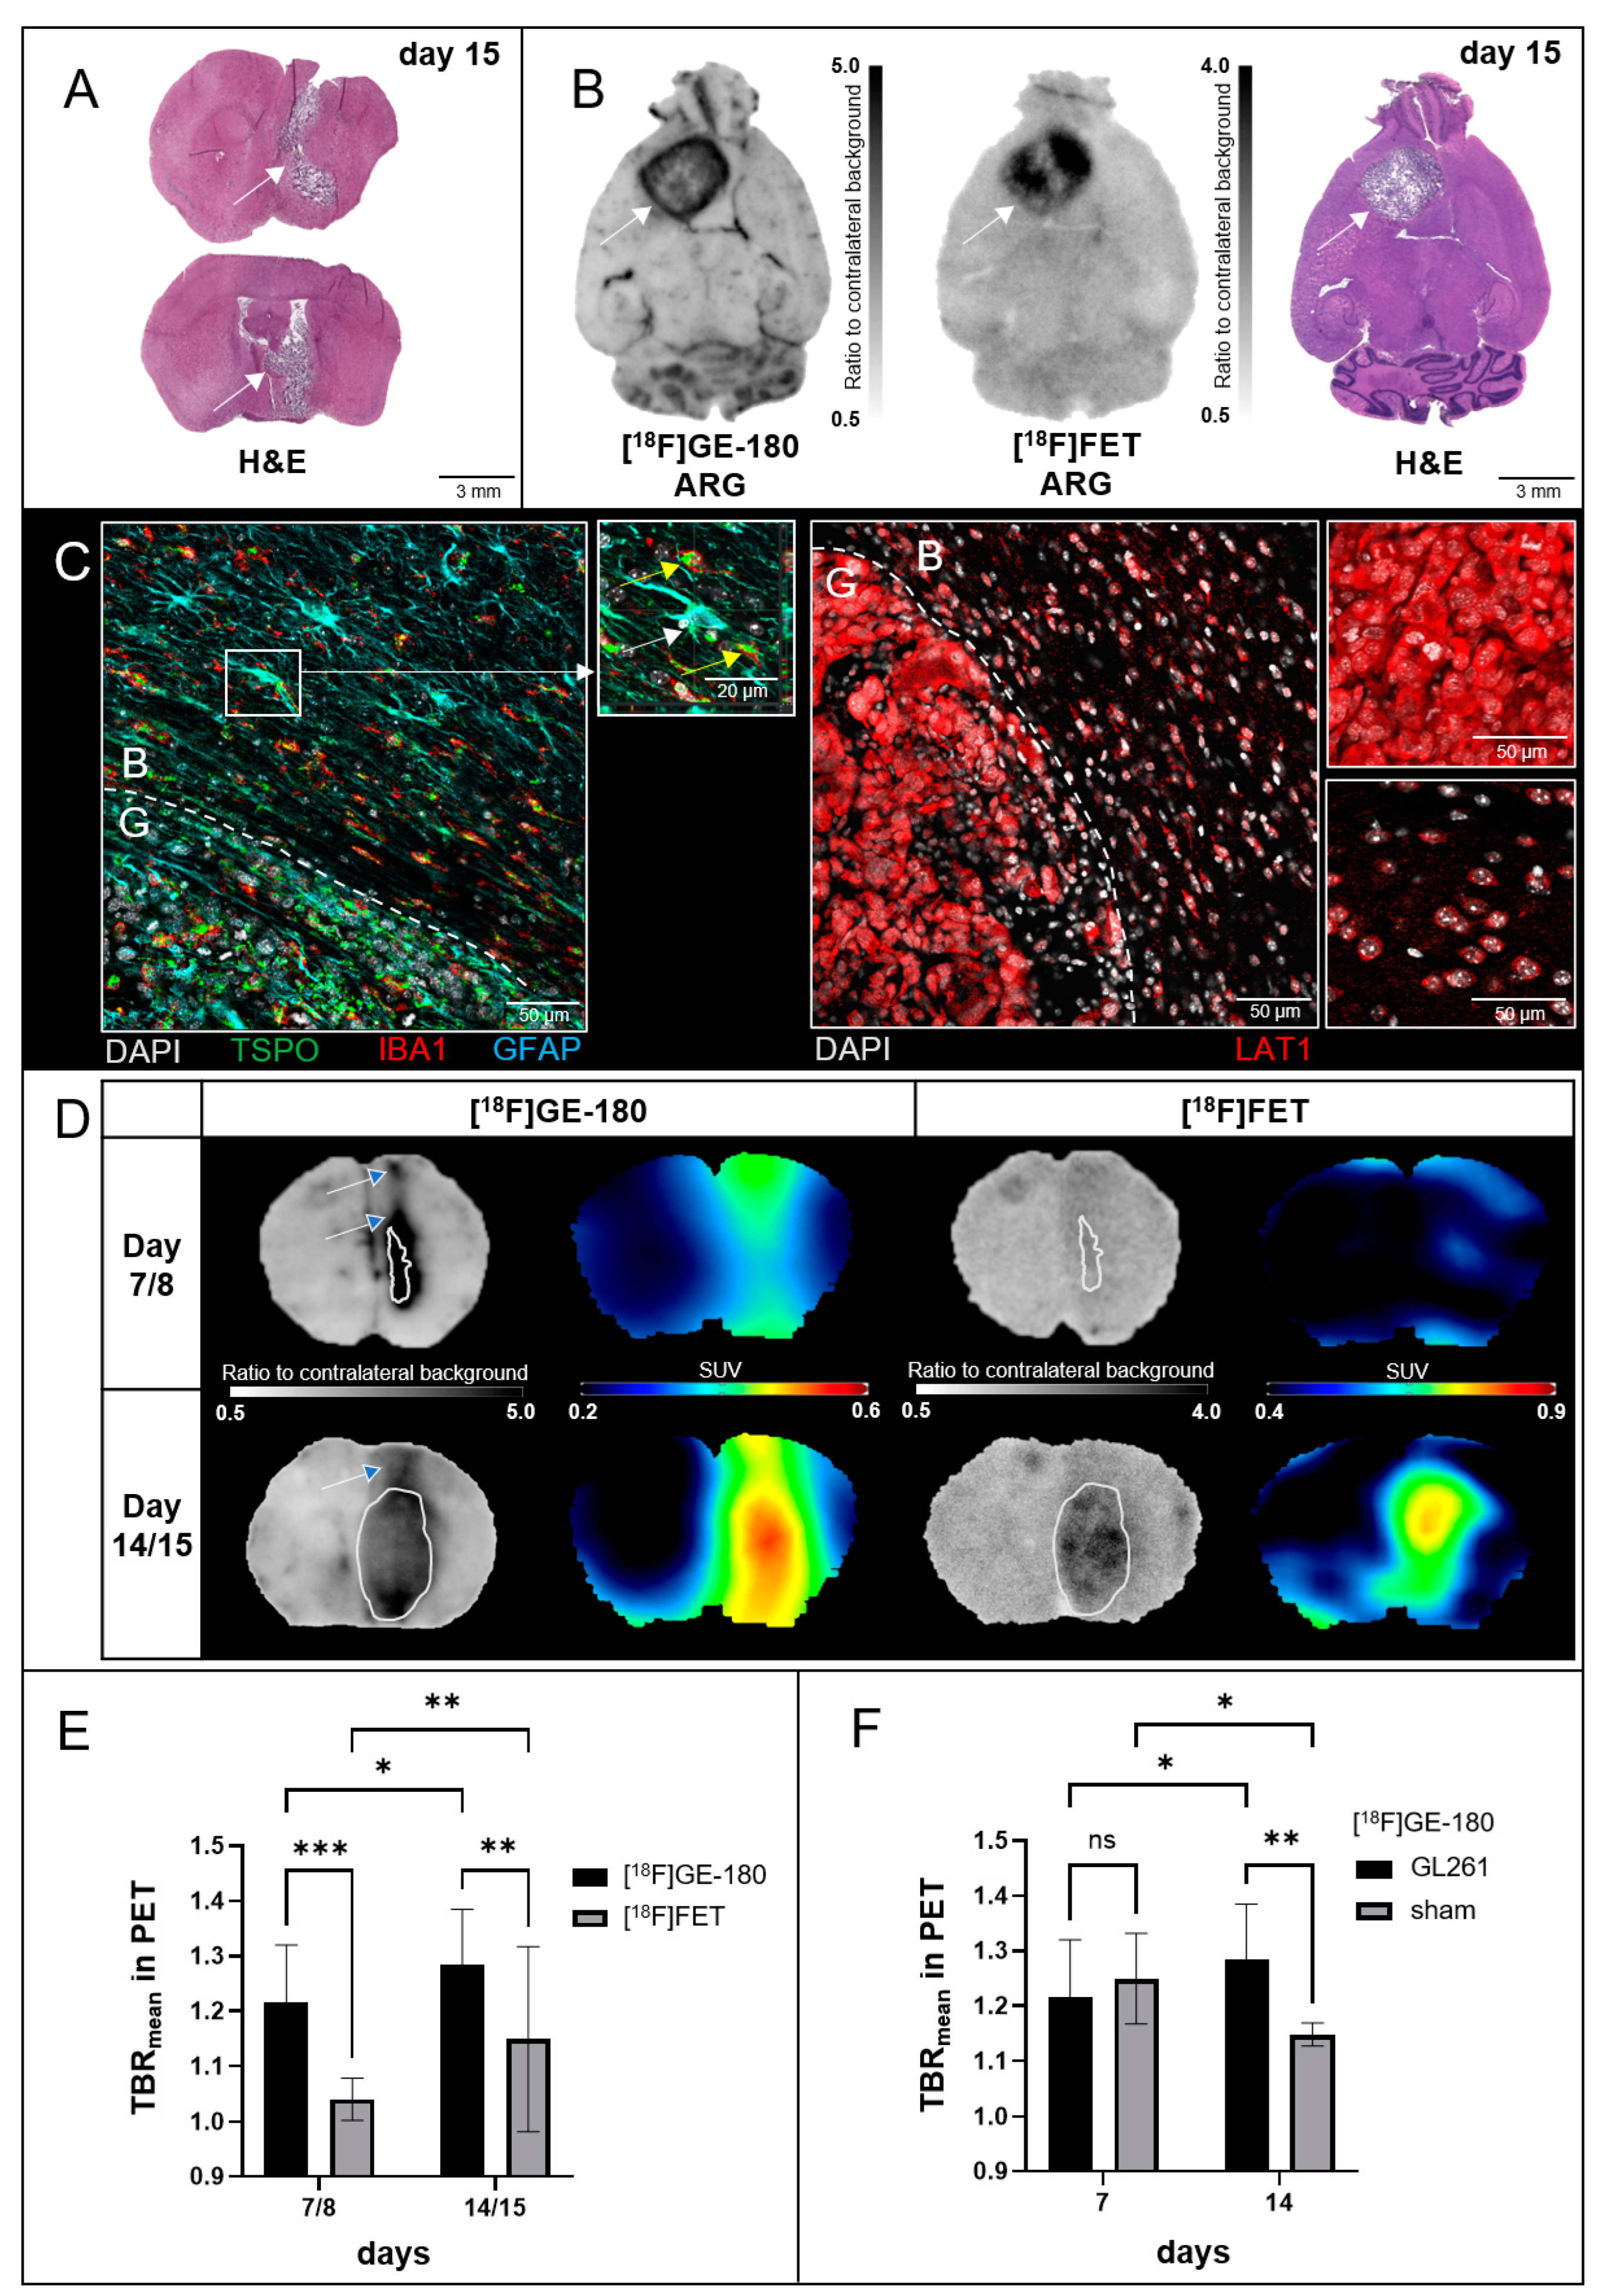
3.1. Tumor Mice
3.2. Sham Mice
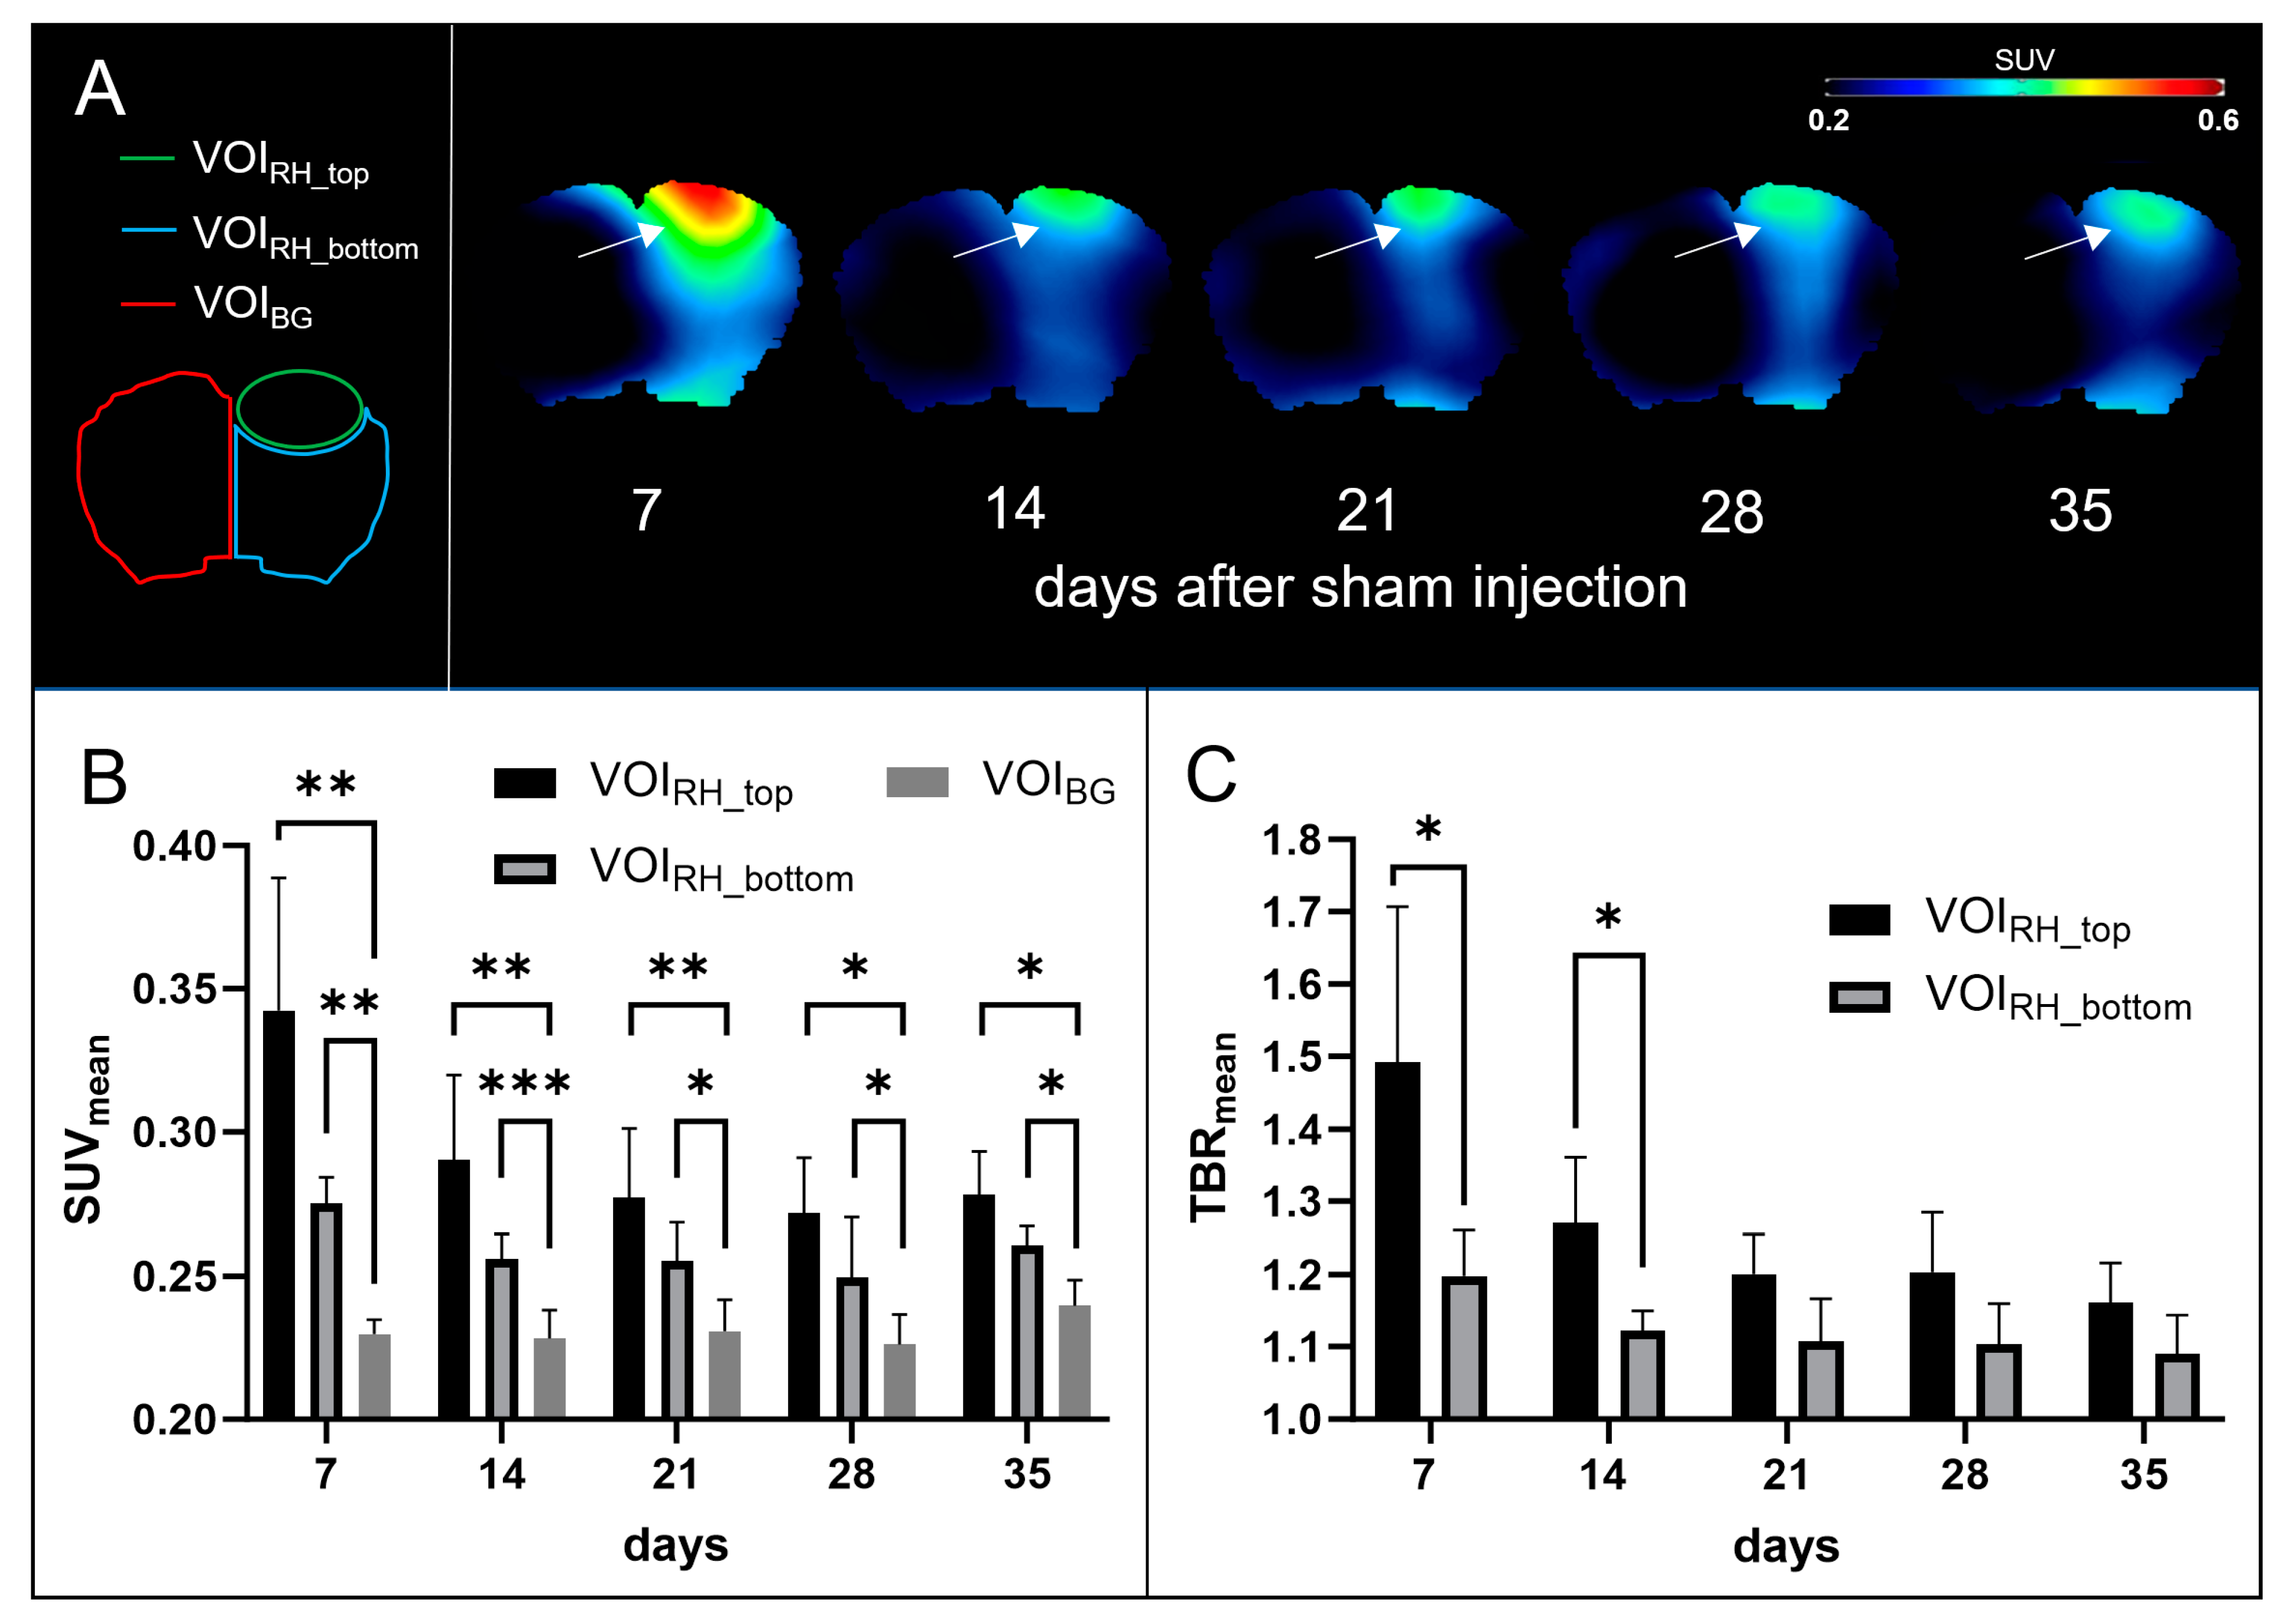
3.2.1. PET
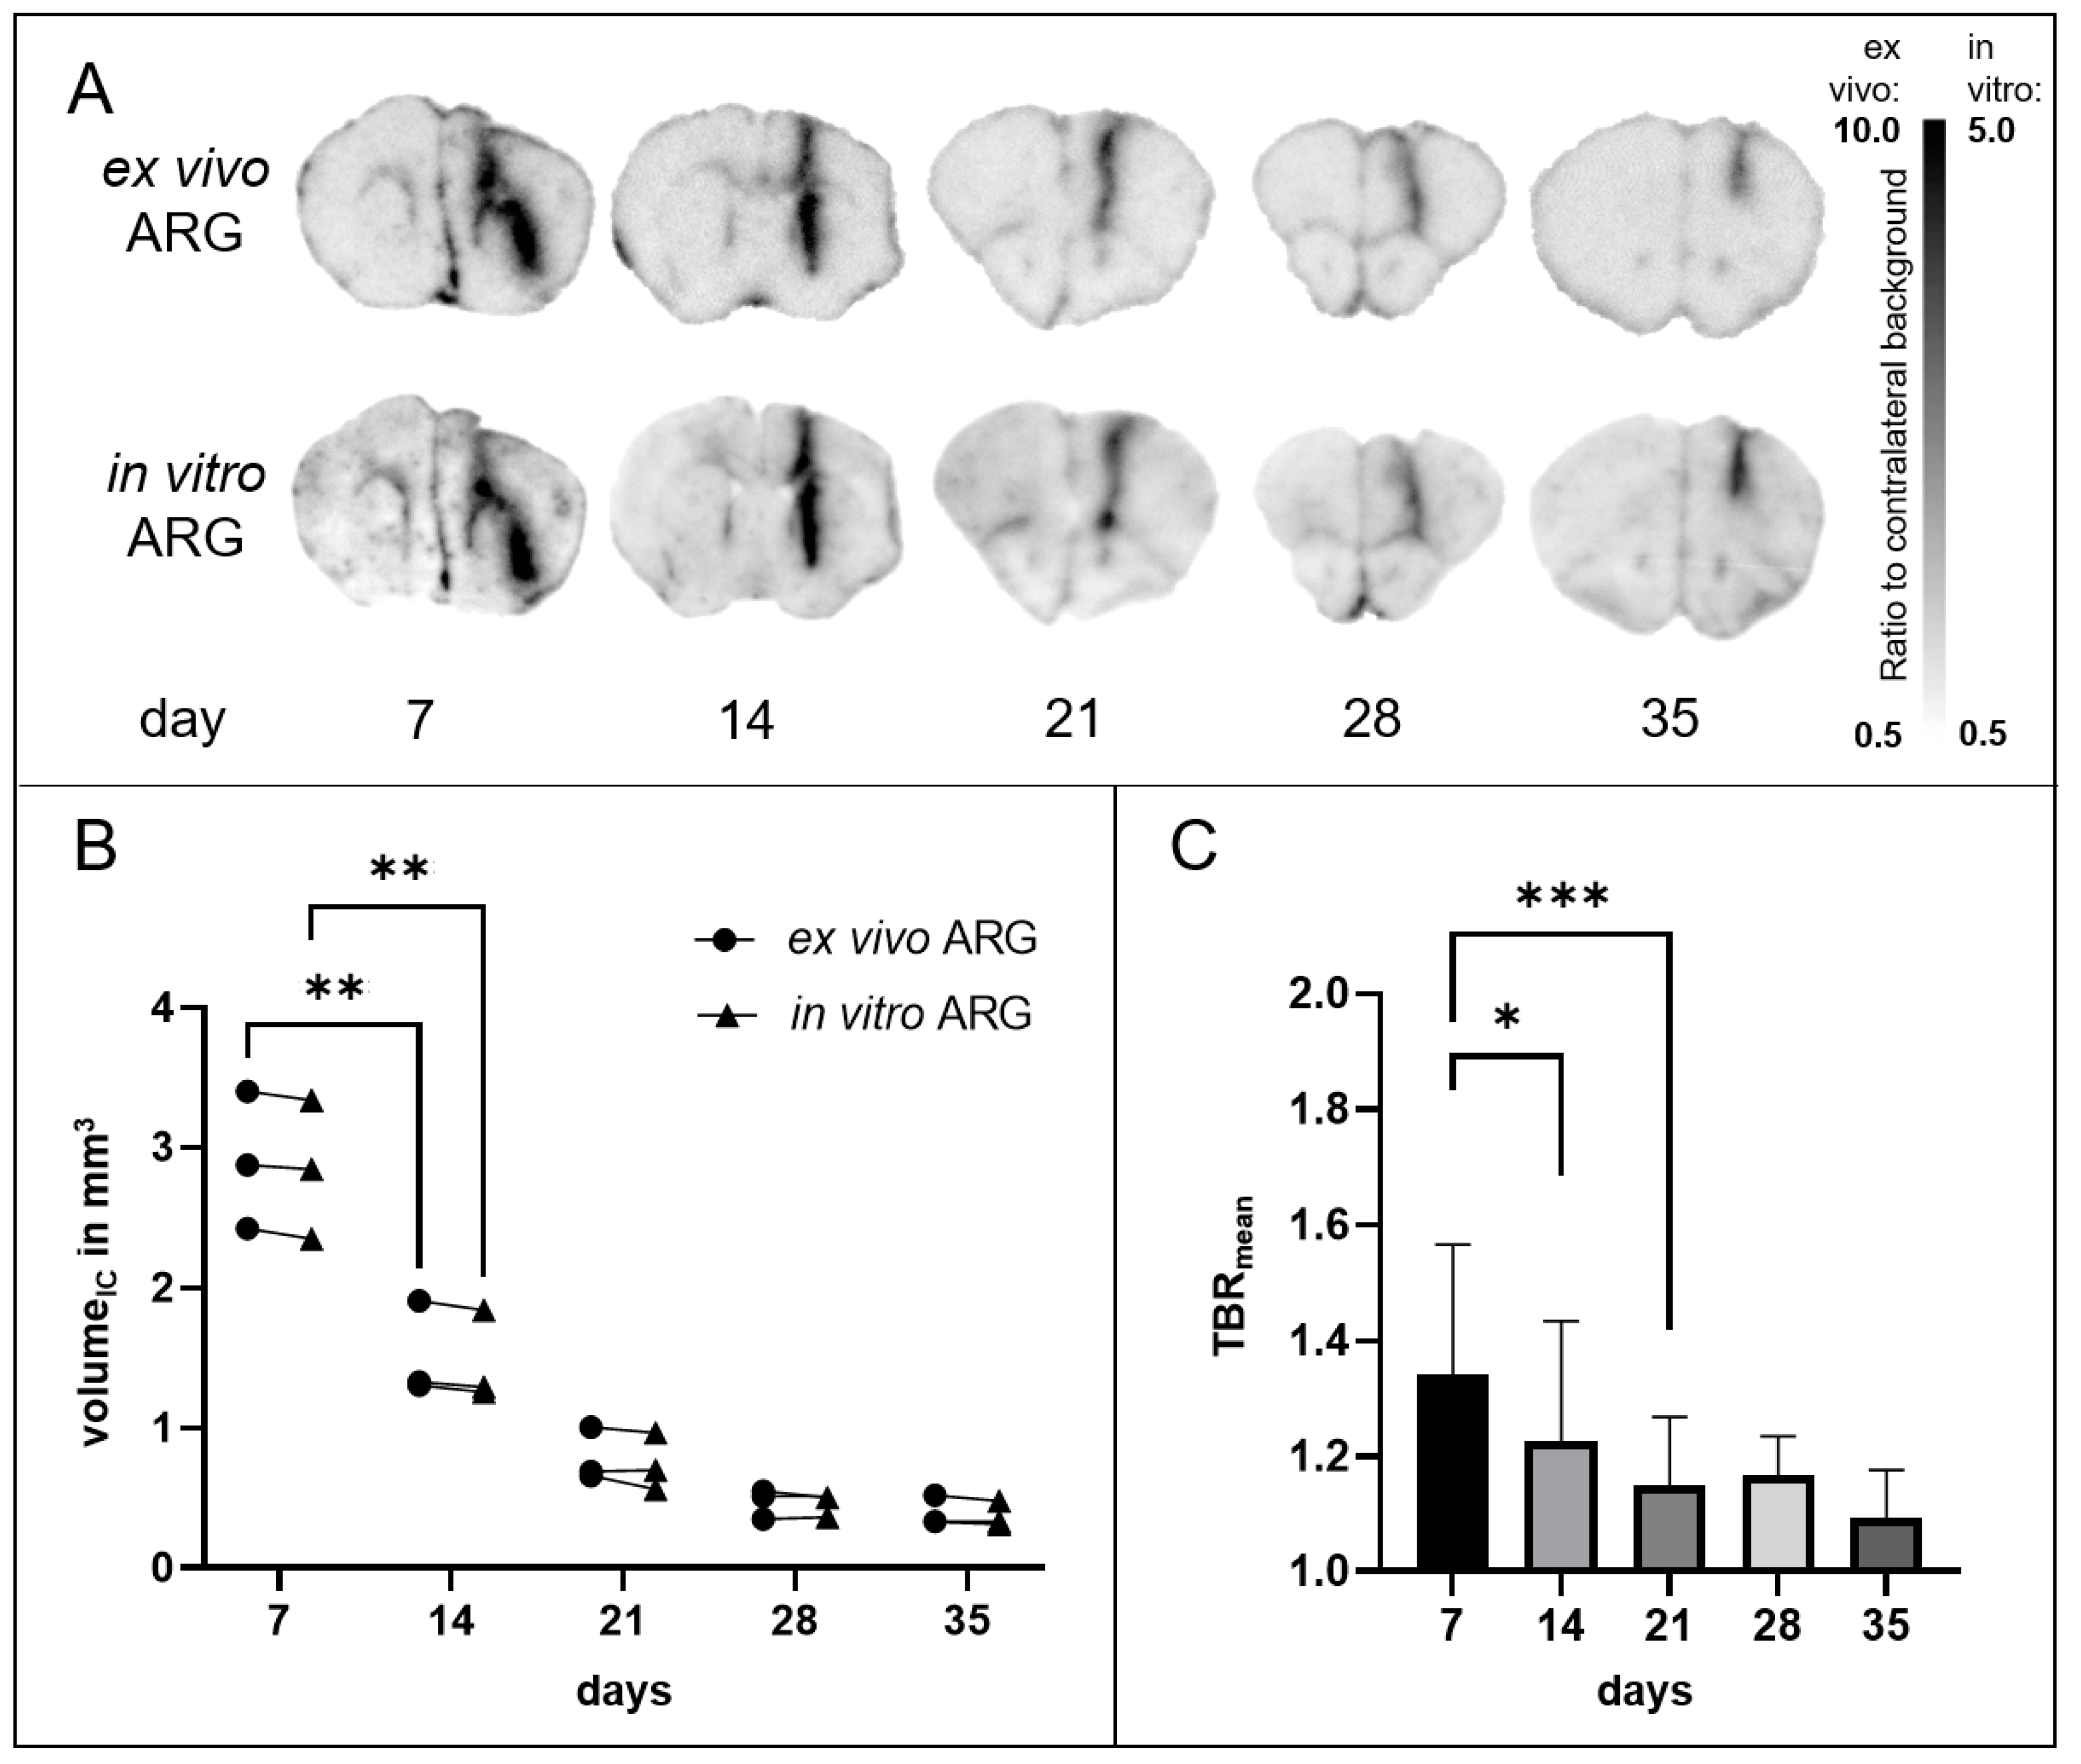
3.2.2. ARG
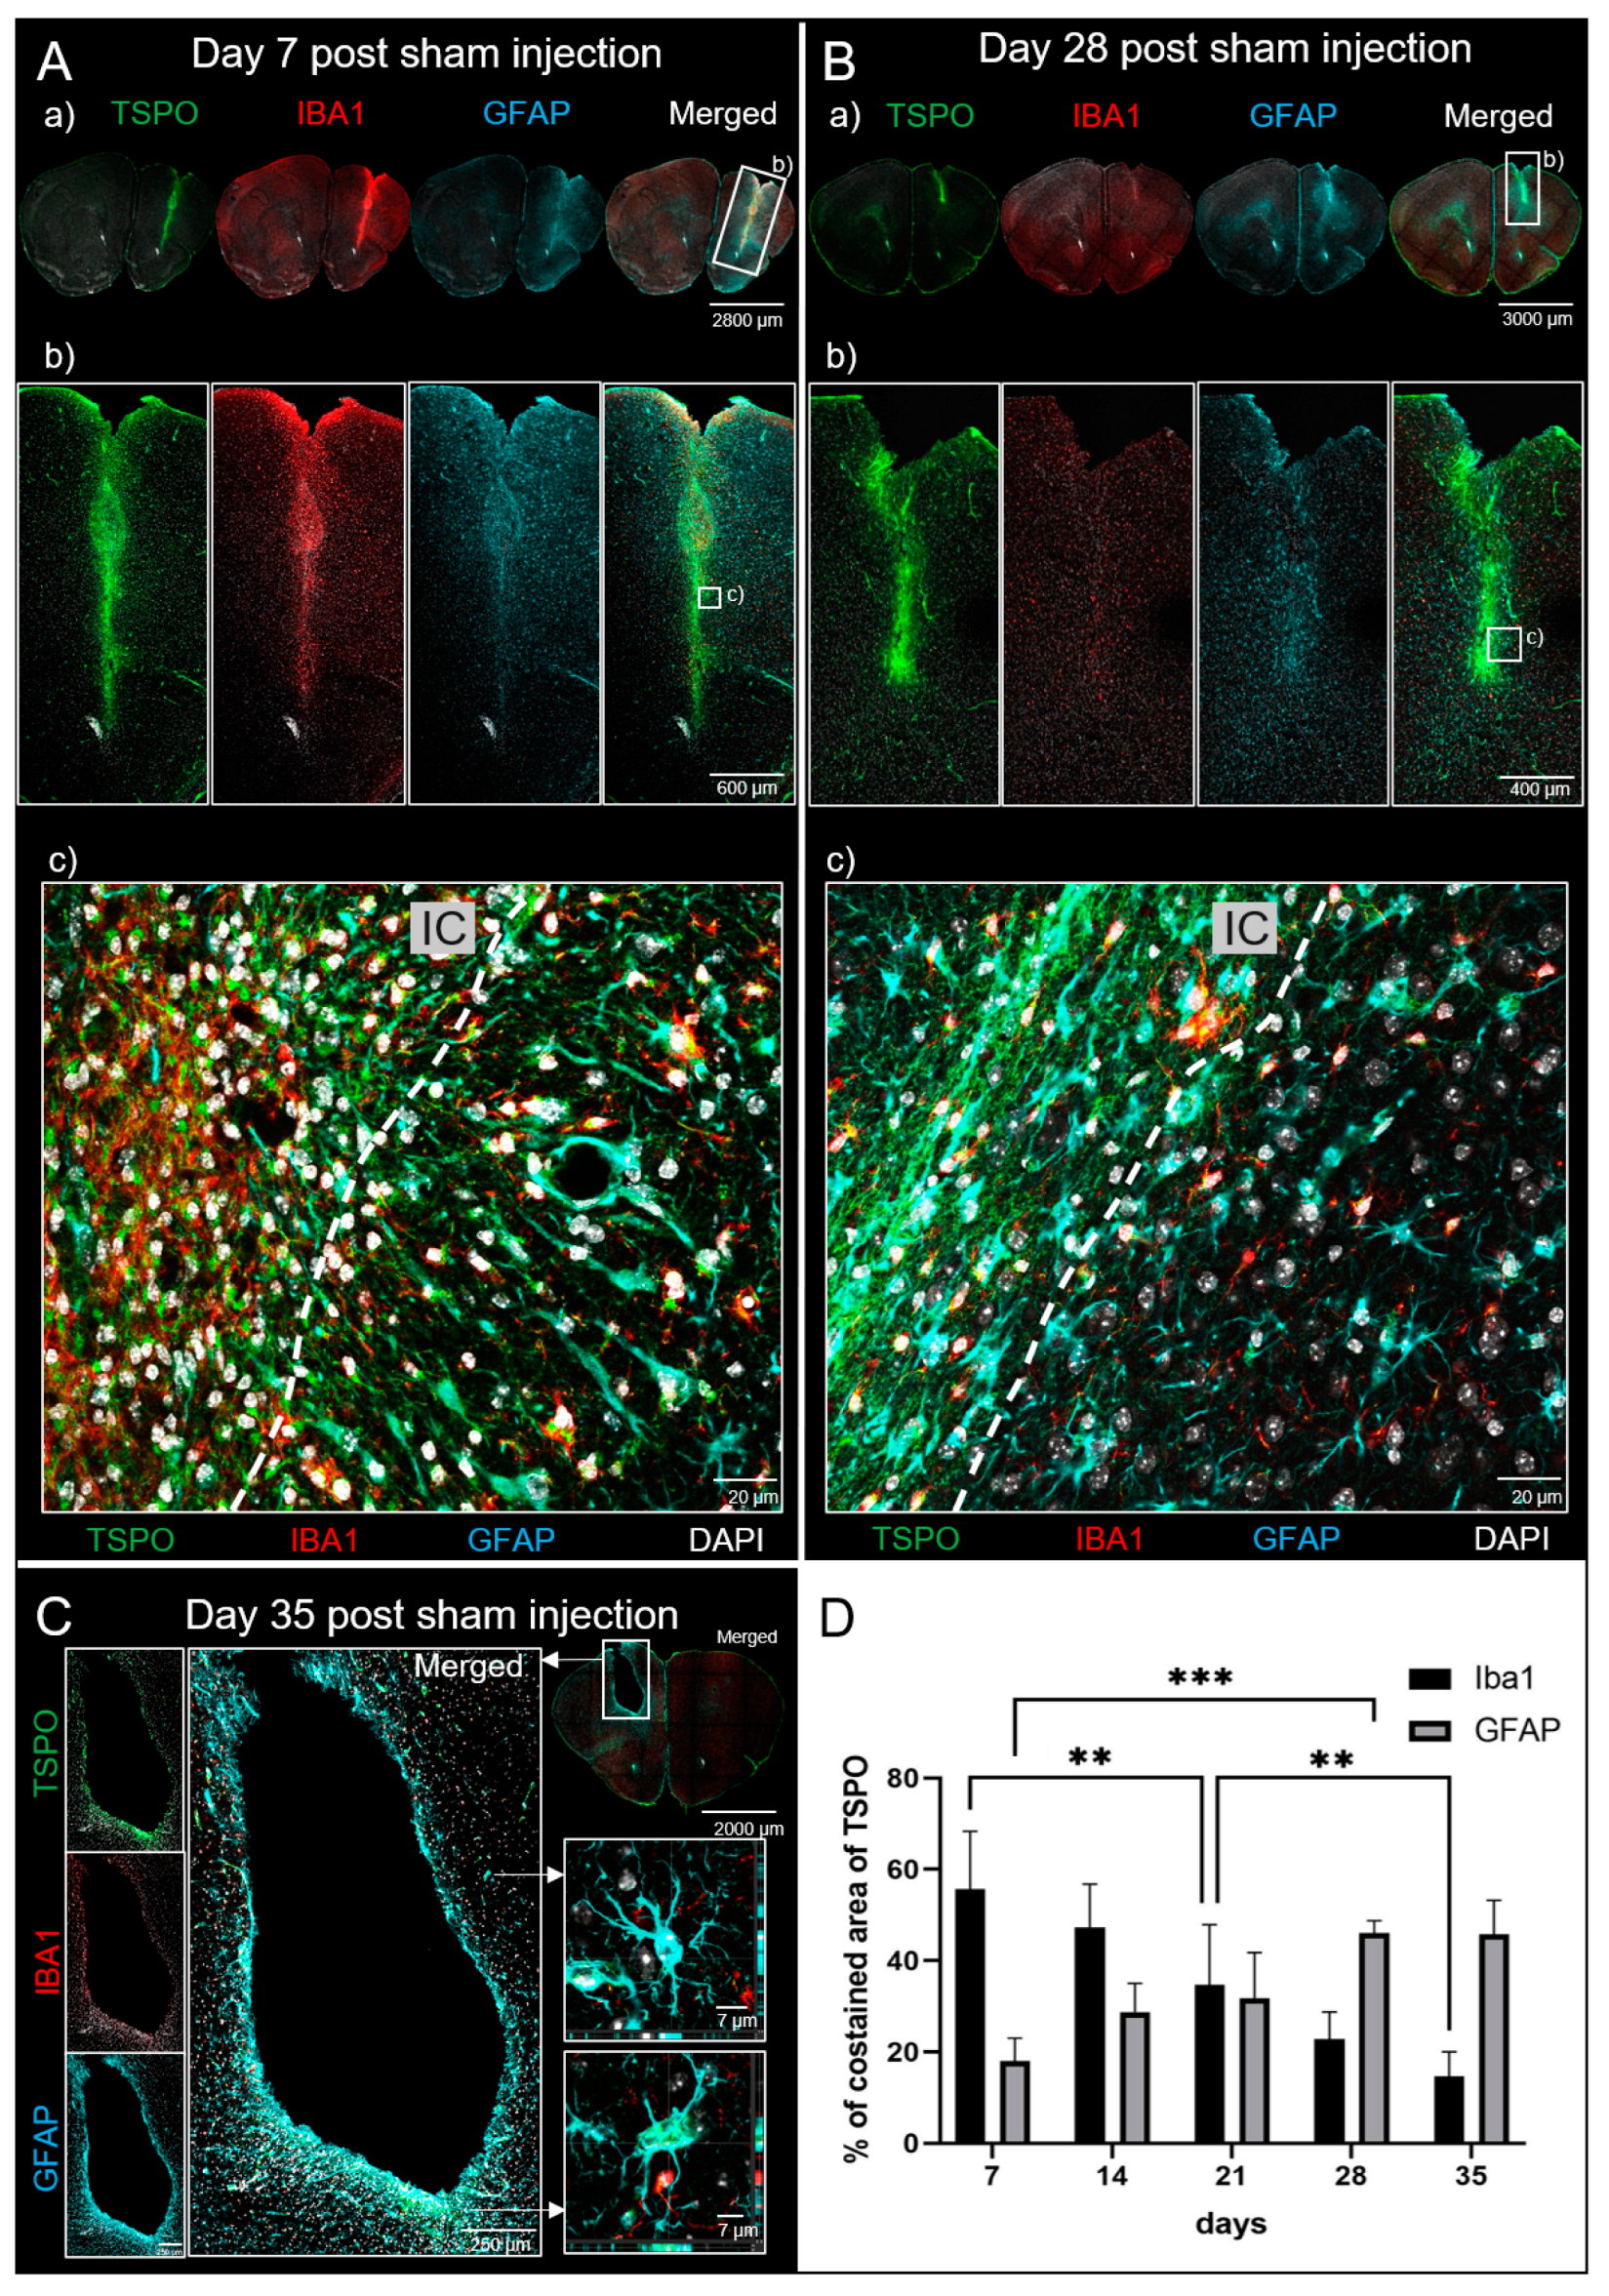
3.2.3. Immunohistochemistry (IHC)
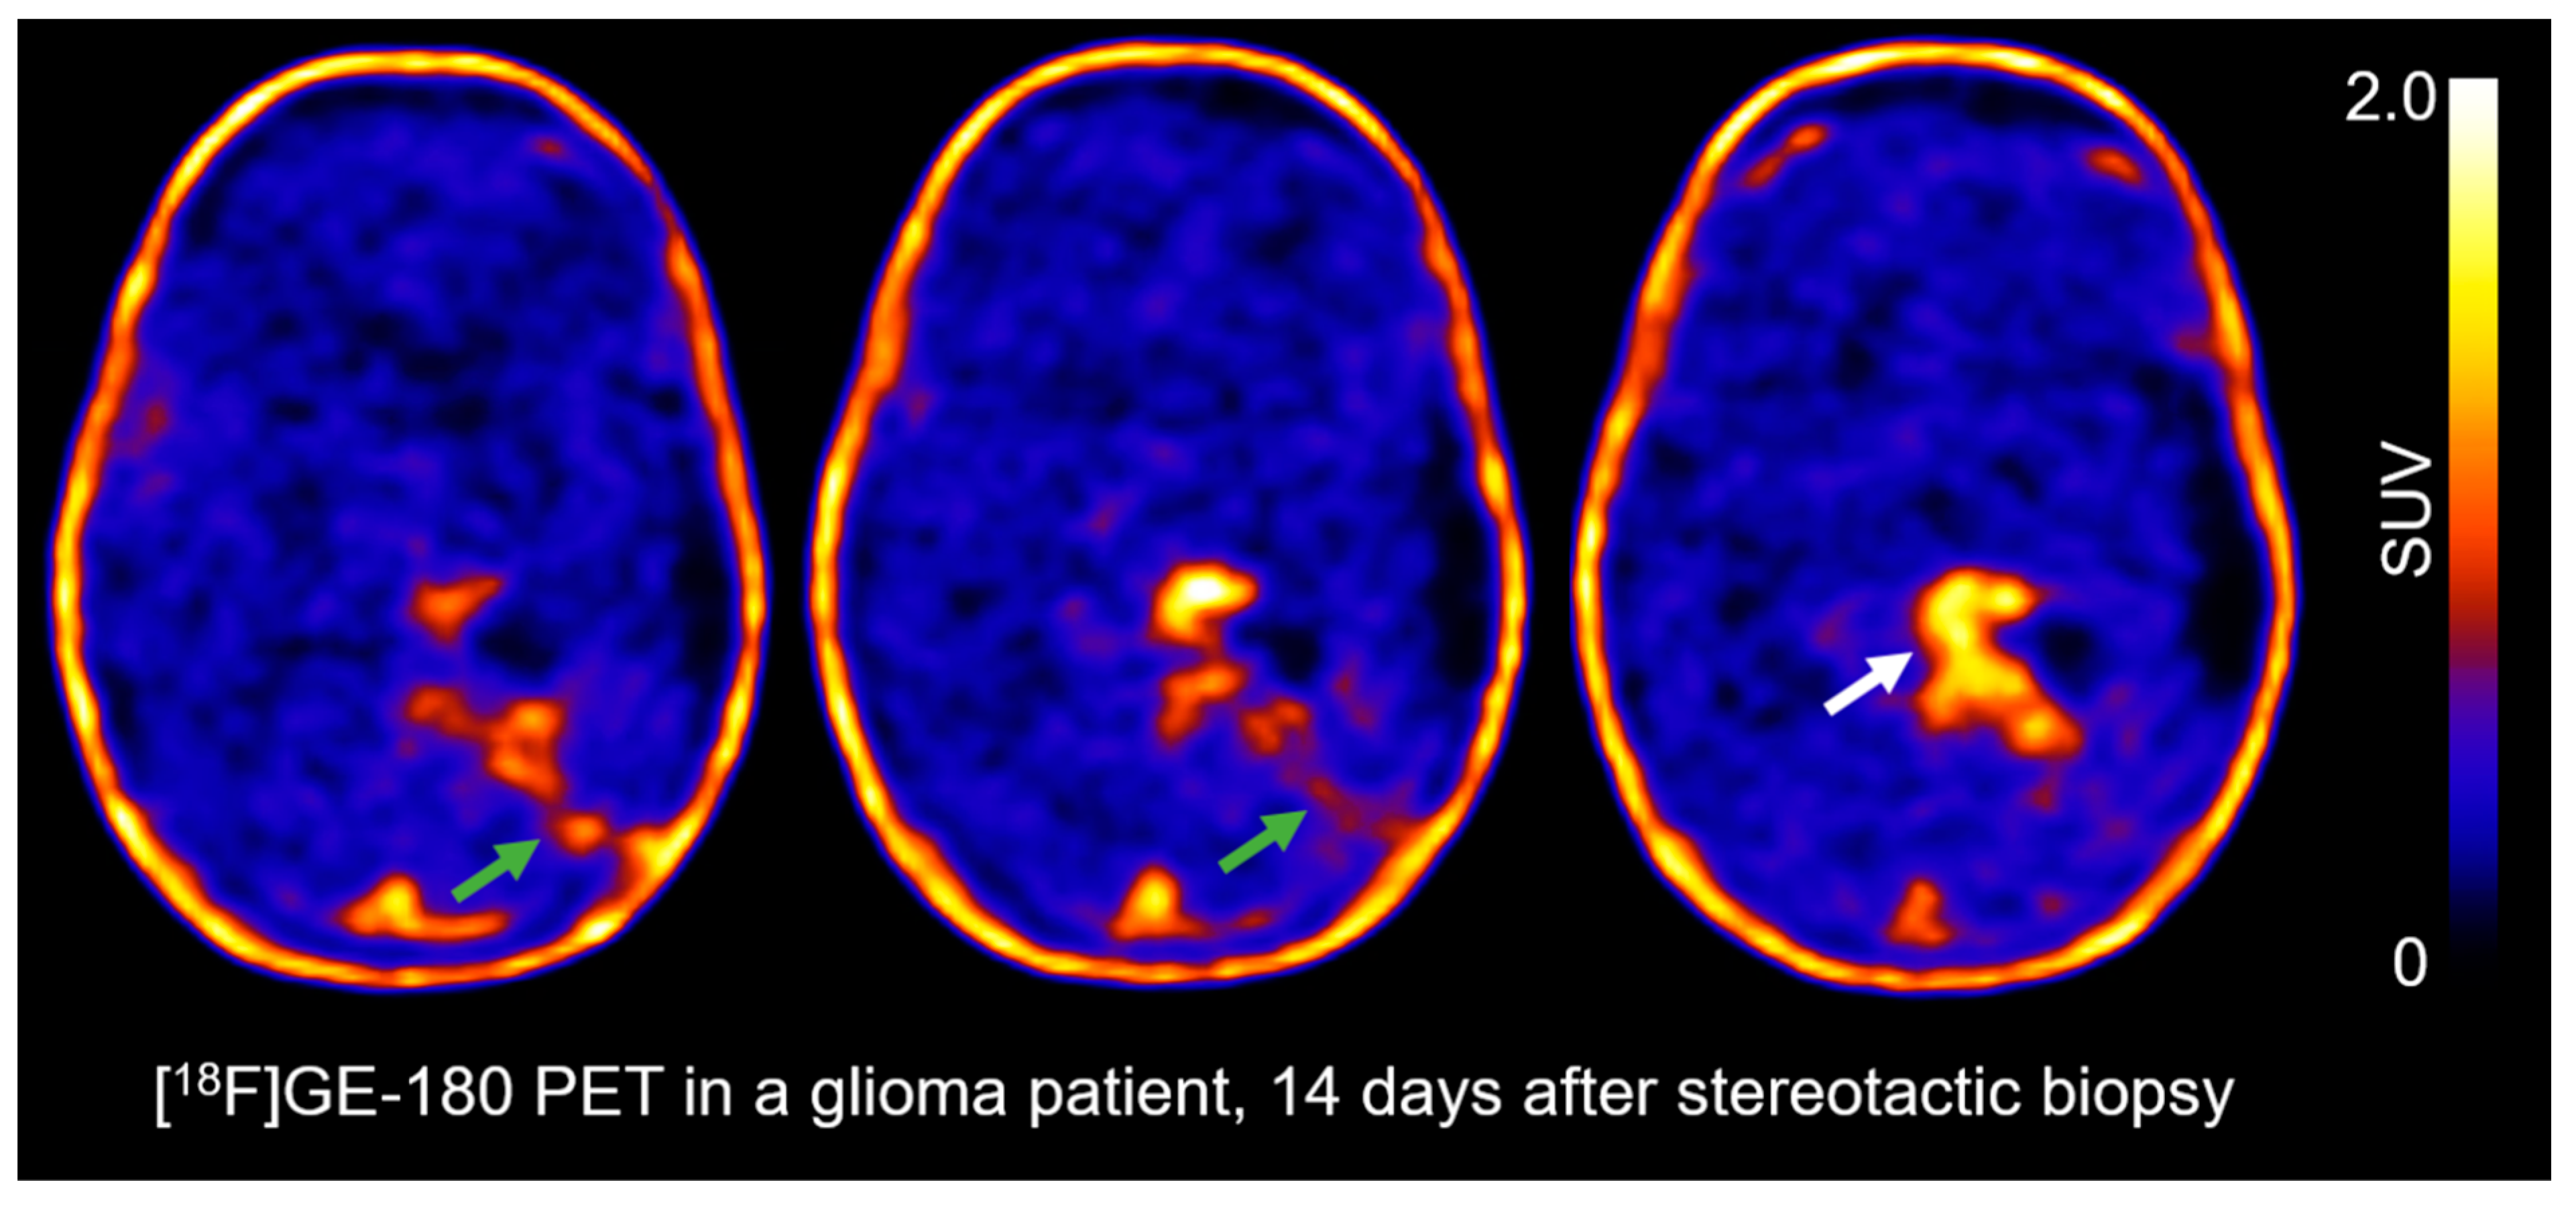
3.3. The TSPO PET-Scan of a Glioma Patient after Stereotactic Biopsy
4. Discussion
5. Conclusions
Supplementary Materials
Author Contributions
Funding
Institutional Review Board Statement
Informed Consent Statement
Data Availability Statement
Acknowledgments
Conflicts of Interest
References
- Ostrom, Q.T.; Bauchet, L.; Davis, F.G.; Deltour, I.; Fisher, J.L.; Langer, C.E.; Pekmezci, M.; Schwartzbaum, J.A.; Turner, M.C.; Walsh, K.M.; et al. The epidemiology of glioma in adults: A state of the science review. Neuro Oncol. 2014, 16, 896–913. [Google Scholar] [CrossRef]
- Weller, M.; van den Bent, M.; Preusser, M.; Le Rhun, E.; Tonn, J.C.; Minniti, G.; Bendszus, M.; Balana, C.; Chinot, O.; Dirven, L.; et al. EANO guidelines on the diagnosis and treatment of diffuse gliomas of adulthood. Nat. Rev. Clin. Oncol. 2021, 18, 170–186. [Google Scholar] [CrossRef] [PubMed]
- Foray, C.; Barca, C.; Backhaus, P.; Schelhaas, S.; Winkeler, A.; Viel, T.; Schafers, M.; Grauer, O.; Jacobs, A.H.; Zinnhardt, B. Multimodal Molecular Imaging of the Tumour Microenvironment. Adv. Exp. Med. Biol. 2020, 1225, 71–87. [Google Scholar] [CrossRef] [PubMed]
- Quail, D.F.; Joyce, J.A. The Microenvironmental Landscape of Brain Tumors. Cancer Cell 2017, 31, 326–341. [Google Scholar] [CrossRef] [PubMed]
- la Fougere, C.; Suchorska, B.; Bartenstein, P.; Kreth, F.W.; Tonn, J.C. Molecular imaging of gliomas with PET: Opportunities and limitations. Neuro Oncol. 2011, 13, 806–819. [Google Scholar] [CrossRef] [PubMed]
- Valtorta, S.; Salvatore, D.; Rainone, P.; Belloli, S.; Bertoli, G.; Moresco, R.M. Molecular and Cellular Complexity of Glioma. Focus on Tumour Microenvironment and the Use of Molecular and Imaging Biomarkers to Overcome Treatment Resistance. Int. J. Mol. Sci. 2020, 21, 2116531. [Google Scholar] [CrossRef] [PubMed]
- Holzgreve, A.; Albert, N.L.; Galldiks, N.; Suchorska, B. Use of PET Imaging in Neuro-Oncological Surgery. Cancers 2021, 13, 2093. [Google Scholar] [CrossRef]
- Galldiks, N.; Langen, K.J.; Albert, N.L.; Law, I.; Kim, M.M.; Villanueva-Meyer, J.E.; Soffietti, R.; Wen, P.Y.; Weller, M.; Tonn, J.C. Investigational PET tracers in neuro-oncology-What's on the horizon? A report of the PET/RANO group. Neuro Oncol. 2022, 24, 131. [Google Scholar] [CrossRef]
- Foray, C.; Valtorta, S.; Barca, C.; Winkeler, A.; Roll, W.; Muther, M.; Wagner, S.; Gardner, M.L.; Hermann, S.; Schafers, M.; et al. Imaging temozolomide-induced changes in the myeloid glioma microenvironment. Theranostics 2021, 11, 2020–2033. [Google Scholar] [CrossRef]
- Cai, L.; Kirchleitner, S.V.; Zhao, D.; Li, M.; Tonn, J.C.; Glass, R.; Kalin, R.E. Glioblastoma Exhibits Inter-Individual Heterogeneity of TSPO and LAT1 Expression in Neoplastic and Parenchymal Cells. Int. J. Mol. Sci. 2020, 21, 3390. [Google Scholar] [CrossRef]
- Pigeon, H.; Peres, E.A.; Truillet, C.; Jego, B.; Boumezbeur, F.; Caille, F.; Zinnhardt, B.; Jacobs, A.H.; Le Bihan, D.; Winkeler, A. TSPO-PET and diffusion-weighted MRI for imaging a mouse model of infiltrative human glioma. Neuro Oncol. 2019, 21, 755–764. [Google Scholar] [CrossRef] [PubMed]
- Aras, S.; Zaidi, M.R. TAMeless traitors: Macrophages in cancer progression and metastasis. Br. J. Cancer 2017, 117, 1583–1591. [Google Scholar] [CrossRef] [PubMed]
- Charles, N.A.; Holland, E.C.; Gilbertson, R.; Glass, R.; Kettenmann, H. The brain tumor microenvironment. Glia 2012, 60, 502–514. [Google Scholar] [CrossRef] [PubMed]
- Jain, P.; Chaney, A.M.; Carlson, M.L.; Jackson, I.M.; Rao, A.; James, M.L. Neuroinflammation PET Imaging: Current Opinion and Future Directions. J. Nucl. Med. 2020, 61, 1107–1112. [Google Scholar] [CrossRef] [PubMed]
- Van Camp, N.; Lavisse, S.; Roost, P.; Gubinelli, F.; Hillmer, A.; Boutin, H. TSPO imaging in animal models of brain diseases. Eur. J. Nucl. Med. Mol. Imaging 2021, 49, 77–109. [Google Scholar] [CrossRef]
- Albert, N.L.; Unterrainer, M.; Brendel, M.; Kaiser, L.; Zweckstetter, M.; Cumming, P.; Bartenstein, P. In response to: The validity of (18)F-GE180 as a TSPO imaging agent. Eur. J. Nucl. Med. Mol. Imaging 2019, 46, 1208–1211. [Google Scholar] [CrossRef]
- Albert, N.L.; Unterrainer, M.; Fleischmann, D.F.; Lindner, S.; Vettermann, F.; Brunegraf, A.; Vomacka, L.; Brendel, M.; Wenter, V.; Wetzel, C.; et al. TSPO PET for glioma imaging using the novel ligand (18)F-GE-180: First results in patients with glioblastoma. Eur. J. Nucl. Med. Mol. Imaging 2017, 44, 2230–2238. [Google Scholar] [CrossRef]
- Unterrainer, M.; Fleischmann, D.F.; Diekmann, C.; Vomacka, L.; Lindner, S.; Vettermann, F.; Brendel, M.; Wenter, V.; Ertl-Wagner, B.; Herms, J.; et al. Comparison of (18)F-GE-180 and dynamic (18)F-FET PET in high grade glioma: A double-tracer pilot study. Eur. J. Nucl. Med. Mol. Imaging 2019, 46, 580–590. [Google Scholar] [CrossRef]
- Holzgreve, A.; Pötter, D.; Brendel, M.; Orth, M.; Weidner, L.; Gold, L.; Kirchner, M.A.; Bartos, L.M.; Unterrainer, L.M.; Unterrainer, M.; et al. Longitudinal [(18)F]GE-180 PET Imaging Facilitates In Vivo Monitoring of TSPO Expression in the GL261 Glioblastoma Mouse Model. Biomedicines 2022, 10, 3390. [Google Scholar] [CrossRef]
- Hafliger, P.; Charles, R.P. The L-Type Amino Acid Transporter LAT1-An Emerging Target in Cancer. Int. J. Mol. Sci. 2019, 20, 3390. [Google Scholar] [CrossRef]
- Albert, N.L.; Weller, M.; Suchorska, B.; Galldiks, N.; Soffietti, R.; Kim, M.M.; la Fougere, C.; Pope, W.; Law, I.; Arbizu, J.; et al. Response Assessment in Neuro-Oncology working group and European Association for Neuro-Oncology recommendations for the clinical use of PET imaging in gliomas. Neuro Oncol. 2016, 18, 1199–1208. [Google Scholar] [CrossRef] [PubMed]
- Holzgreve, A.; Brendel, M.; Gu, S.; Carlsen, J.; Mille, E.; Boning, G.; Mastrella, G.; Unterrainer, M.; Gildehaus, F.J.; Rominger, A.; et al. Monitoring of Tumor Growth with [(18)F]-FET PET in a Mouse Model of Glioblastoma: SUV Measurements and Volumetric Approaches. Front. Neurosci. 2016, 10, 260. [Google Scholar] [CrossRef] [PubMed]
- Ammer, L.M.; Vollmann-Zwerenz, A.; Ruf, V.; Wetzel, C.H.; Riemenschneider, M.J.; Albert, N.L.; Beckhove, P.; Hau, P. The Role of Translocator Protein TSPO in Hallmarks of Glioblastoma. Cancers 2020, 12, 3390. [Google Scholar] [CrossRef] [PubMed]
- Quach, S.; Holzgreve, A.; von Baumgarten, L.; Niyazi, M.; Unterrainer, M.; Thon, N.; Stöcklein, S.; Bartenstein, P.; Tonn, J.C.; Albert, N.L. Increased TSPO PET signal after radiochemotherapy in IDH-wildtype glioma-indicator for treatment-induced immune activation? Eur. J. Nucl. Med. Mol. Imaging 2022, 49, 4282–4283. [Google Scholar] [CrossRef] [PubMed]
- Foray, C.; Barca, C.; Winkeler, A.; Wagner, S.; Hermann, S.; Schaefers, M.; Grauer, O.M.; Zinnhardt, B.; Jacobs, A.H. Interrogating glioma-associated microglia/macrophage dynamics under CSF-1R therapy with multi-tracer in vivo PET/MR imaging. J. Nucl. Med. 2022, 49, 4282–4283. [Google Scholar] [CrossRef]
- Zinnhardt, B.; Muther, M.; Roll, W.; Backhaus, P.; Jeibmann, A.; Foray, C.; Barca, C.; Doring, C.; Tavitian, B.; Dolle, F.; et al. TSPO imaging-guided characterization of the immunosuppressive myeloid tumor microenvironment in patients with malignant glioma. Neuro Oncol. 2020, 22, 1030–1043. [Google Scholar] [CrossRef]
- Chechneva, O.V.; Deng, W. Mitochondrial translocator protein (TSPO), astrocytes and neuroinflammation. Neural Regen. Res. 2016, 11, 1056–1057. [Google Scholar] [CrossRef]
- Wadsworth, H.; Jones, P.A.; Chau, W.F.; Durrant, C.; Fouladi, N.; Passmore, J.; O'Shea, D.; Wynn, D.; Morisson-Iveson, V.; Ewan, A.; et al. [¹⁸F]GE-180: A novel fluorine-18 labelled PET tracer for imaging Translocator protein 18 kDa (TSPO). Bioorg Med. Chem. Lett. 2012, 22, 1308–1313. [Google Scholar] [CrossRef]
- Stegen, B.; Nieto, A.; Albrecht, V.; Maas, J.; Orth, M.; Neumaier, K.; Reinhardt, S.; Weick-Kleemann, M.; Goetz, W.; Reinhart, M.; et al. Contrast-enhanced, conebeam CT-based, fractionated radiotherapy and follow-up monitoring of orthotopic mouse glioblastoma: A proof-of-concept study. Radiat. Oncol. 2020, 15, 19. [Google Scholar] [CrossRef]
- Brendel, M.; Probst, F.; Jaworska, A.; Overhoff, F.; Korzhova, V.; Albert, N.L.; Beck, R.; Lindner, S.; Gildehaus, F.J.; Baumann, K.; et al. Glial Activation and Glucose Metabolism in a Transgenic Amyloid Mouse Model: A Triple-Tracer PET Study. J. Nucl. Med. 2016, 57, 954–960. [Google Scholar] [CrossRef]
- Wester, H.J.; Herz, M.; Weber, W.; Heiss, P.; Senekowitsch-Schmidtke, R.; Schwaiger, M.; Stöcklin, G. Synthesis and radiopharmacology of O-(2-[18F]fluoroethyl)-L-tyrosine for tumor imaging. J. Nucl. Med. 1999, 40, 205–212. [Google Scholar] [PubMed]
- Clatterbuck, R.E.; Sipos, E.P. The efficient calculation of neurosurgically relevant volumes from computed tomographic scans using Cavalieri's Direct Estimator. Neurosurgery 1997, 40, 339–342, discussion 343. [Google Scholar] [CrossRef] [PubMed]
- Cardiff, R.D.; Miller, C.H.; Munn, R.J. Manual hematoxylin and eosin staining of mouse tissue sections. Cold Spring Harb. Protoc. 2014, 2014, 655–658. [Google Scholar] [CrossRef]
- Hao, Z.; Rajewsky, K. Homeostasis of peripheral B cells in the absence of B cell influx from the bone marrow. J. Exp. Med. 2001, 194, 1151–1164. [Google Scholar] [CrossRef] [PubMed]
- Tritz, Z.P.; Ayasoufi, K.; Johnson, A.J. Anti-PD-1 checkpoint blockade monotherapy in the orthotopic GL261 glioma model: The devil is in the detail. Neurooncol Adv. 2021, 3, vdab066. [Google Scholar] [CrossRef]
- Bartos, L.M.; Kirchleitner, S.V.; Blobner, J.; Wind, K.; Kunze, L.H.; Holzgreve, A.; Gold, L.; Zatcepin, A.; Kolabas, Z.I.; Ulukaya, S.; et al. 18 kDa translocator protein positron emission tomography facilitates early and robust tumor detection in the immunocompetent SB28 glioblastoma mouse model. Frontiers in Medicine 2022, 9, 2848. [Google Scholar] [CrossRef]
- Banati, R.B.; Wilcox, P.; Xu, R.; Yin, G.; Si, E.; Son, E.T.; Shimizu, M.; Holsinger, R.M.D.; Parmar, A.; Zahra, D.; et al. Selective, high-contrast detection of syngeneic glioblastoma in vivo. Sci. Rep. 2020, 10, 9968. [Google Scholar] [CrossRef]
- Wei, J.; Gabrusiewicz, K.; Heimberger, A. The controversial role of microglia in malignant gliomas. Clin. Dev. Immunol. 2013, 2013, 285246. [Google Scholar] [CrossRef]
- Ugel, S.; De Sanctis, F.; Mandruzzato, S.; Bronte, V. Tumor-induced myeloid deviation: When myeloid-derived suppressor cells meet tumor-associated macrophages. J. Clin. Investig. 2015, 125, 3365–3376. [Google Scholar] [CrossRef]
- Zhai, K.; Huang, Z.; Huang, Q.; Tao, W.; Fang, X.; Zhang, A.; Li, X.; Stark, G.R.; Hamilton, T.A.; Bao, S. Pharmacological inhibition of BACE1 suppresses glioblastoma growth by stimulating macrophage phagocytosis of tumor cells. Nat. Cancer 2021, 2, 1136–1151. [Google Scholar] [CrossRef]
- Anagnostakis, F.; Piperi, C. Targeting options of tumor-associated macrophages (TAM) activity in gliomas. Curr. Neuropharmacol. 2022, 21, 457–470. [Google Scholar] [CrossRef] [PubMed]
- Wu, J.; Liang, Y.; Chen, S.; Hsu, C.L.; Chavarha, M.; Evans, S.W.; Shi, D.; Lin, M.Z.; Tsia, K.K.; Ji, N. Kilohertz two-photon fluorescence microscopy imaging of neural activity in vivo. Nat. Methods 2020, 17, 287–290. [Google Scholar] [CrossRef] [PubMed]
- Qiao, G.; Gulisashvili, D.; Jablonska, A.; Zhao, G.; Janowski, M.; Walczak, P.; Liang, Y. 3D printing-based frugal manufacturing of glass pipettes for minimally invasive delivery of therapeutics to the brain. Neuroprotection 2023, 1, 58–65. [Google Scholar] [CrossRef]
- Kienast, Y.; von Baumgarten, L.; Fuhrmann, M.; Klinkert, W.E.; Goldbrunner, R.; Herms, J.; Winkler, F. Real-time imaging reveals the single steps of brain metastasis formation. Nat. Med. 2010, 16, 116–122. [Google Scholar] [CrossRef] [PubMed]
- Zinnhardt, B.; Pigeon, H.; Theze, B.; Viel, T.; Wachsmuth, L.; Fricke, I.B.; Schelhaas, S.; Honold, L.; Schwegmann, K.; Wagner, S.; et al. Combined PET Imaging of the Inflammatory Tumor Microenvironment Identifies Margins of Unique Radiotracer Uptake. Cancer Res. 2017, 77, 1831–1841. [Google Scholar] [CrossRef]
- Fee, D.; Crumbaugh, A.; Jacques, T.; Herdrich, B.; Sewell, D.; Auerbach, D.; Piaskowski, S.; Hart, M.N.; Sandor, M.; Fabry, Z. Activated/effector CD4+ T cells exacerbate acute damage in the central nervous system following traumatic injury. J. Neuroimmunol. 2003, 136, 54–66. [Google Scholar] [CrossRef] [PubMed]
- Villa, A.; Gelosa, P.; Castiglioni, L.; Cimino, M.; Rizzi, N.; Pepe, G.; Lolli, F.; Marcello, E.; Sironi, L.; Vegeto, E.; et al. Sex-Specific Features of Microglia from Adult Mice. Cell Rep. 2018, 23, 3501–3511. [Google Scholar] [CrossRef]
- Norden, D.M.; Godbout, J.P. Review: Microglia of the aged brain: Primed to be activated and resistant to regulation. Neuropathol. Appl. Neurobiol. 2013, 39, 19–34. [Google Scholar] [CrossRef]
- Martinez-Tapia, R.J.; Estrada-Rojo, F.; Lopez-Aceves, T.G.; Rodríguez-Mata, V.; Perez-Torres, A.; Barajas-Martinez, A.; Garcia-Velasco, S.; Ugalde-Muñiz, P.; Navarro, L. Diurnal Variation Induces Neurobehavioral and Neuropathological Differences in a Rat Model of Traumatic Brain Injury. Front. Neurosci. 2020, 14, 564992. [Google Scholar] [CrossRef]
- Zajaczkowska, R.; Popiolek-Barczyk, K.; Pilat, D.; Rojewska, E.; Makuch, W.; Wordliczek, J.; Mika, J. Involvement of microglial cells in the antinociceptive effects of metamizol in a mouse model of neuropathic pain. Pharmacol. Biochem. Behav. 2018, 175, 77–88. [Google Scholar] [CrossRef]
- Cai, R.; Pan, C.; Ghasemigharagoz, A.; Todorov, M.I.; Forstera, B.; Zhao, S.; Bhatia, H.S.; Parra-Damas, A.; Mrowka, L.; Theodorou, D.; et al. Panoptic imaging of transparent mice reveals whole-body neuronal projections and skull-meninges connections. Nat. Neurosci. 2019, 22, 317–327. [Google Scholar] [CrossRef] [PubMed]
- Kolabas, Z.I.; Kuemmerle, L.B.; Perneczky, R.; Förstera, B.; Ulukaya, S.; Ali, M.; Kapoor, S.; Bartos, L.M.; Büttner, M.; Caliskan, O.S.; et al. Distinct molecular profiles of skull bone marrow in health and neurological disorders. Cell 2023, 186, 3706–3725.e3729. [Google Scholar] [CrossRef]
- Deczkowska, A.; Keren-Shaul, H.; Weiner, A.; Colonna, M.; Schwartz, M.; Amit, I. Disease-Associated Microglia: A Universal Immune Sensor of Neurodegeneration. Cell 2018, 173, 1073–1081. [Google Scholar] [CrossRef] [PubMed]
- Turtzo, L.C.; Lescher, J.; Janes, L.; Dean, D.D.; Budde, M.D.; Frank, J.A. Macrophagic and microglial responses after focal traumatic brain injury in the female rat. J. Neuroinflammation 2014, 11, 82. [Google Scholar] [CrossRef] [PubMed]
- Mishra, S.K.; Kumar, B.S.; Khushu, S.; Singh, A.K.; Gangenahalli, G. Early monitoring and quantitative evaluation of macrophage infiltration after experimental traumatic brain injury: A magnetic resonance imaging and flow cytometric analysis. Mol. Cell Neurosci. 2017, 78, 25–34. [Google Scholar] [CrossRef]
- Winkeler, A.; Boisgard, R.; Awde, A.R.; Dubois, A.; Theze, B.; Zheng, J.; Ciobanu, L.; Dolle, F.; Viel, T.; Jacobs, A.H.; et al. The translocator protein ligand [(1)(8)F]DPA-714 images glioma and activated microglia in vivo. Eur. J. Nucl. Med. Mol. Imaging 2012, 39, 811–823. [Google Scholar] [CrossRef]
- Roncaroli, F.; Su, Z.; Herholz, K.; Gerhard, A.; Turkheimer, F.E. TSPO expression in brain tumours: Is TSPO a target for brain tumour imaging? Clin. Transl. Imaging 2016, 4, 145–156. [Google Scholar] [CrossRef]
- Placone, A.L.; Quiñones-Hinojosa, A.; Searson, P.C. The role of astrocytes in the progression of brain cancer: Complicating the picture of the tumor microenvironment. Tumour Biol. 2016, 37, 61–69. [Google Scholar] [CrossRef]
- Maeda, J.; Higuchi, M.; Inaji, M.; Ji, B.; Haneda, E.; Okauchi, T.; Zhang, M.R.; Suzuki, K.; Suhara, T. Phase-dependent roles of reactive microglia and astrocytes in nervous system injury as delineated by imaging of peripheral benzodiazepine receptor. Brain Res. 2007, 1157, 100–111. [Google Scholar] [CrossRef]
- Bartos, L.M.; Kirchleitner, S.V.; Kolabas, Z.I.; Quach, S.; Beck, A.; Lorenz, J.; Blobner, J.; Mueller, S.A.; Ulukaya, S.; Hoeher, L.; et al. Deciphering sources of PET signals in the tumor microenvironment of glioblastoma at cellular resolution. Sci. Adv. 2023, 9, eadi8986. [Google Scholar] [CrossRef]
- Xiang, X.; Wind, K.; Wiedemann, T.; Blume, T.; Shi, Y.; Briel, N.; Beyer, L.; Biechele, G.; Eckenweber, F.; Zatcepin, A.; et al. Microglial activation states drive glucose uptake and FDG-PET alterations in neurodegenerative diseases. Sci. Transl. Med. 2021, 13, eabe5640. [Google Scholar] [CrossRef] [PubMed]
- Deussing, M.; Blume, T.; Vomacka, L.; Mahler, C.; Focke, C.; Todica, A.; Unterrainer, M.; Albert, N.L.; Lindner, S.; von Ungern-Sternberg, B.; et al. Coupling between physiological TSPO expression in brain and myocardium allows stabilization of late-phase cerebral [(18)F]GE180 PET quantification. Neuroimage 2018, 165, 83–91. [Google Scholar] [CrossRef]
- 4Chen, P.; Hsu, W.H.; Chang, A.; Tan, Z.; Lan, Z.; Zhou, A.; Spring, D.J.; Lang, F.F.; Wang, Y.A.; DePinho, R.A. Circadian Regulator CLOCK Recruits Immune-Suppressive Microglia into the GBM Tumor Microenvironment. Cancer Discov. 2020, 10, 371–381. [Google Scholar] [CrossRef]
- Lavisse, S.; Guillermier, M.; Hérard, A.S.; Petit, F.; Delahaye, M.; Van Camp, N.; Ben Haim, L.; Lebon, V.; Remy, P.; Dollé, F.; et al. Reactive astrocytes overexpress TSPO and are detected by TSPO positron emission tomography imaging. J. Neurosci. 2012, 32, 10809–10818. [Google Scholar] [CrossRef] [PubMed]
- Rojas, S.; Martin, A.; Arranz, M.J.; Pareto, D.; Purroy, J.; Verdaguer, E.; Llop, J.; Gomez, V.; Gispert, J.D.; Millan, O.; et al. Imaging brain inflammation with [(11)C]PK11195 by PET and induction of the peripheral-type benzodiazepine receptor after transient focal ischemia in rats. J. Cereb. Blood Flow Metab. 2007, 27, 1975–1986. [Google Scholar] [CrossRef] [PubMed]
- Wang, Y.; Yue, X.; Kiesewetter, D.O.; Niu, G.; Teng, G.; Chen, X. PET imaging of neuroinflammation in a rat traumatic brain injury model with radiolabeled TSPO ligand DPA-714. Eur. J. Nucl. Med. Mol. Imaging 2014, 41, 1440–1449. [Google Scholar] [CrossRef] [PubMed]
- Martin, A.; Boisgard, R.; Theze, B.; Van Camp, N.; Kuhnast, B.; Damont, A.; Kassiou, M.; Dolle, F.; Tavitian, B. Evaluation of the PBR/TSPO radioligand [(18)F]DPA-714 in a rat model of focal cerebral ischemia. J. Cereb. Blood Flow Metab. 2010, 30, 230–241. [Google Scholar] [CrossRef]
- Roh, Y.J.; Gong, J.E.; Kim, J.E.; Jin, Y.J.; Song, H.J.; Seol, A.; Park, J.; Lim, Y.; Hwang, D.Y. Comparison of immunophenotypes between Rag2 knockout mice derived from two different sources. Lab. Anim. Res. 2023, 39, 2. [Google Scholar] [CrossRef]
- Shinkai, Y.; Rathbun, G.; Lam, K.P.; Oltz, E.M.; Stewart, V.; Mendelsohn, M.; Charron, J.; Datta, M.; Young, F.; Stall, A.M. , et al. RAG-2-deficient mice lack mature lymphocytes owing to inability to initiate V(D)J rearrangement. Cell 1992, 68, 855–867. [Google Scholar] [CrossRef]
- Awde, A.R.; Boisgard, R.; Thézé, B.; Dubois, A.; Zheng, J.; Dollé, F.; Jacobs, A.H.; Tavitian, B.; Winkeler, A. The translocator protein radioligand 18F-DPA-714 monitors antitumor effect of erufosine in a rat 9L intracranial glioma model. J. Nucl. Med. 2013, 54, 2125–2131. [Google Scholar] [CrossRef]


Disclaimer/Publisher’s Note: The statements, opinions and data contained in all publications are solely those of the individual author(s) and contributor(s) and not of MDPI and/or the editor(s). MDPI and/or the editor(s) disclaim responsibility for any injury to people or property resulting from any ideas, methods, instructions or products referred to in the content. |
© 2024 by the authors. Licensee MDPI, Basel, Switzerland. This article is an open access article distributed under the terms and conditions of the Creative Commons Attribution (CC BY) license (https://creativecommons.org/licenses/by/4.0/).
Share and Cite
Gold, L.; Barci, E.; Brendel, M.; Orth, M.; Cheng, J.; Kirchleitner, S.V.; Bartos, L.M.; Pötter, D.; Kirchner, M.A.; Unterrainer, L.M.; et al. The Traumatic Inoculation Process Affects TSPO Radioligand Uptake in Experimental Orthotopic Glioblastoma. Biomedicines 2024, 12, 188. https://doi.org/10.3390/biomedicines12010188
Gold L, Barci E, Brendel M, Orth M, Cheng J, Kirchleitner SV, Bartos LM, Pötter D, Kirchner MA, Unterrainer LM, et al. The Traumatic Inoculation Process Affects TSPO Radioligand Uptake in Experimental Orthotopic Glioblastoma. Biomedicines. 2024; 12(1):188. https://doi.org/10.3390/biomedicines12010188
Chicago/Turabian StyleGold, Lukas, Enio Barci, Matthias Brendel, Michael Orth, Jiying Cheng, Sabrina V. Kirchleitner, Laura M. Bartos, Dennis Pötter, Maximilian A. Kirchner, Lena M. Unterrainer, and et al. 2024. "The Traumatic Inoculation Process Affects TSPO Radioligand Uptake in Experimental Orthotopic Glioblastoma" Biomedicines 12, no. 1: 188. https://doi.org/10.3390/biomedicines12010188