

Differential Study of Retinal Thicknesses in the Eyes of Alzheimer’s Patients, Multiple Sclerosis Patients and Healthy Subjects

 , ,
, ,  , , and
Abstract
:1. Introduction
2. Materials and Methods
2.1. Study Cohort
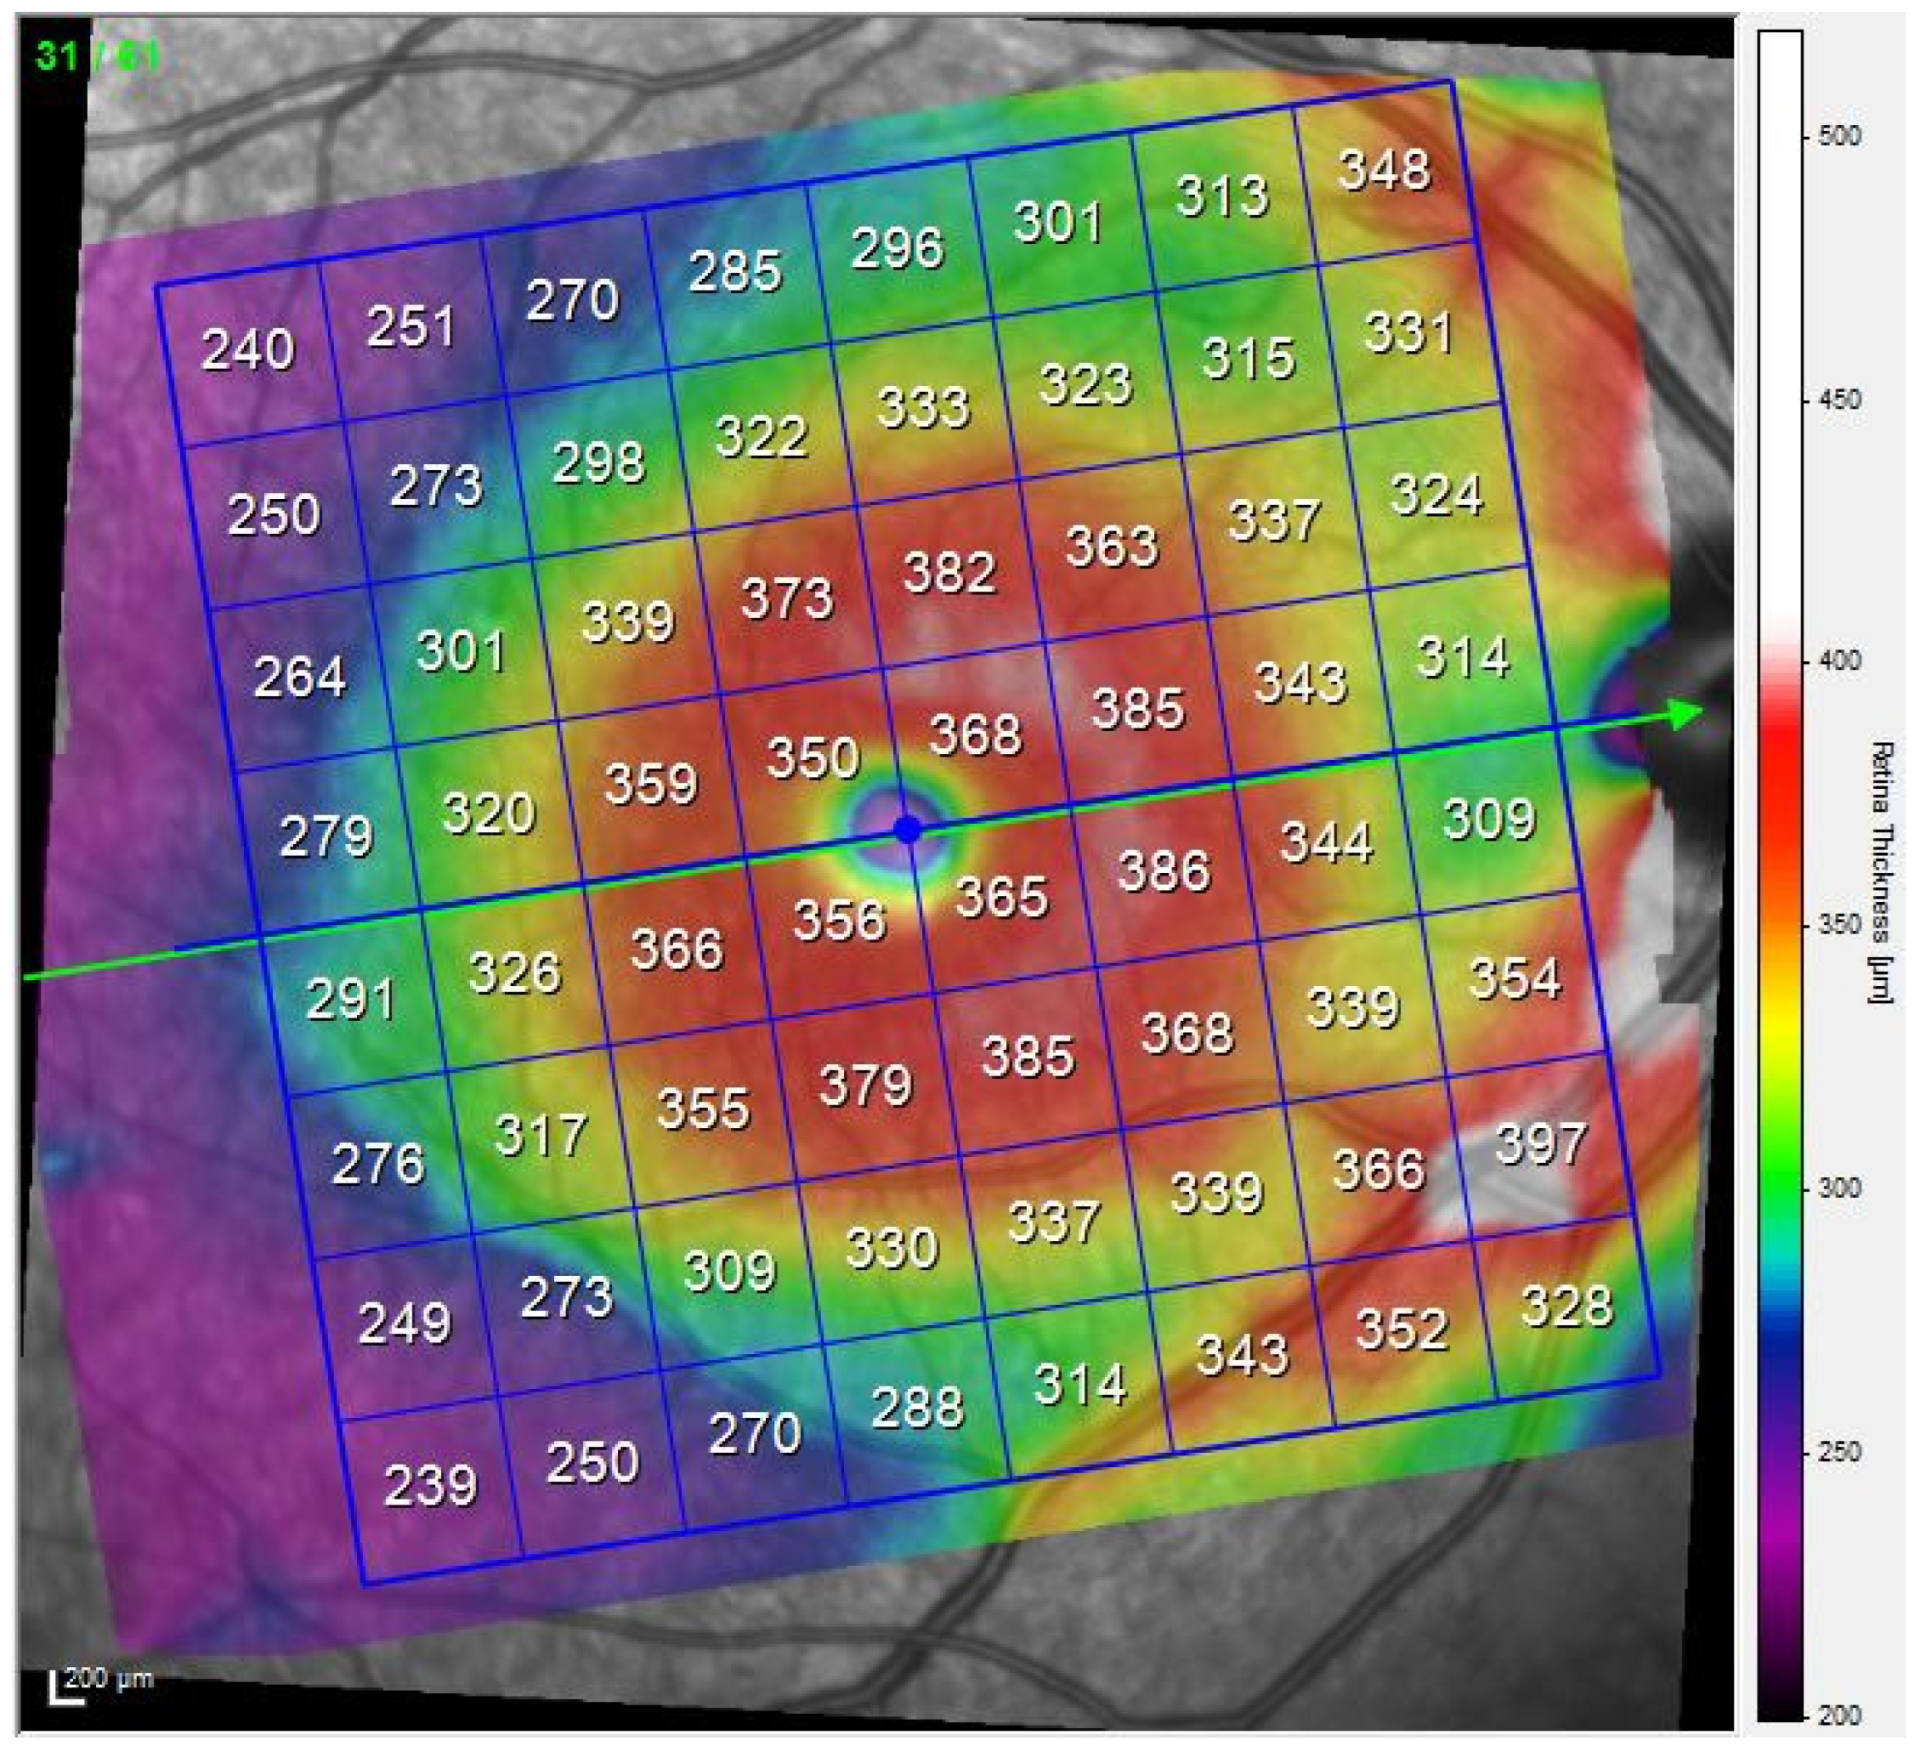
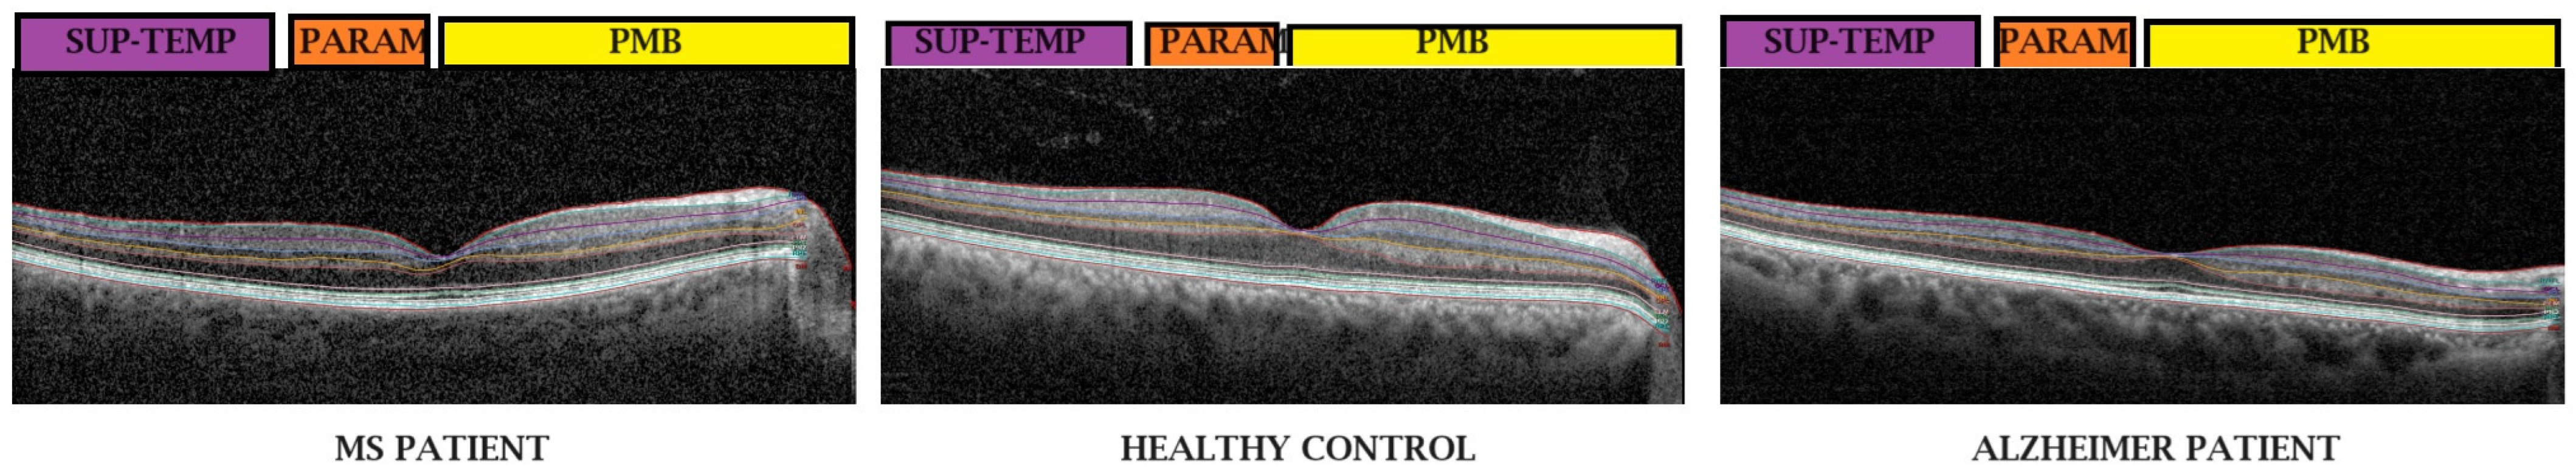
2.2. OCT Method
2.3. Study of Differences in AUC
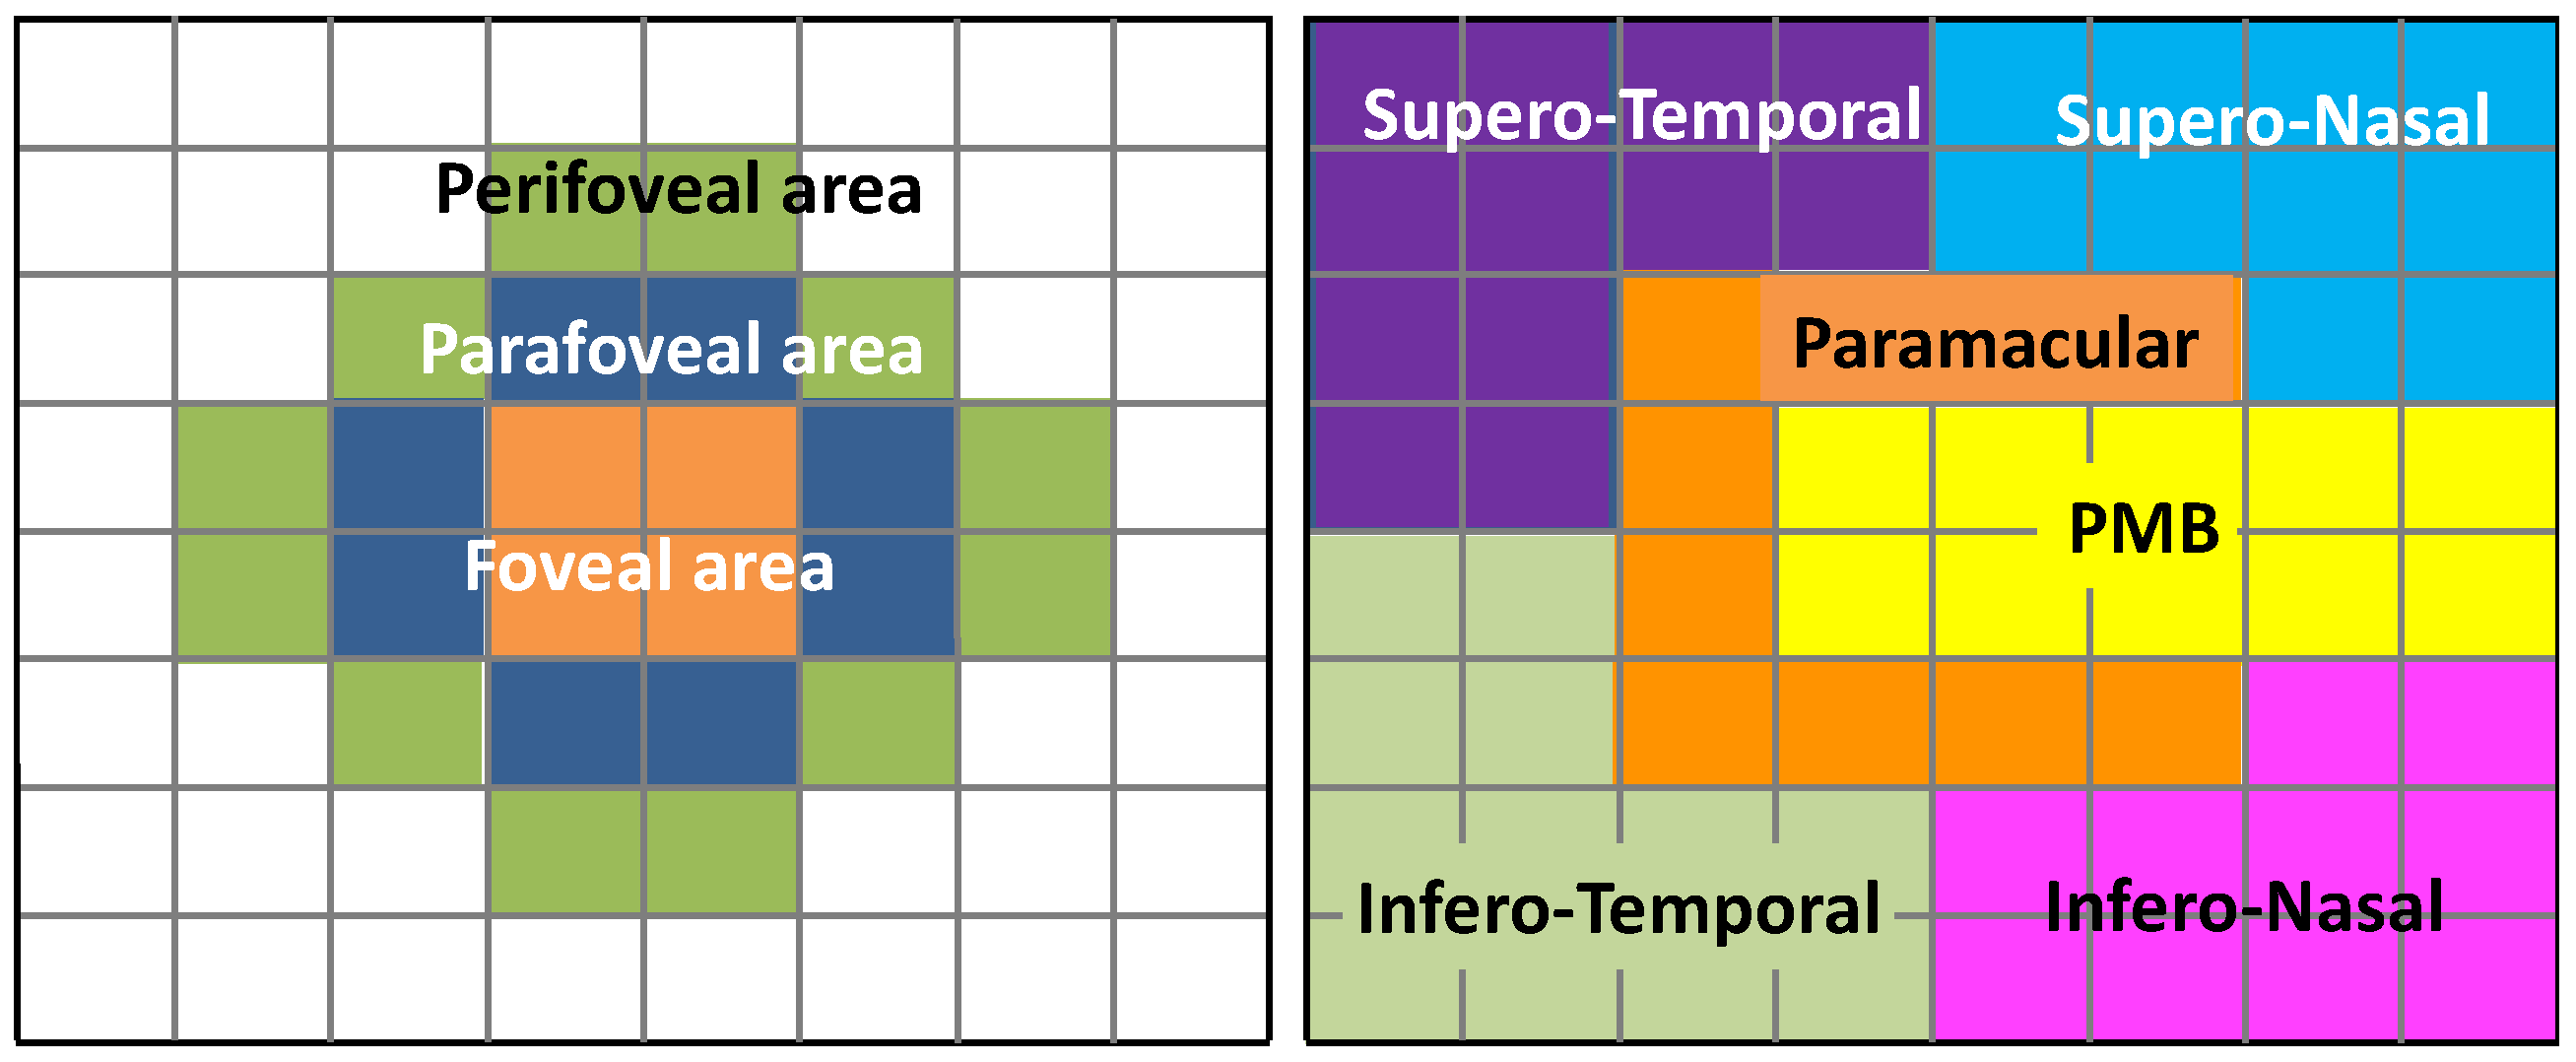
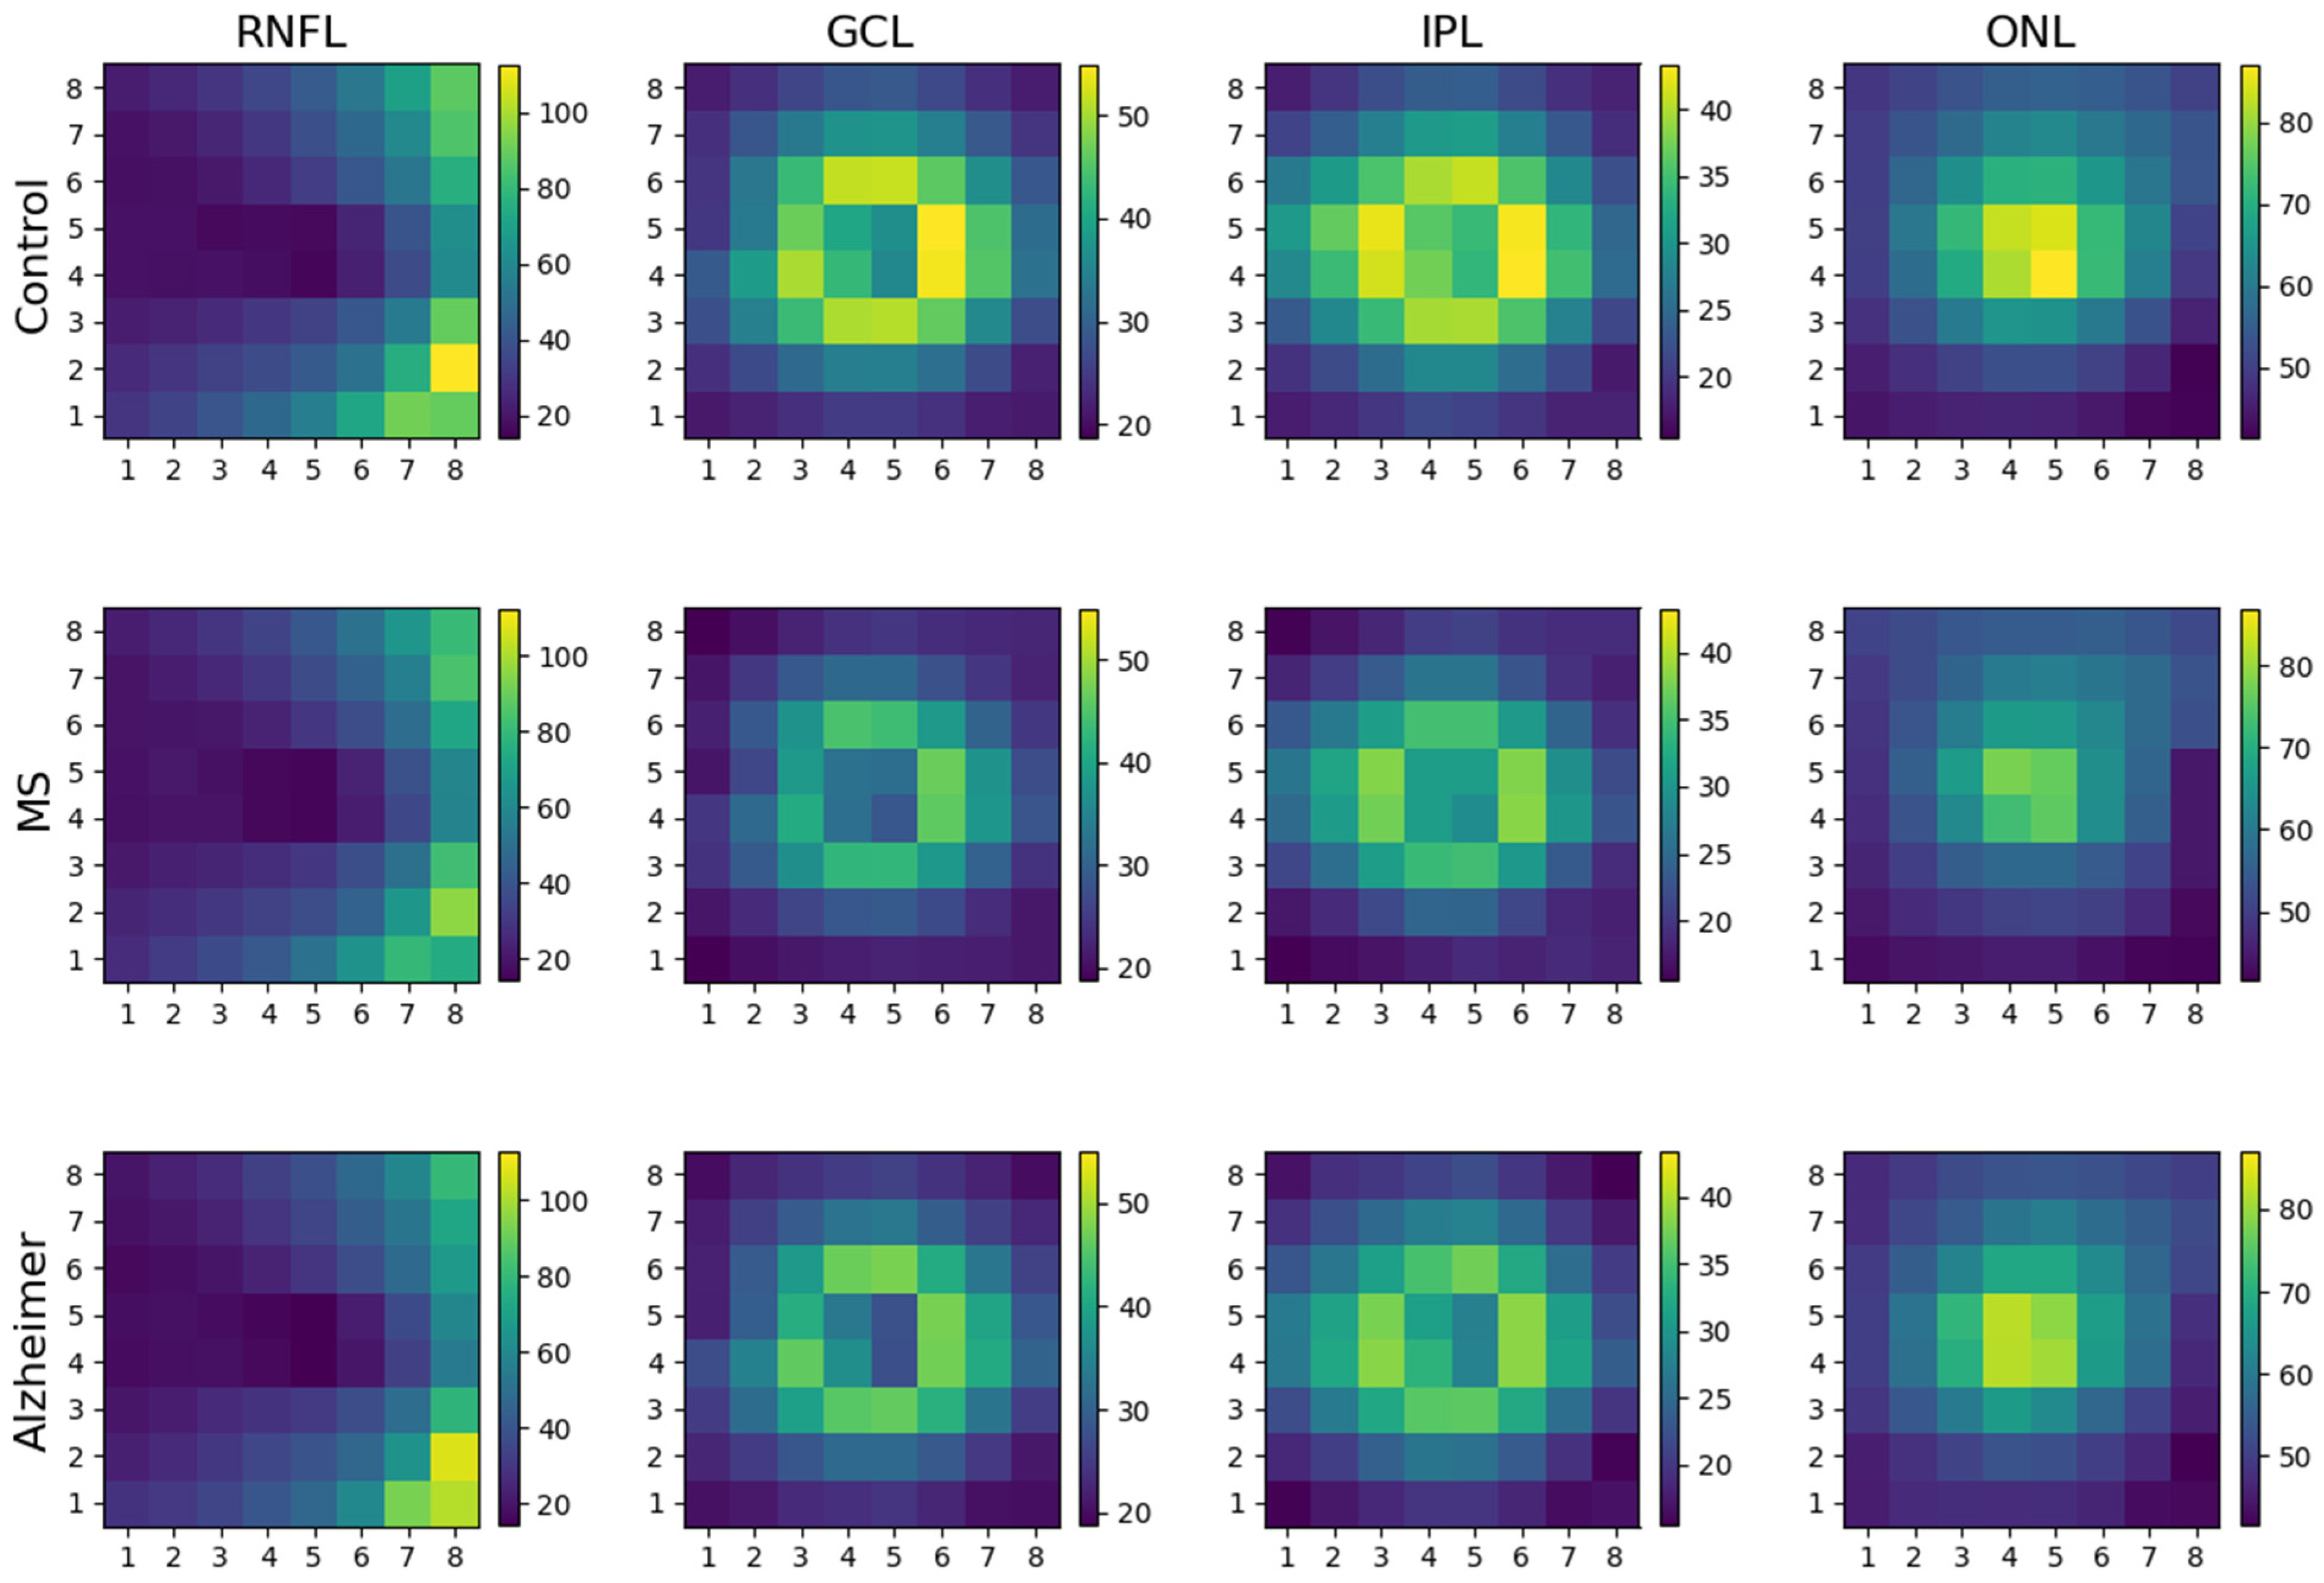
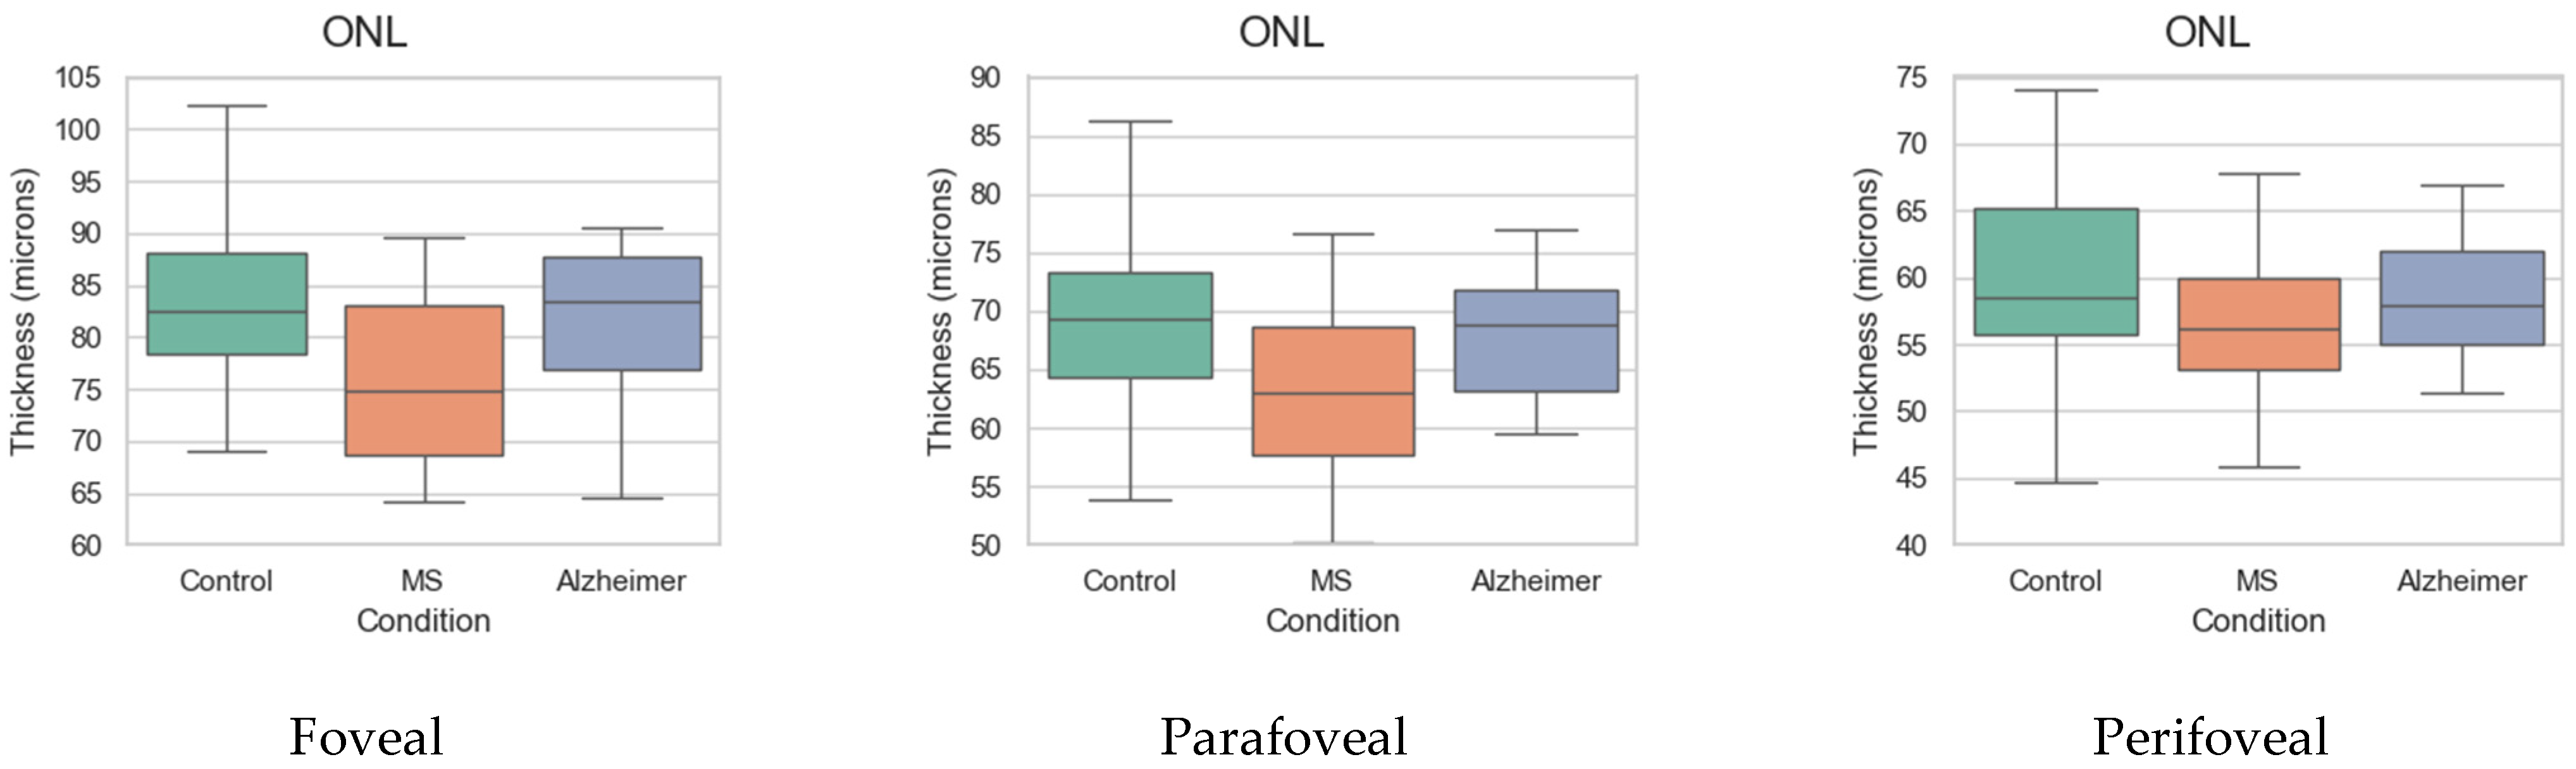
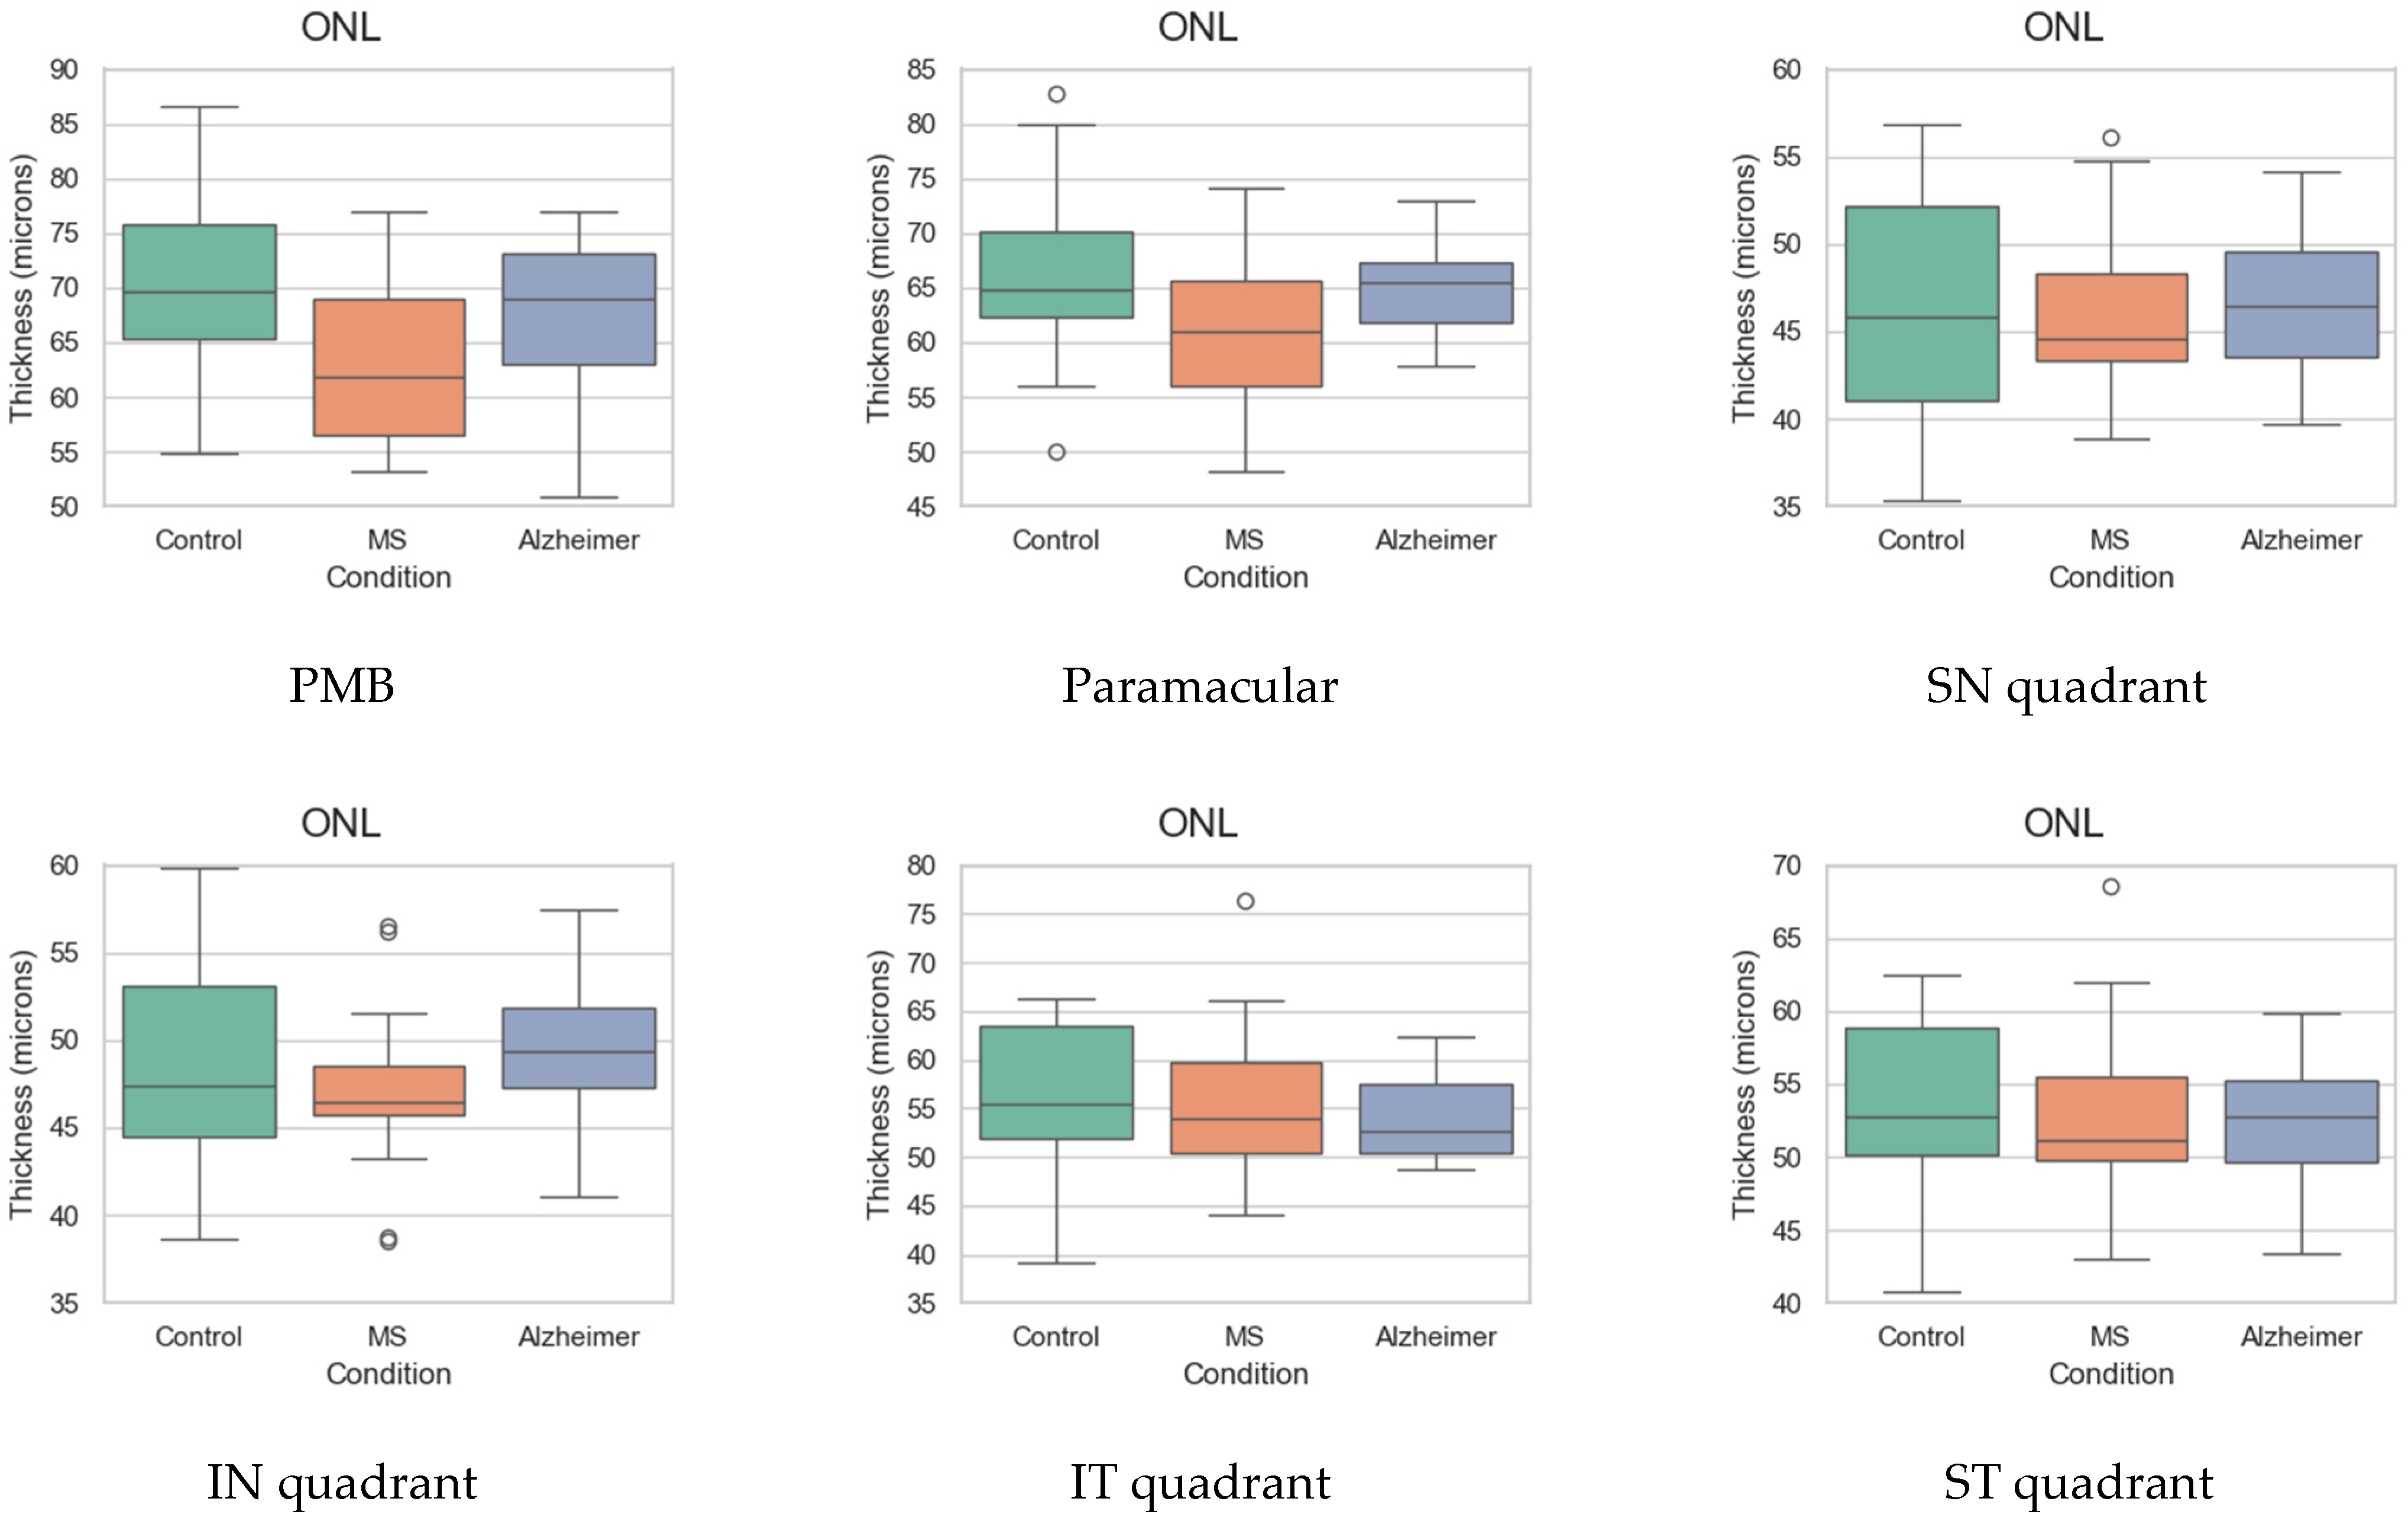
2.4. Analysis Regions
3. Results
3.1. Participating Subjects
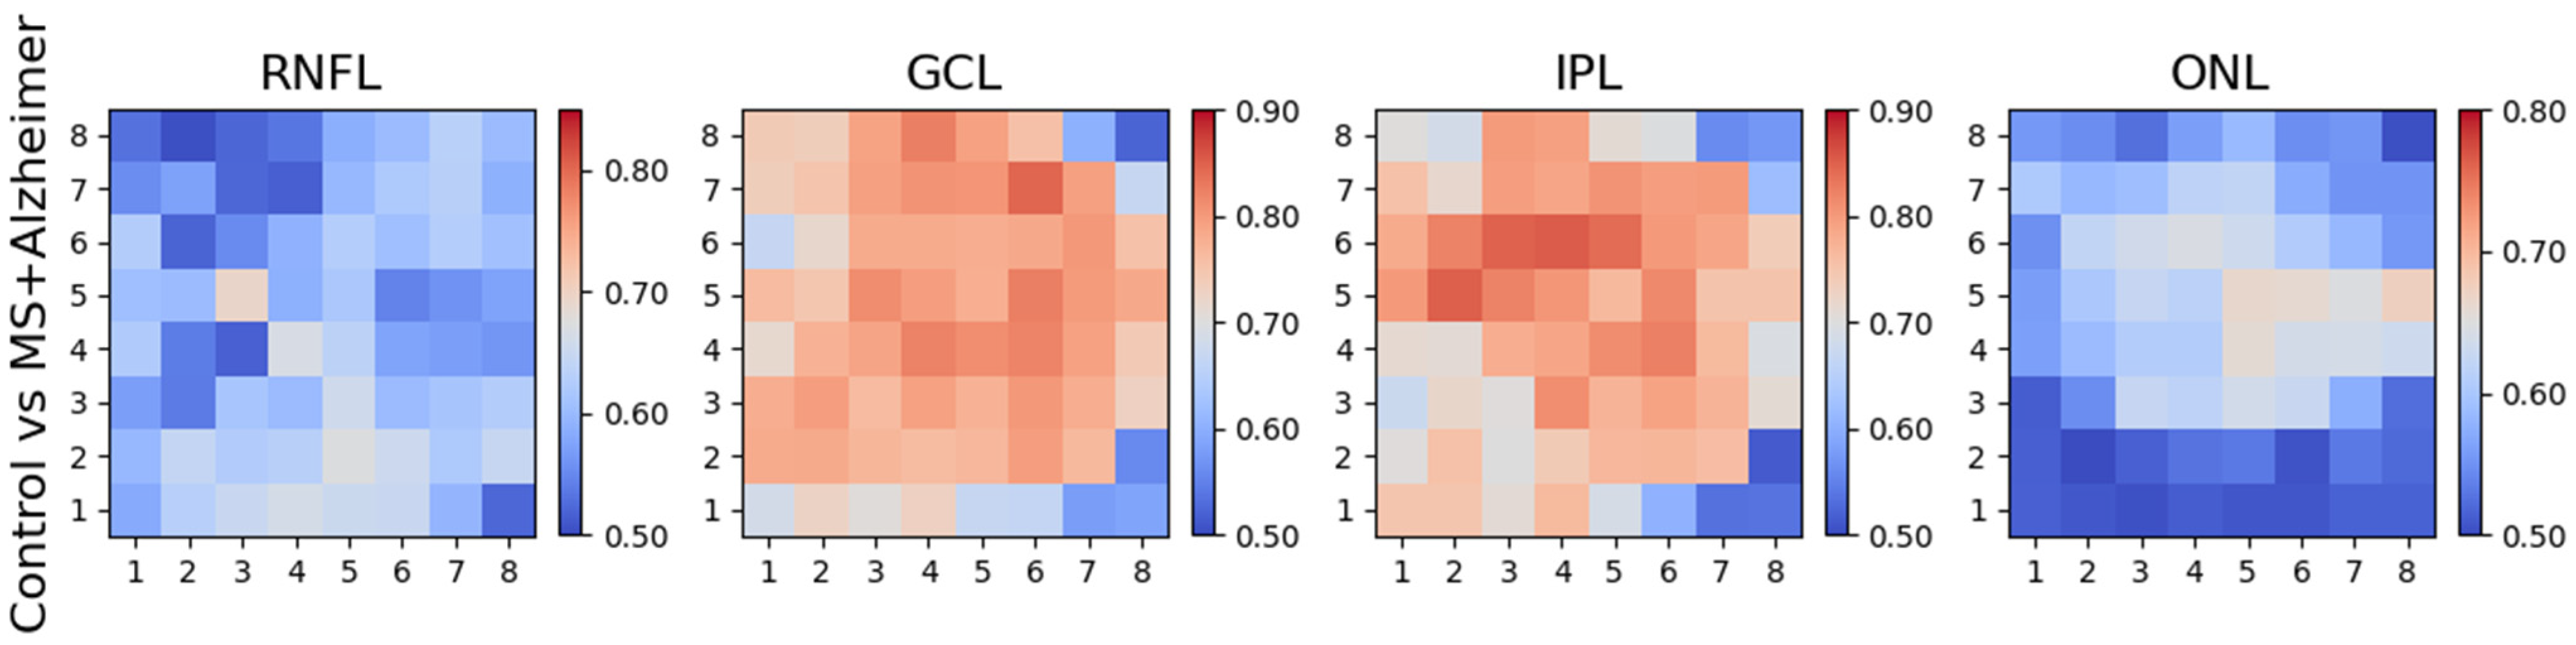
3.2. Differences between Control Subjects and Patients (MS and AD)
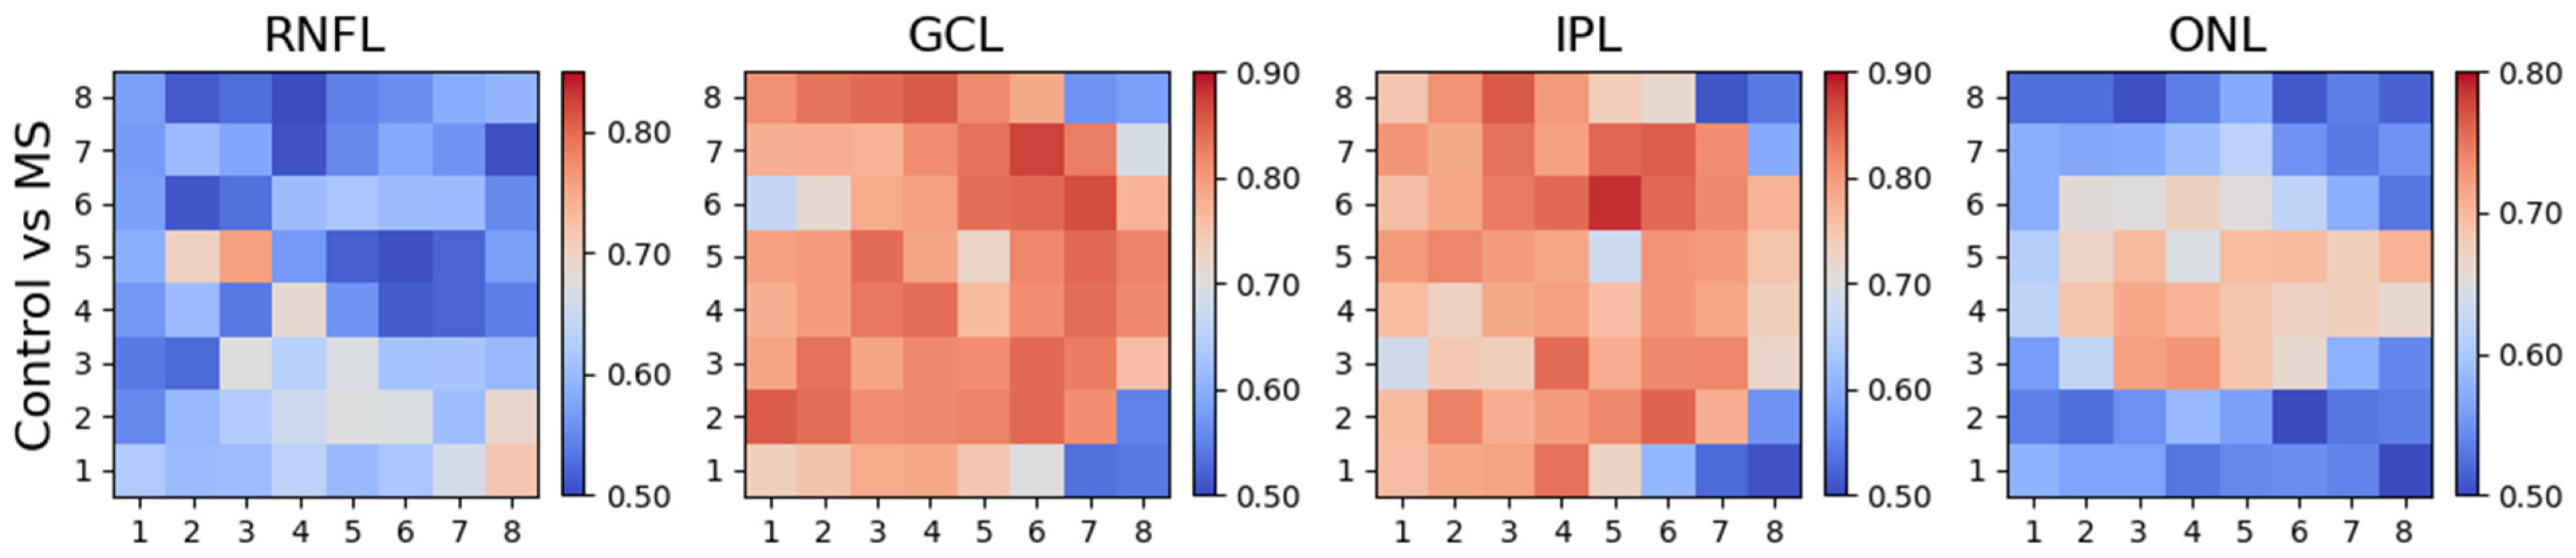
3.3. Differences between Control Subjects and MS Patients
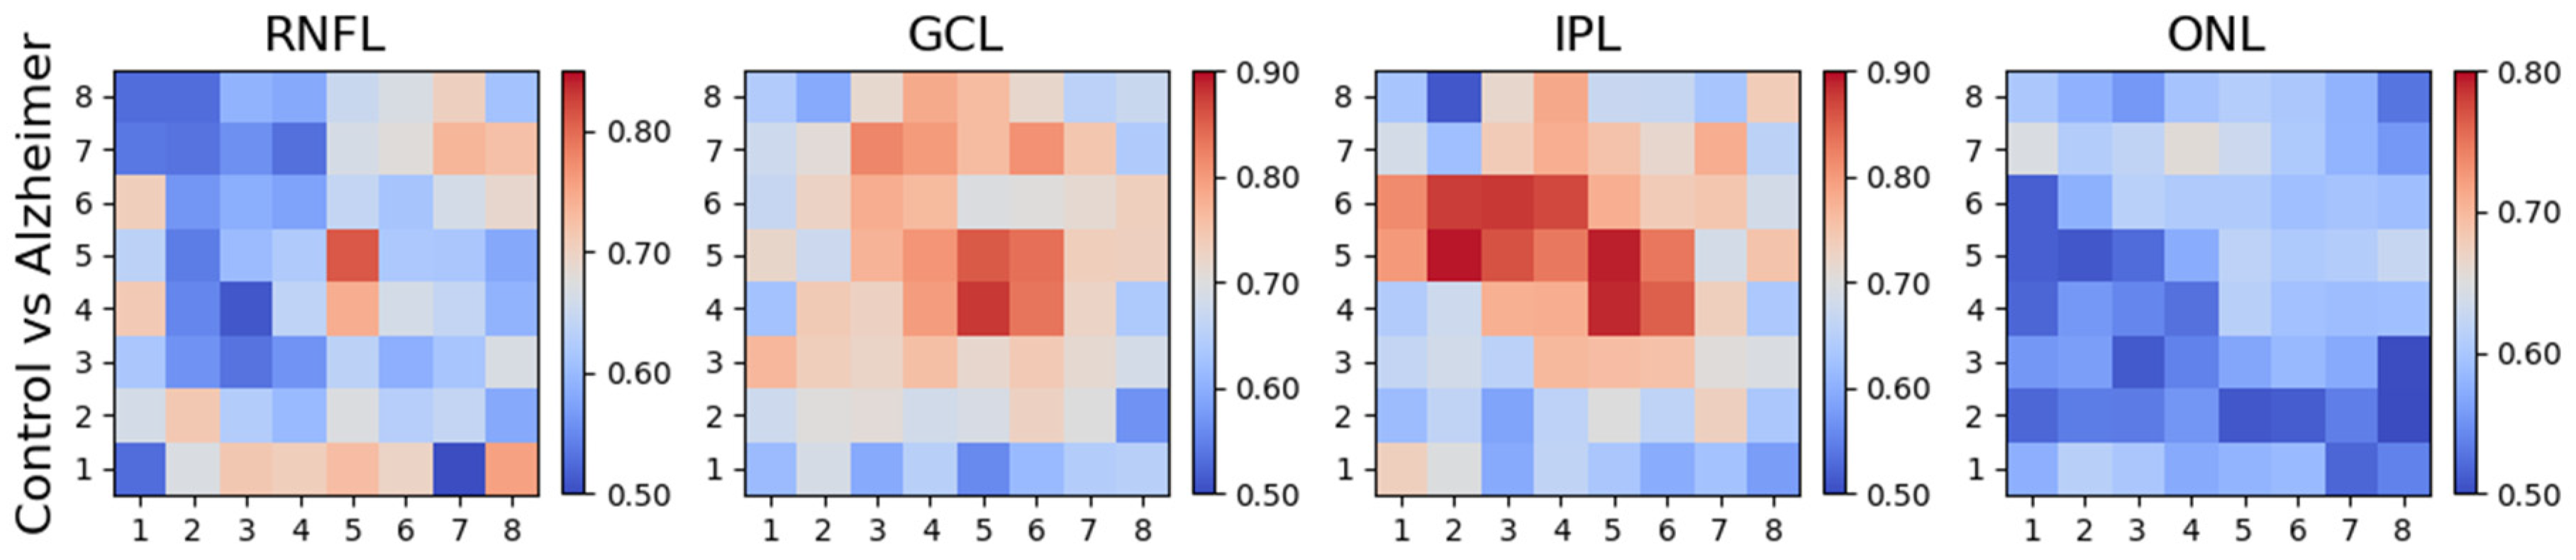
3.4. Differences between Control Subjects and AD Patients
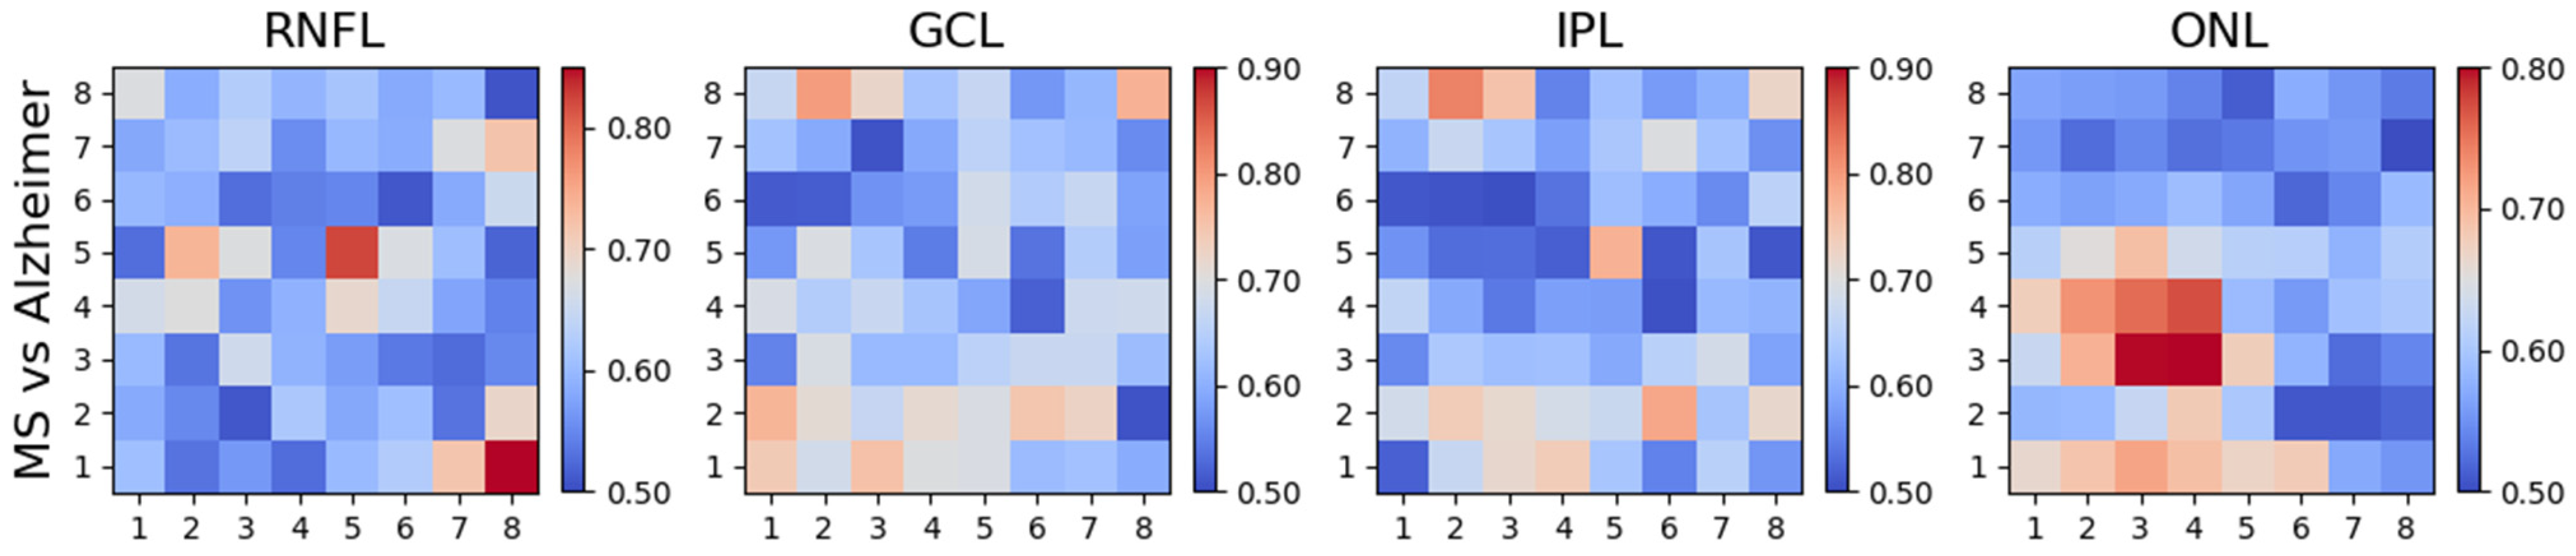
3.5. Differences between MS and AD Patients
4. Discussion and Conclusions
Author Contributions
Funding
Institutional Review Board Statement
Informed Consent Statement
Data Availability Statement
Conflicts of Interest
References
- Gustavsson, A.; Norton, N.; Fast, T.; Frölich, L.; Georges, J.; Holzapfel, D.; Kirabali, T.; Krolak-Salmon, P.; Rossini, P.M.; Ferretti, M.T.; et al. Global estimates on the number of persons across the Alzheimer’s disease continuum. Alzheimer’s Dement. 2023, 19, 658–670. [Google Scholar] [CrossRef] [PubMed]
- Walton, C.; King, R.; Rechtman, L.; Kaye, W.; Leray, E.; Marrie, R.A.; Robertson, N.; La Rocca, N.; Uitdehaag, B.; van der Mei, I.; et al. Rising prevalence of multiple sclerosis worldwide: Insights from the Atlas of MS, third edition. Mult. Scler. J. 2020, 26, 1816–1821. [Google Scholar] [CrossRef] [PubMed]
- Goenka, N.; Tiwari, S. Deep learning for Alzheimer prediction using brain biomarkers. Artif. Intell. Rev. 2021, 54, 4827–4871. [Google Scholar] [CrossRef]
- Thompson, A.J.; Banwell, B.L.; Barkhof, F.; Carroll, W.M.; Coetzee, T.; Comi, G.; Correale, J.; Fazekas, F.; Filippi, M.; Freedman, M.S.; et al. Diagnosis of multiple sclerosis: 2017 revisions of the McDonald criteria. Lancet Neurol. 2018, 17, 162–173. [Google Scholar] [CrossRef] [PubMed]
- Simao, L.M. The contribution of optical coherence tomography in neurodegenerative diseases. Curr. Opin. Ophthalmol. 2013, 24, 521–527. [Google Scholar] [CrossRef]
- Green, A.J.; McQuaid, S.; Hauser, S.L.; Allen, I.V.; Lyness, R. Ocular pathology in multiple sclerosis: Retinal atrophy and inflammation irrespective of disease duration. Brain 2010, 133, 1591–1601. [Google Scholar] [CrossRef]
- Blanks, J.C.; Schmidt, S.Y.; Torigoe, Y.; Porrello, K.V.; Hinton, D.R.; Blanks, R.H.I. Retinal pathology in Alzheimer’s disease. II. Regional neuron loss and glial changes in GCL. Neurobiol. Aging 1996, 17, 385–395. [Google Scholar] [CrossRef]
- Mirmosayyeb, O.; Zivadinov, R.; Weinstock-Guttman, B.; Benedict, R.H.B.; Jakimovski, D. Optical coherence tomography (OCT) measurements and cognitive performance in multiple sclerosis: A systematic review and meta-analysis. J. Neurol. 2023, 270, 1266–1285. [Google Scholar] [CrossRef]
- Cujba, L.; Stan, C.; Samoila, O.; Drugan, T.; Benedec (Cutas), A.; Nicula, C. Identifying Optical Coherence Tomography Markers for Multiple Sclerosis Diagnosis and Management. Diagnostics 2023, 13, 2077. [Google Scholar] [CrossRef]
- Petzold, A.; Balcer, L.J.; Calabresi, P.A.; Costello, F.; Frohman, T.C.; Frohman, E.M.; Martinez-Lapiscina, E.H.; Green, A.J.; Kardon, R.; Outteryck, O.; et al. Retinal layer segmentation in multiple sclerosis: A systematic review and meta-analysis. Lancet Neurol. 2017, 16, 797–812. [Google Scholar] [CrossRef]
- Sheriff, S.; Shen, T.; Abdal, S.; Saks, D.; Mirzaei, M.; Gupta, V.; Chitranshi, N.; You, Y.; Schultz, A.; Graham, S.L.; et al. Retinal thickness and vascular parameters using optical coherence tomography in Alzheimer’s disease: A meta-analysis. Neural Regen. Res. 2023, 18, 2504–2513. [Google Scholar] [CrossRef] [PubMed]
- Costanzo, E.; Lengyel, I.; Parravano, M.; Biagini, I.; Veldsman, M.; Badhwar, A.; Betts, M.; Cherubini, A.; Llewellyn, D.J.; Lourida, I.; et al. Ocular Biomarkers for Alzheimer Disease Dementia. JAMA Ophthalmol. 2023, 141, 84. [Google Scholar] [CrossRef] [PubMed]
- Ge, Y.-J.; Xu, W.; Ou, Y.-N.; Qu, Y.; Ma, Y.-H.; Huang, Y.-Y.; Shen, X.-N.; Chen, S.-D.; Tan, L.; Zhao, Q.-H.; et al. Retinal biomarkers in Alzheimer’s disease and mild cognitive impairment: A systematic review and meta-analysis. Ageing Res. Rev. 2021, 69, 101361. [Google Scholar] [CrossRef] [PubMed]
- Chan, V.T.T.; Sun, Z.; Tang, S.; Chen, L.J.; Wong, A.; Tham, C.C.; Wong, T.Y.; Chen, C.; Ikram, M.K.; Whitson, H.E.; et al. Spectral-Domain OCT Measurements in Alzheimer’s Disease: A Systematic Review and Meta-analysis. Ophthalmology 2019, 126, 497–510. [Google Scholar] [CrossRef] [PubMed]
- Ito, Y.; Sasaki, M.; Takahashi, H.; Nozaki, S.; Matsuguma, S.; Motomura, K.; Ui, R.; Shikimoto, R.; Kawasaki, R.; Yuki, K.; et al. Quantitative Assessment of the Retina Using OCT and Associations with Cognitive Function. Ophthalmology 2020, 127, 107–118. [Google Scholar] [CrossRef]
- Wang, X.; Jiao, B.; Liu, H.; Wang, Y.; Hao, X.; Zhu, Y.; Xu, B.; Xu, H.; Zhang, S.; Jia, X.; et al. Machine learning based on Optical Coherence Tomography images as a diagnostic tool for Alzheimer’s disease. CNS Neurosci. Ther. 2022, 28, 2206–2217. [Google Scholar] [CrossRef]
- Nepal, G.; Kharel, S.; Coghlan, M.A.; Yadav, J.K.; Parajuli, P.; Pandit, K.; Shing, Y.K.; Ojha, R. Amyotrophic lateral sclerosis and retinal changes in optical coherence tomography: A systematic review and meta-analysis. Brain Behav. 2022, 12, e2741. [Google Scholar] [CrossRef]
- Komatsu, H.; Onoguchi, G.; Jerotic, S.; Kanahara, N.; Kakuto, Y.; Ono, T.; Funakoshi, S.; Yabana, T.; Nakazawa, T.; Tomita, H. Retinal layers and associated clinical factors in schizophrenia spectrum disorders: A systematic review and meta-analysis. Mol. Psychiatry 2022, 27, 3592–3616. [Google Scholar] [CrossRef]
- Montolío, A.; Cegoñino, J.; Garcia-Martin, E.; Pérez del Palomar, A. Comparison of Machine Learning Methods Using Spectralis OCT for Diagnosis and Disability Progression Prognosis in Multiple Sclerosis. Ann. Biomed. Eng. 2022, 50, 507–528. [Google Scholar] [CrossRef]
- Klafki, H.-W.; Staufenbiel, M.; Kornhuber, J.; Wiltfang, J. Therapeutic approaches to Alzheimer’s disease. Brain 2006, 129, 2840–2855. [Google Scholar] [CrossRef]
- Schroeter, M.L.; Stein, T.; Maslowski, N.; Neumann, J. Neural correlates of Alzheimer’s disease and mild cognitive impairment: A systematic and quantitative meta-analysis involving 1351 patients. Neuroimage 2009, 47, 1196–1206. [Google Scholar] [CrossRef]
- Chylack, L.T. The Lens Opacities Classification System III. Arch. Ophthalmol. 1993, 111, 831. [Google Scholar] [CrossRef]
- Asrani, S.; Rosdahl, J.A.; Allingham, R.R. Novel software strategy for glaucoma diagnosis: Asymmetry analysis of retinal thickness. Arch. Ophthalmol. 2011, 129, 1205–1211. [Google Scholar] [CrossRef] [PubMed]
- McCann, P.; Hogg, R.E.; Wright, D.M.; McGuinness, B.; Young, I.S.; Kee, F.; Azuara-Blanco, A. Diagnostic Accuracy of Spectral-Domain OCT Circumpapillary, Optic Nerve Head, and Macular Parameters in the Detection of Perimetric Glaucoma. Ophthalmol. Glaucoma 2019, 2, 336–345. [Google Scholar] [CrossRef] [PubMed]
- Huang, D.; Swanson, E.; Lin, C.; Schuman, J.; Stinson, W.; Chang, W.; Hee, M.R.; Flotte, T.; Gregory, K.; Puliafito, C.A.; et al. Optical coherence tomography. Science 1991, 254, 1178–1181. [Google Scholar] [CrossRef]
- de Boer, J.F.; Cense, B.; Park, B.H.; Pierce, M.C.; Tearney, G.J.; Bouma, B.E. Improved signal-to-noise ratio in spectral-domain compared with time-domain optical coherence tomography. Opt. Lett. 2003, 28, 2067–2069. [Google Scholar] [CrossRef]
- Everett, M.; Magazzeni, S.; Schmoll, T.; Kempe, M. Optical coherence tomography: From technology to applications in ophthalmology. Transl. Biophotonics 2021, 3, e202000012. [Google Scholar] [CrossRef]
- Un, Y.; Alpaslan, F.; Dikmen, N.T.; Sonmez, M. Posterior pole analysis and ganglion cell layer measurements in Alzheimer’s disease. Hosp. Pract. 2022, 50, 282–288. [Google Scholar] [CrossRef]
- Petzold, A.; Albrecht, P.; Balcer, L.; Bekkers, E.; Brandt, A.U.; Calabresi, P.A.; Deborah, O.G.; Graves, J.S.; Green, A.; Keane, P.A.; et al. Artificial intelligence extension of the OSCAR-IB criteria. Ann. Clin. Transl. Neurol. 2021, 8, 1528–1542. [Google Scholar] [CrossRef]
- Bamber, D. The area above the ordinal dominance graph and the area below the receiver operating characteristic graph. J. Math. Psychol. 1975, 12, 387–415. [Google Scholar] [CrossRef]
- López-Dorado, A.; Ortiz, M.; Satue, M.; Rodrigo, M.J.; Barea, R.; Sánchez-Morla, E.M.; Cavaliere, C.; Rodríguez-Ascariz, J.M.; Orduna-Hospital, E.; Boquete, L.; et al. Early Diagnosis of Multiple Sclerosis Using Swept-Source Optical Coherence Tomography and Convolutional Neural Networks Trained with Data Augmentation. Sensors 2021, 22, 167. [Google Scholar] [CrossRef] [PubMed]
- Martinez-Lapiscina, E.H.; Arnow, S.; Wilson, J.A.; Saidha, S.; Preiningerova, J.L.; Oberwahrenbrock, T.; Brandt, A.U.; Pablo, L.E.; Guerrieri, S.; Gonzalez, I.; et al. Retinal thickness measured with optical coherence tomography and risk of disability worsening in multiple sclerosis: A cohort study. Lancet Neurol. 2016, 15, 574–584. [Google Scholar] [CrossRef] [PubMed]
- McIlwaine, G.; Csincsik, L.; Coey, R.; Wang, L.; Fitzgerald, D.; Moffat, J.; Dubis, A.M.; McDonnell, G.; Hughes, S.; Peto, T.; et al. Reduced Cone Density Is Associated with Multiple Sclerosis. Ophthalmol. Sci. 2023, 3, 100308. [Google Scholar] [CrossRef] [PubMed]
- Shao, Y.; Jiang, H.; Wei, Y.; Shi, Y.; Shi, C.; Wright, C.B.; Sun, X.; Vanner, E.A.; Rodriguez, A.D.; Lam, B.L.; et al. Visualization of Focal Thinning of the Ganglion Cell–Inner Plexiform Layer in Patients with Mild Cognitive Impairment and Alzheimer’s Disease. J. Alzheimer’s Dis. 2018, 64, 1261–1273. [Google Scholar] [CrossRef] [PubMed]
- Salobrar-García, E.; de Hoz, R.; Ramírez, A.I.; López-Cuenca, I.; Rojas, P.; Vazirani, R.; Amarante, C.; Yubero, R.; Gil, P.; Pinazo-Durán, M.D.; et al. Changes in visual function and retinal structure in the progression of Alzheimer’s disease. PLoS ONE 2019, 14, e0220535. [Google Scholar] [CrossRef] [PubMed]
- Uchida, A.; Pillai, J.A.; Bermel, R.; Bonner-Jackson, A.; Rae-Grant, A.; Fernandez, H.; Bena, J.; Jones, S.E.; Leverenz, J.B.; Srivastava, S.K.; et al. Outer Retinal Assessment Using Spectral-Domain Optical Coherence Tomography in Patients with Alzheimer’s and Parkinson’s Disease. Investig. Opthalmol. Vis. Sci. 2018, 59, 2768. [Google Scholar] [CrossRef] [PubMed]
- Garcia-Martin, E.; Ara, J.R.; Martin, J.; Almarcegui, C.; Dolz, I.; Vilades, E.; Gil-Arribas, L.; Fernandez, F.J.; Polo, V.; Larrosa, J.M.; et al. Retinal and Optic Nerve Degeneration in Patients with Multiple Sclerosis Followed up for 5 Years. Ophthalmology 2017, 124, 688–696. [Google Scholar] [CrossRef]
- Vujosevic, S.; Parra, M.M.; Hartnett, M.E.; O’Toole, L.; Nuzzi, A.; Limoli, C.; Villani, E.; Nucci, P. Optical coherence tomography as retinal imaging biomarker of neuroinflammation/neurodegeneration in systemic disorders in adults and children. Eye 2023, 37, 203–219. [Google Scholar] [CrossRef]
- Saidha, S.; Syc, S.B.; Durbin, M.K.; Eckstein, C.; Oakley, J.D.; Meyer, S.A.; Conger, A.; Frohman, T.C.; Newsome, S.; Ratchford, J.N.; et al. Visual dysfunction in multiple sclerosis correlates better with optical coherence tomography derived estimates of macular ganglion cell layer thickness than peripapillary retinal nerve fiber layer thickness. Mult. Scler. J. 2011, 17, 1449–1463. [Google Scholar] [CrossRef]
- Saidha, S.; Sotirchos, E.S.; Oh, J.; Syc, S.B.; Seigo, M.A.; Shiee, N.; Eckstein, C.; Durbin, M.K.; Oakley, J.D.; Meyer, S.A.; et al. Relationships between Retinal Axonal and Neuronal Measures and Global Central Nervous System Pathology in Multiple Sclerosis. JAMA Neurol. 2013, 70, 34. [Google Scholar] [CrossRef]
- Fard, M.A.; Golizadeh, A.; Yadegari, S.; Ghahvehchian, H.; Subramanian, P.; Ritch, R. Photoreceptor outer nuclear layer thickness changes in optic neuritis follow up. Mult. Scler. Relat. Disord. 2020, 39, 101905. [Google Scholar] [CrossRef] [PubMed]
- Mueller, S.G.; Weiner, M.W.; Thal, L.J.; Petersen, R.C.; Jack, C.R.; Jagust, W.; Trojanowski, J.Q.; Toga, A.W.; Beckett, L. Ways toward an early diagnosis in Alzheimer’s disease: The Alzheimer’s Disease Neuroimaging Initiative (ADNI). Alzheimer’s Dement. 2005, 1, 55–66. [Google Scholar] [CrossRef] [PubMed]


| MS Patients (n = 33 Patients) | AD Patients (n = 21 Patients) | Healthy Controls (n = 19 Subjects) | p-Value | |
|---|---|---|---|---|
| Age (years) (mean (SD)) | 69.53 (6.81) | 69.73 (5.05) | 69.10 (9.25) | p = 0.917 |
| Male/female ratio | 3/30 | 9/12 | 9/12 | p = 0.165 |
| Visual acuity (Snellen) | 0.83 (0.12) | 0.79 (0.14) | 0.84 (0.15) | p = 0.333 |
| Spherical refractive error (dioptres) | −1.45 (0.21) | −1.24 (0.34) | −1.53 (0.19) | p = 0.122 |
| Axial length (mm) | 22.13 (2.43) | 22.54 (3.01) | 22.43 (2.09) | p = 0.448 |
| Disease duration since definitive diagnosis (years) (mean (SD)) | 1.35 (0.66) | 1.46 (0.93) | --- | --- |
| EDSS score (median (range)) | 1.31 (0–3.5) | --- | --- | --- |
| MMSE score (mean (SD)) | ---- | 19.21 (3.76) | ---- | |
| Treatment | Avonex: 8 Betaseron: 7 Rebif: 5 Glatiramer acetate: 2 Tecfidera: 1 Gilenya: 2 Mayzent: 1 Aubagio: 6 No treatment: 1 | --- | --- |
| Layers | Foveal Area | Parafoveal Area | Perifoveal Area | PMB | Paramacular | SN | IN | IT | ST |
|---|---|---|---|---|---|---|---|---|---|
| RNFL | 0.62 [0.51–0.77] | 0.68 [0.54–0.82] | 0.62 [0.51–0.75] | 0.62 [0.51–0.77] | 0.69 [0.56–0.82] | 0.5 [0.5–0.66] | 0.65 [0.52–0.8] | 0.6 [0.5–0.76] | 0.59 [0.51–0.72] |
| GCL | 0.89 [0.81–0.95] | 0.93 [0.87–0.97] | 0.91 [0.84–0.97] | 0.94 [0.89–0.99] | 0.93 [0.86–0.98] | 0.87 [0.78–0.94] | 0.83 [0.71–0.92] | 0.77 [0.65–0.88] | 0.78 [0.66–0.88] |
| IPL | 0.85 [0.76–0.93] | 0.91 [0.83–0.96] | 0.9 [0.81–0.96] | 0.92 [0.85–0.97] | 0.92 [0.84–0.97] | 0.78 [0.67–0.88] | 0.72 [0.59–0.84] | 0.68 [0.53–0.82] | 0.82 [0.7–0.92] |
| ONL | 0.73 [0.61–0.85] | 0.78 [0.64–0.89] | 0.77 [0.63–0.88] | 0.78 [0.64–0.89] | 0.77 [0.65–0.88] | 0.73 [0.58–0.86] | 0.67 [0.53–0.82] | 0.63 [0.51–0.78] | 0.72 [0.59–0.83] |
| Layers | Foveal Area | Parafoveal Area | Perifoveal Area | PMB | Paramacular | SN | IN | IT | ST |
|---|---|---|---|---|---|---|---|---|---|
| RNFL | 0.59 [0.51–0.76] | 0.67 [0.53–0.81] | 0.62 [0.51–0.76] | 0.61 [0.51–0.76] | 0.7 [0.55–0.83] | 0.52 [0.5–0.69] | 0.7 [0.56–0.83] | 0.6 [0.51–0.75] | 0.58 [0.5–0.74] |
| GCL | 0.93 [0.84–0.99] | 0.96 [0.9–1.0] | 0.93 [0.85–0.99] | 0.95 [0.88–1.0] | 0.96 [0.9–1.0] | 0.87 [0.78–0.96] | 0.84 [0.73–0.94] | 0.86 [0.75–0.95] | 0.81 [0.7–0.92] |
| IPL | 0.88 [0.77–0.96] | 0.94 [0.87–0.99] | 0.93 [0.85–0.99] | 0.94 [0.87–0.99] | 0.94 [0.88–0.99] | 0.75 [0.62–0.87] | 0.74 [0.61–0.87] | 0.75 [0.6–0.87] | 0.82 [0.7–0.93] |
| ONL | 0.83 [0.72–0.93] | 0.87 [0.76–0.95] | 0.87 [0.76–0.95] | 0.86 [0.74–0.95] | 0.88 [0.78–0.96] | 0.76 [0.61–0.88] | 0.76 [0.61–0.89] | 0.74 [0.57–0.88] | 0.79 [0.65–0.9] |
| Layers | Foveal Area | Parafoveal Area | Perifoveal Area | PMB | Paramacular | SN | IN | IT | ST |
|---|---|---|---|---|---|---|---|---|---|
| RNFL | 0.67 [0.52–0.83] | 0.69 [0.52–0.84] | 0.61 [0.51–0.79] | 0.65 [0.51–0.83] | 0.68 [0.52–0.84] | 0.52 [0.5–0.73] | 0.58 [0.51–0.76] | 0.6 [0.5–0.78] | 0.6 [0.51–0.76] |
| GCL | 0.84 [0.7–0.95] | 0.89 [0.77–0.97] | 0.88 [0.76–0.97] | 0.93 [0.86–0.99] | 0.89 [0.78–0.98] | 0.86 [0.73–0.96] | 0.81 [0.64–0.94] | 0.63 [0.51–0.8] | 0.72 [0.55–0.88] |
| IPL | 0.81 [0.68–0.94] | 0.85 [0.71–0.95] | 0.85 [0.71–0.96] | 0.88 [0.76–0.97] | 0.87 [0.75–0.96] | 0.83 [0.68–0.95] | 0.69 [0.52–0.86] | 0.57 [0.5–0.76] | 0.82 [0.67–0.93] |
| ONL | 0.57 [0.5–0.75] | 0.63 [0.51–0.8] | 0.61 [0.5–0.78] | 0.66 [0.51–0.81] | 0.61 [0.51–0.79] | 0.67 [0.51–0.83] | 0.52 [0.5–0.71] | 0.54 [0.5–0.73] | 0.61 [0.51–0.78] |
| Layers | Foveal Area | Parafoveal Area | Perifoveal Area | PMB | Paramacular | SN | IN | IT | ST |
|---|---|---|---|---|---|---|---|---|---|
| RNFL | 0.59 [0.51–0.74] | 0.53 [0.5–0.68] | 0.55 [0.5–0.7] | 0.5 [0.5–0.67] | 0.59 [0.5–0.74] | 0.55 [0.5–0.7] | 0.68 [0.54–0.82] | 0.56 [0.5–0.7] | 0.52 [0.5–0.68] |
| GCL | 0.64 [0.51–0.77] | 0.74 [0.6–0.86] | 0.75 [0.61–0.87] | 0.69 [0.54–0.83] | 0.75 [0.61–0.88] | 0.6 [0.5–0.74] | 0.66 [0.52–0.79] | 0.8 [0.67–0.9] | 0.67 [0.52–0.81] |
| IPL | 0.61 [0.5–0.76] | 0.69 [0.54–0.83] | 0.71 [0.57–0.84] | 0.64 [0.52–0.78] | 0.69 [0.54–0.83] | 0.52 [0.5–0.68] | 0.6 [0.51–0.76] | 0.73 [0.58–0.86] | 0.59 [0.51–0.72] |
| ONL | 0.8 [0.67–0.92] | 0.85 [0.73–0.93] | 0.8 [0.69–0.91] | 0.77 [0.63–0.9] | 0.85 [0.74–0.95] | 0.63 [0.51–0.78] | 0.75 [0.6–0.88] | 0.83 [0.69–0.94] | 0.68 [0.53–0.83] |
Disclaimer/Publisher’s Note: The statements, opinions and data contained in all publications are solely those of the individual author(s) and contributor(s) and not of MDPI and/or the editor(s). MDPI and/or the editor(s) disclaim responsibility for any injury to people or property resulting from any ideas, methods, instructions or products referred to in the content. |
© 2023 by the authors. Licensee MDPI, Basel, Switzerland. This article is an open access article distributed under the terms and conditions of the Creative Commons Attribution (CC BY) license (https://creativecommons.org/licenses/by/4.0/).
Share and Cite
Garcia-Martin, E.; Jimeno-Huete, D.; Dongil-Moreno, F.J.; Boquete, L.; Sánchez-Morla, E.M.; Miguel-Jiménez, J.M.; López-Dorado, A.; Vilades, E.; Fuertes, M.I.; Pueyo, A.; et al. Differential Study of Retinal Thicknesses in the Eyes of Alzheimer’s Patients, Multiple Sclerosis Patients and Healthy Subjects. Biomedicines 2023, 11, 3126. https://doi.org/10.3390/biomedicines11123126
Garcia-Martin E, Jimeno-Huete D, Dongil-Moreno FJ, Boquete L, Sánchez-Morla EM, Miguel-Jiménez JM, López-Dorado A, Vilades E, Fuertes MI, Pueyo A, et al. Differential Study of Retinal Thicknesses in the Eyes of Alzheimer’s Patients, Multiple Sclerosis Patients and Healthy Subjects. Biomedicines. 2023; 11(12):3126. https://doi.org/10.3390/biomedicines11123126
Chicago/Turabian StyleGarcia-Martin, Elena, Daniel Jimeno-Huete, Francisco J. Dongil-Moreno, Luciano Boquete, Eva M. Sánchez-Morla, Juan M. Miguel-Jiménez, Almudena López-Dorado, Elisa Vilades, Maria I. Fuertes, Ana Pueyo, and et al. 2023. "Differential Study of Retinal Thicknesses in the Eyes of Alzheimer’s Patients, Multiple Sclerosis Patients and Healthy Subjects" Biomedicines 11, no. 12: 3126. https://doi.org/10.3390/biomedicines11123126