

The Evolvement of OCT and OCT-A in Identifying Multiple Sclerosis Biomarkers
 ,
,
Abstract
:1. Introduction
1.1. Background
1.2. Epidemiology
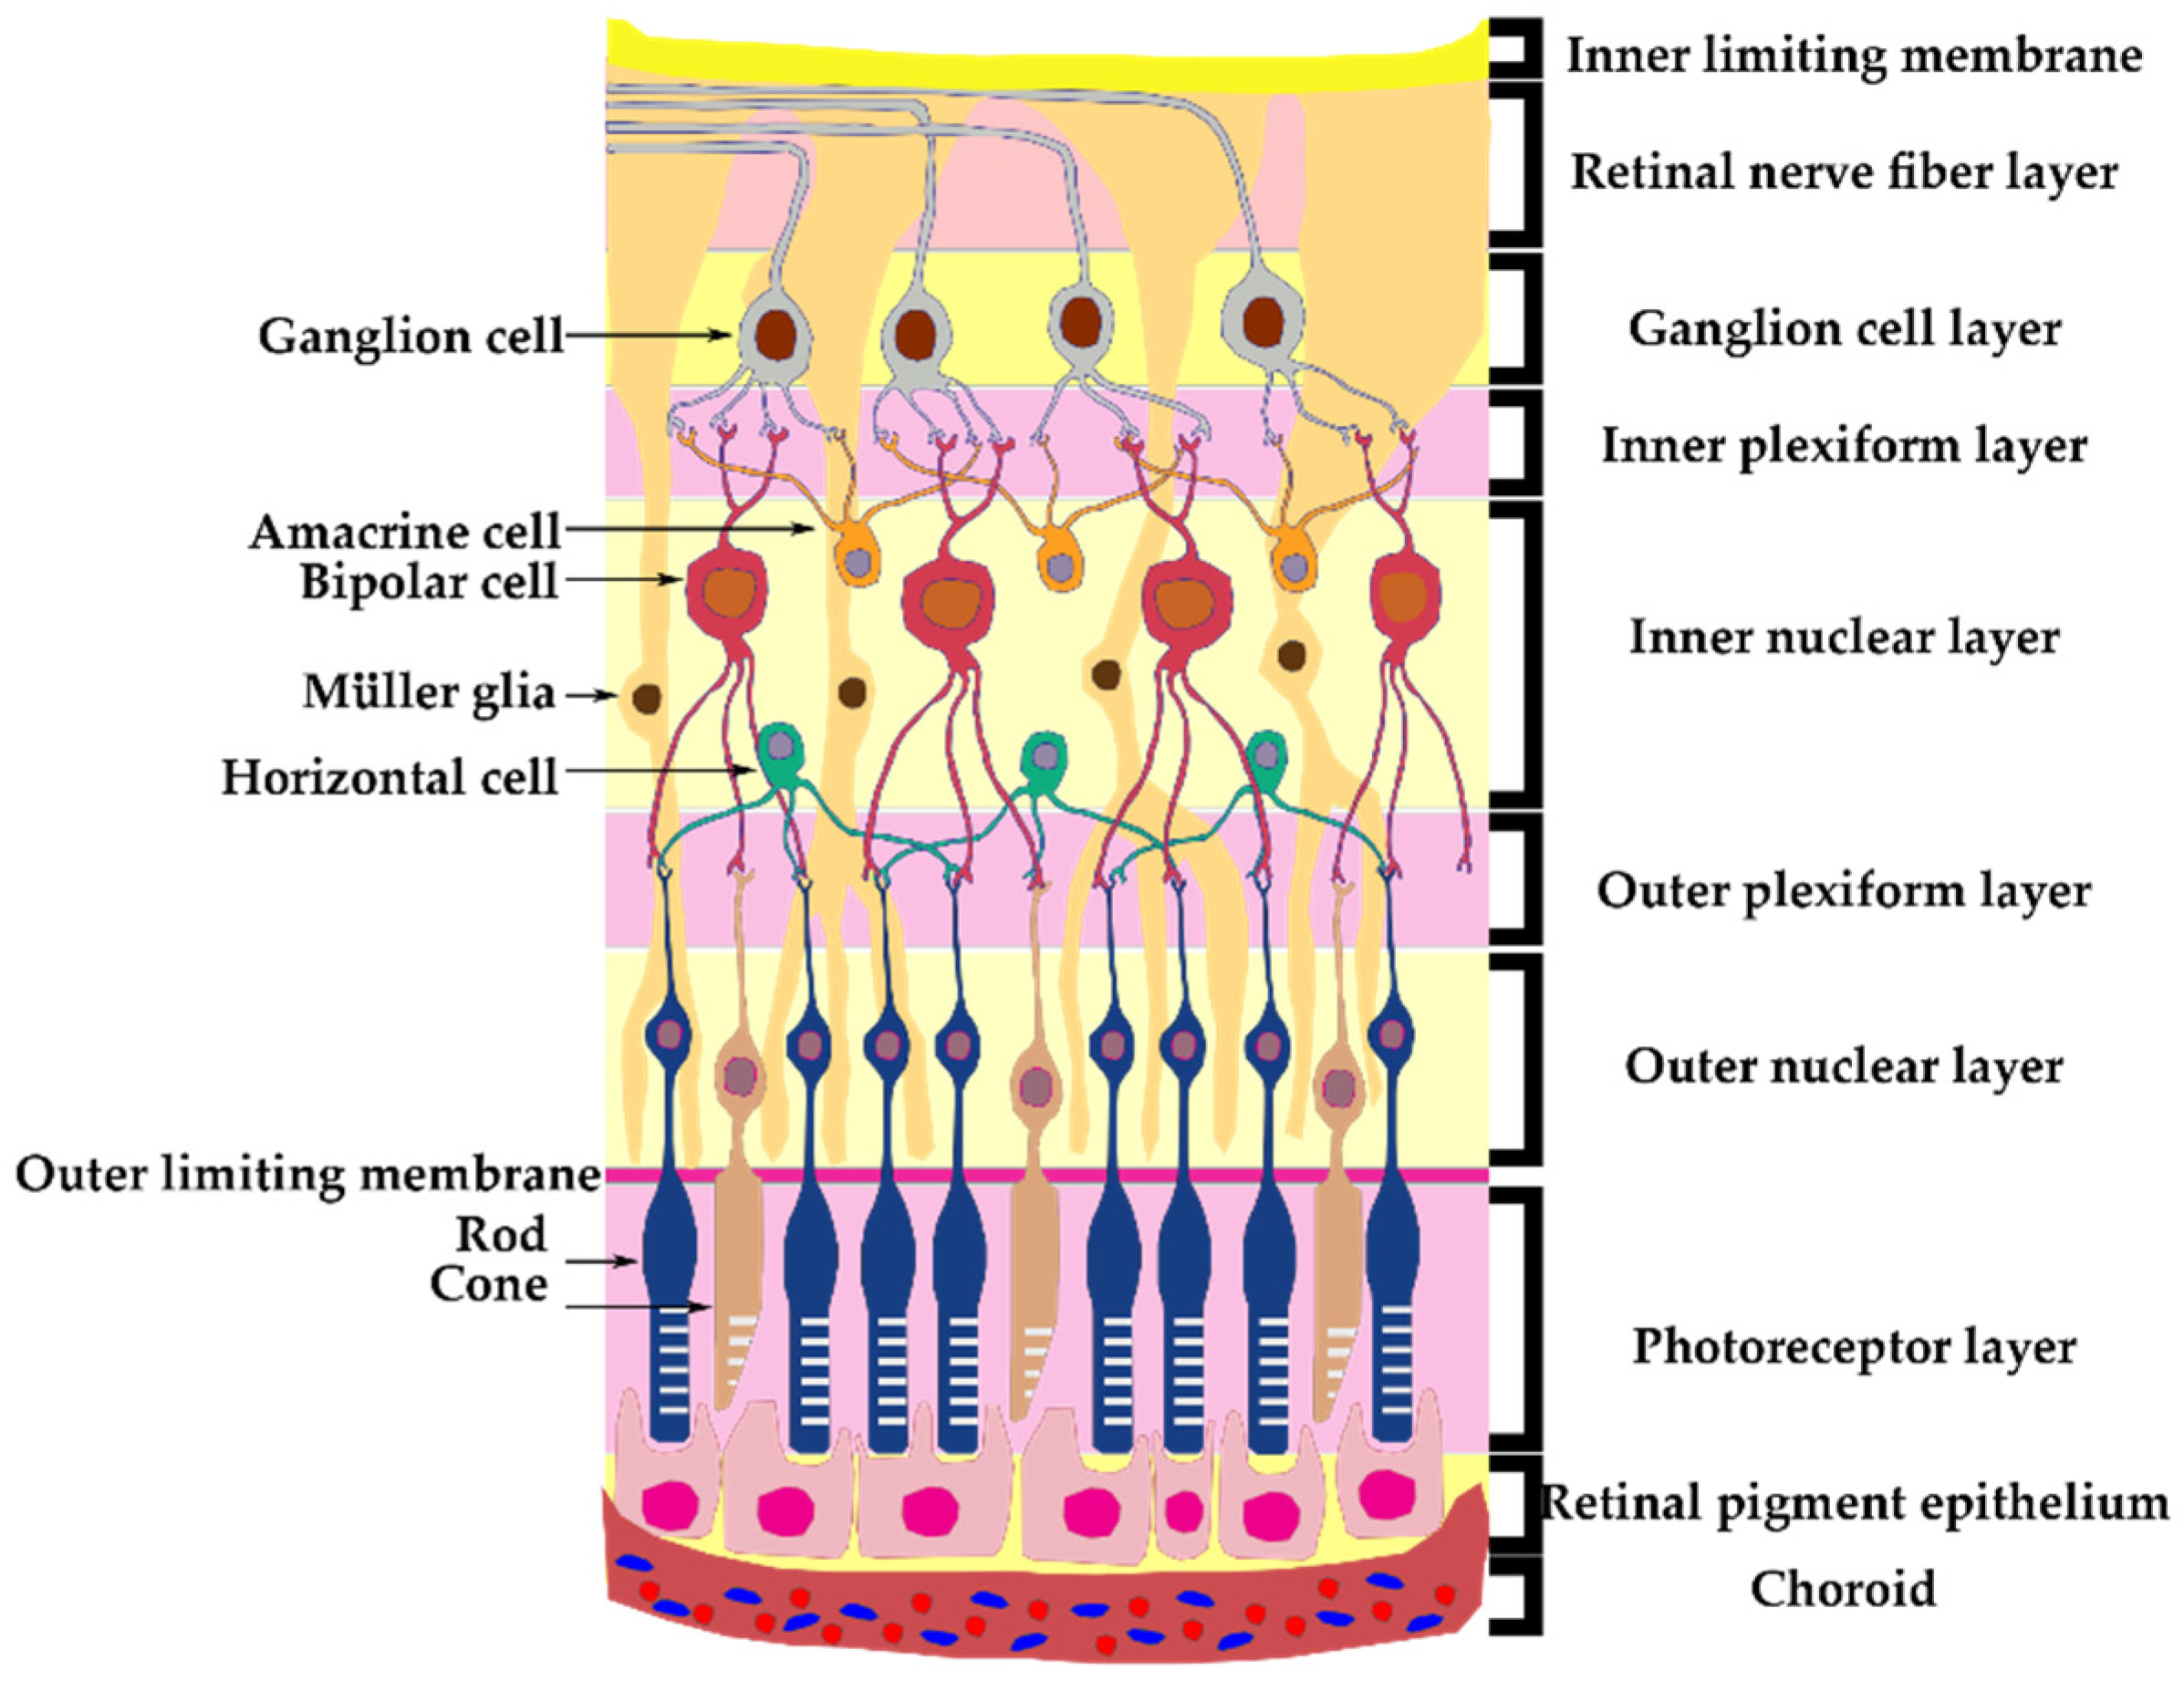
1.3. Anatomy
1.4. Pathophysiology
1.5. Optical Coherence Tomography
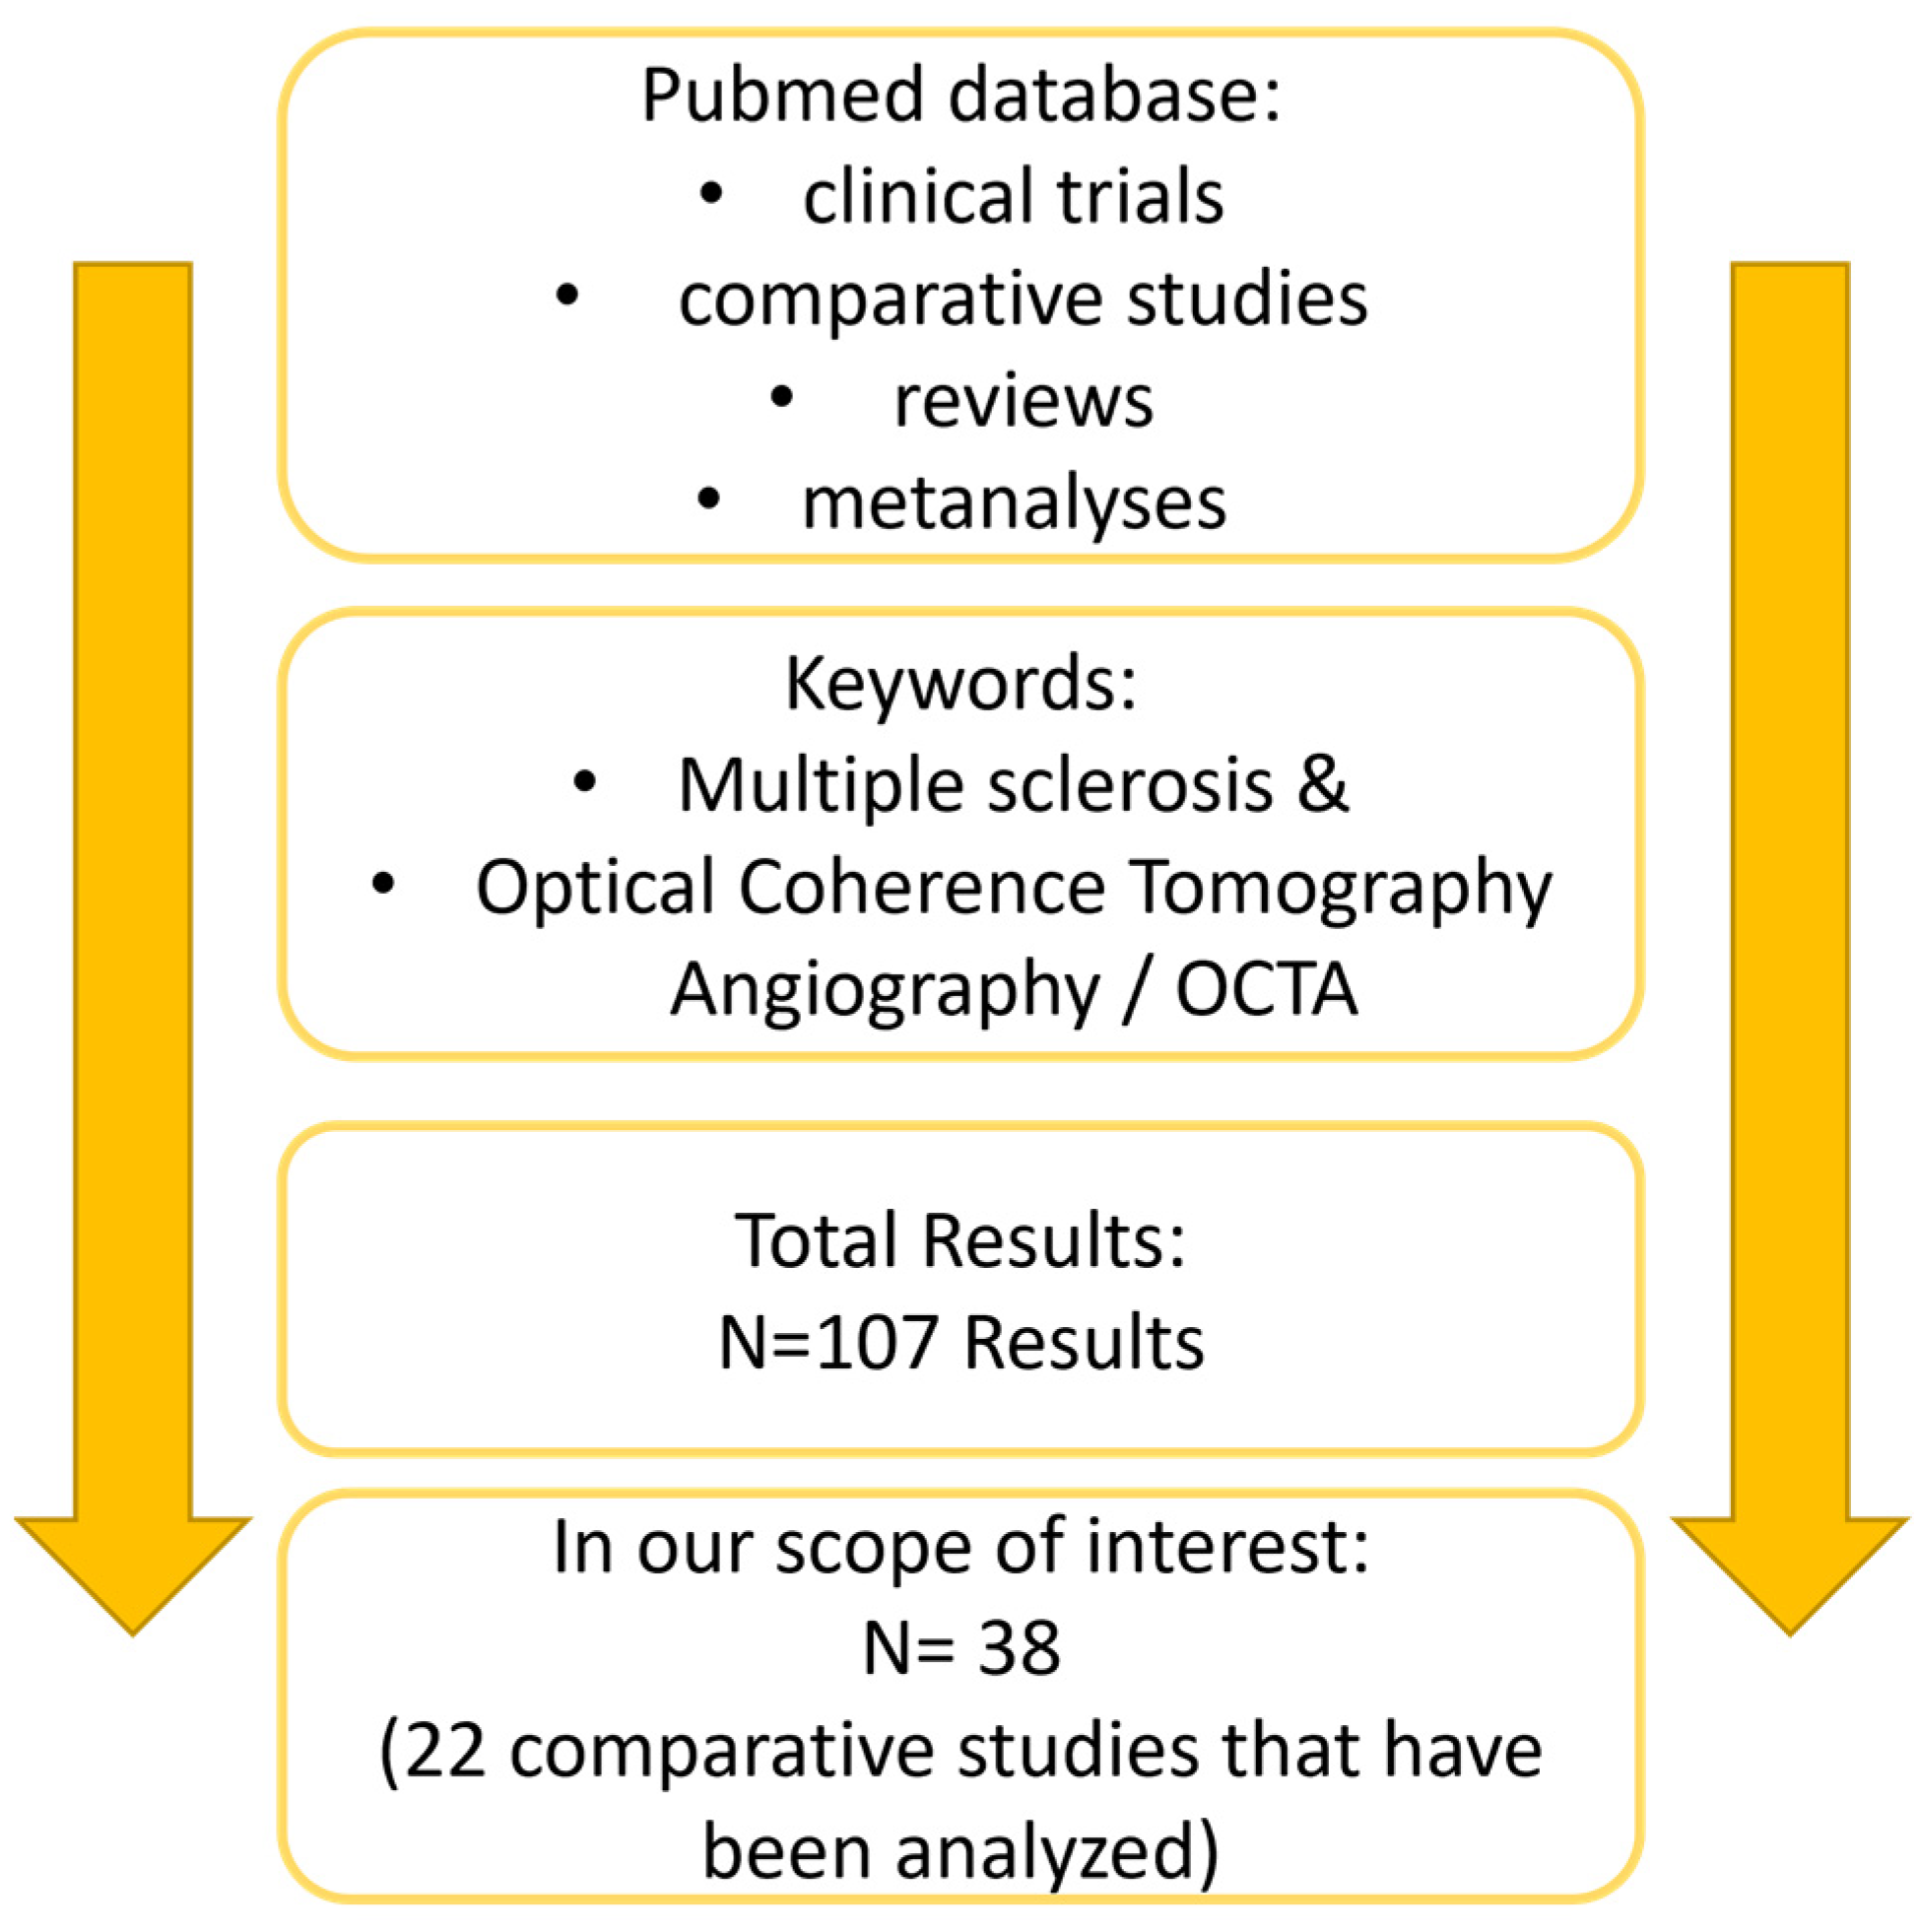
2. Materials and Methods
3. Optical Coherence Tomography Structural Parameters
3.1. Retinal Layers
3.2. Lamina Cribrosa
3.3. Vascular Changes
3.4. Choroidal Thickness
4. Optical Coherence Tomography Angiography Vascular Density Parameters

| Author and Year | Participants and Method | Analyzed Structures | Sub Groups | Study Limitations | Key Findings |
|---|---|---|---|---|---|
| Gao et al. [34] 2023 | 72 MS eyes vs. 74 healthy eyes | ORT CC VD CT CVI | MS ON vs. MS NON | Not longitudinal | MS NON patients had decreased CC VD and CVI. No difference in ORT and CT between them. In MS patients, no correlation between OCT-A parameters and EDSS score were found. |
| Montorio et al. [33] 2022 | 33 MS eyes vs. 35 healthy eyes | FAZ area SVP VD DVP VD | - | Small lot size No subgroups Not longitudinal | Decreased SVP VD in periphery where RNFL and GCIPL are normally decreased. FAZ area increased in MS patients. No significant DVP VD differences |
| Khader et al. [35] 2021 | 10 MS ON eyes vs. 10 MS NON eyes vs. 10 healthy eyes | RNFL GCC ONH VD | MS ON vs. MS NON | Small lot size Not longitudinal | Decrease of VD around ONH, in SVP, DVP, more significant in ON patients. Lower pRNFL and GCC thickness corelates with decreased VD surrounding the ONH. |
| Balikci et al. [36] 2021 | 164 MS eyes vs. 114 healthy eyes | FAZ area SVP VD DVP VD RNFL GCL | MS ON vs. MS NON | Not longitudinal | No significant difference regarding VD. No significant difference for structural parameters for MS groups. Correlation between structural OCT parameters and OCT-A vascular modification. |
| Jesus et al. [37] 2021 | 45 MS eyes vs. 45 healthy eyes | Choroidal VD CC VD | MS ON vs. MS NON | Not longitudinal No correlation with other parameters Manual method | Decrease in VD in both Choroid and Choriocapillaris layers 500 to 1500 µm from the fovea. |
| Murphy et al. [38] 2020 | Cross-sectional 43 MS ON patients with 92 visits vs. 14 MS NON patients with 24 visits | IED between: RNFL GCC VD in SVP | MS ON >3 m. vs. MS ON 3–12 m vs. MS ON 1–3 y vs. MS ON >3 year vs. MS NON | - | Significant IED difference in VD of SVP in MS ON vs. MS NON. Loss of VD in SVP is better correlated with visual function than GCIPL loss. IED post ON in GCIPL appear up to 3 months after the ON episode. IED post ON in VD in SVP appear at 1 year after the ON episode. |
| Cordon et al. [39] 2020 | 92 MS eyes vs. 149 healthy eyes | VD in SVP | MS ON vs. MS NON MS < 5 years vs. MS > 5 years | Not longitudinal | Decreased SVP in MS patients especially in patients with disease activity > 5 years. |
| Jiang et al. [40] 2020 | 123 MSNON eyes vs. 36 MSON eyes vs. 198 healthy eyes | VVD SVP VD in SVP, VVD DVP VD in DVP whole retina plexus. Retinal tissue volume. RNFL GCL INL OPL | MSON vs. MSNON | The VD is calculated after removing the large vessels from the analysis, making the VD values unable to be compared with others from different studies of the same type Not longitudinal | VVD is significantly increased in MS NON compared to healthy patients in the deep and whole retinal vascular plexus. VVD in MS ON is significantly increased compared to MS NON and healthy patients. VD from the SVP and whole retina plexus in MS NON are increased compared to healthy eyes. Retinal tissue volume, RNFL and GCL are decreased in MSON and MSNON compared to healthy eyes. INL and OPL thickness is decreased in MS ON compared to healthy eyes. VVD has a better correlation with visual function and disease duration than VD. The correlation between VVD and structural parameters offer the capacity to distinguish between MS-ON, MS-NON and control groups with a higher specificity than without the vascular parameters. |
| Cennamo et al. [41] 2020 | 40 IDE eye vs. 20 MS eyes vs. 30 healthy eyes | RNFL GCL VF SVP VD DVP VD CCP VD ONH VD | IED vs. MS | Not longitudinal Small lot size | No correlation between OCT-A parameters and neurological symptoms or visual field modifications. GCL modifications correlate with VD in the SVP and around the ONH. RNFL modifications correlate with VD surrounding the ONH. VD in patients with an IDE was significantly lower when compared with MS or healthy eyes. VD in the SVP and surrounding the ONH was lower in MS eyes compared to the healthy ones. VD surrounding the ONH was lower in MS eyes compared with those with IDE. DVP and CC showed no significant modifications between the groups. |
| Farci et al. [32] 2020 | 94 MS eyes vs. 37 healthy eyes | SVP VD DVP VD CC VD ONH VD GCIPL RNFL | MS ON vs. MS NON | VD around ONH only in MS, not in healthy eyes Not longitudinal | Increased VD in DVP, CC in MS patients regardless of ON history. Decreased VD in SVP in MS ON vs. MS NON. No correlation between GCIPL and VD. |
| Ulusoy et al. [42] 2020 | 40 MS eyes vs. 48 healthy eyes | RNFL SVP VD DVP VD ONH VD | MSON vs. MSNON | Not longitudinal Small lot size | SVP VD was lower in MS vs. healthy eyes especially in ON eyes. DVP VD showed no significant differences between groups. ONH VD was significantly lower in the inferior and temporal quadrants in MS compared with healthy eyes, especially in MSON. In SVP and DVP, there was no significant difference between ON and NON eyes. Positive correlation between OCT-A parameters and disease length. |
| Yilmaz et al. [43] 2020 | 94 MS eyes vs. 122 healthy eyes | FAZ area SVP VD DVP VD MT FT ONH VD | MSON vs. MSNON | Not longitudinal | No differences in FAZ area between groups. Inverse correlation between VD and FAZ. Positive correlation between SVP, RNFL and MT. Positive correlation between DVP and FT |
| Murphy et al. [44] 2019 | Cross-sectional 201 MS eyes vs. 97 healthy eyes | RNFL GCL SVP VD DVP VD | MS ON vs. MS NON | Advanced disease patients were not included Not longitudinal | VD is decreased in MS patients regardless of ON status. In MS patients, DVP decrease was correlated with ONL thickness. SVP VD decrease was higher in MSON vs. MSNON. SVP decrease was correlated with RNFL and GCIPL. SVP decrease was more significant in patients with longer disease activity. |
| Feucht et al. [45] 2018 | 83 MS/CIS eyes vs. 100 healthy eyes | SVP VD DVP VD CC VD pRNFL GCL macular volume INL + OPL thickness | MS vs. CIS ON vs. NON | Not longitudinal | VD in SVP and DVP decreased in ON, ON, NON and healthy eyes showing comparable values. pRNFL, GCL, MT macular thickness were lower in ON vs. NON. No IED regarding OCT-A parameters. In MS eyes in both ON and NON, OCT-A values are correlated with OCT structural parameters. ON occurrence does not correlate with CC VD modifications. High values of CC VD in MS patients were correlated with previous relapse occurrence. |
| Spain et al. [46] 2017 | 68 MS eyes vs. 55 healthy eyes | ONHFI RNFL GCL | MSON vs. MSNON | Not longitudinal | No correlation between ONHFI and OCT structural parameters. When combining ONHFI and OCT structural parameters, nerve damage is diagnosed more accurately. |
| Lanzillo et al. [47] 2017 | 100 MS eyes vs. 92 healthy eyes | Macular VD RNFL GCL | MSON vs. MSNON | Not longitudinal | The correlation between VD and OCT parameters was statistically significant except for the foveal area. VD from MS eyes was significantly lower compared to healthy eyes. Inverse correlation between OCT parameters and disease severity. No correlation was found between VF and OCT angiography values. |
| Bhaduri et al. [48] 2016 | 105 MS eyes vs. 24 healthy eyes | RNFL ONH VD | MSON vs. MSNON | Not longitudinal Patients were analyzed by disease severity, not disease activity. | Decrease in VD surrounding the ONH is significantly correlated with disease severity. Propose that the central vascular modifications are secondary to peripheral phlebitis-related modifications. |
| Wang et al. [49] 2014 | 52 MS eyes vs. 21 healthy eyes | ONHFI perifoveolar FI | MSON vs. MSNON | Small lot size Not longitudinal | ONHFI is decreased in MS eyes compared to healthy control group, especially MSON eyes. Perifoveolar FI shows no significant differences between the analyzed groups |
4.1. Optic Nerve Head Perfusion
4.2. Macular Area Perfusion
4.3. Superficial Vascular Plexus Vascular Density
4.4. Deep Vascular Plexus Vessel Density
4.5. Volumetric Vascular Density
4.6. Choroidal and Choriocapillaris Vascular Density
5. Inter-Eye Differences
6. Foveal Avascular Zone
7. Differential Diagnosis
7.1. Multiple Sclerosis and Neuromyelitis Optica Spectrum Disorder
7.2. Multiple Sclerosis and Myelin Oligodendrocyte Glycoprotein Antibody-Associated Disease
8. Visual Evoked Potentials
9. OCT and Treatment Efficiency
10. Discussion
Author Contributions
Funding
Institutional Review Board Statement
Informed Consent Statement
Data Availability Statement
Conflicts of Interest
References
- Dobson, R.; Giovannoni, G. Multiple sclerosis—A review. Eur. J. Neurol. 2018, 26, 27–40. [Google Scholar] [CrossRef]
- Hittle, M.; Culpepper, W.J.; Langer-Gould, A.; Marrie, R.A.; Cutter, G.R.; Kaye, W.E.; Wagner, L.; Topol, B.; LaRocca, N.G.; Nelson, L.M.; et al. Population-Based Estimates for the Prevalence of Multiple Sclerosis in the United States by Race, Ethnicity, Age, Sex, and Geographic Region. JAMA Neurol. 2023, 80, 693. [Google Scholar] [CrossRef]
- Langer-Gould, A.M.; Gonzales, E.G.; Smith, J.B.; Li, B.H.; Nelson, L.M. Racial and Ethnic Disparities in Multiple Sclerosis Prevalence. Neurology 2022, 98, e1818–e1827. [Google Scholar] [CrossRef]
- Bennett, J.L. Optic Neuritis. CONTINUUM Lifelong Learn. Neurol. 2019, 25, 1236–1264. [Google Scholar] [CrossRef] [PubMed]
- Kale, N. Optic neuritis as an early sign of multiple sclerosis. Eye Brain 2016, 8, 195–202. [Google Scholar] [CrossRef]
- Britze, J.; Frederiksen, J.L. Optical coherence tomography in multiple sclerosis. Eye 2018, 32, 884–888. [Google Scholar] [CrossRef]
- Picard, E.; Daruich, A.; Youale, J.; Courtois, Y.; Behar-Cohen, F. From Rust to Quantum Biology: The Role of Iron in Retina Physiopathology. Cells 2020, 9, 705. [Google Scholar] [CrossRef] [PubMed]
- Zhang, J.; Zhang, T.; Zeng, S.; Zhang, X.; Zhou, F.; Gillies, M.C.; Zhu, L. The Role of Nrf2/sMAF Signalling in Retina Ageing and Retinal Diseases. Biomedicines 2023, 11, 1512. [Google Scholar] [CrossRef] [PubMed]
- Puthenparampil, M.; Federle, L.; Poggiali, D.; Miante, S.; Signori, A.; Pilotto, E.; Rinaldi, F.; Perini, P.; Sormani, M.P.; Midena, E.; et al. Trans-synaptic degeneration in the optic pathway. A study in clinically isolated syndrome and early relapsing-remitting multiple sclerosis with or without optic neuritis. PLoS ONE 2017, 12, e0183957. [Google Scholar] [CrossRef]
- Ciapă, M.A.; Șalaru, D.L.; Stătescu, C.; Sascău, R.A.; Bogdănici, C.M. Optic Neuritis in Multiple Sclerosis—A Review of Molecular Mechanisms Involved in the Degenerative Process. Curr. Issues Mol. Biol. 2022, 44, 3959–3979. [Google Scholar] [CrossRef] [PubMed]
- Petzold, A.; Balcer, L.J.; Calabresi, P.A.; Costello, F.; Frohman, T.C.; Frohman, E.M.; Martinez-Lapiscina, E.H.; Green, A.J.; Kardon, R.; Outteryck, O.; et al. Retinal layer segmentation in multiple sclerosis: A systematic review and meta-analysis. Lancet Neurol. 2017, 16, 797–812. [Google Scholar] [CrossRef] [PubMed]
- Petzold, A.; de Boer, J.F.; Schippling, S.; Vermersch, P.; Kardon, R.; Green, A.; Calabresi, P.A.; Polman, C. Optical coherence tomography in multiple sclerosis: A systematic review and meta-analysis. Lancet Neurol. 2010, 9, 921–932. [Google Scholar] [CrossRef] [PubMed]
- Saidha, S.; Al-Louzi, O.; Ratchford, J.N.; Bhargava, P.; Oh, J.; Newsome, S.D.; Prince, J.L.; Pham, D.; Roy, S.; van Zijl, P.; et al. Optical coherence tomography reflects brain atrophy in multiple sclerosis: A four-year study. Ann. Neurol. 2015, 78, 801–813. [Google Scholar] [CrossRef] [PubMed]
- Cellerino, M.; Cordano, C.; Boffa, G.; Bommarito, G.; Petracca, M.; Sbragia, E.; Novi, G.; Lapucci, C.; Capello, E.; Uccelli, A.; et al. Relationship between retinal inner nuclear layer, age, and disease activity in progressive MS. Neurol.-Neuroimmunol. Neuroinflamm. 2019, 6, e596. [Google Scholar] [CrossRef] [PubMed]
- Paul, F.; Calabresi, P.A.; Barkhof, F.; Green, A.J.; Kardon, R.; Sastre-Garriga, J.; Schippling, S.; Vermersch, P.; Saidha, S.; Gerendas, B.S.; et al. Optical coherence tomography in multiple sclerosis: A 3-year prospective multicenter study. Ann. Clin. Transl. Neurol. 2021, 8, 2235–2251. [Google Scholar] [CrossRef]
- Cilingir, V.; Batur, M. Axonal Degeneration Independent of Inflammatory Activity: Is It More Intense in the Early Stages of Relapsing-Remitting Multiple Sclerosis Disease? Eur. Neurol. 2020, 83, 508–516. [Google Scholar] [CrossRef]
- Cujba, L.; Stan, C.; Samoila, O.; Drugan, T.; Cutas, A.B.; Nicula, C. Identifying Optical Coherence Tomography Markers for Multiple Sclerosis Diagnosis and Management. Diagnostics 2023, 13, 2077. [Google Scholar] [CrossRef]
- Frau, J.; Fenu, G.; Signori, A.; Coghe, G.; Lorefice, L.; Barracciu, M.A.; Sechi, V.; Cabras, F.; Badas, M.; Marrosu, M.G.; et al. A cross-sectional and longitudinal study evaluating brain volumes, RNFL, and cognitive functions in MS patients and healthy controls. BMC Neurol. 2018, 18, 67. [Google Scholar] [CrossRef]
- Ersöz, M.G.; Mart, D.K.; Hazar, L.; Ayıntap, E.; Güneş, İ.B.; Konya, H.Ö. Evaluation of Prelaminar Region and Lamina Cribrosa with Enhanced Depth Imaging Optical Coherence Tomography in Pseudoexfoliation Glaucoma. Türk Oftalmol. Derg. 2018, 48, 109–114. [Google Scholar] [CrossRef]
- Hamamcı, M.; Küçük, B.; Bayhan, S.; Bayhan, H.; İnan, L. Can Lamina Cribrosa Indicate Optic Neuritis in Multiple Sclerosis? Neurol. India 2022, 70, 2366. [Google Scholar] [CrossRef]
- Lightman, S.; McDonald, W.I.; Bird, A.C.; Francis, D.A.; Hoskins, A.; Batcholer, J.R.; Halliday, A.M. Retinal Venous Sheating in Optic Neuritis. Brain 1987, 110, 405–414. [Google Scholar] [CrossRef]
- Caprio, M.G.; Russo, C. Vascular Disease in Patients with Multiple Sclerosis: A Review. J. Vasc. Med. 2016, 4, 2. [Google Scholar]
- D’haeseleer, M.; Beelen, R.; Fierens, Y.; Cambron, M.; Vanbinst, A.-M.; Verborgh, C.; Demey, J.; Keyser, J.D. Cerebral hypoperfusion in multiple sclerosis is reversible and mediated by endothelin-1. Proc. Natl. Acad. Sci. USA 2013, 110, 5654–5658. [Google Scholar] [CrossRef] [PubMed]
- Castellazzi, M.; Lamberti, G.; Resi, M.V.; Baldi, E.; Caniatti, L.M.; Galante, G.; Perri, P.; Pugliatti, M. Increased Levels of Endothelin-1 in Cerebrospinal Fluid Are a Marker of Poor Visual Recovery after Optic Neuritis in Multiple Sclerosis Patients. Dis. Markers 2019, 2019, 9320791. [Google Scholar] [CrossRef] [PubMed]
- Minagar, A.; Jy, W.; Jimenez, J.J.; Alexander, J.S. Multiple sclerosis as a vascular disease. Neurol. Res. 2006, 28, 230–235. [Google Scholar] [CrossRef]
- Doğan, Ü.; Ulaş, F.; Türkoğlu, Ş.A.; Ögün, M.N.; Ağca, S. Eyes are mirror of the brain: Comparison of multiple sclerosis patients and healthy controls using OCT. Int. J. Neurosci. 2019, 129, 848–855. [Google Scholar] [CrossRef]
- Esen, E.; Sizmaz, S.; Demir, T.; Demirkiran, M.; Unal, I.; Demircan, N. Evaluation of Choroidal Vascular Changes in Patients with Multiple Sclerosis Using Enhanced Depth Imaging Optical Coherence Tomography. Ophthalmologica 2015, 235, 65–71. [Google Scholar] [CrossRef] [PubMed]
- Masala, A.; Mola, I.D.; Cellerino, M.; Pera, V.; Vagge, A.; Uccelli, A.; Christian, C.; Traverso, C.E.; Iester, M. Choroidal Thickness in Multiple Sclerosis: An Optical Coherence Tomography Study. J. Clin. Neurol. 2022, 18, 334. [Google Scholar] [CrossRef]
- Garcia-Martin, E.; Jarauta, L.; Pablo, L.E.; Bambo, M.P.; Ara, J.R.; Martin, J.; Polo, V.; Larrosa, J.M.; Vilades, E.; Ramirez, T.; et al. Changes in peripapillary choroidal thickness in patients with multiple sclerosis. Acta Ophthalmol. 2018, 97, e77–e83. [Google Scholar] [CrossRef] [PubMed]
- Bostan, M.; Pîrvulescu, R.; Tiu, C.; Bujor, I.; Popa-Cherecheanu, A. OCT and OCT-A biomarkers in multiple sclerosis-review. Rom J. Ophthalmol. 2023, 67, 107–110. [Google Scholar] [PubMed]
- Wang, L.; Murphy, O.; Caldito, N.G.; Calabresi, P.A.; Saidha, S. Emerging Applications of Optical Coherence Tomography Angiography (OCTA) in neurological research. Eye Vis. 2018, 5, 11. [Google Scholar] [CrossRef]
- Farci, R.; Carta, A.; Cocco, E.; Frau, J.; Fossarello, M.; Diaz, G. Optical coherence tomography angiography in multiple sclerosis: A cross-sectional study. PLoS ONE 2020, 15, e0236090. [Google Scholar] [CrossRef] [PubMed]
- Montorio, D.; Cennamo, G.; Carotenuto, A.; Petracca, M.; Morra, V.B.; Costagliola, C. Correlation analysis between foveal avascular zone and near peripheral retinal hypoperfusion in multiple sclerosis: A wide field optical coherence tomography angiography study. Front. Med. 2022, 9, 1032514. [Google Scholar] [CrossRef]
- Gao, Y.; Liu, Y.; Zhang, Y.; Lang, Y.; Xu, H.; Tao, Y.; Li, Y.; Mou, K.; Zhang, Y.; Man, S.; et al. Assessment of Outer Retina and Choroid Using Swept Source Optical Coherence Tomography and Angiography in Patients With Multiple Sclerosis. J. Neuro-Ophthalmol. 2023. [Google Scholar] [CrossRef]
- Nawar, A.; Khader, S.; Ghali, A.; Ghoneim, A. Evaluation of optical coherence tomography angiography findings in patients with multiple sclerosis. Indian J. Ophthalmol. 2021, 69, 1457. [Google Scholar] [CrossRef]
- Balıkçı, A.; Yener, N.P.; Seferoğlu, M. Optical Coherence Tomography and Optical Coherence Tomography Angiography Findings in Multiple Sclerosis Patients. Neuro-Ophthalmology 2021, 46, 19–33. [Google Scholar] [CrossRef] [PubMed]
- Jesus, J.; Soares, R.; Geraldes, R.; Matias, M.; Chibante, J. Analysis of choroidal vessel density in patients with multiple sclerosis. Biomark. Neuropsychiatry 2021, 5, 100040. [Google Scholar] [CrossRef]
- Murphy, O.C.; Kalaitzidis, G.; Vasileiou, E.; Filippatou, A.G.; Lambe, J.; Ehrhardt, H.; Pellegrini, N.; Sotirchos, E.S.; Luciano, N.J.; Liu, Y.; et al. Optical Coherence Tomography and Optical Coherence Tomography Angiography Findings After Optic Neuritis in Multiple Sclerosis. Front. Neurol. 2020, 11, 618879. [Google Scholar] [CrossRef] [PubMed]
- Cordon, B.; Vilades, E.; Orduna, E.; Satue, M.; Perez-Velilla, J.; Sebastian, B.; Polo, V.; Larrosa, J.M.; Pablo, L.E.; Garcia-Martin, E. Angiography with optical coherence tomography as a biomarker in multiple sclerosis. PLoS ONE 2020, 15, e0243236. [Google Scholar] [CrossRef]
- Jiang, H.; Gameiro, G.R.; Liu, Y.; Lin, Y.; Hernandez, J.; Deng, Y.; Gregori, G.; Delgado, S.; Wang, J. Visual Function and Disability Are Associated with Increased Retinal Volumetric Vessel Density in Patients with Multiple Sclerosis. Am. J. Ophthalmol. 2020, 213, 34–45. [Google Scholar] [CrossRef] [PubMed]
- Cennamo, G.; Carotenuto, A.; Montorio, D.; Petracca, M.; Moccia, M.; Melenzane, A.; Tranfa, F.; Lamberti, A.; Spiezia, A.L.; Servillo, G.; et al. Peripapillary Vessel Density as Early Biomarker in Multiple Sclerosis. Front. Neurol. 2020, 11, 542. [Google Scholar] [CrossRef] [PubMed]
- Ulusoy, M.O.; Horasanlı, B.; Işık-Ulusoy, S. Optical coherence tomography angiography findings of multiple sclerosis with or without optic neuritis. Neurol. Res. 2020, 42, 319–326. [Google Scholar] [CrossRef]
- Yilmaz, H.; Ersoy, A.; Icel, E. Assessments of vessel density and foveal avascular zone metrics in multiple sclerosis: An optical coherence tomography angiography study. Eye 2019, 34, 771–778. [Google Scholar] [CrossRef] [PubMed]
- Murphy, O.C.; Kwakyi, O.; Iftikhar, M.; Zafar, S.; Lambe, J.; Pellegrini, N.; Sotirchos, E.S.; Gonzalez-Caldito, N.; Ogbuokiri, E.; Filippatou, A.; et al. Alterations in the retinal vasculature occur in multiple sclerosis and exhibit novel correlations with disability and visual function measures. Mult. Scler. J. 2019, 26, 815–828. [Google Scholar] [CrossRef] [PubMed]
- Feucht, N.; Maier, M.; Lepennetier, G.; Pettenkofer, M.; Wetzlmair, C.; Daltrozzo, T.; Scherm, P.; Zimmer, C.; Hoshi, M.-M.; Hemmer, B.; et al. Optical coherence tomography angiography indicates associations of the retinal vascular network and disease activity in multiple sclerosis. Mult. Scler. J. 2018, 25, 224–234. [Google Scholar] [CrossRef]
- Spain, R.I.; Liu, L.; Zhang, X.; Jia, Y.; Tan, O.; Bourdette, D.; Huang, D. Optical coherence tomography angiography enhances the detection of optic nerve damage in multiple sclerosis. Br. J. Ophthalmol. 2017, 102, 520–524. [Google Scholar] [CrossRef] [PubMed]
- Lanzillo, R.; Cennamo, G.; Criscuolo, C.; Carotenuto, A.; Velotti, N.; Sparnelli, F.; Cianflone, A.; Moccia, M.; Morra, V.B. Optical coherence tomography angiography retinal vascular network assessment in multiple sclerosis. Mult. Scler. J. 2017, 24, 1706–1714. [Google Scholar] [CrossRef] [PubMed]
- Bhaduri, B.; Nolan, R.M.; Shelton, R.L.; Pilutti, L.A.; Motl, R.W.; Moss, H.E.; Pula, J.H.; Boppart, S.A. Detection of retinal blood vessel changes in multiple sclerosis with optical coherence tomography. Biomed. Opt. Express 2016, 7, 2321. [Google Scholar] [CrossRef]
- Wang, X.; Jia, Y.; Spain, R.; Potsaid, B.; Liu, J.J.; Baumann, B.; Hornegger, J.; Fujimoto, J.G.; Wu, Q.; Huang, D. Optical coherence tomography angiography of optic nerve head and parafovea in multiple sclerosis. Br. J. Ophthalmol. 2014, 98, 1368–1373. [Google Scholar] [CrossRef]
- Hwang, J.C.; Konduru, R.; Zhang, X.; Tan, O.; Francis, B.A.; Varma, R.; Sehi, M.; Greenfield, D.S.; Sadda, S.R.; Huang, D. Relationship among Visual Field, Blood Flow, and Neural Structure Measurements in Glaucoma. Investig. Opthalmol. 2012, 53, 3020–3026. [Google Scholar] [CrossRef]
- Samara, W.A.; Say, E.A.T.; Khoo, C.T.L.; Higgins, T.P.; Magrath, G.; Ferenczy, S.; Shields, C.L. Correlation of foveal avascular zone size with foveal morphology in normal eyes using optical coherence tomography angiography. Retina 2015, 35, 2188–2195. [Google Scholar] [CrossRef]
- Cortese, R.; Carrasco, F.P.; Tur, C.; Bianchi, A.; Brownlee, W.; Angelis, F.D.; Paz, I.D.L.; Grussu, F.; Haider, L.; Jacob, A.; et al. Differentiating Multiple Sclerosis From AQP4-Neuromyelitis Optica Spectrum Disorder and MOG-Antibody Disease With Imaging. Neurology 2023, 100, e308–e323. [Google Scholar] [CrossRef] [PubMed]
- Papadopoulos, M.C.; Verkman, A.S. Aquaporin 4 and neuromyelitis optica. Lancet Neurol. 2012, 11, 535–544. [Google Scholar] [CrossRef] [PubMed]
- Kobat, S.G. Importance of Müller Cells. Beyoglu Eye J. 2020, 5, 59–63. [Google Scholar] [PubMed]
- Fu, J.; Tan, S.; Peng, C.; Zhou, H.; Wei, S. A comparative study of alteration in retinal layer segmentation alteration by SD-OCT in neuromyelitis optica spectrum disorders: A systematic review and meta-analysis. Adv. Ophthalmol. Pract. Res. 2021, 1, 100007. [Google Scholar] [CrossRef] [PubMed]
- Lee, G.-I.; Park, K.-A.; Oh, S.Y.; Min, J.-H.; Kim, B.J. Differential patterns of parafoveal and peripapillary vessel density in multiple sclerosis and neuromyelitis optica spectrum disorder. Mult. Scler. Relat. Disord. 2021, 49, 102780. [Google Scholar] [CrossRef]
- Aly, L.; Strauß, E.-M.; Feucht, N.; Weiß, I.; Berthele, A.; Mitsdoerffer, M.; Haass, C.; Hemmer, B.; Maier, M.; Korn, T.; et al. Optical coherence tomography angiography indicates subclinical retinal disease in neuromyelitis optica spectrum disorders. Mult. Scler. J. 2021, 28, 522–531. [Google Scholar] [CrossRef]
- Rogaczewska, M.; Michalak, S.; Stopa, M. Optical Coherence Tomography Angiography of Peripapillary Vessel Density in Multiple Sclerosis and Neuromyelitis Optica Spectrum Disorder: A Comparative Study. J. Clin. Med. 2021, 10, 609. [Google Scholar] [CrossRef] [PubMed]
- Liu, C.; Xiao, H.; Zhang, X.; Zhao, Y.; Li, R.; Zhong, X.; Wang, Y.; Shu, Y.; Chang, Y.; Wang, J.; et al. Optical coherence tomography angiography helps distinguish multiple sclerosis from AQP4-IgG-seropositive neuromyelitis optica spectrum disorder. Brain Behav. 2021, 11, e02125. [Google Scholar] [CrossRef]
- Rogaczewska, M.; Michalak, S.; Stopa, M. Differentiation between multiple sclerosis and neuromyelitis optica spectrum disorder using optical coherence tomography angiography. Sci. Rep. 2021, 11, 10697. [Google Scholar] [CrossRef] [PubMed]
- Sechi, E.; Cacciaguerra, L.; Chen, J.J.; Mariotto, S.; Fadda, G.; Dinoto, A.; Lopez-Chiriboga, A.S.; Pittock, S.J.; Flanagan, E.P. Myelin Oligodendrocyte Glycoprotein Antibody-Associated Disease (MOGAD): A Review of Clinical and MRI Features, Diagnosis, and Management. Front. Neurol. 2022, 13, 885218. [Google Scholar] [CrossRef] [PubMed]
- Chen, J.J.; Sotirchos, E.S.; Henderson, A.D.; Vasileiou, E.S.; Flanagan, E.P.; Bhatti, M.T.; Jamali, S.; Eggenberger, E.R.; Dinome, M.; Frohman, L.P.; et al. OCT retinal nerve fiber layer thickness differentiates acute optic neuritis from MOG antibody-associated disease and Multiple Sclerosis. Mult. Scler. Relat. Disord. 2022, 58, 103525. [Google Scholar] [CrossRef]
- Roca-Fernández, A.; Camera, V.; Loncarevic-Whitaker, G.; Messina, S.; Mariano, R.; Vincent, A.; Sharma, S.; Leite, M.I.; Palace, J. The use of OCT in good visual acuity MOGAD and AQP4-NMOSD patients with and without optic neuritis. Mult. Scler. J. = Exp. Transl. Clin. 2021, 7, 205521732110664. [Google Scholar] [CrossRef] [PubMed]
- Yu, J.; Huang, Y.; Quan, C.; Zhou, L.; ZhangBao, J.; Wu, K.; Zong, Y.; Zhou, X.; Wang, M. Alterations in the Retinal Vascular Network and Structure in MOG Antibody-Associated Disease: An Optical Coherence Tomography Angiography Study. J. Neuro-Ophthalmol. 2020, 41, e424–e432. [Google Scholar] [CrossRef]
- Guerrieri, S.; Comi, G.; Leocani, L. Optical Coherence Tomography and Visual Evoked Potentials as Prognostic and Monitoring Tools in Progressive Multiple Sclerosis. Front. Neurosci. 2021, 15, 692599. [Google Scholar] [CrossRef]
- Behbehani, R.; Ali, A.; Al-Omairah, H.; Rousseff, R.T. Optimization of spectral domain optical coherence tomography and visual evoked potentials to identify unilateral optic neuritis. Mult. Scler. Relat. Disord. 2020, 41, 101988. [Google Scholar] [CrossRef] [PubMed]
- Behbehani, R.; Ahmed, S.; Al-Hashel, J.; Rousseff, R.T.; Alroughani, R. Sensitivity of visual evoked potentials and spectral domain optical coherence tomography in early relapsing remitting multiple sclerosis. Mult. Scler. Relat. Disord. 2017, 12, 15–19. [Google Scholar] [CrossRef] [PubMed]
- Chilińska, A.; Ejma, M.; Turno-Kręcicka, A.; Guranski, K.; Misiuk-Hojlo, M. Analysis of retinal nerve fibre layer, visual evoked potentials and relative afferent pupillary defect in multiple sclerosis patients. Clin. Neurophysiol. 2016, 127, 821–826. [Google Scholar] [CrossRef]
- Ava, S.; Hazar, L.; Tamam, Y.; Karahan, M.; Erdem, S.; Dursun, M.; Keklikçi, U. Relationship between optical coherence tomography angiography and visual evoked potential in patients with multiple sclerosis. Indian J. Ophthalmol. 2022, 70, 873. [Google Scholar] [PubMed]
- Pihl-Jensen, G.; Schmidt, M.F.; Frederiksen, J.L. Multifocal visual evoked potentials in optic neuritis and multiple sclerosis: A review. Clin. Neurophysiol. 2017, 128, 1234–1245. [Google Scholar] [CrossRef] [PubMed]
- Narayanan, D.; Cheng, H.; Tang, R.A.; Frishman, L.J. Multifocal visual evoked potentials and contrast sensitivity correlate with ganglion cell-inner plexiform layer thickness in multiple sclerosis. Clin. Neurophysiol. 2019, 130, 180–188. [Google Scholar] [CrossRef] [PubMed]
- Alshowaeir, D.; Yannikas, C.; Garrick, R.; Walt, A.V.D.; Graham, S.L.; Fraser, C.; Klistorner, A. Multifocal VEP assessment of optic neuritis evolution. Clin. Neurophysiol. 2015, 126, 1617–1623. [Google Scholar] [CrossRef] [PubMed]
- Kal, A.; Ulusoy, M.O.; Horasanlı, B.; Cezairlioğlu, Ş.; Kal, Ö. Effect of fingolimod (FTY720) on choroidal thickness in patients with multiple sclerosis. Mult. Scler. Relat. Disord. 2017, 14, 4–7. [Google Scholar] [CrossRef] [PubMed]
- Karaküçük, Y.; Gümüş, H.; Eker, S. Evaluation of the effect of fingolimod (FTY720) on macular perfusion by swept-source optical coherence tomography angiography in patients with multiple sclerosis. Cutan. Ocul. Toxicol. 2020, 39, 281–286. [Google Scholar] [CrossRef]
- Mohammadi, S.; Gouravani, M.; Salehi, M.A.; Arevalo, J.F.; Galetta, S.L.; Harandi, H.; Frohman, E.M.; Frohman, T.C.; Saidha, S.; Sattarnezhad, N.; et al. Optical coherence tomography angiography measurements in multiple sclerosis: A systematic review and meta-analysis. J. Neuroinflamm. 2023, 20, 85. [Google Scholar] [CrossRef] [PubMed]
- Chalkias, I.-N.; Bakirtzis, C.; Pirounides, D.; Boziki, M.K.; Grigoriadis, N. Optical Coherence Tomography and Optical Coherence Tomography with Angiography in Multiple Sclerosis. Healthcare 2022, 10, 1386. [Google Scholar] [CrossRef] [PubMed]
- Thompson, A.J.; Banwell, B.L.; Barkhof, F.; Carroll, W.M.; Coetzee, T.; Comi, G.; Correale, J.; Fazekas, F.; Filippi, M.; Freedman, M.S.; et al. Diagnosis of multiple sclerosis: 2017 revisions of the McDonald criteria. Lancet Neurol. 2018, 17, 162–173. [Google Scholar] [CrossRef] [PubMed]
- Usta, N.C.; Gunay, B.O. Is the ganglion cell layer thickness to macular thickness ratio a new biomarker for multiple sclerosis? Int. Ophthalmol. 2023, 43, 3841–3852. [Google Scholar] [CrossRef] [PubMed]
- O’Riordan, M.M.; Cahill, M.T.; Campbell, M.; Kearney, H. Evaluation of Inflammation in the Peripheral Multiple Sclerosis Retina Using Ultra-Widefield Optical Coherence Tomography: A Pilot Study. Ophthalmic Surg. Lasers Imaging Retin. 2023, 54, 586–588. [Google Scholar] [CrossRef]
- Iftikhar, M.; Zafar, S.; Gonzalez, N.; Murphy, O.; Kwakyi, M.S.O.; Feldman, B.S.S.; Calabresi, P.A.; Saidha, S.; Channa, R. Image Artifacts in Optical Coherence Tomography Angiography Among Patients With Multiple Sclerosis. Curr. Eye Res. 2019, 44, 558–563. [Google Scholar] [CrossRef]
- Kleerekooper, I.; Houston, S.; Dubis, A.M.; Trip, S.A.; Petzold, A. Optical Coherence Tomography Angiography (OCTA) in Multiple Sclerosis and Neuromyelitis Optica Spectrum Disorder. Front. Neurol. 2020, 11, 604049. [Google Scholar] [CrossRef] [PubMed]
- Lanzillo, R.; Moccia, M.; Criscuolo, C.; Cennamo, G. Optical coherence tomography angiography detects retinal vascular alterations in different phases of multiple sclerosis. Mult. Scler. J. 2018, 25, 300–301. [Google Scholar] [CrossRef] [PubMed]
- Abdul-Salam State, S.E.; Sfredel, V.; Mocanu, C.L.; Albu, C.V.; Bălășoiu, A.T. Optic neuropathies post-COVID 19-review. Rom. J. Ophthalmol. 2022, 66, 289–298. [Google Scholar] [PubMed]
- Dziedzic, A.; Saluk-Bijak, J.; Miller, E.; Niemcewicz, M.; Bijak, M. The Impact of SARS-CoV-2 Infection on the Development of Neurodegeneration in Multiple Sclerosis. Int. J. Mol. Sci. 2021, 22, 1804. [Google Scholar] [CrossRef]
- Shemer, A.; Greenbaum, A.; Toledano, A.; Biron, R.; Dubinsky-Pertzov, B.; Or, L. Optic Neuritis After SARS-CoV-2 Vaccination. J. Neuro-Ophthalmol. 2023, 43, 29–33. [Google Scholar] [CrossRef]
- Roy, M.; Chandra, A.; Roy, S.; Shrotriya, C. Optic neuritis following COVID-19 vaccination: Coincidence or side-effect?-A case series. Indian J. Ophthalmol. 2022, 70, 679. [Google Scholar] [CrossRef] [PubMed]
- Waldman, A.T.; Benson, L.; Sollee, J.R.; Lavery, A.M.; Liu, G.W.; Green, A.J.; Waubant, E.; Heidary, G.; Conger, D.; Graves, J.; et al. Interocular Difference in Retinal Nerve Fiber Layer Thickness Predicts Optic Neuritis in Pediatric-Onset Multiple Sclerosis. J. Neuro-Ophthalmol. 2020, 41, 469–475. [Google Scholar] [CrossRef]


| Author and Year | Participants and Method | Analyzed Structures | Sub Groups | Study Limitations | Key Findings |
|---|---|---|---|---|---|
| Lee et al. [56] 2021 | 36 MS eyes vs. with 47 NMOSD eyes vs. 36 healthy eyes | RNFL GCL Macular VD ONH VD | No subgroups | Not longitudinal | NMOSD eyes had the lowest structural OCT parameters. IED were found in patients with ON history; Correlation between visual function and ONH VD. Correlation between structural parameters and OCT-A values in MS and between RNFL and OCT-A values in NMOSD. |
| Aly et al. [57] 2021 | 41 MS eyes vs. 30 NMOSD eyes vs. 42 healthy eyes | RNFL GCIPL Fovea thickness FAZ area SVP VD DVP VD | MSON vs. MSNON; NMO ON vs. NMO NON | Not longitudinal Not correlated with visual function | ON eyes had a decreased VD and a larger FAZ. No significant differences between VD in MS and NMOSD. NON NMOSD eyes had an increased FAZ while MS and healthy eyes presented normal values. Enlarged FAZ area had a higher correlation with EDSS in NMOSD patients. |
| Rogaczewska et al. [58] 2021 | 75 MS eyes vs. 20 NMOSD eyes vs. 40 healthy eyes | Radial peripapillary capillary density | MSON vs. MSNON; NMO ON vs. NMO NON | Not longitudinal Only one analyzed parameter | VD was significantly reduced in NMO ON eyes with a predilection to inferior, superior nasal and nasal superior sectors. RPC in temporal, nasal and ST sectors were decreased in MSON compared with MSNON. Comparing ON and NON eyes, lower RPC VD had temporal and nasal affinity in MS, whereas in NMOSD, 7 out of 8 sectors were affected. |
| Liu et al. [59] 2021 | 83 MS eyes vs. 91 NMOSD eyes vs. 34 healthy eyes | RNFL GCL Macular VD FAZ | MSON vs. MSNON; NMOSD ON vs. NMOSD NON | Not longitudinal | No significant FAZ parameters differences between the groups. MS NON and NMOSD NON showed no significant difference in structural OCT parameters when compared to healthy group. NMOSD eyes had lower macular VD compared to MS eyes, especially when comparing NMOSD ON to MS ON. Outer inferior and outer nasal quadrants showed the highest capacity to distinguish between MS and NMOSD patients. |
Disclaimer/Publisher’s Note: The statements, opinions and data contained in all publications are solely those of the individual author(s) and contributor(s) and not of MDPI and/or the editor(s). MDPI and/or the editor(s) disclaim responsibility for any injury to people or property resulting from any ideas, methods, instructions or products referred to in the content. |
© 2023 by the authors. Licensee MDPI, Basel, Switzerland. This article is an open access article distributed under the terms and conditions of the Creative Commons Attribution (CC BY) license (https://creativecommons.org/licenses/by/4.0/).
Share and Cite
Donica, V.C.; Alexa, A.I.; Pavel, I.A.; Danielescu, C.; Ciapă, M.A.; Donica, A.L.; Bogdănici, C.M. The Evolvement of OCT and OCT-A in Identifying Multiple Sclerosis Biomarkers. Biomedicines 2023, 11, 3031. https://doi.org/10.3390/biomedicines11113031
Donica VC, Alexa AI, Pavel IA, Danielescu C, Ciapă MA, Donica AL, Bogdănici CM. The Evolvement of OCT and OCT-A in Identifying Multiple Sclerosis Biomarkers. Biomedicines. 2023; 11(11):3031. https://doi.org/10.3390/biomedicines11113031
Chicago/Turabian StyleDonica, Vlad Constantin, Anisia Iuliana Alexa, Irina Andreea Pavel, Ciprian Danielescu, Manuela Andreea Ciapă, Alexandra Lori Donica, and Camelia Margareta Bogdănici. 2023. "The Evolvement of OCT and OCT-A in Identifying Multiple Sclerosis Biomarkers" Biomedicines 11, no. 11: 3031. https://doi.org/10.3390/biomedicines11113031