1. Introduction
Multiple sclerosis (MS) is a severe, life-long neurological disorder of autoimmune origin with an unclear etiology. The communities most affected by multiple sclerosis are in industrialized countries, but in recent decades the disease has spread throughout the world. The availability of both improved diagnostic and medical services has influenced local statistics on MS patients. Since no data were available on MS prevalence in the human population during the SARS-2 pandemic, we operated with a previously reported level—149.2 cases per 100,000 individuals in 2012 in the USA [
1]. Because MS is a life-long disease, MS countermeasures applied to patients pose a heavy financial burden on medical and insurance services; the annual average cost of disease-modifying therapies in the USA was reportedly up to USD 70,000 a year [
2]. The detailed mechanism of MS onset is yet unknown, but it is continuously speculated that autoimmune developments in the immune system are linked to certain aspects of lifestyle, genetic predisposition, or the general ecological situation. Following the innate immune response, cells become capable of activating antigen-specific B and T cells. Such an event evinces the adaptive immune response in general [
3,
4]. The adaptive immune response contains both humoral and cellular parts, while the humoral response is fueled by B cells, the activation of which provides the organism with antibodies produced via circulating plasma cells. Generated antibodies can specifically target not only autologous antigens but also those with similar 3D structures. The function of antibodies is to provide antigen neutralization and opsonization, initiating the system of complementing and preventing pathogen proliferation [
5]. B cell activation depends on the interaction between antigens loaded onto MHC and those antigen presenting cells (APCs) exposed to B cells. This process can be tuned by the magnitude of assistance provided by helper T cells (Th), which are CD+ type cells that promote the activation of CD8+ and CD4+ cells, while T cells continue to recognize particular antigens presented on the cell surface by MHC-I and MHC-II protein complexes [
4]. As a result, T cells become capable of identifying infected cells and recruiting other immune cells to eliminate all detected damage [
4]. Moreover, both B and T cells create limited populations of immune memory cells, which are capable of providing a faster adaptive immune response in case of reinfection with the same antigen. Obviously, a pool of antigen-specific receptors with extremely diverse specificity, located on the outer membranes of lymphocytes, makes the immune system capable of targeting the most pathogens. At the same time, even a power of such magnitude still possesses some sort of physical “Trojan” emerging from the nature of a universally wide range of antigen receptors. This could drive lymphocytes to acting specifically toward some antigen structures formally related to the native body and defined, therefore, as self-antigens. Normally, such lymphocytes capable of activating with self-antigens should be eliminated in the course of immune cell maturation. Indeed, there are mechanisms directed to control immune cell specificity to cell antigens, which aim to cancel auto-reactive lymphocyte propagation. At the same time, a tolerance mechanism has to be employed during lymphocyte activation to prevent the potentially auto-reactive lymphocytes from escaping negative selectionand to allow the eventual onset of autoimmune disease after they are exposed to unidentified antigenic stimuli. Similar mechanisms have been observed in multiple sclerosis (MS), type-1 diabetes (T1D), and rheumatoid arthritis (RA) [
4].
Autoimmune diseases can be triggered by B and T cells, recognized as self-antigens, and then become activated to promote the proliferation of T cells with defined antigenic specificity. The key reason for neuron malfunctioning in patients diagnosed with MS is the impairment of myelin sheath integrity in the neurons in the central nervous system (CNS). Myelin, which insulates nerves, is composed of distinctive components—myelin basic protein (MBP), proteolipid protein (PLP), myelin-associated glycoprotein (MAG), and myelin oligodendrocyte glycoprotein (MOG) [
6]. Demyelinization in MS has several clinical manifestations, grouped into four disease forms: relapsing-remitting MS (RRMS), which accounts for 85% of all registered MS cases; primary progressing MS (PPMS), which is diagnosed in 10% cases; progressive-remitting MS (PRMS), which relates to another 5% cases; and secondary progressive MS (SPMS), which usually develops over time in some patients previously diagnosed with RRMS [
7]. Despite the precise switching of MS being unclear, both T and B lymphocytes are known for taking part in MS progression. While T cells are assumed to play the main role in the event, B cells are also capable of penetrating the hematoencephalic barrier by infiltrating both the parenchyma and cerebrospinal liquid. Finally, the infiltrated cells become responsible for propagating distinctive oligoclonal antibodies, which are joined to the myelin components with a high affinity [
8]. Such B lymphocytes were characterized with an elevated expression of lympho-proliferative cytokine GM-CSF [
9]. Loaded to MHC, class I antigens can promote the formation of peptide–MHC (pMHC) complexes, capable of directing the immune response and CD8+ cytotoxic T-cell (CTL) activation [
10,
11]. Obviously, the antigen structure restriction, achieved with MHC and TCR proteins, lowers the overall number of self-antigens among the pool of peptidome structures, since they are loading to MHC in a competitive manner. Thus, the volume of the T-cell receptor (TCR) repertoire influences the magnitude of the T-cell response, while naive T cells must provide recognition for every potential peptide generated within the body and complexed with MHC proteins in order to adjust the adaptive immune response [
12,
13]. For instance, EBV immune recognition is usually dominated by a single EBNA3 peptide bound to HLA-B8 [
14]. HLA-B8-restricted T-cell response in humans is mainly conducted by a single TCR type (LC13), which is considered to be a public clonotype structure shared among all HLA-B8-expressed individuals [
15]. A study of TCR immunodominance during the response to Epstein–Barr virus (EBV) has shown that such a structure of pMHC complexes may exist to affect the selection of immune-dominant peptides and disrupt the selection of the fittest structures. It is not clear what exactly distinguishes between the prospective ligand structures and less prominent candidates for this role. Presumably, the auto-immune process could be influenced by the antigens able to compete with the structures that promote pathology by forming an effective immune complex with distinctive MHC and TCR receptors. Pathology-inducing antigens are therefore defined as pathology-related factors.
There are several medications approved to treat MS symptoms in clinics: massive (several grams) intravenous injections of donor plasma immunoglobulins (IVIG) low-specific agents with cytostatic activity, which are also used to treat rheumatoid arthritis (RA), steroid immunosupressants. Historically, the most typical treatments of MS in humans are based on IFN β-1a, IFN β-1b, glatiramer acetate (Copaxone-1), and dimethyl fumarate [
16,
17]. Several immune-based anti-MS drugs have been approved for humans, including ocrelizumab (mAb to CD20 B-cell antigen) [
18]; natalizumab (Tysabri
® by Vetter Farma-Fertigung, Germany; mAb to the α4 integrin) [
19]; daclizumab (mAb to the subunit of IL-2Rα [
20]); mitoxantrone (Novantrone
®), which is a rather systemic cytostatic agent that also possesses tropism for immune cells [
21]. Finally, fingolimod (Gilenya), known for interfering with the infiltration of lymphocytes into the central nervous system (CNS) by blocking the cell penetration of the blood–brain barrier, similar to the non-selective agonist of sphingosine-1-phosphate receptor FTY720 (S1P) activity [
22].
Glatiramer acetate (Copaxone-1
® by Teva Pharmaceuticals) is the only polypeptide approved by the FDA as a drug for MS treatment. Copaxone is composed of four amino acid residues, found in the myelin most frequently. Glatiramer acetate is assumed to possess remarkable activity by interfering with myelin-directed autoantibody (auto-Ab) accumulation and cytotoxic CD8+ T-cell proliferation [
6]. Therefore, Copaxone enables a very natural way of introducing glatiramer-derived peptides to the inner anti-gene restricting machinery in the immune system. Notably, this drug is greatly demanded on the market, given the remarkably small list of unfavorable side effects compared to other medications, despite the fact that the efficacy of modern MS treatments, on average, remains below 25%. Furthermore, the monoclonal antibodies and cytokines used for MS treatment often produce deep distress and promote immune system deficiency in MS patients. Immune-modifying drugs are noted for having lower efficacy against the primary and secondary non-remitting (progressive) forms of MS, which are less prevalent than RRMS but could exhibit highly severe symptoms [
23]. To summarize, there is a constant need to search for novel immune-modifiers able to treat MS, especially its progressive forms.
Immunosuppressive peptide structures with anti-proliferative activity toward activated lymphocytes emerged several decades ago. Since then, some endogenous peptides of humans were determined to possess certain immunosuppressive activities, lacking most of the side effects usually observed during MS treatment with common medications. The prime structure of immunocortins is composed of ValLysLysProGlySerSerValLysVal amino acid residues (a.a.). This sequence was derived from immunoglobulin. It is homologous to the N-terminal region of human Ig γ- or μ- heavy chains (from 11 to 20 a.a.), just upstream to the variable VH-region [
24]. Although immunocortin is known for exhibiting immunosuppressing properties, its practical implications remain under consideration.
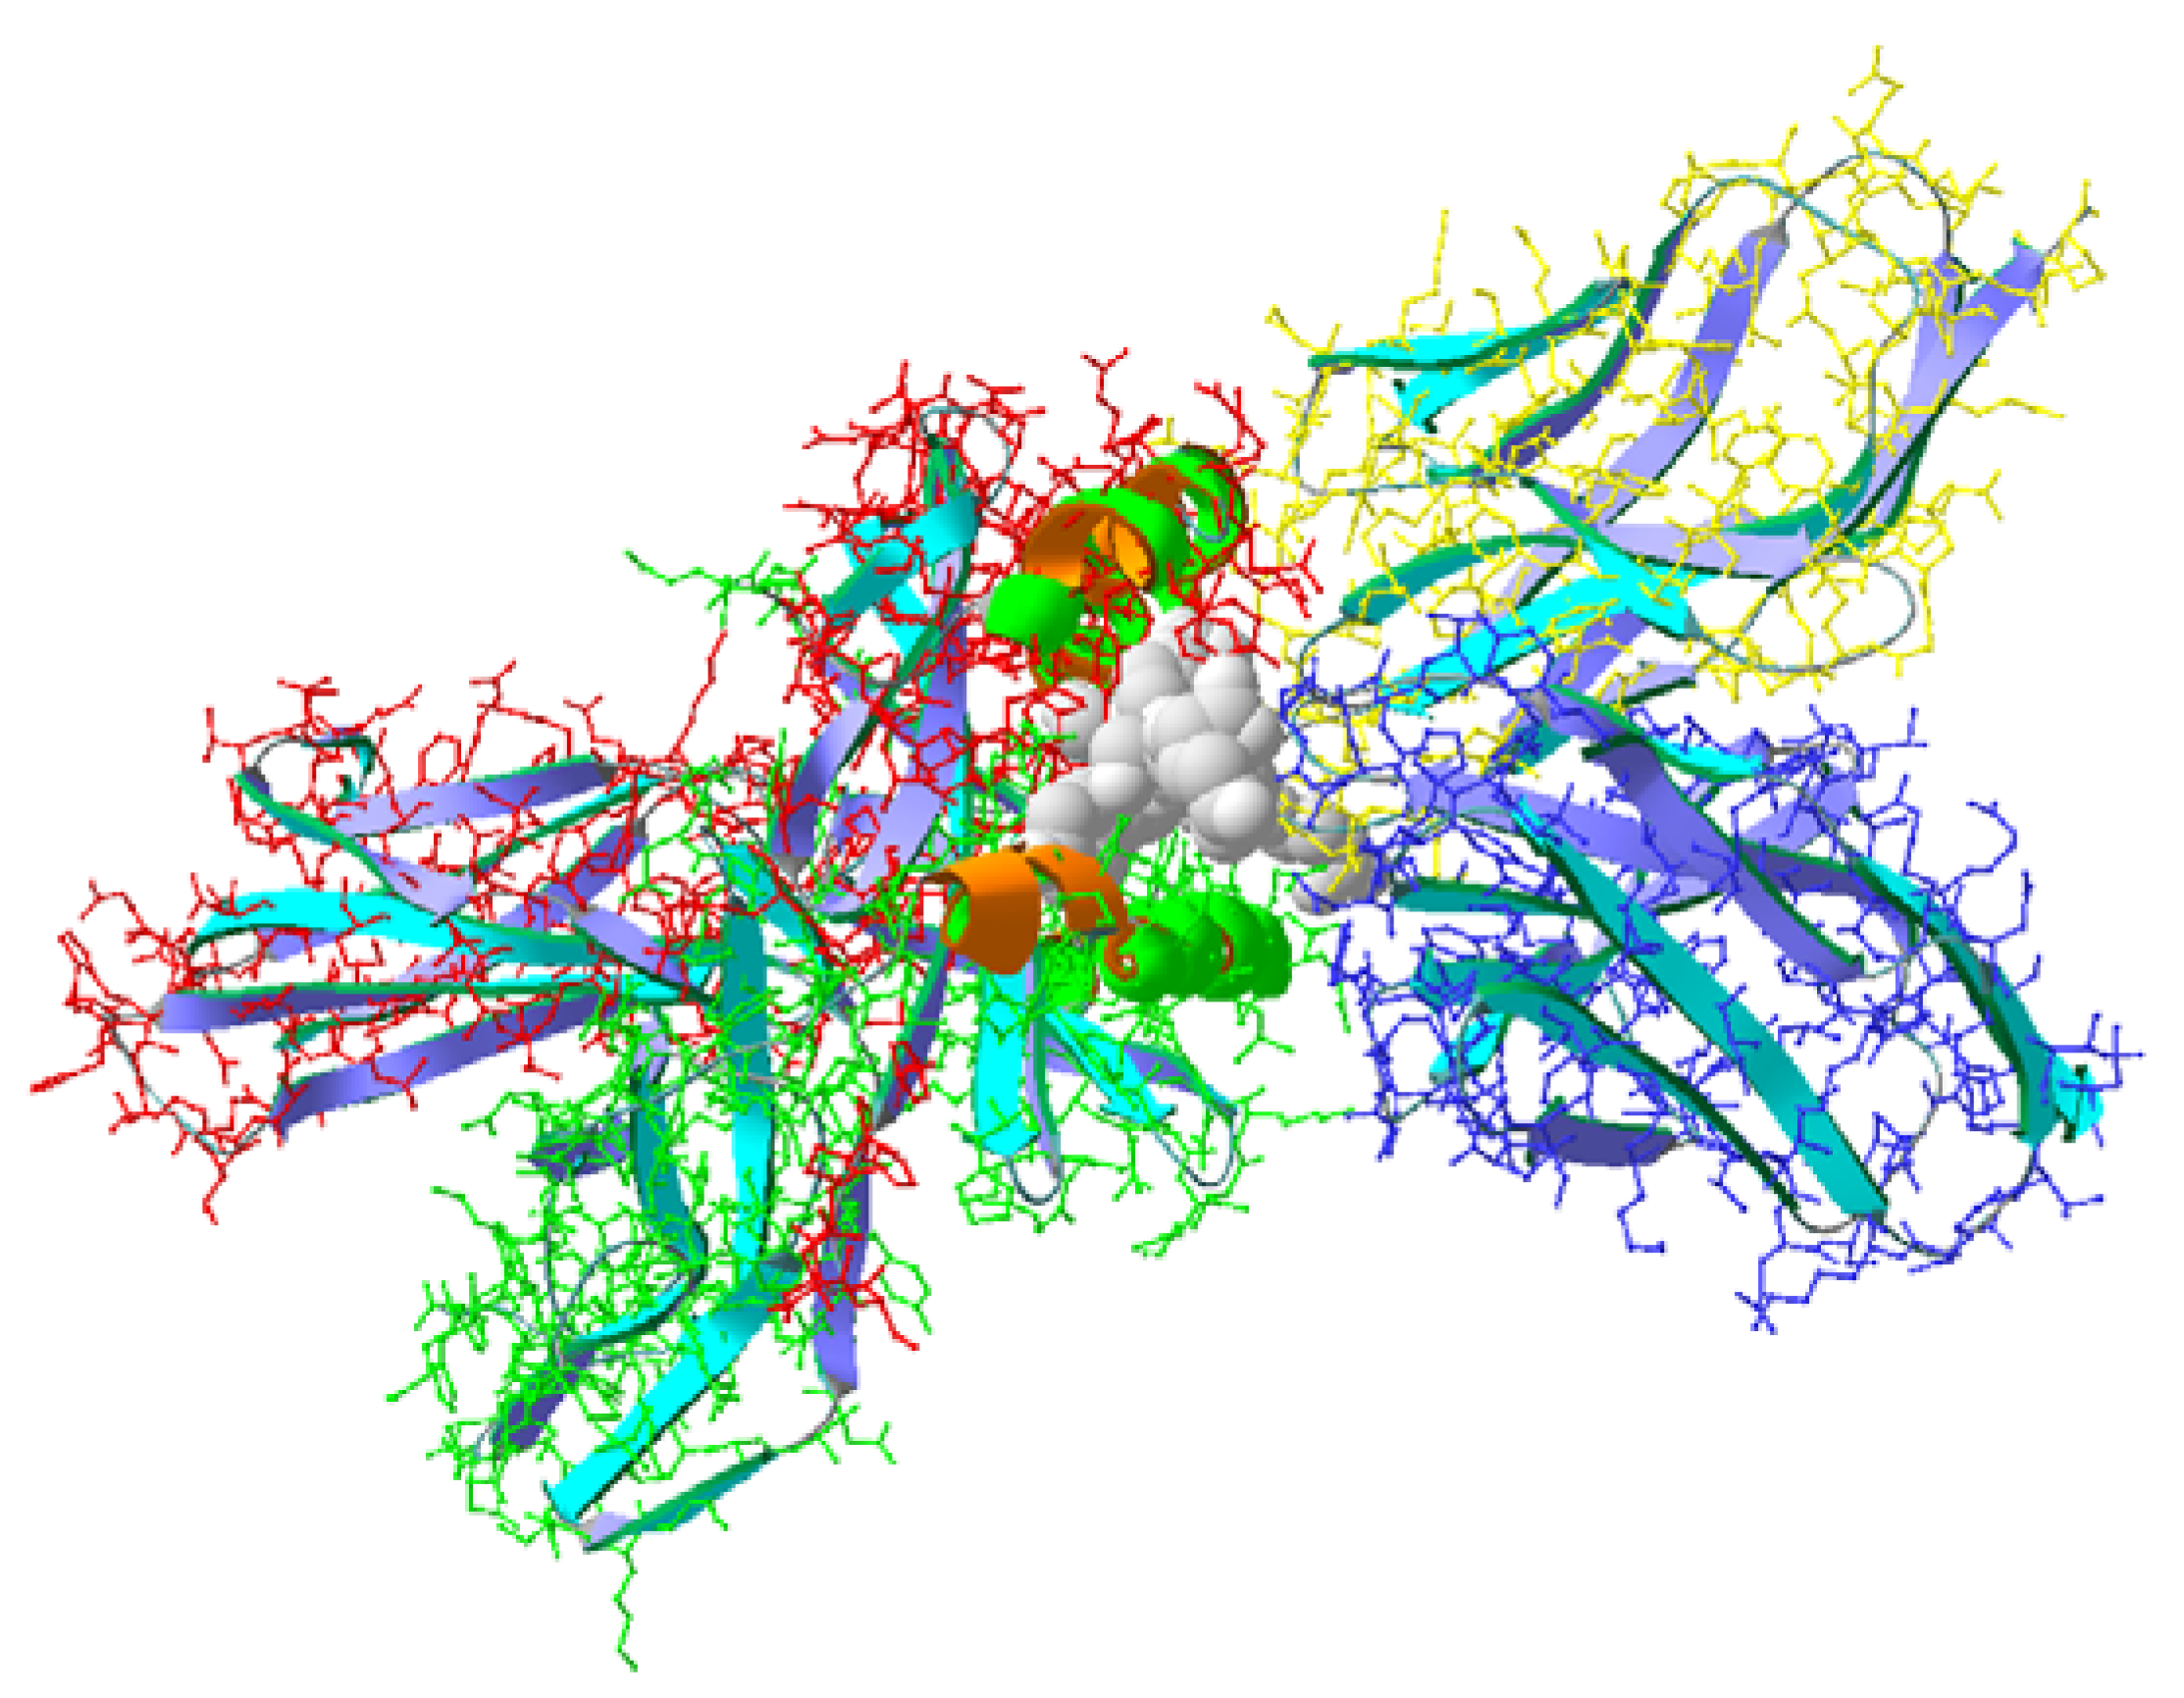
During this work, we studied a short synthetic peptide (pCav3) found in the C-terminal region of caveolin-3, chosen because its primary structure was found to be similar to that of immunocortin. This novel peptide structure is located at the C-terminus of the primary human caveolin-3 structure. The main properties of pCav3 were evaluated by emulating a 3D pCav3 model and then placed in a triple auto-immune complex MHC/TCR/p (SwissProt ID 2Z31) by replacing the peptide ligand of the myelin origin in silico. Given the molecular docking results, pCav3 was picked up to test its activity in vitro and in vivo. We decided it would be rational to compare the same peptide treatments on two models of different autoimmune disorders. This could provide additional information on the antigenic peptide structure influenced by the treatment specificities. We used experimental autoimmune encephalomyelitis (EAE) as the MS model and collagen-induced arthritis (CIA) as the model of rheumatoid arthritis (RA). Both models went through the same peptide treatments. Similar to EAE, the CIA used has been established in several rat strains, including Sprague–Dawley (SD) immunized with collagen type II [
25,
26]. Also, CIA was shown to share both immunological and pathological features common to rheumatoid arthritis in humans (RA); so far, it has been used to study RA [
27]. Contrary to the EAE that was optimized for DA rats, the CIA model was established on different from DA immunogenetics corresponding to distinct rat lineages susceptible to CIA. This point makes a bridge between the features of the autoimmune disease model and the antigenic specificity of the MHC proteins in the animals used for modeling the disease [
28,
29]. It is known that rat strains with different MHC types are able to develop CIA, although the autoantibody specificities or T-cell epitope affinities may differ among the rat strains significantly [
30]. For instance, DA and SD rats have distinct MHC RT1 haplotypes av1 and f respectively [
25,
29]. Although DA rats are highly susceptible to immunization with collagen II, these animals are known to employ two different immune mechanisms that are engaged simultaneously during the immune system response to collagen II in the course of CIA. Therefore, DA rats are explicitly not recommended by the Organization of Economic Cooperation and Development in Europe (OECD) to model CIA. This point is highly questionable from the authors’ prospective.
The aims of this study were to investigate the novel peptide pCav3 homologous to the immunocortin structure for its potency in treating an autoimmune model of EAE, while immunocortin was examined for the treatment of EAE and CIA established in DA and SD rats, respectively. These two models both relate to autoimmune disorders in humans, but were induced with distinct antigens applied to the different genetic landscapes featured by the DA and SD rats. This comprehensive approach makes enabled the investigation of immunosuppressive peptide activity by monitoring the magnitude of peptide-directed effects on certain autoimmune diseases to clarify the prospects of autoimmune disease treatments in clinics.
2. Materials and Methods
2.1. Peptide and Structure Analysis
Search for the regions of homology to immunocortin was accomplished by analysis of the protein database GenProt at
https://ncbi.nlm.nih.gov (accessed on 10 February 2023), and then implementing them using the BLAST website. Eventually, the structure of interest was found in the C-terminal region of human protein caveolin-3 (Cav-3). A 3D structure of peptide pCav3 was modeled and processed using SPDB viewer v.3 software. A triple complex (SwissProt ID 2Z31) of myelin peptide, complexed with TCR/MHC proteins (MHC/pep/TCR), was used as a template in silico replacement of the ligand in 2Z31 with the investigated structure. Free energies of the isolated ligand and receptor proteins MHC/TCR or those of the whole complex were assessed with a specialized subroutine of the software. The estimated values were used to determine the ability of the ligands to bind to the corresponding receptors. The free energy of binding (
Ebind) were calculated using the framework of the generalized approach by Born, since
EMM/GBSA (the free energy of the structure) include solvation effects, taking into account the size and kind of the molecule surface exposed to the solution [
31]:
where Δ
EMM—molecular mechanic energy; Δ
EGB—free energy presented by the generalized Born approach, including mechanical, electrostatic, and Van der Vaals interactions; Δ
ESA—events due to molecular surface solvation (SA). The free energy of ligands binding to the complex of TCR and MHC proteins was calculated accordingly:
where Δ
Ecomplex—free energy of the full complex; Δ
Epep—free energy of the isolated ligand; Δ
ETCR/MHC—free energy of the “empty” complex (structure without ligand). Given the ligand affinity was confirmed in silico, the chemical synthesis of pCav3 peptides and immunocortin was accomplished. The peptides were crafted with a standard solid-phase peptide synthesis (SPPS) approach using Fmoc/tBu-protected amino acids as precursors [
32,
33]. The peptides were purified from the main preparation mixture with reversed-phase chromatography and a UV-light detector set at 226 nm (2238 Uvicord SII, LKB Bromma). The peptide homogeneity was confirmed with a specific HPLC analysis (>95.5% homogeneity), which determined it was suitable for biological trials and preclinical study.
2.2. Animals
The experimental protocols used in this work fully complied with the International Guiding Principles for Biomedical Research Involving Animals issued by WHO. The experiments were approved by the Institutional Commission for Control and Use of Laboratory Animals at the Branch of the Shemyakin-Ovchinnikov Institute of Bioorganic Chemistry, Russian Academy of Sciences (protocol number: 711/19 on 23 September 2019). The study was conducted at the Animal Care Facility of the Laboratory of Biological Trials at BIBCH RAS (Pushchino, Russia). The animal care procedures were performed according to the laboratory SOPs. The room that was inhabited with the animals in the experiment has a certified barrier to external media. There was an automatic period of switching between day and night every 12 h, and the whole volume of circulating air changed every 1 h. The temperature and humidity were monitored in each room remotely with the Eksis Visual Lab computerized system, Practice-NC Ltd., Moscow, Russia. Dark Agouti (DA) rats (DA/ZFV Crl BR breeding stock) were purchased from Charles River Co. (Sulzfeld, Germany). DA and SD rats were bred at the Shemyakin and Ovchinnikov Institute of Bioorganic Chemistry, Pushchino, Russia. Outbred female DA rats that were 10–12 weeks old and weighed 190–220 g were used in the experiment. Outbred SPF female SD rats that were 8–12 week old and weighed 170–200 g were used in the experiment after they grew at the breeding facility “Pushchino” at the Shemyakin and Ovchinnikov Institute of Bioorganic Chemistry, Russian Academy of Sciences (Pushchino, Russia). The animals were kept at the animal facility under climate-controlled conditions with 12 h light/dark cycles, fed food, and provided with water ad libitum. All manipulations applied to the animals were evaluated and approved by the Institutional Animal Care and Use Committees (IACUC, Singapore). The animals were accommodated for 2 weeks before the experiment started; they were kept in secure isolated rooms under controlled environmental conditions: temperature of 20–24 °C; humidity of 30–60%; 12 h light/dark cycle. The animals were fed ad libitum (SSNIFF V1534-300, Spezialdiaeten, GmbH, Stuttgart, Germany) and had free access to Milli-RO (Millipore, Burlington, MA, USA) purified sink water. The cages were supplied with an ecologically pure Lignocel Nesting Ball (JRS, Rosenberg, Germany) and pyramids of red polycarbonate for the animals to entertain themselves during their inhabitation period (Tecniplast S.P.A., Varese, Italy). The study was conducted fully in accordance with the following regulating documents: the Institutional Animal Care Rules and National User Program, Federal Guidelines SP 2.2.1.3218-14; Guide for the Care and Use of Laboratory Animals: Eighth Edition (National Research Council, Washington, DC, USA, 2011), Directive 2010/63/EU of EP and the National Research Council on 09.22.2010 regarding animal protection during scientific manipulations; Guidelines by the National Research Council, 2003 (Care and Use of Mammals in Neuroscience and Behavioral Research).
2.3. Experimental Autoimmune Encephalomyelitis Model (EAE)
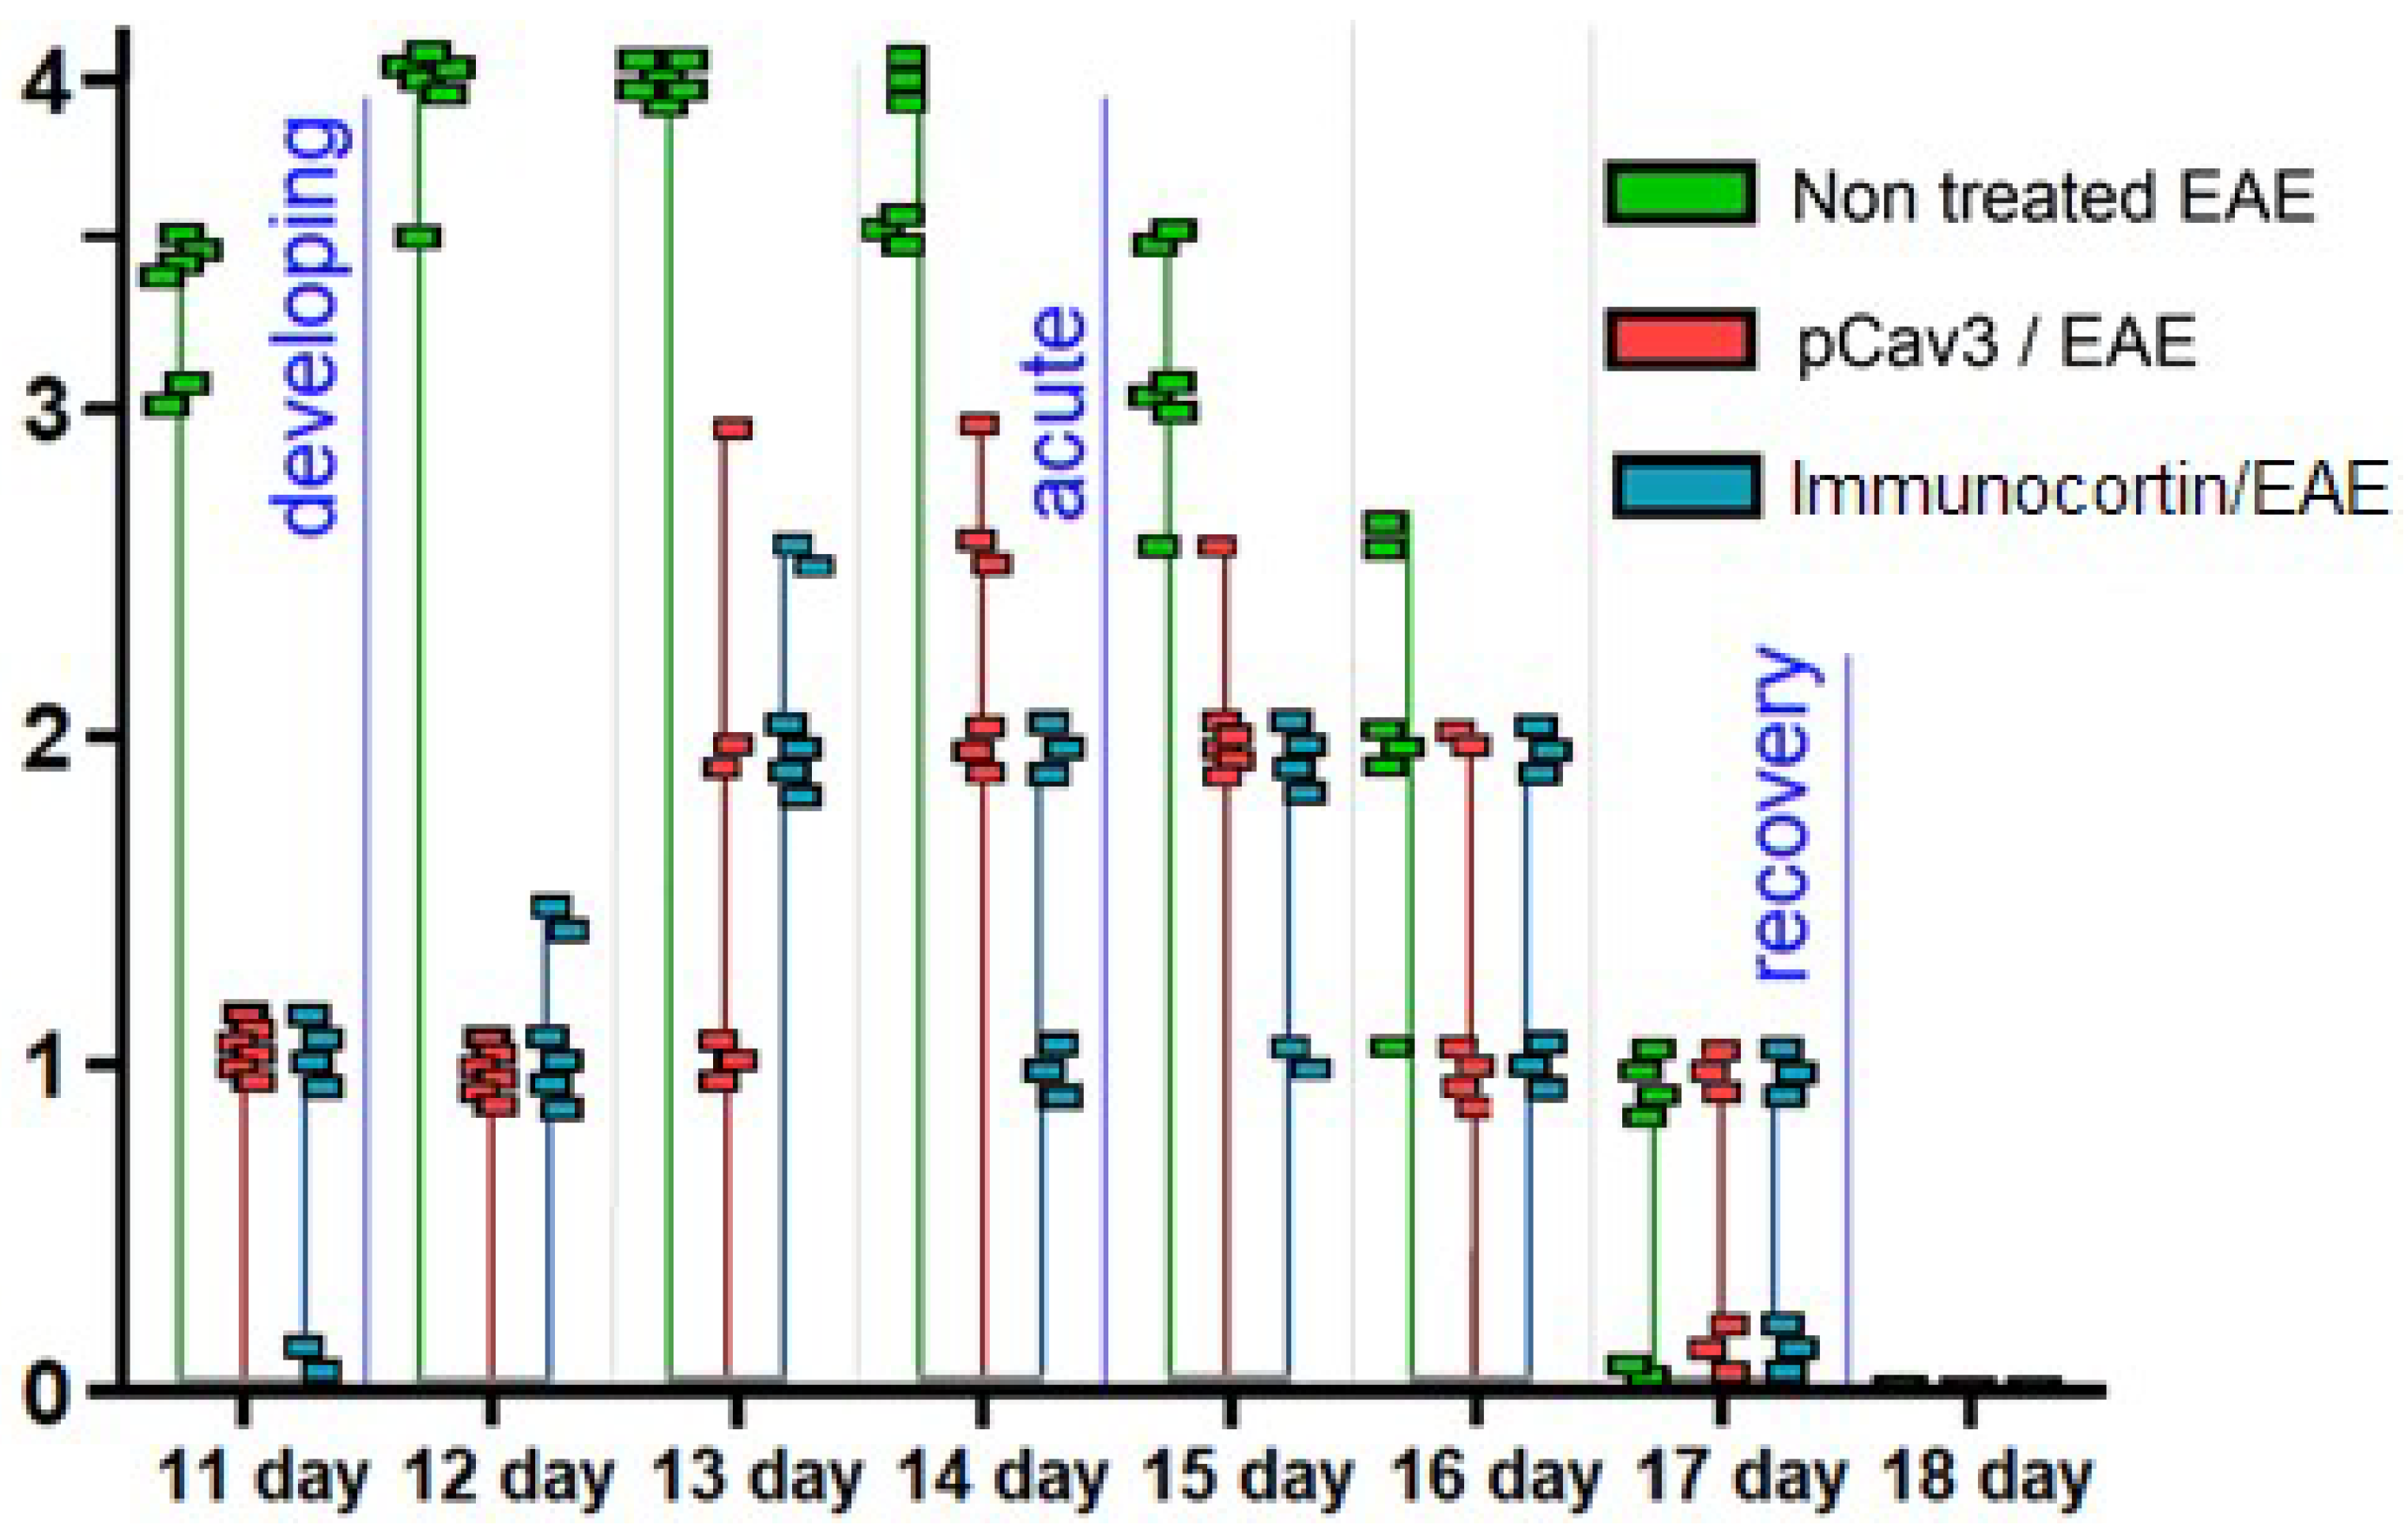
DA rats weighing 210–230 g were divided into three groups with six animals in each. Homogenate injection for DA rat immunization was prepared by homogenizing spinal cords that were previously excised from rats, frozen, and stored in liquid nitrogen until use. During the first step of immunization, the homogenate injection was emulsified with incomplete Freund’s adjuvant (IFA, 1:1
w/
v), as described elsewhere [
34]. Rats were immunized with 50 μL of the syngeneic homogenate drug injected into both hind footpads. The animals’ condition and weight were monitored for EAE clinical symptoms according to the following clinical scores: 0, asymptomatic; 1, loss of tail turgor; 2, impaired righting reflex; 3, partial paralysis; 4, complete paralysis; 5, moribund or dead animal. The clinical signs of sub-typical symptoms were scored as 0.5 less than the symptoms graded above. In our case, acute-phase EAE in the DA rats started in the control group of animals with non-treated EAE on the 12th day after immunization with homogenate injection and continued until day 14, which corresponded to the most obvious signs of the disease detected in the experiment. The peak of disease symptoms (acute phase) lasted for 3 days and were characterized by the biggest scores detected in the EAE animals in the experimental groups. Overall, EAE was scored once daily in each group of animals used for the experiment. The common cumulative scores of groups were calculated once daily during three phases of EAE: developing (shown on day 1 only); acute phase (from day 12 to 14); recovering (from day 15 to 19). Such an approach was used to analyze the data on the EAE phenotypes obtained during the experiment. The annual data on the cumulative scores were confirmed with the Mann–Whitney (U-test) criteria, Kholmogorov–Smirnov, and Kruskal–Wallis tests at
p < 0.05. The animals were euthanized at the end of the experiment in a CO
2 chamber.
2.4. Peptide Therapy for EAE
Starting the day after EAE was induced with immunization of DA rats by homogenate injection, the animals of the experimental groups were injected intraperitoneally (i.p.) with a tested peptide solution (100 μL) at a dose of 500 mcg/kg once a day. The control group of animals received a placebo-equal volume (100 μL) of a carrier-solution of non-pyrogenic saline (0.9% NaCl). The experimental groups of animals, which received the tested peptides, were considered the “treated EAE” groups. The control group of animals, which received the carrier only, was considered the “non-treated EAE” group. The rats in the experimental groups took the treatment with pCav3 or immunocortin once a day, while the control animals took the placebo (carrier). The EAE scores were estimated for every animal starting on day 11. The individual scores in each group were used to calculate a combined integral score of the group each day until day 18. Starting on day 19, all of the animals were considered fully recovered, and the peptide injections were discontinued. At this point, the whole experiment was considered to be over.
2.5. Histological Examination
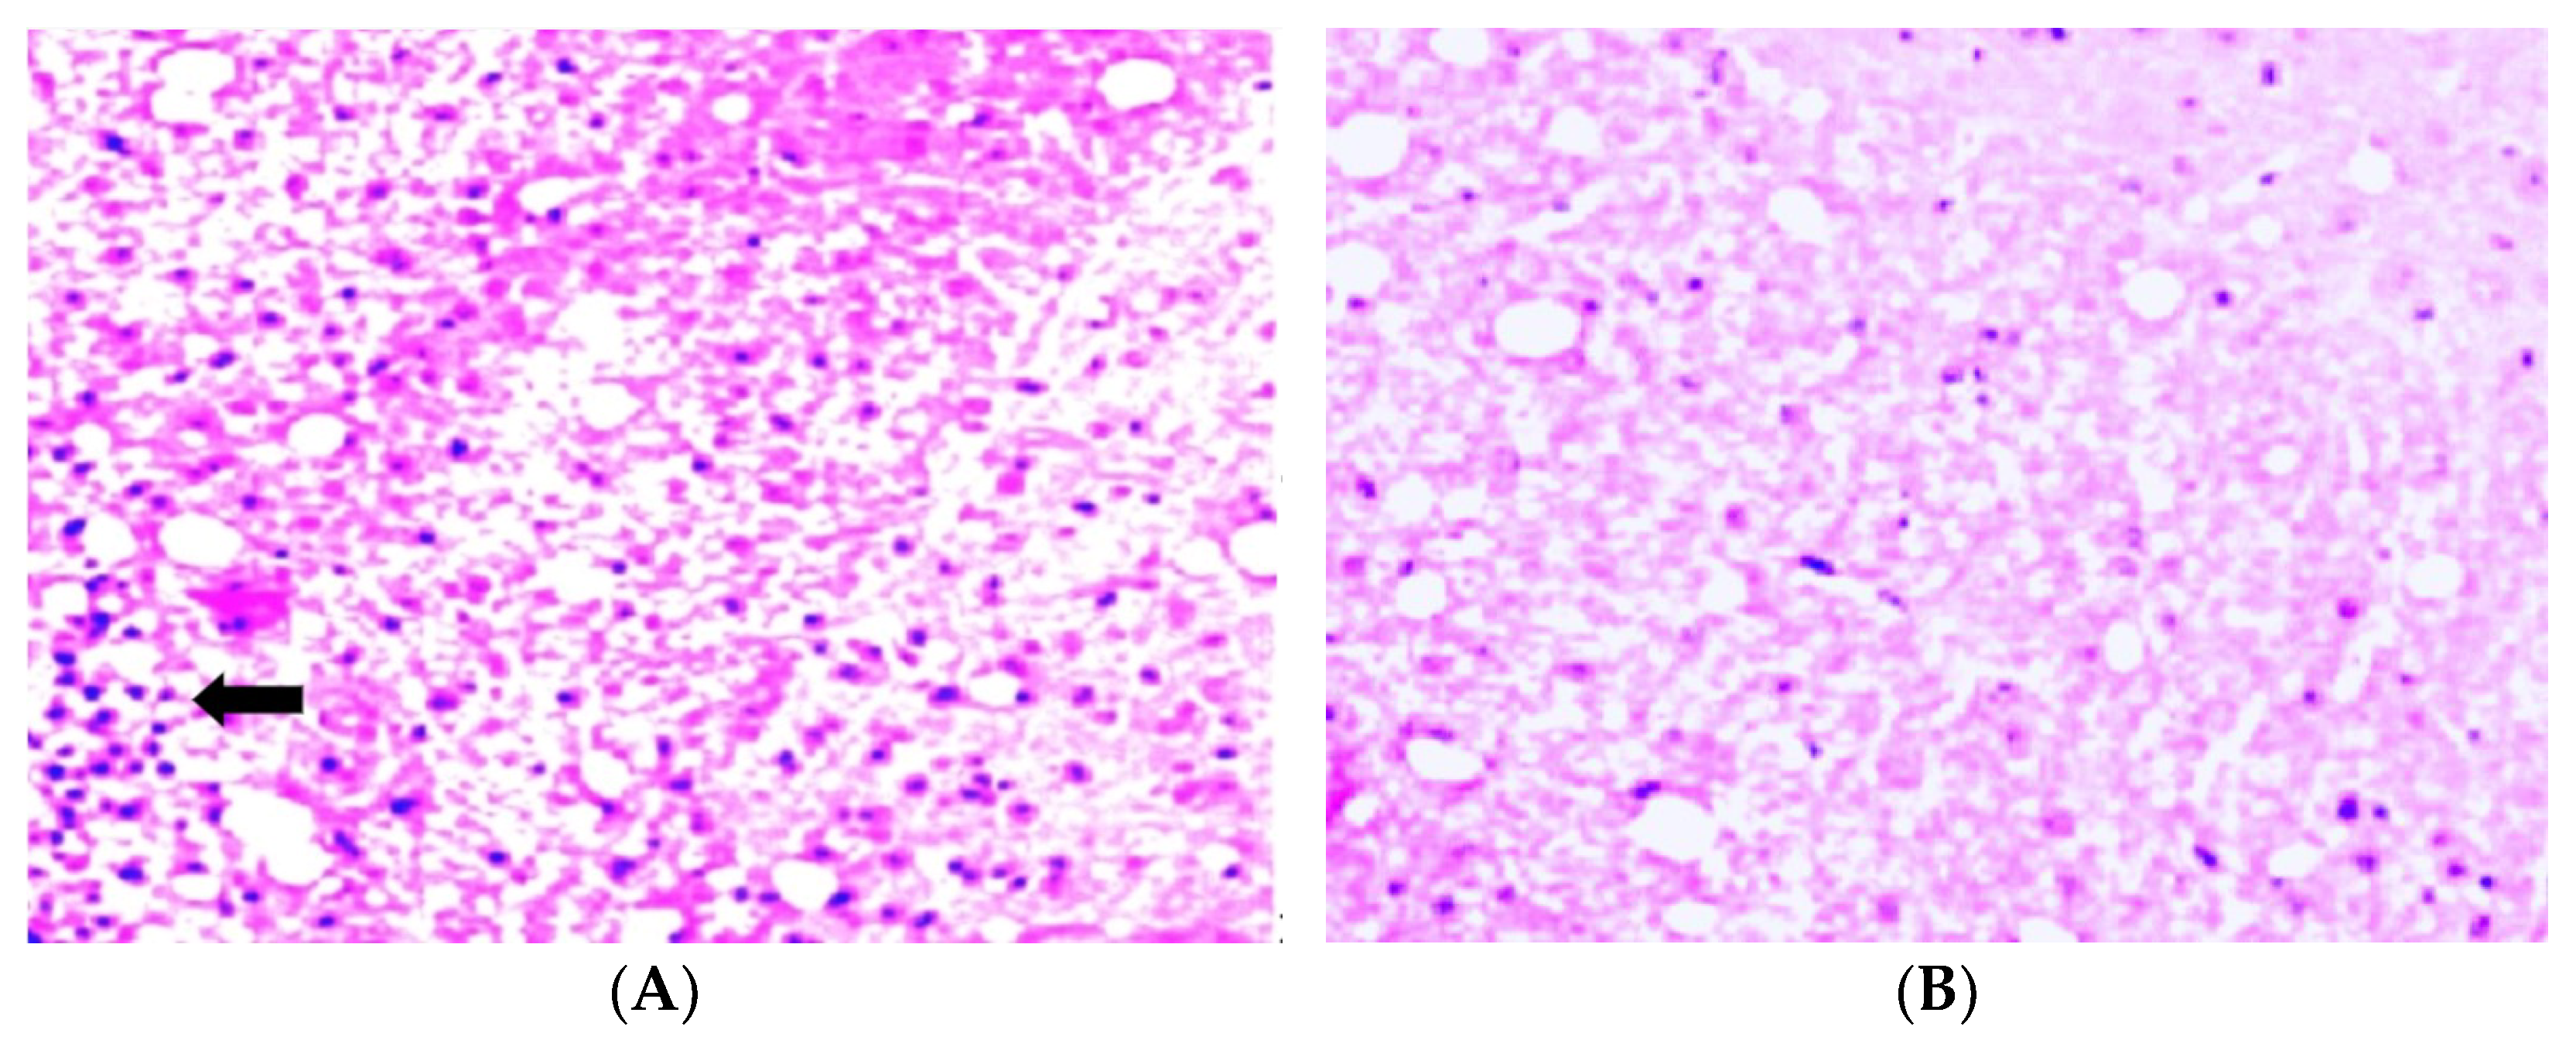
Histological EAE analysis was performed on sections made from the lumbar spinal cords of the EAE-treated and non-treated DA rats prepared on day 12 after EAE initiation. The rats were euthanized, and then each rat was perfused with 4% paraformaldehyde in 0.1 M phosphate buffer. The spinal cord was carefully removed and then immersed in the same fixative. The specimens’ spinal cord lumbar segments were embedded in paraffin, and 5 μm-thick slices were cut with a microtome to be stained and analyzed.
The slices were stained with a standard hematoxylin–eosin (H&E) procedure and visualized using the AxioScope A1 (Carl Zeiss) microscope. Pictures were taken with the Axiocam 305 color camera (Carl Zeiss).
2.6. Collagen-Induced Arthritis (CIA) Model
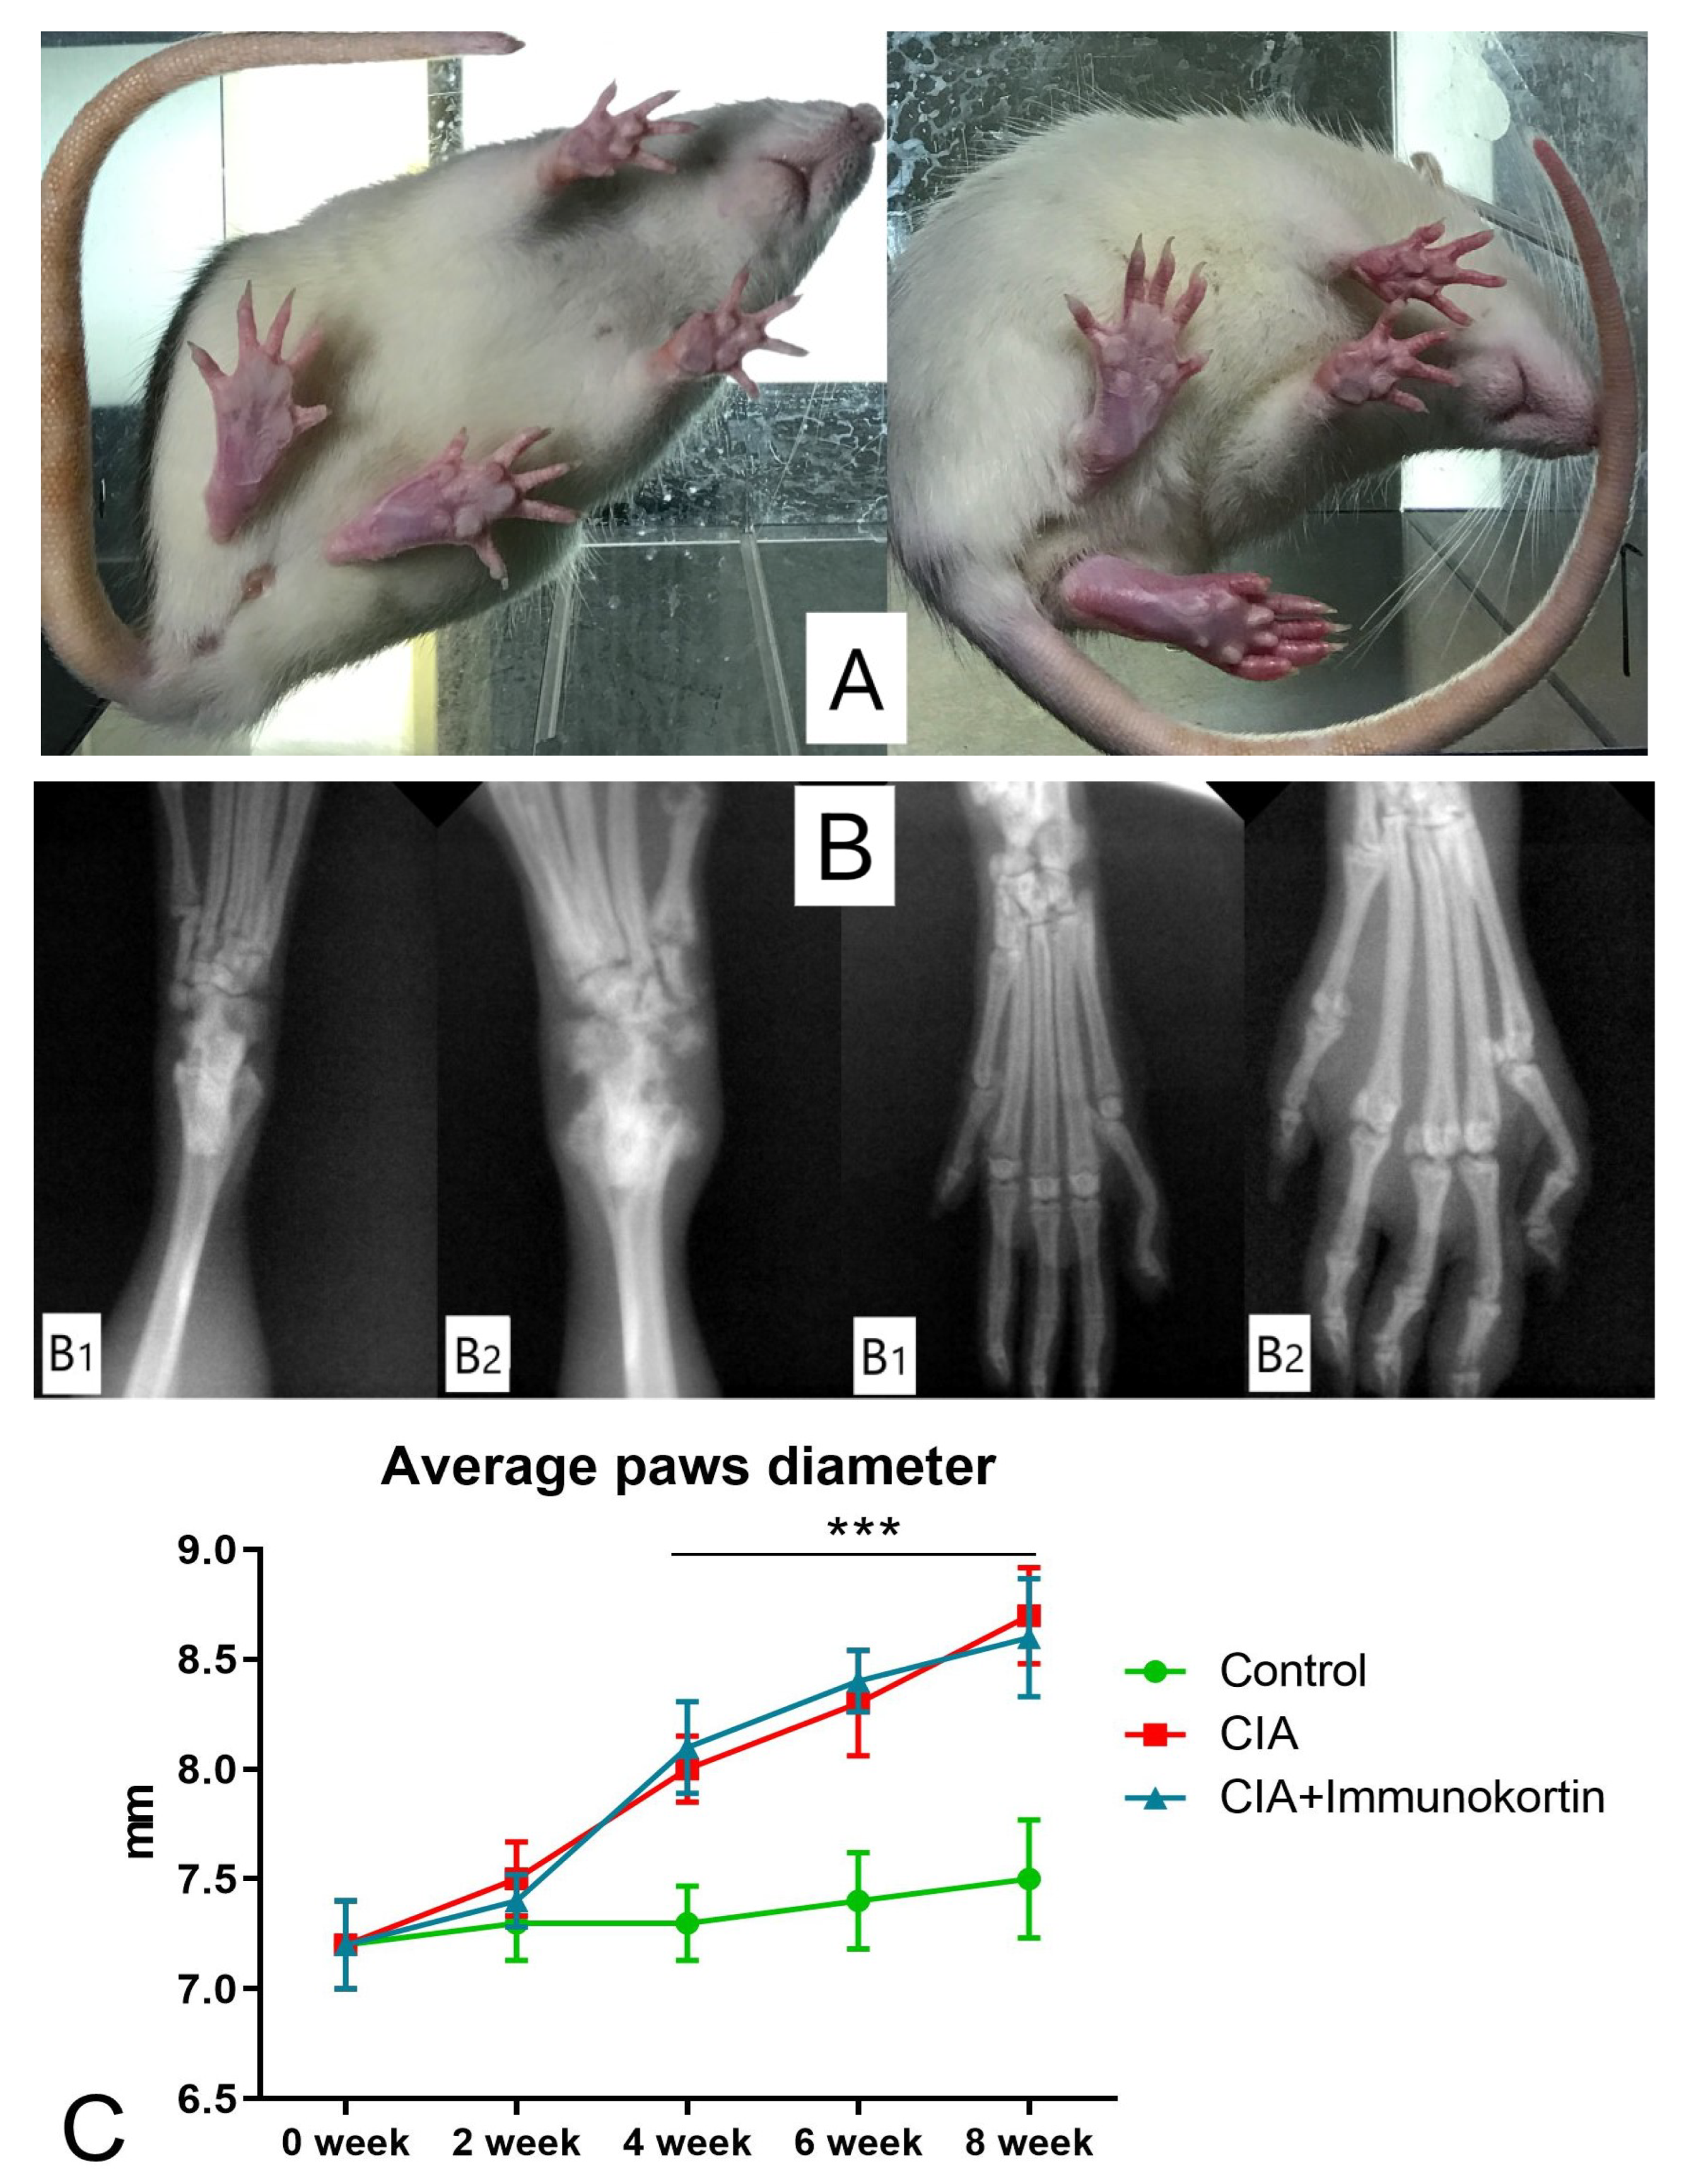
A total of 40 female rats SD, including the control group (n = 8), were taken for the experiment. CIA was modeled by injecting collagen type II. Bovine collagen II was isolated and purified to yield powder in the Pharmkinetics Laboratory at IBCH RAS (Pushchino, Russia). The collagen was dissolved in 0.1 M acetic acid up to 2.5 mg/mL. For the immunization, the collagen solution was mixed with incomplete Freund adjuvant (IFA) at 1:1 ratio (w/v). The prepared emulsion contained collagen II at a concentration of 1.25 mg/mL. The emulsion of 50 μL of collagen II was injected into four places in each animal: twice intradermally to the tail and twice subcutaneously to the back near the tail core. The injections were repeated on the 7th day. The animals in the control group were injected in the same places with the same volumes of sterile saline (0.9% NaCl). CIA was monitored once a day during the experiment for body mass, paw diameter, and clinical signs of manifestation. The paws of the experimental animals were scored as follows:
0—Absence of erythema;
1—Mild redness and ankle or wrist swelling;
2—Moderate redness and swelling of ankle or wrist;
3—Severe redness and the entire paw swelling, including digits;
4—Heavily inflamed limb, with multiple joints involved.
On day 28, the rats that scored above grade 3 were selected and divided into two groups of eight animals, which were subdued for CIA healing either with the tested peptide or saline. CIA treatment with the peptide started on the 4th week with 0.5 mg/mL of the tested peptide solution in sterile saline. The peptide solution was injected once a day at a dose of 500 mcg/animal from the 4th to the 8th week. The paw diameters were measured at weeks 0, 2, 4, 6, and 8 of the study using a digital caliper. The data were used for scoring the clinical signs of CIA in the SD rats.
2.7. Disability Test of Animals with CIA
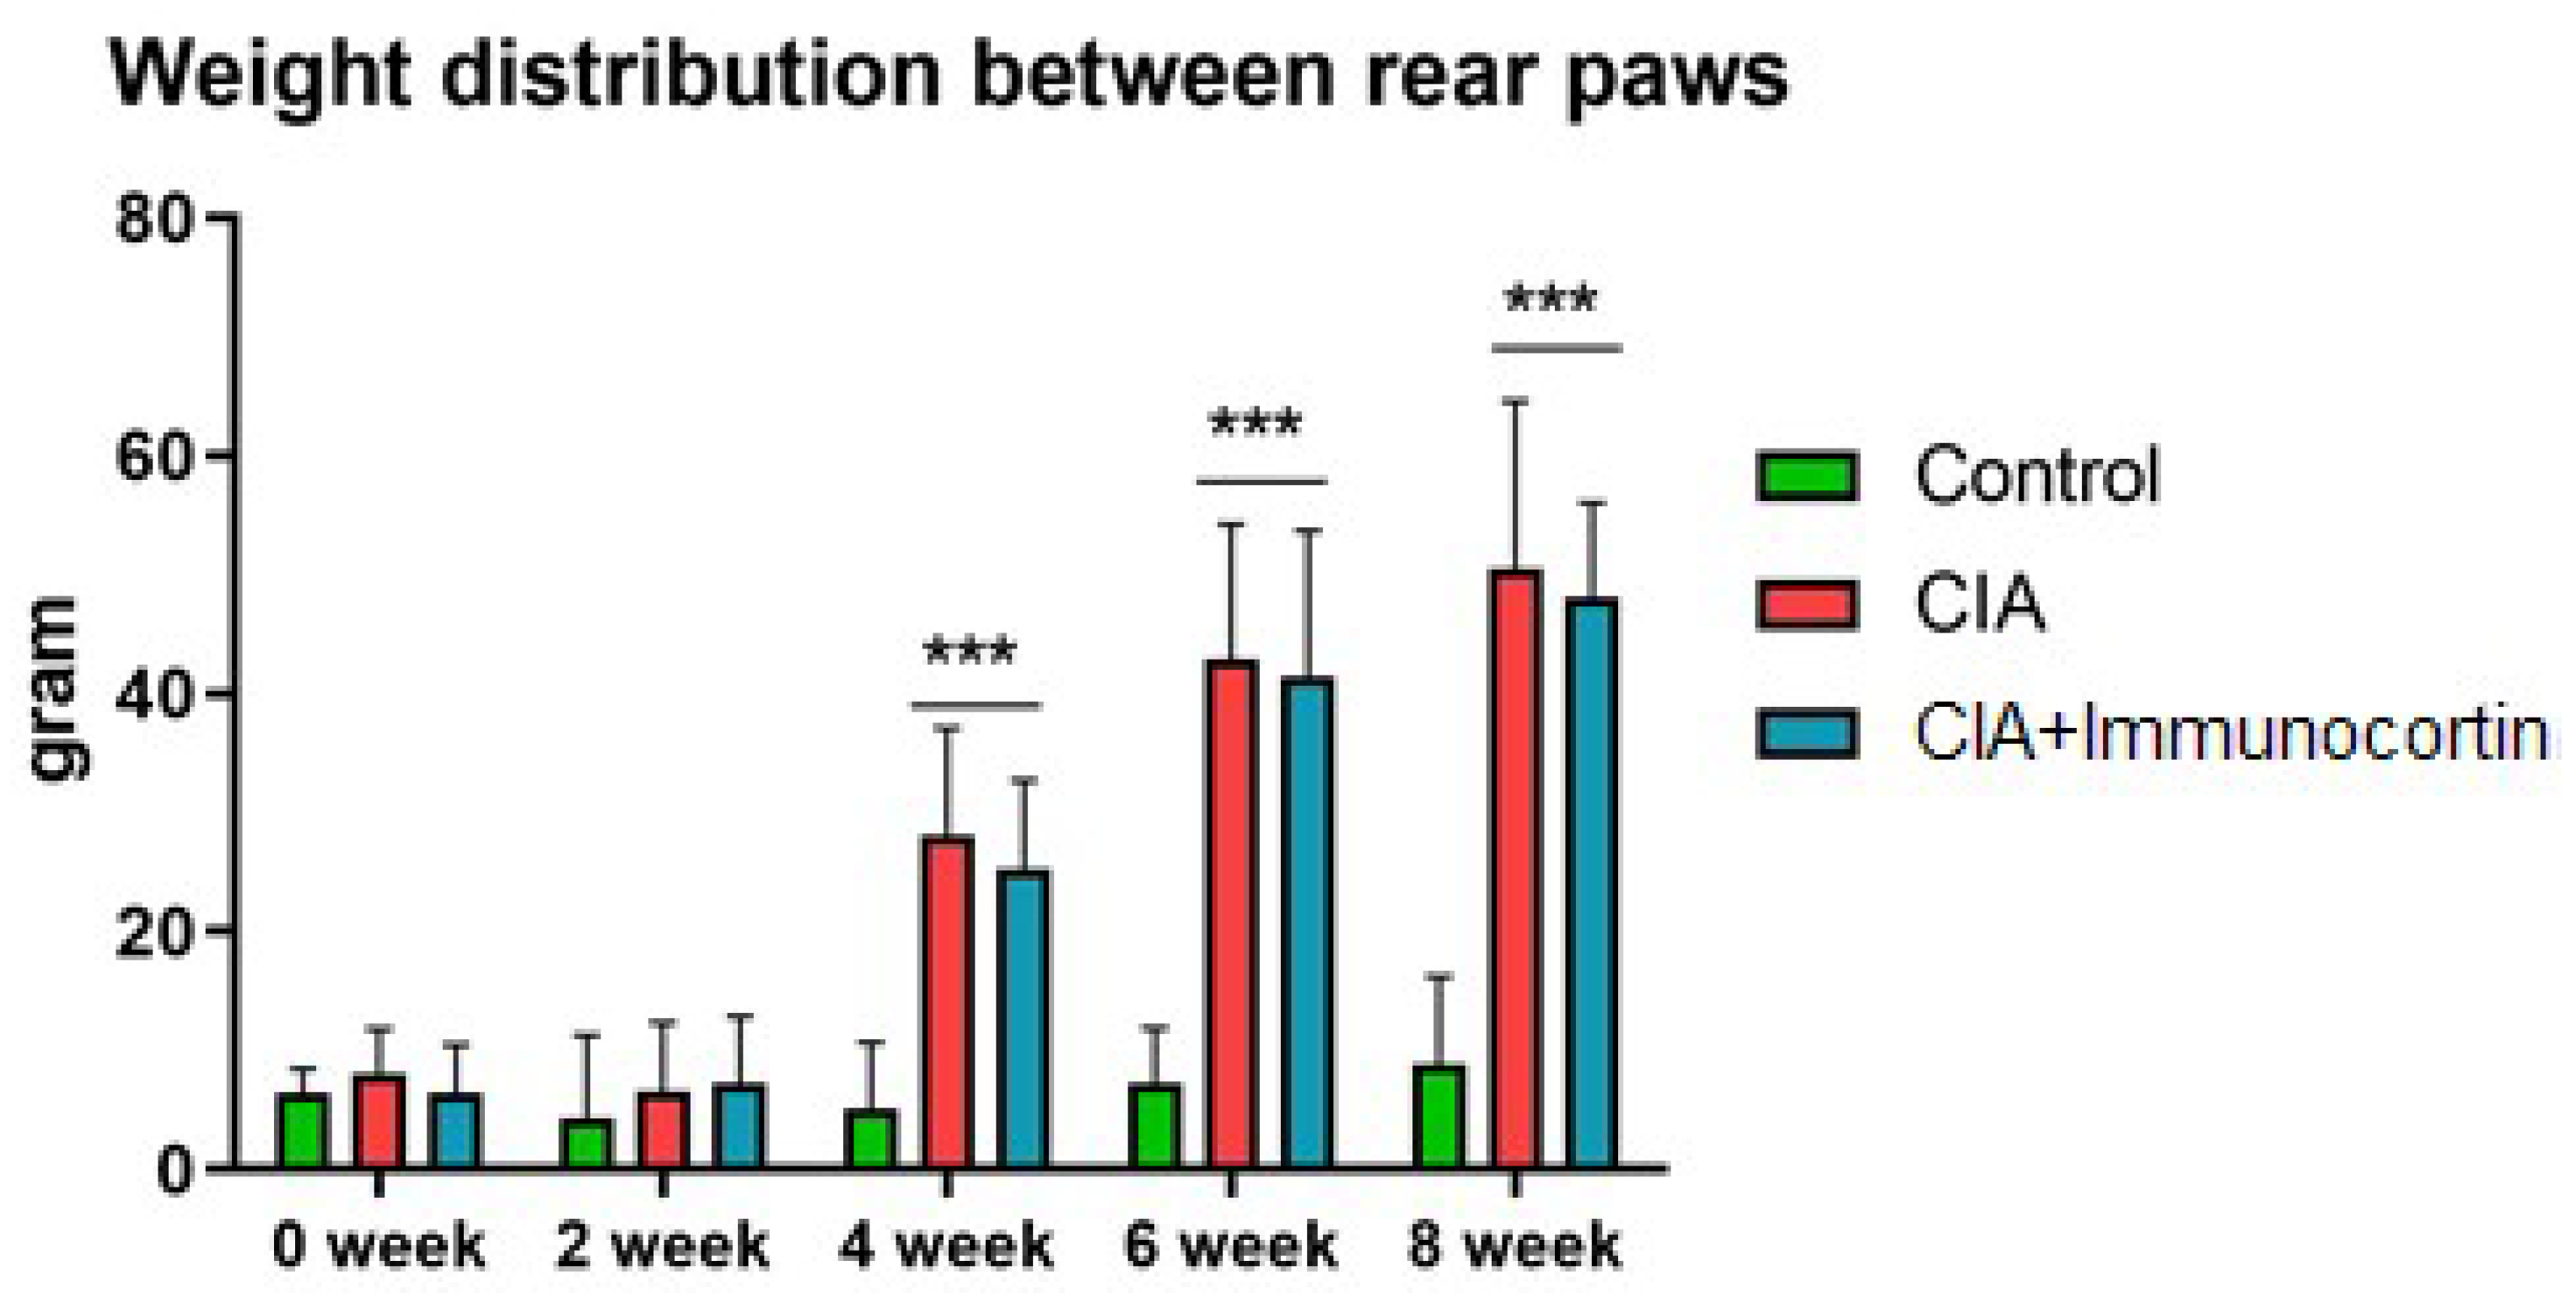
Static pressure was delivered to the animal paws at approximately 0, 2, 4, 6, and 8 weeks (since the study started) with an SWB TOUCH measuring device (Bioseb, Vitrolles, France). The data represent the measurable degree of disability in the animals with CIA with their weight distributed between their injured front paws supported by external bars and injured hind paws placed on the weight detector tabs of the measuring plate. Timely data from each detector were assessed independently as they were displayed on the LCD. The program unit allowed for calculating the average weight put on each paw for the period of time of monitoring.
2.8. DLN Mononuclear Cells
Drained lymph node lymphocytes (DLN mononuclear cells) were extracted from lymph nodes excised from the DA rats on the 7th day after the animals were immunized with homogenate injection emulsified in incomplete Freund adjuvant (IFA, 1:1 w/v). DLN were homogenized with a standard cell homogenizer. Cells with debris were loaded over a Ficoll-formed gradient at room temperature (d = 1.077 g/mL, BioloT, St. Petersburg, Russia) and centrifuged at 400× g for 35 min. DLN lymphocytes were collected from the corresponding zone in the Ficoll gradient, transferred to a fresh tube with Hanks solution, and then centrifuged at 400 g for 10 min. The procedure of cell washing with Hanks solution was repeated twice. Viable cells were counted with Trypan blue with the use of simple light microscopy (Mg × 400). DLN lymphocytes were cultivated in complete DMEM medium with 2 mM-glutamine, 2 mM Na+-pyruvate, 20 mM β-ME, 40 mcg/mL gentamycin, and 10% fetal calf serum (HyClone, Logan, Utah). The media and chemicals for cell culturing were purchased from Sigma-Aldrich (St. Louis, MO, USA).
2.9. Flow Cytometry
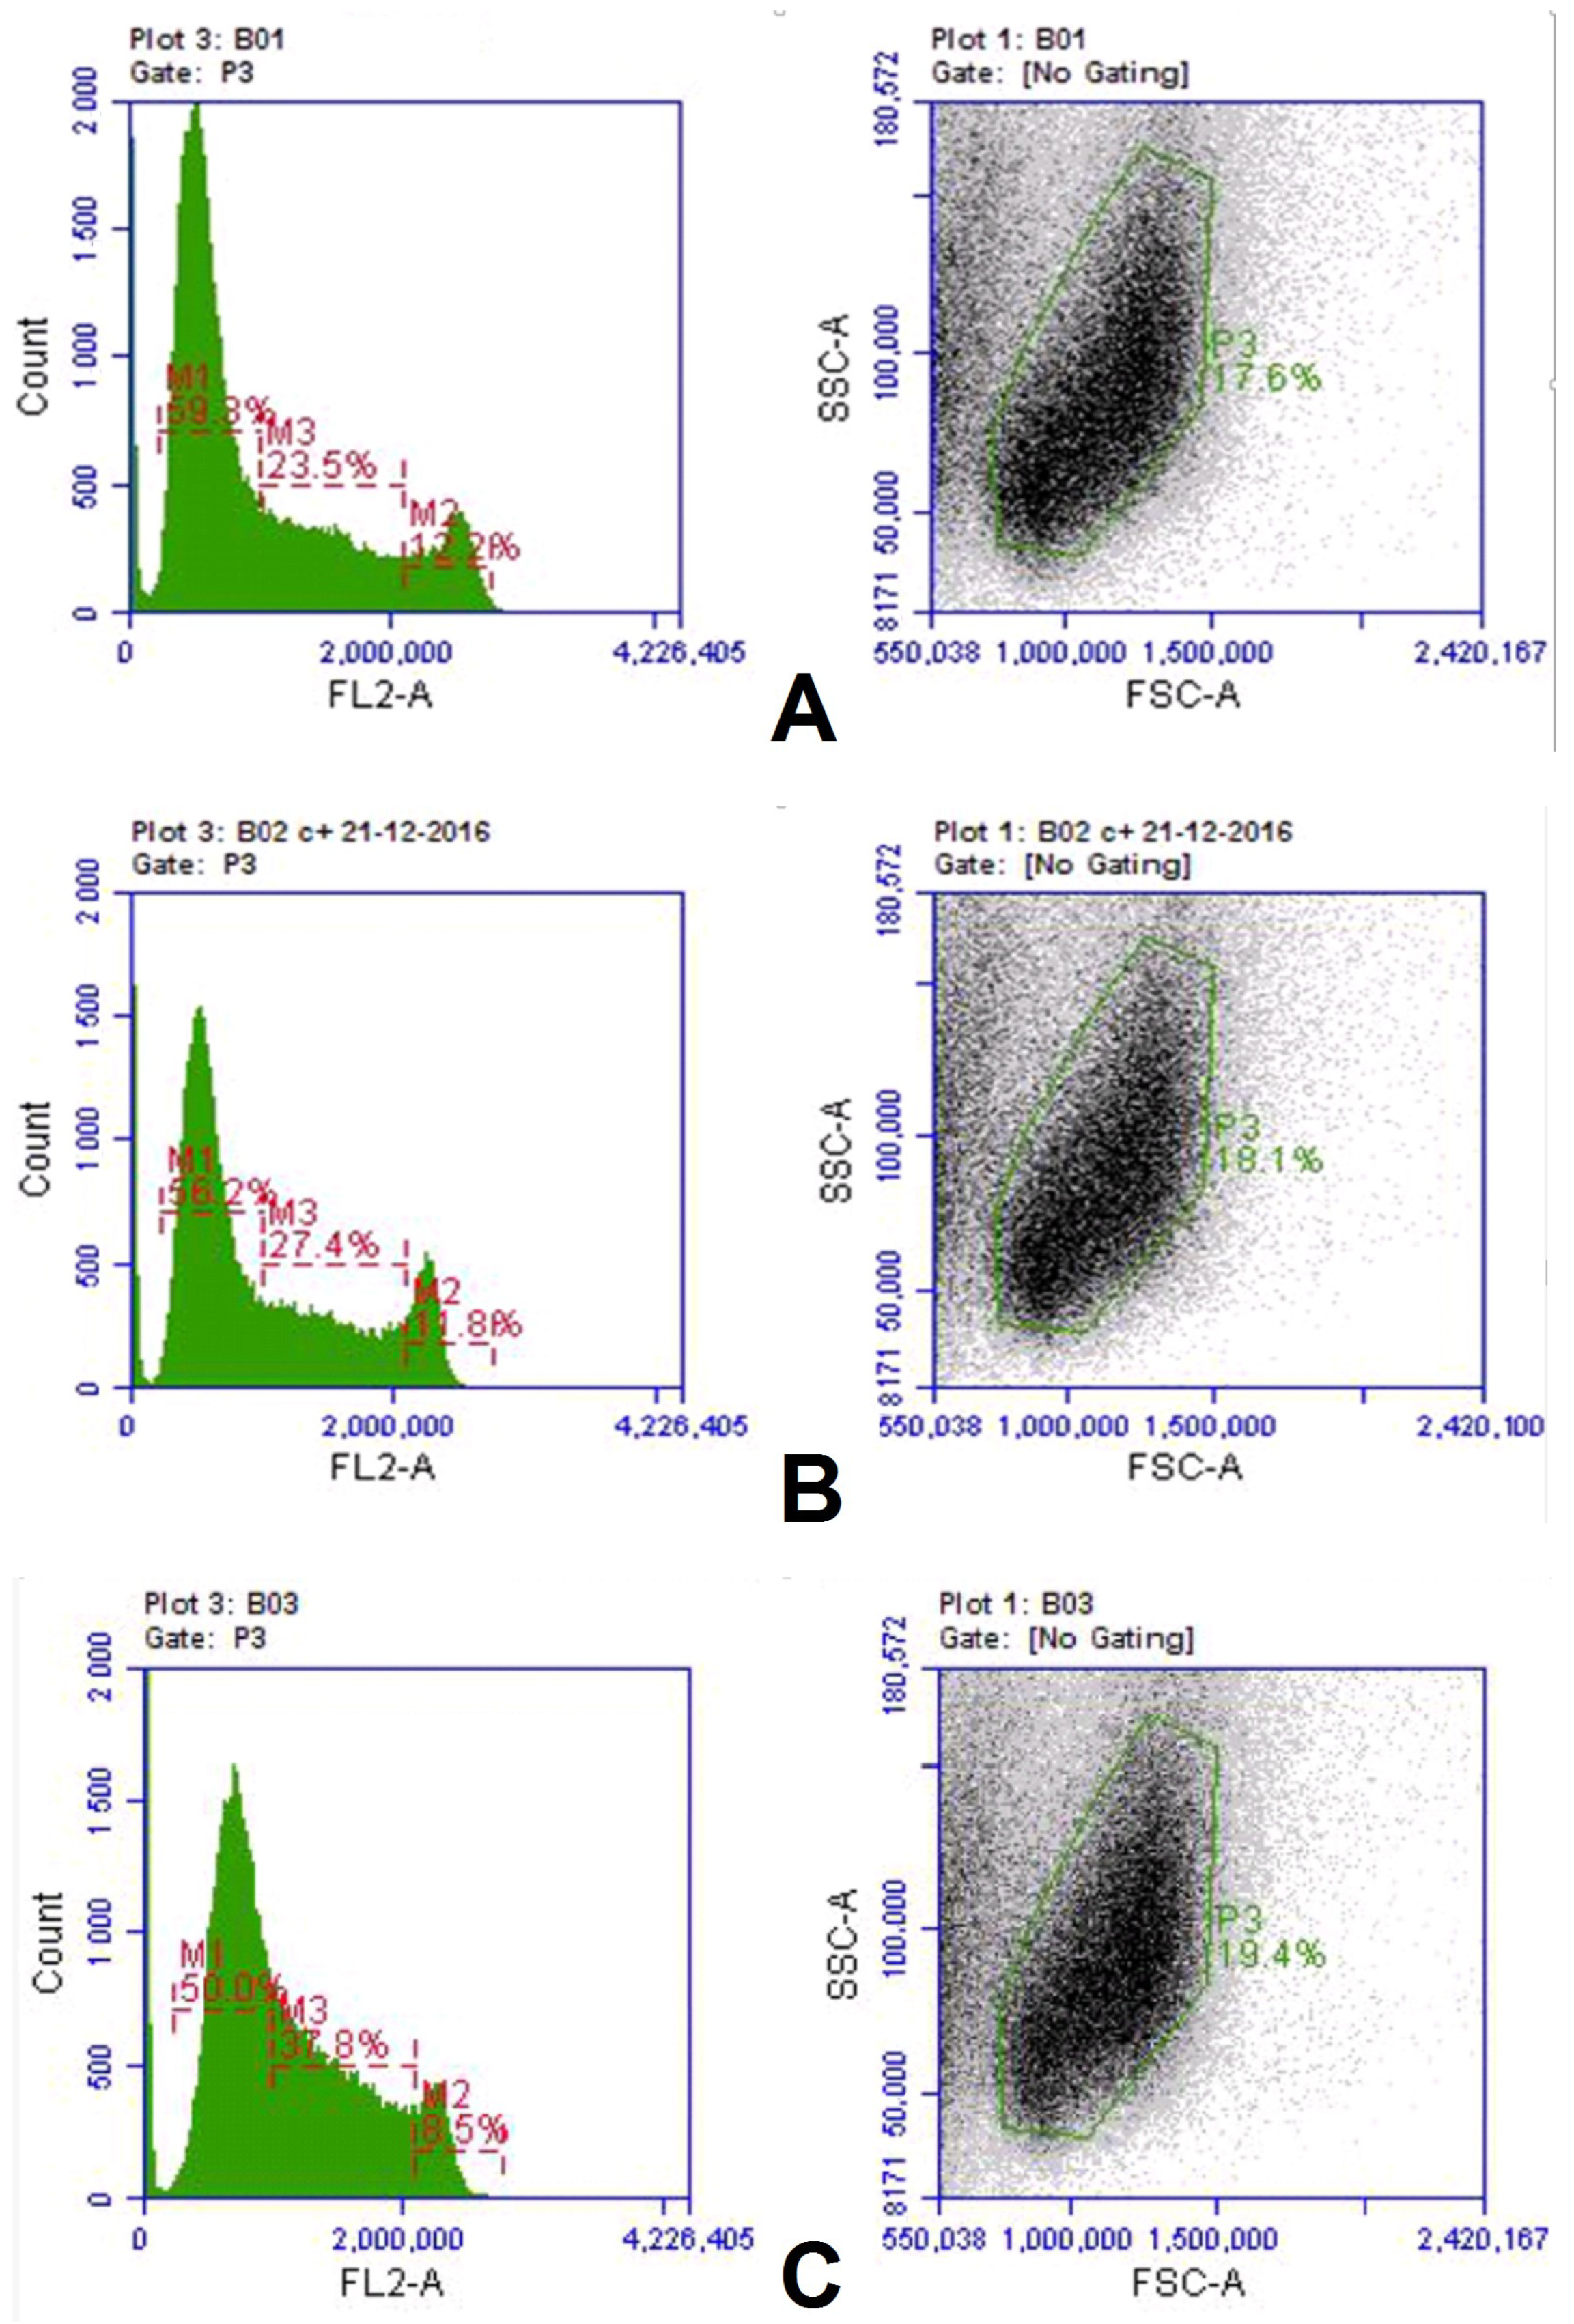
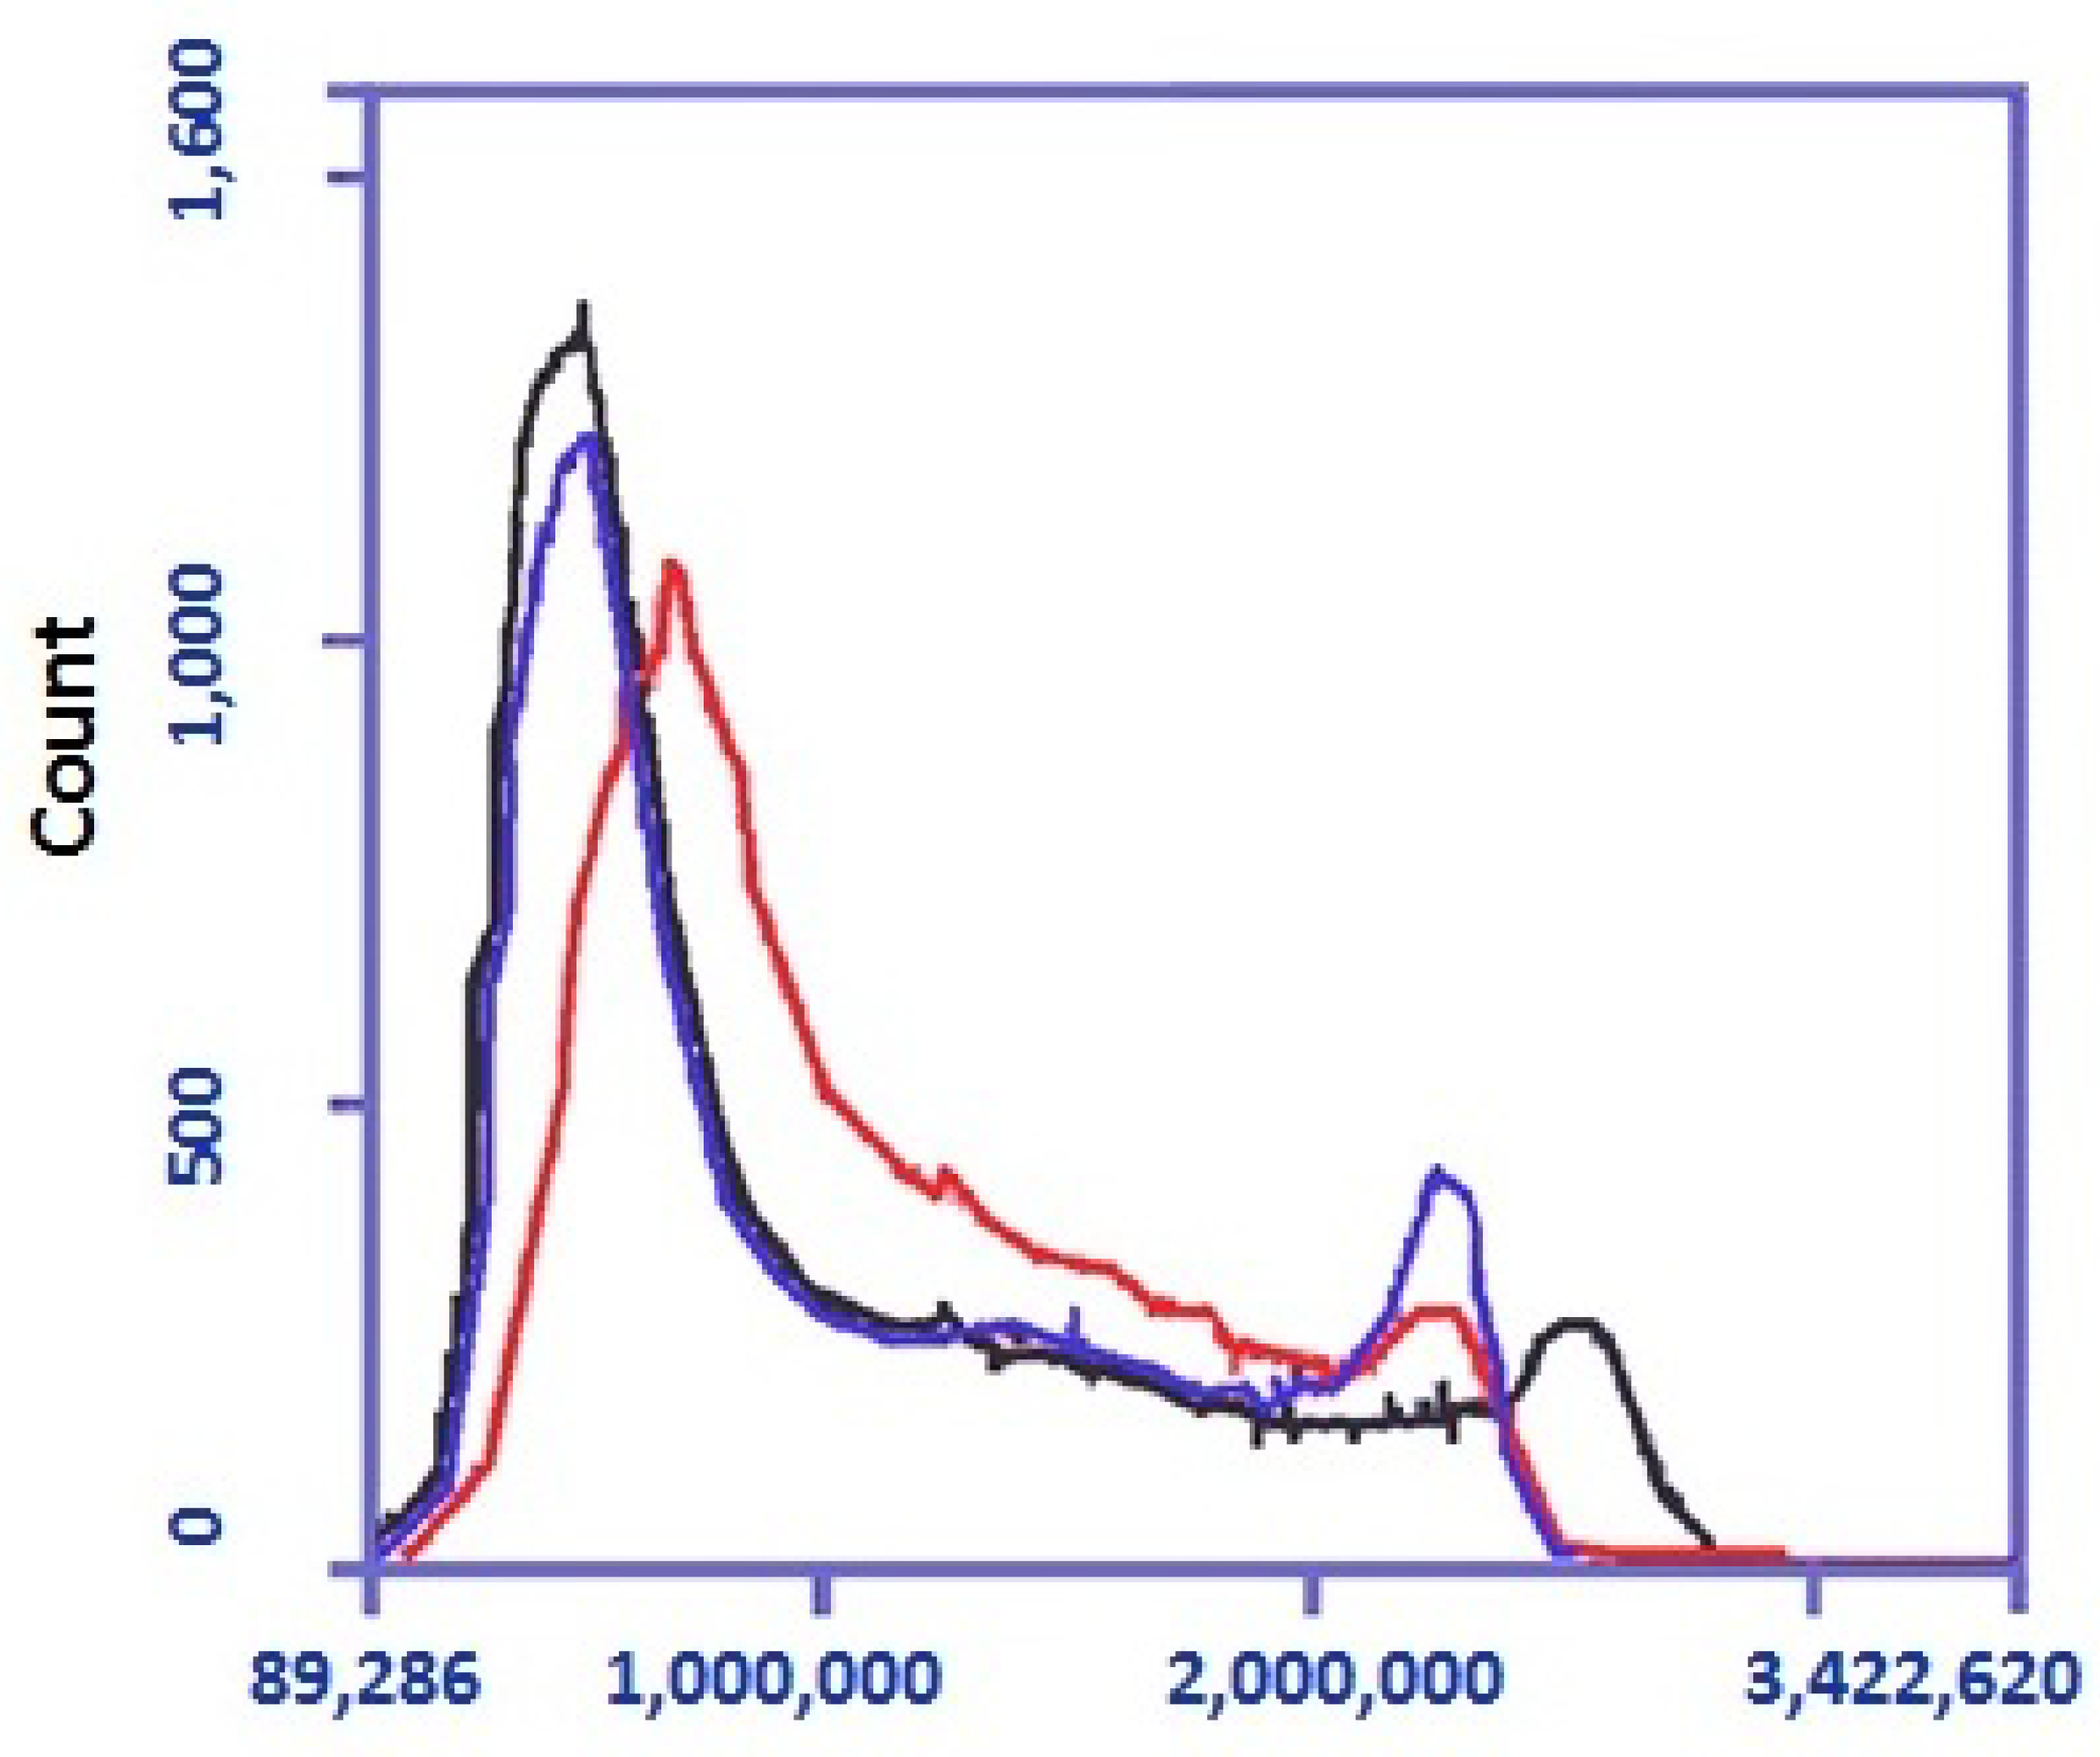
pCav3 peptide can affect the fractions of cells at the G1, G2 + M, and S phases of the cell cycle, which results in characteristic changes of the data on lymphocyte proliferation. The DNA quantity in the cells was studied with the Accui 3C (Japan) cytofluorimeter. DLN leukocytes, extracted from the DLN of the DA rats (5 × 10⁶ cells/), were stimulated either with ConA (5 µg/mL) or ConA+pCav3 (10 mcg/mL) and then incubated in a 5% CO2 atmosphere for 48 h at 37 °C. The DNA was stained with vital dye SYBR-GREEN I (1:10,000 dilution) before it was assessed in the cell population with the Accui 3C. The data on the DLN lymphocytes distributed by the DNA per cell load were used to compare the DNA/cell numbers after exposure to pCav3 peptide or to the carrier. The Accuri 3C cytofluorimeter (Japan) was used to measure DNA fluorescence for DLN lymphocyte of at least >3 × 10⁶ per sample. The data were used to locate the cells at the G1, S, and G2 + M stages of the cell cycle (CCP) to determine the cell number for the M2 fraction, which included cells with fluorescence (FL2-A) above 2,100,000 per cell. Further analysis was conducted according to the Accuri 3C manufacturer’s recommendations for preinstalled subroutines.
2.10. Lymphocyte Proliferation by MTT Test
The potency of the studied peptide to inhibit lymphocyte proliferation was assessed by an MTT test. DLN leukocytes from the DA rats immunized with homogenate injection were seeded at 2.5 × 10
5 cells/mL (5 × 10
4 cells/well) in a 96-well plate and stimulated with ConA (5 mcg/mL) to be further exposed to different concentrations of the testing peptide for 48 h. Th cell number per well was assessed with MTT reagent, which could develop a colored derivative inside the living cells only. The optical density of each well was measured with a plate reader at 550 nm. MTT protocol with some modifications was used [
35]. The peptide to be tested was dissolved in cell media with 1% DMSO. Then, 10 μL of the tested peptide solution (1 μg/μL) was added to the experimental well containing 50,000 cells/200 μL. Two-fold serial dilutions were prepared using 100 μL of media with peptide transferred to a fresh well preloaded with 25,000 cells/100 μL and located in the next row on the plate. Plain media (100 μL) was used to fill up the well volume to 200 μL. Finally, the highest plate peptide concentration was 25 μg/mL, which decreased by half in each subsequent row of wells. The plates were incubated in a humidified incubator at 37 °C, 5% CO
2 for 48 h. Then, 15 μL of MTT solution 5mg/mL was added to every well, and then the plate was returned to the incubator for another 3 h. The plates were centrifuged at 3000×
g rpm (850 g) for 30 min at 6 °C in a refrigerated centrifuge (Sigma, Ronkonkoma, NY, USA). Supernatants were aspirated from the wells and 100 μL of DMSO was added to each well. The plates were slowly rotated on an orbital shaker at 50 rpm at room temperature for 5 min. The optical density of the wells was measured at 550 nm with the SpectraCount plate reader (Packard, Detroit, MI, USA). The ratio of the sample OD
550 to the control (untreated cells) was calculated and presented as a percentage of the control. The data reflect the cell proliferation rate per well. The peptide concentrations were performed in triplicate, and the experiment was repeated several times.
2.11. Statistical Analysis
The data were analyzed with Microsoft Excel (descriptive statistics) and Statistica v.7.1 for Windows. The data on EAE were confirmed with the Kruskal–Wallis and Kholmogorov–Smirnov tests at p < 0.05 and then further analyzed with one-way ANOVA (HSD) at p < 0.05. A post hoc Tukey’s honestly significant difference procedure performed pairwise comparisons using the ANOVA data set. The F statistic accounted for the overall differences among the sample (n) means (Mn). Tukey’s HSD test determined if a significant difference between the various pairs of means was possible at the chosen significant level. The data on the CIA model were analyzed for two sexes separately. The repeated results were analyzed with a single-factor dispersion analysis (ANOVA). The quantitative results of the disability test were evaluated with non-parameter Mann–Whitney criteria (U-test). Illustrations were produced with GraphPad «Prism v.5 and Prism v.5.04» software. The data values displayed mean ± SEM values; the volume of each group of animals used in the EAE experiment was n = 6; the volume of each group used in the CIA experiment was n = 8.
4. Discussion
We investigated synthetic peptide pCav3 corresponding to the C-terminal part of caveolin-3 in vitro and in vivo. We found that pCav3 injected into DA rats daily was effective against the development and acute phases of EAE—a model of autoimmune disorders, such as MS in humans. Peptides from caveolin-3 and immunocortin demonstrated an ability to interfere with propagating ConA-stimulated DLN lymphocytes extracted from DA rats on the ninth day after they were primed with homogenate injection. Given the known ability of immunocortin to reduce EAE scores in DA rats, we tried but failed to reveal the least measurable effect of immunocortin on CIA induced in SD rats. That experiment was set up by following the OECD recommendations, which claim that DA rats have too-complex immunological responses and are not recommended by the OECD to model CIA in preclinical studies. Following this recommendation, we had no choice but to use a different rat strain—SD rats, which is recommended by the OECD to model RA in the form of CIA for preclinical trials. Interestingly, this line of rats was previously genotyped with an f-type of the MHC RT1 locus that is different from DA rats. Overall, CIA has been established with collagen II immunization in Wistar, Sprague–Dawley, and Wistar–Lewis rats, mice, and some other primates [
25,
26]. In preclinical trials, CIA has been used for modeling rheumatoid arthritis (RA) in rats, since CIA and RA have the same main immune-pathological features. Nevertheless, susceptibility to CIA established in different kinds of animals is linked to the MHC type: CIA in mice is heavily directed by the MHC type, while CIA in rats is less sensitive to the genetic base. Despite the variety of rat strains bearing different MHC types that are susceptible to collagen II-induced arthritis, the incidence rate, magnitude of symptoms, and CIA severity could be different. This also includes antibodies and the scope of the T-cell reactive epitope specificity [
28,
29,
30].
It is accepted that naïve T cells interact with dendritic cells, or antigen-presenting cells (APCs) are set to engage T-cell activation. During this process, the antigen is upregulated by APCs for processing, so the antigen fragments are then exposed to the APC cell surface in the form of an antigen-MHC-I complex (Ag-MHC-I). Complimentary structures of T-cell antigen receptors (TCRs) can also recognize Ag-MHC structures, forming an Ag-MHC-II/TCR triple immune complex (Signal-1). Accomplishing T-cell activation requires Signal-2 to happen, which is featured by stimulatory molecular complexes formed in the APC/T cell contact areas [
36]. Inflammatory-like responses can be developed as a result of Signal-2 expansion via co-stimulatory molecule interaction during T-cell activation [
37,
38]. Both of the signals (Signal-1 and Signal-2) shape the so-called structure of immunological synapse (IS) [
39], which involves the lateral translocations of Signal-1- and Signal-2-related complex structures, as demonstrated previously on MHC-II/p/TCR and ICAM-1/LFA-1 complexes [
40,
41]. Data point to the MHC-II/p/TCR complexes of Signal-1, situated in the periphery of Signal-2-related structures [
39]. Yet, they can swiftly move from the peripheral area to the center to form another characteristic structure of the central supramolecular activation complex (cSMAC), which marks T-cell activation, influencing immune reaction development.
MS and RA have some factors in common, since RA is also spread over the world and affects roughly 1% of the human population [
42]. Therefore, in clinics, MS and RA share some general treatments for what are considered common problems of autoimmune disorders with unknown exact causes [
43]. The recognition of genetic predisposition to developing autoimmune disease is one of the major factors that should be taken into consideration, given that the prevalence of disease may vary in different populations. For instance, the native tribes of North America are predisposed to MS much less compared to RA [
44]. It was noticed that females are more susceptible to RA than males (with a ratio above 2:1), which indicates a possible role of hormones in RA pathogenesis [
45].
Since EAE in DA rats was proven as a common model of human auto-immune demyelinizing neuropathy, the results of EAE treatment with pCav3 support this peptide as a candidate for drugs to be evaluated as a possible treatment for auto-immune diseases, including Guillain–Barre syndrome, RA, or MS in humans. Symptoms of autoimmune response are shaped by autoreactive T cells, activated in response to a specific antigen, so the overall outcome is driven by the balance between coexisting but opposite processes: the propagation of antigen-specific T cells (AST) while eliminating AST cells. Some compositions are known to affect both EAE and CIA at the same time [
46]. Based on this information, this rationale could be used for testing the ability of immunocortin-class peptides to affect the scores of not only EAE but also CIA, considering the peptide activity based either on a shifting immune cell balance or resulting from a genuine antigen restriction process. It was shown previously that impaired recovery from EAE could result from the used apoptosis inhibitors responsible for suppressed inflammatory cell apoptosis [
47]. At the same time, the induction of autoreactive T-cell apoptosis diminished the EAE symptoms [
48,
49]. Furthermore, a study reported that floral extract kirenol was capable of inhibiting mature antigen-specific T-cell survival; namely, it could raise the number of naive T cells by lowering the number of effector/memory T cells and then inducing the cell apoptosis of lymphocytes extracted from the drained lymph nodes of kirenol-treated animals [
50].
The use of immune-modulating peptides for the treatment of autoimmune disorders minimizes the threat of forceful depletion of the immune system from the main immune cell subpopulations. This is contrary to the common side effects observed as a result of contemporary drugs used to treat MS in clinics, including recombinant cytokines or humanized antibodies (hAb) developed against cell-surface antigens. It is noteworthy to point out that peptide-based drugs could be safer by helping to avoid leucopenia development. Indeed, immune-modulating peptides could minimize the magnitude and rate of side effects due to rapid turnover and limited cell penetration ability. Complex preclinical and toxicological trials are further required to fully assess the prospects of pCav3 and immunocortin for use as a novel medication to treat autoimmune disorders.
5. Conclusions
A novel peptide pCav3 was located in the C-terminus of the Cav3 region and found to be highly homologous to the immune-modulator peptide immunocortin.
Both the structures of pCav3 and immunocortin, used for molecular docking, provided the peptide ligand binding energy necessary after peptide was placed within the triple auto-immune MHC/P/TCR complex.
Synthetic peptides of pCav3 and immunocortin demonstrated similar activity on EAE in DA rats immunized with horde_homogenate.
In addition, the synthetic peptides of pCav3 and immunocortin demonstrated similar anti-proliferative activity on DLN lymphocytes extracted from the DA rats primed with horde homogenate injection.
Immunocortin failed to influence on the CIA scores in SD rats.
Since immunocortin performed differently on two distinct models of autoimmune diseases, we assume that the OECD recommendations for avoiding DA rats to model CIA in favor of SD rats require further consideration. The results could be influenced by the fact that DA and SD rats aregenetically different by their genomic sequences in the MHC RT1 loci. The RT1 locus directs MHC protein expression, providing antigen recognition and structure restriction, which greatly shape the immune response seen during EAE and CIA modeled in rats.
It was concluded that immunocortin could interact differently with MHC proteins expressed by distinct MHC RT1 loci.
Further considerations are required for using DA rats for combined or comparative studies of the CIA and EAE treated with the same drug.

 ,
, 


