

COVID-19 in Infants and Children under 2 Years—Could Lung Ultrasound Score Be Correlated with Biomarkers and Symptoms?

 , , , ,
  , , , and
Abstract
:1. Introduction
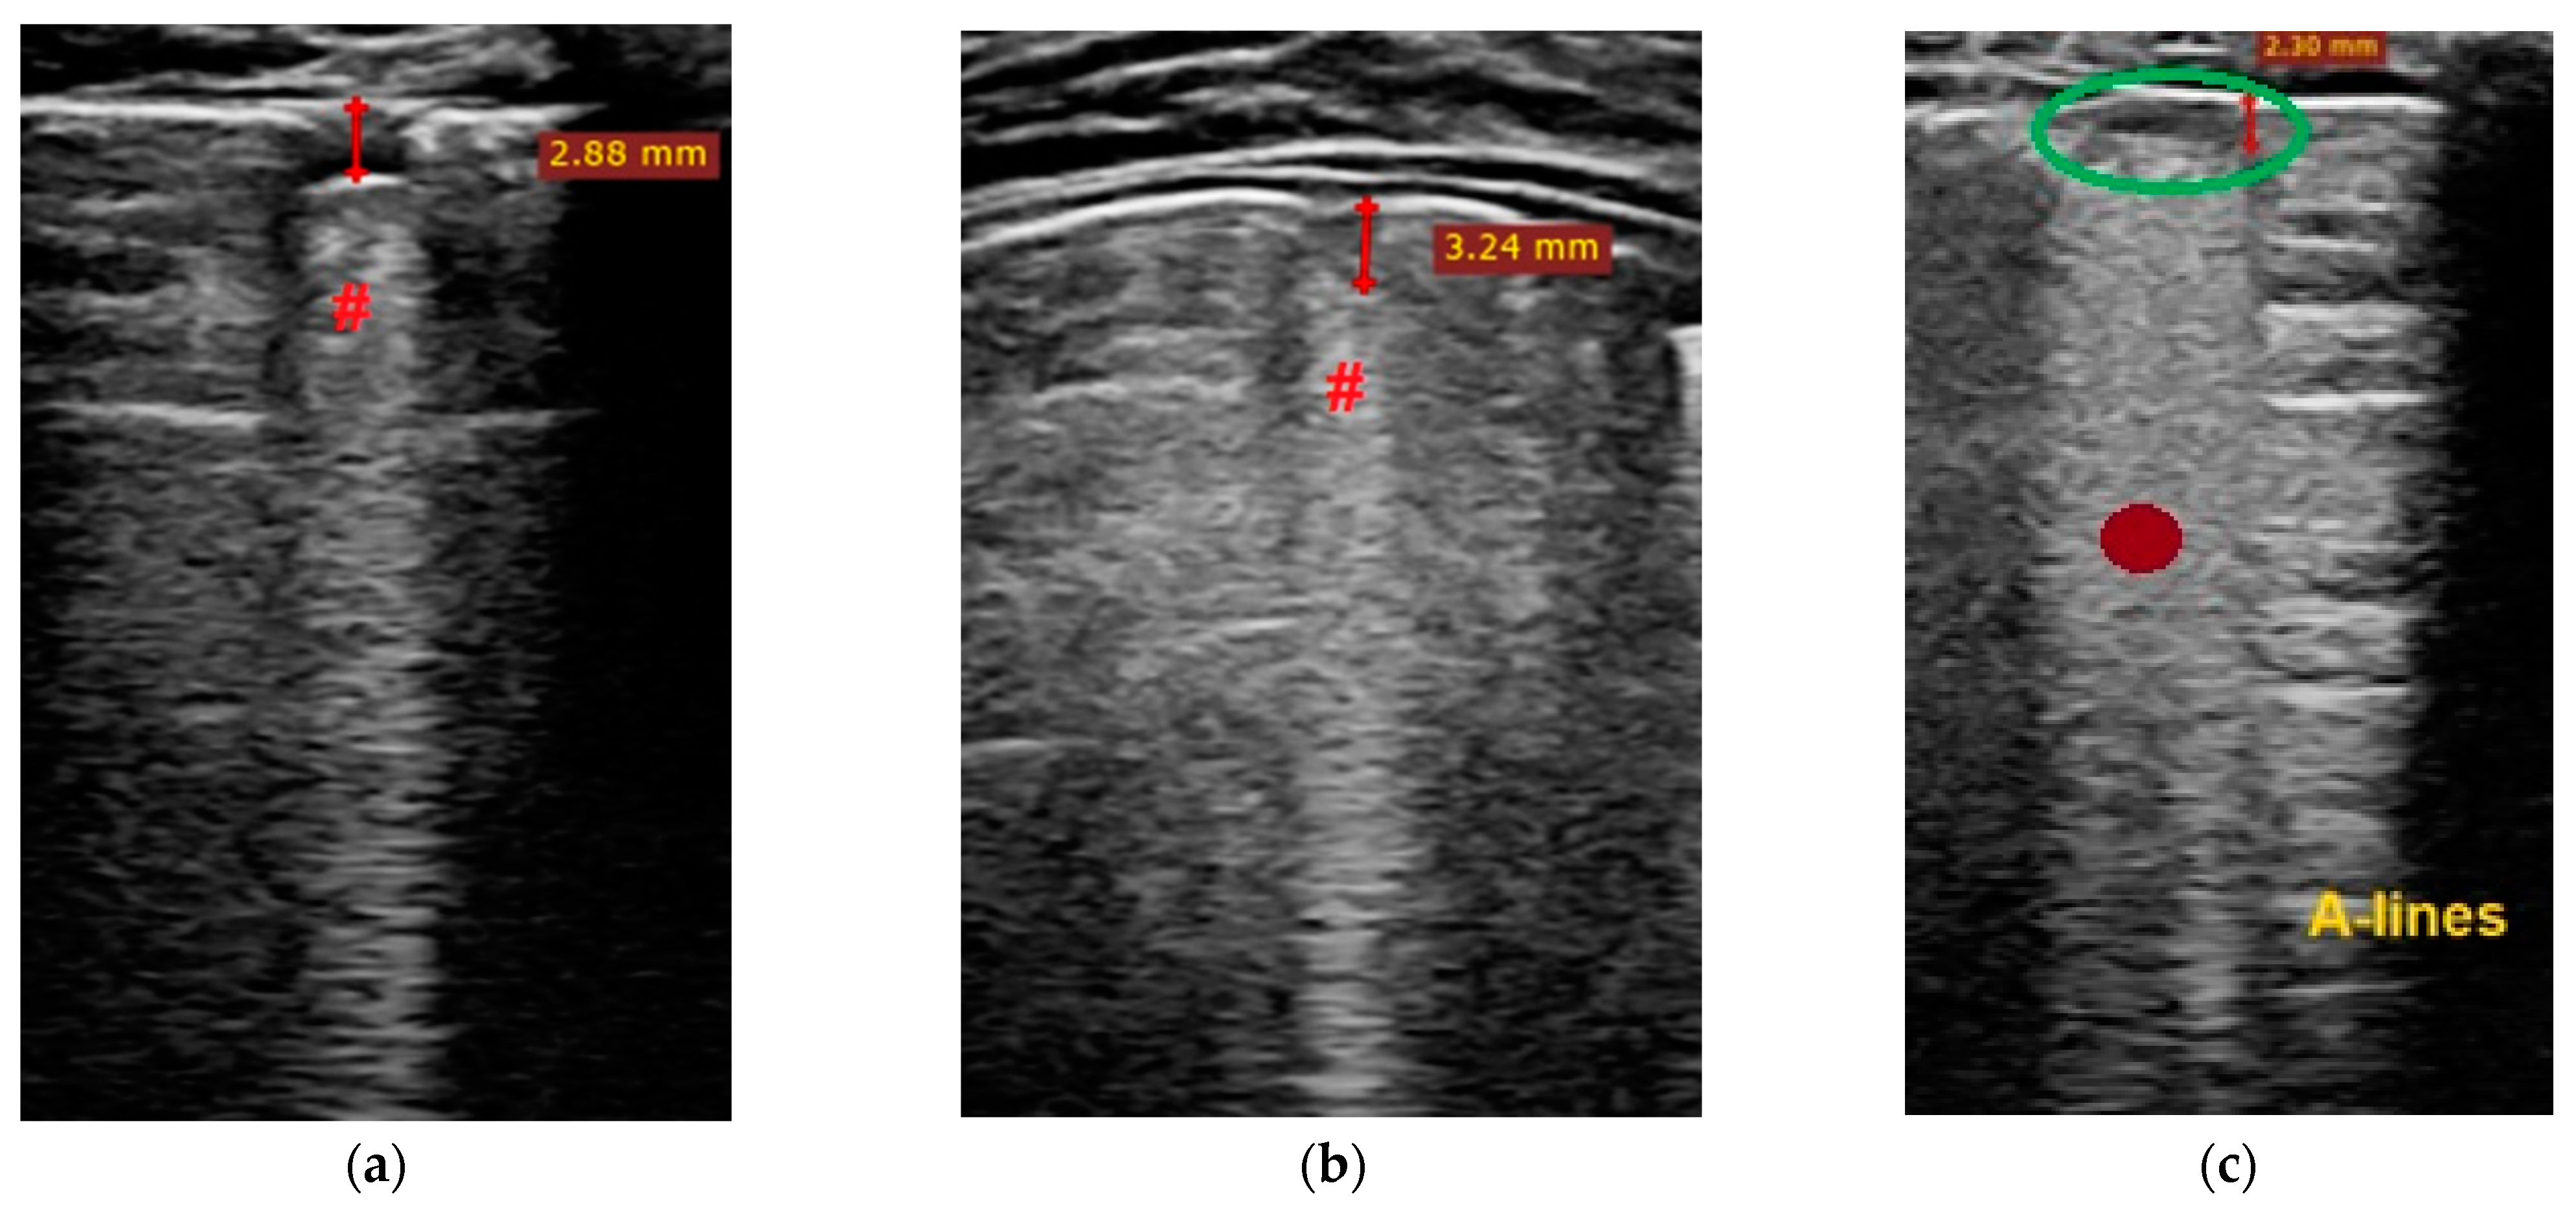
- Transverse physiologic A-lines that depict healthy parenchyma;
- Isolated/sparse vertical B-lines are equivalent to interstitial edema;
- Confluent vertical B-lines correspond to alveolar edema;
- Subpleural/peripheral consolidations;
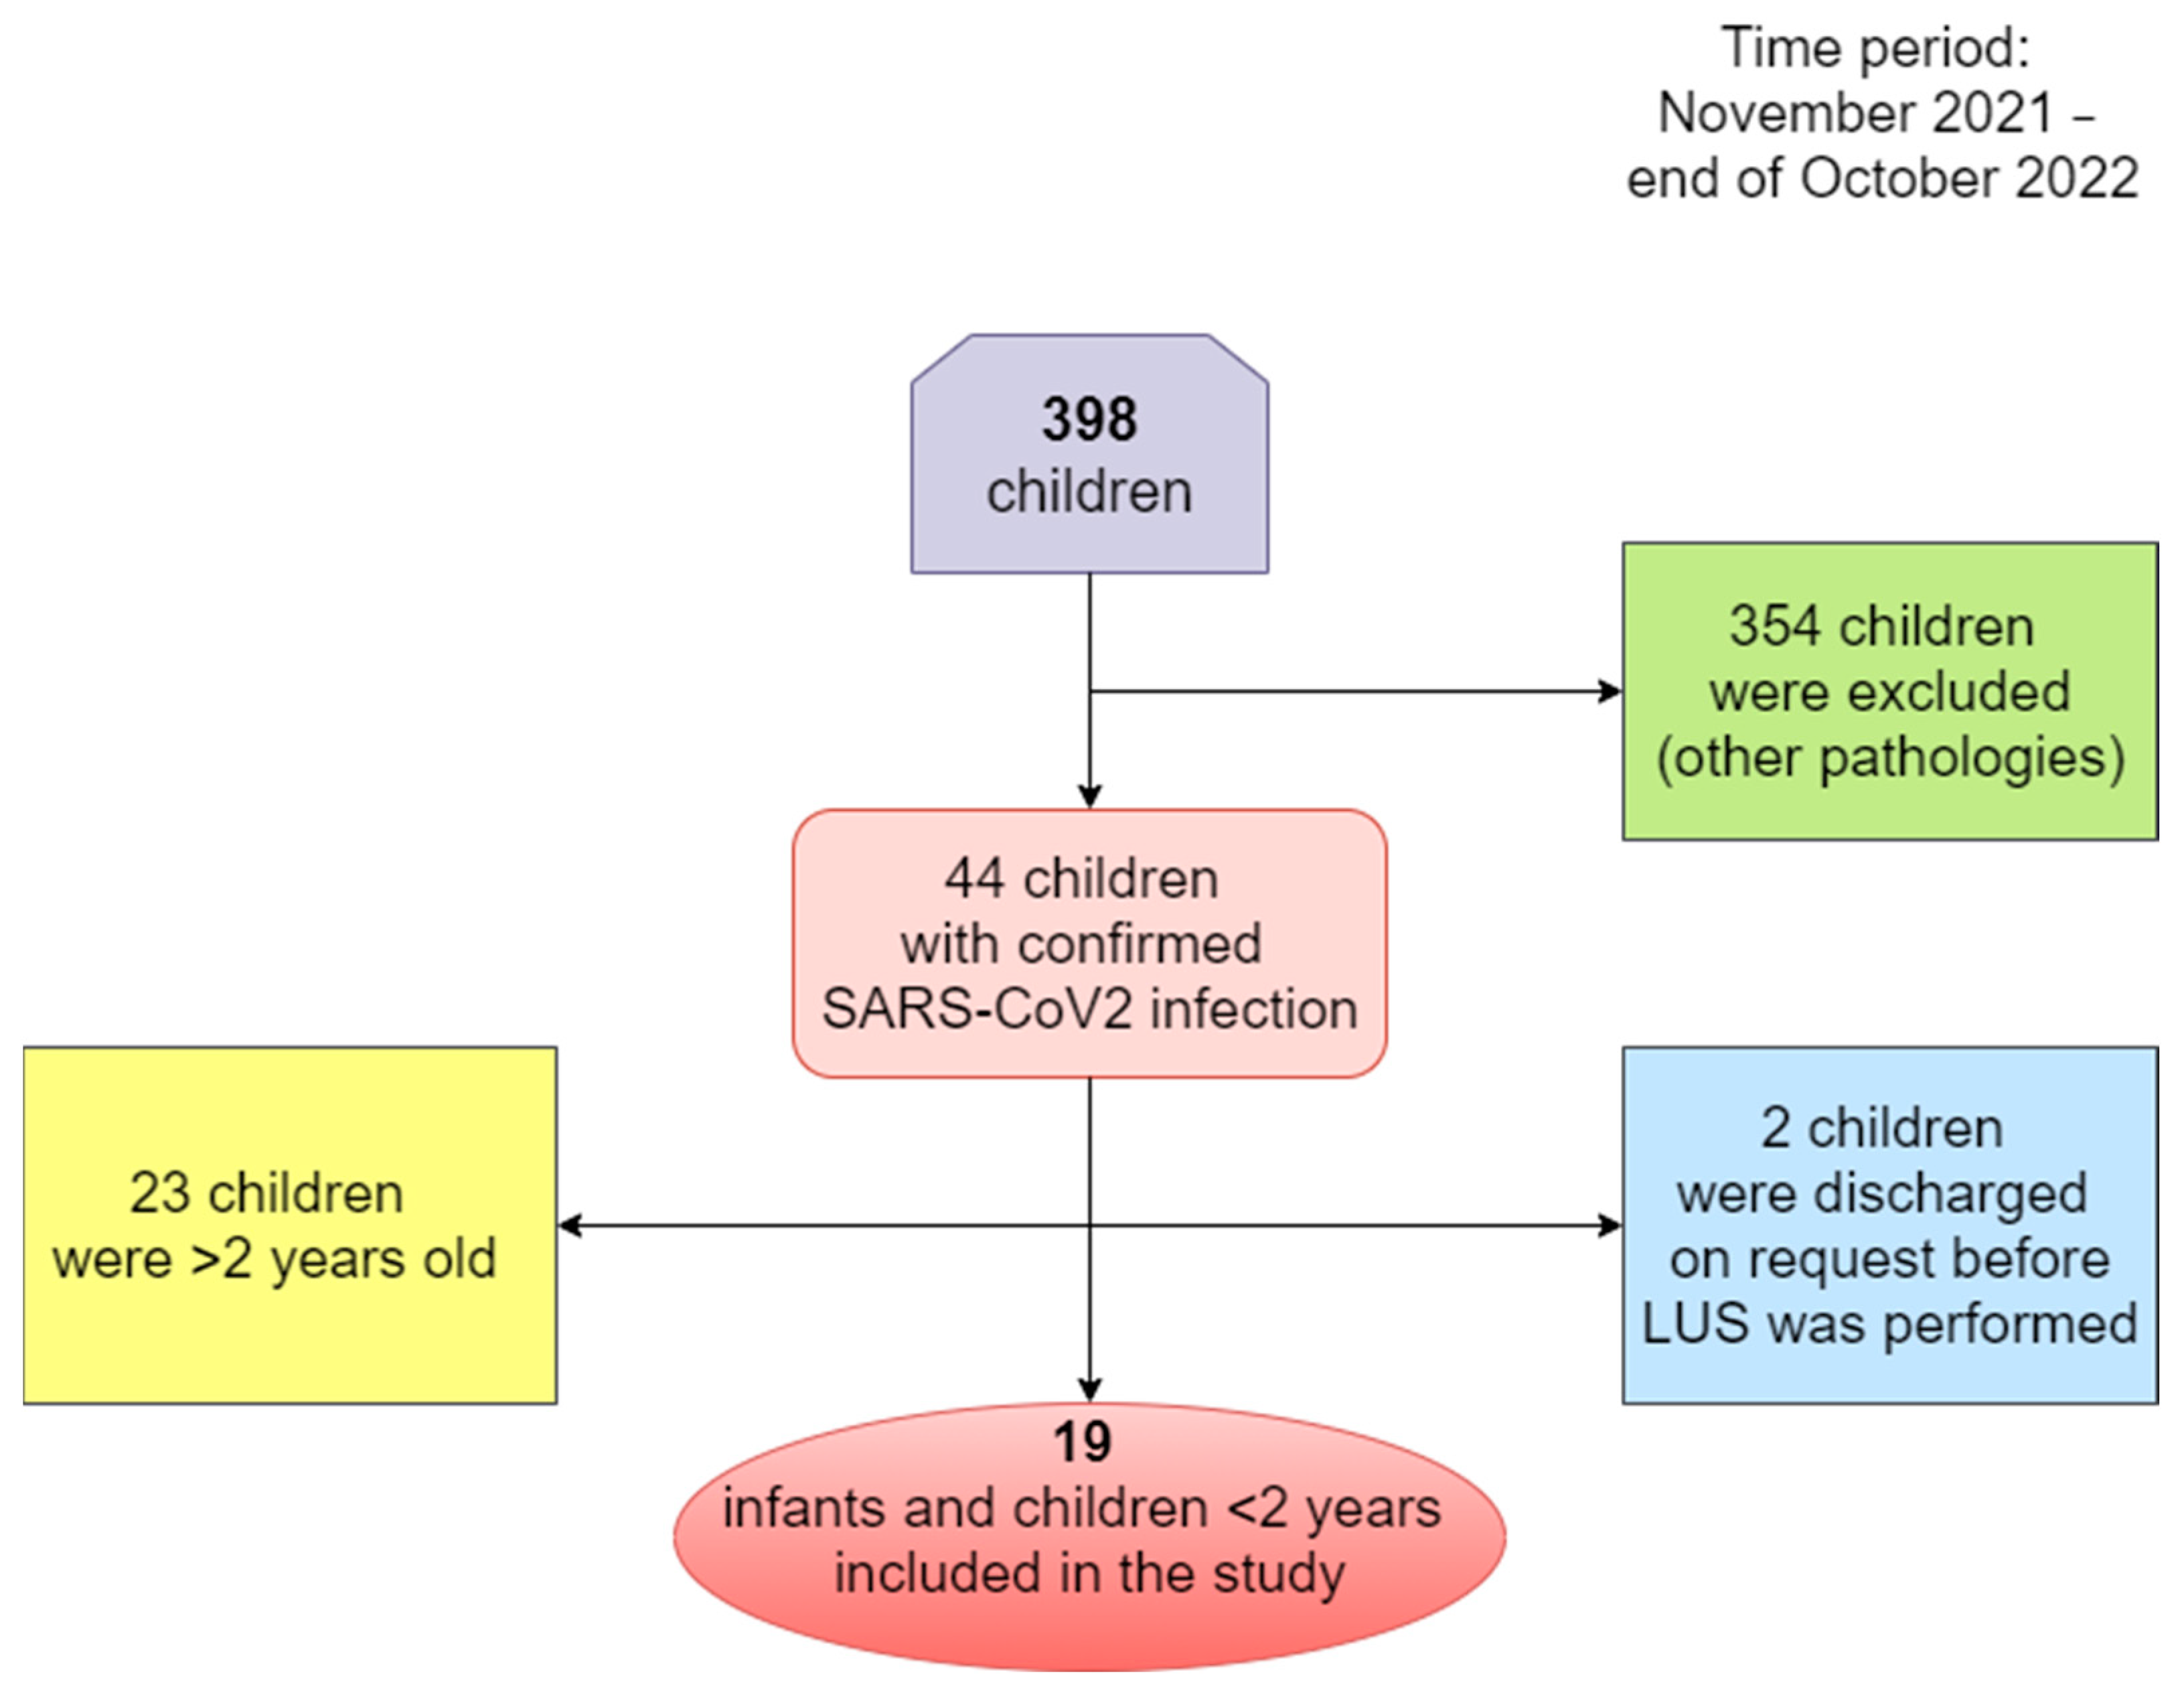
2. Patients and Methods
- -
- Infants with SARS-CoV-2 infection that were hospitalized for more than two days;
- -
- Children under 2 years of age with SARS-CoV-2 infection who had been hospitalized for more than two days.
- -
- Infants and children with SARS-CoV-2 infection that were hospitalized for less than two days;
- -
- Infants and children with chronic lung diseases such as bronchopulmonary dysplasia, cystic fibrosis, immunodeficiency, etc.;
- -
- Children over the age of 2 years with SARS-CoV-2 infection;
- -
- Infants and children lacking informed consent from parents or legal guardians.
- -
- Gender;
- -
- Age (months);
- -
- Anthropometric measurements (weight of children);
- -
- Number of positive PCR tests;
- -
- Days of hospitalization/days of convalescence;
- -
- Signs and symptoms of the infection (psychomotor agitation, asthenic syndrome, fever, cough, rhinorrhea, acute dehydration syndrome, vomiting, diarrhea, nasal obstruction, dysphagia, dysphonia, loss of appetite, dyspnea, oropharyngeal candidiasis, presence of inflammatory lymph nodes, presence of congestive pharynx);
- -
- Other associated pathologies;
- -
- Biological markers and inflammatory probes (hemoglobin, leukocytes, lymphocytes, neutrophils, monocytes, thrombocytes, erythrocyte sedimentation rate, procalcitonin, C-reactive protein, ferritin, LDH, hepatic transaminases, bilirubin, D-dimer level, fibrinogen, interleukin-6);
- -
- Bacterial and fungal cultures;
- -
- Imaging examinations;
- -
- Score of lung affection based on ultrasound.
3. Results
3.1. Demographic Data
3.2. Clinical and Biological Markers of COVID-19 Infection in Infants and Children under 2 Years
3.3. Lung ultrasound investigation, score and correlation
4. Discussion
4.1. Limitation of Study/Weakness
4.2. Further Directions
5. Conclusions
Author Contributions
Funding
Institutional Review Board Statement
Informed Consent Statement
Data Availability Statement
Acknowledgments
Conflicts of Interest
References
- Demi, L.; Wolfram, F.; Klersy, C.; De Silvestri, A.; Ferretti, V.V.; Muller, M.; Miller, D.; Feletti, F.; Wełnicki, M.; Buda, N.; et al. New International Guidelines and Consensus on the Use of Lung Ultrasound. J. Ultrasound Med. 2023, 42, 309–344. [Google Scholar] [CrossRef]
- Lovrenski, J. Pediatric Lung Ultrasound—Pros and Potentials. Pediatr. Radiol. 2020, 50, 306–313. [Google Scholar] [CrossRef]
- Laursen, C.B.; Clive, A.; Hallifax, R.; Pietersen, P.I.; Asciak, R.; Davidsen, J.R.; Bhatnagar, R.; Bedawi, E.O.; Jacobsen, N.; Coleman, C.; et al. European Respiratory Society Statement on Thoracic Ultrasound. Eur. Respir. J. 2021, 57, 2001519. [Google Scholar] [CrossRef] [PubMed]
- Stoicescu, E.R.; Ciuca, I.M.; Iacob, R.; Iacob, E.R.; Marc, M.S.; Birsasteanu, F.; Manolescu, D.L.; Iacob, D. Is Lung Ultrasound Helpful in COVID-19 Neonates?—A Systematic Review. Diagnostics 2021, 11, 2296. [Google Scholar] [CrossRef] [PubMed]
- Buonsenso, D.; Vetrugno, L. Lung Ultrasound in Adults and Children with COVID-19: From First Discoveries to Recent Advances. JCM 2022, 11, 4340. [Google Scholar] [CrossRef]
- Stoicescu, E.R.; Manolescu, D.L.; Iacob, R.; Cerbu, S.; Dima, M.; Iacob, E.R.; Ciuca, I.M.; Oancea, C.; Iacob, D. The Assessment of COVID-19 Pneumonia in Neonates: Observed by Lung Ultrasound Technique and Correlated with Biomarkers and Symptoms. JCM 2022, 11, 3555. [Google Scholar] [CrossRef] [PubMed]
- Campagnano, S.; Angelini, F.; Fonsi, G.B.; Novelli, S.; Drudi, F.M. Diagnostic Imaging in COVID-19 Pneumonia: A Literature Review. J. Ultrasound 2021, 24, 383–395. [Google Scholar] [CrossRef]
- Caro-Dominguez, P.; Shelmerdine, S.C.; Toso, S.; Secinaro, A.; Toma, P.; Damasio, M.B.; Navallas, M.; Riaza-Martin, L.; Gomez-Pastrana, D.; Ghadimi Mahani, M.; et al. Thoracic Imaging of Coronavirus Disease 2019 (COVID-19) in Children: A Series of 91 Cases. Pediatr. Radiol. 2020, 50, 1354–1368. [Google Scholar] [CrossRef]
- Mocanu, V.; Bhagwani, D.; Sharma, A.; Borza, C.; Rosca, C.I.; Stelian, M.; Bhagwani, S.; Haidar, L.; Kshtriya, L.; Kundnani, N.R.; et al. COVID-19 and the Human Eye: Conjunctivitis, a Lone COVID-19 Finding—A Case-Control Study. Med. Princ. Pract. 2022, 31, 66–73. [Google Scholar] [CrossRef]
- Parvu, S.; Müller, K.; Dahdal, D.; Cosmin, I.; Christodorescu, R.; Duda-Seiman, D.; Man, D.; Sharma, A.; Dragoi, R.; Baneu, P.; et al. COVID-19 and Cardiovascular Manifestations. Eur. Rev. Med. Pharmacol. Sci. 2022, 26, 4509–4519. [Google Scholar] [CrossRef]
- Simsek Uzunoglu, S.; Akca, H. Systematic Review: Clinical Symptoms and Laboratory and Radiology Findings in Children with COVID-19. Niger. J. Clin. Pract. 2021, 24, 1259–1267. [Google Scholar] [CrossRef] [PubMed]
- Cui, X.; Zhao, Z.; Zhang, T.; Guo, W.; Guo, W.; Zheng, J.; Zhang, J.; Dong, C.; Na, R.; Zheng, L.; et al. A Systematic Review and Meta-Analysis of Children with Coronavirus Disease 2019 (COVID-19). J. Med. Virol. 2021, 93, 1057–1069. [Google Scholar] [CrossRef] [PubMed]
- Manti, S.; Licari, A.; Montagna, L.; Votto, M.; Leonardi, S.; Brambilla, I.; Castagnoli, R.; Foiadelli, T.; Marseglia, G.L.; Cardinale, F.; et al. SARS-CoV-2 Infection in Pediatric Population. Acta Biomed. Atenei Parm. 2020, 91, e2020003. [Google Scholar] [CrossRef]
- Caroselli, C.; Blaivas, M.; Falzetti, S. Diagnostic Imaging in Newborns, Children and Adolescents Infected with Severe Acute Respiratory Syndrome Coronavirus 2 (SARS-CoV-2): Is There a Realistic Alternative to Lung High-Resolution Computed Tomography (HRCT) and Chest X-Rays? A Systematic Review of the Literature. Ultrasound Med. Biol. 2021, 47, 3034–3040. [Google Scholar] [CrossRef]
- Ciuca, I.M.; Pop, L.L.; Dediu, M.; Stoicescu, E.R.; Marc, M.S.; Manea, A.M.; Manolescu, D.L. Lung Ultrasound in Children with Cystic Fibrosis in Comparison with Chest Computed Tomography: A Feasibility Study. Diagnostics 2022, 12, 376. [Google Scholar] [CrossRef]
- Gil-Rodríguez, J.; Pérez De Rojas, J.; Aranda-Laserna, P.; Benavente-Fernández, A.; Martos-Ruiz, M.; Peregrina-Rivas, J.-A.; Guirao-Arrabal, E. Ultrasound Findings of Lung Ultrasonography in COVID-19: A Systematic Review. Eur. J. Radiol. 2022, 148, 110156. [Google Scholar] [CrossRef]
- Tung-Chen, Y.; Martí de Gracia, M.; Díez-Tascón, A.; Alonso-González, R.; Agudo-Fernández, S.; Parra-Gordo, M.L.; Ossaba-Vélez, S.; Rodríguez-Fuertes, P.; Llamas-Fuentes, R. Correlation between Chest Computed Tomography and Lung Ultrasonography in Patients with Coronavirus Disease 2019 (COVID-19). Ultrasound Med. Biol. 2020, 46, 2918–2926. [Google Scholar] [CrossRef] [PubMed]
- Çetin, C.; Karaaslan, A.; Akın, Y.; Arifoglu, M.; Rona, G.; Demirhan, R. Relationship of Chest Computed Tomography Score with Disease Severity and Laboratory Values in Children with COVID-19. J. Paediatrics Child. Health 2022, 58, 802–808. [Google Scholar] [CrossRef]
- Mongodi, S.; Bouhemad, B.; Orlando, A.; Stella, A.; Tavazzi, G.; Via, G.; Iotti, G.A.; Braschi, A.; Mojoli, F. Modified Lung Ultrasound Score for Assessing and Monitoring Pulmonary Aeration. Ultraschall Med. 2017, 38, 530–537. [Google Scholar] [CrossRef]
- Jackson, W.M.; Price, J.C.; Eisler, L.; Sun, L.S.; Lee, J.J. COVID-19 in Pediatric Patients: A Systematic Review. J. Neurosurg. Anesthesiol. 2022, 34, 141–147. [Google Scholar] [CrossRef]
- Marini, T.J.; Rubens, D.J.; Zhao, Y.T.; Weis, J.; O’Connor, T.P.; Novak, W.H.; Kaproth-Joslin, K.A. Lung Ultrasound: The Essentials. Radiol. Cardiothorac. Imaging 2021, 3, e200564. [Google Scholar] [CrossRef] [PubMed]
- Musolino, A.M.; Boccuzzi, E.; Buonsenso, D.; Supino, M.C.; Mesturino, M.A.; Pitaro, E.; Ferro, V.; Nacca, R.; Sinibaldi, S.; Palma, P.; et al. The Role of Lung Ultrasound in Diagnosing COVID-19-Related Multisystemic Inflammatory Disease: A Preliminary Experience. JCM 2022, 11, 234. [Google Scholar] [CrossRef] [PubMed]
- Beaney, T.; Neves, A.L.; Alboksmaty, A.; Ashrafian, H.; Flott, K.; Fowler, A.; Benger, J.R.; Aylin, P.; Elkin, S.; Darzi, A.; et al. Trends and Associated Factors for COVID-19 Hospitalisation and Fatality Risk in 2.3 Million Adults in England. Nat. Commun. 2022, 13, 2356. [Google Scholar] [CrossRef] [PubMed]
- Mansourian, M.; Ghandi, Y.; Habibi, D.; Mehrabi, S. COVID-19 Infection in Children: A Systematic Review and Meta-Analysis of Clinical Features and Laboratory Findings. Arch. Pédiatrie 2021, 28, 242–248. [Google Scholar] [CrossRef] [PubMed]
- García-Vera, C.; Castejón-Ramírez, S.; Laín Miranda, E.; Hernández Abadía, R.; García Ventura, M.; Borque Navarro, E.; Rubio Sánchez, P.; Baeta Ruiz, Á.; Mengual Gil, J.M. COVID-19 in Children: Clinical and Epidemiological Spectrum in the Community. Eur. J. Pediatr. 2022, 181, 1235–1242. [Google Scholar] [CrossRef]
- Salton, F.; Confalonieri, P.; Campisciano, G.; Cifaldi, R.; Rizzardi, C.; Generali, D.; Pozzan, R.; Tavano, S.; Bozzi, C.; Lapadula, G.; et al. Cytokine Profiles as Potential Prognostic and Therapeutic Markers in SARS-CoV-2-Induced ARDS. JCM 2022, 11, 2951. [Google Scholar] [CrossRef]
- Gurbani, N.; Acosta-Sorensen, M.; Díaz-Pérez, D.; Figueira-Goncalves, J.M.; Ramallo-Fariña, Y.; Trujillo-Castilla, J.L. Clinical Outcomes and Lung Ultrasound Findings in COVID-19 Follow up: Calm Comes after the Storm? Respir. Med. Res. 2022, 82, 100907. [Google Scholar] [CrossRef]
- Vetrugno, L.; Meroi, F.; Orso, D.; D’Andrea, N.; Marin, M.; Cammarota, G.; Mattuzzi, L.; Delrio, S.; Furlan, D.; Foschiani, J.; et al. Can Lung Ultrasound Be the Ideal Monitoring Tool to Predict the Clinical Outcome of Mechanically Ventilated COVID-19 Patients? An Observational Study. Healthcare 2022, 10, 568. [Google Scholar] [CrossRef]
- Deng, Q.; Cao, S.; Wang, H.; Zhang, Y.; Chen, L.; Yang, Z.; Peng, Z.; Zhou, Q. Application of Quantitative Lung Ultrasound Instead of CT for Monitoring COVID-19 Pneumonia in Pregnant Women: A Single-Center Retrospective Study. BMC Pregnancy Childbirth 2021, 21, 259. [Google Scholar] [CrossRef]
- Vetrugno, L.; Sala, A.; Orso, D.; Meroi, F.; Fabbro, S.; Boero, E.; Valent, F.; Cammarota, G.; Restaino, S.; Vizzielli, G.; et al. Lung Ultrasound Signs and Their Correlation With Clinical Symptoms in COVID-19 Pregnant Women: The “PINK-CO” Observational Study. Front. Med. 2021, 8, 768261. [Google Scholar] [CrossRef]
- Ruaro, B.; Baratella, E.; Confalonieri, P.; Confalonieri, M.; Vassallo, F.G.; Wade, B.; Geri, P.; Pozzan, R.; Caforio, G.; Marrocchio, C.; et al. High-Resolution Computed Tomography and Lung Ultrasound in Patients with Systemic Sclerosis: Which One to Choose? Diagnostics 2021, 11, 2293. [Google Scholar] [CrossRef] [PubMed]
- Baratella, E.; Ruaro, B.; Marrocchio, C.; Poillucci, G.; Pigato, C.; Bozzato, A.M.; Salton, F.; Confalonieri, P.; Crimi, F.; Wade, B.; et al. Diagnostic Accuracy of Chest Digital Tomosynthesis in Patients Recovering after COVID-19 Pneumonia. Tomography 2022, 8, 1221–1227. [Google Scholar] [CrossRef] [PubMed]
- Altersberger, M.; Goliasch, G.; Khafaga, M.; Schneider, M.; Cho, Y.; Winkler, R.; Funk, G.-C.; Binder, T.; Huber, G.; Zwick, R.-H.; et al. Echocardiography and Lung Ultrasound in Long COVID and Post-COVID Syndrome, a Review Document of the Austrian Society of Pneumology and the Austrian Society of Ultrasound in Medicine. J. Ultrasound Med. 2023, 42, 269–277. [Google Scholar] [CrossRef] [PubMed]


| LUSS = 0 Points | LUSS = 1 Point | LUSS = 2 Points | LUSS = 3 Points |
|---|---|---|---|
| Normal/physiological A-lines | More than 2 B-lines (sparse B-lines) with associated pleural abnormalities | Coalescent or confluent B-lines | Large peripheral consolidation (wider than 1 cm) in association or not with air bronchogram |
| One or two B-lines per intercostal space | ‘White-lung’ aspect or small peripheral consolidation (smaller than 1 cm) |
| Infants and Children’s Characteristics | Entire Lot n = 19 | Patients with Respiratory Involvement (n = 12) | Patients without Respiratory Involvement (n = 7) | Independent Samples Tests |
|---|---|---|---|---|
| Age (Months) Mean ± S.D. Min; Max | 11.21 ± 7.70 1; 24 | 13.16 ± 8.33 2; 24 | 7.87 ± 5.49 1; 18 | Test Statistic t = −1.49 p = 0.15 |
| Weight (Kilograms) Mean ± S.D. Min; Max | 9.04 ± 3.08 3.5; 13.6 | 9.63 ± 2.95 4.5; 13.5 | 8.02 ± 3.26 3.5; 13.6 | Test Statistic t = −1.09 p = 0.28 |
| Total PCR Tests Per Child Median; [IQR] Min; Max | 1; [1;2] 1; 3 | 1.5; [1;2] 1; 3 | 1; [1;2] 1; 3 | Mann–Whitney U = 39 p = 0.77 |
| Days of Hospitalization Per Child Mean ± S.D. Min; Max | 4.68 ± 1.73 2; 9 | 5 ± 1.20 3; 7 | 4.14 ± 2.41 2; 9 | Test Statistic t = −1.04 p = 0.31 |
| Days of convalescence per child Mean ± S.D. Min; Max | 7.68 ± 2.35 4; 13 | 7.75 ± 2.37 5; 13 | 7.57 ± 2.50 4; 12 | Test Statistic t = −1.55 p = 0.87 |
| Second Positive PCR tests | 57.9% (n = 11) |
| Signs and Symptoms in Infants and Children | n = 19 (Percentage %) | Patients with Respiratory Involvement n = 12 (Percentage % of the Entire Lot) | Patients without Respiratory Involvement n = 7 (Percentage % of the Entire Lot) |
|---|---|---|---|
| Moderately influenced general condition | 11 (57.89) | 8 (42.10) | 3 (15.78) |
| Slightly influenced general condition | 8 (42.10) | 4 (21.05) | 4 (21.05) |
| Psychomotor agitation | 3 (15.78) | 2 (10.52) | 1 (5.26) |
| Asthenic syndrome | 8 (42.10) | 6 (31.57) | 2 (10.52) |
| Fever (≥37.5 °C) | 16 (84.21) | 10 (52.63) | 6 (31.57) |
| Rhinorrhea | 7 (36.84) | 3 (15.78) | 4 (21.05) |
| Nasal obstruction | 8 (42.10) | 5 (26.31) | 3 (15.78) |
| Congestive pharynx | 14 (73.68) | 8 (42.10) | 6 (31.57) |
| Dysphonia | 4 (21.05) | 2 (10.52) | 2 (10.52) |
| Dysphagia | 2 (10.52) | 2 (10.52) | 0 |
| Red eyes and runny nose | 2 (10.52) | 2 (10.52) | 0 |
| Mild acute dehydration syndrome (<5% of weight) | 15 (78.94) | 9 (47.36) | 6 (31.57) |
| Episodes of diarrhea | 3 (15.78) | 3 (15.78) | 0 |
| Diarrhea with bloody stools | 1 (5.26) | 1 (5.26) | 0 |
| Vomiting | 4 (21.05) | 3 (15.78) | 1 (5.26) |
| Loss of appetite | 11 (57.84) | 8 (42.10) | 3 (15.78) |
| Lateral-cervical lymph nodes | 3 (15.78) | 2 (10.52) | 1 (5.26) |
| Dyspnea | 1 (5.26) | 1 (5.26) | 0 |
| Glottis spasm | 1 (5.26) | 1 (5.26) | 0 |
| Associated pathologies and comorbidities | |||
| Oral candidiasis | 3 (15.78) | 2 (10.52) | 1 (5.26) |
| Lactose intolerance | 2 (10.52) | 2 (10.52) | 0 |
| Egg intolerance | 1 (5.26) | 1 (5.26) | 0 |
| Seizures | 1 (5.26) | 1 (5.26) | 0 |
| Repeated otitis | 1 (5.26) | 1 (5.26) | 0 |
| Atopic dermatitis | 1 (5.26) | 0 | 1 (5.26) |
| History of whooping cough | 1 (5.26) | 1 (5.26) | 0 |
| Urinary tract infection | 1 (5.26) | 0 | 1 (5.26) |
| Biomarker (Unit Measurement) | Mean ± S.D. or Median; [IQR] | Patients with Respiratory Involvement (n = 12) | Patients without Respiratory Involvement (n = 7) | Independent Samples Tests |
|---|---|---|---|---|
| Hemoglobin (g/dL) Min; Max | 11.50; [10.92; 12.10] 9.7; 12.7 | 11.50; [10.35; 12.15] 9.7; 12.7 | 11.50; [11.22; 12.05] 9.7; 12.5 | Mann–Whitney U = 39 p = 0.79 |
| Leukocytes (×109/L) Min; Max | 7890; [6400; 11062.50] 4230; 31,700 | 8695; [6170; 14760] 4230; 31,700 | 7380; [6697.50; 8100] 5440; 12,360 | Mann–Whitney U = 34 p = 0.49 |
| Lymphocytes (×109/L) Min; Max | 3960; [2427.5; 5787.5] 1060; 12,460 | 4140; [2180; 5720] 1060; 12,460 | 3120; [2815; 5655] 1800; 7760 | Mann–Whitney U = 41 p = 0.93 |
| Neutrophiles (×109/L) Min; Max | 2410; [1512.5; 4685] 720; 22,270 | 3755; [1700; 6010] 1220; 22,270 | 1710; [965; 3360] 720; 5050 | Mann–Whitney U = 23 p = 0.10 |
| Monocytes (×109/L) Min; Max | 1260; [797.5; 1697.5] 360; 3440 | 1635; [700; 2635] 360; 3440 | 1210; [967.5; 1402.5] 640; 1700 | Mann–Whitney U = 33 p = 0.44 |
| Thrombocytes (×109/L) Min; Max | 360,000.00 ± 124,869.26 138,000; 589,000 | 348,750.00 ± 106,279.32 222,000; 574,000 | 379,285.71 ± 159,316.99 138,000; 589,000 | Test statistic t = 0.50 p = 0.62 |
| Erythrocyte Sedimentation Rate (mm/h) Min; Max | 10; [10; 15] 5; 70 | 12.50; [9; 17.50] 5; 70 | 10; [10; 15] 5; 60 | Mann–Whitney U = 40 p = 0.86 |
| LDH (U/L) Min; Max | 279.10 ± 74.29 159; 461 | 278 ± 86.57 159; 461 | 281 ± 53.02 210; 361 | Test statistic t = 0.08 p = 0.93 |
| AST (U/L) Min; Max | 53; [31.40; 65.35] 20.4; 160.1 | 60.40; [33.95; 81.15] 20.4; 160.1 | 34.70; [26.95; 57.87] 26.3; 60.6 | Mann–Whitney U = 23 p = 0.10 |
| CRP (mg/L) Min; Max | 5.57 [2.63; 8] 0.4; 191 | 4.44 [2.65; 8.34] 0.4; 89.42 | 5.57 [2.96; 7.75] 0.66; 191 | Mann–Whitney U = 41 p = 0.93 |
| Fibrinogen (g/L) Min; Max | 3.41; [2.90; 4.04] 1.8; 6.2 | 3.66; [3.37; 4.01] 1.8; 6.2 | 2.94; [2.78; 4.28] 2.67; 5.05 | Mann–Whitney U = 29.50 p = 0.29 |
| Procalcitonin (ng/mL) Min; Max | 0.18; [0.08; 0.27] 0.05; 2.1 | 0.19; [0.09; 0.28] 0.07; 0.44 | 0.17; [0.09; 0.18] 0.05; 2.1 | Mann–Whitney U = 35 p = 0.55 |
| Ferritin (μg/L) Min; Max | 91.68; [55.82; 147.17] 0.77; 1087 | 106.50; [58.73; 176.62] 0.77; 1087 | 91.68; [59.87; 122.37] 34.29; 524.87 | Mann–Whitney U = 35 p = 0.55 |
| D-dimer (mg/L) Min; Max | 0.78; [0.53; 1.66] 0.32; 2.31 | 0.88; [0.54; 1.72] 0.49; 2.31 | 0.76; [0.40; 1.45] 0.32; 1.74 | Mann–Whitney U = 34 p = 0.49 |
| IL-6 (pg/mL) Min; Max | 8.94; [ 1.73; 16.35] 1.32; 31.3 | 12.95; [ 5.08; 23.12] 1.40; 31.3 | 1.92; [ 1.55; 11.25] 1.32; 12.49 | Mann–Whitney U = 22 p = 0.09 |
| ALT (U/L) Min; Max | 22.70; [14.27; 30.60] 9; 85 | 25.95; [13.50; 49.85] 9; 85 | 22.30; [16.47; 25.25] 13.10; 29.7 | Mann–Whitney U = 34.50 p = 0.52 |
| Urea (mg/dL) Min; Max | 20.78 ± 6.36 12.3; 33.3 | 21.69 ± 6.70 13.4; 33.3 | 19.24 ± 5.89 12.3; 28.8 | Test statistic t = −0.80 p = 0.43 |
| Total Bilirubin (mg/dL) Min; Max | 0.19; [0.11; 0.30] 0.07; 0.63 | 0.20; [0.15; 0.41] 0.11; 0.63 | 0.11; [0.09; 0.19] 0.07; 0.60 | Mann–Whitney U = 21.50 p = 0.08 |
| Median LUSS, [IQR] | Average Rank LUSS | Mann–Whitney U Value | p-Value | |
|---|---|---|---|---|
| Patients with respiratory involvement (n = 12) vs. patients without (n = 7)—Figure 5a | 6 vs. 3 [3; 7.5] vs. [2;3.75] | 12.12 vs. 6.37 | 16.50 | 0.02 |
| Patients with fever (n = 16) vs. patients without fever (n = 3) | 4.5 vs. 2 | 10.31 vs. 8.33 | 19 | 0.57 |
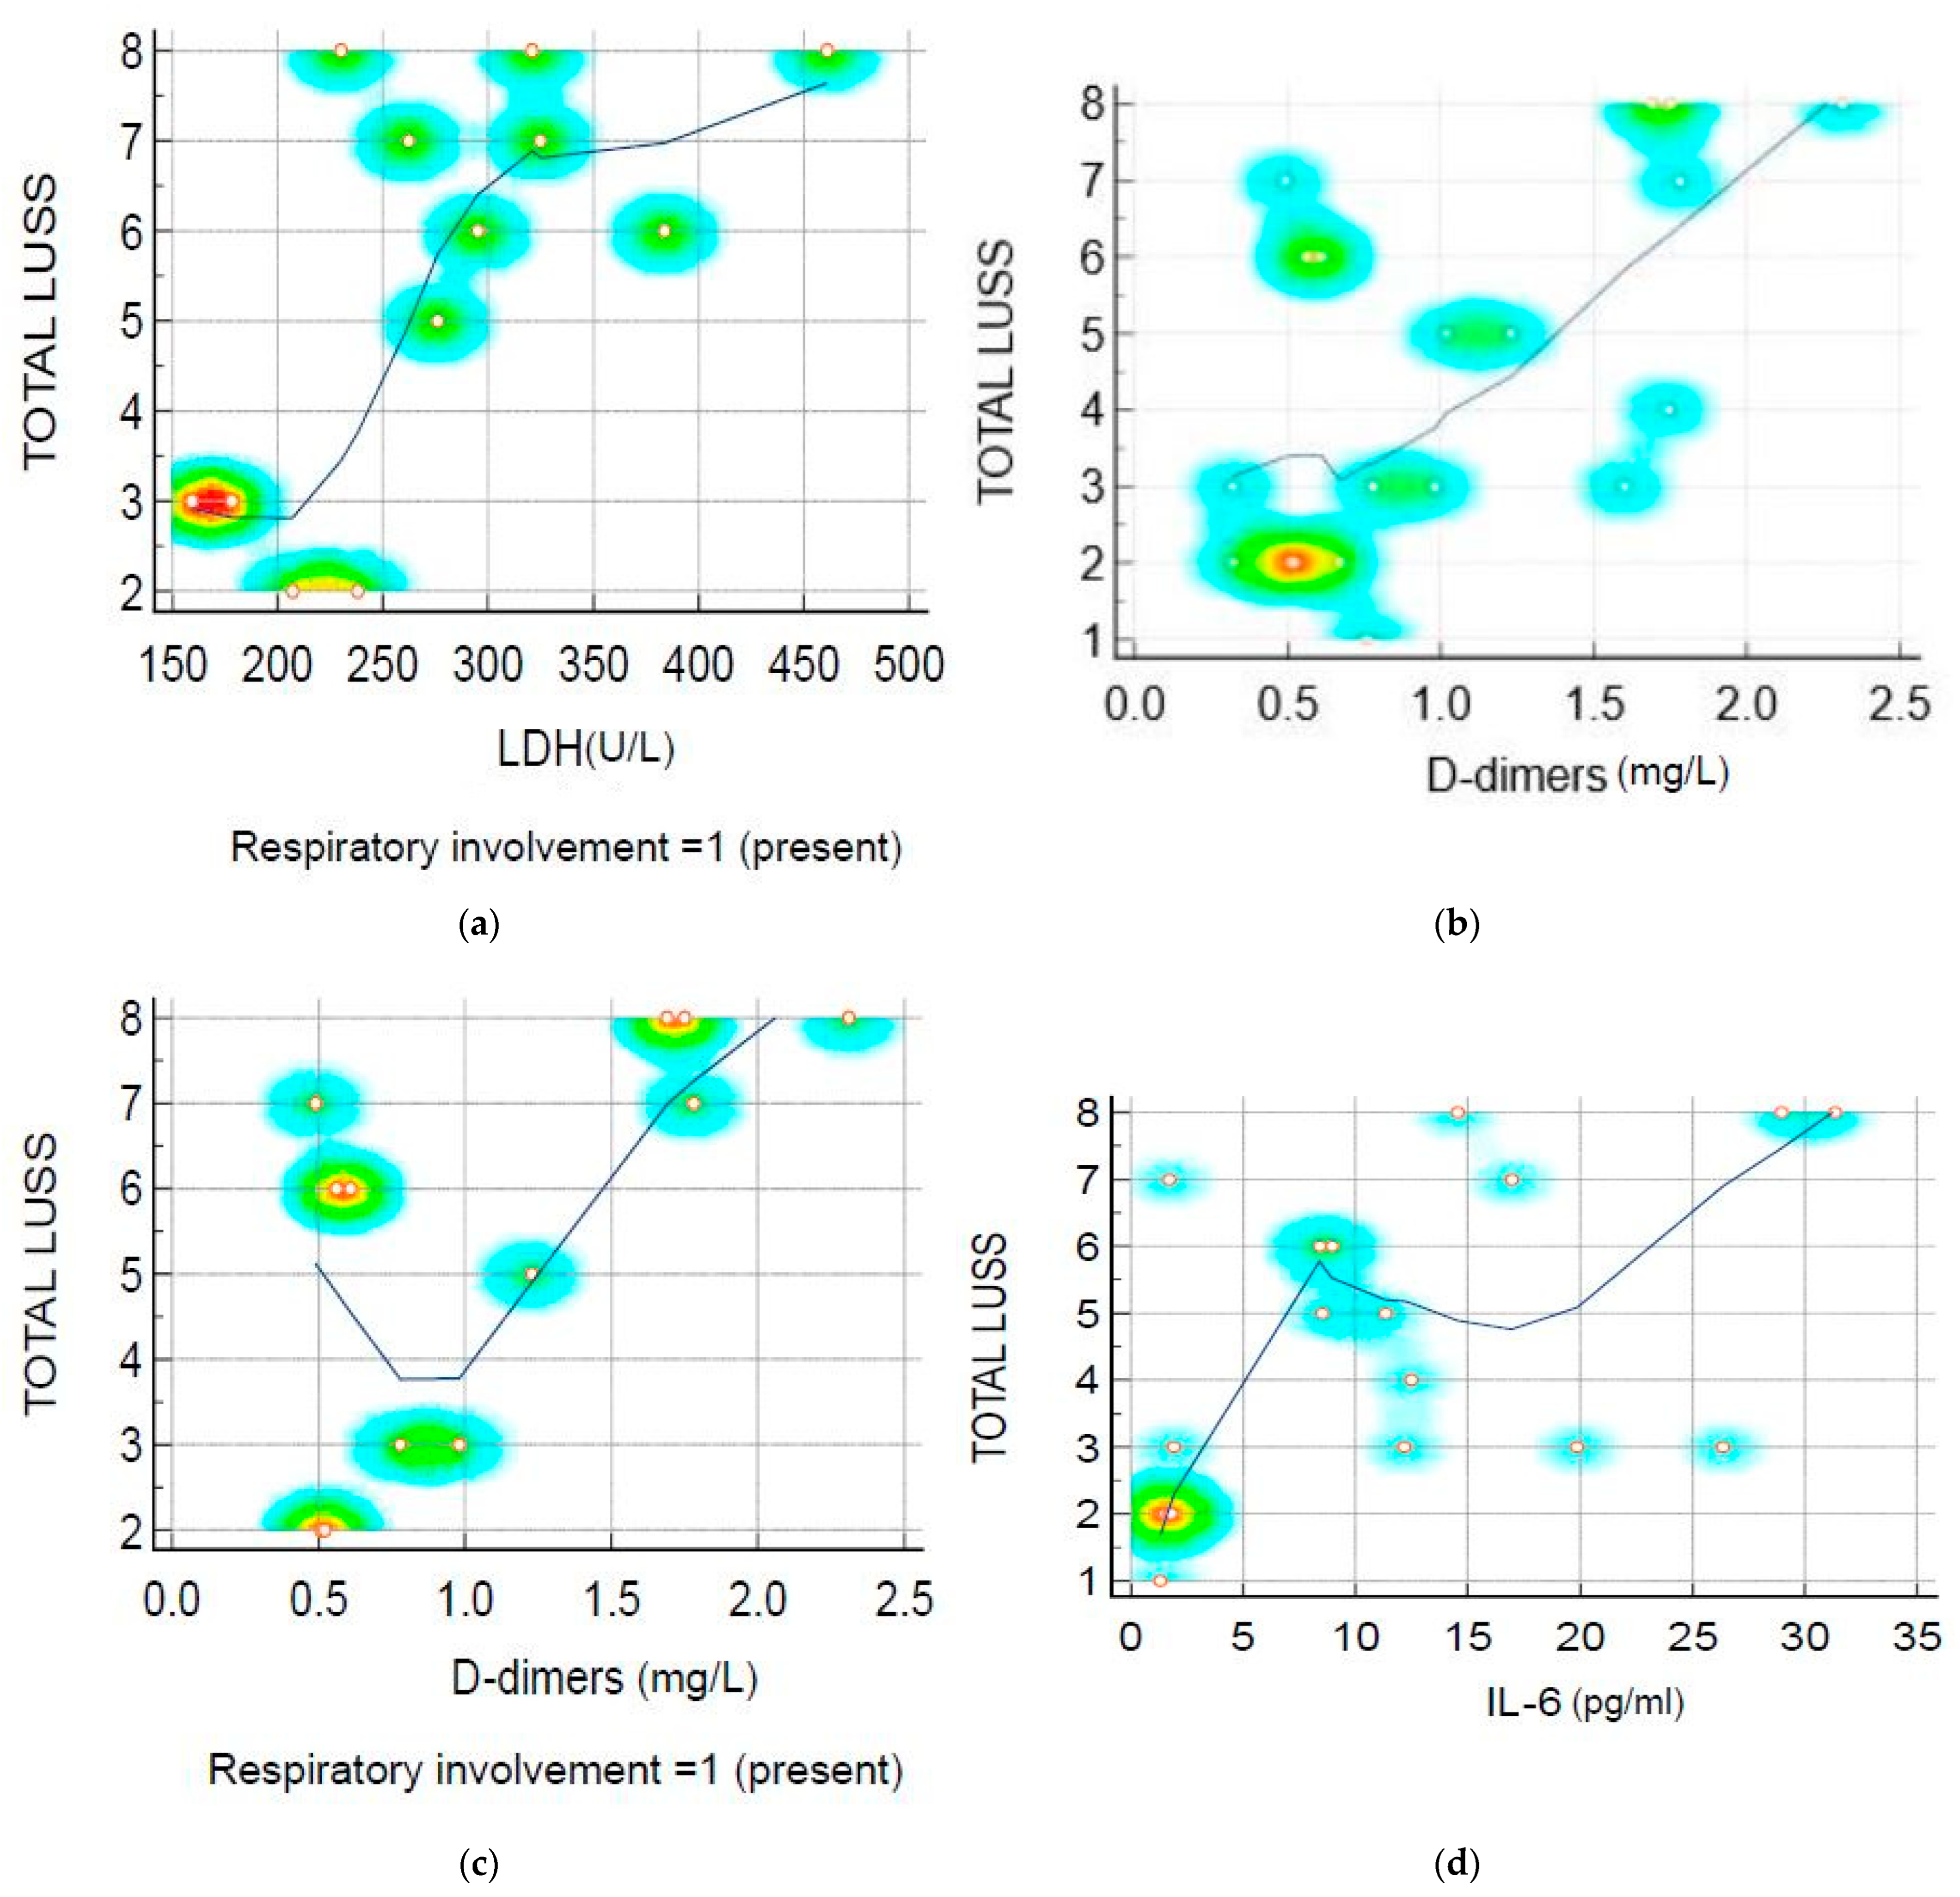
| Correlation between | Rank Correlation/Coefficient | 95% CI | p-Value | Graphic Representation |
|---|---|---|---|---|
| LUSS and LDH at symptomatic patients (respiratory involvement) | rho = 0.60 | 0.04 to 0.87 | 0.03 | Figure 6a |
| LUSS and D-dimer level | rho = 0.55 | 0.139 to 0.807 | 0.01 | Figure 6b |
| LUSS and D-dimer level at symptomatic infants and children (with respiratory involvement present) | rho = 0.62 | 0.07 to 0.88 | 0.03 | Figure 6c |
| LUSS and D-dimer level at symptomatic infants and children (with fever present) | rho = 0.50 | 0.01 to 0.80 | 0.04 | |
| LUSS and IL-6 level | rho = 0.64 | 0.26 to 0.84 | 0.00 | Figure 6d |
| LUSS and IL-6 level at symptomatic infants and children (with respiratory involvement present) | rho = 0.48 | −0.11 to 0.83 | 0.10 | |
| LUSS and IL-6 level at symptomatic infants and children (with fever present) | r = 0.45 | −0.05 to 0.77 | 0.07 | |
| LUSS and O2 saturation level | R = −0.65 | −0.865 to −0.28 | 0.00 | Figure 7 |
Disclaimer/Publisher’s Note: The statements, opinions and data contained in all publications are solely those of the individual author(s) and contributor(s) and not of MDPI and/or the editor(s). MDPI and/or the editor(s) disclaim responsibility for any injury to people or property resulting from any ideas, methods, instructions or products referred to in the content. |
© 2023 by the authors. Licensee MDPI, Basel, Switzerland. This article is an open access article distributed under the terms and conditions of the Creative Commons Attribution (CC BY) license (https://creativecommons.org/licenses/by/4.0/).
Share and Cite
Stoicescu, E.R.; Lovrenski, J.; Iacob, R.; Cerbu, S.; Iacob, D.; Iacob, E.R.; Susa, S.R.; Ciuca, I.M.; Bolintineanu, L.A.; Ciornei-Hoffman, A.; et al. COVID-19 in Infants and Children under 2 Years—Could Lung Ultrasound Score Be Correlated with Biomarkers and Symptoms? Biomedicines 2023, 11, 2620. https://doi.org/10.3390/biomedicines11102620
Stoicescu ER, Lovrenski J, Iacob R, Cerbu S, Iacob D, Iacob ER, Susa SR, Ciuca IM, Bolintineanu LA, Ciornei-Hoffman A, et al. COVID-19 in Infants and Children under 2 Years—Could Lung Ultrasound Score Be Correlated with Biomarkers and Symptoms? Biomedicines. 2023; 11(10):2620. https://doi.org/10.3390/biomedicines11102620
Chicago/Turabian StyleStoicescu, Emil Robert, Jovan Lovrenski, Roxana Iacob, Simona Cerbu, Daniela Iacob, Emil Radu Iacob, Septimiu Radu Susa, Ioana Mihaiela Ciuca, Laura Andreea Bolintineanu (Ghenciu), Andreea Ciornei-Hoffman, and et al. 2023. "COVID-19 in Infants and Children under 2 Years—Could Lung Ultrasound Score Be Correlated with Biomarkers and Symptoms?" Biomedicines 11, no. 10: 2620. https://doi.org/10.3390/biomedicines11102620