Article

Serum Urate Levels and Ultrasound Characteristics of Carotid Atherosclerosis across Obesity Phenotypes

by
Daniela Efremova
1,2,
Natalia Ciobanu
1,2,
Danu Glavan
1,
Pavel Leahu
1,2,
Renata Racila
1,2,
Tatiana Bălănuță
1,
Alexandru Matei
1,
Maria Vasilieva
1,2,
Cristina Cheptea
1,
Paula Bîtcă
1,
Cristina Damian
1,
Ana Bondarciuc
1,
Irina Bejenari
1,
Adelina Cojocaru
1,
Diana Manea
1,
Mihail Ciocanu
1,
Eremei Zota
1,2,
Dumitru Ciolac
1,2,* and
Stanislav A. Groppa
1,2,*
1
Department of Neurology, Institute of Emergency Medicine, 2004 Chisinau, Moldova
2
Department of Neurology, Nicolae Testemitanu State University of Medicine and Pharmacy, 2004 Chisinau, Moldova
*
Authors to whom correspondence should be addressed.
Biomedicines 2023, 11(7), 1897; https://doi.org/10.3390/biomedicines11071897
Submission received: 6 June 2023 / Revised: 28 June 2023 / Accepted: 2 July 2023 / Published: 4 July 2023
(This article belongs to the Special Issue Biomedicines: 10th Anniversary)

Abstract

:
Background: Existing evidence suggests a close link among high levels of serum urate (SU), obesity and carotid atherosclerosis. The aim of the present study was to evaluate the interrelations between SU levels and carotid atherosclerosis in subjects with different obesity phenotypes. Methods: In this study, a total of 2076 subjects (mean age 48.1 ± 13.1 years; 1307 women) were recruited: 59 with general obesity, 616 with central obesity, 715 with mixed (general–central) obesity and 686 non-obese. Anthropometric measurements, vascular risk factors, blood biochemistry analysis (including SU levels), and carotid ultrasound were performed. Ultrasound assessment included evaluation of intima-media thickness (IMT) and plaque characteristics, including number, total area and type (vulnerable vs. stable) of plaques. Results: After adjustment for potential confounders, the highest levels of SU were observed in subjects with mixed obesity, followed by subjects with central obesity, general obesity and the non-obese (309.4 ± 82.2 vs. 301.2 ± 73.1 vs. 272.9 ± 61.8 vs. 234.2 ± 59.8 μmol/L, respectively; F = 149.2, post hoc p < 0.001). Similarly, subjects with mixed and central obesity presented higher values of IMT compared to subjects with general obesity and the non-obese (0.68 ± 0.16 vs. 0.67 ± 0.16 vs. 0.62 ± 0.14 vs. 0.57 ± 0.13 mm, respectively; F = 54.2, post hoc p < 0.001). No difference in number, total area and type of plaques among obesity groups were attested (all p > 0.05). Significantly higher IMT values were observed in subjects with increased SU levels compared to subjects with normal SU levels (0.70 ± 0.10 vs. 0.62 ± 0.14 mm, p = 0.02) only within the central obesity group. Increasing levels of SU were associated with a higher frequency of increased IMT only in subjects with central obesity (OR 1.033, 95% CI 1.025–1.041). Similarly, SU levels yielded a satisfactory performance in detecting subjects with increased IMT (AUC 0.65, 95% CI 0.50–0.73, subjects with carotid plaques (0.62, 95% CI 0.55–0.68) and subjects with vulnerable plaque types (0.68, 0.59–0.76) only within the central obesity group. Conclusions: Among the studied obesity types, the association between SU levels and markers of carotid atherosclerosis was of particular significance in subjects with central obesity.

1. Introduction

Cardiovascular and cerebrovascular diseases are the leading cause of death globally [1]. A spectrum of various modifiable risk factors, such as arterial hypertension, diabetes, obesity, physical inactivity, tobacco use, alcohol consumption, and dyslipidemia, were recognized as major vascular risk factors. Nevertheless, other less common risk factors are directly or indirectly associated with cerebrovascular diseases. Among these, elevated levels of serum urate (SU) are emerging as an important risk factor for cerebrovascular diseases [2,3,4]. The specific role of SU in cerebrovascular diseases, as an independent causal factor, a mediator or a marker of vascular comorbidities, is still the matter of debate. Despite existing controversies, increased SU levels have been independently associated with many vascular risk factors, including hypertension, obesity, diabetes mellitus, dyslipidemia, atherosclerosis and metabolic syndrome [3,5]. Depicting the role of SU in different vascular comorbidities may improve the risk stratification for cerebrovascular diseases.
Obesity is a major global health problem and poses a significant burden on healthcare systems. Obesity is known to be strongly related to a higher prevalence of hypertension, diabetes and metabolic syndrome [6] and to be significantly associated with an increased risk of cerebrovascular diseases [7]. In addition, obesity was shown to be associated with SU levels. In particular, a close relationship between SU and body mass index (BMI) and waist circumference (WC) was documented, with higher SU levels being detected in subjects with higher BMI [8,9,10] and higher WC values [11,12]. It has been postulated that abdominal obesity in particular is one of the main contributors of elevated SU levels in the general population [5,13]. These data indicate the existence of potential implications of obesity phenotypes in determining the SU levels and associated vascular risk factors.
Carotid atherosclerosis is a common pathological substrate of cerebrovascular diseases, being one of the major causes of ischemic stroke [14,15]. Currently, carotid intima–media thickness (IMT) and carotid plaques are widely used as non-invasive markers for carotid atherosclerotic disease and are directly associated with an increased risk of cerebrovascular diseases [16,17,18]. Moreover, the morphology of carotid plaques as assessed by carotid ultrasound is closely related to the risk of stroke—the less echogenic the plaque is (i.e., the more vulnerable), the higher the risk of stroke [19,20]. To date, numerous studies have demonstrated that higher SU levels are associated with higher values of IMT in healthy as well as in diseased (e.g., hypertensive or diabetic) populations [21]. Similarly, higher SU levels were associated with a higher occurrence of carotid plaques [22] and with a higher prevalence of vulnerable plaques [23]. However, little is known about the possible differential effects of SU on carotid atherosclerosis in subjects with different types of obesity.
Given that obesity is associated with both high SU levels and carotid atherosclerotic disease, it is essential to characterize SU levels and markers of carotid atherosclerosis across different obesity types. Thus, in the present study, we aimed to explore the interrelations between SU levels and carotid atherosclerosis (IMT and carotid plaque characteristics) in subjects with general, central and mixed (general–central) types of obesity.

2. Materials and Methods

2.1. Study Subjects

This cross-sectional study was part of the National State Program on Stroke Risk Factors initiated in 2015 that aimed to characterize the risk factors for stroke in the population of the Republic of Moldova. The inclusion criteria were as follows: age ≥ 18 years and signed informed consent. Subjects aged <18 years, a history of stroke, the presence of a major systemic disease (e.g., cancer, heart, liver or renal insufficiency), and failure to sign the informed consent served as exclusion criteria. Screening activities within the national program were performed in two stages, as described in [24,25]. First, local general practitioners prepared the lists of subjects in their circumscription, and all members aged ≥18 years were recruited for participation. In the second stage, subjects were interviewed and clinically examined in accordance with the study protocol for the evaluation of risk factors for stroke. Demographic data, previous medical history, concomitant medication and behavioral factors were determined using a predesigned questionnaire. Among the concomitant medication potentially affecting the levels of SU, only data on aspirin administration were available for the included subjects. All interviews as well as physical and instrumental evaluations were carried out by a well-trained team of physicians (from neurology and internal medicine disciplines). In total, 2076 subjects were evaluated and included into the study.

2.2. Physical Evaluation

For each subject, the following measures were performed: body weight and height for the BMI, WC, and blood pressure (BP). Body mass index was calculated as weight divided by the square of the body height. General obesity was defined as BMI ≥ 30 kg/m2 [26]. Waist circumference was measured by wrapping the tape around the midway between the lowest border of the ribs and iliac crest in the horizontal plane at the end of a normal breath. Central obesity was defined as an WC of >80 cm in women and >94 cm in men according to World Health Organization [26]. Mixed obesity was defined as coexistence of both general and central obesity in the same subject.
Blood pressure (BP) was measured on both extremities in clinostatic and orthostatic positions. Hypertension was estimated as a self-reported history of arterial hypertension or taking antihypertensive medication [27].

2.3. Laboratory Examination

Venous blood samples were collected via venipuncture from each subject after overnight fasting for evaluation of SU levels, serum fasting blood glucose (FBG), and the lipid profile (total cholesterol (TC), triglycerides (TG), high-density lipoprotein cholesterol (HDL-C) and low-density lipoprotein cholesterol (LDL-C)), according to established protocols. High TC was estimated as ≥5.0 mmol/L, high LDL-C as ≥4.16 mmol/L, and low HDL-C as ≤1.04 mmol/L. Dyslipidemia was defined as elevated TC or LDL-C levels, or low levels of HDL-C [28]. Regarding SU, there is no universally accepted definition for high SU levels. In our study, high SU levels were defined as serum concentrations > 416.4 μmol/L (or 7 mg/dL) in males and >356.9 μmol/L (or 6 mg/dL) in females. These cut-off values were based on generally accepted values used in clinical laboratories and in previous studies [29,30].

2.4. Ultrasound Assessment

In order to evaluate the IMT and plaque morphology, Doppler-Duplex ultrasound was used to assess the extracranial portions of the carotid arteries–the common carotid artery (CCA), the bifurcation, the internal carotid artery (ICA), and the external carotid artery (ECA) [31]. After the bifurcation of the CCA was confirmed, the carotid IMT was measured 2 cm proximal to the dilatation of the carotid bulb [32]. Values of IMT ≥ 0.9 mm were considered as increased IMT. Atherosclerotic plaque was defined as a focal structure that penetrates into the arterial lumen with 0.5 mm or 50% of the adjacent IMT or has a thickness of ≥1.5 mm [33]. Ultrasound characterization of plaques was performed bilaterally on 3 segments: the CCA, the bifurcation and the ICA. The morphology of plaques was described based on the assessment of three main features: echogenicity, homogeneity and surface. Area (in mm2) of the plaques was quantified by measuring the cross-sectional area of each plaque in a longitudinal view (in which the plaque was largest), freezing the frame, and tracing around the plaque perimeter with a cursor on the screen [34]. Distinction of plaque types was performed according to the modified Gray–Weale classification: type 1—uniformly an- or hypoechogenic; type 2—predominantly hypoechogenic; type 3—predominantly hyperechogenic; type 4—uniformly hyperechogenic; and type 5—unclassified due to calcification [35]. As previously mentioned, the morphological characteristics of the plaques are related to the risk of stroke—the lower the echogenicity of the plaque, the higher the risk of stroke [19]. In this regard, atherosclerotic plaques of types 1 and 2 are considered vulnerable (or unstable) plaques, with a high risk of stroke, while types 3, 4 and 5 are considered stable plaques, with a lower risk of stroke [36]. Eventually, for the subsequent analysis, the following ultrasound parameters were considered: IMT (mean of right and left sides), number, and type and total area of the plaques (assessed on both CCA and ICA).

2.5. Statistical Analysis

Gaussian distribution of the variables was assessed by evaluating the histograms and Shapiro–Wilk test. Variables are presented as means, medians or proportions where appropriate. Differences between the means of continuous variables were assessed via a two-sample t-test or one-way analysis of variance (ANOVA) and Pearson’s χ2 for categorical variables.
Between-group differences in laboratory and ultrasound parameters were assessed by employing general linear models (GLMs). The models were adjusted for age, sex, concomitant medication (aspirin), creatinine and other cardiovascular risk factors (i.e., arterial hypertension, diabetes mellitus, smoking, total C, LDL-C and HDL-C), where appropriate.
Binary logistic regression was employed to estimate the association between SU levels (as the independent variable) and (i) occurrence of increased IMT, (ii) occurrence of carotid plaques and (iii) occurrence of vulnerable carotid plaques (as dependent variables) in each obesity group. The models were adjusted for age, sex, concomitant medication (aspirin), creatinine and other cardiovascular risk factors. Odds ratios (ORs) with confidence intervals (CIs) were calculated.
A receiver operating characteristic (ROC) analysis was performed to assess the performance of SU levels to detect (i) subjects with increased IMT, (ii) subjects with carotid plaques and (iii) subjects with vulnerable carotid plaques (types 1 and 2) in each obesity group. For each model, the area under the curve (AUC) and CIs were calculated. The performance of models was estimated as excellent (AUC 0.9–1.0), very good (AUC 0.8–0.9), good (AUC 0.7–0.8), satisfactory (AUC 0.6–0.7) and unsatisfactory (AUC 0.5–0.6).
All analyses were carried out using SPSS (version 23.0; IBM, Armonk, NY, USA).

3. Results

3.1. General Characteristics

In this study, 2076 (1307 women) subjects with a mean age of 48.1 ± 13.1 years were included. Among these, 1390 were with different types of obesity (either general, central or mixed) and 686 were non-obese (Table 1). Non-obese subjects were younger compared to obese subjects (ANOVA, F = 71.8, all post hoc p < 0.001). General and mixed obesity groups contained mainly female subjects, while the central obesity group contained mainly male subjects (χ2 = 261.5, p < 0.001). Subjects with general and mixed obesity presented the highest values of BMI (F = 145.4, all post hoc p < 0.001). Subjects with mixed obesity displayed the highest values of abdominal circumference compared to all other three groups (F = 135.1, all post hoc p < 0.001). Among the obesity groups, systolic and diastolic BP did not significantly differ (all post hoc p > 0.05) but was higher compared to the non-obese group (all post hoc p < 0.001). Arterial hypertension was more frequent in subjects with general and mixed obesity compared to subjects with central obesity (χ2 = 89.9, p < 0.001). The highest frequency of smoking (25%) was among subjects with central obesity compared to subjects with general and mixed obesity (χ2 = 130.6, p < 0.001), while diabetes mellitus was more frequent in subjects with mixed obesity (χ2 = 67.3, p < 0.001). The frequency of dyslipidemia was similar among subjects with different types of obesity (χ2 = 2.2, p = 0.13). Subjects with central obesity showed higher values of triglycerides (post hoc p < 0.001) and lower values of HDL-C (post hoc p < 0.001) compared to subjects with mixed obesity. No significant differences in TC and LDL-C were attested among obesity types (all post hoc p > 0.05). Creatinine levels were similar among the obesity groups (all post hoc p > 0.05) but higher compared to the non-obese group (all post hoc p < 0.001). The highest prevalence of aspirin consumption was observed in subjects with mixed and general obesity compared to subjects with central obesity (32 vs. 27 vs. 15%, respectively; χ2 = 50.3, p < 0.001). Subject characteristics are presented in Table 1.

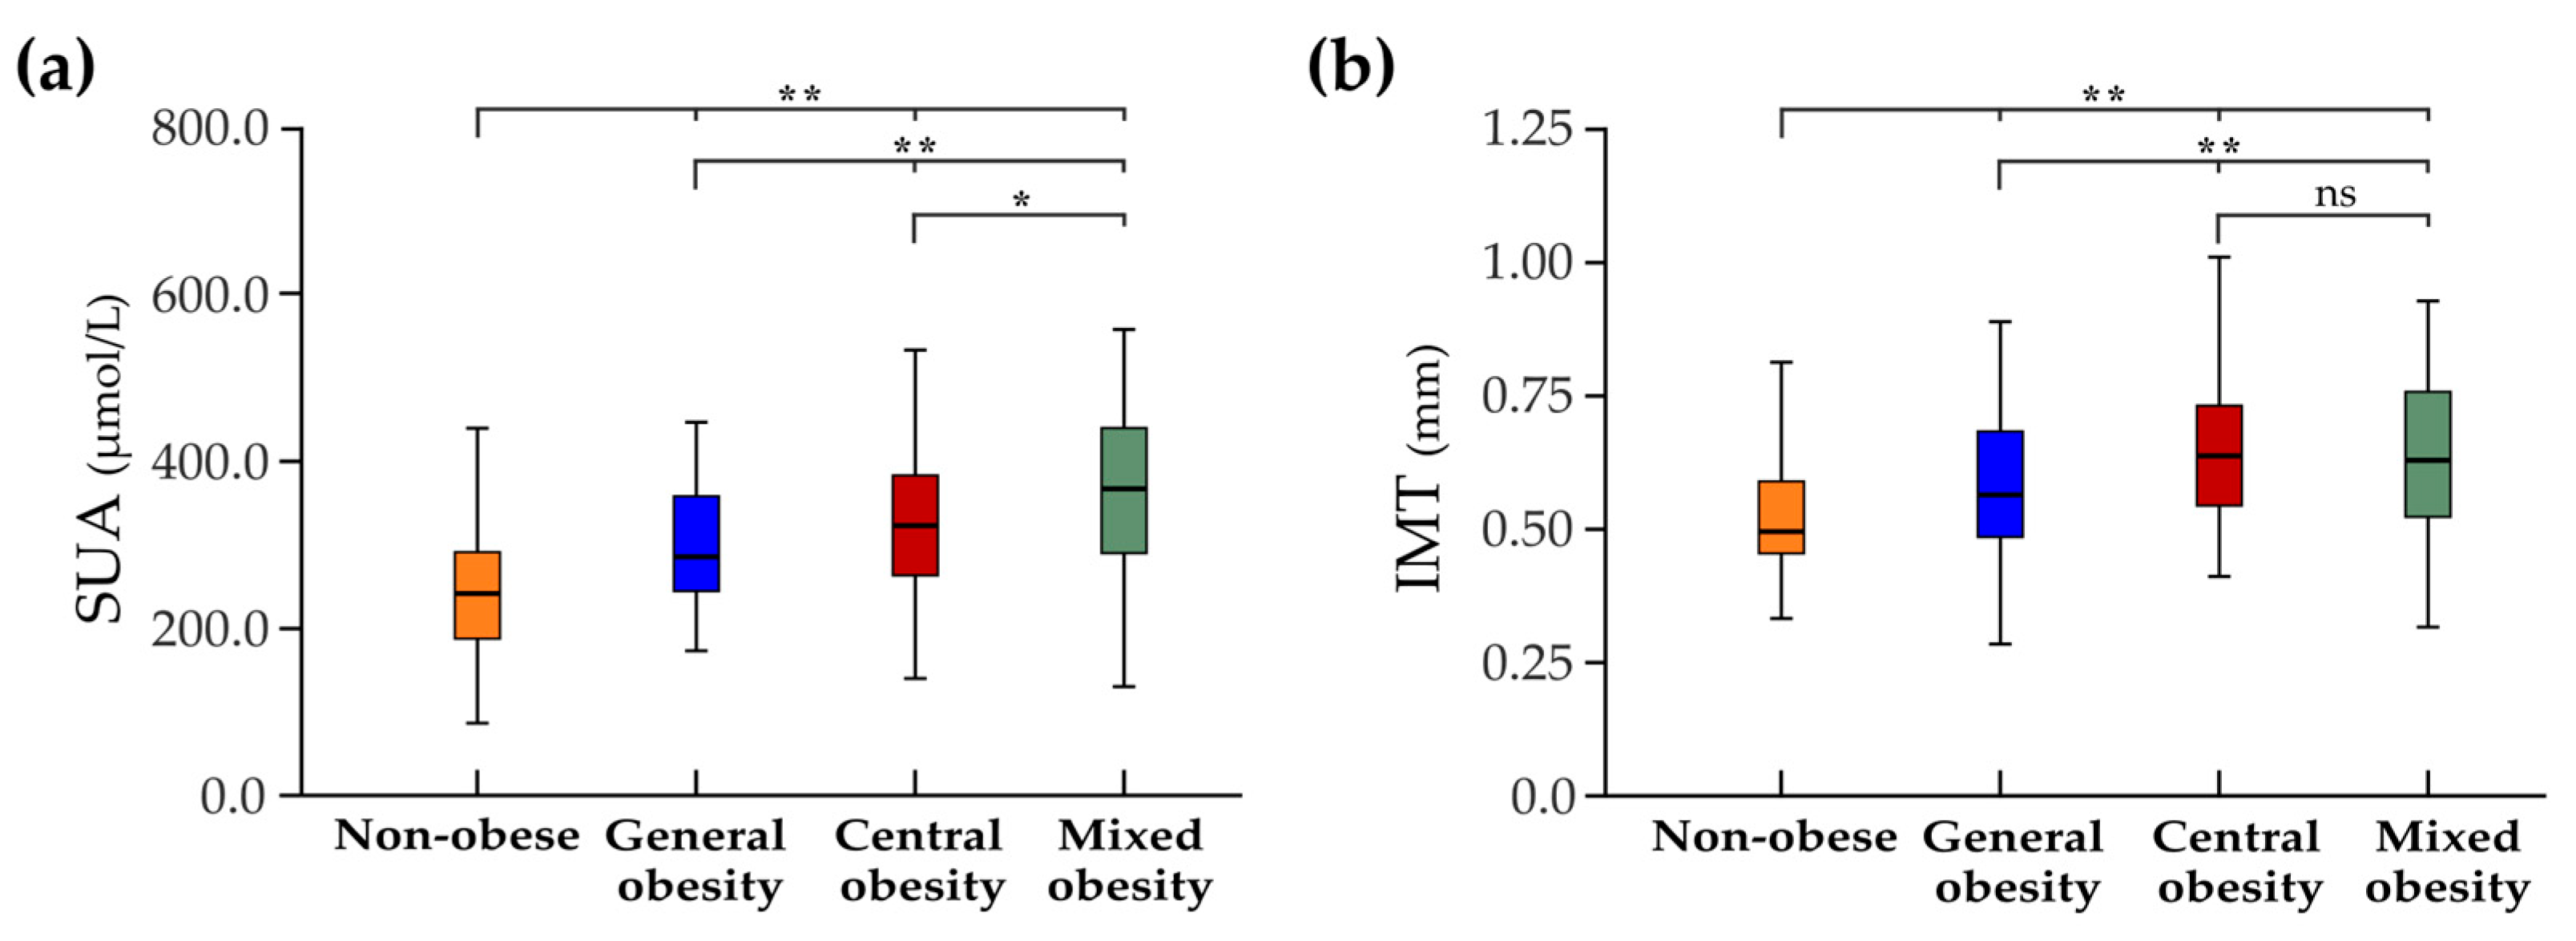
3.2. Serum Urate Levels

Levels of SU were significantly different among subjects with different obesity types (F = 125.1, all post hoc p < 0.001), with highest levels being detected in subjects with central and mixed obesity (Table 1, Figure 1). Within all the studied population, increased levels of SU were identified in 192 (9.2%) subjects, with a higher frequency in all obesity groups compared to non-obese subjects (χ2 = 89.3, p < 0.001). Within obesity groups, the frequency of increased SU levels was the highest in subjects with mixed obesity compared to subjects with general and central obesity (χ2 = 28.7, p < 0.001), for which the frequency was similar (χ2 = 0.4, p = 0.52) (Table 1).

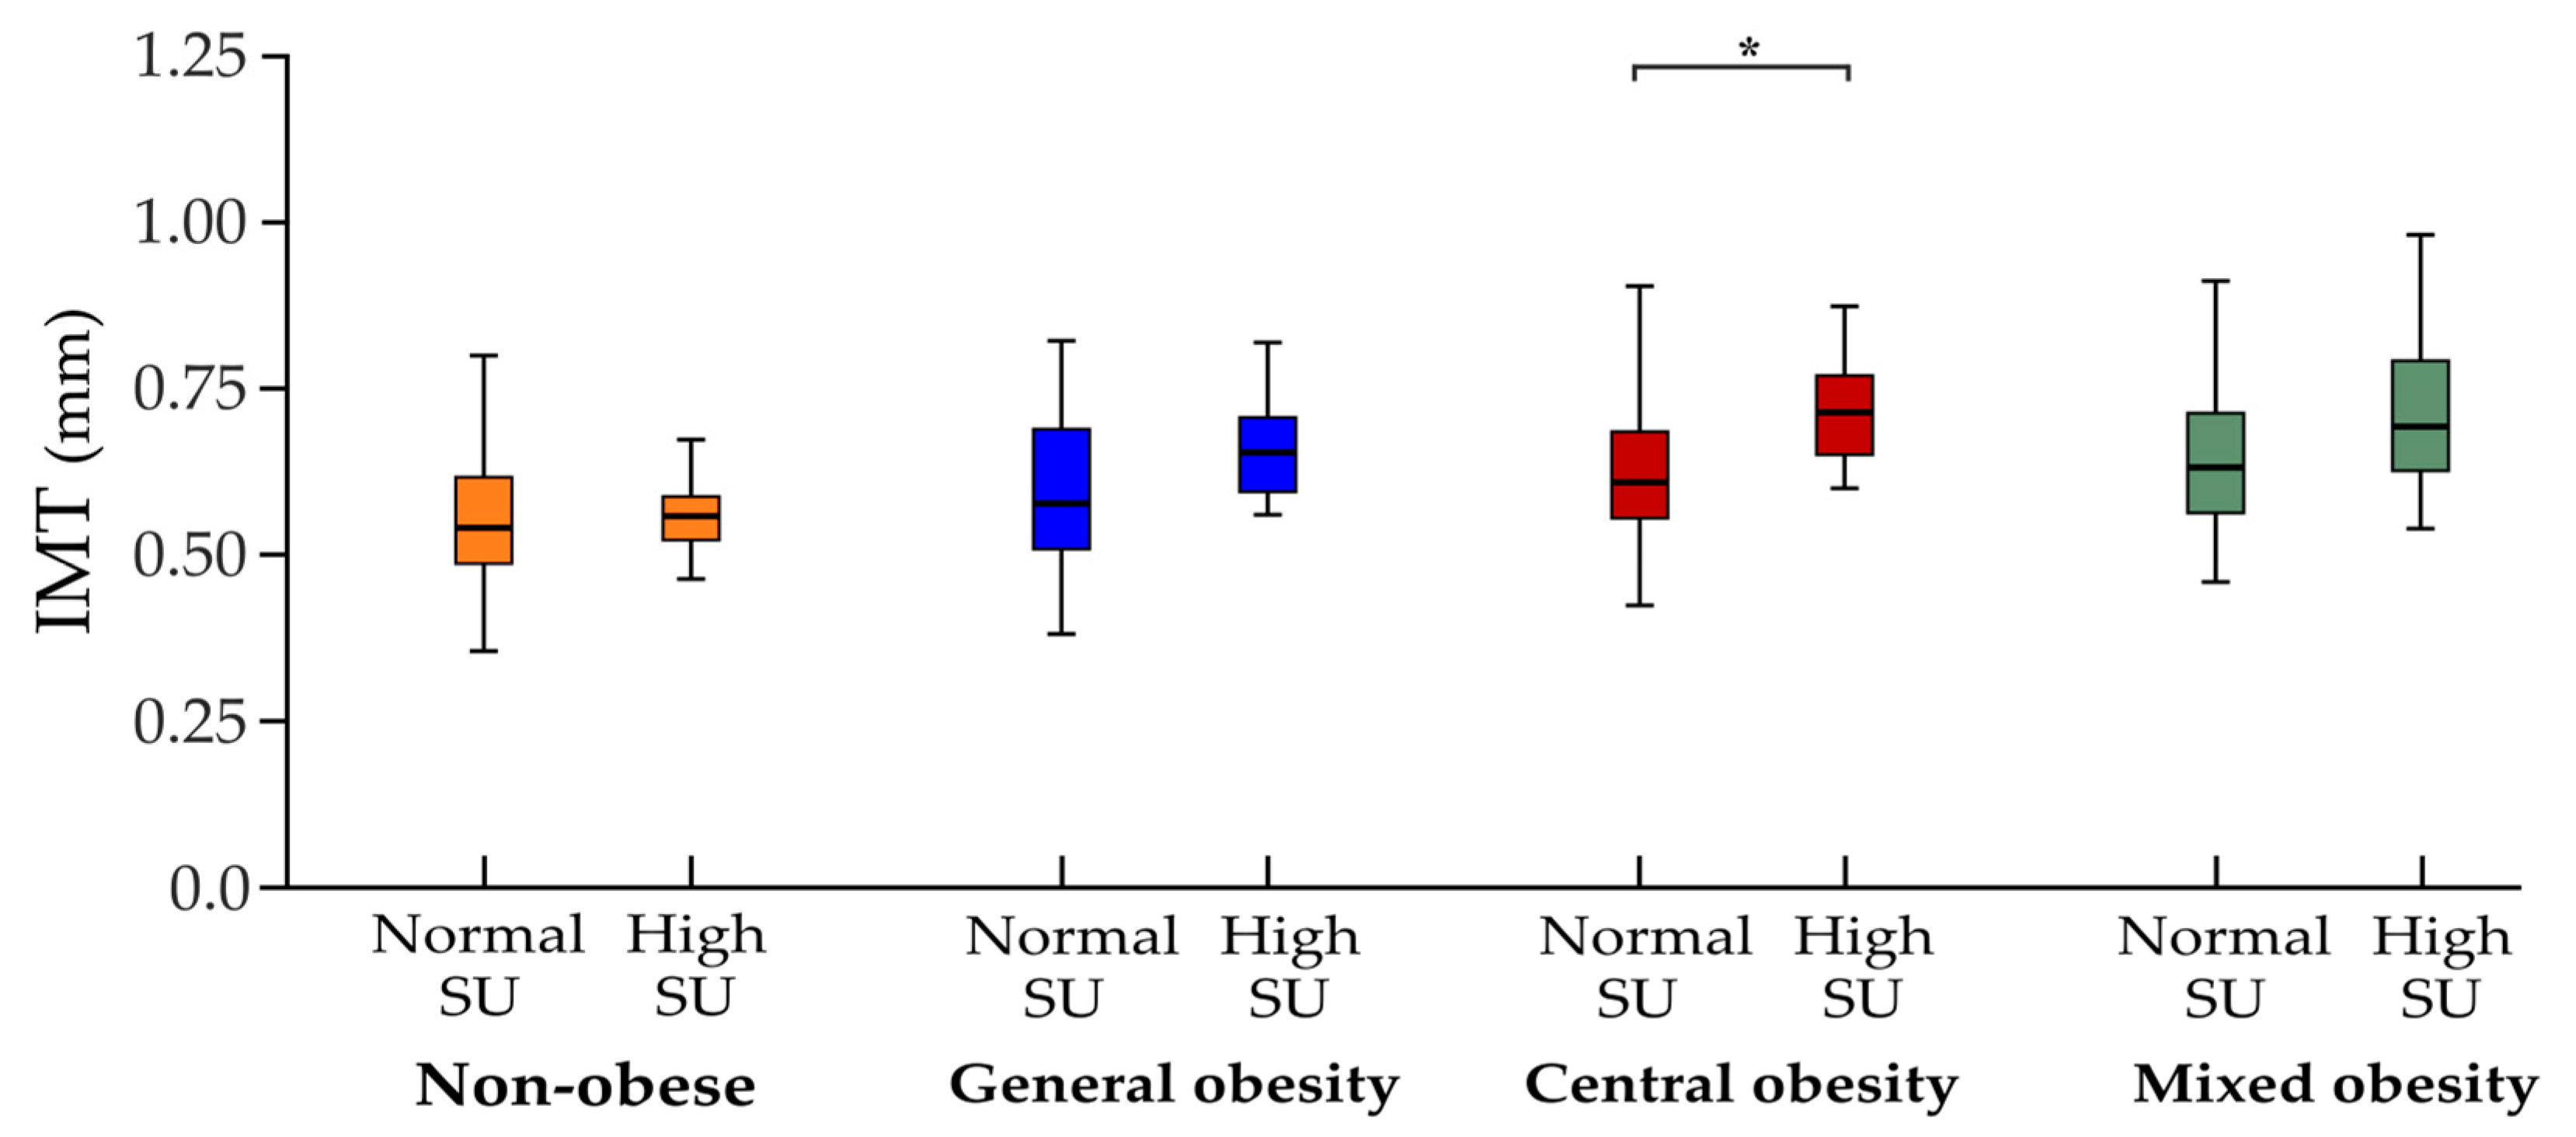
3.3. Ultrasound Characteristics

The highest values of IMT were attested in subjects with central and mixed types of obesity compared to subjects with general obesity and the non-obese (F = 55.7, p < 0.001) (Figure 1, Table 2). The frequency of increased IMT did not differ across the subjects with either type of obesity (χ2 = 3.1, p = 0.21). The frequency (χ2 = 2.9, p = 0.23), number (F = 1.89, p = 0.12) and area (F = 2.13, p = 0.17) of the plaques were similar among the obesity groups but higher compared to the non-obese (all p < 0.001) (Table 2, Figure S1). The type of plaque had a comparable distribution among all the subject groups (χ2 = 1.1, p = 0.77), with stable types of plaque (i.e., types 3, 4 and 5) predominating in all the groups.

3.4. Serum Urate Levels and Carotid Atherosclerosis
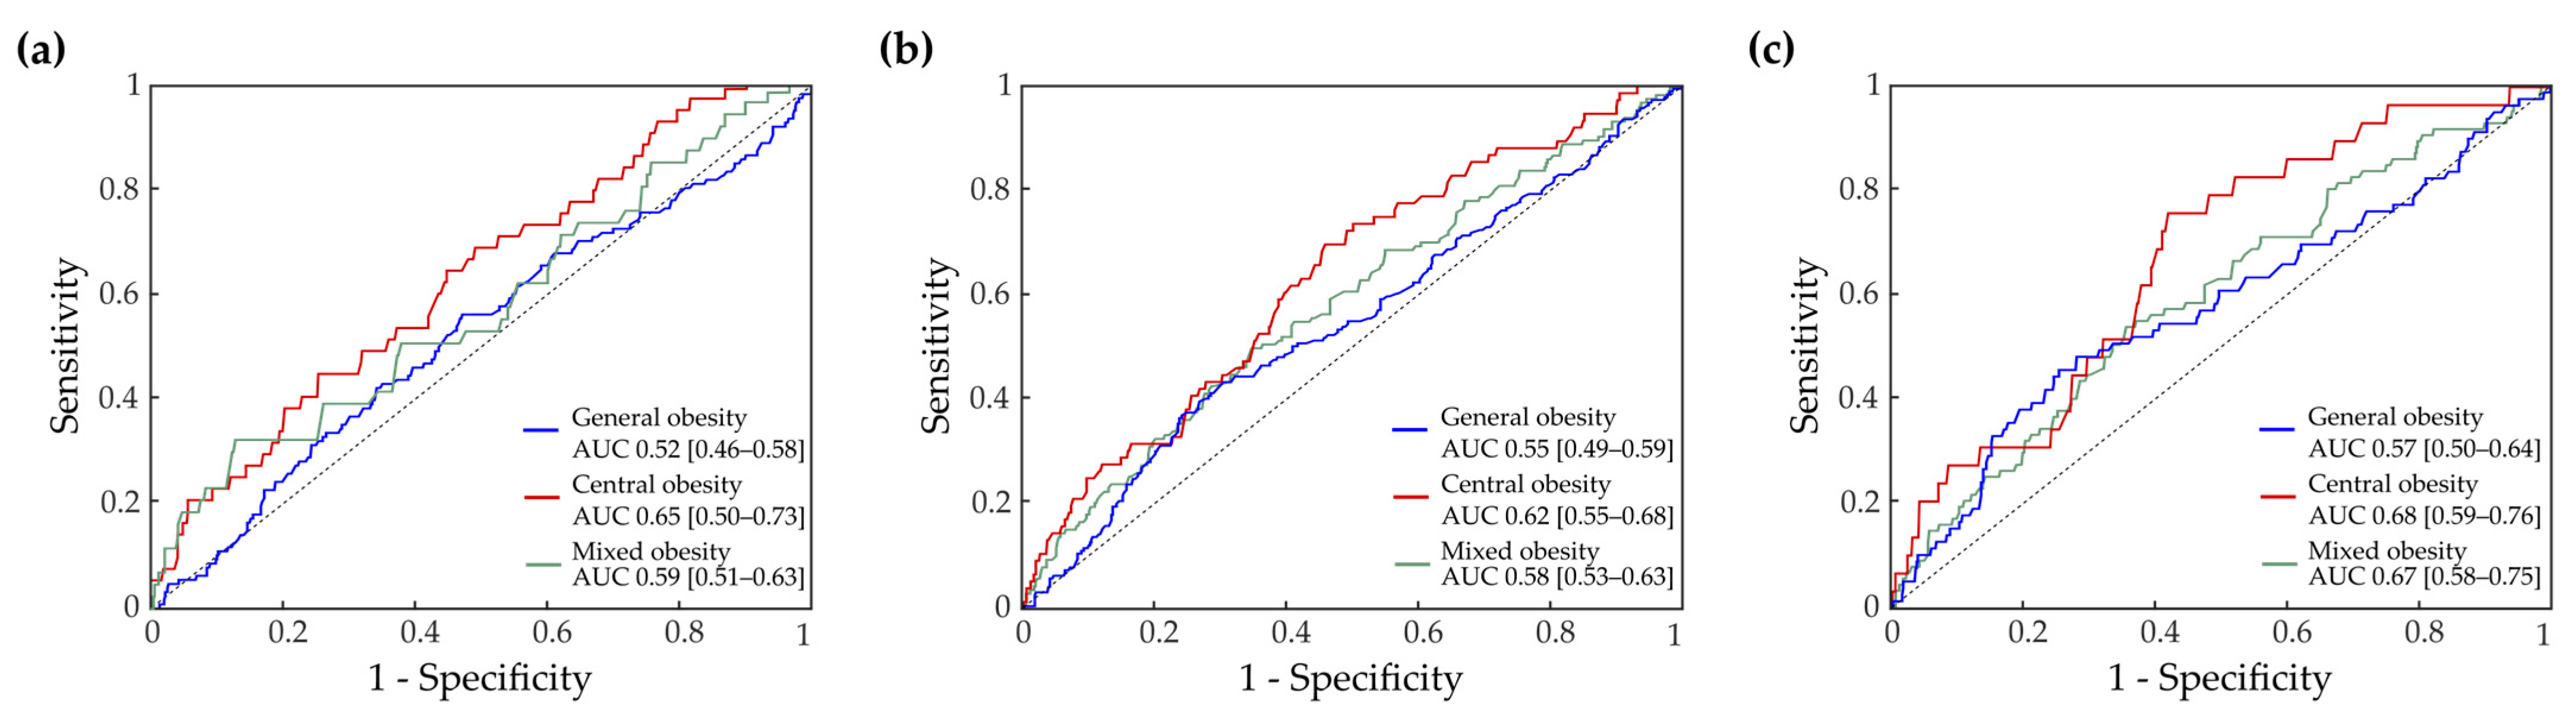
Next, we compared the IMT, number and area of the plaques between subjects with increased and normal SU levels in each studied group. Subjects of either group with increased SU levels tended to have higher IMT estimates, a higher number of plaques and a greater plaque area compared to subjects with normal SU levels. However, the difference was not statistically significant, except for the subjects with central obesity, in which higher IMT values were observed in subjects with increased SU levels (0.70 ± 0.10 vs. 0.62 ± 0.14 mm, p = 0.02) (Figure 2 and Figure S2).
Table 3 shows the relationship between SU levels and ultrasound markers of carotid atherosclerosis estimated with logistic regression models. Increasing levels of SU were associated with a higher frequency of increased IMT only in subjects with central obesity (OR 1.027, 95% CI 1.021–1.038). Interestingly, SU levels were inversely associated with the frequency of carotid plaques in the non-obese (OR 0.992, 95% CI 0.988–0.996). No other associations between SU levels and carotid plaque characteristics were found in the studied groups (Table 3).

3.5. ROC Analysis

Following the ROC analysis, SU levels yielded a satisfactory performance, with AUCs of 0.65 (95% CI 0.50–0.73), 0.62 (95% CI 0.55–0.68) and 0.68 (95% CI 0.59–0.76) in detecting subjects with increased IMT, with carotid plaques and vulnerable plaque types, respectively, only within the group of central obesity (Figure 3). For all other obesity groups, the performance of AUC was unsatisfactory, ranging between 0.5 and 0.6 (Figure 3).

4. Discussion

In this study, we investigated the levels of SU, markers of carotid atherosclerosis as well as their associations in subjects with different types of obesity. Specifically, we demonstrated that SU levels and IMT values were the highest among subjects with central and mixed types of obesity. However, higher levels of SU were associated with increased IMT occurrence and were able to detect subjects with carotid atherosclerosis only within the group of central obesity. These findings point to the relevance of SU levels for carotid atherosclerosis in subjects with obesity, particularly in those with central obesity.
A substantial body of evidence points to a clear relation between high levels of SU and carotid atherosclerosis. Previous studies have shown a positive correlation between SU levels and carotid IMT values [21,24,37], documented in healthy subjects as well as in subjects with hypertension, diabetes, metabolic syndrome and kidney diseases [3,21]. In our study, we found that higher SU levels were associated with a higher occurrence of increased IMT but only among subjects with central obesity. Moreover, only within the group of central obesity, subjects with high SU levels displayed higher estimates of IMT compared to obese subjects with normal SU levels. At the same time, we did not find a significant association between SU levels and the occurrence of increased IMT in subjects with general obesity, despite the reports on tight correlation between SU and BMI [8,9,10]. This might be related to a relatively small number of subjects with general obesity included in our study or to the fact that we included only obese subjects, in contrast to other studies that included subjects with normal and high BMI values. In addition, this might be attributed to the evidence that values of WC correlate better than BMI with subclinical atherosclerosis, as evaluated by IMT [38]. Taking into account the findings of previous studies claiming that central obesity is one of the main contributors of increased SU levels in the general population [5,13] and our findings of the highest SU levels and IMT values among subjects with central obesity, it might be postulated that high SU levels favor carotid atherosclerosis, particularly in subjects with central obesity.
Several studies have explored the link between SU levels and the occurrence of carotid plaques, with otherwise inconsistent findings; some studies found no association between SU and the presence of carotid plaques [39], while other studies attested a clear association [22,40,41,42]. According to the latter, the association between SU and carotid plaques increased with elevating SU levels and demonstrated a dose-response relation only in men [22] or only in women [41]. Interestingly, SU was shown to be an independent risk factor for incidence of carotid plaques only in men without metabolic syndrome and not in men or women with metabolic syndrome [40]. Based on our findings, we could not find any positive association between SU levels and the presence of carotid plaques in either obesity group. A higher number and area of plaques could be observed in patients with central and mixed types of obesity, but without reaching statistical significance. On the other side, an inverse association between SU levels and the occurrence of carotid plaques was observed in non-obese subjects. One may speculate that this might be related to the beneficial effects of SU, which exerts not only pro-oxidative and pro-inflammatory activity but also has an extracellular anti-oxidative activity [43,44]. Recent studies suggested that SU levels are also related to carotid plaque instability [23,42]. Thus, elevated SU levels were independently associated with the prevalence of vulnerable carotid plaques in middle-aged adults [23] and were more commonly detected in symptomatic compared to asymptomatic carotid plaques [42], thereby indicating that SU may play an important role in carotid plaque inflammation and determine plaque vulnerability and subsequent rupture. Our results did not find any association between SU levels and the presence of vulnerable plaques in patients with obesity. A higher frequency of vulnerable plaques was observed in subjects with central obesity compared to subjects with general and mixed obesity types (63% vs. 53% vs. 58%, respectively); however, this was not statistically significant. In this regard, the heterogeneity among the available studies in terms of subjects’ age, concomitant comorbidities, confounding factors and used measures of obesity may account for existing controversies.
The clinical relevance of studying SU levels relies on their strong correlation with cardiovascular risk [3,45]. There is emerging evidence that an increase in SU to levels even lower than those typically associated with gout is independently associated with increased cardiovascular risk in both the general and hypertensive populations [46]. Similar studies should also be conducted in other high risk populations, including subjects with obesity. The latest guidelines on arterial hypertension (2018, European Society of Cardiology/European Society of Hypertension ESC/ESH) have officially introduced the evaluation of SU for the stratification of a patient’s cardiovascular risk [46]. Measurement of SU levels is recommended as part of the screening of hypertensive patients [3]. Our observations on the ability of SU levels to detect subjects with increased IMT and subjects with vulnerable plaques within the group of central obesity highlights the necessity of careful SU management in this specific population. The control of SU levels as an early prevention strategy might be helpful in reducing the risk of atherosclerosis, and hence reduce cardiovascular and cerebrovascular diseases. In this regard, pharmacological interventions, e.g., with sodium/glucose co-transporter-2 (SGLT2) inhibitors, which are antidiabetic agents that also lower SU levels, may be an important component of this strategy [44].
Several limitations are applicable to our study. First, data on concomitant administration of drugs, other than aspirin, affecting the SU levels (e.g., thiazide diuretics, nicotinic acid, etc.) were incomplete for the included subjects, and their effects could not be assessed. Second, subjects with general obesity were relatively underrepresented in our study, with only 59 subjects included. Future studies with a larger sample size may provide additional findings regarding the SU effects on carotid atherosclerosis in this patient population. Third, categorization of subjects into general, central and mixed obesity types is based on anthropometric measures and does not take into account physiological or pathological metabolic characteristics. Obesity phenotypes are heterogeneous, ranging from metabolically healthy to unhealthy obesity, with different risks for cardiovascular diseases [47]. Fourth, although our study revealed the association between SU levels and IMT, no causality can be inferred due to the cross-sectional nature of the study. Finally, even though the performance of ROC models was satisfactory, increased levels of SU cannot be considered a reliable marker in detecting subjects with carotid atherosclerosis, thus requiring further investigation and validation studies.

5. Conclusions

The results of our study indicate that among studied obesity types, subjects with central and mixed phenotypes were characterized by the highest SU and IMT values. Only in subjects with central obesity, higher SU levels were significantly related to a higher occurrence of increased IMT and were able to detect those with carotid atherosclerosis. Therefore, subjects with central obesity require a close observation for managing SU levels and its related complications.

Supplementary Materials

The following supporting information can be downloaded at: https://www.mdpi.com/article/10.3390/biomedicines11071897/s1, Figure S1: Number and area of plaques across subject groups; Figure S2: Subgroup analysis of number and area of plaques.

Author Contributions

Conceptualization, D.E., D.C. and S.A.G.; methodology, D.E., D.C. and S.A.G.; software, D.E.; validation, D.E., N.C., D.G., P.L., R.R., T.B., A.M., M.V., C.C., P.B., C.D., A.B., I.B., A.C., D.M., M.C., E.Z. and D.C.; formal analysis, D.E.; investigation, D.E., N.C., D.G., P.L., R.R., T.B., A.M., M.V., C.C., P.B., C.D., A.B., I.B. and A.C.; resources, S.A.G.; data curation, D.E.; writing—original draft preparation, D.E., D.C. and S.A.G.; writing—review and editing, D.E., N.C., D.G., P.L., E.Z., D.C. and S.A.G.; visualization, D.E.; supervision, D.C. and S.A.G.; project administration, S.A.G.; funding acquisition, S.A.G. All authors have read and agreed to the published version of the manuscript.

Funding

This research was supported by the Nicolae Testemitanu State University of Medicine and Pharmacy, Institute of Emergency Medicine and National Agency for Research and Development, Chisinau, Moldova.

Institutional Review Board Statement

The study was conducted in accordance with the Declaration of Helsinki, and approved by the Ethics Research Committee of the Nicolae Testemitanu State University of Medicine and Pharmacy in the Republic of Moldova.

Informed Consent Statement

Signed informed consent from each subject was obtained prior to study inclusion.

Data Availability Statement

The data are available from the corresponding author upon reasonable request.

Acknowledgments

We would like to thank the subjects for their participation in this study.

Conflicts of Interest

The authors declare no conflict of interest. The funders had no role in the design of the study; in the collection, analyses, or interpretation of data; in the writing of the manuscript, or in the decision to publish the results.

References

  1. Yusuf, S.; Joseph, P.; Rangarajan, S.; Islam, S.; Mente, A.; Hystad, P.; Brauer, M.; Kutty, V.R.; Gupta, R.; Wielgosz, A. Modifiable risk factors, cardiovascular disease, and mortality in 155 722 individuals from 21 high-income, middle-income, and low-income countries (PURE): A prospective cohort study. Lancet 2020, 395, 795–808. [Google Scholar] [CrossRef] [PubMed] [Green Version]
  2. Bos, M.J.; Koudstaal, P.J.; Hofman, A.; Witteman, J.C.; Breteler, M.M. Uric acid is a risk factor for myocardial infarction and stroke: The Rotterdam study. Stroke 2006, 37, 1503–1507. [Google Scholar] [CrossRef] [PubMed] [Green Version]
  3. Borghi, C.; Rosei, E.A.; Bardin, T.; Dawson, J.; Dominiczak, A.; Kielstein, J.T.; Manolis, A.J.; Perez-Ruiz, F.; Mancia, G. Serum uric acid and the risk of cardiovascular and renal disease. J. Hypertens. 2015, 33, 1729–1741. [Google Scholar] [CrossRef]
  4. Stack, A.; Hanley, A.; Casserly, L.; Cronin, C.; Abdalla, A.; Kiernan, T.; Murthy, B.; Hegarty, A.; Hannigan, A.; Nguyen, H. Independent and conjoint associations of gout and hyperuricaemia with total and cardiovascular mortality. QJM Int. J. Med. 2013, 106, 647–658. [Google Scholar] [CrossRef] [PubMed] [Green Version]
  5. Gagliardi, A.C.; Miname, M.H.; Santos, R.D. Uric acid: A marker of increased cardiovascular risk. Atherosclerosis 2009, 202, 11–17. [Google Scholar] [CrossRef]
  6. Mandviwala, T.; Khalid, U.; Deswal, A. Obesity and cardiovascular disease: A risk factor or a risk marker? Curr. Atheroscler. Rep. 2016, 18, 21. [Google Scholar] [CrossRef]
  7. Kernan, W.N.; Inzucchi, S.E.; Sawan, C.; Macko, R.F.; Furie, K.L. Obesity: A stubbornly obvious target for stroke prevention. Stroke 2013, 44, 278–286. [Google Scholar] [CrossRef]
  8. Yue, J.-R.; Huang, C.-Q.; Dong, B.-R. Association of serum uric acid with body mass index among long-lived Chinese. Exp. Gerontol. 2012, 47, 595–600. [Google Scholar] [CrossRef]
  9. Tanaka, K.; Ogata, S.; Tanaka, H.; Omura, K.; Honda, C.; Group, O.T.R.; Hayakawa, K. The relationship between body mass index and uric acid: A study on Japanese adult twins. Environ. Health Prev. Med. 2015, 20, 347–353. [Google Scholar] [CrossRef] [Green Version]
  10. Liu, D.-m.; Gan, L.; Su, Y.; Li, F. Association between serum uric acid level and body mass index in sex-and age-specific groups in southwestern China. Endocr. Pract. 2019, 25, 438–445. [Google Scholar] [CrossRef]
  11. Ishizaka, N.; Ishizaka, Y.; Toda, A.; Tani, M.; Koike, K.; Yamakado, M.; Nagai, R. Changes in waist circumference and body mass index in relation to changes in serum uric acid in Japanese individuals. J. Rheumatol. 2010, 37, 410–416. [Google Scholar] [CrossRef] [PubMed]
  12. Biradar, M.I.; Chiang, K.-M.; Yang, H.-C.; Huang, Y.-T.; Pan, W.-H. The causal role of elevated uric acid and waist circumference on the risk of metabolic syndrome components. Int. J. Obes. 2020, 44, 865–874. [Google Scholar] [CrossRef]
  13. Onat, A.; Uyarel, H.; Hergenc, G.; Karabulut, A.; Albayrak, S.; Sarı, I.; Yazıcı, M.; Keleş, I. Serum uric acid is a determinant of metabolic syndrome in a population-based study. Am. J. Hypertens. 2006, 19, 1055–1062. [Google Scholar] [CrossRef] [PubMed] [Green Version]
  14. Groppa, S. Accidentul Vascular Cerebral: Epidemiologie, Factori de Risc, Prevenție; Î. S. Firma Editorial-Poligrafică “Tipografia Centrală”: Chişinău, Moldova, 2020; 212p. [Google Scholar]
  15. Groppa, S.; Zota, E.; Efremova, D.; Chiforişina, V. Profilaxia secundară a accidentului vascular cerebral ischemic şi factorii de risc modificabili în populaţia Republicii Moldova. Bul. Acad. Ştiinţe Moldovei Ştiinţe Med. 2015, 49, 130–133. [Google Scholar]
  16. Bots, M.L.; Hoes, A.W.; Koudstaal, P.J.; Hofman, A.; Grobbee, D.E. Common carotid intima-media thickness and risk of stroke and myocardial infarction: The Rotterdam Study. Circulation 1997, 96, 1432–1437. [Google Scholar] [CrossRef] [PubMed] [Green Version]
  17. Tsivgoulis, G.; Vemmos, K.; Papamichael, C.; Spengos, K.; Manios, E.; Stamatelopoulos, K.; Vassilopoulos, D.; Zakopoulos, N. Common carotid artery intima-media thickness and the risk of stroke recurrence. Stroke 2006, 37, 1913–1916. [Google Scholar] [CrossRef] [PubMed]
  18. Parish, S.; Arnold, M.; Clarke, R.; Du, H.; Wan, E.; Kurmi, O.; Chen, Y.; Guo, Y.; Bian, Z.; Collins, R. Assessment of the role of carotid atherosclerosis in the association between major cardiovascular risk factors and ischemic stroke subtypes. JAMA Netw. Open 2019, 2, e194873. [Google Scholar] [CrossRef]
  19. Geroulakos, G.; Domjan, J.; Nicolaides, A.; Stevens, J.; Labropoulos, N.; Ramaswami, G.; Belcaro, G.; Mansfield, A. Ultrasonic carotid artery plaque structure and the risk of cerebral infarction on computed tomography. J. Vasc. Surg. 1994, 20, 263–266. [Google Scholar] [CrossRef] [Green Version]
  20. Kitamura, A.; Iso, H.; Imano, H.; Ohira, T.; Okada, T.; Sato, S.; Kiyama, M.; Tanigawa, T.; Yamagishi, K.; Shimamoto, T. Carotid intima-media thickness and plaque characteristics as a risk factor for stroke in Japanese elderly men. Stroke 2004, 35, 2788–2794. [Google Scholar] [CrossRef] [Green Version]
  21. Ma, M.; Wang, L.; Huang, W.; Zhong, X.; Li, L.; Wang, H.; Peng, B.; Mao, M. Meta-analysis of the correlation between serum uric acid level and carotid intima-media thickness. PLoS ONE 2021, 16, e0246416. [Google Scholar] [CrossRef]
  22. Neogi, T.; Ellison, R.C.; Hunt, S.; Terkeltaub, R.; Felson, D.T.; Zhang, Y. Serum uric acid is associated with carotid plaques: The National Heart, Lung, and Blood Institute Family Heart Study. J. Rheumatol. 2009, 36, 378–384. [Google Scholar] [CrossRef] [PubMed] [Green Version]
  23. Li, Q.; Zhou, Y.; Dong, K.; Wang, A.; Yang, X.; Zhang, C.; Zhu, Y.; Wu, S.; Zhao, X. The association between serum uric acid levels and the prevalence of vulnerable atherosclerotic carotid plaque: A cross-sectional study. Sci. Rep. 2015, 5, 10003. [Google Scholar] [CrossRef] [PubMed] [Green Version]
  24. Efremova, D.; Ciolac, D.; Zota, E.; Glavan, D.; Ciobanu, N.; Aulitzky, W.; Nics, A.M.; Trinka, E.; Yamada, C.; Movila, A. Dissecting the Spectrum of Stroke Risk Factors in an Apparently Healthy Population: Paving the Roadmap to Primary Stroke Prevention. J. Cardiovasc. Dev. Dis. 2023, 10, 35. [Google Scholar] [CrossRef]
  25. Efremova, D.; Groppa, S. Factorii de risc ai accidentului vascular cerebral la adulţii tineri în populaţia Republicii Moldova: Studiu descriptiv. Rev. Ştiinţe Ale Sănătăţii Mold. 2020, 25, 31–39. [Google Scholar]
  26. World Health Organization. Waist Circumference and Waist-Hip Ratio: Report of a WHO Expert Consultation, Geneva, 8–11 December 2008; World Health Organization: Geneva, Switzerland, 2011. [Google Scholar]
  27. James, P.A.; Oparil, S.; Carter, B.L.; Cushman, W.C.; Dennison-Himmelfarb, C.; Handler, J.; Lackland, D.T.; LeFevre, M.L.; MacKenzie, T.D.; Ogedegbe, O. 2014 evidence-based guideline for the management of high blood pressure in adults: Report from the panel members appointed to the Eighth Joint National Committee (JNC 8). JAMA 2014, 311, 507–520. [Google Scholar] [CrossRef] [PubMed] [Green Version]
  28. Fodor, G. Primary prevention of CVD: Treating dyslipidemia. Am. Fam. Physician 2011, 83, 1207–1208. [Google Scholar]
  29. Neilson, J.; Bonnon, A.; Dickson, A.; Roddy, E. Gout: Diagnosis and management—Summary of NICE guidance. BMJ 2022, 378, o1754. [Google Scholar] [CrossRef]
  30. Maloberti, A.; Giannattasio, C.; Bombelli, M.; Desideri, G.; Cicero, A.; Muiesan, M.; Rosei, E.; Salvetti, M.; Ungar, A.; Rivasi, G. Hyperuricemia and risk of cardiovascular outcomes: The experience of the URRAH (uric acid right for heart health) project. High Blood Press. Cardiovasc. Prev. 2020, 27, 121–128. [Google Scholar] [CrossRef]
  31. Groppa, S.; Zota, E.; Chiforişina, V.; Efremova, D. Importanţa caracteristicilor ultrasonografice a plăcilor aterosclerotice carotidiene ca factor predictor a accidentului vascular cerebral ischemic. Bul. Acad. Ştiinţe Moldovei Ştiinţe Med. 2015, 49, 134–137. [Google Scholar]
  32. Touboul, P.-J.; Hennerici, M.; Meairs, S.; Adams, H.; Amarenco, P.; Bornstein, N.; Csiba, L.; Desvarieux, M.; Ebrahim, S.; Fatar, M. Mannheim carotid intima-media thickness consensus (2004–2006). Cerebrovasc. Dis. 2007, 23, 75–80. [Google Scholar] [CrossRef]
  33. Csiba, L.; Baracchini, C. Manual of Neurosonology; Cambridge University Press: Cambridge, UK, 2016. [Google Scholar]
  34. Spence, J.D. Technology insight: Ultrasound measurement of carotid plaque—Patient management, genetic research, and therapy evaluation. Nat. Clin. Pract. Neurol. 2006, 2, 611–619. [Google Scholar] [CrossRef]
  35. Geroulakos, G.; Ramaswami, G.; Nicolaides, A.; James, K.; Labropoulos, N.; Belcaro, G.; Holloway, M. Characterization of symptomatic and asymptomatic carotid plaques using high-resolution real-time ultrasonography. J. Br. Surg. 1993, 80, 1274–1277. [Google Scholar] [CrossRef]
  36. Topakian, R.; King, A.; Kwon, S.; Schaafsma, A.; Shipley, M.; Markus, H.; Investigators, A. Ultrasonic plaque echolucency and emboli signals predict stroke in asymptomatic carotid stenosis. Neurology 2011, 77, 751–758. [Google Scholar] [CrossRef] [PubMed]
  37. Ma, M.; Wang, L.; Zhong, X.; Zhong, L.; Chen, R.; Li, L.; Mao, M. Age and gender differences between carotid intima-media thickness and serum uric acid. Am. J. Cardiol. 2022, 172, 137–143. [Google Scholar] [CrossRef] [PubMed]
  38. Recio-Rodriguez, J.I.; Gomez-Marcos, M.A.; Patino-Alonso, M.C.; Agudo-Conde, C.; Rodriguez-Sanchez, E.; Garcia-Ortiz, L.; Group, V. Abdominal obesity vs general obesity for identifying arterial stiffness, subclinical atherosclerosis and wave reflection in healthy, diabetics and hypertensive. BMC Cardiovasc. Disord. 2012, 12, 3. [Google Scholar] [CrossRef] [Green Version]
  39. Oikonen, M.; Wendelin-Saarenhovi, M.; Lyytikäinen, L.P.; Siitonen, N.; Loo, B.M.; Jula, A.; Seppälä, I.; Saarikoski, L.; Lehtimäki, T.; Hutri-Kähönen, N.; et al. Associations between serum uric acid and markers of subclinical atherosclerosis in young adults. The cardiovascular risk in Young Finns study. Atherosclerosis 2012, 223, 497–503. [Google Scholar] [CrossRef]
  40. Ishizaka, N.; Ishizaka, Y.; Toda, E.-I.; Nagai, R.; Yamakado, M. Association between serum uric acid, metabolic syndrome, and carotid atherosclerosis in Japanese individuals. Arterioscler. Thromb. Vasc. Biol. 2005, 25, 1038–1044. [Google Scholar] [CrossRef] [PubMed] [Green Version]
  41. Sugiura, T.; Dohi, Y.; Takagi, Y.; Yokochi, T.; Yoshikane, N.; Suzuki, K.; Tomiishi, T.; Nagami, T.; Iwase, M.; Takase, H. Increased impact of serum uric acid on arterial stiffness and atherosclerosis in females. J. Atheroscler. Thromb. 2022, 29, 1672–1691. [Google Scholar] [CrossRef]
  42. Nardi, V.; Franchi, F.; Prasad, M.; Fatica, E.M.; Alexander, M.P.; Bois, M.C.; Lam, J.; Singh, R.J.; Meyer, F.B.; Lanzino, G. Uric acid expression in carotid atherosclerotic plaque and serum uric acid are associated with cerebrovascular events. Hypertension 2022, 79, 1814–1823. [Google Scholar] [CrossRef]
  43. Puddu, P.; Puddu, G.M.; Cravero, E.; Vizioli, L.; Muscari, A. The relationships among hyperuricemia, endothelial dysfunction, and cardiovascular diseases: Molecular mechanisms and clinical implications. J. Cardiol. 2012, 59, 235–242. [Google Scholar] [CrossRef] [Green Version]
  44. Gherghina, M.-E.; Peride, I.; Tiglis, M.; Neagu, T.P.; Niculae, A.; Checherita, I.A. Uric Acid and Oxidative Stress—Relationship with Cardiovascular, Metabolic, and Renal Impairment. Int. J. Mol. Sci. 2022, 23, 3188. [Google Scholar] [CrossRef]
  45. Feig, D.I.; Kang, D.-H.; Johnson, R.J. Uric acid and cardiovascular risk. N. Engl. J. Med. 2008, 359, 1811–1821. [Google Scholar] [CrossRef] [PubMed]
  46. Williams, B.; Mancia, G.; Spiering, W.; Agabiti Rosei, E.; Azizi, M.; Burnier, M.; Clement, D.L.; Coca, A.; De Simone, G.; Dominiczak, A. 2018 ESC/ESH Guidelines for the management of arterial hypertension: The Task Force for the management of arterial hypertension of the European Society of Cardiology (ESC) and the European Society of Hypertension (ESH). Eur. Heart J. 2018, 39, 3021–3104. [Google Scholar] [CrossRef] [PubMed] [Green Version]
  47. Pujia, R.; Tarsitano, M.G.; Arturi, F.; De Lorenzo, A.; Lenzi, A.; Pujia, A.; Montalcini, T. Advances in phenotyping obesity and in its dietary and pharmacological treatment: A narrative review. Front. Nutr. 2022, 9, 804719. [Google Scholar] [CrossRef] [PubMed]
Figure 1. Serum urate (SU) and intima-media thickness (IMT) across the studied groups. Comparison of SU levels (a) and IMT values (b) between the non-obese and subjects with general, central and mixed obesity; * p < 0.05, ** p < 0.001, ns—non-significant.
Biomedicines 11 01897 g001
Figure 2. Estimates of intima-media thickness (IMT) across subject subgroups. Comparison of IMT values between subjects with normal and high serum urate (SU) levels among the non-obese and general, central and mixed obesity groups; * p < 0.05.
Biomedicines 11 01897 g002
Figure 3. Receiver operating characteristic (ROC) curve analysis. Area under the ROC curve (AUC) assessing the performance of serum urate in detection of subjects with increased IMT (a), subjects with carotid plaques (b) and subjects with vulnerable carotid plaques (types 1 and 2) (c) in each obesity group. In the legend, AUCs with 95% confidence intervals are shown for each obesity group.
Biomedicines 11 01897 g003
Table 1. Demographic, clinical and laboratory characteristics of the study subjects.
ParameterNon-Obese
(n = 686)
General Obesity
(n = 59)
Central Obesity
(n = 616)
Mixed Obesity
(n = 715)
p-Value
Age, mean ± SD42.8 ± 13.351.5 ± 10.448.9 ± 13.052.4 ± 10.9<0.001  a
Sex (female/male), n (%)602 (88)/84 (12)58 (98)/1 (2)169 (27)/447 (73)478 (67)/237 (33)<0.001  b
Systolic BP, mean ± SD, mmHg125.8 ± 17.2139.1 ± 19.1137.0 ± 20.2145.7 ± 21.3<0.001  c
Diastolic BP, mean ± SD, mmHg79.0 ± 10.084.5 ± 10.283.5 ± 10.688.3 ± 10.8<0.001  c
BMI, mean ± SD, kg/m223.8 ± 3.031.9 ± 1.726.3 ± 2.434.9 ± 4.1NA
Abdominal circumference, mean ± SD, cm80.9 ± 7.889.1 ± 5.896.1 ± 7.9109.6 ± 9.5NA
Arterial hypertension, n (%)113 (16)26 (44)164 (27)373 (52)<0.001  b
Diabetes mellitus, n (%)12 (7)5 (8)25 (4)80 (11)<0.001  b
Dyslipidemia, n (%)377 (55)45 (76)411 (66)544 (76)<0.001  b
Smoking, n (%)49 (7)1 (2)159 (25)60 (8)<0.001  b
Serum urate, mean ± SD, μmol/L234.2 ± 59.8272.9 ± 61.8301.2 ± 73.1309.4 ± 82.2<0.001  d
Increased serum urate, n (%)12 (2)6 (10)48 (8)126 (17)<0.001  b
FBG, mean ± SD, mmol/L4.7 ± 0.74.8 ± 0.65.0 ± 1.25.5 ± 1.8<0.001  d
Creatinine, mean ± SD, mmol/L68.6 ± 14.472.9 ± 10.876.5 ± 16.573.4 ± 16.1<0.01  e
Triglycerides, mean ± SD, mmol/L1.0 ± 0.61.4 ± 0.61.3 ± 0.71.5 ± 0.9<0.001  e
Total-C, mean ± SD, mmol/L5.0 ± 0.95.4 ± 1.05.3 ± 1.15.5 ± 1.0<0.001  e
LDL-C, mean ± SD, mmol/L3.1 ± 0.93.5 ± 1.13.7 ± 0.93.7 ± 0.9<0.001  e
HDL-C, mean ± SD, mmol/L1.6 ± 0.41.5 ± 0.41.4 ± 0.41.3 ± 0.3<0.001  e
Concomitant medication (aspirin), n (%)54 (8)16 (27)93 (15)227 (32)<0.001  b
Significant p-values are marked in bold. BMI: body mass index; BP: blood pressure; C: cholesterol; FBG: fasting blood glucose; HDL-C: high-density lipoprotein cholesterol; LDL-C: low-density lipoprotein cholesterol; NA: not applicable; SD: standard deviation. a One-way analysis of variance; b Chi-square test; c General linear models adjusted for age and sex; d General linear models adjusted for age, sex, concomitant medication (aspirin), creatinine and other cardiovascular risk factors (i.e., arterial hypertension, diabetes mellitus, smoking, total C, LDL-C, and HDL-C); e General linear models adjusted for age, sex, and other cardiovascular risk factors (i.e., arterial hypertension, diabetes mellitus, and smoking).
Table 2. Carotid ultrasound characteristics of the study subjects.
ParameterNon-Obese
(n = 686)
General Obesity
(n = 59)
Central Obesity
(n = 616)
Mixed Obesity
(n = 715)
p-Value
IMT, mean ± SD, mm0.57 ± 0.130.62 ± 0.140.67 ± 0.160.68 ± 0.16<0.001  a
Increased IMT, n (%)17 (2)6 (10)44 (7)70 (10)<0.001  b
Presence of plaques, n (%)76 (11)15 (25)138 (22)189 (26)<0.001  b
Number of plaques, mean ± SD0.21 ± 0.030.33 ± 0.110.45 ± 0.040.49 ± 0.03<0.001  a
Area of plaques (mm2), mean ± SD4.4 ± 15.75.6 ± 11.310.9 ± 27.311.0 ± 24.5<0.001  a
Type of plaques: 0.77 b
vulnerable (types 1, 2)29 (38)7 (47)51 (37)79 (42)
stable (types 3, 4, 5)47 (62)8 (53)87 (63)110 (58)
Significant p-values are marked in bold. IMT: intima-media thickness; SD: standard deviation. a General linear model adjusted for age, sex, concomitant medication (aspirin), creatinine and other cardiovascular risk factors (arterial hypertension, diabetes mellitus, smoking, total C, LDL-C and HDL-C); b Chi-square test.
Table 3. Results of the binary logistic regression analysis on the association between serum urate levels and carotid atherosclerosis.
Subject GroupOR95% CIp-Value
Presence of increased IMT a
Non-obese0.9920.985–1.0010.06
General obesity1.0010.987–1.0150.91
Central obesity1.0271.021–1.038<0.01
Mixed obesity1.0010.984–1.0190.89
Presence of carotid plaques a
Non-obese0.9920.988–0.996<0.001
General obesity1.0020.992–1.0110.74
Central obesity1.0050.993–1.0090.70
Mixed obesity1.0080.996–1.0140.88
Presence of vulnerable carotid plaques a
Non-obese1.0010.978–1.0630.71
General obesity1.0040.995–1.0150.90
Central obesity0.9970.990–1.0050.11
Mixed obesity0.9990.997–1.0010.41
Significant p values are marked in bold. CI: confidence interval; IMT: intima-media thickness; OR: odds ratio. a Models adjusted for age, sex, concomitant medication (aspirin), creatinine and other cardiovascular risk factors (arterial hypertension, diabetes mellitus, smoking, total C, LDL-C and HDL-C).
Disclaimer/Publisher’s Note: The statements, opinions and data contained in all publications are solely those of the individual author(s) and contributor(s) and not of MDPI and/or the editor(s). MDPI and/or the editor(s) disclaim responsibility for any injury to people or property resulting from any ideas, methods, instructions or products referred to in the content.

