
Prognostic Value of Spot Urinary Creatinine Concentration and Its Relationship with Body Composition Parameters in HF Patients
 , , ,
, , ,
Abstract
:1. Introduction
2. Methods
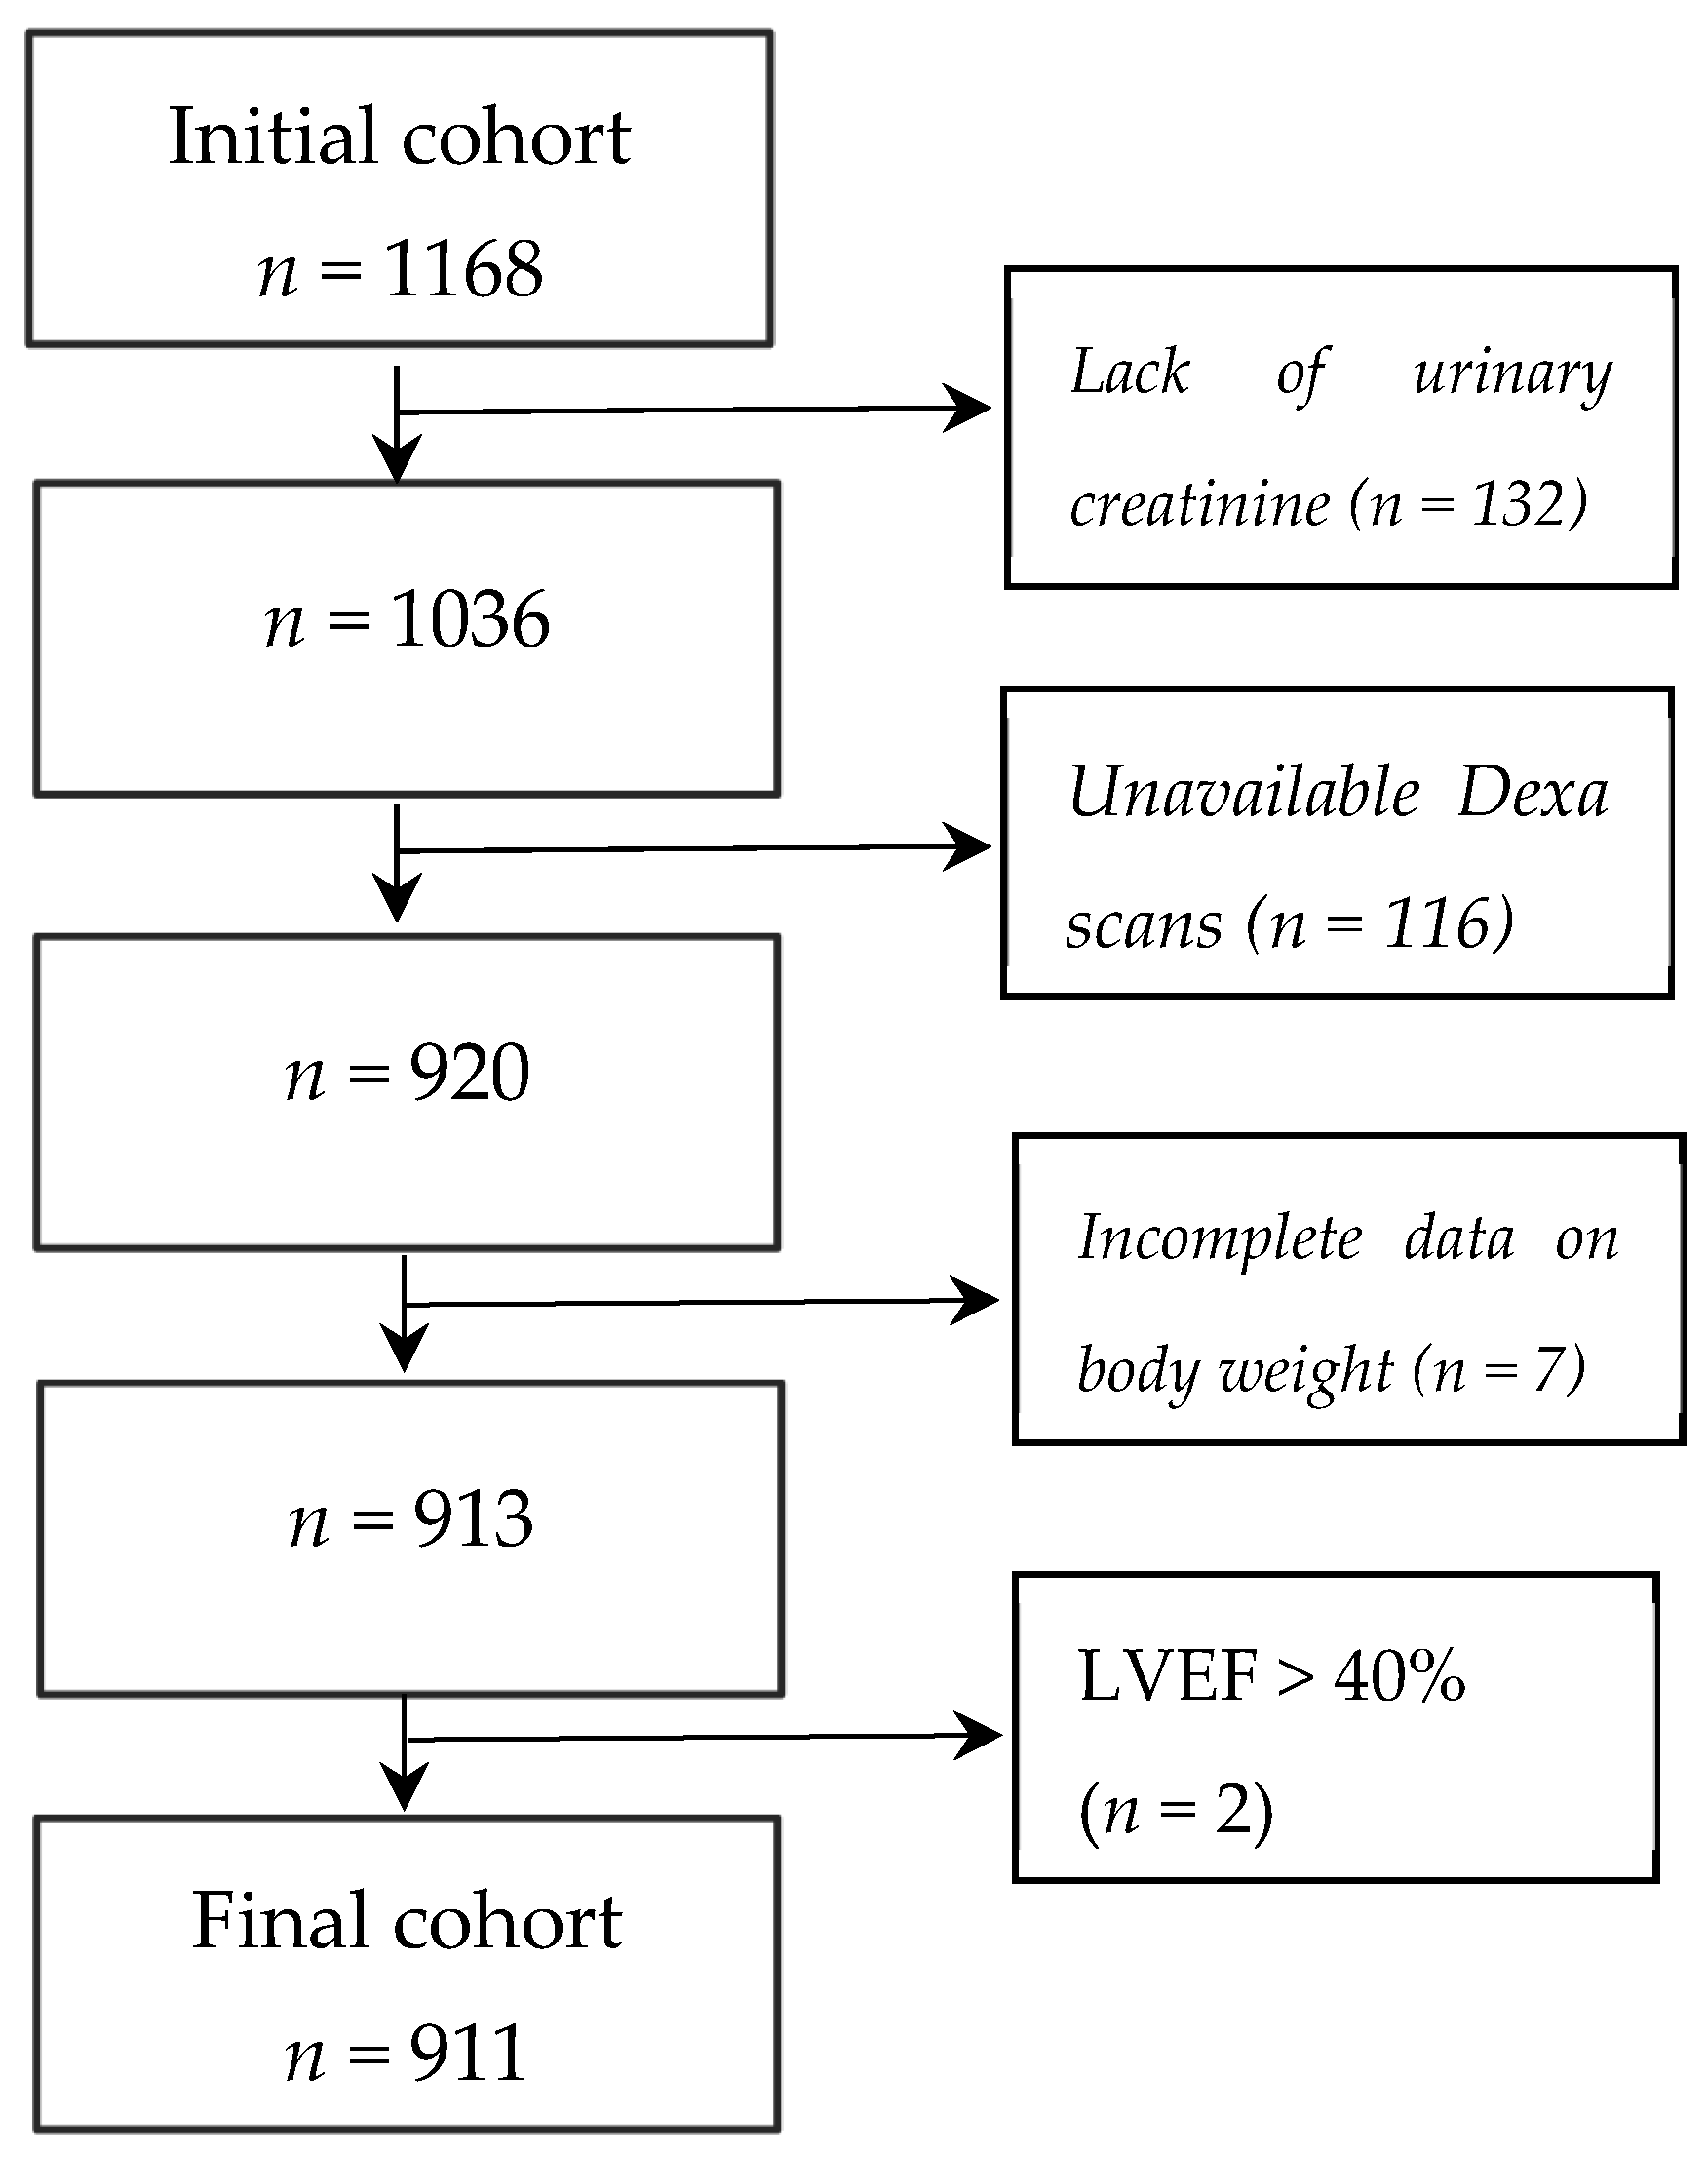
2.1. Study Group
2.2. Statistical Analysis
3. Results
3.1. Comparison of Study Groups According to SUCR
3.2. The Risk of Death in Unadjusted and Adjusted Analyses
4. Discussion
5. Limitations
6. Conclusions
Author Contributions
Funding
Informed Consent Statement
Data Availability Statement
Conflicts of Interest
Abbreviations
| ICM | Ischemic etiology of HF |
| NYHA | New York Heart Association class |
| MVO2 | Maximum oxygen consumption on symptom-limited treadmill test |
| LVEF | Left ventricular ejection fraction |
| ASMI | Appendicular Skeletal Muscle Index |
| NTproBNP | N-terminal fragment of brain-type natriuretic peptide |
| eGFRMDRD | Estimated glomerular filtration rate calculated with the use of Modification of Diet in Renal Disease formula |
| hsCRP | High-sensitive C-reactive protein |
| GLIM | The Global Leadership Initiative on Malnutrition |
| ACEI/ARB | Angiotensin-converting enzyme inhibitors/Angiotensin II receptor blockers |
| BB | Beta blockers |
| MRA | Mineralocorticoid receptor antagonist |
References
- Savarese, G.; Becher, P.M.; Lund, L.H.; Seferovic, P.; Rosano, G.M.C.; Coats, A.J.S. Global burden of heart failure: A comprehensive and updated review of epidemiology. Cardiovasc. Res. 2022, 118, 3272–3287. [Google Scholar] [CrossRef] [PubMed]
- Johansson, I.; Joseph, P.; Balasubramanian, K.; McMurray, J.J.; Lund, L.H.; Ezekowitz, J.A.; Kamath, D.; Alhabib, K.; Bayes-Genis, A.; Budaj, A.; et al. Health-Related Quality of Life and Mortality in Heart Failure: The Global Congestive Heart Failure Study of 23 000 Patients from 40 Countries. Circulation 2021, 143, 2129–2142. [Google Scholar] [CrossRef] [PubMed]
- Moradi, M.; Daneshi, F.; Behzadmehr, R.; Rafiemanesh, H.; Bouya, S.; Raeisi, M. Quality of life of chronic heart failure patients: A systematic review and meta-analysis. Heart Fail. Rev. 2020, 25, 993–1006. [Google Scholar] [CrossRef] [PubMed]
- Del Buono, M.G.; Arena, R.; Borlaug, B.A.; Carbone, S.; Canada, J.M.; Kirkman, D.L.; Garten, R.; Rodriguez-Miguelez, P.; Guazzi, M.; Lavie, C.J.; et al. Exercise Intolerance in Patients with Heart Failure: JACC State-of-the-Art Review. J. Am. Coll. Cardiol. 2019, 73, 2209–2225. [Google Scholar] [CrossRef] [PubMed]
- Piepoli, M.F.; Kaczmarek, A.; Francis, D.P.; Davies, L.C.; Rauchhaus, M.; Jankowska, E.A.; Anker, S.D.; Capucci, A.; Banasiak, W.; Ponikowski, P. Reduced peripheral skeletal muscle mass and abnormal reflex physiology in chronic heart failure. Circulation 2006, 114, 126–134. [Google Scholar] [CrossRef] [PubMed]
- Drexler, H.; Riede, U.; Münzel, T.; König, H.; Funke, E.; Just, H. Alterations of skeletal muscle in chronic heart failure. Circulation 1992, 85, 1751–1759. [Google Scholar] [CrossRef]
- Sullivan, M.J.; Green, H.J.; Cobb, F.R. Skeletal muscle biochemistry and histology in ambulatory patients with long-term heart failure. Circulation 1990, 81, 518–527. [Google Scholar] [CrossRef]
- Chati, Z.; Zannad, F.; Robin-Lherbier, B.; Escanye, J.-M.; Jeandel, C.; Robert, J.; Aliot, E. Contribution of specific skeletal muscle metabolic abnormalities to limitation of exercise capacity in patients with chronic heart failure: A phosphorus 31 nuclear magnetic resonance study. Am. Heart J. 1994, 128, 781–792. [Google Scholar] [CrossRef]
- Cicoira, M.; Zanolla, L.; Franceschini, L.; Rossi, A.; Golia, G.; Zamboni, M.; Tosoni, P.; Zardini, P. Skeletal muscle mass independently predicts peak oxygen consumption and ventilatory response during exercise in noncachectic patients with chronic heart failure. J. Am. Coll. Cardiol. 2001, 37, 2080–2085. [Google Scholar] [CrossRef]
- Mancini, D.M.; Walter, G.; Reichek, N.; Lenkinski, R.; McCully, K.K.; Mullen, J.L.; Wilson, J.R. Contribution of skeletal muscle atrophy to exercise intolerance and altered muscle metabolism in heart failure. Circulation 1992, 85, 1364–1373. [Google Scholar] [CrossRef]
- Anker, S.D.; Ponikowski, P.; Varney, S.; Chua, T.P.; Clark, A.L.; Webb-Peploe, K.M.; Harrington, D.; Kox, W.J.; Poole-Wilson, P.A.; Coats, A.J. Wasting as independent risk factor for mortality in chronic heart failure. Lancet 1997, 349, 1050–1053. [Google Scholar] [CrossRef] [PubMed]
- Al-Absi, H.R.H.; Islam, M.T.; Refaee, M.A.; Chowdhury, M.E.H.; Alam, T. Cardiovascular Disease Diagnosis from DXA Scan and Retinal Images Using Deep Learning. Sensors 2022, 22, 4310. [Google Scholar] [CrossRef] [PubMed]
- Myers, V.C.; Fine, M.S. The creatine content of muscle under normal conditions: Its relation to the urinary creatinine. J. Biol. Chem. 1913, 14, 9–26. [Google Scholar] [CrossRef]
- Hargreaves, M.; Spriet, L.L. Skeletal muscle energy metabolism during exercise. Nat. Metab. 2020, 2, 817–828. [Google Scholar] [CrossRef] [PubMed]
- Guimarães-Ferreira, L. Role of the phosphocreatine system on energetic homeostasis in skeletal and cardiac muscles. Einstein 2014, 12, 126–131. [Google Scholar] [CrossRef]
- Wallimann, T.; Wyss, M.; Brdiczka, D.; Nicolay, K.; Eppenberger, H.M. Intracellular compartmentation, structure and function of creatine kinase isoenzymes in tissues with high and fluctuating energy demands: The ‘phosphocreatine circuit’ for cellular energy homeostasis. Biochem. J. 1992, 281 Pt 1, 21–40. [Google Scholar] [CrossRef]
- Stam, S.P.; Eisenga, M.F.; Gomes-Neto, A.W.; van Londen, M.; de Meijer, V.E.; van Beek, A.P.; Gansevoort, R.T.; Bakker, S.J. Muscle mass determined from urinary creatinine excretion rate, and muscle performance in renal transplant recipients. J. Cachex Sarcopenia Muscle 2019, 10, 621–629. [Google Scholar] [CrossRef]
- ter Maaten, J.M.; Maggioni, A.P.; Latini, R.; Masson, S.; Tognoni, G.; Tavazzi, L.; Signorini, S.; Voors, A.A.; Damman, K. Clinical and prognostic value of spot urinary creatinine in chronic heart failure—An analysis from GISSI-HF. Am. Heart J. 2017, 188, 189–195. [Google Scholar] [CrossRef]
- Pandhi, P.; Streng, K.W.; Anker, S.D.; Cleland, J.G.; Damman, K.; Dickstein, K.; Pellicori, P.; Lang, C.C.; Ng, L.; Samani, N.J.; et al. The value of spot urinary creatinine as a marker of muscle wasting in patients with new-onset or worsening heart failure. J. Cachex Sarcopenia Muscle 2021, 12, 555–567. [Google Scholar] [CrossRef]
- Wilcox, C.S.; Testani, J.M.; Pitt, B. Pathophysiology of Diuretic Resistance and Its Implications for the Management of Chronic Heart Failure. Hypertension 2020, 76, 1045–1054. [Google Scholar] [CrossRef]
- Cederholm, T.; Jensen, G.L.; Correia, M.I.T.D.; Gonzalez, M.C.; Fukushima, R.; Higashiguchi, T.; Baptista, G.; Barazzoni, R.; Blaauw, R.; Coats, A.J.; et al. GLIM criteria for the diagnosis of malnutrition—A consensus report from the global clinical nutrition community. Clin. Nutr. 2019, 38, 1–9. [Google Scholar] [CrossRef] [PubMed]
- Heymsfield, S.B.; Arteaga, C.; McManus, C.; Smith, J.; Moffitt, S. Measurement of muscle mass in humans: Validity of the 24-hour urinary creatinine method. Am. J. Clin. Nutr. 1983, 37, 478–494. [Google Scholar] [CrossRef] [PubMed]
- Oterdoom, L.H.; Gansevoort, R.T.; Schouten, J.P.; de Jong, P.E.; Gans, R.O.; Bakker, S.J. Urinary creatinine excretion, an indirect measure of muscle mass, is an independent predictor of cardiovascular disease and mortality in the general population. Atherosclerosis 2009, 207, 534–540. [Google Scholar] [CrossRef]
- Ix, J.H.; de Boer, I.H.; Wassel, C.L.; Criqui, M.H.; Shlipak, M.G.; Whooley, M.A. Urinary creatinine excretion rate and mortality in persons with coronary artery disease: The Heart and Soul Study. Circulation 2010, 121, 1295–1303. [Google Scholar] [CrossRef] [PubMed]
- Wilson, F.P.; Xie, D.; Anderson, A.H.; Leonard, M.B.; Reese, P.P.; Delafontaine, P.; Horwitz, E.; Kallem, R.; Navaneethan, S.; Ojo, A.; et al. Urinary creatinine excretion, bioelectrical impedance analysis, and clinical outcomes in patients with CKD: The CRIC study. Clin. J. Am. Soc. Nephrol. 2014, 9, 2095–2103. [Google Scholar] [CrossRef]
- ter Maaten, J.M.; Damman, K.; Hillege, H.L.; Bakker, S.J.; Anker, S.D.; Navis, G.; Voors, A.A. Creatinine excretion rate, a marker of muscle mass, is related to clinical outcome in patients with chronic systolic heart failure. Clin. Res. Cardiol. 2014, 103, 976–983. [Google Scholar] [CrossRef] [PubMed]
- Malinowska-Borowska, J.; Kulik, A.; Buczkowska, M.; Ostręga, W.; Stefaniak, A.; Piecuch, M.; Garbicz, J.; Nowak, J.U.; Tajstra, M.; Jankowska, E.A.; et al. Nutritional and Non-Nutritional Predictors of Low Spot Urinary Creatinine Concentration in Patients with Heart Failure. Nutrients 2021, 13, 3994. [Google Scholar] [CrossRef]
- Mullens, W.; Damman, K.; Harjola, V.-P.; Mebazaa, A.; Rocca, H.-P.B.-L.; Martens, P.; Testani, J.M.; Tang, W.W.; Orso, F.; Rossignol, P.; et al. The use of diuretics in heart failure with congestion—A position statement from the Heart Failure Association of the European Society of Cardiology. Eur. J. Heart Fail. 2019, 21, 137–155. [Google Scholar] [CrossRef] [PubMed]
- Chioncel, O.; Mebazaa, A.; Maggioni, A.P.; Harjola, V.P.; Rosano, G.; Laroche, C.; Piepoli, M.F.; Crespo-Leiro, M.G.; Lainscak, M.; Ponikowski, P.; et al. Acute heart failure congestion and perfusion status—Impact of the clinical classification on in-hospital and long-term outcomes; insights from the ESC-EORP-HFA Heart Failure Long-Term Registry. Eur. J. Heart Fail. 2019, 21, 1338–1352. [Google Scholar] [CrossRef]
- Valentova, M.; von Haehling, S.; Bauditz, J.; Doehner, W.; Ebner, N.; Bekfani, T.; Elsner, S.; Sliziuk, V.; Scherbakov, N.; Murín, J.; et al. Intestinal congestion and right ventricular dysfunction: A link with appetite loss, inflammation, and cachexia in chronic heart failure. Eur. Heart J. 2016, 37, 1684–1691. [Google Scholar] [CrossRef] [PubMed]
- Forman, D.E.; Santanasto, A.; Boudreau, R.; Harris, T.; Kanaya, A.M.; Satterfield, S.; Simonsick, E.M.; Butler, J.; Kizer, J.R.; Newman, A.B. Impact of Incident Heart Failure on Body Composition Over Time in the Health, Aging, and Body Composition Study Population. Circ. Heart Fail. 2017, 10, e003915. [Google Scholar] [CrossRef] [PubMed]
- Post, A.; Tsikas, D.; Bakker, S.J.L. Creatine is a Conditionally Essential Nutrient in Chronic Kidney Disease: A Hypothesis and Narrative Literature Review. Nutrients 2019, 11, 1044. [Google Scholar] [CrossRef] [PubMed]
- Wyss, M.; Kaddurah-Daouk, R. Creatine and Creatinine Metabolism. Physiol. Rev. 2000, 80, 1107–1213. [Google Scholar] [CrossRef]
- Mitchell, W.K.; Williams, J.; Atherton, P.J.; Larvin, M.; Lund, J.N.; Narici, M. Sarcopenia, Dynapenia, and the Impact of Advancing Age on Human Skeletal Muscle Size and Strength; a Quantitative Review. Front. Physiol. 2012, 3, 260. [Google Scholar] [CrossRef]
- Sallsten, G.; Barregard, L. Variability of Urinary Creatinine in Healthy Individuals. Int. J. Environ. Res. Public Health 2021, 18, 3166. [Google Scholar] [CrossRef] [PubMed]
- Yumino, D.; Redolfi, S.; Ruttanaumpawan, P.; Su, M.C.; Smith, S.; Newton, G.E.; Mak, S.; Bradley, T.D. Nocturnal rostral fluid shift: A unifying concept for the pathogenesis of obstructive and central sleep apnea in men with heart failure. Circulation 2010, 121, 1598–1605. [Google Scholar] [CrossRef]
- Redeker, N.S.; Adams, L.; Berkowitz, R.; Blank, L.; Freudenberger, R.; Gilbert, M.; Walsleben, J.; Zucker, M.J.; Rapoport, D. Nocturia, Sleep and Daytime Function in Stable Heart Failure. J. Card. Fail. 2012, 18, 569–575. [Google Scholar] [CrossRef]
- Carlisle, T.; Ward, N.R.; Atalla, A.; Cowie, M.R.; Simonds, A.K.; Morrell, M.J. Investigation of the link between fluid shift and airway collapsibility as a mechanism for obstructive sleep apnea in congestive heart failure. Physiol. Rep. 2017, 5, e12956. [Google Scholar] [CrossRef]
- Okumura, K.; Obayashi, K.; Tai, Y.; Yamagami, Y.; Negoro, H.; Kataoka, H.; Kurumatani, N.; Saeki, K. Association between NT-proBNP and nocturia among community-dwelling elderly males and females: A cross-sectional analysis of the HEIJO-KYO study. Neurourol. Urodyn. 2021, 40, 112–119. [Google Scholar] [CrossRef]
- FitzGerald, M.P.; Litman, H.J.; Link, C.L.; McKinlay, J.B. BACH Survey Investigators The Association of Nocturia with Cardiac Disease, Diabetes, Body Mass Index, Age and Diuretic Use: Results from the BACH Survey. J. Urol. 2007, 177, 1385–1389. [Google Scholar] [CrossRef]
- Takezawa, K.; Kuribayashi, S.; Okada, K.; Sekii, Y.; Inagaki, Y.; Fukuhara, S.; Kiuchi, H.; Abe, T.; Fujita, K.; Uemura, M.; et al. Decreased renal function increases the nighttime urine volume rate by carryover of salt excretion to the nighttime. Sci. Rep. 2021, 11, 10587. [Google Scholar] [CrossRef] [PubMed]


| Quartiles of Spot Urinary Creatinine [g/L] | ||||||
|---|---|---|---|---|---|---|
| Feature | All n = 911 | Q1 n = 227 (0.050–0.573) | Q2 n = 228 (0.573–1.087) | Q3 n = 228 (1.087–1.633) | Q4 n = 228 (1.633–5.058) | p Value |
| Baseline Demographics and Functional Tests | ||||||
| Age (years) | 52.9 ± 11 | 52.4 ± 11 | 52.6 ± 11 | 53.4 ± 11 | 53.1 ± 9 | 0.74 |
| Males (%) | 86 | 81 | 82 | 87 | 93 | <0.0001 |
| HF etiology–ICM (%) | 62 | 62 | 58 | 64 | 62 | 0.65 |
| NYHA class | 2.6 ± 0.8 | 2.8 ± 0.8 | 2.8 ± 0.8 | 2.5 ± 0.8 | 2.4 ± 0.7 | <0.0001 |
| NYHA class I/II/III/IV (%) | 6/37/48/9 | 6/25/55/14 | 5/29/51/14 | 7/40/43/9 | 10/46/41/3 | <0.0001 |
| Duration of HF (months) | 34.4 (14–70) | 27 (12–66) | 41 (14–77) | 34 (13–68) | 39 (15–39) | 0.22 |
| Systolic BP (mmHg) | 109 ± 16 | 107 ± 16 | 106 ± 16 | 111 ± 17 | 110 ± 16 | 0.002 |
| Heart rate (beat per minute) | 82 ± 15 | 81 ± 14 | 81 ± 13 | 82 ± 16 | 83 ±15 | 0.57 |
| MVO2 (mL/kg min) | 15.0 (12.2–18.4) | 14.9 (11.9–18.6) | 14.7 (11.9–18.6) | 14.7 (12.3–17.9) | 15.3 (12.6–18.6) | 0.60 |
| LVEF (%) | 25 ± 8 | 25 ± 8 | 25 ± 9 | 26 ± 9 | 26 ± 8 | 0.50 |
| Anthropometrics and Body Composition | ||||||
| PreHF BMI (kg/m2) | 28.2 ± 4.6 | 28.0 ± 4.7 | 28.0 ± 4.6 | 28.3 ± 4.8 | 28.5 ± 4.3 | 0.59 |
| IndexBMI (kg/m2) | 26.3 ± 4.5 | 25.4 ± 4.2 | 25.7 ± 4.4 | 26.8 ± 1.9 | 27.4 ± 4.2 | <0.0001 |
| Weight loss from preHF BMI until index BMI (%) | 11.0; (4.9–17.6) | 13.8; (6.7–19.4) | 11.2; (5.5–18.6) | 9.2; (3.5–16.5) | 9.0; (3.1–14.6) | <0.0001 |
| Fat mass (kg/m2) | 7.2; (5.6–9.0) | 6.9; (5.0–8.7) | 7.2; (5.7–8.8) | 7.3; (6.0–9.1) | 7.6; (5.8–9.3) | 0.06 |
| Fat-free mass (kg/m2) | 17.7; (16.0–19.4) | 17.4; (15.7–19.1) | 17.5; (15.5–19.4) | 17.6; (16.2–19.2) | 18.3; (16.8–19.9) | 0.0002 |
| Laboratory Tests | ||||||
| Hemoglobin (mmol/L) | 8.7 ± 1.1 | 8.6 ± 1.1 | 8.8 ± 1.0 | 8.6 ± 1.1 | 8.8 ± 1.0 | 0.04 |
| NTproBNP (pg/mL) | 1375; (647–3069) | 1598; (805–3690) | 1644; (693–3477) | 1356; (638–2982) | 1081; (447–2293) | 0.008 |
| eGFRMDRD (mL/min × 1.73 m2) | 86; (55–105) | 83; (63–106) | 88; (65–1053) | 88; (70–107) | 83; (66–101) | 0.52 |
| eGFRMDRD < 60 mL/min × 1.73 m2 (%) | 22.2 | 21.1 | 21.9 | 14.9 | 15.3 | <0.05 |
| Sodium (mmol/L) | 134; (136–138) | 136; (133–138) | 136; (134–138) | 136; (134–138) | 135; (138–139) | <0.001 |
| hCRP (mg/dL) | 2.8; (1.2–6.6) | 3.1; (1.4–7.1) | 2.5; (1.3–5.8) | 2.8; (1.2–7.0) | 2.7; (1.1–6.5) | 0.39 |
| GLIM (malnutrition) (%) | 51.1 | 63.4 | 61.4 | 44.3 | 35.5 | <0.001 |
| Spot urinary creatinine concentration (g/L) | 1.087 | 0.331 | 0.822 | 1.374 | 2.085 | <0.001 |
| Comorbidities | ||||||
| Hypertension (%) | 54.4 | 53.7 | 54.4 | 59.2 | 50.4 | 0.31 |
| Diabetes mellitus type 2 (%) | 29.4 | 29.1 | 36.8 | 27.2 | 24.6 | 0.03 |
| Hypercholesterolemia (%) | 59.9 | 59.9 | 60.1 | 61.8 | 57.9 | 0.86 |
| Hypertriglyceridemia (%) | 42.9 | 44.0 | 43.0 | 40.3 | 44.3 | 0.82 |
| History of smoking (%) | 73.4 | 72.7 | 71.0 | 70.6 | 79.4 | 0.12 |
| Therapy | ||||||
| ACEI/ARB (% treated) | 93.1 | 91.2 | 92.5 | 94.7 | 93.9 | 0.003 |
| ACEI/ARB (% of recommended dose) | 50; (25–100) | 50; (20–100) | 50; (20–100) | 50; (25–100) | 50; (25–100) | 0.33 |
| BB (% treated) | 97.3 | 97.8 | 96.0 | 97.4 | 97.8 | 0.625 |
| BB (% target of recommended dose) | 33; (25–67) | 43; (25–67) | 33; (25–67) | 33; (25–67) | 33; (33–67) | 0.142 |
| MRA (% treated) | 92.2 | 92.5 | 96.0 | 93.0 | 86.8 | 0.003 |
| MRA (% of recommended dose) | 100; (100–200) | 100; (100–200) | 100; (100–200) | 100; (50–100) | 100; (100–100) | 0.09 |
| Loop diuretics (% treated) | 87.0 | 90.7 | 86.4 | 88.2 | 82.9 | 0.08 |
| Loop diuretics (mg of furosemide equivalent) | 93.6 ± 75.9 | 105.1 ± 91.5 | 94.1 ± 70.8 | 97.4 ± 98.9 | 74.3 ± 61.7 | <0.001 |
| Outcome | ||||||
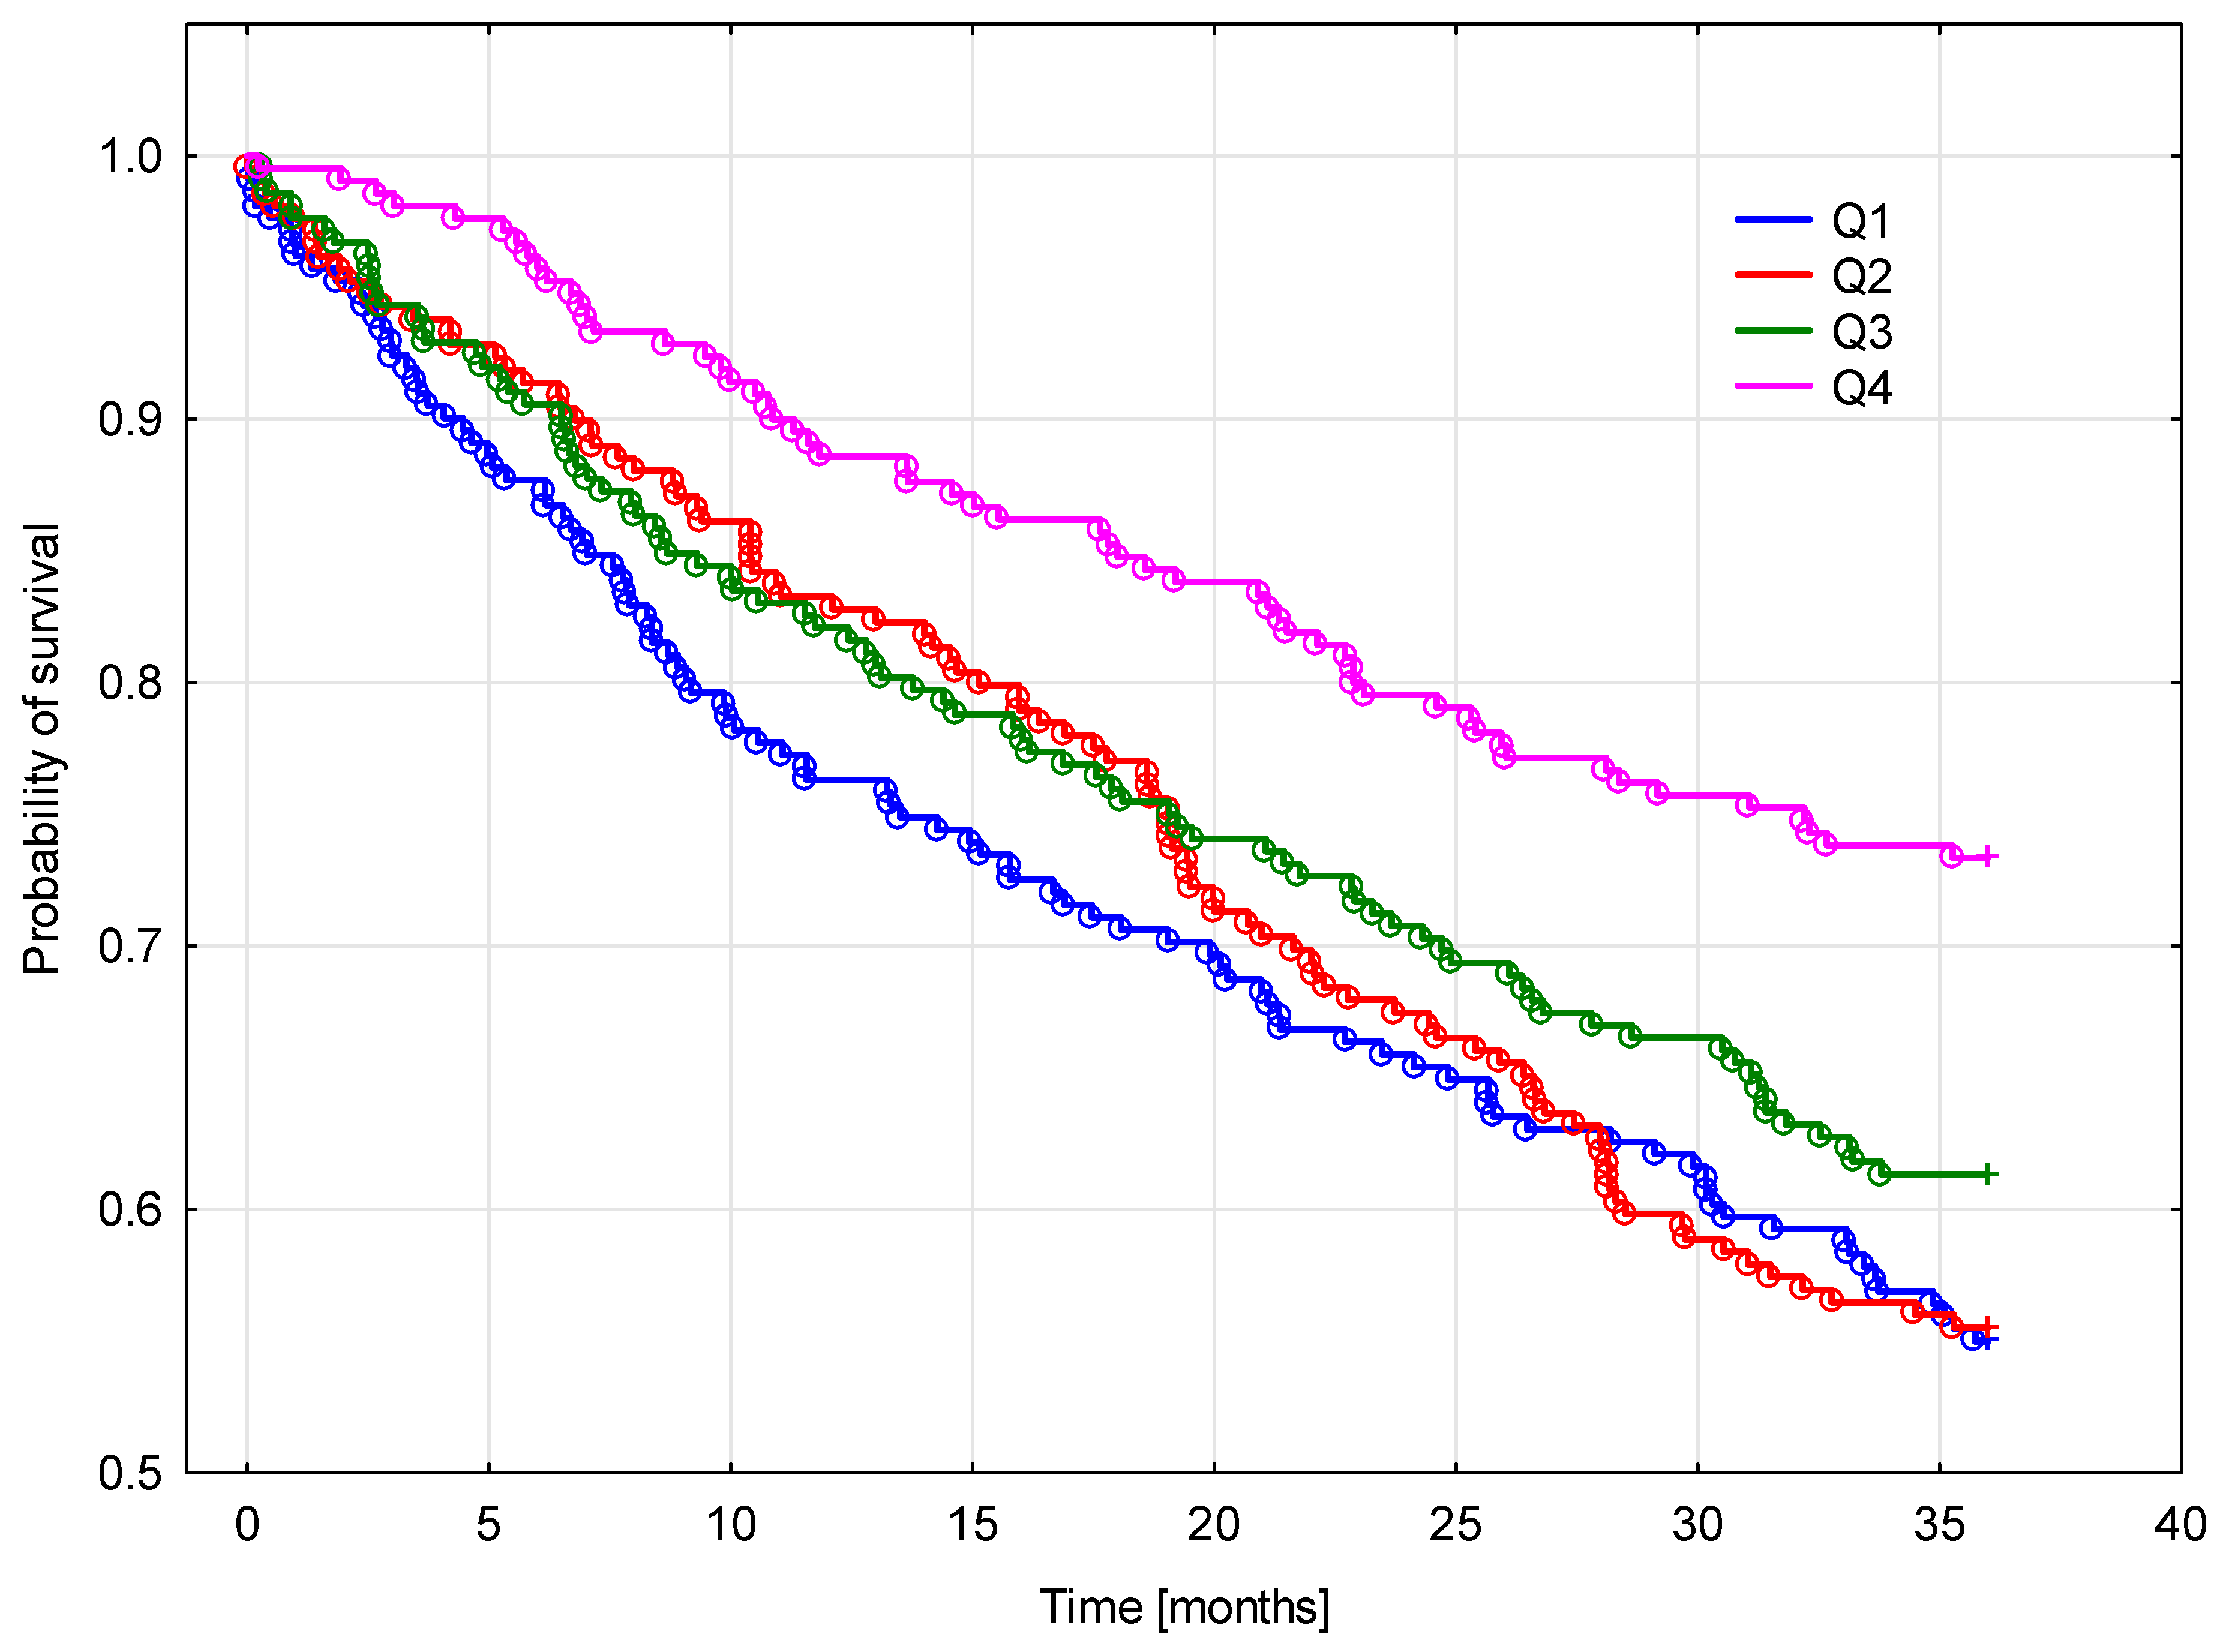
| All-cause mortality at 3 years | 38.7 | 45.0 | 44.5 | 38.7 | 26.7 | <0.001 |
| Parameter | Univariable | Multivariable | ||
|---|---|---|---|---|
| Standard β | p-Value | Standard β | p-Value | |
| Gender | −0.08 | 0.02 | 0.10 | 0.04 |
| NYHA | −0.18 | 0.0001 | ||
| Systolic BP | 0.11 | 0.001 | ||
| BMI | 0.15 | <0.0001 | ||
| Weight loss | −0.15 | <0.0001 | ||
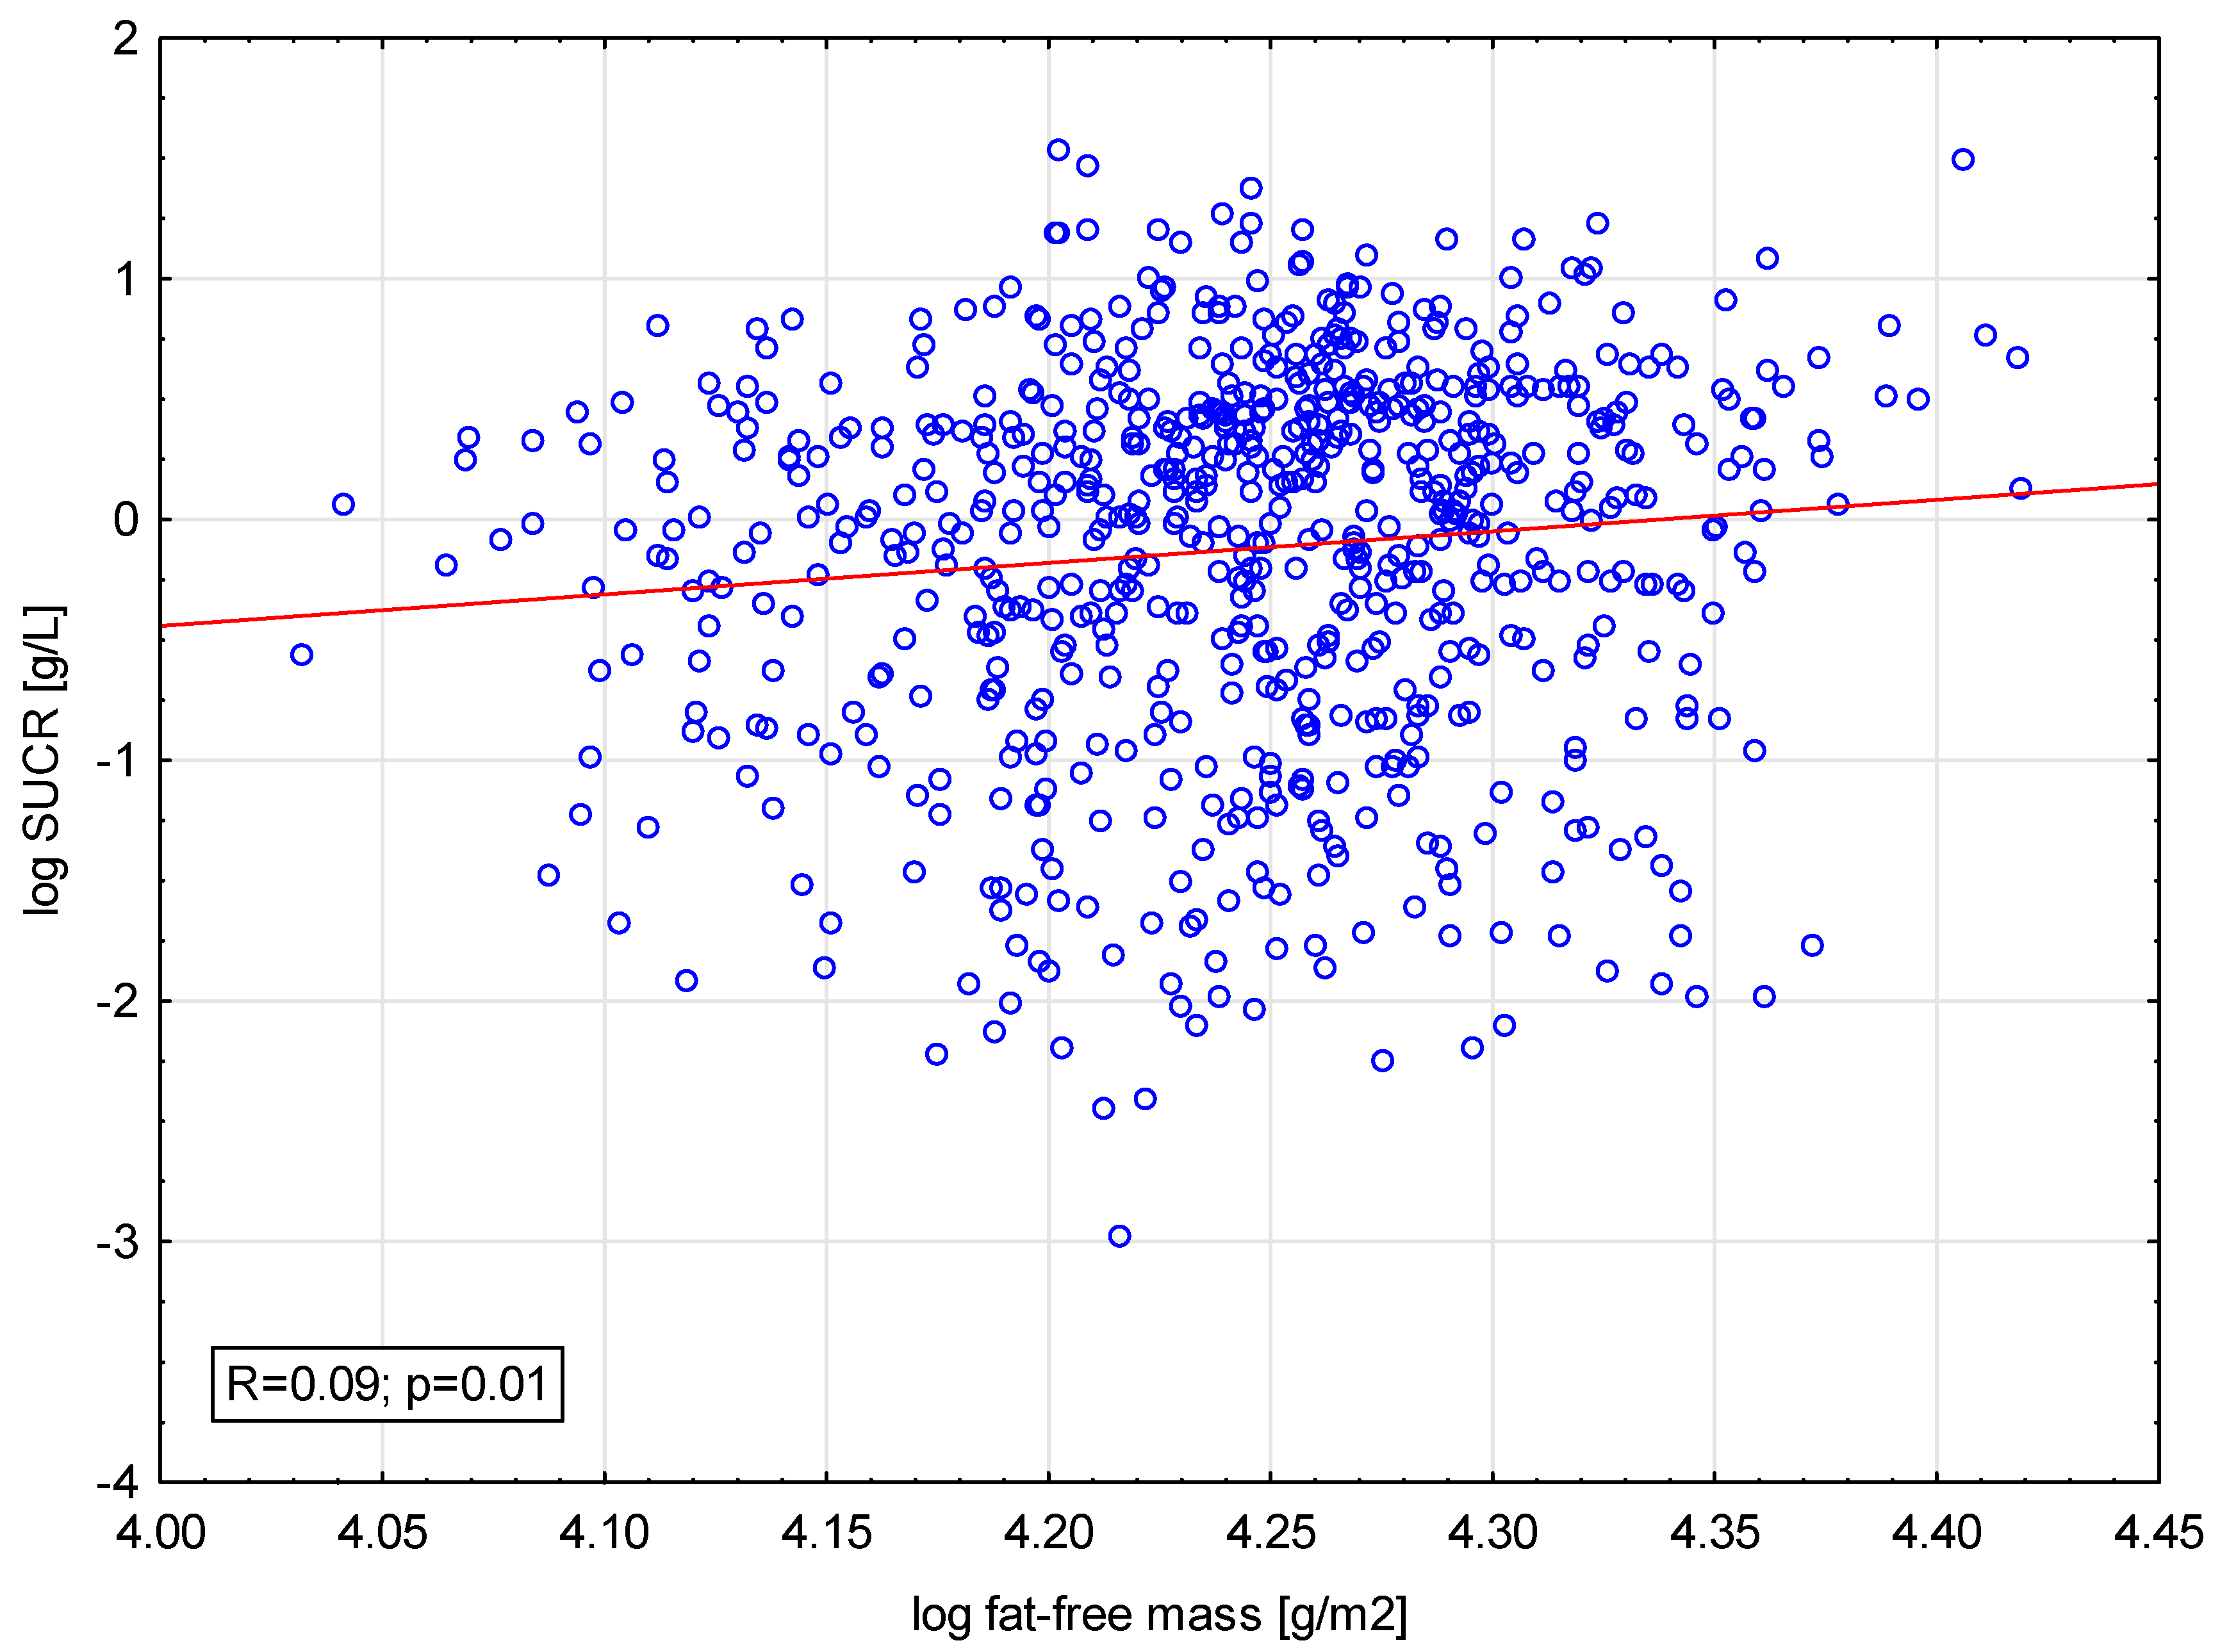
| Log fat tissue | 0.09 | 0.01 | ||
| Log fat-free tissue | 0.09 | 0.01 | ||
| Sodium | 0.19 | <0.0001 | ||
| NTproBNP | −0.15 | <0.0001 | ||
| GLIM | −0.21 | <0.0001 | −0.13 | 0.02 |
| Loop diuretics dose | −0.14 | 0.0001 | ||
| MRA percent recommended dose | 0.07 | 0.03 | ||
| Quartiles of SUCR | ||||
|---|---|---|---|---|
| Feature | Q4 Ref. | Q3 | Q2 | Q1 |
| 3-year mortality risk Cox regression analysis | ||||
| Hazard ratio ± 95% CI, p-value | ||||
| Raw model | 1.0 | 1.87; (1.23–2.85), p = 0.003 | 1.80: (1.18–2.74), p = 0.006 | 1.82; (1.20–2.78), p = 0.005 |
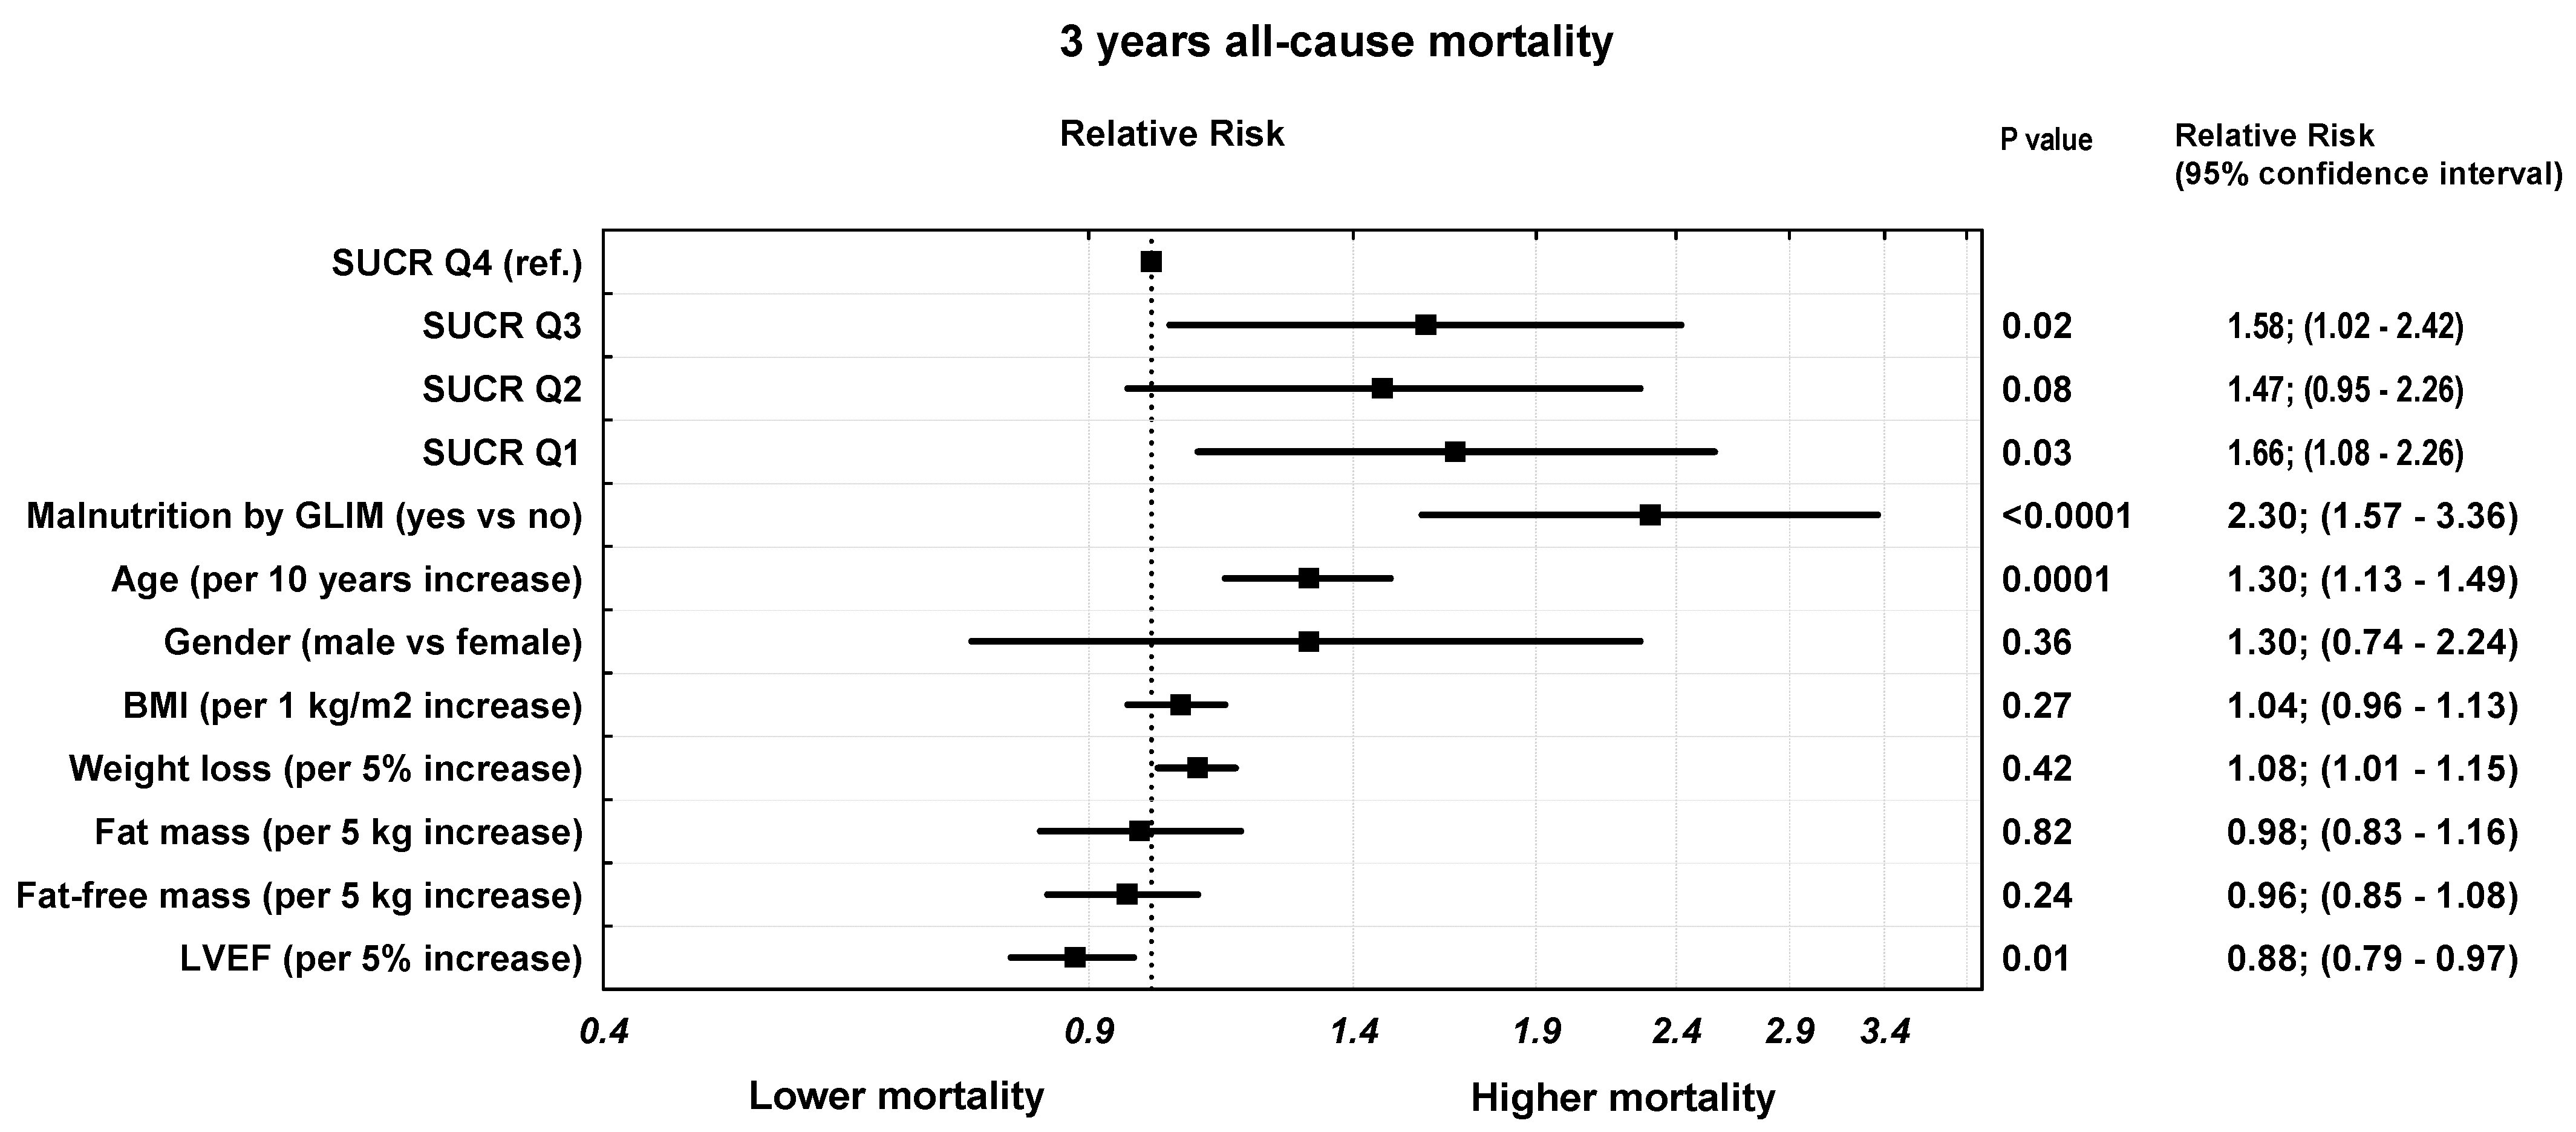
| Model 1. adjusted for age, gender, BMI, weight loss, log fat tissue, log fat-free tissue, GLIM score, LVEF | 1.0 | 1.58; (1.03–2.42), p = 0.02 | 1.47; (0.95–2.26), p = 0.08 | 1.66; (1.08–2.56), p = 0.03 |
| Model 2 = model 1 + log loop diuretics dose + percent recommended dose of MRA | 1.0 | 1.36; (0.87–2.12), p = 0.18 | 1.32; (0.85–2.05), p = 0.21 | 1.33; (0.85–2.08), p = 0.21 |
| Model 3 = model 1 + log loop diuretics dose + percent recommended dose of MRA + serum sodium + log NTproBNP | 1.0 | 1.34; (0.86–2.09), p = 0.20 | 1.27; (0.82–1.98). p = 0.29 | 1.20; (0.76–1.89), p = 0.43 |
Disclaimer/Publisher’s Note: The statements, opinions and data contained in all publications are solely those of the individual author(s) and contributor(s) and not of MDPI and/or the editor(s). MDPI and/or the editor(s) disclaim responsibility for any injury to people or property resulting from any ideas, methods, instructions or products referred to in the content. |
© 2023 by the authors. Licensee MDPI, Basel, Switzerland. This article is an open access article distributed under the terms and conditions of the Creative Commons Attribution (CC BY) license (https://creativecommons.org/licenses/by/4.0/).
Share and Cite
Malinowska-Borowska, J.; Piecuch, M.; Szlacheta, P.; Kulik, A.; Niedziela, J.; Nowak, J.U.; Pyka, Ł.; Gąsior, M.; Rozentryt, P. Prognostic Value of Spot Urinary Creatinine Concentration and Its Relationship with Body Composition Parameters in HF Patients. Biomedicines 2023, 11, 1429. https://doi.org/10.3390/biomedicines11051429
Malinowska-Borowska J, Piecuch M, Szlacheta P, Kulik A, Niedziela J, Nowak JU, Pyka Ł, Gąsior M, Rozentryt P. Prognostic Value of Spot Urinary Creatinine Concentration and Its Relationship with Body Composition Parameters in HF Patients. Biomedicines. 2023; 11(5):1429. https://doi.org/10.3390/biomedicines11051429
Chicago/Turabian StyleMalinowska-Borowska, Jolanta, Małgorzata Piecuch, Patryk Szlacheta, Aleksandra Kulik, Jacek Niedziela, Jolanta Urszula Nowak, Łukasz Pyka, Mariusz Gąsior, and Piotr Rozentryt. 2023. "Prognostic Value of Spot Urinary Creatinine Concentration and Its Relationship with Body Composition Parameters in HF Patients" Biomedicines 11, no. 5: 1429. https://doi.org/10.3390/biomedicines11051429