
Artificial Intelligence Driven Biomedical Image Classification for Robust Rheumatoid Arthritis Classification
 , , ,
, , ,
Abstract
:1. Introduction
2. Related Works
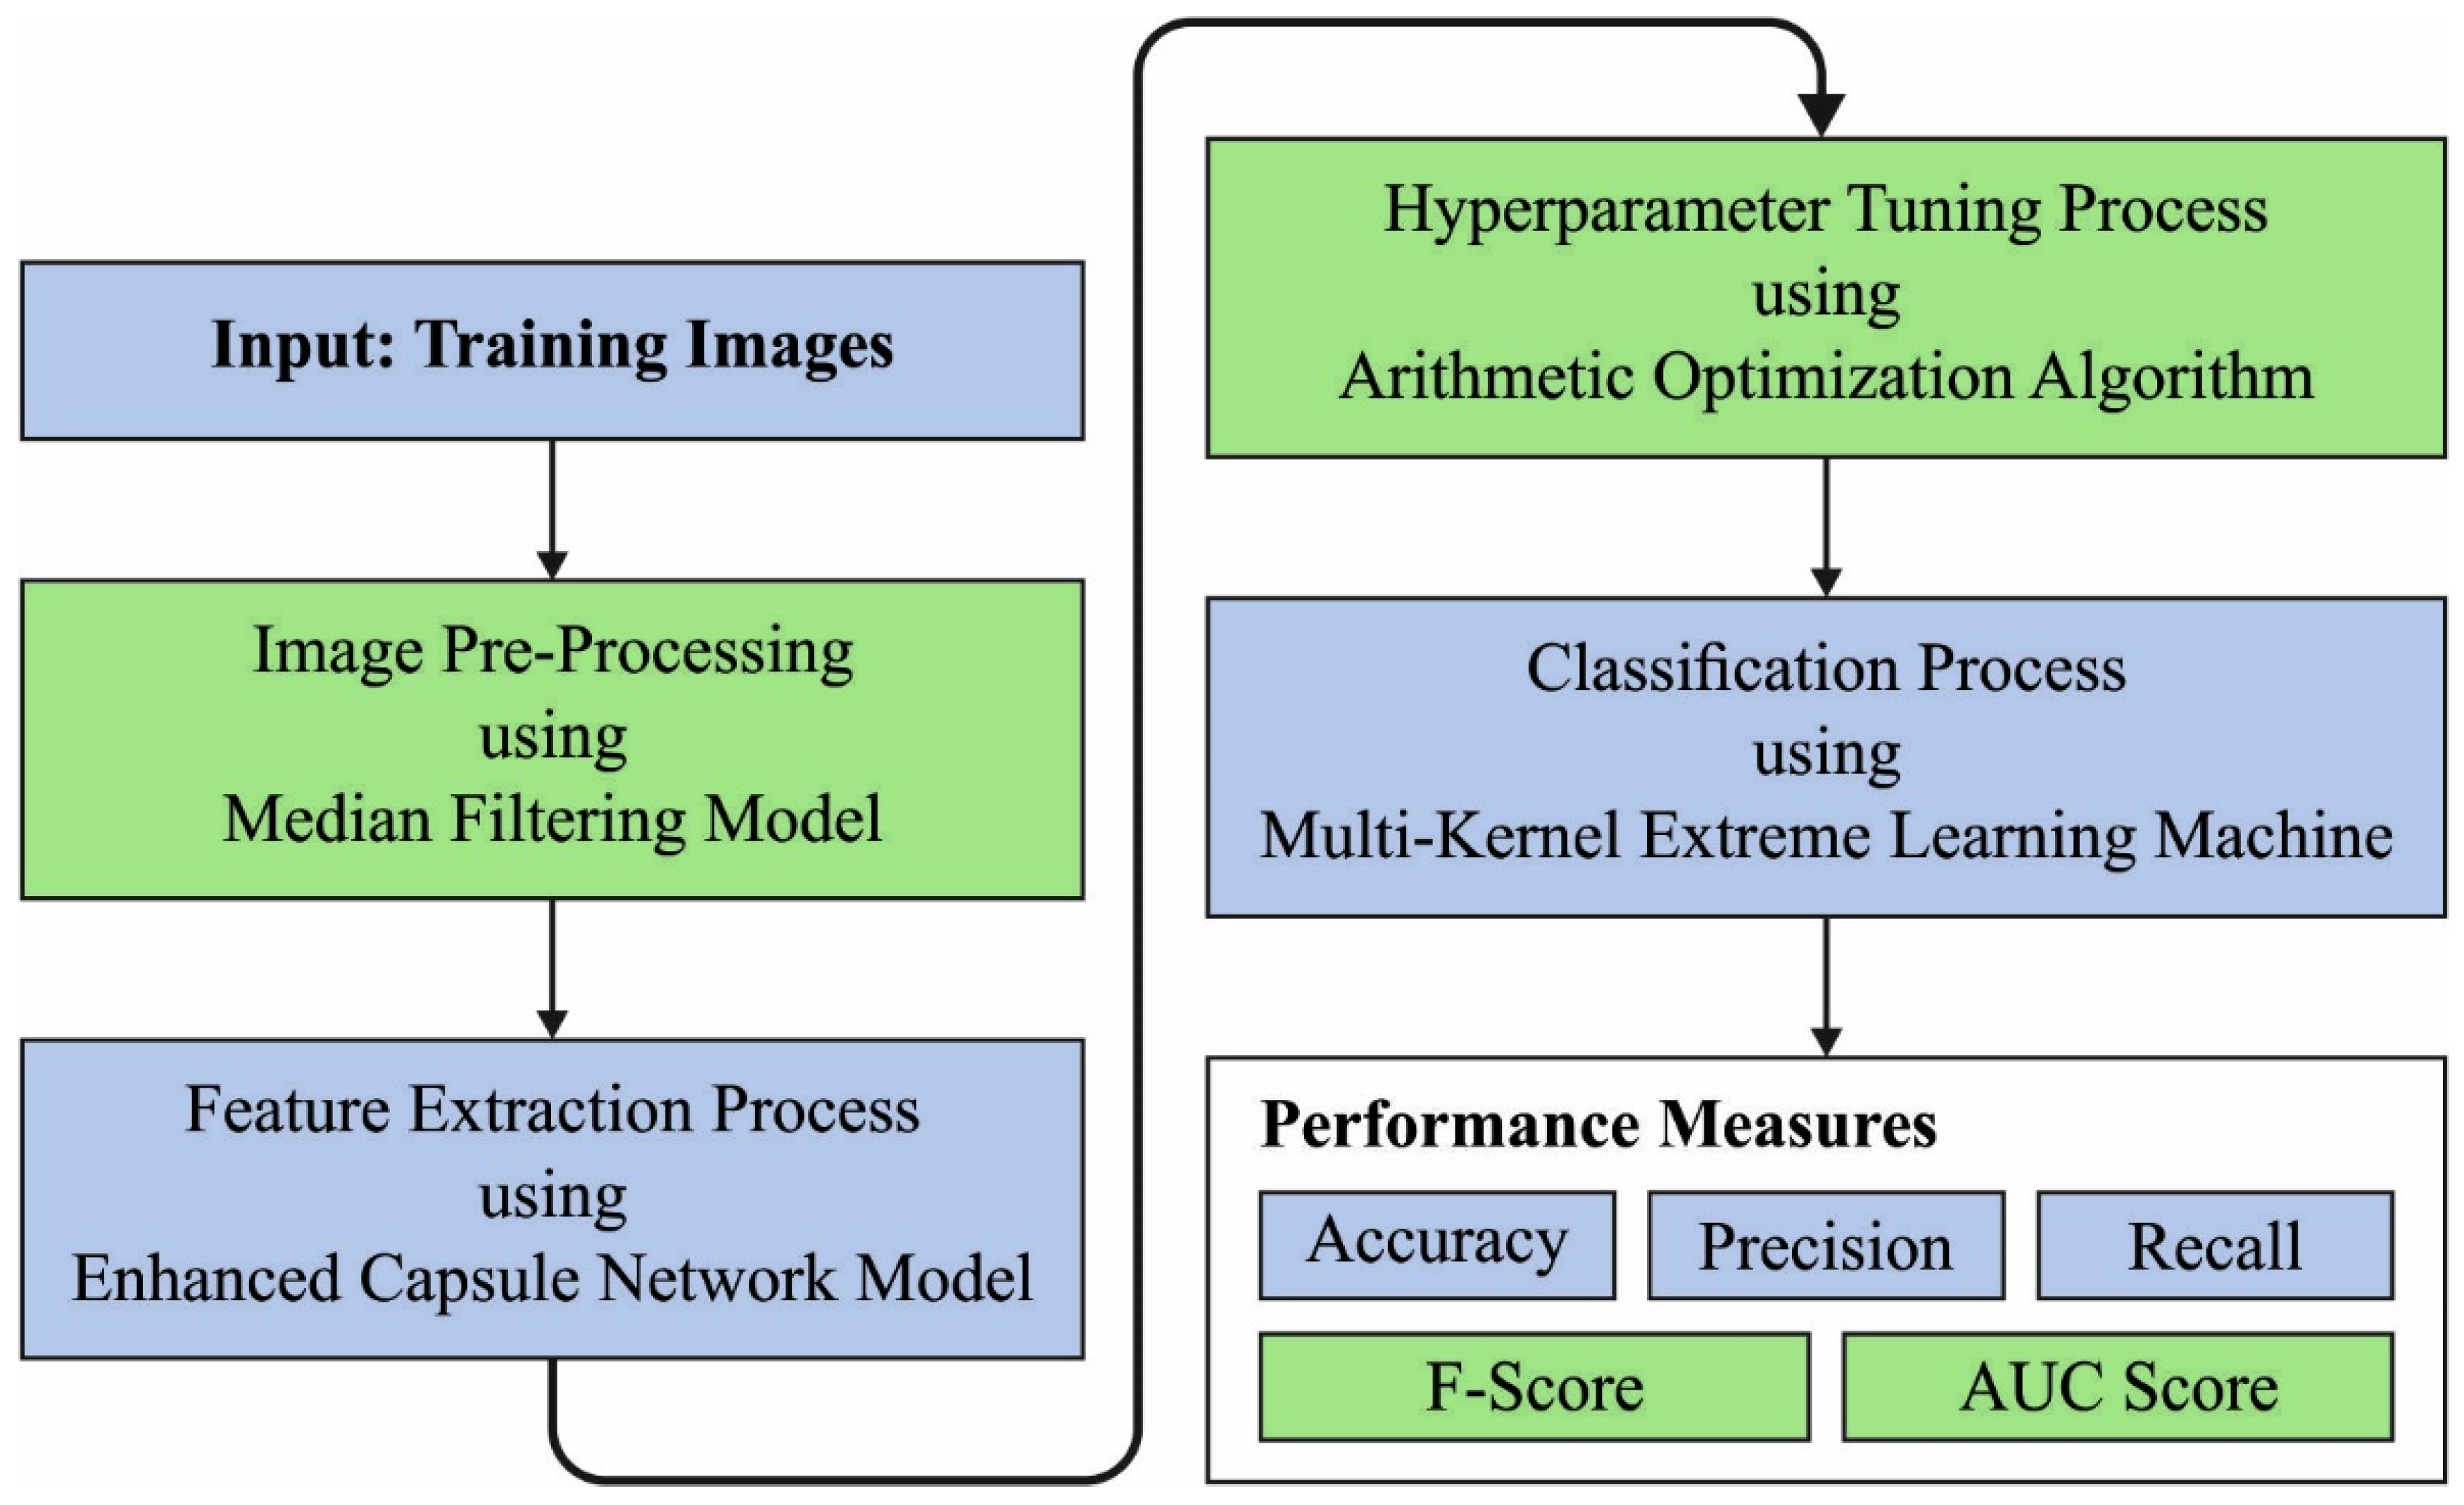
3. The Proposed Model
3.1. Noise Filtering Technique
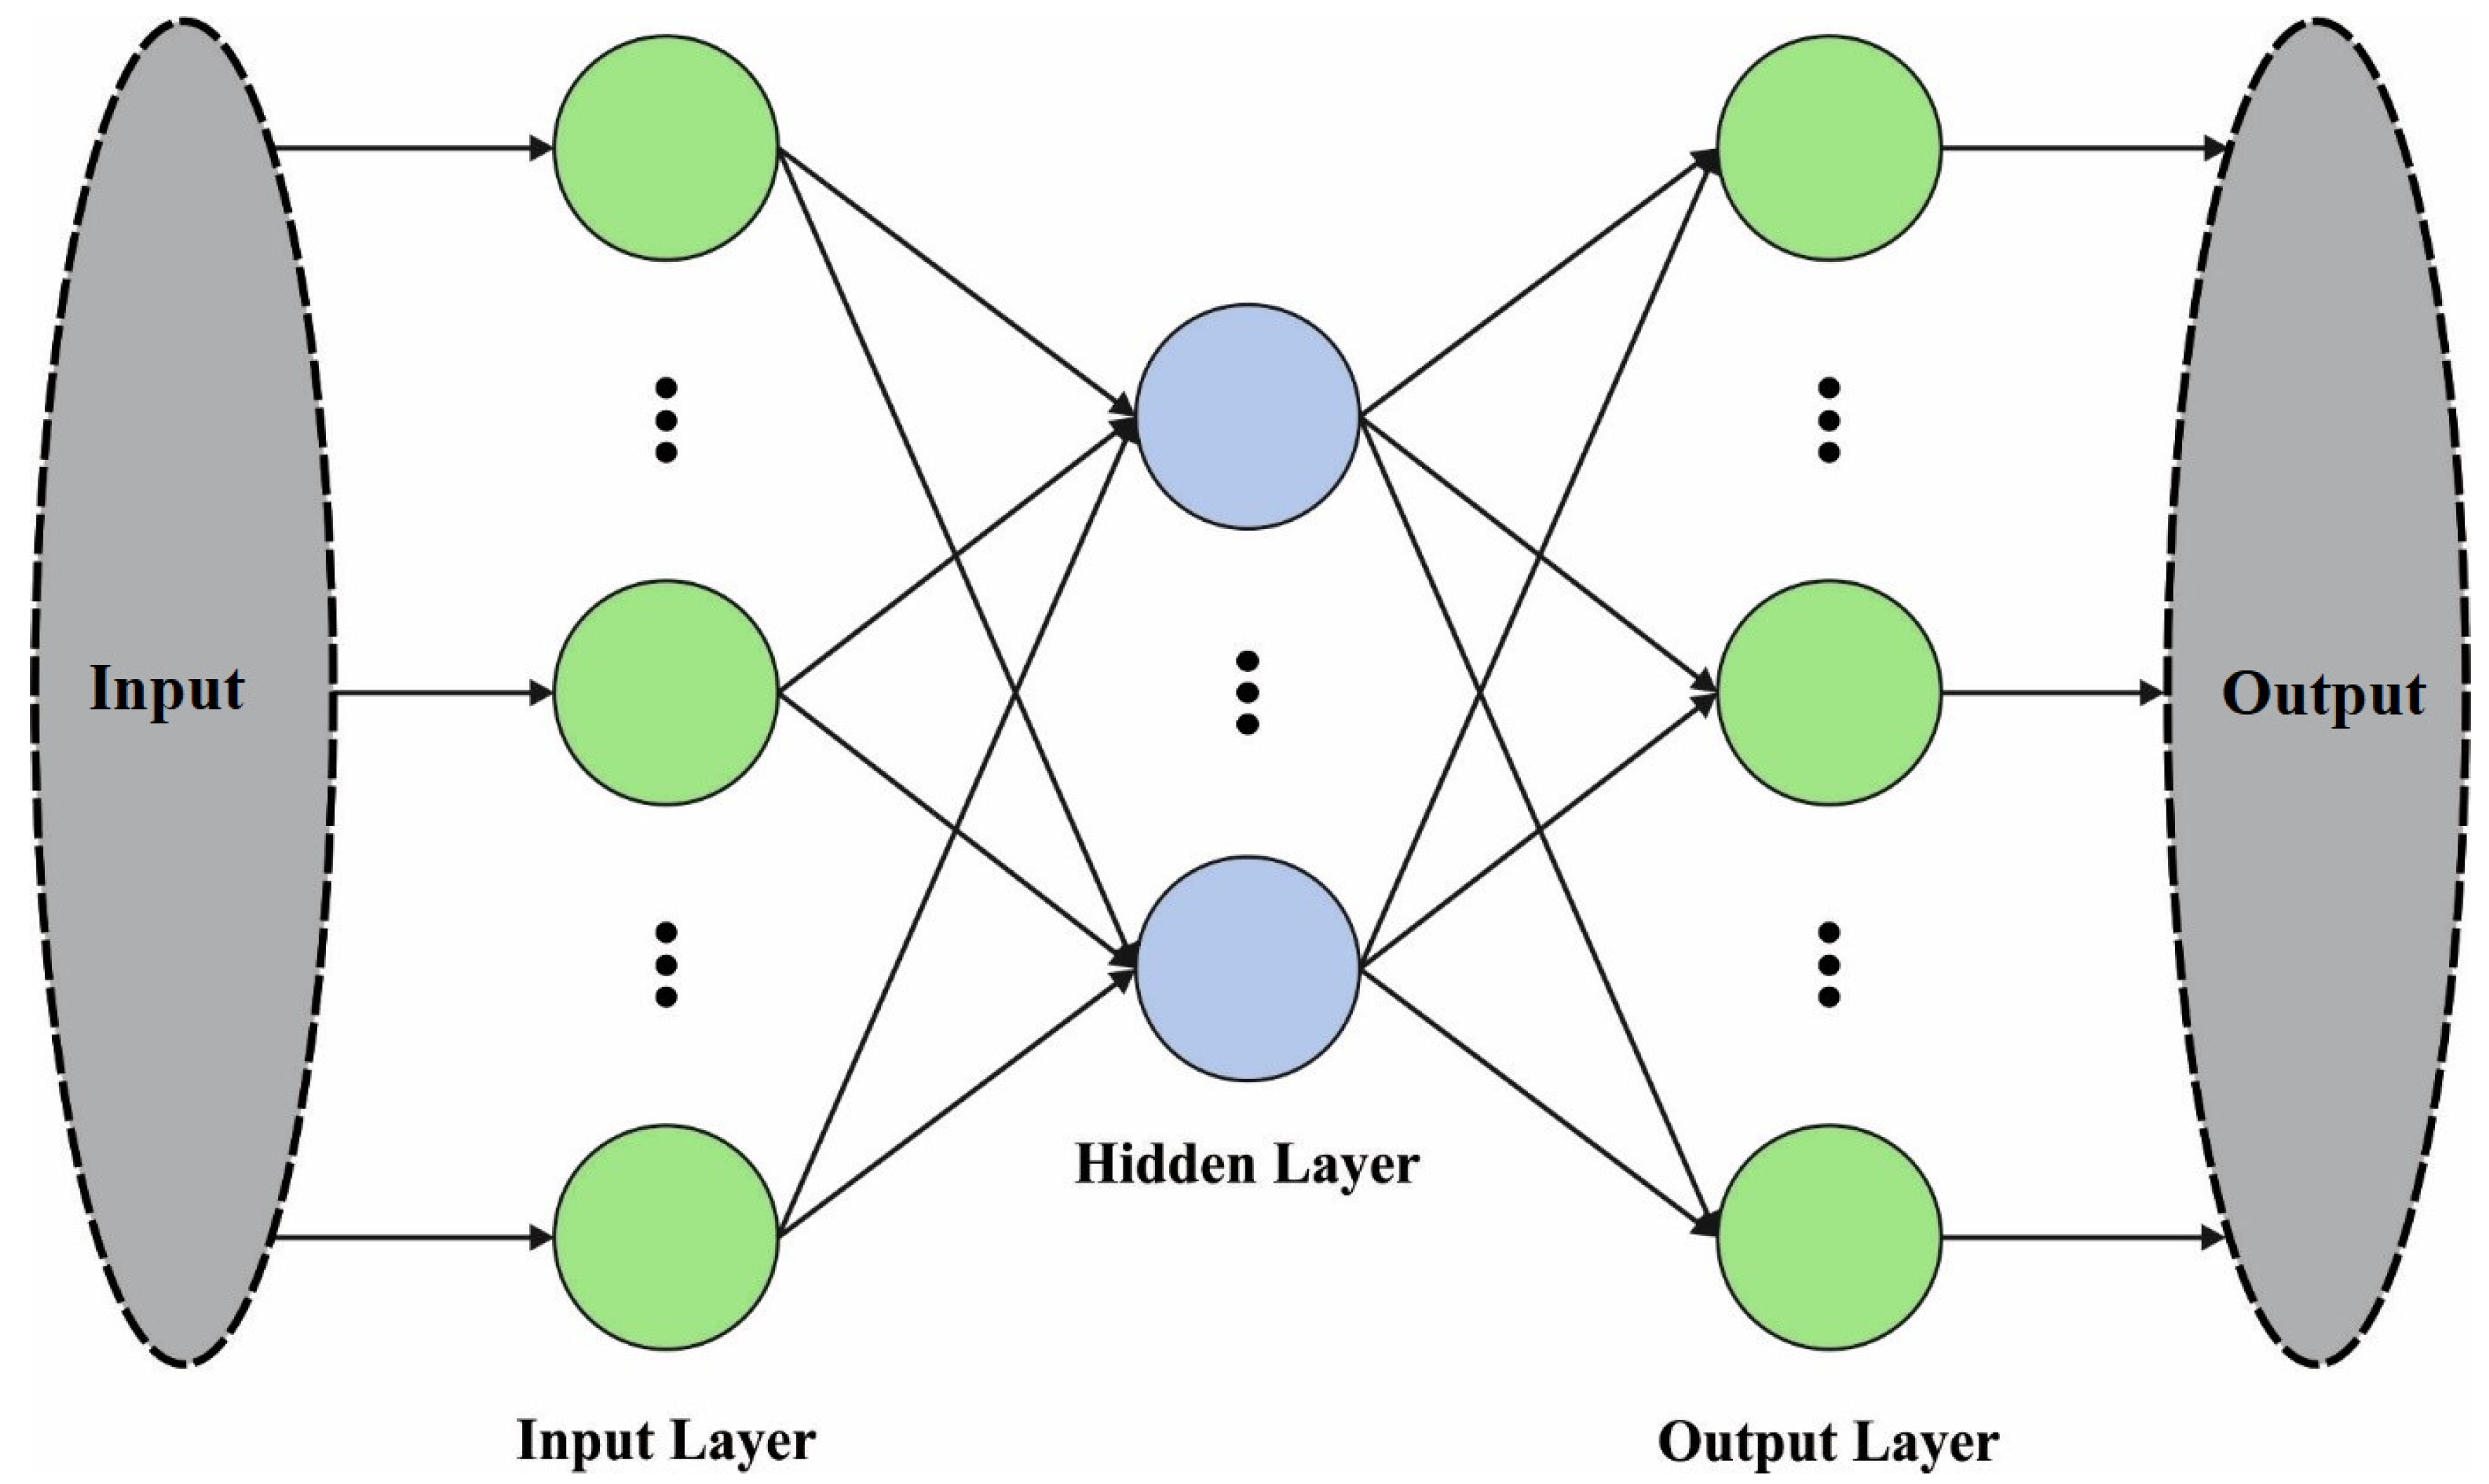
3.2. Feature Extraction Using Optimal ECN Model
| Algorithm 1. Pseudocode of AOA |
| Initialization of the parameter pop-size (N) and maximal iteration (T) |
| Initialization of the location of every search agent |
| Set the parameters and |
| While |
| Evaluate the fitness of all the search agent Upgrade bestFitness, |
| Evaluate the MOP |
| Evaluate the |
| For every search agent |
| If |
| Upgrade position |
| Else |
| Upgrade position |
| End if |
| End for |
| End While |
| Return best Fitness, |
3.3. RA Classification Model
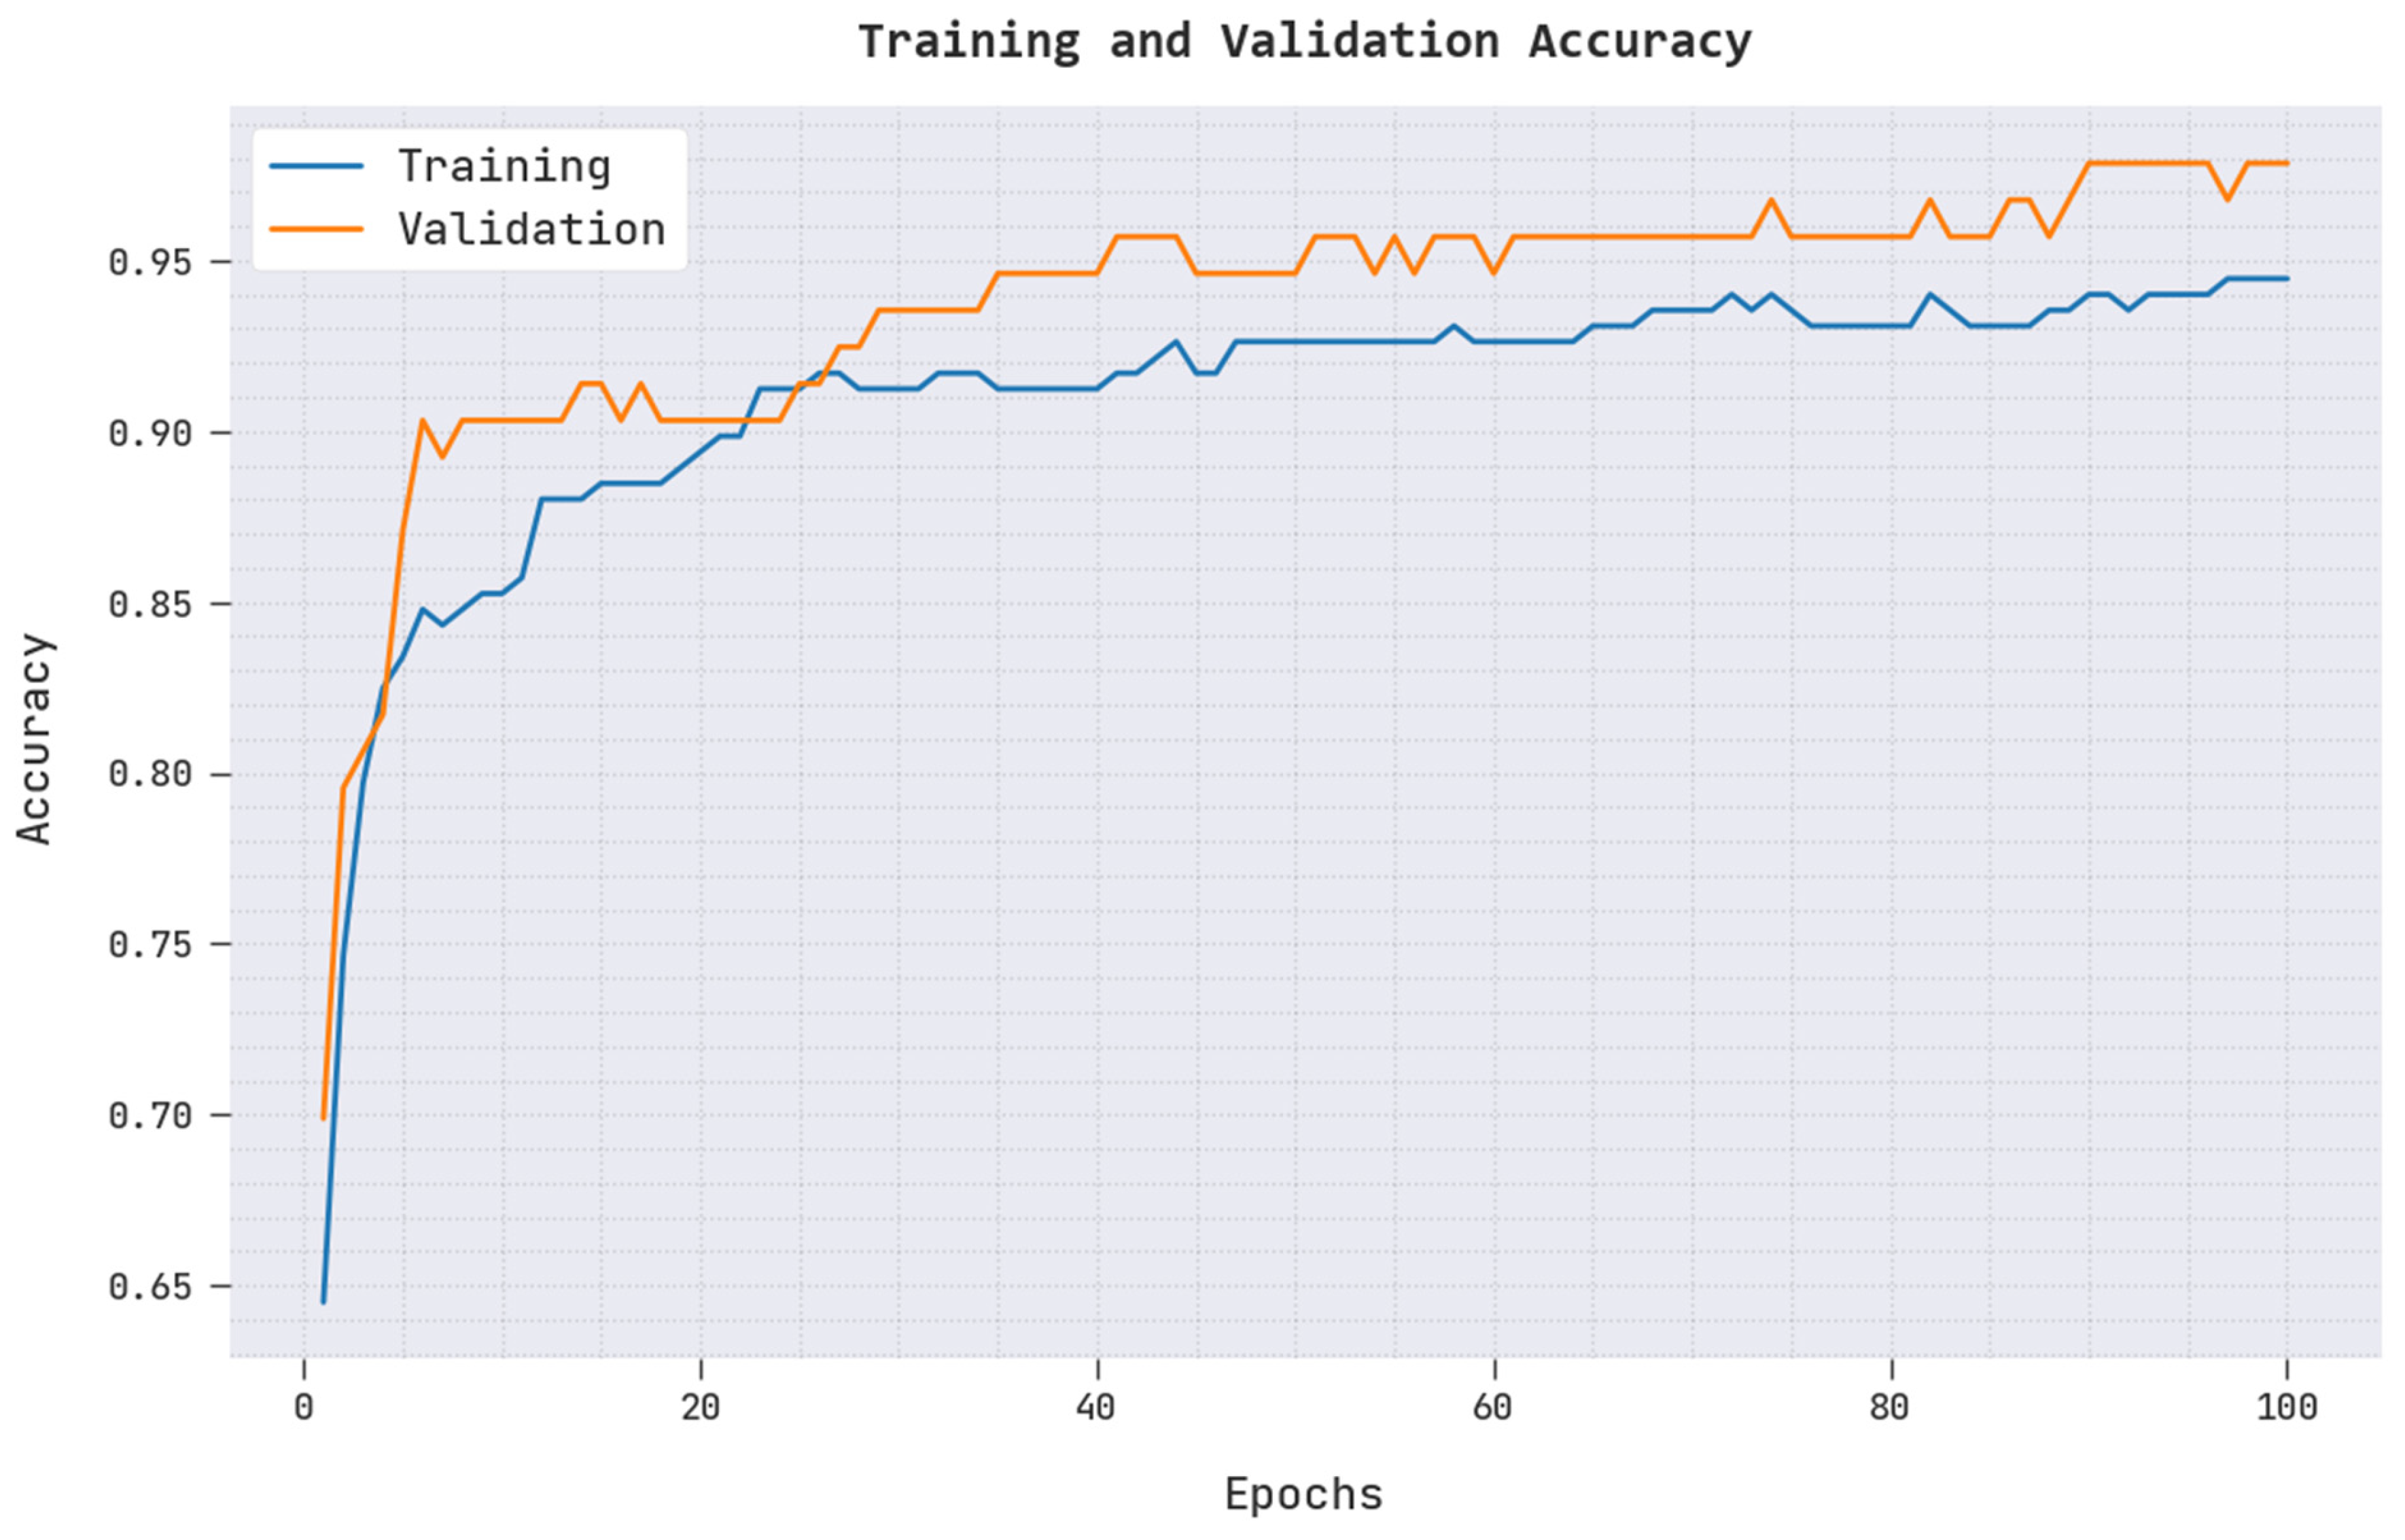
4. Experimental Validation
5. Conclusions
Author Contributions
Funding
Institutional Review Board Statement
Informed Consent Statement
Data Availability Statement
Conflicts of Interest
References
- Myasoedova, E.; Athreya, A.P.; Crowson, C.S.; Davis, J., III; Warrington, K.J.; Walchak, R.C.; Carlson, E.; Kalari, K.R.; Bongartz, T.; Tak, P.P.; et al. Toward Individualized Prediction of Response to Methotrexate in Early Rheumatoid Arthritis: A Pharmacogenomics-Driven Machine Learning Approach. Arthritis Care Res. 2022, 74, 879–888. [Google Scholar] [CrossRef] [PubMed]
- Maarseveen, T.D.; Meinderink, T.; Reinders, M.J.T.; Knitza, J.; Huizinga, T.W.J.; Kleyer, A.; Simon, D.; Akker, E.B.V.D.; Knevel, R. Machine learning electronic health record identification of patients with rheumatoid arthritis: Algorithm pipeline development and validation study. JMIR Med. Inform. 2020, 8, e23930. [Google Scholar] [CrossRef] [PubMed]
- Goñi, M.; Basu, N.; Murray, A.D.; Waiter, G.D. Brain predictors of fatigue in rheumatoid arthritis: A machine learning study. PLoS ONE 2022, 17, e0269952. [Google Scholar] [CrossRef] [PubMed]
- Prasad, B.; McGeough, C.; Eakin, A.; Ahmed, T.; Small, D.; Gardiner, P.; Pendleton, A.; Wright, G.; Bjourson, A.J.; Gibson, D.S.; et al. ATRPred: A machine learning based tool for clinical decision making of anti-TNF treatment in rheumatoid arthritis patients. PLoS Comput. Biol. 2022, 18, e1010204. [Google Scholar] [CrossRef] [PubMed]
- Yoosuf, N.; Maciejewski, M.; Ziemek, D.; Jelinsky, S.A.; Folkersen, L.; Müller, M.; Sahlström, P.; Vivar, N.; Catrina, A.; Berg, L.; et al. Early prediction of clinical response to anti-TNF treatment using multi-omics and machine learning in rheumatoid arthritis. Rheumatology 2022, 61, 1680–1689. [Google Scholar] [CrossRef] [PubMed]
- Lötsch, J.; Alfredsson, L.; Lampa, J. Machine-learning-based knowledge discovery in rheumatoid arthritis-related registry data to identify predictors of persistent pain. Pain 2019, 161, 114–126. [Google Scholar] [CrossRef] [PubMed] [Green Version]
- Crowson, C.S.; Gunderson, T.M.; Davis, J.M., III; Myasoedova, E.; Kronzer, V.L.; Coffey, C.M.; Atkinson, E.J. Using Unsupervised Machine Learning Methods to Cluster Comorbidities in a Population-based Cohort of Patients with Rheumatoid Arthritis. Arthritis Care Res. 2022. [Google Scholar] [CrossRef] [PubMed]
- Singh, U.V.; Gupta, E.; Choudhury, T. Detection of rheumatoid arthritis using machine learning. In Proceedings of the 2019 International Conference on Computational Intelligence and Knowledge Economy (ICCIKE), Dubai, United Arab Emirates, 11–12 December 2019. [Google Scholar]
- Sharon, H.; Elamvazuthi, I.; Lu, C.; Parasuraman, S.; Natarajan, E. Classification of Rheumatoid Arthritis using Machine Learning Algorithms. In Proceedings of the 2019 IEEE Student Conference on Research and Development (SCOReD), Bandar Seri Iskandar, Malaysia, 15–17 October 2019; pp. 245–250. [Google Scholar] [CrossRef]
- Kedra, J.; Davergne, T.; Braithwaite, B.; Servy, H.; Gossec, L. Machine learning approaches to improve disease management of patients with rheumatoid arthritis: Review and future directions. Expert Rev. Clin. Immunol. 2021, 17, 1311–1321. [Google Scholar] [CrossRef] [PubMed]
- Lim, A.J.; Lim, L.J.; Ooi, B.N.; Koh, E.T.; Tan, J.W.L.; Chong, S.S.; Khor, C.C.; Tucker-Kellogg, L.; Leong, K.P.; Lee, C.G.; et al. Functional coding haplotypes and machine-learning feature elimination identifies predictors of Methotrexate Response in Rheumatoid Arthritis patients. eBioMedicine 2022, 75, 103800. [Google Scholar] [CrossRef] [PubMed]
- Ahalya, R.K.; Umapathy, S.; Krishnan, P.T.; Raj, A.N.J. Automated evaluation of rheumatoid arthritis from hand radiographs using Machine Learning and deep learning techniques. Proc. Inst. Mech. Eng. Part H J. Eng. Med. 2022, 236, 1238–1249. [Google Scholar] [CrossRef] [PubMed]
- Yang, T.; Zhu, H.; Gao, X.; Zhang, Y.; Hui, Y.; Wang, F. Grading of metacarpophalangeal rheumatoid arthritis on ultrasound images using machine learning algorithms. IEEE Access 2020, 8, 67137–67146. [Google Scholar] [CrossRef]
- Tang, J.; Jin, Z.; Zhou, X.; Chu, H.; Yuan, J.; Wu, M.; Cheng, Q.; Wang, X. Grading of rheumatoid arthritis on ultrasound images with deep convolutional neural network. In Proceedings of the 2018 IEEE International Ultrasonics Symposium (IUS), Kobe, Japan, 22–25 October 2018; pp. 1–4. [Google Scholar]
- Sharon, H.; Elamvazuthi, I.; Lu, C.-K.; Parasuraman, S.; Natarajan, E. Development of rheumatoid arthritis classification from electronic image sensor using ensemble method. Sensors 2019, 20, 167. [Google Scholar] [CrossRef] [PubMed] [Green Version]
- Chin, C.-Y.; Hsieh, S.-Y.; Tseng, V.S. eDRAM: Effective early disease risk assessment with matrix factorization on a large-scale medical database: A case study on rheumatoid arthritis. PLoS ONE 2018, 13, e0207579. [Google Scholar] [CrossRef] [PubMed]
- Andreu-Perez, J.; Garcia-Gancedo, L.; McKinnell, J.; Van Der Drift, A.; Powell, A.; Hamy, V.; Keller, T.; Yang, G.-Z. Developing fine-grained actigraphies for rheumatoid arthritis patients from a single accelerometer using machine learning. Sensors 2017, 17, 2113. [Google Scholar] [CrossRef] [PubMed]
- Zhang, Z.; Ye, S.; Liao, P.; Liu, Y.; Su, G.; Sun, Y. Enhanced capsule network for medical image classification. In Proceedings of the 2020 42nd Annual International Conference of the IEEE Engineering in Medicine & Biology Society (EMBC), Montreal, QC, Canada, 20–24 July 2020; pp. 1544–1547. [Google Scholar]
- Abualigah, L.; Diabat, A.; Mirjalili, S.; Abd Elaziz, M.; Gandomi, A.H. The arithmetic optimization algorithm. Comput. Methods Appl. Mech. Eng. 2021, 376, 113609. [Google Scholar] [CrossRef]
- Kaveh, A.; Hamedani, K.B. January. Improved arithmetic optimization algorithm and its application to discrete structural optimization. In Structures; Elsevier: Amsterdam, The Netherlands, 2021; Volume 35, pp. 748–764. [Google Scholar]
- Bisoi, R.; Dash, P.K.; Das, P.P. Short-term electricity price forecasting and classification in smart grids using optimized multikernel extreme learning machine. Neural Comput. Appl. 2018, 32, 1457–1480. [Google Scholar] [CrossRef]
- Xing, Y.; Ban, X.; Guo, C. Probabilistic forecasting of traffic flow using multikernel based extreme learning machine. Sci. Program. 2017, 2017, 2073680. [Google Scholar] [CrossRef]
- Biomechanical Features of Orthopedic Patients. Available online: https://www.kaggle.com/datasets/uciml/biomechanical-features-of-orthopedic-patients?resource=download (accessed on 12 August 2022).


| Class | No. of Instances |
|---|---|
| Hernia | 60 |
| Spondylolisthesis | 150 |
| Normal | 100 |
| Total Number of Samples | 310 |
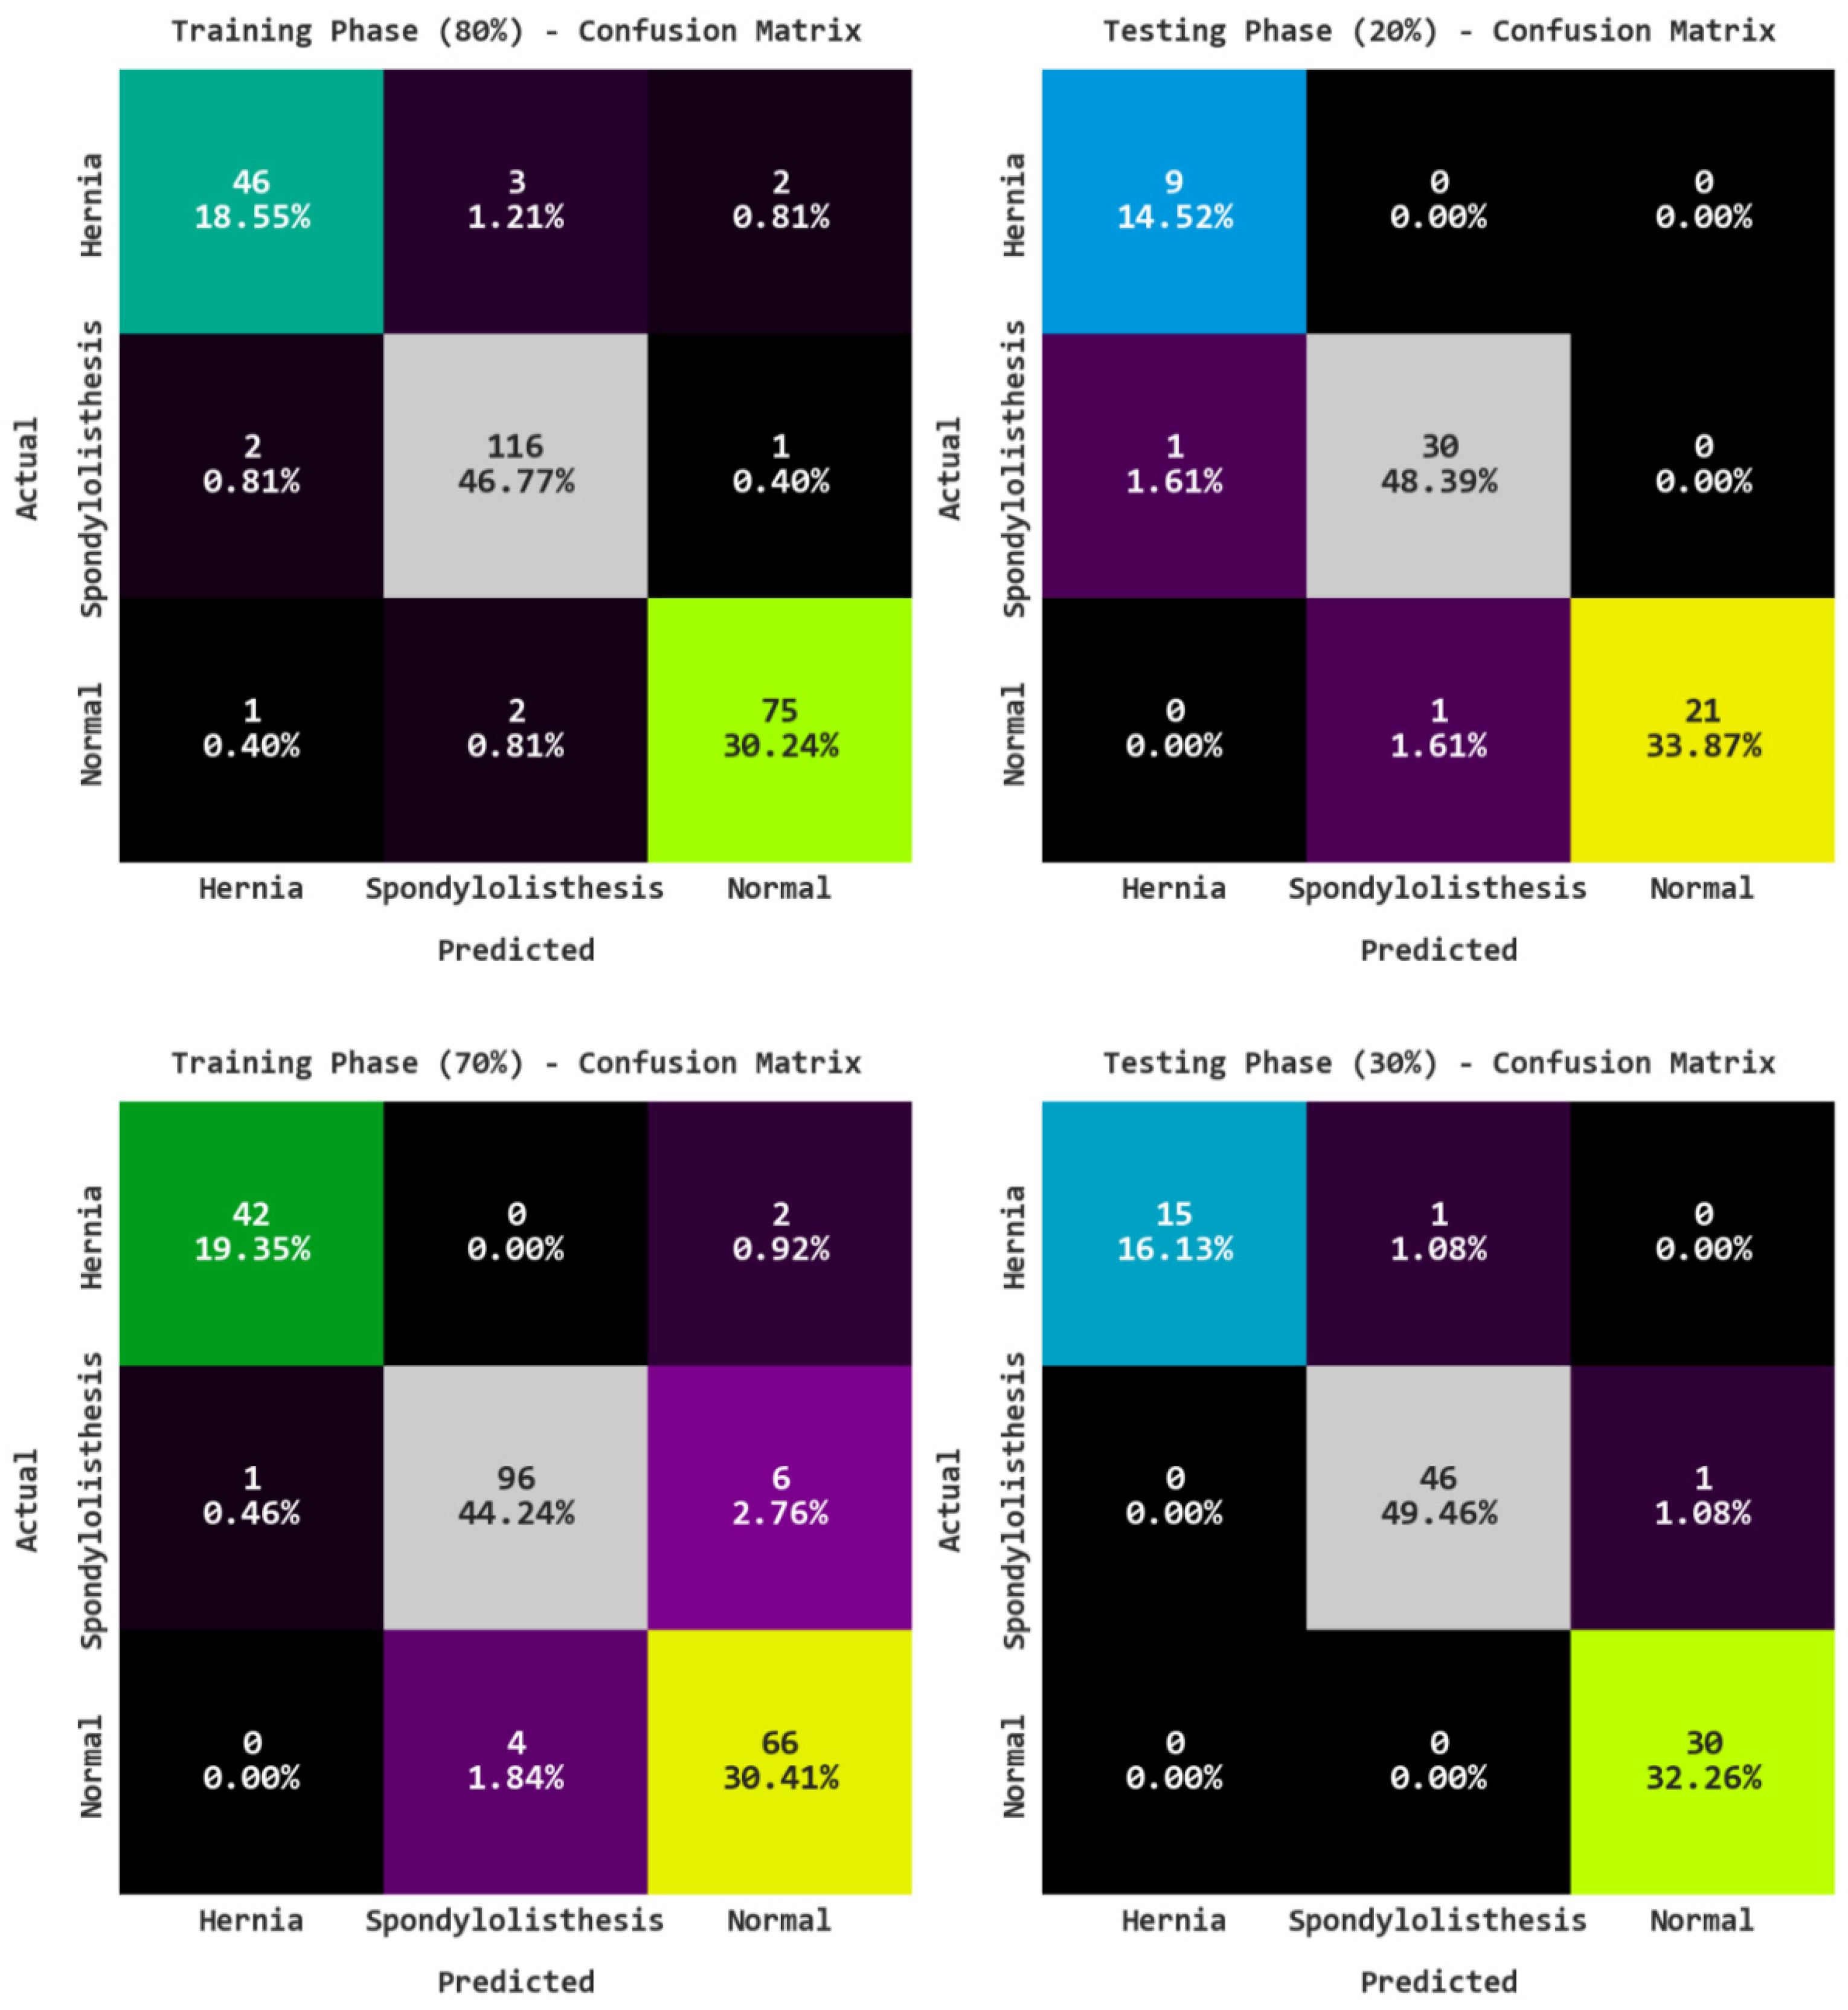
| Training/Testing (80:20) | |||||
|---|---|---|---|---|---|
| Labels | Accuracy | Precision | Recall | F-Score | AUC Score |
| Training Phase | |||||
| Hernia | 96.77 | 93.88 | 90.20 | 92.00 | 94.34 |
| Spondylolisthesis | 96.77 | 95.87 | 97.48 | 96.67 | 96.80 |
| Normal | 97.58 | 96.15 | 96.15 | 96.15 | 97.19 |
| Average | 97.04 | 95.30 | 94.61 | 94.94 | 96.11 |
| Testing Phase | |||||
| Hernia | 98.39 | 90.00 | 100.00 | 94.74 | 99.06 |
| Spondylolisthesis | 96.77 | 96.77 | 96.77 | 96.77 | 96.77 |
| Normal | 98.39 | 100.00 | 95.45 | 97.67 | 97.73 |
| Average | 97.85 | 95.59 | 97.41 | 96.40 | 97.85 |
| Training/Testing (70:30) | |||||
|---|---|---|---|---|---|
| Labels | Accuracy | Precision | Recall | F-Score | AUC Score |
| Training Phase | |||||
| Hernia | 98.62 | 97.67 | 95.45 | 96.55 | 97.44 |
| Spondylolisthesis | 94.93 | 96.00 | 93.20 | 94.58 | 94.85 |
| Normal | 94.47 | 89.19 | 94.29 | 91.67 | 94.42 |
| Average | 96.01 | 94.29 | 94.31 | 94.27 | 95.57 |
| Testing Phase | |||||
| Hernia | 98.92 | 100.00 | 93.75 | 96.77 | 96.88 |
| Spondylolisthesis | 97.85 | 97.87 | 97.87 | 97.87 | 97.85 |
| Normal | 98.92 | 96.77 | 100.00 | 98.36 | 99.21 |
| Average | 98.57 | 98.22 | 97.21 | 97.67 | 97.98 |
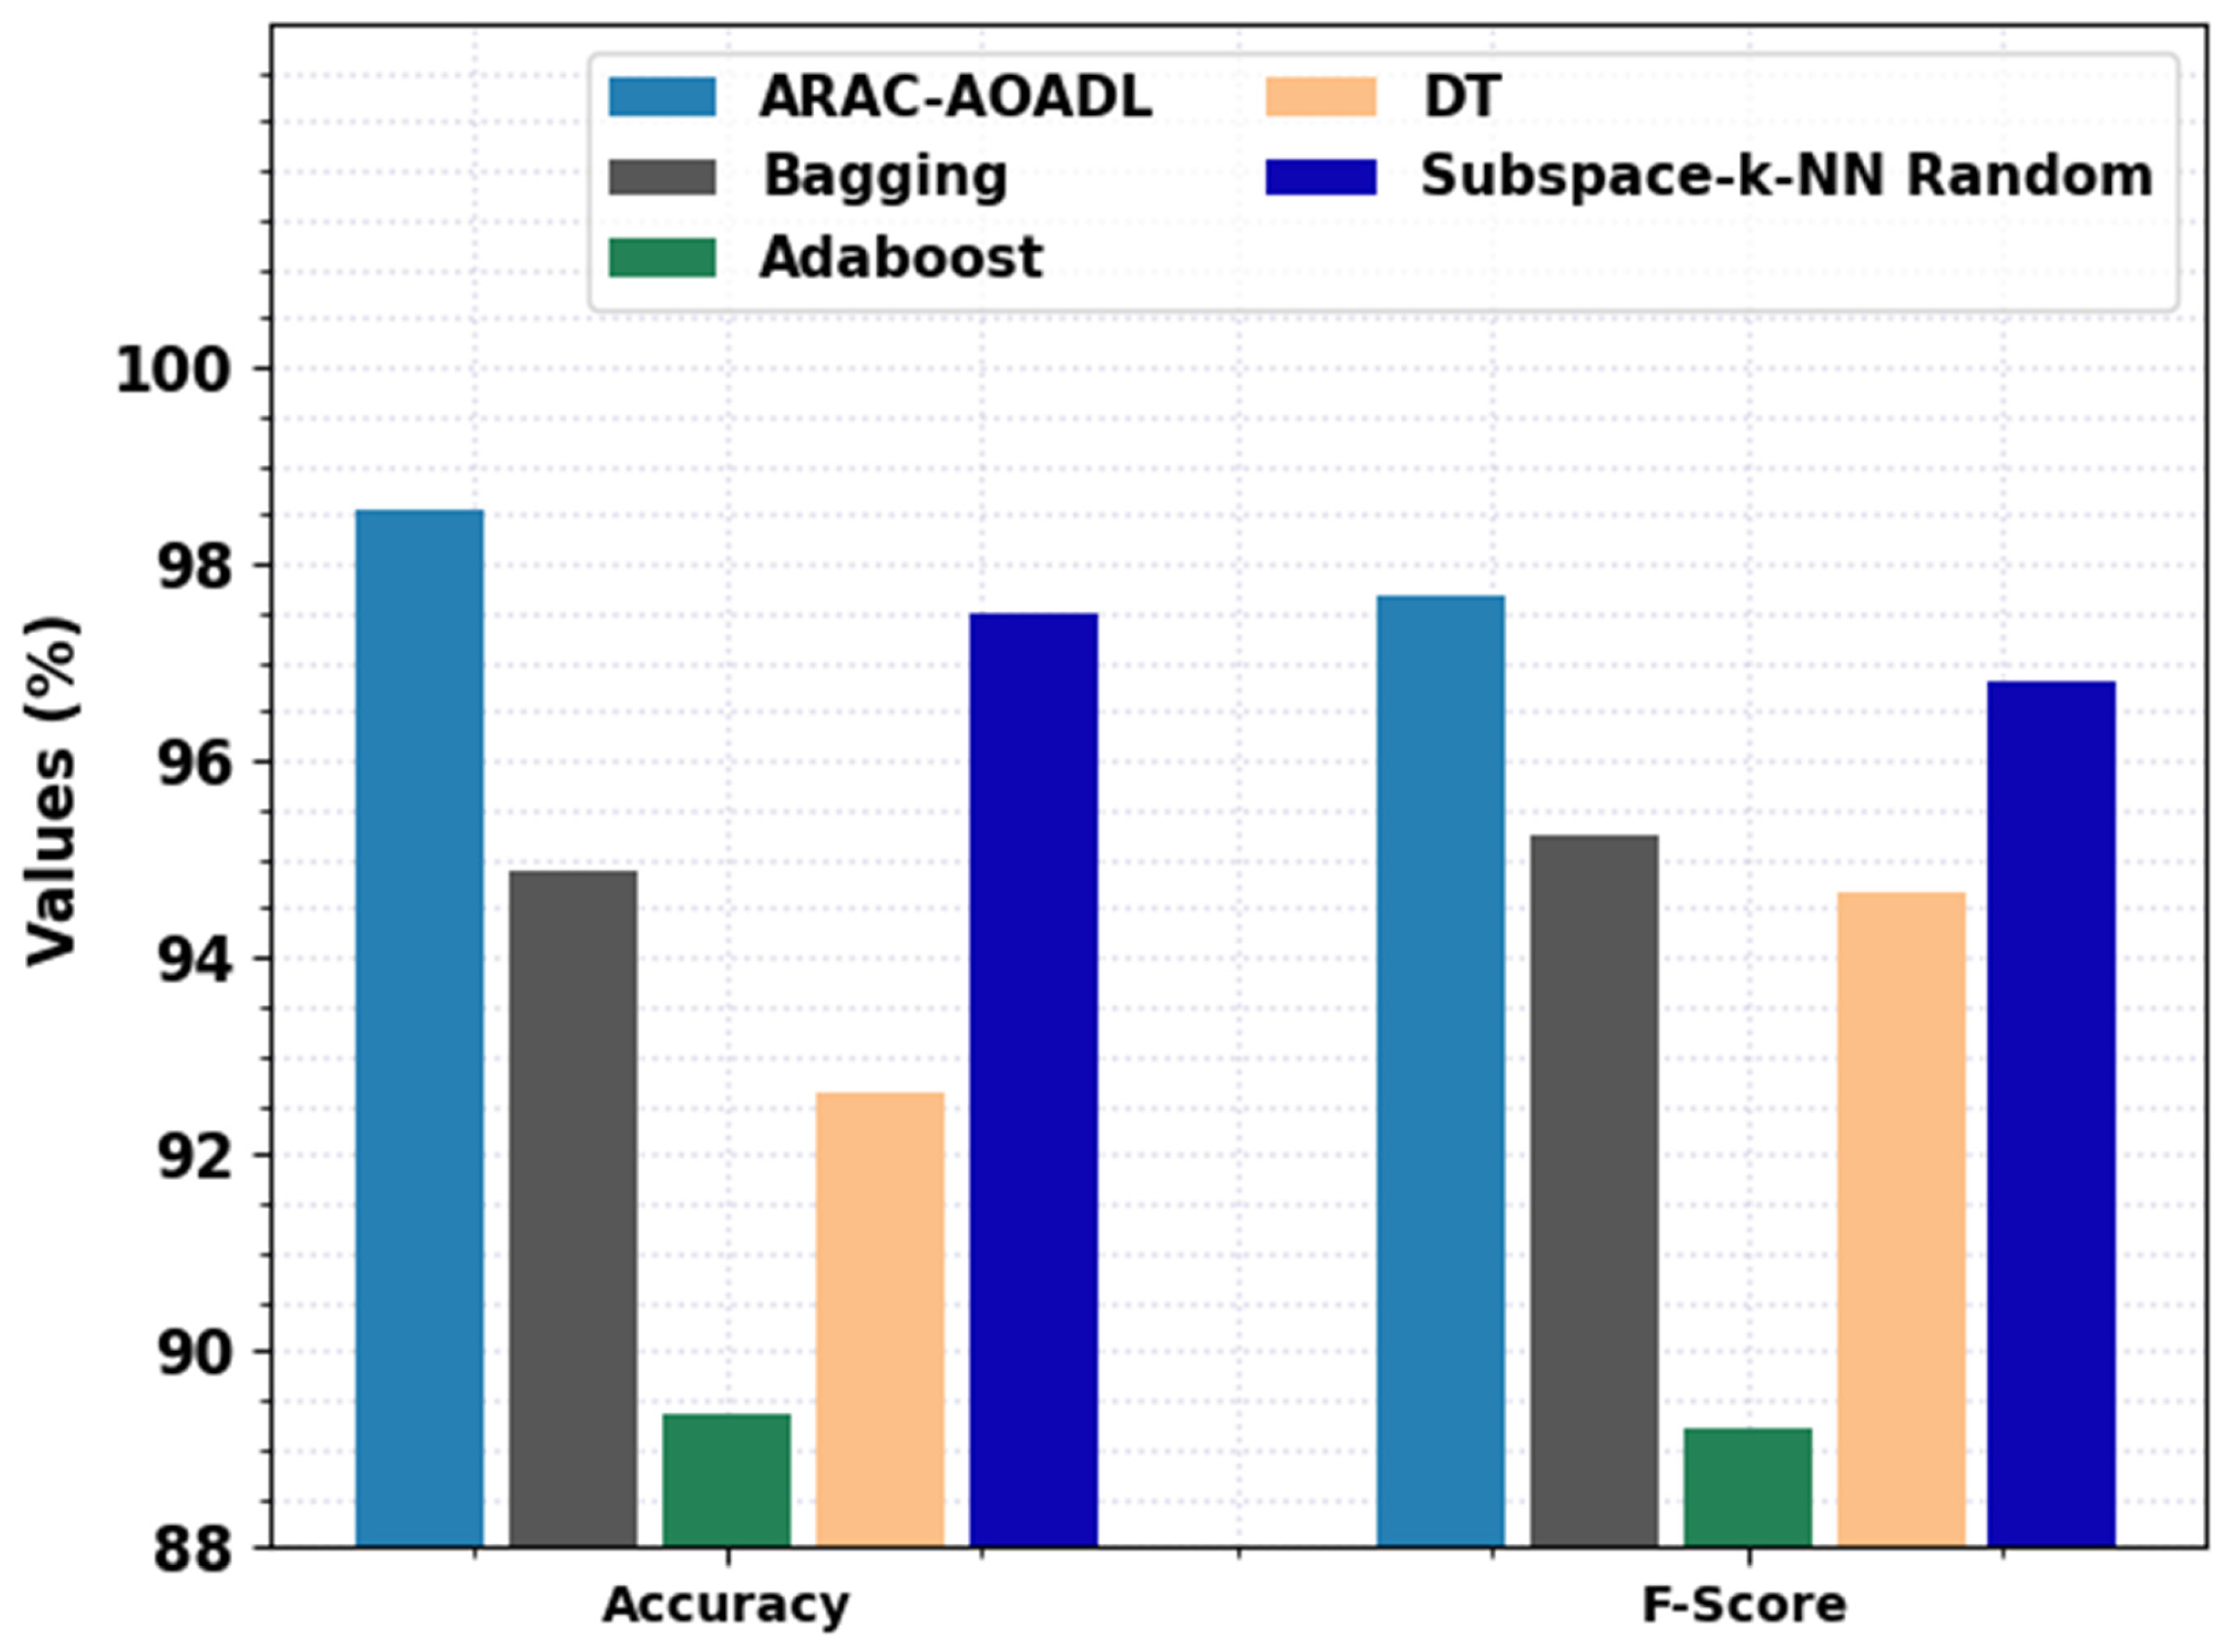
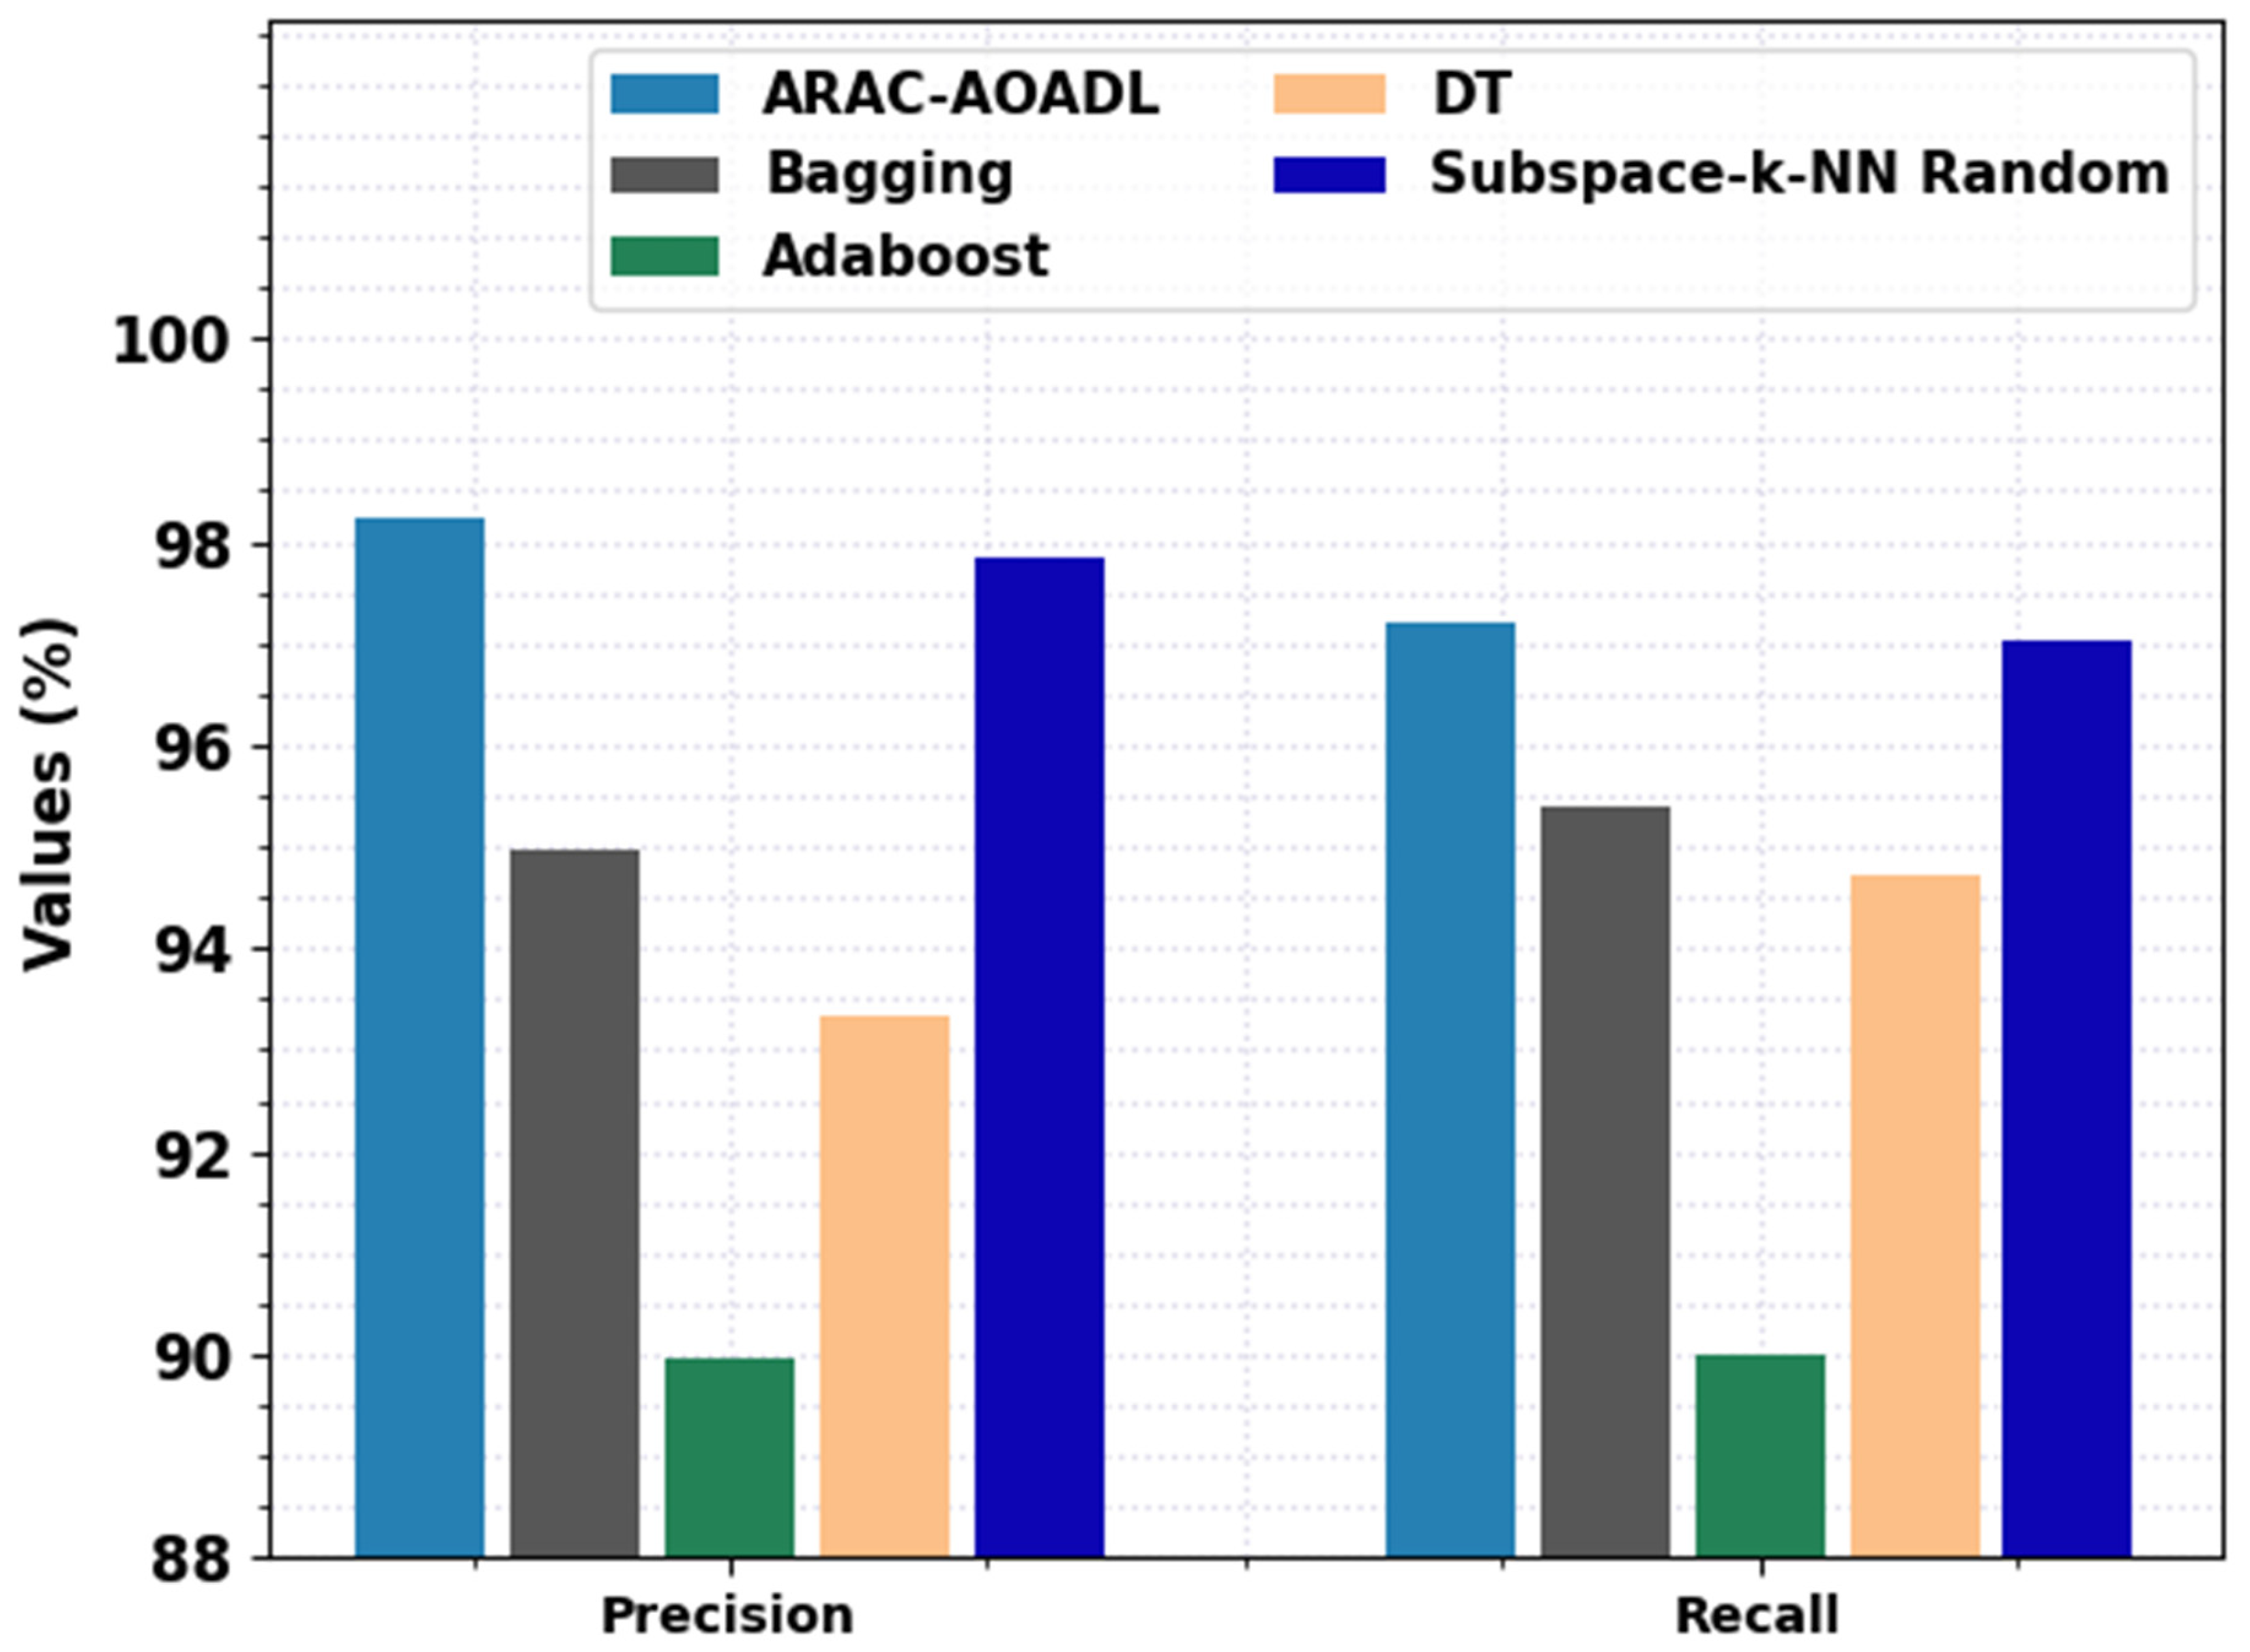
| Methods | Accuracy | Precision | Recall | F-Score |
|---|---|---|---|---|
| ARAC-AOADL | 98.57 | 98.22 | 97.21 | 97.67 |
| Bagging | 94.89 | 94.97 | 95.4 | 95.23 |
| Adaboost | 89.37 | 89.96 | 90.01 | 89.21 |
| DT | 92.64 | 93.32 | 94.73 | 94.68 |
| Subspace-k-NN Random | 97.50 | 97.83 | 97.02 | 96.82 |
Publisher’s Note: MDPI stays neutral with regard to jurisdictional claims in published maps and institutional affiliations. |
© 2022 by the authors. Licensee MDPI, Basel, Switzerland. This article is an open access article distributed under the terms and conditions of the Creative Commons Attribution (CC BY) license (https://creativecommons.org/licenses/by/4.0/).
Share and Cite
Obayya, M.; Alamgeer, M.; S. Alzahrani, J.; Alabdan, R.; N. Al-Wesabi, F.; Mohamed, A.; Alsaid Hassan, M.I. Artificial Intelligence Driven Biomedical Image Classification for Robust Rheumatoid Arthritis Classification. Biomedicines 2022, 10, 2714. https://doi.org/10.3390/biomedicines10112714
Obayya M, Alamgeer M, S. Alzahrani J, Alabdan R, N. Al-Wesabi F, Mohamed A, Alsaid Hassan MI. Artificial Intelligence Driven Biomedical Image Classification for Robust Rheumatoid Arthritis Classification. Biomedicines. 2022; 10(11):2714. https://doi.org/10.3390/biomedicines10112714
Chicago/Turabian StyleObayya, Marwa, Mohammad Alamgeer, Jaber S. Alzahrani, Rana Alabdan, Fahd N. Al-Wesabi, Abdullah Mohamed, and Mohamed Ibrahim Alsaid Hassan. 2022. "Artificial Intelligence Driven Biomedical Image Classification for Robust Rheumatoid Arthritis Classification" Biomedicines 10, no. 11: 2714. https://doi.org/10.3390/biomedicines10112714