
Regular Intermittent Aerobic Exercise Reduces Arterial Stiffness Associated with Postprandial Hyperglycemia in Middle-Aged and Older Individuals


1
Center for Fundamental Education, Teikyo University of Science, Tokyo 120-0045, Japan
2
Faculty of Medicine, Nara Medical University, Nara 634-8521, Japan
*
Author to whom correspondence should be addressed.
BioMed 2024, 4(1), 39-49; https://doi.org/10.3390/biomed4010003
Submission received: 22 November 2023
/
Revised: 15 January 2024
/
Accepted: 19 January 2024
/
Published: 8 February 2024
Abstract
:Hardening of arterial walls associated with elevated postprandial blood glucose levels increases the risk of cardiovascular disease; however, the impact of intermittent aerobic training on reducing arterial stiffness is unknown. The aim of this study was to examine the chronic effects of intermittent aerobic exercise on arterial stiffness during hyperglycemia in middle-aged adults: 30 healthy middle-aged adults were randomly assigned to an 8-week intermittent aerobic training group (n = 15, jogging or running, 30 min/run, 3 times/week, 65% reserve heart rate) and a control group (n = 15, no training). Pulse wave velocity (PWV) of carotid-femoral (cf) and brachial-ankle (ba), heart rate, blood pressure, and blood glucose was measured before a 75 g oral glucose tolerance test (OGTT) and 30, 60, and 90 min after the test, before the exercise intervention, and 4 and 8 weeks after intervention. The baPWV and blood glucose levels before the intervention were elevated at 30, 60, and 90 min in both groups compared to levels before the 75 g OGTT (p < 0.01). The baPWV and blood glucose levels after 4 and 8 weeks of intervention were unchanged in the training group compared to that before the 75 g OGTT, but increased at 30, 60, and 90 min in the control group compared to that before the 75 g OGTT (p < 0.01). The baPWV and blood glucose levels at 30 and 60 min after the 75 g OGTT after 4 and 8 weeks of intervention were lower in the training group than in the control group (p < 0.01). These results indicate that intermittent aerobic exercise training may reduce the acute increase in arterial stiffness after hyperglycemia.
1. Introduction
Postprandial hyperglycemia is a risk factor for cardiovascular disease independent of fasting blood glucose levels [1]. It is believed that postprandial hyperglycemia increases the incidence of cardiovascular disease, which is caused by increased atherosclerosis [2]. Many studies have shown that arterial stiffness (brachial-ankle pulse wave velocity (baPWV)) increases after acute hyperglycemia in middle-aged and elderly individuals [3,4]. We also demonstrated that baPWV increases after a 75 g oral glucose tolerance test (OGTT) in elderly subjects compared with the pre-test [5], confirming that arterial stiffness [6] and blood glucose levels [7] increase with age. Therefore, arterial stiffness in middle-aged and older adults should be inhibited from being increased by postprandial hyperglycemia.
A recent study demonstrated that aerobic exercise suppresses the increase in baPWV associated with postprandial hyperglycemia [8]. However, it is difficult for middle-aged and elderly people who do not habitually exercise to continuously exercise at medium intensity for more than 30 min, as described above, and it also requires a strong willingness to continue under such exercise conditions [9]. However, moderate intermittent aerobic exercise provides superior benefits compared with moderate continuous exercise [10]. Recent studies have shown that acute intermittent aerobic exercise reduces arterial stiffness 60 min after it is performed [11]. In addition, other studies have reported that 20 min of acute aerobic exercise (two cycling sessions of 15 min) reduces systemic arterial stiffness [12]. We similarly showed that aerobic exercise (two cycling sessions of 15 min) with a 20 min rest interval reduces arterial stiffness [13]. Thus, intermittent acute aerobic exercise training may prevent increased arterial stiffness after postprandial hyperglycemia [14]. However, the effect of intermittent aerobic exercise training on increased arterial stiffness after postprandial hyperglycemia remains unclear.
2. Materials and Methods
2.1. Participants
Thirty healthy middle-aged and older adults (14 men and 16 postmenopausal women) were included in the study. Participants were collected by posting flyers (Table 1). In the end, 50 applicants were obtained, from which 30 were selected using Dr. Negoro’s judgment after meeting the following criteria and more. Assumed participation criteria were normal blood pressure (Japanese guideline standard: <140/90 mmHg [15]), non-smoking, no apparent disease, no exercise habits before the study using the international physical activity questionnaire (IPAQ), and no abnormal values in nutrient intake before the study using Excel Nutrition Ver. 6.0 (Kenpakusha Co., Ltd., Tokyo, Japan). Those with diabetes; abnormal chest radiographs, blood tests, or electrocardiograms in the year prior to the study or exercise weeks; or nutritional imbalances were excluded from the study. For the allocation of the participants, a computer-generated list of random numbers was used. To avoid the involvement of other confounding factors such as exercise and diet, participants were given verbal and written instructions that their diet and exercise habits would remain the same during the intervention. A power analysis was performed using G*Power 3 to determine the number of participants in the study [16]. The effect size of aerobic exercise training on atherosclerosis was assumed to be 0.5. After an analysis of variance, it was determined that 9 participants should be included to detect a difference with 80% power and a two-sided alpha of 5%. After accounting for dropouts, a final total of 30 participants were included in the study. The study was conducted in compliance with the Declaration of Helsinki. All participants were randomly assigned to the intermittent aerobic training group (IAT, 15 participants) or the control group (CON, 15 participants).
2.2. Study Design
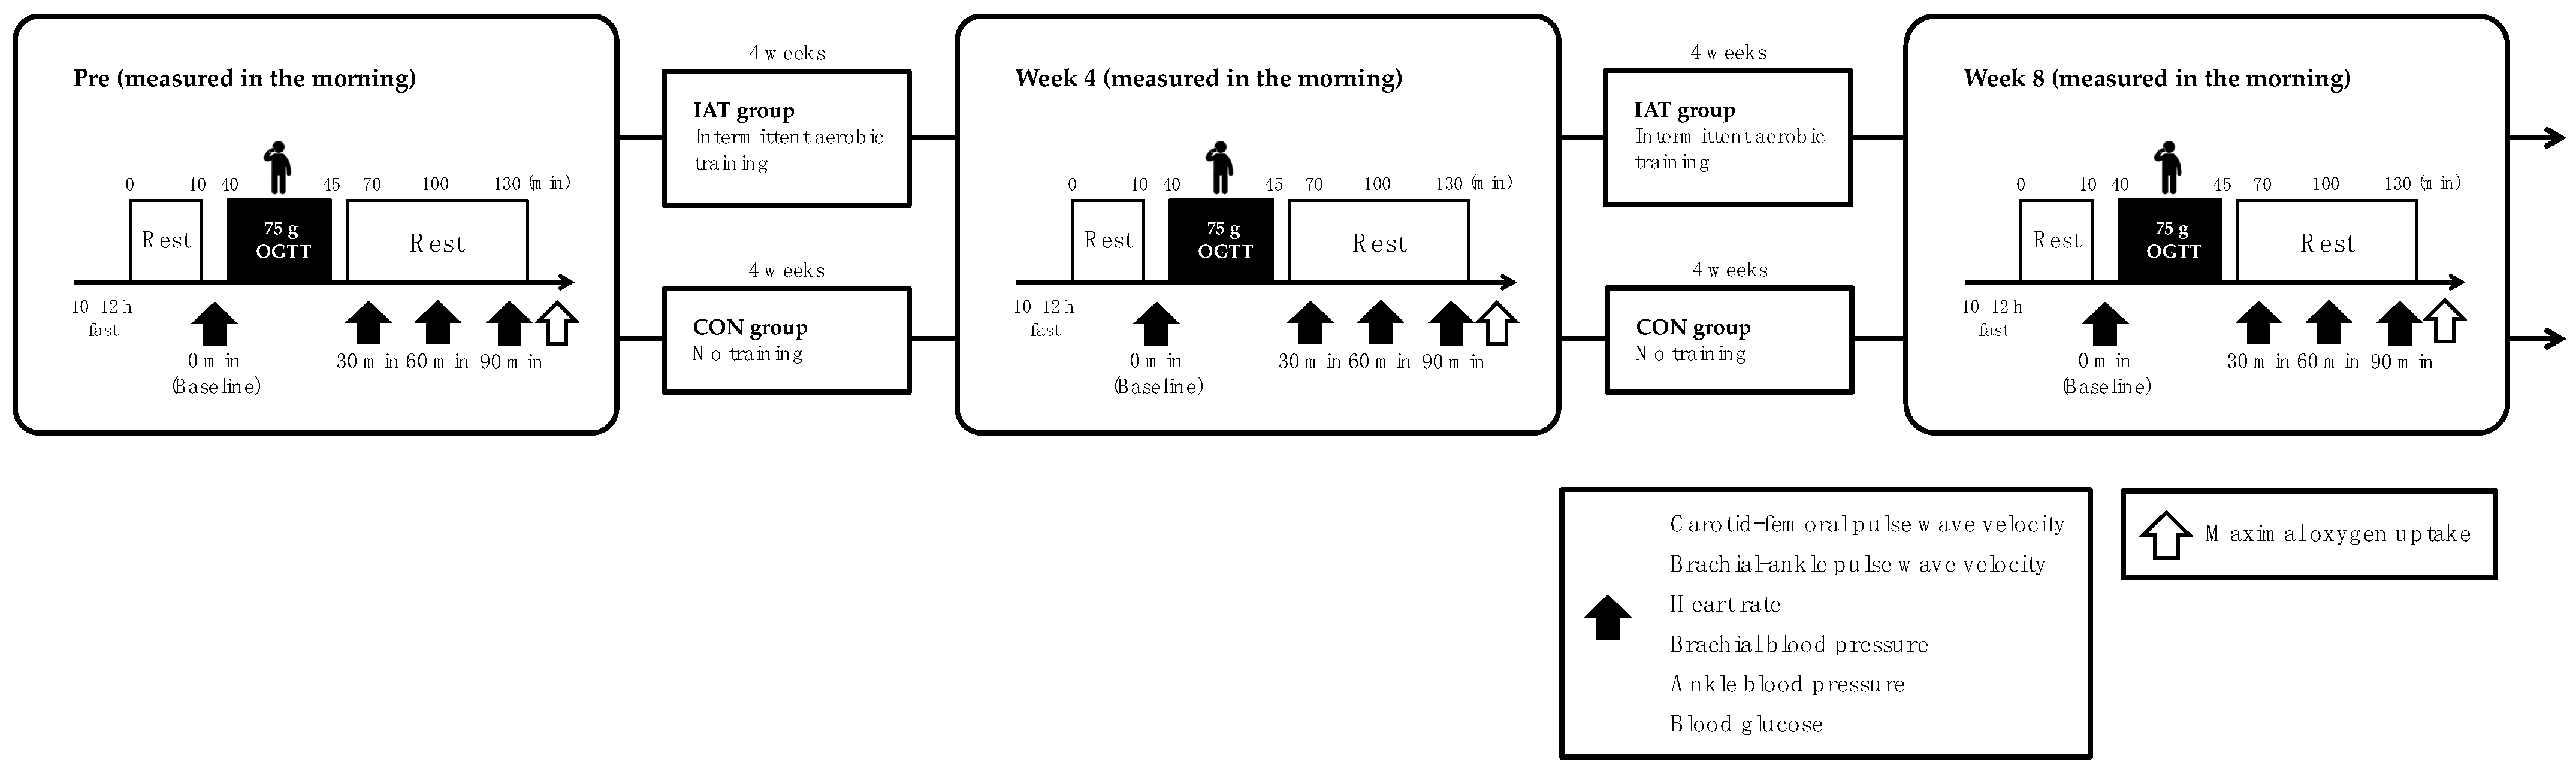
This study is a randomized controlled trial. A total of 30 healthy elderly and middle-age people participated in this study. The principal investigator instructed the participants to maintain their existing eating habits and lifestyle activities during the experimental intervention. All participants were prohibited from consuming caffeine and alcohol and from exercising (training) for 24 h prior to the measurement. Measurements were taken in the morning, on an empty stomach (10–12 h). Blood glucose, systemic and aortic arterial stiffness, blood pressure, and heart rate (HR) were measured before (baseline); 30, 60, and 90 min after the 75 g OGTT before the intervention; and 4 and 8 weeks after the intervention. Maximal oxygen uptake (VO2max) was measured before intervention, and 4 and 8 weeks after intervention. Before each measurement, participants rested for 10 min in the supine position on a bed (Figure 1). The IAT group underwent aerobic training for 8 weeks (4 sessions/week, 30 min/treatment, moderate intensity); the CON group was prohibited from any exercise during the intervention.
2.3. Physical Characteristics
Height was measured using a stadiometer (in increments of 0.1 cm). Body weight and body mass index (BMI) (each in 0.1 kg increments) were measured using a precision instrument body composition analyzer (WB-150 PMA, Tanita, Tokyo, Japan).
2.4. Arterial Stiffness
To evaluate arterial stiffness, PWV was calculated from the pulse wave propagation time between two arterial points as follows: PWV = arterial length/pulse wave propagation time. As an index of systemic arterial stiffness, brachial-ankle PWV (baPWV) was evaluated using a blood pressure (BP) pulse wave testing device (BP-203RPEII; Fukuda Colin Co., Tokyo, Japan) by attaching oscillometric sensors to the left and right upper arms and ankles [17]. Carotid-femoral PWV (cfPWV) was measured by recording arterial pressure waveforms (SphygmoCor XCEL TM-2805V; A&D Corp., Tokyo, Japan) using tonometric and oscillometric sensors affixed to the left common carotid and left femoral arteries, respectively. The linear distance between the sensors was measured using a tape measure and divided by the automatically calculated time difference in the increase in arterial pressure between the sensors, which was used as an index of aortic stiffness [18]. The intra- and inter-rater coefficients of variation for the PWV measurements were 3% and 4%, respectively.
2.5. Upper Arm and Ankle Blood Pressure
Participants were measured in the supine position using an automated oscillometric PWV/ABI device (Omron Colin, Tokyo, Japan) over the brachial and posterior tibial arteries for systolic blood pressure (SBP), diastolic blood pressure (DBP), and mean blood pressure (MBP) at the upper arm and ankle [5]. The coefficient of variation per day was 2 ± 1% for upper arm blood pressure % and 2 ± 2% for ankle BP.
2.6. Heart Rate
Heart rate (HR) was measured in the supine position using an automated oscillometric PWV/ankle-brachial index (ABI) device (Omron Colin, Tokyo, Japan) [5]. The coefficient of variation per day was 2 ± 1% for HR.
2.7. Blood Glucose
BG levels were assessed using the Glutest Neo Alpha Glucometer (Sanwa Kagaku Kenkyusho, Tokyo, Japan) for the flavin adenine dinucleotide glucose dehydrogenase method after venous blood was collected from the participants’ fingertips [8]. The coefficient of variation per day was 3 ± 1% for BG.
2.8. The 75 g OGTT
In this study, a 75 g OGTT was used to induce postprandial hyperglycemia. Based on the guidelines of the Japan Diabetes Society [8], the 75 g OGTT was performed orally in a general volume (225 mL per dose) in 5 min using TRELAN- G 75 (Yoshindo Corp., Toyama, Japan), which is commonly used in research and medical institutions under the direction of a physician.
2.9. VO2max
In the measurement of VO2max, a measure of aerobic capacity, oxygen uptake was monitored with each breath (VO2Master MW-1100, VO2 Master Health Sensors Inc., Vernon, British Columbia, CA) and style was measured with a bicycle ergometer (Medergo EM-400, OG Wellness Corporation, Okayama, Japan). The following data were used. Participants performed a 1 min warm-up at 15 W; then, we increased the workload by 20 W for men and 15 W for women every minute [8]; HR was recorded every 5 s (OH1+, Polar Electro OY, Kempele, Finland). Subjective exercise intensity (Borg scale) and SBP were measured at the end of each 1 min phase.
2.10. Intermittent Aerobic Training
Exercise sessions were held from December 2020 to March 2021 on a boardwalk near Adachi Ward, Tokyo, Japan; the IAT group performed 30 min of moderate-intensity training four times a week for eight weeks. Participants participated in an 8-week exercise class, which consisted of 5 min of preparatory exercise followed by 30 min of jogging [8]; the IAT group consisted of two 15 min jogging sessions with 20 min intervals, which were performed before breakfast [19]; the CON group did not perform any exercise. The exercise sessions were supervised by a researcher trained in exercise instruction. During the exercise sessions, an exercise HR monitor (ForeAthlete 45S; GARMIN Ltd., Schaff-Hausen, Switzerland) was attached to the left hand of each participant and they were instructed to jog at a speed that represented 65% of the estimated maximum HR based on age. The estimated maximum HR based on age was calculated by subtracting age from the constant 220 and was set to 65% exercise intensity using the Karvonen method. Additionally, subjective exercise intensity was assessed every 3 min during exercise sessions using the Borg scale [8]. Participants’ daily activities during the study period were monitored and an activity diary was maintained to avoid changes in daily activity.
2.11. Statistical Analysis
Data are presented as the mean ± standard deviation (SD). Data normality and homogeneity of variance were investigated using Shapiro–Wilk and Levene tests, respectively. Changes in each measure before and after intervention were presented as mean values with 95% confidence intervals for each group. A two-way ANOVA with repeated measures (time × group) was used for the three measurements performed. The Bonferroni method was used for each intervention change with a post hoc test. SPSS (version 25, IBM Corp., Armonk, NY, USA) was used for the statistical analysis. Statistical significance was set at p < 0.05 and all p-values were two-sided. Effect sizes (ESs) were calculated to investigate the magnitude of the difference based on Cohen’s d.
3. Results
3.1. Physical Characteristics
The height and BMI of both groups did not change before or after the exercise intervention (Table 1). The VO2max of the IAT group was higher after 4 and 8 weeks of intervention compared to pre-intervention (p < 0.05), while that of the CON group remained unchanged (Table 1).
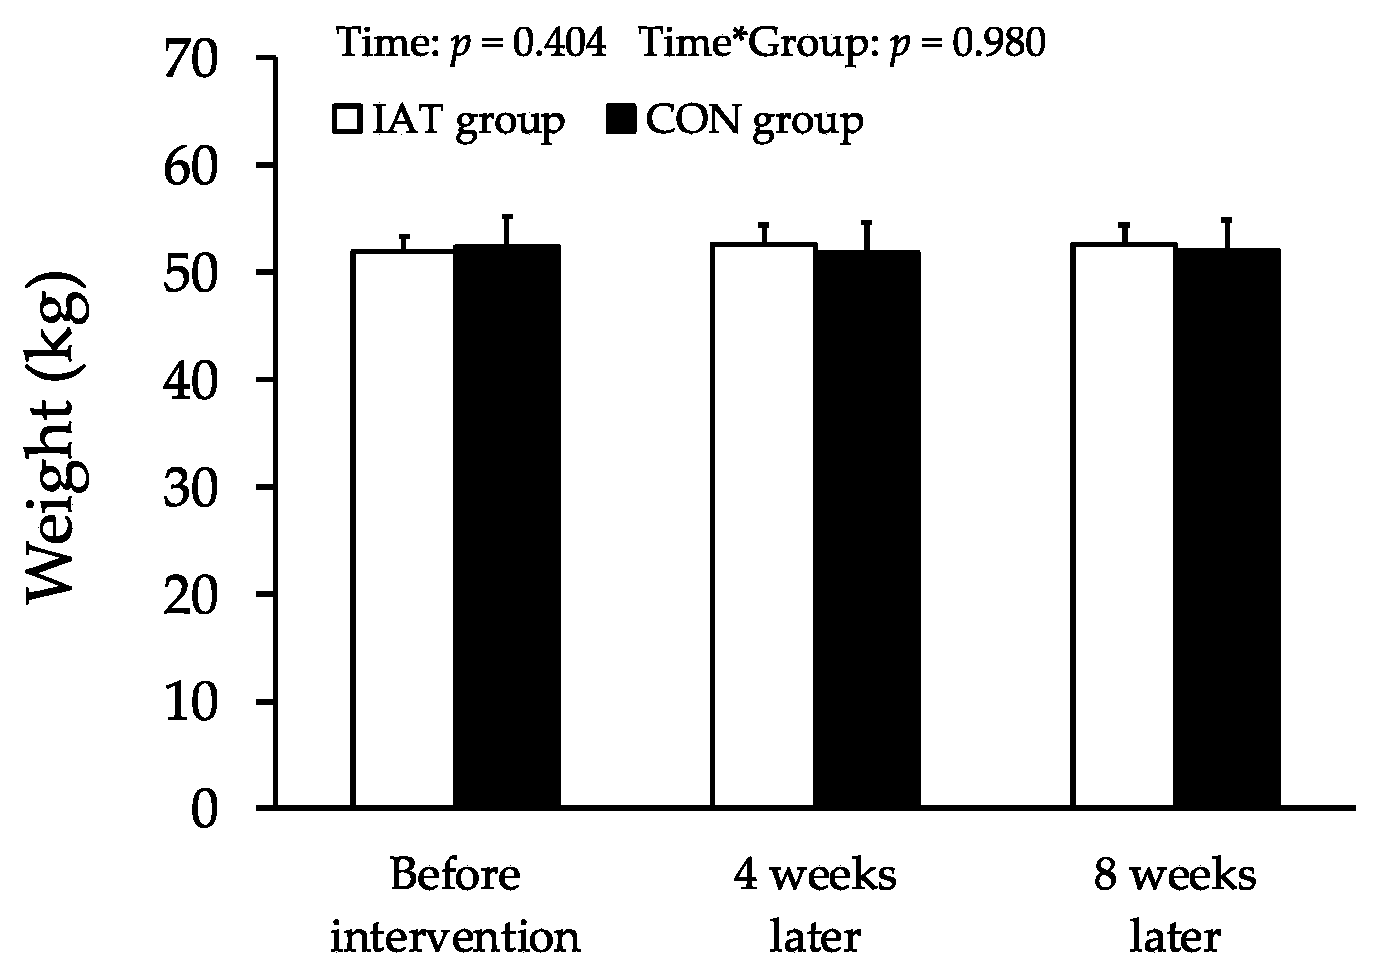
Changes in weight are shown in Figure 2. The weight of both groups did not change before or after the exercise intervention.
3.2. Arterial Stiffness
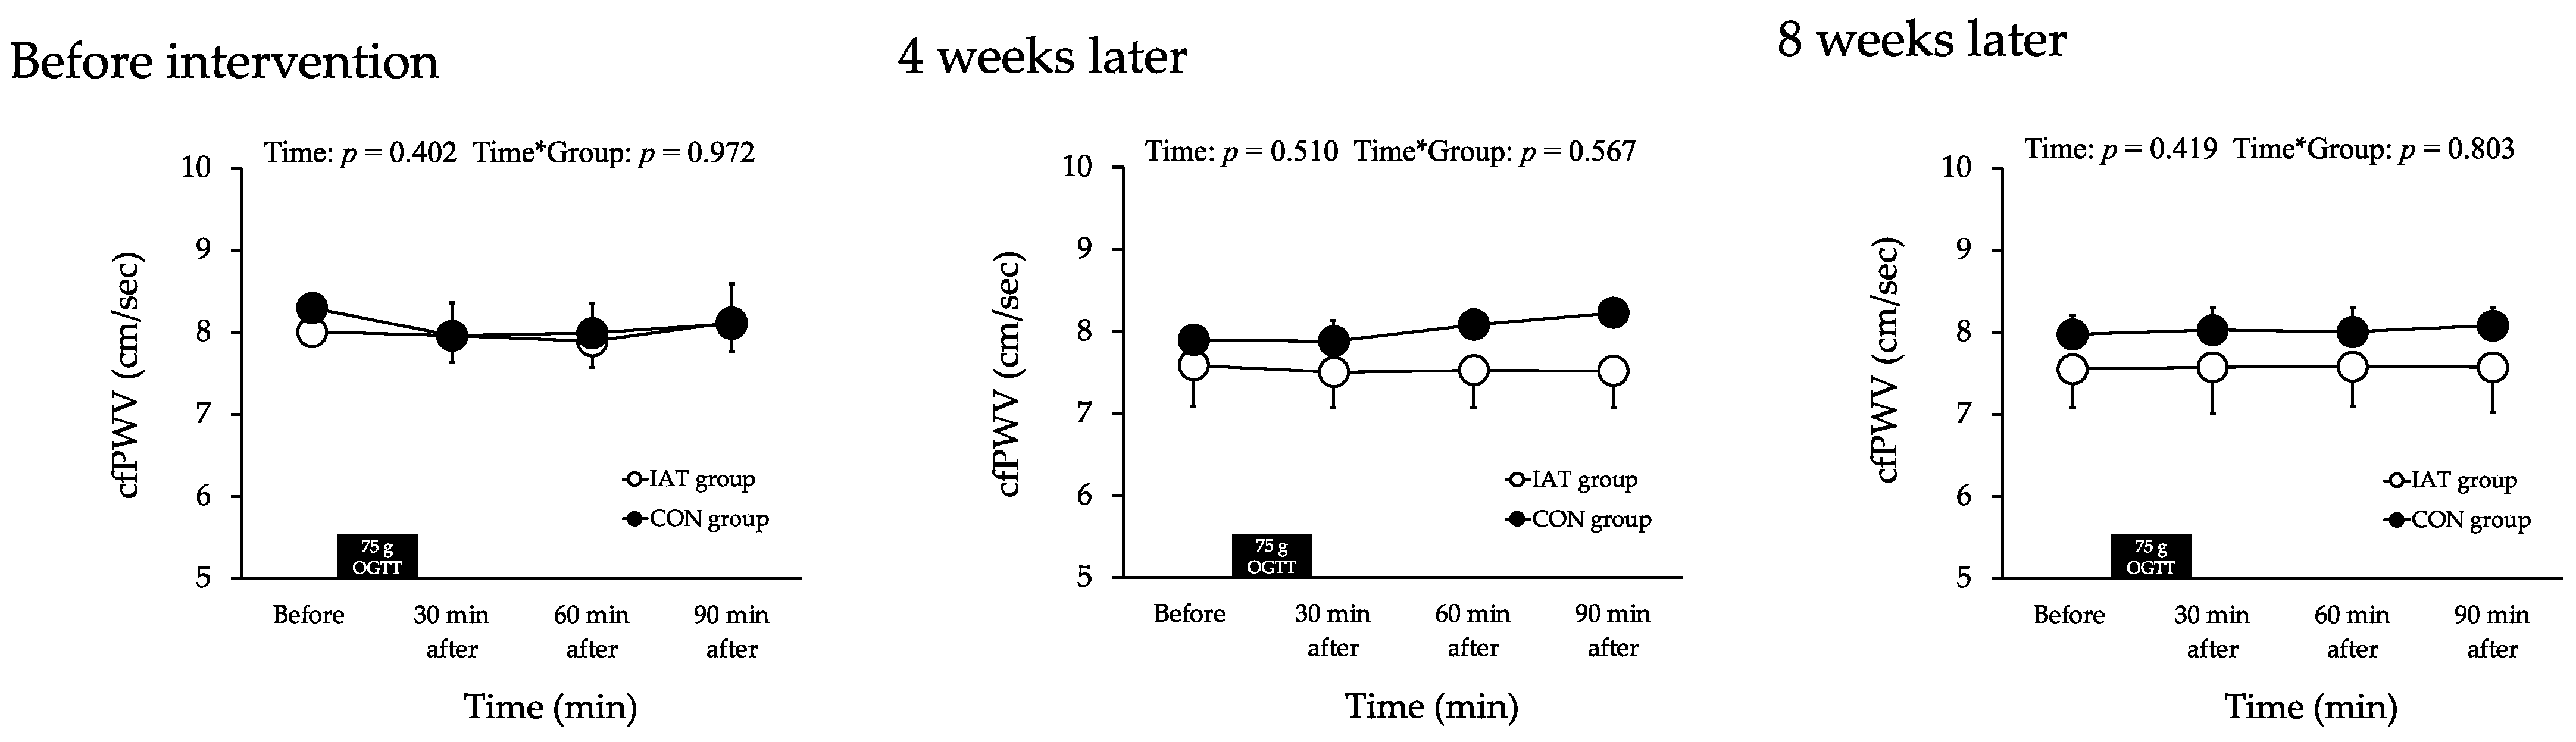
Changes in cfPWV are shown in Figure 3. The cfPWV in both groups did not change after the exercise intervention, and there were no intergroup differences.
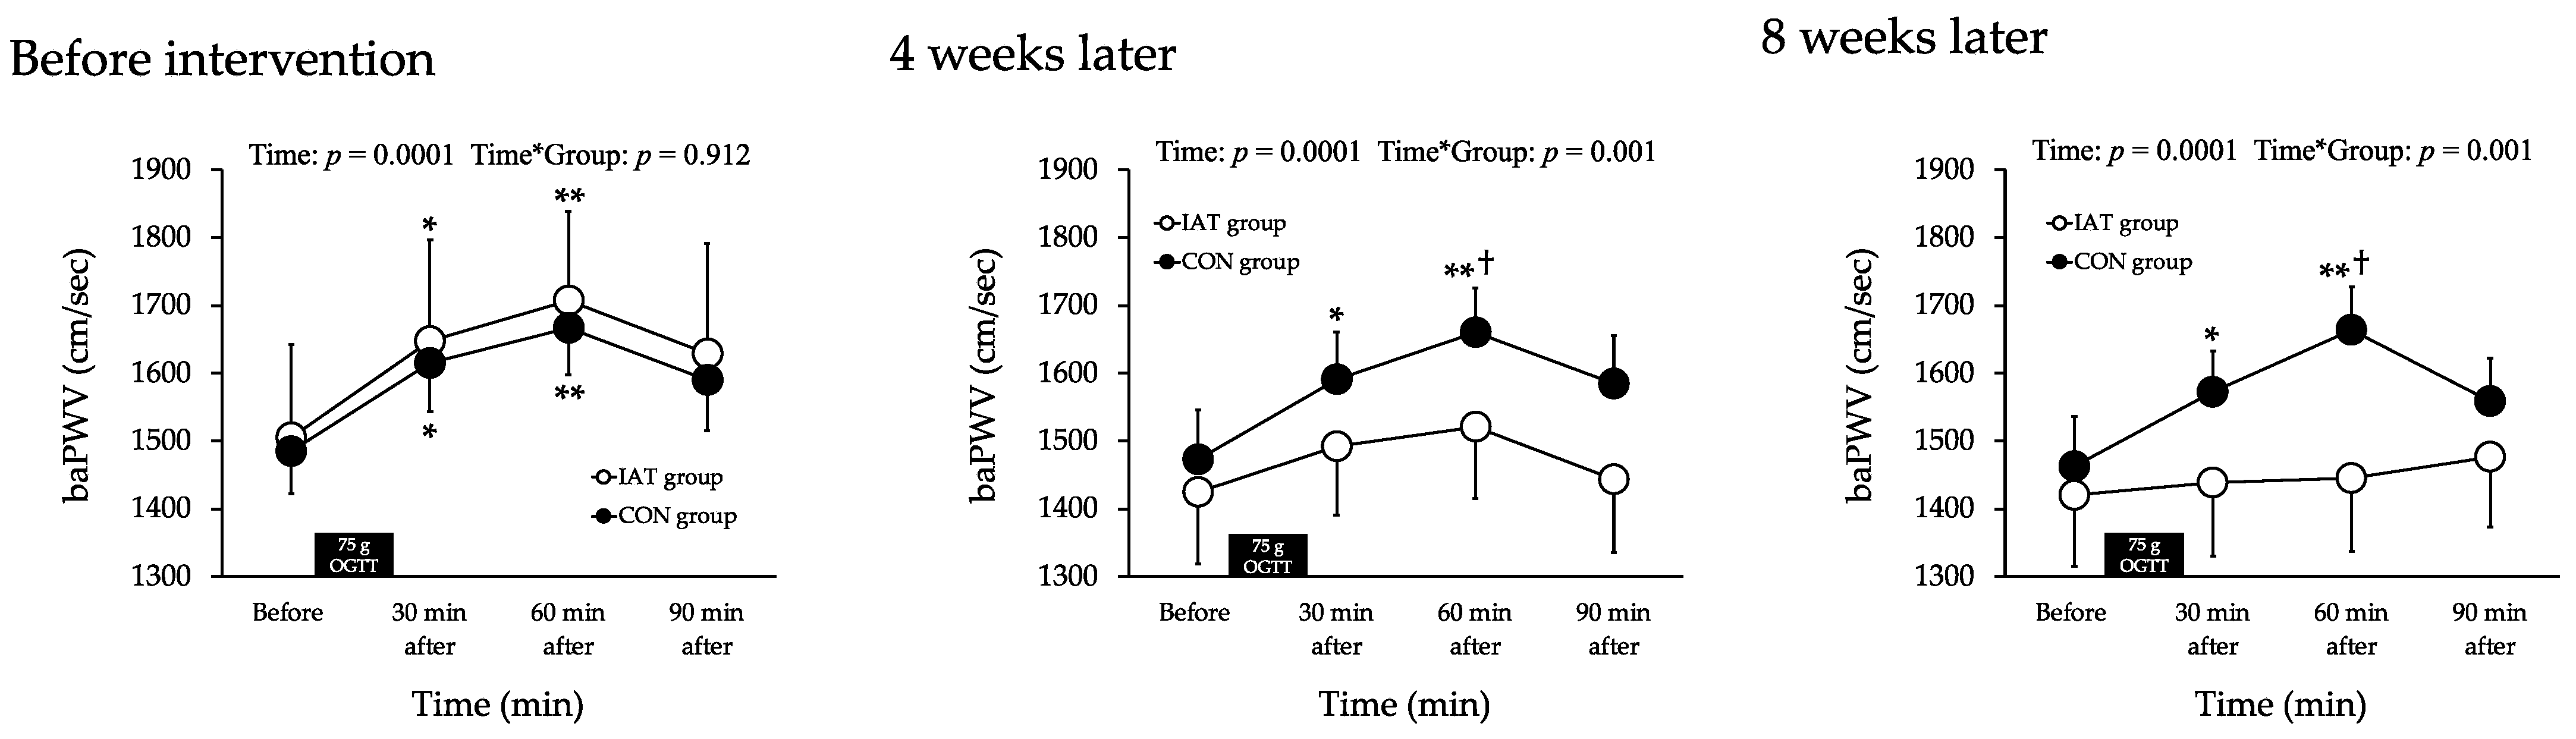
Changes in baPWV are shown in Figure 4. The baPWV before the exercise intervention increased in both groups at 30 (p < 0.05) and 60 (p < 0.01) min compared to the baPWV before the 75 g OGTT (p < 0.05), but there were no differences between the groups. After 4 and 8 weeks of exercise intervention, baPWV was unchanged in the IAT group compared to that before the 75 g OGTT. The baPWV in the CON group increased at 30 (p < 0.05) and 60 (p < 0.01) min compared to that before the 75 g OGTT. The baPWV at 60 min after the 75 g OGTT was lower in the IAT group than in the CON group (p < 0.05).
3.3. Brachial Blood Pressure
Changes in brachial blood pressure are shown in Table 2. There were no changes in the upper arm SBP, MBP, or DBP before and after the 75 g OGTT intervention in either group, and there were no differences between the groups.
3.4. Ankle Blood Pressure
Changes in ankle blood pressure are shown in Table 3. Ankle MBP and DBP did not change in either group before or after the 75 g OGTT, and there were no differences between groups.
The ankle SBP before the exercise intervention increased in both groups at 30 and 60 min compared to that before the 75 g OGTT (p < 0.05); however, there were no differences between the groups. Ankle SBP after 4 and 8 weeks of exercise intervention was unchanged in the IAT group compared to before the 75 g OGTT; there was an increase in the CON group at 30 and 60 min compared to before the 75 g OGTT (p < 0.05); ankle SBP at 60 min after the 75 g OGTT was lower in the IAT group than in the CON group (p < 0.05).
3.5. Heart Rate
The changes in HR are shown in Table 4. There was no change in the HR before and after the 75 g OGTT or before and after the exercise intervention in either group, and no difference was observed between the groups.
3.6. Blood Glucose
Changes in BG are shown in Table 5. BG before exercise intervention increased in both groups at 30 and 60 min after the 75 g OGTT compared to before the 75 g OGTT (p < 0.05), but there was no difference between groups; after 4 and 8 weeks of intervention, BG in the IAT group increased at 30 min after the 75 g OGTT compared to before the 75 g OGTT (p < 0.05), and BG in the CON group increased at 30 and 60 min compared to before the 75 g OGTT (p < 0.05). Post 4 weeks and 8 weeks from the intervention, BG at 30 min after the 75 g OGTT was lower in the IAT group than in the CON group (p < 0.05).
4. Discussion
The main finding of this study is that arterial stiffness did not increase after the 75 g OGTT following an 8-week intermittent aerobic exercise training intervention. This result supports our hypothesis. These results indicate that intermittent aerobic exercise training may reduce the acute increase in arterial stiffness after hyperglycemia in the elderly.
Arterial stiffness increases with postprandial hyperglycemia [20,21,22]. In fact, baPWV has been demonstrated to increase after a 75 g OGTT in healthy middle-aged and older adults [8]. Similarly, in other studies, baPWV increased after the ingestion of 25 g of a glucose solution [23]. The results of the present study are similar: baPWV was significantly increased in both groups 30 min after the 75 g OGTT compared to before the 75 g OGTT [5]. Thus, systemic arterial stiffness might be increased with postprandial hyperglycemia in the elderly. However, cfPWV may not change during acute hyperglycemia in healthy individuals. Previous studies have demonstrated that cardiac brachial (hb) PWV does not change after the ingestion of a 25 g glucose solution in healthy elderly individuals [22]. Furthermore, it has been demonstrated that hbPWV was not increased after the 75 g OGTT compared to before the 75 g OGTT [5]. The results of the present study are similar. However, Baynard et al. [24] suggest an increase in aortic stiffness with postprandial hyperglycemia in obese individuals. Therefore, obesity (especially insulin resistance) may be involved in the changes in aortic stiffness associated with postprandial hyperglycemia. On the other hand, a previous study suggested that femoral-ankle PWV (faPWV), a marker of lower extremity arterial stiffness, increased with postprandial hyperglycemia in healthy individuals, while cfPWV did not increase [25]. Furthermore, Gordin et al. [20] demonstrated that brachial PWV increased with postprandial hyperglycemia, but cfPWV did not. The present study is similar. Thus, peripheral arterial stiffness may increase during postprandial hyperglycemia in healthy subjects. To clarify these considerations, it is necessary to examine site-specific (aortic, brachial, and lower extremity arteries) changes during postprandial hyperglycemia in the elderly.
It is not fully clear whether aerobic exercise training can reduce the increase in arterial stiffness associated with postprandial hyperglycemia. A previous study suggested that increased physical activity (including aerobic exercise) in the elderly inhibits the increase in baPWV associated with postprandial hyperglycemia [5]. Furthermore, it has been demonstrated that in middle-aged and elderly individuals, 8 weeks of aerobic exercise training suppressed the increase in baPWV associated with postprandial hyperglycemia [8]. Thus, aerobic exercise training may inhibit the increase in arterial stiffness associated with postprandial hyperglycemia. However, moderate-intensity aerobic exercise training is uncomfortable for some middle-aged and elderly individuals. Previous studies have suggested that transient intermittent aerobic exercise may reduce the increase in arterial stiffness associated with postprandial hyperglycemia [10,11,12]. Zheng et al. [11] found that intermittent aerobic exercise (two 15 min cycling sessions, 20 min rest) demonstrated superior effects on arterial stiffness compared to control and continuous aerobic exercise (30 min). In addition, Zhou et al. [12] similarly reported that intermittent aerobic exercise (3 × 10 min) had a superior effect on arterial stiffness compared to continuous cycling exercise (30 min). Thus, intermittent aerobic exercise may reduce the increase in arterial stiffness after a 75 g OGTT. The implementation, in the present study, of intermittent aerobic exercise training reduced the increase in arterial stiffness associated with postprandial hyperglycemia. The total amount of intermittent aerobic training in this study was similar to the continuous aerobic training used in previous studies [8]. Thus, intermittent aerobic exercise training may be a means of reducing the increase in arterial stiffness associated with postprandial hyperglycemia in middle-aged and elderly individuals with low fitness levels.
Although this study was not designed to investigate the mechanism of intermittent aerobic exercise training on arterial stiffness associated with postprandial hyperglycemia, arterial stiffness may be implicated with changes in systolic blood pressure. Yamashina et al. [26] demonstrated that PWV correlates with SBP in men and women of all ages. They also suggest that arterial stiffness and SBP increase with postprandial hyperglycemia in healthy subjects [27]. Ciolac et al. [28] demonstrated that SBP decreases after acute intermittent aerobic exercise, and Park et al. [29] found that stacked aerobic exercise is more effective than a single continuous session for SBP management. The present study also showed an increase in baPWV and ankle SBP after the 75 g OGTT compared to before the 75 g OGTT. Furthermore, in the present study, baPWV in the post-intervention IAT group did not increase after the 75 g OGTT compared to before the 75 g OGTT. Thus, increased arterial stiffness associated with postprandial hyperglycemia may be associated with increased SBP. In this study, ankle systolic blood pressure in the IAT group improved continuously from 4 to 8 weeks of intervention. baPWV in the IAT group improved significantly from 0 to 4 weeks and remained stable through 8 weeks, while baPWV improved continuously. Therefore, it is possible that ankle systolic blood pressure may be involved in the reason for the continuous improvement in baPWV. In the future, the mechanism by which baPWV is continuously improved by intermittent aerobic exercise should be elucidated. Previous studies have reported that aortic arterial stiffness, a measure of aortic stiffness, did not change in young [25] and elderly [30] subjects, but femoral artery-to-ankle PWV (faPWV), a measure of lower extremity arterial stiffness, increased. However, in obese subjects, cfPWV was increased after a high-carbohydrate diet, suggesting that cfPWV was increased in obese subjects [24]. The same is true in the present study. In healthy elderly subjects, cfPWV was unchanged and baPWV was increased after a 75 g OGTT. In other words, changes in cfPWV associated with postprandial hyperglycemia may occur more in obese than in non-obese subjects. Thus, 8 weeks of intermittent aerobic exercise training may prevent the increase in lower extremity arterial stiffness after oral glucose inoculation, the mechanism of which may be due to many factors.
Furthermore, changes in arterial stiffness during hyperglycemia are associated with BG levels [20]. In addition, BG levels associated with postprandial hyperglycemia were proven to be attenuated by intermittent aerobic exercise (60–65% VO2peak, 12 h, 5 min intervals) compared to continuous aerobic exercise (60–65% VO2peak, 60 min) [31]. In the present study, the IAT group had a slower increase in blood glucose levels after the intervention. Thus, BG may have been involved in the reduction in the increase in arterial stiffness associated with postprandial hyperglycemia by intermittent aerobic exercise training. Therefore, intermittent aerobic exercise training may have prevented the increase in baPWV by moderating the increase in BG levels after the 75 g OGTT and suppressing the increase in blood pressure.
Limitations of this study include the following: first, the target population is a relatively healthy middle-aged population, and an accurate representation of the effects of intermittent exercise requires a wide range of patients, including those with diabetes and those with hypertension; second, the number of subjects is too small (30); third, this study was not designed to examine possible mechanisms by which intermittent aerobic exercise training might reduce the increase in baPWV after the 75 g OGTT; and fourth, this study was not designed to examine the effects of intermittent aerobic exercise training on baPWV. Fifth, we did not compare intermittent aerobic exercise with continuous aerobic exercise. Sixth, there is a lack of nutrition and physical activity information for participants.
5. Conclusions
Eight weeks of intermittent aerobic exercise training may reduce the increase in arterial stiffness associated with postprandial hyperglycemia. Therefore, intermittent aerobic exercise training may be useful in preventing arterial stiffness in middle-aged and older adults with reduced physical fitness.
Author Contributions
R.K. designed the study; R.K. and H.N. collected the data and performed the study; R.K. and H.N. performed the statistical analyses; R.K. drafted the manuscript; H.N. critically reviewed the manuscript. All authors have read and agreed to the published version of the manuscript.
Funding
This research received no external funding.
Institutional Review Board Statement
This study was conducted in compliance with the Declaration of Helsinki on the basis of ethics, human rights, and protection of the personal information of participants. Ethical approval for this study was obtained from the Ethics Committee of Teikyo University of Science (Approval Number: 20A024; Approval date: 11 November 2020).
Informed Consent Statement
Informed consent was obtained from all participants involved in the study.
Data Availability Statement
The data presented in this study are available from the corresponding author upon request.
Conflicts of Interest
The authors declare no conflicts of interest.
References
- DECODE Study Group; the European Diabetes Epidemiology Group. Glucose Tolerance and Cardiovascular Mortality: Comparison of Fasting and 2-Hour Diagnostic Criteria. Arch. Intern. Med. 2001, 161, 397–405. [Google Scholar] [CrossRef]
- Jacome-Sosa, M.; Parks, E.J.; Bruno, R.S.; Tasali, E.; Lewis, G.F.; Schneeman, B.O.; Rains, T.M. Postprandial Metabolism of Macronutrients and Cardiometabolic Risk: Recent Developments, Emerging Concepts, and Future Directions. Adv. Nutr. 2016, 7, 364–374. [Google Scholar] [CrossRef] [PubMed]
- Kobayashi, R.; Sato, K.; Takahashi, T.; Asaki, K.; Iwanuma, S.; Ohashi, N.; Hashiguchi, T. Arterial Stiffness During Hyperglycemia in Older Adults with High Physical Activity vs Low Physical Activity. J. Clin. Biochem. Nutr. 2019, 65, 146–152. [Google Scholar] [CrossRef]
- Ahn, C.W. The Association of Brachial-Ankle Pulse Wave Velocity with Acute Postprandial Hyperglycemia in Korean Prediabetic and Diabetic Subjects. Korean Diabetes J. 2010, 34, 284–286. [Google Scholar] [CrossRef] [PubMed]
- Kobayashi, R.; Sato, K.; Takahashi, T.; Asaki, K.; Iwanuma, S.; Ohashi, N.; Hashiguchi, T. Effects of a Short-Term Increase in Physical Activity on Arterial Stiffness during Hyperglycemia. J. Clin. Biochem. Nutr. 2020, 66, 238–244. [Google Scholar] [CrossRef] [PubMed]
- Mikael, L.D.R.; De Paiva, A.M.G.; Gomes, M.M.; Sousa, A.L.L.; Jardim, P.C.B.V.; Vitorino, P.V.D.O.; Euzébio, M.B.; Sousa, W.D.M.; Barroso, W.K.S. Vascular Aging and Arterial Stiffness. Arq. Bras. Cardiol. 2017, 109, 253–258. [Google Scholar] [CrossRef] [PubMed]
- Chia, C.W.; Egan, J.M.; Ferrucci, L. Age-Related Changes in Glucose Metabolism, Hyperglycemia, and Cardiovascular Risk. Circ. Res. 2018, 123, 886–904. [Google Scholar] [CrossRef] [PubMed]
- Kobayashi, R.; Asaki, K.; Hashiguchi, T.; Negoro, H. The Effect of Aerobic Exercise Training Frequency on Arterial Stiffness in a Hyperglycemic State in Middle-Aged and Elderly Females. Nutrients 2021, 13, 3498. [Google Scholar] [CrossRef] [PubMed]
- Manley, A.F. Physical Activity and Health: A Report of the Surgeon General; Public Health Service; Office of the Surgeon General, Department of Health and Human Services: Washington, DC, USA, 1996. [Google Scholar]
- Ren, J.; Xiao, H.; Wang, P. Acute Effects of the Interval and Duration of Intermittent Exercise on Arterial Stiffness in Young Men. Int. J. Environ. Res. Public Health 2022, 19, 16847. [Google Scholar] [CrossRef]
- Zheng, L.; Zhang, X.; Zhu, W.; Chen, X.; Wu, H.; Yan, S. Acute Effects of Moderate-Intensity Continuous and Accumulated Exercise on Arterial Stiffness in Healthy Young Men. Eur. J. Appl. Physiol. 2015, 115, 177–185. [Google Scholar] [CrossRef]
- Zhou, Z.; He, Z.; Yuan, M.; Yin, Z.; Dang, X.; Zhu, J.; Zhu, W. Longer Rest Intervals Do Not Attenuate the Superior Effects of Accumulated Exercise on Arterial Stiffness. Eur. J. Appl. Physiol. 2015, 115, 2149–2157. [Google Scholar] [CrossRef]
- Kobayashi, R.; Hatakeyama, H.; Hashimoto, Y.; Okamoto, T. Acute Effects of Accumulated Aerobic Exercise on Aortic and Peripheral Pulse Wave Velocity in Young Males. J. Phys. Ther. Sci. 2018, 30, 181–184. [Google Scholar] [CrossRef]
- Kobayashi, R.; Hashimoto, Y.; Hatakeyama, H.; Okamoto, T. Acute Effects of Aerobic Exercise Intensity on Arterial Stiffness after Glucose Ingestion in Young Men. Clin. Physiol. Funct. Imaging 2018, 38, 138–144. [Google Scholar] [CrossRef] [PubMed]
- Kario, K. Key Points of the 2019 Japanese Society of Hypertension Guidelines for the Management of Hypertension. Korean Circ. J. 2019, 49, 1123–1135. [Google Scholar] [CrossRef] [PubMed]
- Kang, H. Sample Size Determination and Power Analysis Using the G*Power Software. J. Educ. Eval. Health Prof. 2021, 18, 17. [Google Scholar] [CrossRef] [PubMed]
- Sugawara, J.; Hayashi, K.; Yokoi, T.; Cortez-Cooper, M.Y.; DeVan, A.E.; Anton, M.A.; Tanaka, H. Brachial-Ankle Pulse Wave Velocity: An Index of Central Arterial Stiffness? J. Hum. Hypertens. 2005, 19, 401–406. [Google Scholar] [CrossRef]
- Fryer, S.; Stone, K.; Paterson, C.; Brown, M.; Faulkner, J.; Lambrick, D.; Credeur, D.; Zieff, G.; Martínez Aguirre-Betolaza, A.; Stoner, L. Central and Peripheral Arterial Stiffness Responses to Uninterrupted Prolonged Sitting Combined with a High-Fat Meal: A Randomized Controlled Crossover Trial. Hypertens. Res. 2021, 44, 1332–1340. [Google Scholar] [CrossRef] [PubMed]
- Kobayashi, R.; Hashimoto, Y.; Hatakeyama, H.; Okamoto, T. Acute Effects of Repeated Bouts of Aerobic Exercise on Arterial Stiffness after Glucose Ingestion. Clin. Exp. Hypertens. 2019, 41, 123–129. [Google Scholar] [CrossRef] [PubMed]
- Gordin, D.; Saraheimo, M.; Tuomikangas, J.; Soro-Paavonen, A.; Forsblom, C.; Paavonen, K.; Steckel-Hamann, B.; Vandenhende, F.; Nicolaou, L.; Pavo, I.; et al. Influence of Postprandial Hyperglycemic Conditions on Arterial Stiffness in Patients with Type 2 Diabetes. J. Clin. Endocrinol. Metab. 2016, 101, 1134–1143. [Google Scholar] [CrossRef] [PubMed]
- Murai, N.; Saito, N.; Nii, S.; Nishikawa, Y.; Suzuki, A.; Kodama, E.; Iida, T.; Mikura, K.; Imai, H.; Hashizume, M.; et al. Postloading Insulinemia Is Independently Associated with Arterial Stiffness in Young Japanese Persons. Hypertens. Res. 2021, 44, 1515–1523. [Google Scholar] [CrossRef]
- Kobayashi, R.; Sakazaki, M.; Nagai, Y.; Asaki, K.; Hashiguchi, T.; Negoro, H. Effects of Different Types of Carbohydrates on Arterial Stiffness: A Comparison of Isomaltulose and Sucrose. Nutrients 2021, 13, 4493. [Google Scholar] [CrossRef]
- Kobayashi, R.; Sato, K.; Sakazaki, M.; Nagai, Y.; Iwanuma, S.; Ohashi, N.; Hashiguchi, T. Acute Effects of Difference in Glucose Intake on Arterial Stiffness in Healthy Subjects. Cardiol. J. 2021, 28, 446–452. [Google Scholar] [CrossRef] [PubMed]
- Baynard, T.; Carhart, R.L.; Weinstock, R.S.; Ploutz-Snyder, L.L.; Kanaley, J.A. Short-Term Exercise Training Improves Aerobic Capacity with No Change in Arterial Function in Obesity. Eur. J. Appl. Physiol. 2009, 107, 299–308. [Google Scholar] [CrossRef] [PubMed]
- Kobayashi, R.; Yoshida, S.; Okamoto, T. Arterial Stiffness After Glucose Ingestion in Exercise-Trained versus Untrained Men. Appl. Physiol. Nutr. Metab. 2015, 40, 1151–1156. [Google Scholar] [CrossRef] [PubMed]
- Yamashina, A.; Tomiyama, H.; Arai, T.; Koji, Y.; Yambe, M.; Motobe, H.; Glunizia, Z.; Yamamoto, Y.; Hori, S. Nomogram of the Relation of Brachial-Ankle Pulse Wave Velocity with Blood Pressure. Hypertens. Res. 2003, 26, 801–806. [Google Scholar] [CrossRef] [PubMed]
- Kobayashi, R.; Yoshida, S.; Okamoto, T. Effects of Acute Aerobic Exercise on Arterial Stiffness before and after Glucose Ingestion. Int. J. Sport. Med. 2017, 38, 12–18. [Google Scholar] [CrossRef] [PubMed]
- Ciolac, E.G.; Guimarães, G.V.; D Avila, V.M.; Bortolotto, L.A.; Doria, E.L.; Bocchi, E.A. Acute Effects of Continuous and Interval Aerobic Exercise on 24-h Ambulatory Blood Pressure in Long-Term Treated Hypertensive Patients. Int. J. Cardiol. 2009, 133, 381–387. [Google Scholar] [CrossRef] [PubMed]
- Park, S.; Rink, L.D.; Wallace, J.P. Accumulation of Physical Activity Leads to a Greater Blood Pressure Reduction than a Single Continuous Session, in Prehypertension. J. Hypertens. 2006, 24, 1761–1770. [Google Scholar] [CrossRef] [PubMed]
- Kobayashi, R.; Sakazaki, M.; Nagai, Y.; Okamoto, T.; Hashimoto, Y.; Sato, K.; Seki, S.; Hata, U.; Esaki, K.; Tanigawa, R.; et al. Habitual isomaltulose intake reduces arterial stiffness associated with postprandial hyperglycemia in middle-aged and elderly people: A randomized controlled trial. Heart Vessels 2024, 39, 123–134. [Google Scholar] [CrossRef]
- Holmstrup, M.; Fairchild, T.; Keslacy, S.; Weinstock, R.; Kanaley, J. Multiple Short Bouts of Exercise over 12-h Period Reduce Glucose Excursions More than an Energy-Matched Single Bout of Exercise. Metabolism 2014, 63, 510–519. [Google Scholar] [CrossRef]
Figure 1.
Study design. IAT group, intermittent aerobic training group; CON group, control group; 75 g OGTT, 75 g oral glucose tolerance test.
Figure 1.
Study design. IAT group, intermittent aerobic training group; CON group, control group; 75 g OGTT, 75 g oral glucose tolerance test.

Figure 2.
Changes in weight at baseline and post-ingestion in both groups: pre-exercise-intervention and post 4 weeks and post 8 weeks from exercise intervention. Values are presented as mean ± SD; IAT, intermittent aerobic exercise training; CON, control.
Figure 2.
Changes in weight at baseline and post-ingestion in both groups: pre-exercise-intervention and post 4 weeks and post 8 weeks from exercise intervention. Values are presented as mean ± SD; IAT, intermittent aerobic exercise training; CON, control.

Figure 3.
Changes in cfPWV at baseline and post-ingestion in both groups: pre-exercise-intervention and post 4 weeks and post 8 weeks from exercise intervention. Values are presented as mean ± SD. cfPWV, carotid-femoral pulse wave velocity; 75 g OGTT, 75 g oral glucose tolerance test; SD, standard deviation.

Figure 4.
Changes in baPWV at baseline and post-ingestion in both groups: pre-exercise-intervention and post 4 weeks and post 8 weeks from exercise intervention. Values are presented as mean ± SD. * p < 0.05 and ** p < 0.01 vs. baseline. † p < 0.05 vs. CON group. baPWV, brachial-ankle pulse wave velocity; 75 g OGTT, 75 g oral glucose tolerance test; SD, standard deviation.


Table 1.
Participant Characteristics.
| Measurement Item | IAT (n = 15) | CON (n = 15) | p-Value (Group) | ||||
|---|---|---|---|---|---|---|---|
| Before Intervention | 4 Weeks Later | 8 Weeks Later | before Intervention | 4 Weeks Later | 8 Weeks Later | ||
| Age, years | 63.6 ± 1.2 | NA | NA | 63.2 ± 1.1 | NA | NA | NA |
| Height, cm | 152.2 ± 2.2 | NA | NA | 152.5 ± 3.4 | NA | NA | NA |
| BMI, kg/m2 | 22.4 ± 0.4 | 22.7 ± 0.5 | 22.7 ± 0.5 | 22.4 ± 0.5 | 22.2 ± 0.5 | 22.3 ± 0.5 | p > 0.05 |
| VO2max, ml/kg/min | 22.2 ± 2.0 | 26.8 ± 1.8 * | 29.9 ± 1.0 *† | 21.8 ± 1.1 | 22.7 ± 1.1 | 22.4 ± 1.2 | p > 0.05 |
Data are presented as mean ± SD; BMI, body mass index; VO2max, maximal oxygen uptake; IAT, intermittent aerobic exercise training; CON, control. * p < 0.05 vs. before intervention. † p < 0.05 vs. CON.
Table 2.
Changes in brachial SBP, MBP, and DBP before and after the 75 g OGTT.
| Measurement Item | Intervention | Group | before | 30 min after | 60 min after | 90 min after | p-Value (Group) |
|---|---|---|---|---|---|---|---|
| Brachial SBP, mmHg | Pre | IAT | 121.9 ± 5.0 | 122.8 ± 4.6 | 125.9 ± 4.4 | 129.8 ± 4.8 | p > 0.05 |
| CON | 120.7 ± 5.3 | 123.4 ± 6.3 | 126.3 ± 7.1 | 126.6 ± 6.7 | |||
| 4 weeks later | IAT | 120.2 ± 5.4 | 120.9 ± 4.5 | 122.4 ± 4.7 | 125.3 ± 3.5 | p > 0.05 | |
| CON | 118.9 ± 5.9 | 119.9 ± 6.6 | 123.2 ± 7.2 | 122.3 ± 7.2 | |||
| 8 weeks later | IAT | 120.8 ± 4.8 | 121.4 ± 3.5 | 120.9 ± 4.3 | 124.2 ± 4.7 | p > 0.05 | |
| CON | 118.3 ± 4.8 | 120.2 ± 5.2 | 122.4 ± 6.4 | 121.0 ± 6.4 | |||
| Brachial MBP, mmHg | Pre | IAT | 88.7 ± 1.9 | 89.4 ± 1.9 | 90.0 ± 2.3 | 91.7 ± 1.9 | p > 0.05 |
| CON | 87.6 ± 3.7 | 88.6 ± 3.8 | 89.8 ± 4.3 | 89.2 ± 4.4 | |||
| 4 weeks later | IAT | 86.9 ± 2.4 | 87.2 ± 2.6 | 87.4 ± 2.7 | 90.0 ± 2.0 | p > 0.05 | |
| CON | 86.2 ± 4.1 | 86.4 ± 4.3 | 87.6 ± 4.2 | 87.1 ± 4.7 | |||
| 8 weeks later | IAT | 87.4 ± 1.5 | 87.9 ± 1.4 | 87.8 ± 2.4 | 89.8 ± 2.0 | p > 0.05 | |
| CON | 85.2 ± 3.5 | 85.7 ± 3.3 | 86.9 ± 3.7 | 88.0 ± 3.9 | |||
| Brachial DBP, mmHg | Pre | IAT | 72.2 ± 1.8 | 72.7 ± 1.5 | 72.0 ± 2.1 | 72.7 ± 1.9 | p > 0.05 |
| CON | 71.1 ± 3.0 | 71.2 ± 2.6 | 71.5 ± 3.1 | 70.5 ± 3.5 | |||
| 4 weeks later | IAT | 70.3 ± 1.9 | 70.4 ± 2.2 | 69.9 ± 2.8 | 72.3 ± 2.1 | p > 0.05 | |
| CON | 69.9 ± 3.3 | 69.6 ± 3.4 | 69.8 ± 2.8 | 69.5 ± 3.6 | |||
| 8 weeks later | IAT | 70.7 ± 1.7 | 71.2 ± 1.6 | 71.3 ± 2.3 | 72.7 ± 1.8 | p > 0.05 | |
| CON | 68.7 ± 3.0 | 68.5 ± 2.5 | 69.2 ± 2.5 | 71.5 ± 2.8 |
Data are presented as mean ± SD; 75 g OGTT, 75 g oral glucose tolerance test; IAT, intermittent aerobic training group; CON, control group; SBP, systolic blood pressure; MBP, mean blood pressure; DBP, diastolic blood pressure.
Table 3.
Changes in ankle artery SBP, MBP, DBP, and HR before and after the 75 g OGTT.
| Measurement Item | Intervention | Group | before | 30 min after | 60 min after | 90 min after | p-Value (Group) |
|---|---|---|---|---|---|---|---|
| Ankle SBP, mmHg | Pre | IAT | 143.0 ± 9.2 | 156.1 ± 7.7 * | 163.1 ± 9.1 * | 160.4 ± 8.4 | p > 0.05 |
| CON | 146.3 ± 6.3 | 157.5 ± 6.1 * | 162.9 ± 6.6 * | 156.9 ± 7.6 | |||
| 4 weeks later | IAT | 141.7 ± 9.8 | 144.1 ± 8.1 | 146.6 ± 8.3 | 144.8 ± 7.5 | p > 0.05 | |
| CON | 145.3 ± 6.7 | 156.5 ± 5.4 * | 163.1 ± 4.9 *† | 153.5 ± 3.7 | |||
| 8 weeks later | IAT | 142.6 ± 6.7 | 145.4 ± 7.1 | 148.2 ± 7.6 | 145.9 ± 7.8 | p < 0.05 | |
| CON | 144.2 ± 6.3 | 154.2 ± 5.5 * | 163.2 ± 5.0 *† | 157.2 ± 4.7 | |||
| Ankle MBP, mmHg | Pre | IAT | 96.5 ± 3.2 | 101.0 ± 2.7 | 103.3 ± 2.8 | 105.2 ± 2.4 | p > 0.05 |
| CON | 96.8 ± 3.7 | 100.4 ± 3.5 | 102.0 ± 4.1 | 100.4 ± 4.8 | |||
| 4 weeks later | IAT | 94.4 ± 3.8 | 95.4 ± 2.9 | 96.4 ± 2.9 | 96.9 ± 2.6 | p > 0.05 | |
| CON | 93.9 ± 3.5 | 97.9 ± 3.0 | 99.9 ± 3.3 | 96.6 ± 3.2 | |||
| 8 weeks later | IAT | 94.5 ± 2.1 | 95.0 ± 2.1 | 96.5 ± 2.4 | 98.0 ± 2.6 | p > 0.05 | |
| CON | 94.2 ± 4.3 | 97.2 ± 3.4 | 101.0 ± 3.5 | 99.4 ± 3.7 | |||
| Ankle DBP, mmHg | Pre | IAT | 73.2 ± 1.5 | 73.5 ± 0.9 | 73.4 ± 1.4 | 77.6 ± 2.0 | p > 0.05 |
| CON | 72.0 ± 2.6 | 71.8 ± 2.5 | 71.6 ± 3.0 | 72.1 ± 3.6 | |||
| 4 weeks later | IAT | 70.8 ± 1.7 | 71.0 ± 1.6 | 71.4 ± 1.7 | 72.9 ± 1.5 | p > 0.05 | |
| CON | 68.2 ± 2.1 | 68.7 ± 2.0 | 68.3 ± 2.7 | 68.1 ± 3.2 | |||
| 8 weeks later | IAT | 70.5 ± 1.4 | 69.8 ± 1.3 | 70.7 ± 1.6 | 74.1 ± 1.3 | p > 0.05 | |
| CON | 69.2 ± 3.4 | 68.7 ± 2.8 | 69.9 ± 2.9 | 70.6 ± 3.6 |
Data are presented as mean ± SD; 75 g OGTT, 75 g oral glucose tolerance test; IAT, intermittent aerobic training group; CON, control group; SBP, systolic blood pressure; MBP, mean blood pressure; DBP, diastolic blood pressure. * p < 0.05 vs. before intervention; † p < 0.05 vs. CON.
Table 4.
Changes in HR before and after the 75 g OGTT.
| Measurement Item | Intervention | Group | before | 30 min after | 60 min after | 90 min after | p-Value (Group) |
|---|---|---|---|---|---|---|---|
| HR, beats/min | Pre | IAT | 62.6 ± 2.5 | 62.8 ± 2.0 | 59.2 ± 1.8 | 58.9 ± 2.0 | p > 0.05 |
| CON | 63.0 ± 2.9 | 63.0 ± 1.8 | 61.4 ± 2.5 | 61.2 ± 1.8 | |||
| 4 weeks later | IAT | 59.1 ± 2.3 | 59.2 ± 2.2 | 58.7 ± 2.2 | 58.8 ± 2.0 | p > 0.05 | |
| CON | 62.8 ± 2.8 | 63.6 ± 2.2 | 62.6 ± 1.5 | 59.4 ± 2.3 | |||
| 8 weeks later | IAT | 58.3 ± 2.1 | 60.5 ± 1.6 | 57.4 ± 1.3 | 57.9 ± 1.2 | p > 0.05 | |
| CON | 59.4 ± 2.9 | 60.2 ± 2.7 | 61.9 ± 1.8 | 59.8 ± 2.4 |
Data are presented as mean ± SD; 75 g OGTT, 75 g oral glucose tolerance test; IAT, intermittent aerobic training group; CON, control group; HR, heart rate.
Table 5.
Changes in BG before and after the 75 g OGTT.
| Measurement Item | Intervention | Group | Before | 30 min after | 60 min after | 90 min after | p-Value (Group) |
|---|---|---|---|---|---|---|---|
| BG, mg/dl | Pre | IAT | 98.1 ± 5.4 | 160.6 ± 8.4 * | 135.7 ± 8.1 * | 113.8 ± 4.4 | p > 0.05 |
| CON | 96.5 ± 5.0 | 148.0 ± 9.5 * | 131.2 ± 11.7 * | 95.8 ± 6.8 | |||
| 4 weeks later | IAT | 95.7 ± 5.3 | 112.0 ± 5.9 *† | 108.3 ± 4.8 | 104.6 ± 4.6 | p < 0.05 | |
| CON | 94.7 ± 7.2 | 139.6 ± 9.7 * | 128.2 ± 6.6 * | 108.9 ± 5.8 | |||
| 8 weeks later | IAT | 93.9 ± 4.3 | 114.2 ± 4.4 *† | 107.9 ± 4.1 | 101.6 ± 4.5 | p < 0.05 | |
| CON | 98.0 ± 5.3 | 145.9 ± 7.9 * | 128.3 ± 6.9 * | 106.6 ± 6.7 |
Data are presented as mean ± SD; 75 g OGTT, 75 g oral glucose tolerance test; IAT, intermittent aerobic training group; CON, control group; BG, blood glucose. * p < 0.05 vs. before intervention; † p < 0.05 vs. CON.
Disclaimer/Publisher’s Note: The statements, opinions and data contained in all publications are solely those of the individual author(s) and contributor(s) and not of MDPI and/or the editor(s). MDPI and/or the editor(s) disclaim responsibility for any injury to people or property resulting from any ideas, methods, instructions or products referred to in the content. |
© 2024 by the authors. Licensee MDPI, Basel, Switzerland. This article is an open access article distributed under the terms and conditions of the Creative Commons Attribution (CC BY) license (https://creativecommons.org/licenses/by/4.0/).
Share and Cite
MDPI and ACS Style
Kobayashi, R.; Negoro, H. Regular Intermittent Aerobic Exercise Reduces Arterial Stiffness Associated with Postprandial Hyperglycemia in Middle-Aged and Older Individuals. BioMed 2024, 4, 39-49. https://doi.org/10.3390/biomed4010003
AMA Style
Kobayashi R, Negoro H. Regular Intermittent Aerobic Exercise Reduces Arterial Stiffness Associated with Postprandial Hyperglycemia in Middle-Aged and Older Individuals. BioMed. 2024; 4(1):39-49. https://doi.org/10.3390/biomed4010003
Chicago/Turabian StyleKobayashi, Ryota, and Hideyuki Negoro. 2024. "Regular Intermittent Aerobic Exercise Reduces Arterial Stiffness Associated with Postprandial Hyperglycemia in Middle-Aged and Older Individuals" BioMed 4, no. 1: 39-49. https://doi.org/10.3390/biomed4010003