
Inertial Sensing of the Abdominal Wall Kinematics during Diaphragmatic Breathing in Head Standing

School of Physical Education and Sport Science, National and Kapodistrian University of Athens, 172 37 Daphne, Greece
*
Author to whom correspondence should be addressed.
Biomechanics 2024, 4(1), 63-83; https://doi.org/10.3390/biomechanics4010005
Submission received: 26 November 2023
/
Revised: 20 January 2024
/
Accepted: 23 January 2024
/
Published: 2 February 2024
(This article belongs to the Special Issue Inertial Sensor Assessment of Human Movement)
Abstract
:Head standing (HS) in concurrence with diaphragmatic breathing is an atypical deviation from daily activity, yet commonly practiced. The study aimed at the inertially sensed effect of diaphragmatic versus normal breathing on the abdomen wall kinematics during HS. Twenty-eight men and women maintained HS and erect standing (ES) under normal and diaphragmatic breathing. An inertial sensor (LORD MicroStrain®, 3DM-GX3®-45, 2 cm above the umbilicus, 100 Hz, MicroStrain, Williston, VT, USA) recorded the 3D abdomen wall angular displacement (AD) (bandpass filter (0.1–0.5 Hz)). ANOVAs (p ≤ 0.05, SPSS 28.0) were applied to the extracted variables (AD path: magnitude, individual variability-%CVind, and diaphragmatic to normal ratio). Reliability measures (ICC and %SEM) and the minimal detectable change (%MDC90) were estimated. Diaphragmatic breathing increased the AD path (p ≤ 0.05) with the diaphragmatic to normal ratio being lower in HS (p ≤ 0.05). The similar AD time series (cross-correlations at p ≤ 0.05) and the ICCs (>0.80) indicated excellent reliability with the similar across conditions %CVind (p ≤ 0.05), further enhancing reliability. The %MDC90 was consistently higher than the %SEM upper boundary, indicating the differences as “real” ones. The results contribute to the limited data concerning a widely practiced atypical deviation from daily activity, as HS in concurrence with diaphragmatic breathing.
1. Introduction
Head-down inversions present a particularly atypical deviation from daily activity and upset the various systemic adaptations for overcoming the effects of gravity, a condition that appears to attract an ongoing research interest concerning their potential health benefits [1,2,3,4,5]. The alleged positive health effect of gravity inversion exercises is not a new issue. Many fitness facilities (sports clubs, YMCAs, health spas, etc.) were long ago prompted to install inversion devices so that their members could hang upside down [6]. Among them, most possibly due to the growing popularity of the Eastern ancient tradition of yoga, head standing (HS) not only is known as the “king of all postures” but also is advocated as a cure for almost all health issues by Eastern yoga gurus [7]. Nowadays, many people are encouraged or even challenged not only to practice HS but also to concurrently practice diaphragmatic breathing (characterized by a slow and deep breathing cycle), which is expected to further enhance the alleged HS benefits [7,8,9].
In diaphragmatic breathing, the inspiration phase aims to increase both the vertical and transverse diameters of the thoracic cavity through the contraction of the diaphragm that depresses its central tendon and elevates the lower ribs, thus pushing the viscera downward and outward [10,11]. During diaphragmatic breathing, the normally passive expiration phase [12] is performed actively to compress the abdomen wall and reverse the viscera’s upward and inward phases. As shown in normal breathing, muscles having both a respiratory and a postural role, such as the diaphragm (primary inspiratory muscle) and the abdominals (primary expiratory muscle), and may compromise their breathing function to prioritize their postural role [11,13]. This prioritization could be expected to be more critical in body stances of inherent instability, i.e., HS [14] when an additional postural perturbation is concurrently induced, i.e., diaphragmatic breathing [11,13,15].
During diaphragmatic breathing, in addition to postural stability [14], the breathing mechanics [15] are affected by the influence of the respiratory muscles’ activation (i.e., diaphragm-related abdomen wall expansion). Nevertheless, the research-based evidence appears rather limited and focused on the hung upside down position [3,4,5], where the shoulders and ankles support the body’s weight load rather than bearing the whole-body weight load on one’s head, i.e., during HS. Studies on the hung head-down position indicate disturbed breathing mechanics due to the reversed action of gravity on the ribcage (inspiratory direction: maximal gravity effect superseding the abdominal hydrostatic pressure, increased functional capacity of the lungs, and oxygen utilization nearer to the erect posture level; expiratory direction: reversed effect of gravity on the elastic recoil properties of the various contracting components of the respiratory muscles probably appears to have the major role, less postural contraction of the respiratory muscles and, consequently, a smaller functional residual capacity) [5]. In the HS position, the normal expiratory function [13] suggests an increased diaphragmatic restraint because the body weight is borne on the vertex and the rib cage is free of the weight of the shoulder girdle. Considering the abdomen wall expansion in diaphragmatic inspiration as well as the intense role of the abdominal muscles in expiration to breathe out the air volume that was deeply inhaled, the abdomen wall kinematics may provide a quantitative criterion of diaphragmatic versus normal breathing. Despite the technological advancements of non-invasive devices for studying breathing mechanics, i.e., inertial sensors, there appears to be limited information concerning the kinematics of the abdomen wall during diaphragmatic breathing in HS compared to erect standing (ES).
The technology advancements have inspired a lot of recent studies to use inertial sensors (devices that include an accelerometer and a gyro sensor) to detect and evaluate breathing function [16,17,18,19,20,21]. The use of inertial sensors aimed to overcome the difficulties of the gold standards for testing breathing function (spirometry and body plethysmography) [17] are both rather uncomfortable because the person must breath through a mouthpiece or a face mask with a sealed nose. Nevertheless, most of such studies tested normal breathing in the erect posture. In those studies, accelerometers placed on the chest wall [16,17,19,20,21,22,23] or the abdomen wall [16,18,19,20,21,23] appear to effectively detect the breathing kinematic changes in both the chest and the abdomen wall. To the best of our knowledge, a rather small number of studies include deep breathing data using an accelerometer [19,20]. However, the kinematic changes reported by Hung et al. [19] concern deep breathing while standing, sitting, and lying but not in head-down body stances; in addition, the breathing instructions did not target intentional diaphragmatic breathing. Karacocuk et al. [20] also describe their breathing instructions as forceful but quiet, stating that although abdominal (diaphragmatic) rather than thoracic breathing dominated, their sensor location (chest wall) did not allow the detection of abdomen wall kinematic changes. Although the use of accelerometers to assess the kinematic changes in the abdomen or chest wall is not without problems (strong dependency on the sensor location on the participant’s body [24] or motion artifacts [20]), such problems appear to be effectively handled through elaborated signal-filtering techniques [17,23,25].
To the best of our knowledge, the studies using inertial sensors and advanced signal-processing techniques concern normal breathing in the erect posture. There appears to be a lack of experimental information concerning the effect of diaphragmatic breathing in concurrence with HS, an extremely atypical deviation from daily activities, nevertheless widely practiced due to its alleged health benefits. We hypothesized that diaphragmatic compared to normal breathing would significantly increase the abdomen wall displacement and that inertial sensing would be feasible to discern this increase.
Thus, the purpose of this study was to apply inertial sensing to evaluate the effect of diaphragmatic versus normal breathing on the abdomen wall kinematics during head standing.
2. Materials and Methods
2.1. Participants
Twenty-eight healthy men and women (32.6 ± 9.7 and 22.4 ± 5.0 years; height: 173.8 ± 10.0 and 166.8 ± 6.0 cm; and body mass: 72.1 ± 9.0 and 59.7 ± 7.2 kg, for the men (n = 8) and the women (n = 20), respectively) were selected among those who volunteered as participants after a public announcement or personal invitation. The inclusion criteria (no musculoskeletal injury during the past 2 months, no history of high blood pressure, no known respiratory or vision disorder, previous experience in HS and diaphragmatic breathing) aimed to ensure that the participants could safely maintain HS in concurrence with diaphragmatic breathing. All participants were fully informed about the purpose of the study, and informed consent was obtained from all of them. Their detailed characteristics are presented in Table 1.
2.2. Experimental Procedure
2.2.1. Verification of Diaphragmatic Breathing Pattern
Participation clearance was provided only after a familiarization session that aimed to ensure that the volunteers could perform and maintain HS for 40 s and perform the diaphragmatic breathing pattern (Figure 1). Specifically, an experienced examiner evidenced the two characteristic visual alterations of the abdomen wall between regular and diaphragmatic breathing, that is, the intense abdomen wall expansion during the inspiration phase (without observable motion in the upper thorax) as well as its subsequent intense flattening and inward pull during the expiration phase [14,15,26]. In addition to the experienced examiner’s visual verification, the diaphragmatic breathing pattern was also experimentally verified through the angular displacement signal of an inertial sensor positioned on the abdomen wall (described below) concerning the abdomen wall rotation around the frontal horizontal axis [20], thus tracing the abdomen wall expansion and compression during inspiration and expiration, respectively. Karacocuk et al. [20] also report that the inclination due to rotation around the frontal horizontal axis (roll angle in the present study) is the most accurate one because it yields the lowest error concerning the breathing rate and its correlation with the respiratory minute volume.
2.2.2. Data Collection
The participants were instructed to maintain (40 s, barefoot) HS (Figure 1) as well as ES. They maintained both stances under normal and diaphragmatic breathing, both at their preferred breathing frequency. The two body stances were presented in rotation order, aiming to obtain a similar number of participants in each body stance × breathing type combination. HS was maintained without wall support; thus, in all HS trials, a trained assistant was standing next to the participant to safely cushion a potential balance loss. Also, a mat was positioned in the potential falling area in case of balance loss. Three successful trials were obtained per participant in each combination of body stance and breathing type. One minute rest was allowed between trials of the same body stance and 3 min rest before initiating the trials of the subsequent body stance. To eliminate the influence of external factors that could possibly affect the sensor signal, we did our best to maintain the same experimental conditions for all participants (conducting the data collection at fixed times of the day with some tolerance, monitoring air temperature and humidity to keep similar ambient conditions, and ensuring the absence of environmental sound or voice pollutants—a possible reason for a variety of oscillations) [27].
Following previous studies [16,21,23,28], a triaxial inertial sensor was used (LORD MicroStrain®, 3DM-GX3®-45, sampling at 100 Hz, https://www.microstrain.com/sites/default/files/applications/files/3DM-GX3-45-GPS-Aided-Inertial-Navigation-System-Data-Sheet.pdf, accessed on 23 November 2023) enabling the recording of the 3D abdomen wall 3D linear acceleration and 3D angular displacement (AD) during the normal and the diaphragmatic breathing trials. The AD rather than the linear acceleration signal was selected for analysis as a more direct estimate of the abdomen wall displacement. With the participant in ΕS, the inertial sensor was securely positioned on the abdomen wall, at 2 cm above the umbilicus (Figure 1). Also in ΕS, the anatomical calibration of the sensor indicated the abdomen wall AD for the inspiration and expiration phases as follows: the roll Euler angle as the forward–backward motion of the abdomen wall in the sagittal plane (rotation around the frontal horizontal axis, forward expansion during diaphragmatic inspiration); the pitch Euler angle as the outward–inward motion in the frontal plane (rotation around the sagittal horizontal axis, outward expansion during diaphragmatic inspiration); and the yaw Euler angle as the downward–upward motion in the transverse plane (rotation around the vertical axis, downward expansion during diaphragmatic inspiration). The AD signal was recorded in radians and converted into degrees (1 radian = 57.3 degrees). Then, the resultant of the roll, pitch, and yaw signals was also calculated.
2.2.3. Data Procession
Initially, all raw Euler angle signals were pre-processed (MatLab R2022b, bandpass filtering (https://www.mathworks.com/help/signal/ref/bandpass.html, accessed on 10 August 2023) by applying the function y = bandpass(x,fpass,fs), where y stands for the filtered signal, fs specifies the sampling frequency (that is 100 Hz in the present study), and fpass specifies the two-element vector concerning the passband frequency range of the filter in Hz. Following previous studies [17] and an extensive trial and error process, 0.1 Hz and 0.5 Hz were decided as the optimum lower and upper cut-off frequencies, respectively, for the passband frequency range.
The pre- and post-filtering signal to noise ratios (SNRs) in each body stance and breathing type condition are presented in Table 2 for all three Euler angles, as well as their resultants. The SNR was estimated through Matlab 2022b software using the function r = snr(x) that returns the SNR in decibels relative to the carrier (dBc) (where r stands for SNR and x is the input signal, https://www.mathworks.com/help/signal/ref/snr.html, accessed on 24 December 2023). The function determines the SNR through a modified periodogram that uses a Kaiser window with β = 38 and has the same length as the input signal (the result excludes the power of the first six harmonics, including the fundamental). In breathing monitoring studies, an SNR as low as 10 dB has been realized as a limit above which the accuracy of results is consistently good [29]. To the best of our knowledge, breathing studies using inertial sensors do not report their SNR values; however, an SNR ≥ 14 dB is reported as producing very low estimation error concerning the breathing rate using a Doppler radar system [29] and typical of clinically acknowledged equipment such as the respiration-correlated computer tomography [30], while an average SNR at 29.6 dB is reported for acoustic breathing signal [31].
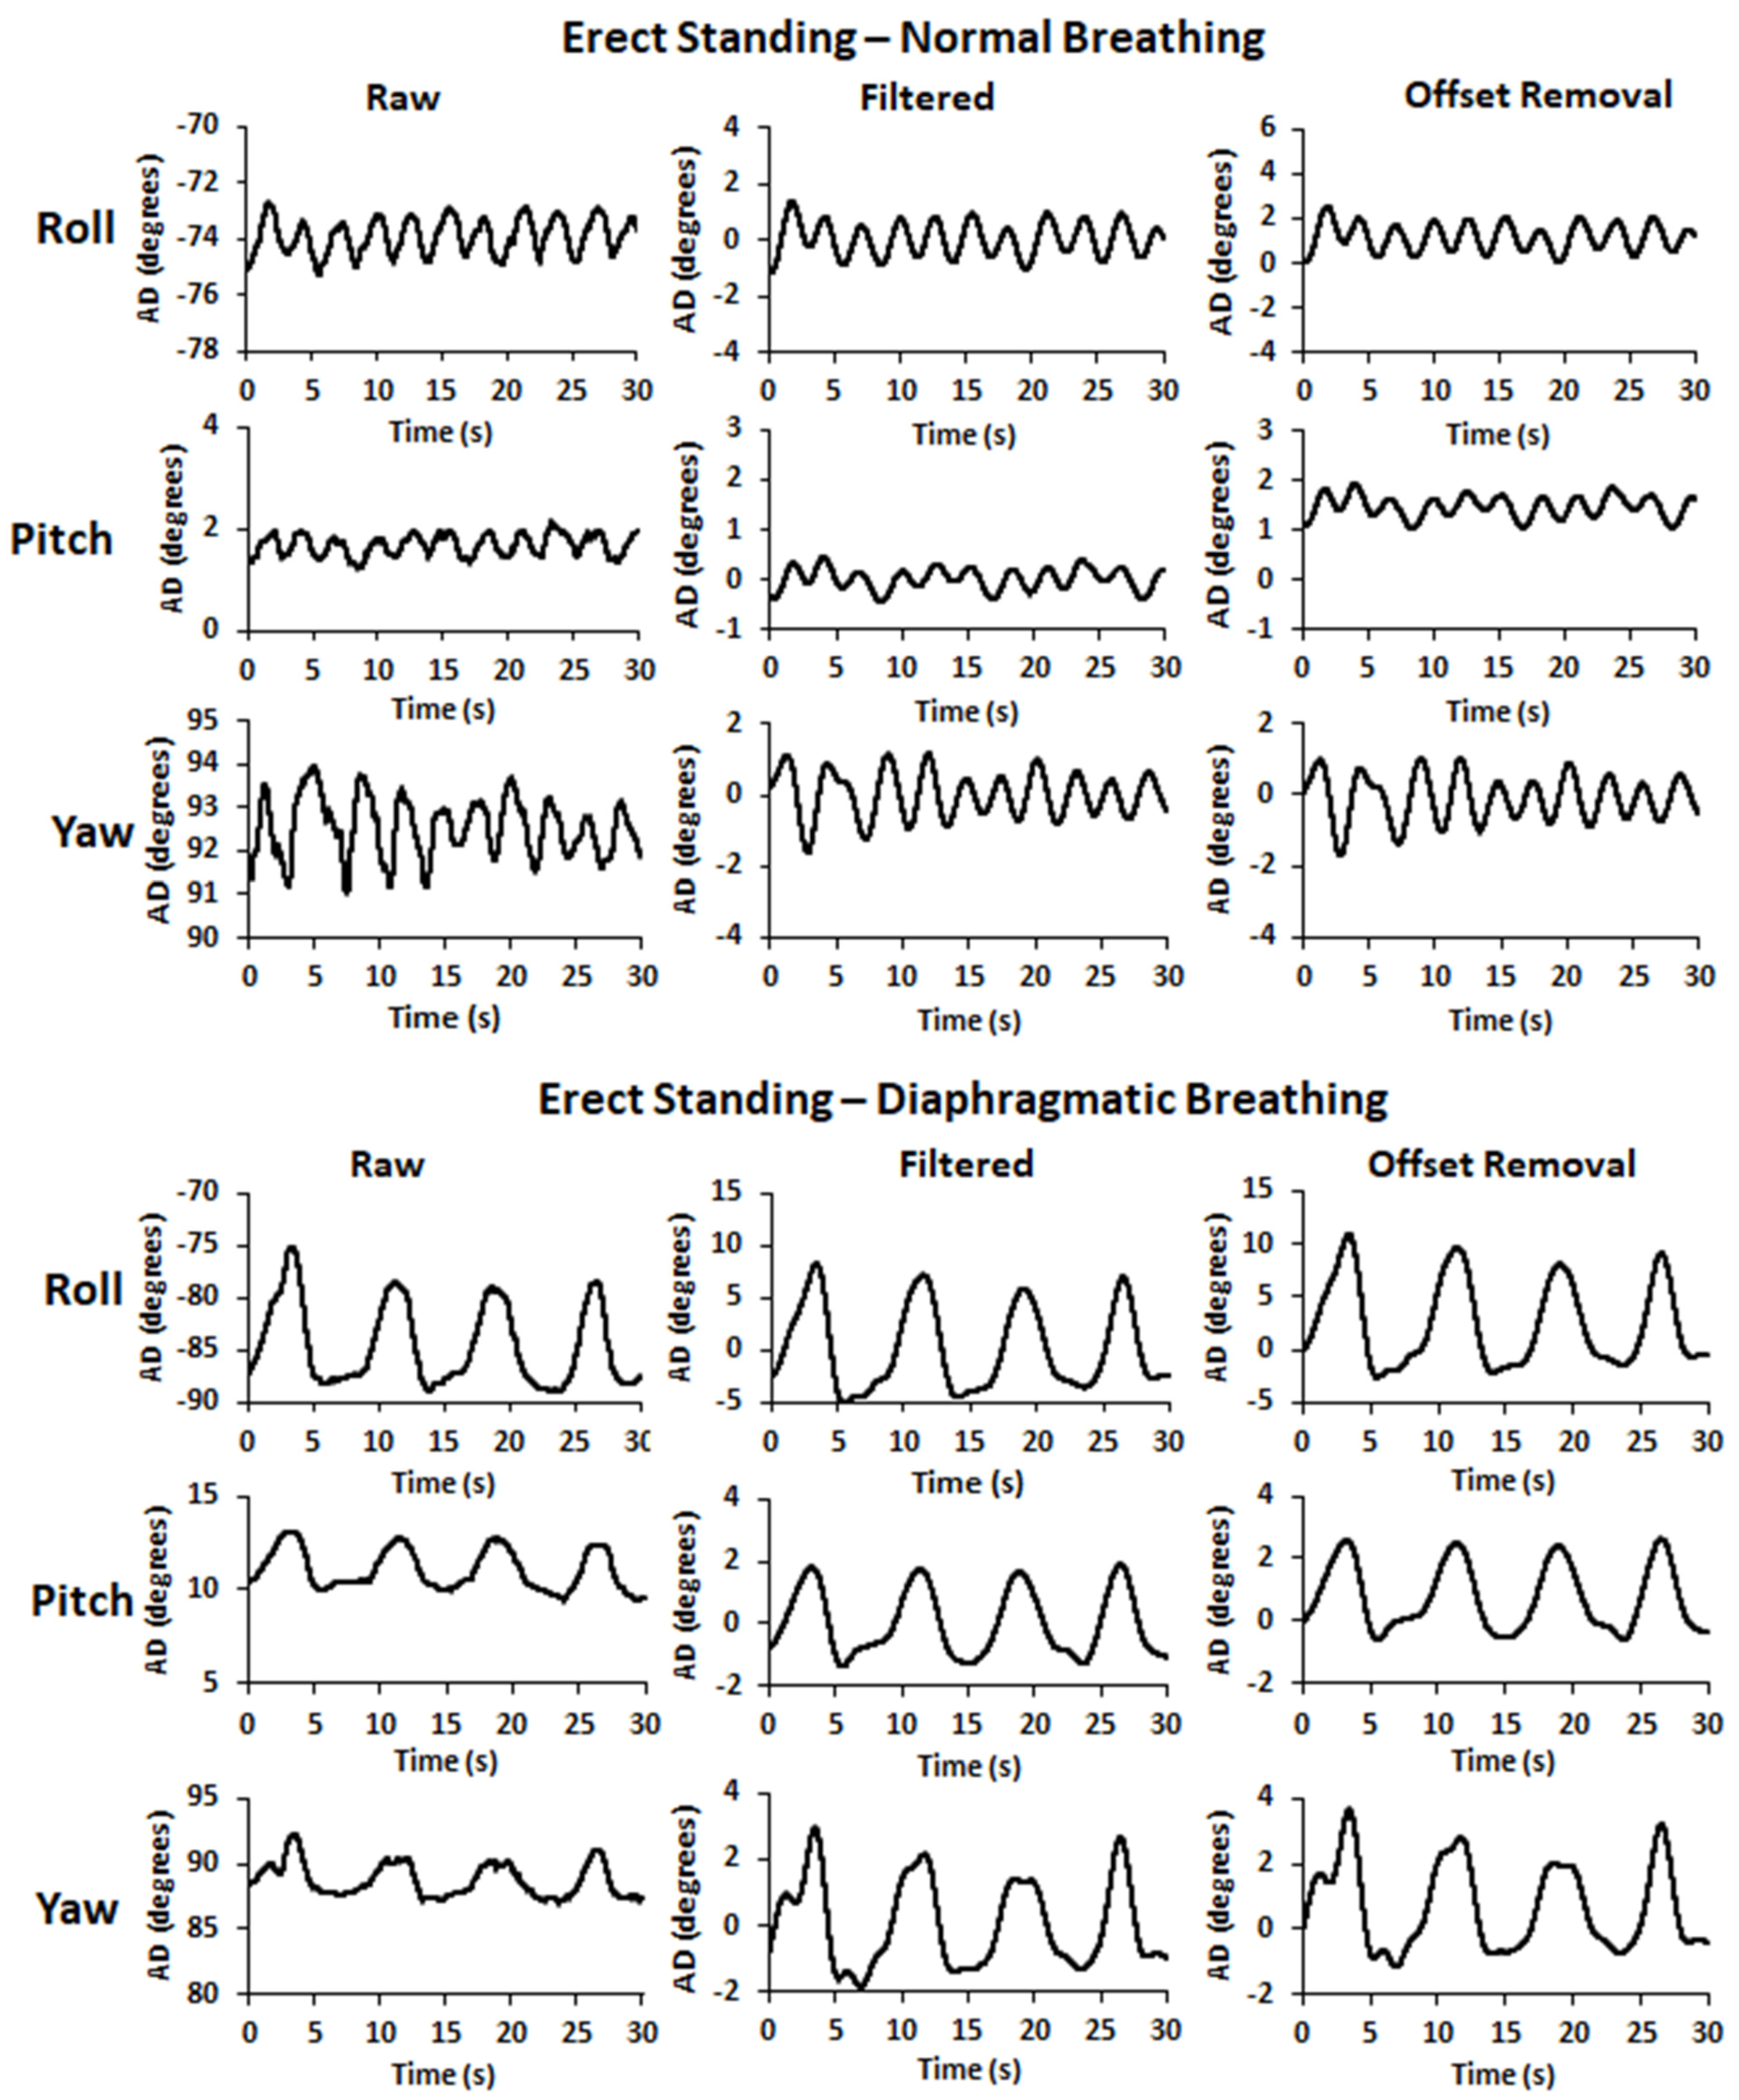
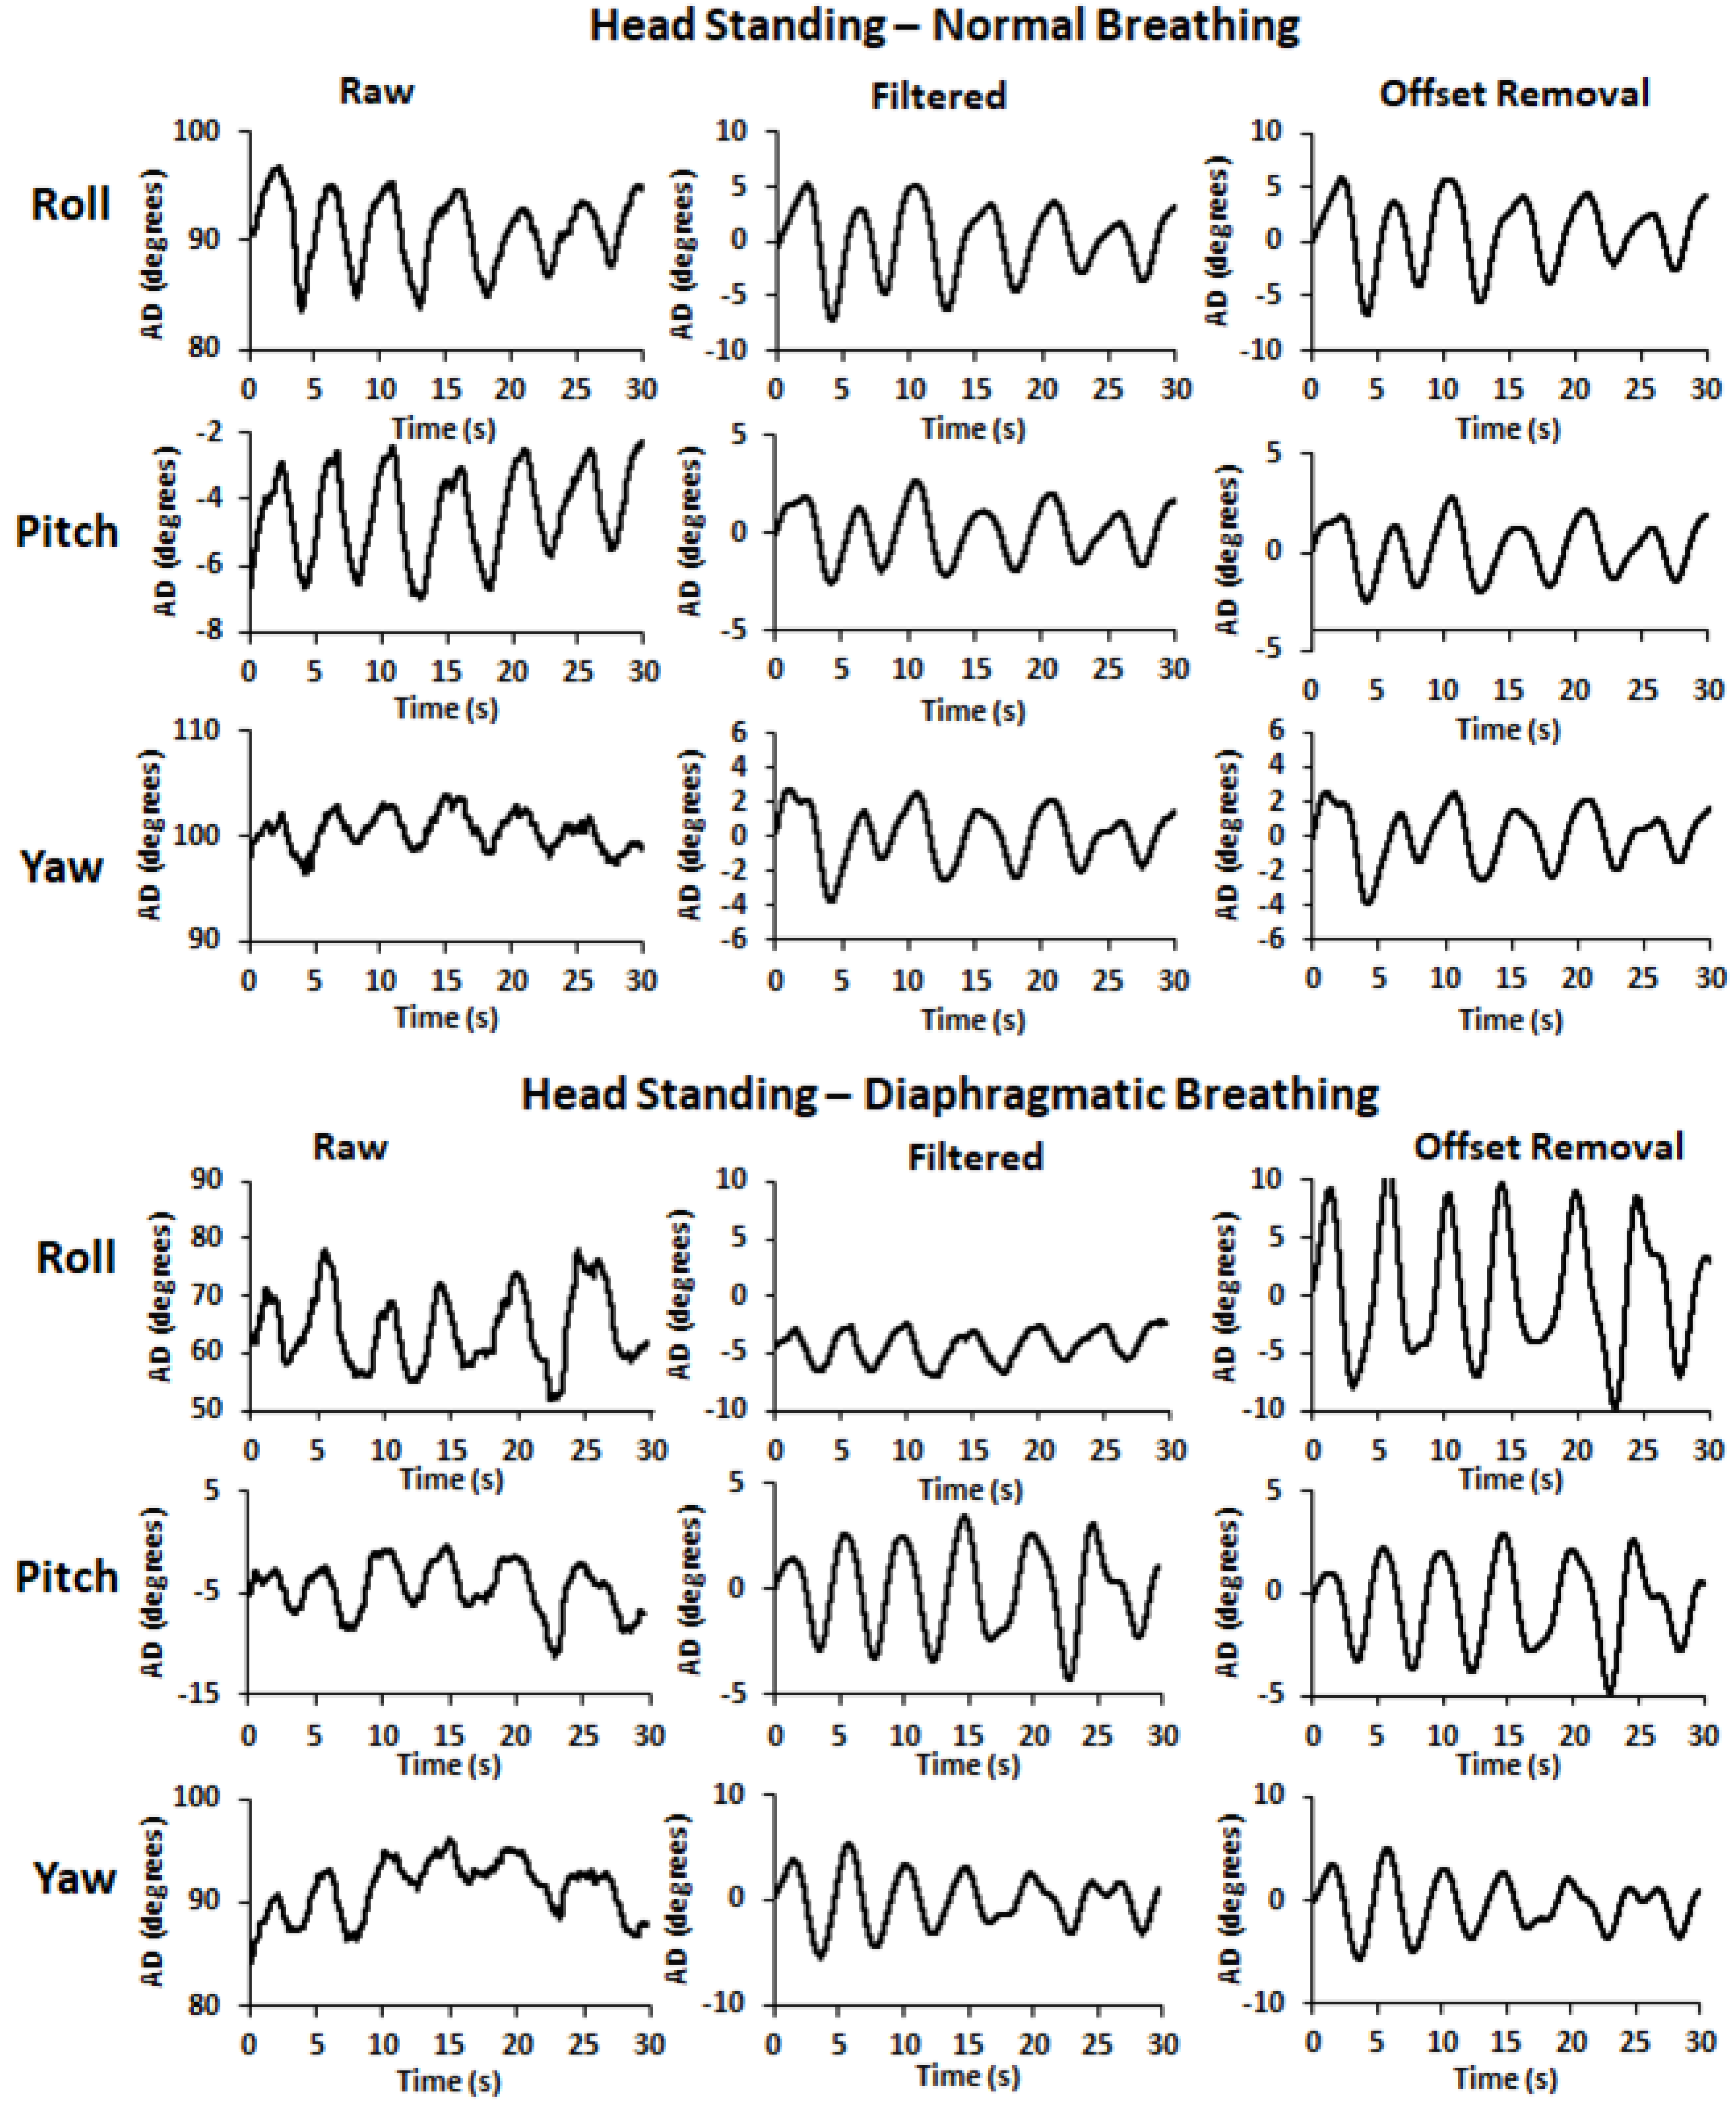
To ensure the removal of any remaining linear trend, signal filtering was followed by signal detrending using the function D = detrend(A) of MatLab R2022b software (https://www.mathworks.com/help/matlab/ref/detrend.html?s_tid=srchtitle_site_search_1_detrend, accessed on 10 August 2023) that removes the best straight-fit line from the data of the input signal (A) and returns the remaining data (D). Finally, an offset removal procedure was applied according to the equation y = x – offset, where x is the input signal and y is the output signal with the offset being the value of the initial data point of each respective input signal which was subtracted from each one of its successive data points. Sample pre- and post-filtering time series, as well as after offset removal, are illustrated in Figure 2 for ES and in Figure 3 for HS. Detrending did not affect the SNR of the time series signals or yield any significant difference concerning the variables under examination (p > 0.05). Thus, the detrended signals are not included in Figure 2 and Figure 3.
All signals were plotted at each procession step for visual inspection. All three AD signals (roll, pitch, and yaw) presented peaks and dips allowing us to visualize the breathing cycles in both the normal and the diaphragmatic breathing conditions. Peaks indicate the end of the inspiration phase and dips at the end of the expiration one, thus the initiation of the subsequent breathing cycle. After locating the initiation of the first breathing cycle, a 30 s breathing duration was extracted for further analysis, concerning the roll, pitch, and yaw Euler angles and their resultants (in each one of the three trials per participant, for each body stance and breathing type experimental condition), as described below.
The initiation of the first breathing cycle was located through visual inspection and numerical verification of the first dip of the signal (end of first expiration). The abdomen wall rotation around the frontal horizontal axis traces the characteristic abdomen wall expansion and compression during inspiration and expiration, respectively, [20]. Thus, the roll AD signal was selected to visually locate the temporal position of the dip indicating the end of the first expiration, that is, the initial time point of the 30 s data used for further procession and analysis in all three AD signals. The visual location of the dip indicating the end of the first expiration was followed by verification that its numerical value was the lower one among the neighboring data. The three AD signals (roll, pitch, and yaw) were synchronized, and their visual inspection allowed us to assume a temporal concurrence among their dips and peaks; however, we did not extract, nor did we statistically test the dip and peak time differences among the roll, pitch, and yaw AD signals.
2.2.4. Estimation of Angular Displacement (AD) Variables
Magnitude of AD Path Length. The length of the AD path was calculated by summing the magnitude of the AD change (absolute value) at every time step for the data points comprising the AD time series signal. The AD path length was calculated by summing the magnitude of the AD distance change at every time step using Equation (1), where N is the number of data points in the AD time series (in this case, 3000 successive data points), is the angular position at the respective time step, and ∣⋅∣ denotes the absolute value. For each participant, the mean of his/her three trials per experimental condition consisted of the AD path length value inserted in statistical analysis.
Individual Variability of AD Path Length. Individual variability is a measure of natural behavior reliability [32,33]. Separately for each participant and the participant’s three trials in each condition, the relative individual coefficient of variation (CVind) of the AD path length was calculated and expressed as a percentage (%CVind) according to Equation (2), where SD is the standard deviation and is the average of the three trials’ observed values.
Ratio of AD Path Length. For the AD path length, the diaphragmatic (D) to normal (N) breathing ratio was calculated, in ES (E-D/N) and HS (H-D/N), expressing the times that the AD of the abdomen wall was increased during the diaphragmatic relative to normal breathing.
2.2.5. Cross-Correlation, Relative Reliability, Standard Error of Measurement, and Minimal Detectable Change
Cross-Correlation of Time Series Signals. Separately for each participant, the signals extracted for further analysis were initially tested for cross-correlation between pairs of trials. Cross-correlation provides a measure of association between signals. When two time-series data sets are cross-correlated, a measure of temporal similarity or temporal reliability is achieved [34]. The cross-correlation coefficient (CC) was calculated between pairs of trials in each condition, that is, between trial 1 and trial 2 (CC12), between trial 1 and trial 3 (CC13), and between trial 2 and trial 3 (CC23). All CCs and their statistical significance were calculated using the MatLab Function [R,P] = corrcoef(A,B) (https://www.mathworks.com/help/matlab/ref/corrcoef.html, accessed on 10 August 2023), where R stands for the correlation coefficient, P for its significance level (default: P < 0.05), and A and B stand for the two discrete time series signals that are cross-correlated. The mathematical equations behind the corrcoef function concern the correlation coefficient matrix (R) (Equation (3)) and the p-value matrix (P) (Equations (4) and (5)). Concerning Equation (3), the cov(x,y) is the covariance between x and y and var(x) and var(y) are the variances of x and y, respectively.
The p-value matrix was calculated using a t-statistic according to Equation (4), under the assumption that the true correlation coefficient is zero.
The p-value was then obtained from the cumulative distribution function of the t-distribution with n − 2 degrees of freedom according to Equation (5); here, t(i,j) is the t-statistic for the correlation coefficient R(i,j) and P(i,j) is the p-value for testing the null hypothesis that the true correlation coefficient is zero.
Relative Reliability–Intraclass Correlation Coefficient (ICC). The relative reliability of the AD path length among the three trials was tested using the Intraclass Correlation Coefficient (ICC). There are several forms of the ICC [35], but considering that the relative reliability that is in question concerns absolute agreement, the 2-way random effects absolute agreement method, also known as ICC (2,1), was the most appropriate for the present study [36], and the average measures output was used (SPSS v28.0). The ICC’s upper and lower bounds of their 95% confidence interval were also extracted. Relative reliability was classified by Fleiss [37] (ICC > 0.75: excellent; ICC between 0.40 and 0.75: fair to good; ICC < 0.40: poor).
Standard Error of Measurement (SEM). A behavior change can be interpreted as a true change only if the observed difference between measurements is larger than the measurement error, the latter depending on the trials’ absolute reliability [32,33] in addition to the natural behavior reliability (%IndCV). Absolute reliability was tested with the standard error of measurement (SEM) with a smaller SEM indicating a better absolute reliability. SEM accounts for the within-subject variability and assesses how precisely a test measures a subject’s true value, has the same units as the measure of interest, and is not sensitive to the between-subject variability of the data. Thus, SEM indicates the expected variation in observed values that occurs owing to the measurement error (if reliability = 0, SEM will equal the standard deviation of the observed values; if test reliability = 1.00, SEM will be zero).
SEM was estimated as the square root of the mean square error term from ANOVA, as this estimation has the advantage of being independent of the specific ICC and allows more consistency in interpreting SEM values across different studies [38]. The relative SEM (expressed as a percentage, %SEM) was used for statistics and was defined as (SEM/) × 100, where is the average of all participants’ AD path length values. The %SEM allows a comparison of the expected variation in observed values between different conditions.
Minimal Detectable Change. The minimal detectable change (MDC) indicates the minimal amount of change that can be interpreted as a “real” change in the behavior of an individual, that is, a difference greater than the measurement error; a smaller MDC indicates a more sensitive measure [33,38]. MDC was calculated from the SEM based on a 90% confidence interval (MDC90) following the formula MDC90 = SEM × 1.65 × [33]. Then, the relative MDC90 was estimated (%MDC90) as (MDC90/) × 100, where is the average of all participants’ observed values, separately for each combination of body stance and breathing type condition. The %MDC90 allowed the comparative evaluation of absolute reliability to infer if the observed differences could be interpreted as a “real” change in the behavior of the participants of the present study.
2.3. Statistical Analysis
A two-way repeated measures analysis of variance (ANOVA) (body stance X breathing type) was applied to test the interaction between body stance and breathing type concerning the magnitude, the %CVind, and the ratio of the AD path length. Due to non-significant interaction between body stance and breathing type across all three AD variables (Appendix A, Table A1, two separate one-way ANOVAs were applied, one to test the effect of breathing type per body stance and another one to test the effect of body stance per breathing type. The level of significance was set at p ≤ 0.05 (SPSS version 28.0, IBM Statistics, Armonk, NY, USA).
3. Results
3.1. Angular Displacement Path Length
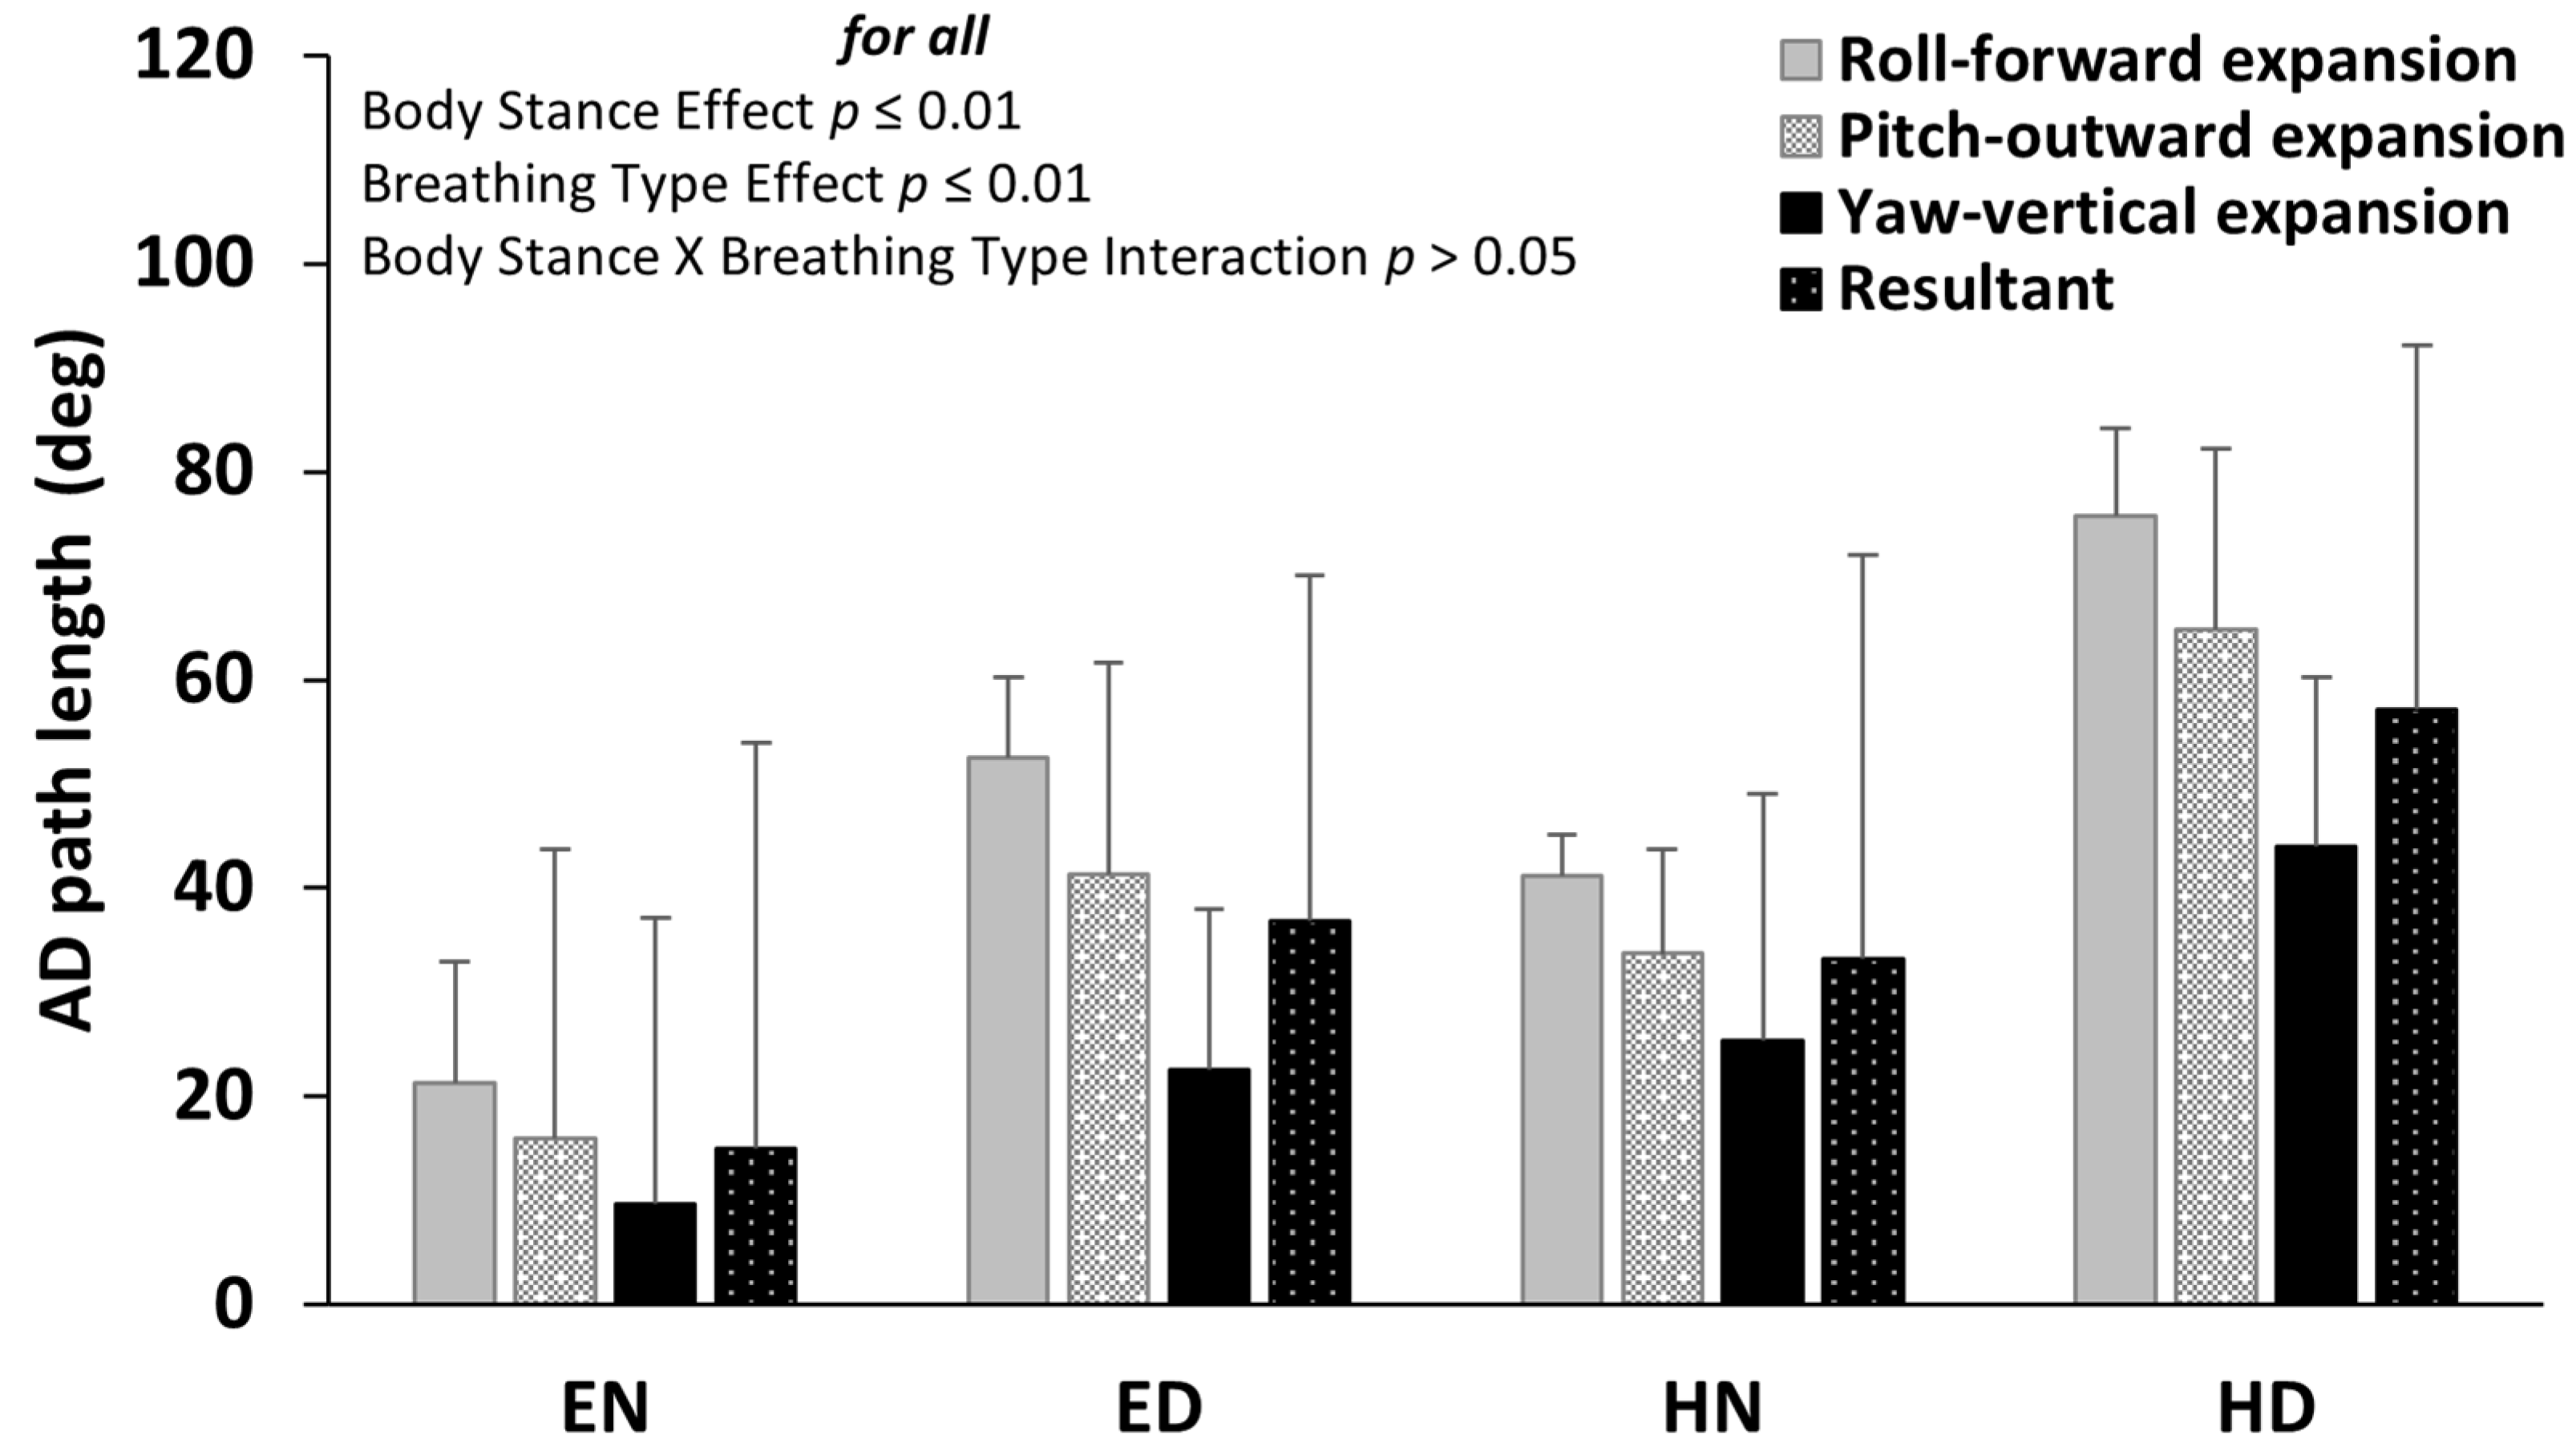
Across all axes of rotation, as well as their resultant, the AD path of the abdominal wall was significantly altered due to breathing type. Specifically, diaphragmatic breathing significantly increased the AD path of the abdominal wall (p ≤ 0.01 for all) in both ES and HS (Figure 4). Similarly, the body stance altered the AD path of the abdominal wall, with a significant increase in HS for both normal and diaphragmatic breathing (p ≤ 0.01 for all) (Figure 4). Detailed statistics of the repeated measures ANOVA, as well as the Cohen’s d effect size, concerning the breathing type and the body stance main effect, are provided in Appendix A, Table A1.
3.2. Individual Variability of AD Path
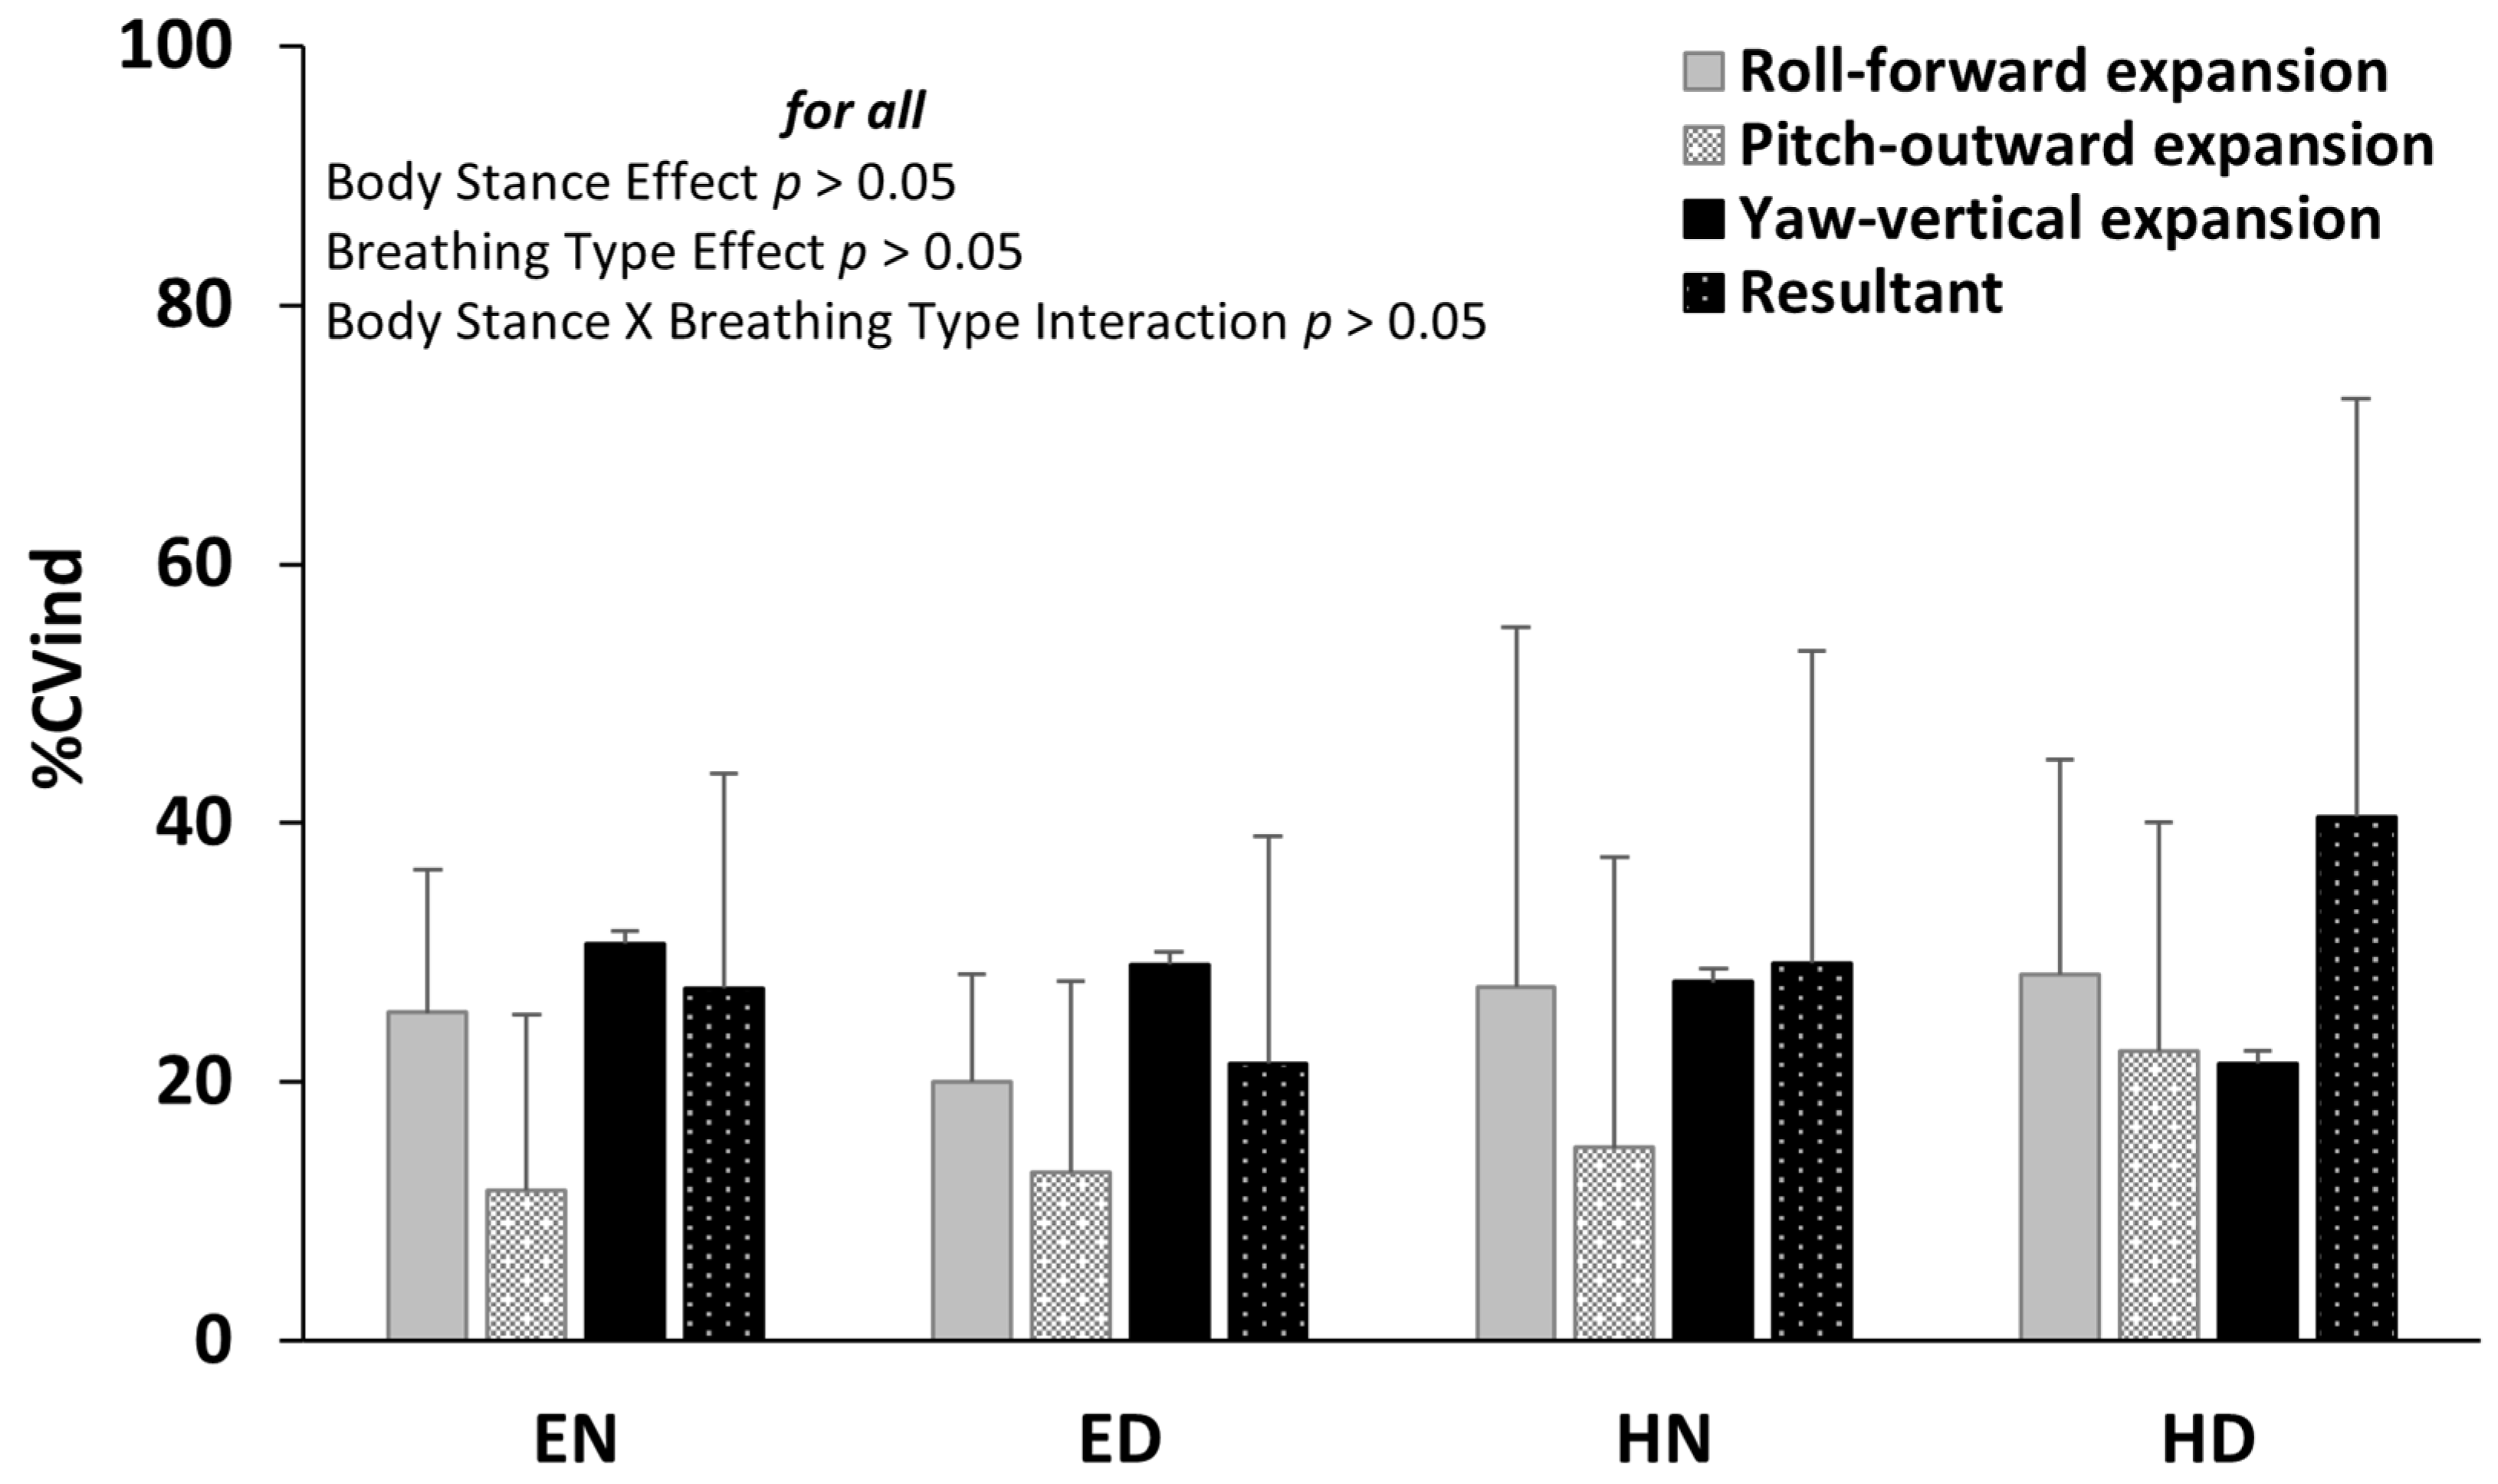
The relative individual coefficient of variation (%CVind) was not significantly altered due to either the body stance or due to breathing type (p > 0.005) (Figure 5). Detailed statistics of the repeated measures ANOVA, as well as the Cohen’s d effect size, concerning the breathing type and the body stance main effect, are provided in Appendix A, Table A1.
3.3. Diaphragmatic to Normal Breathing Ratio of AD Path
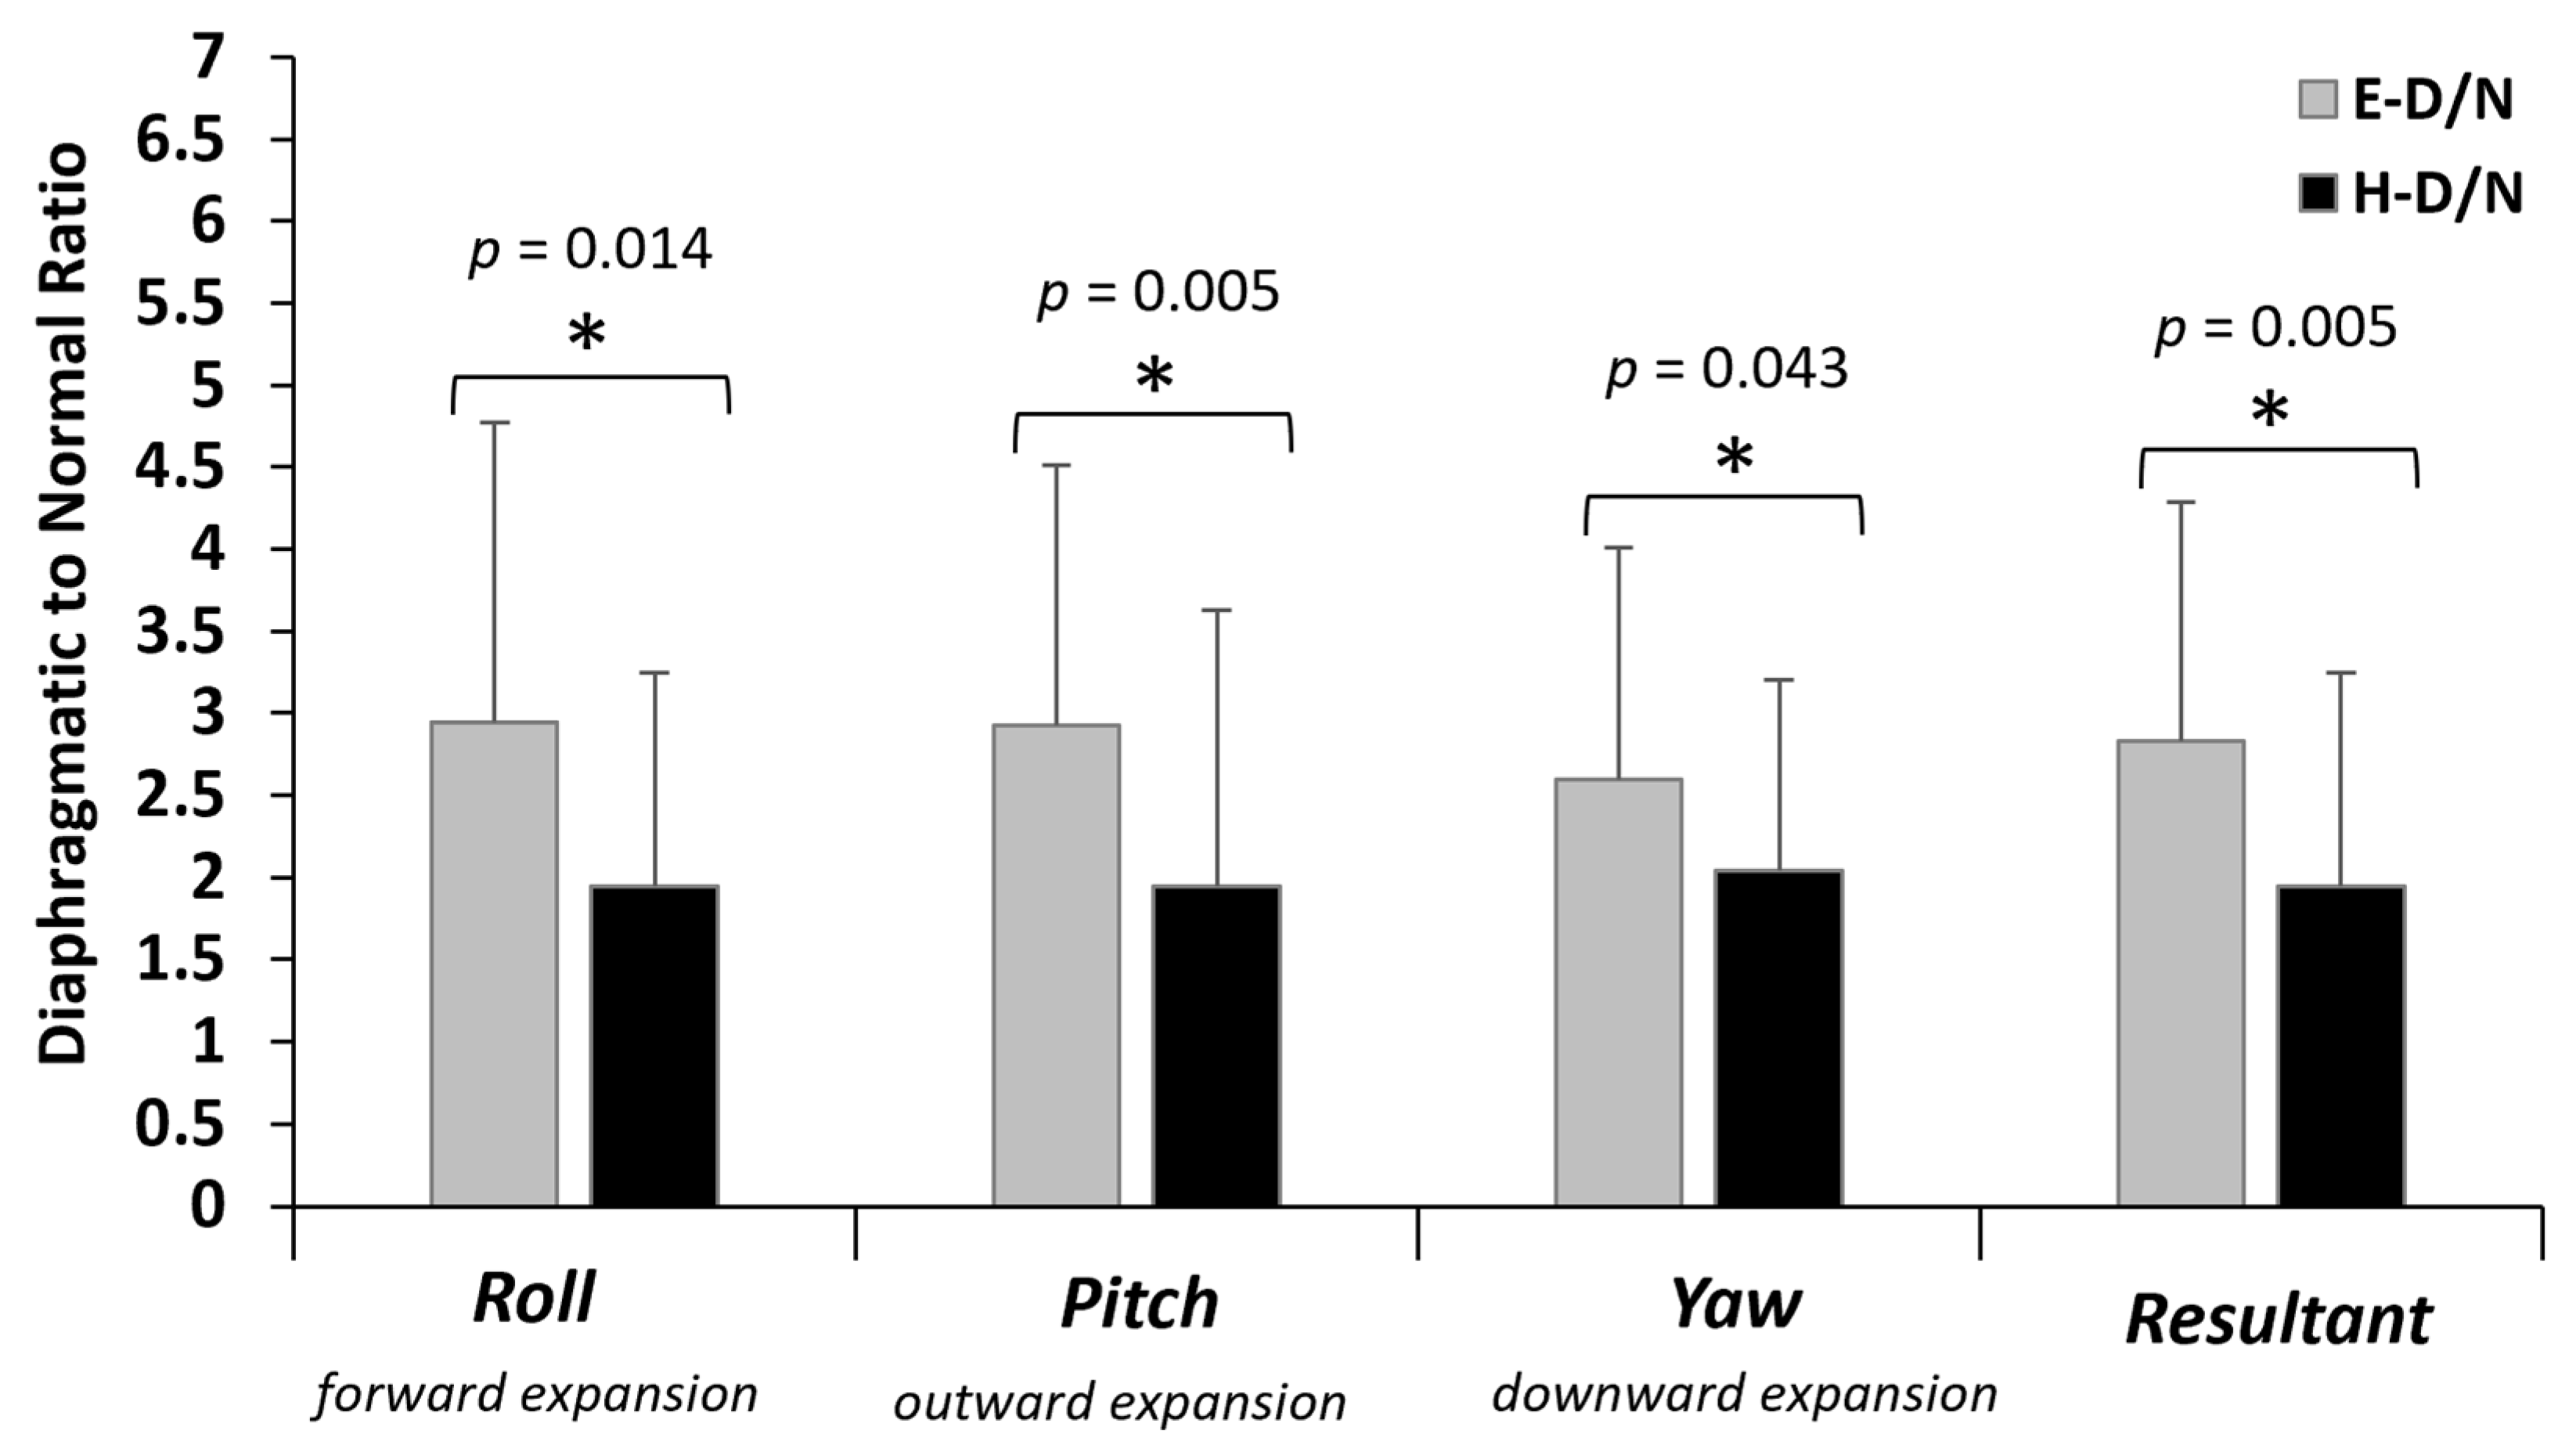
Across all axes of rotation, as well as their resultants, the diaphragmatic to normal breathing ratio was significantly lower in HS (p < 0.05) indicating that it was tripled in ES and just doubled in HS (Figure 6). Detailed statistics of the repeated measures ANOVA, as well as the Cohen’s d effect size, concerning the body stance main effect are provided in Appendix A, Table A2.
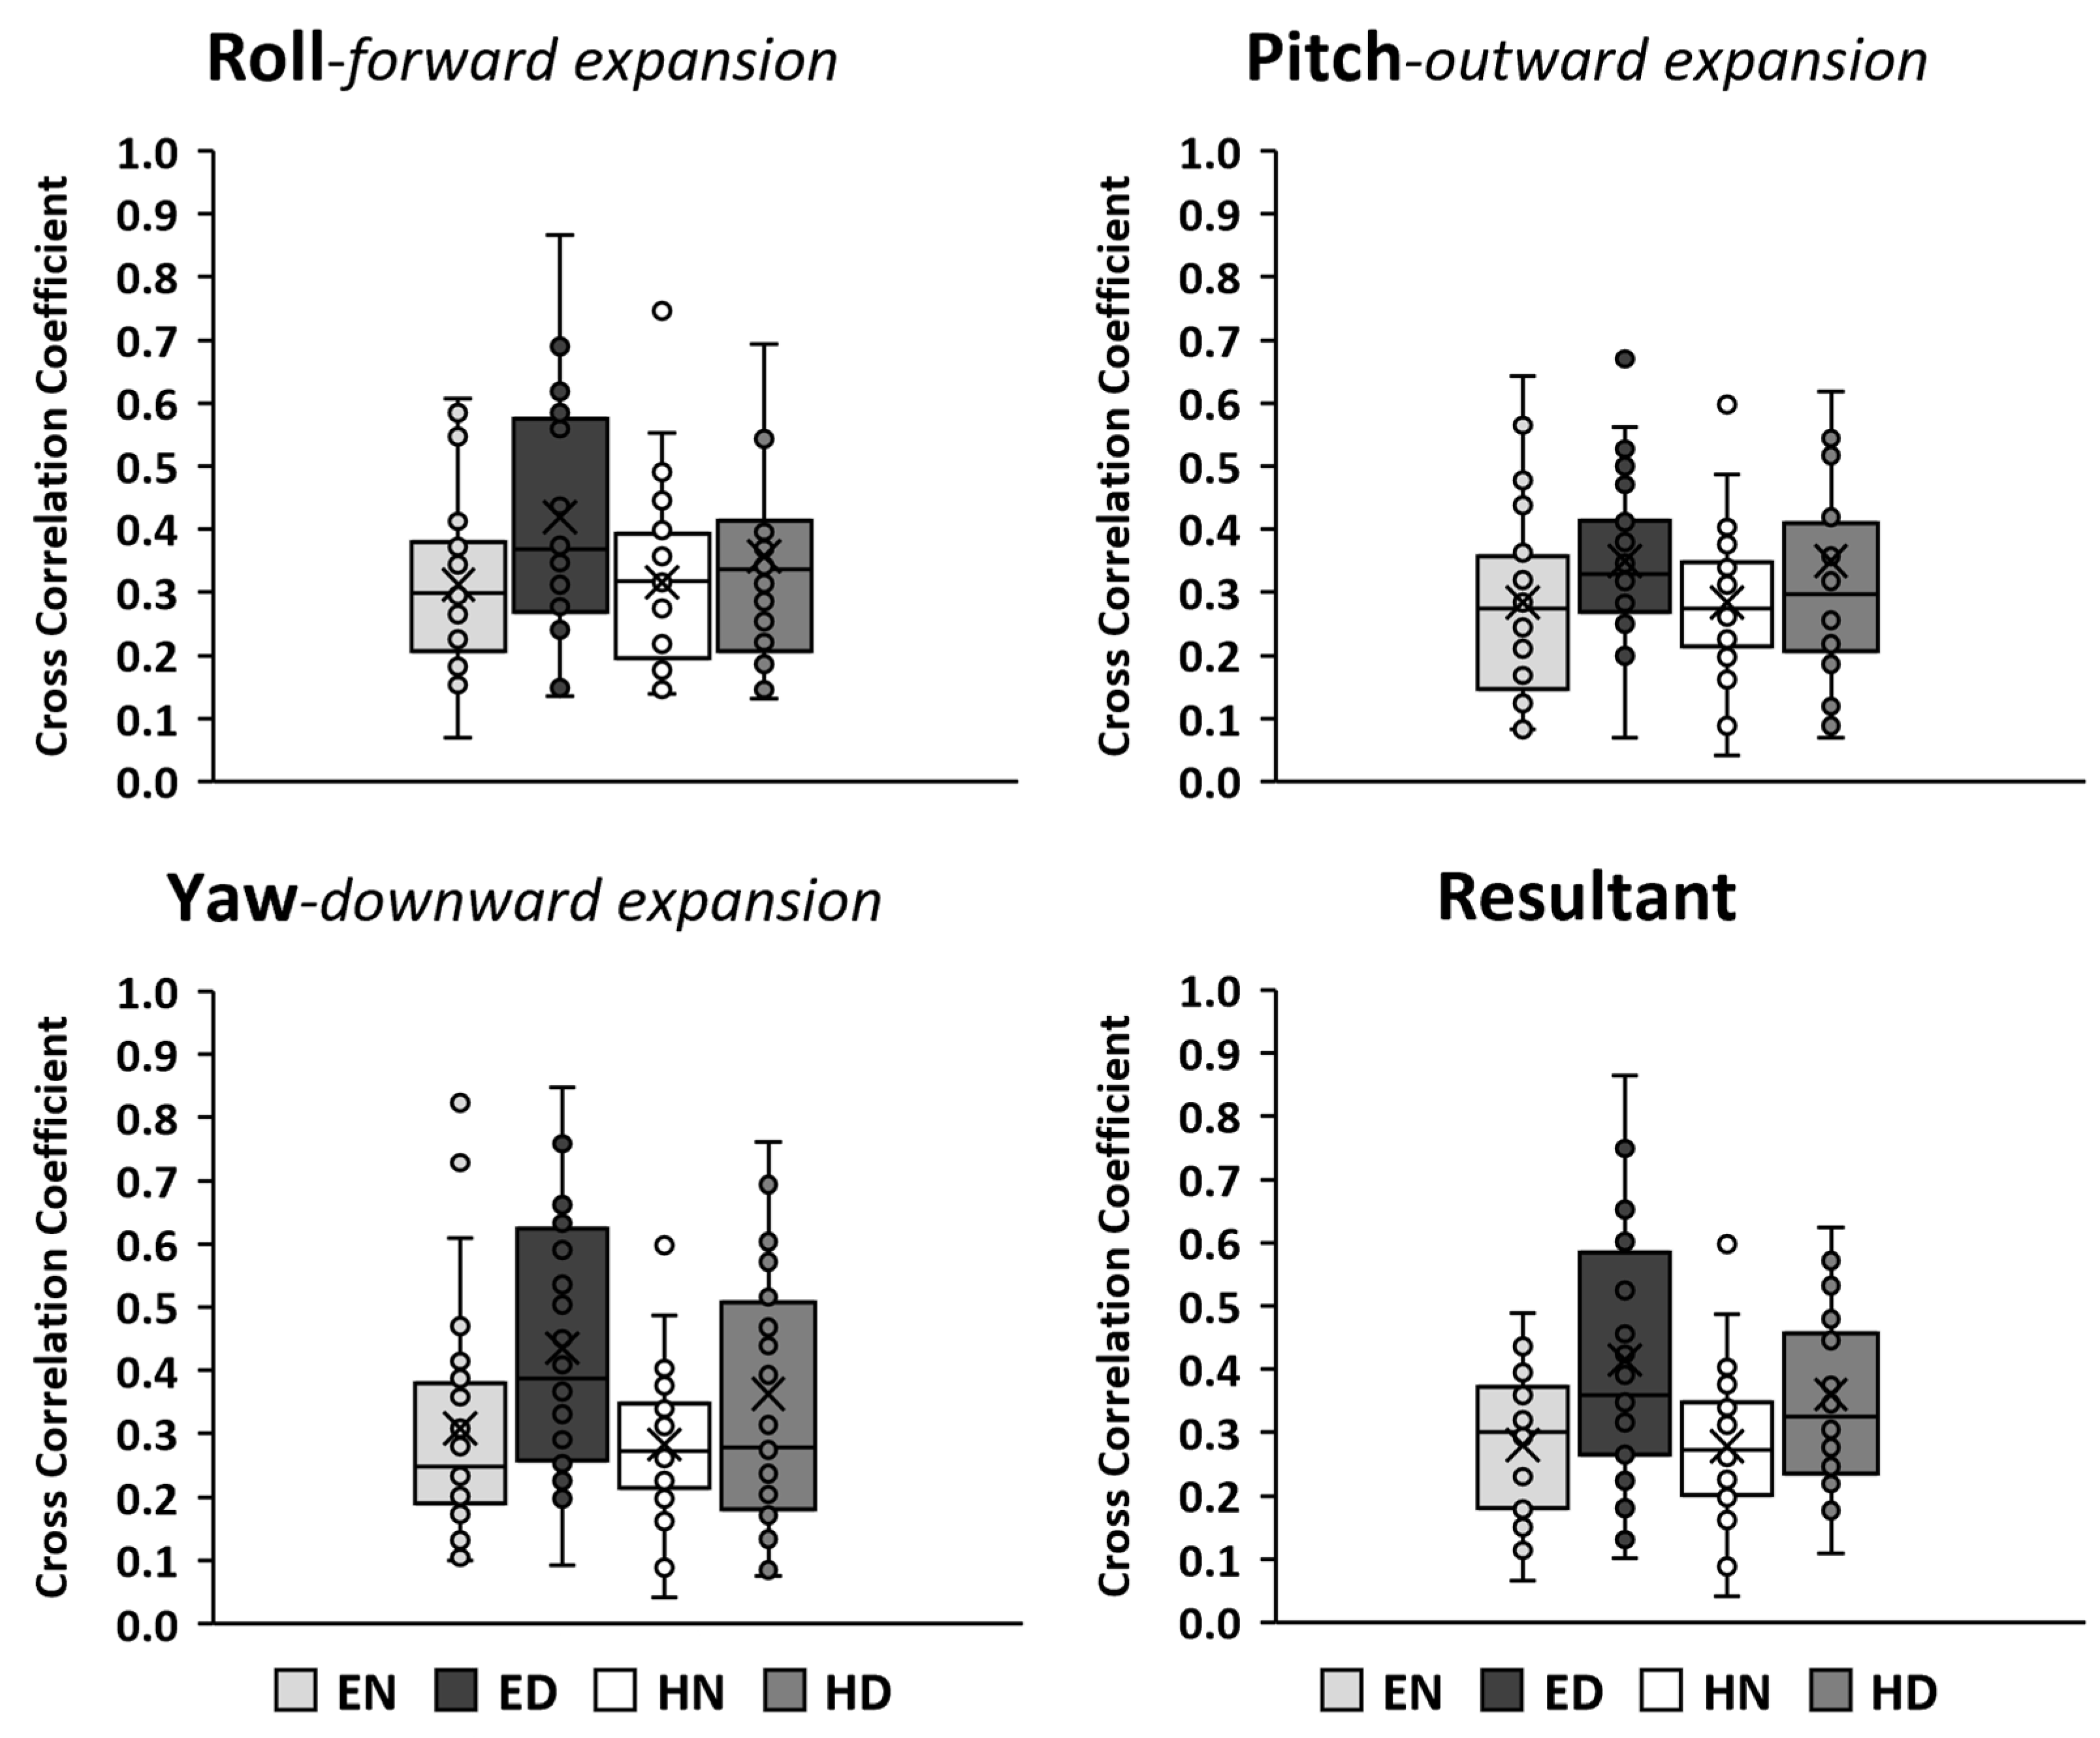
3.4. Cross-Correlation of AD Time Series Signals
3.5. Relative Reliability–Intraclass Correlation Coefficient (ICC) of AD Path
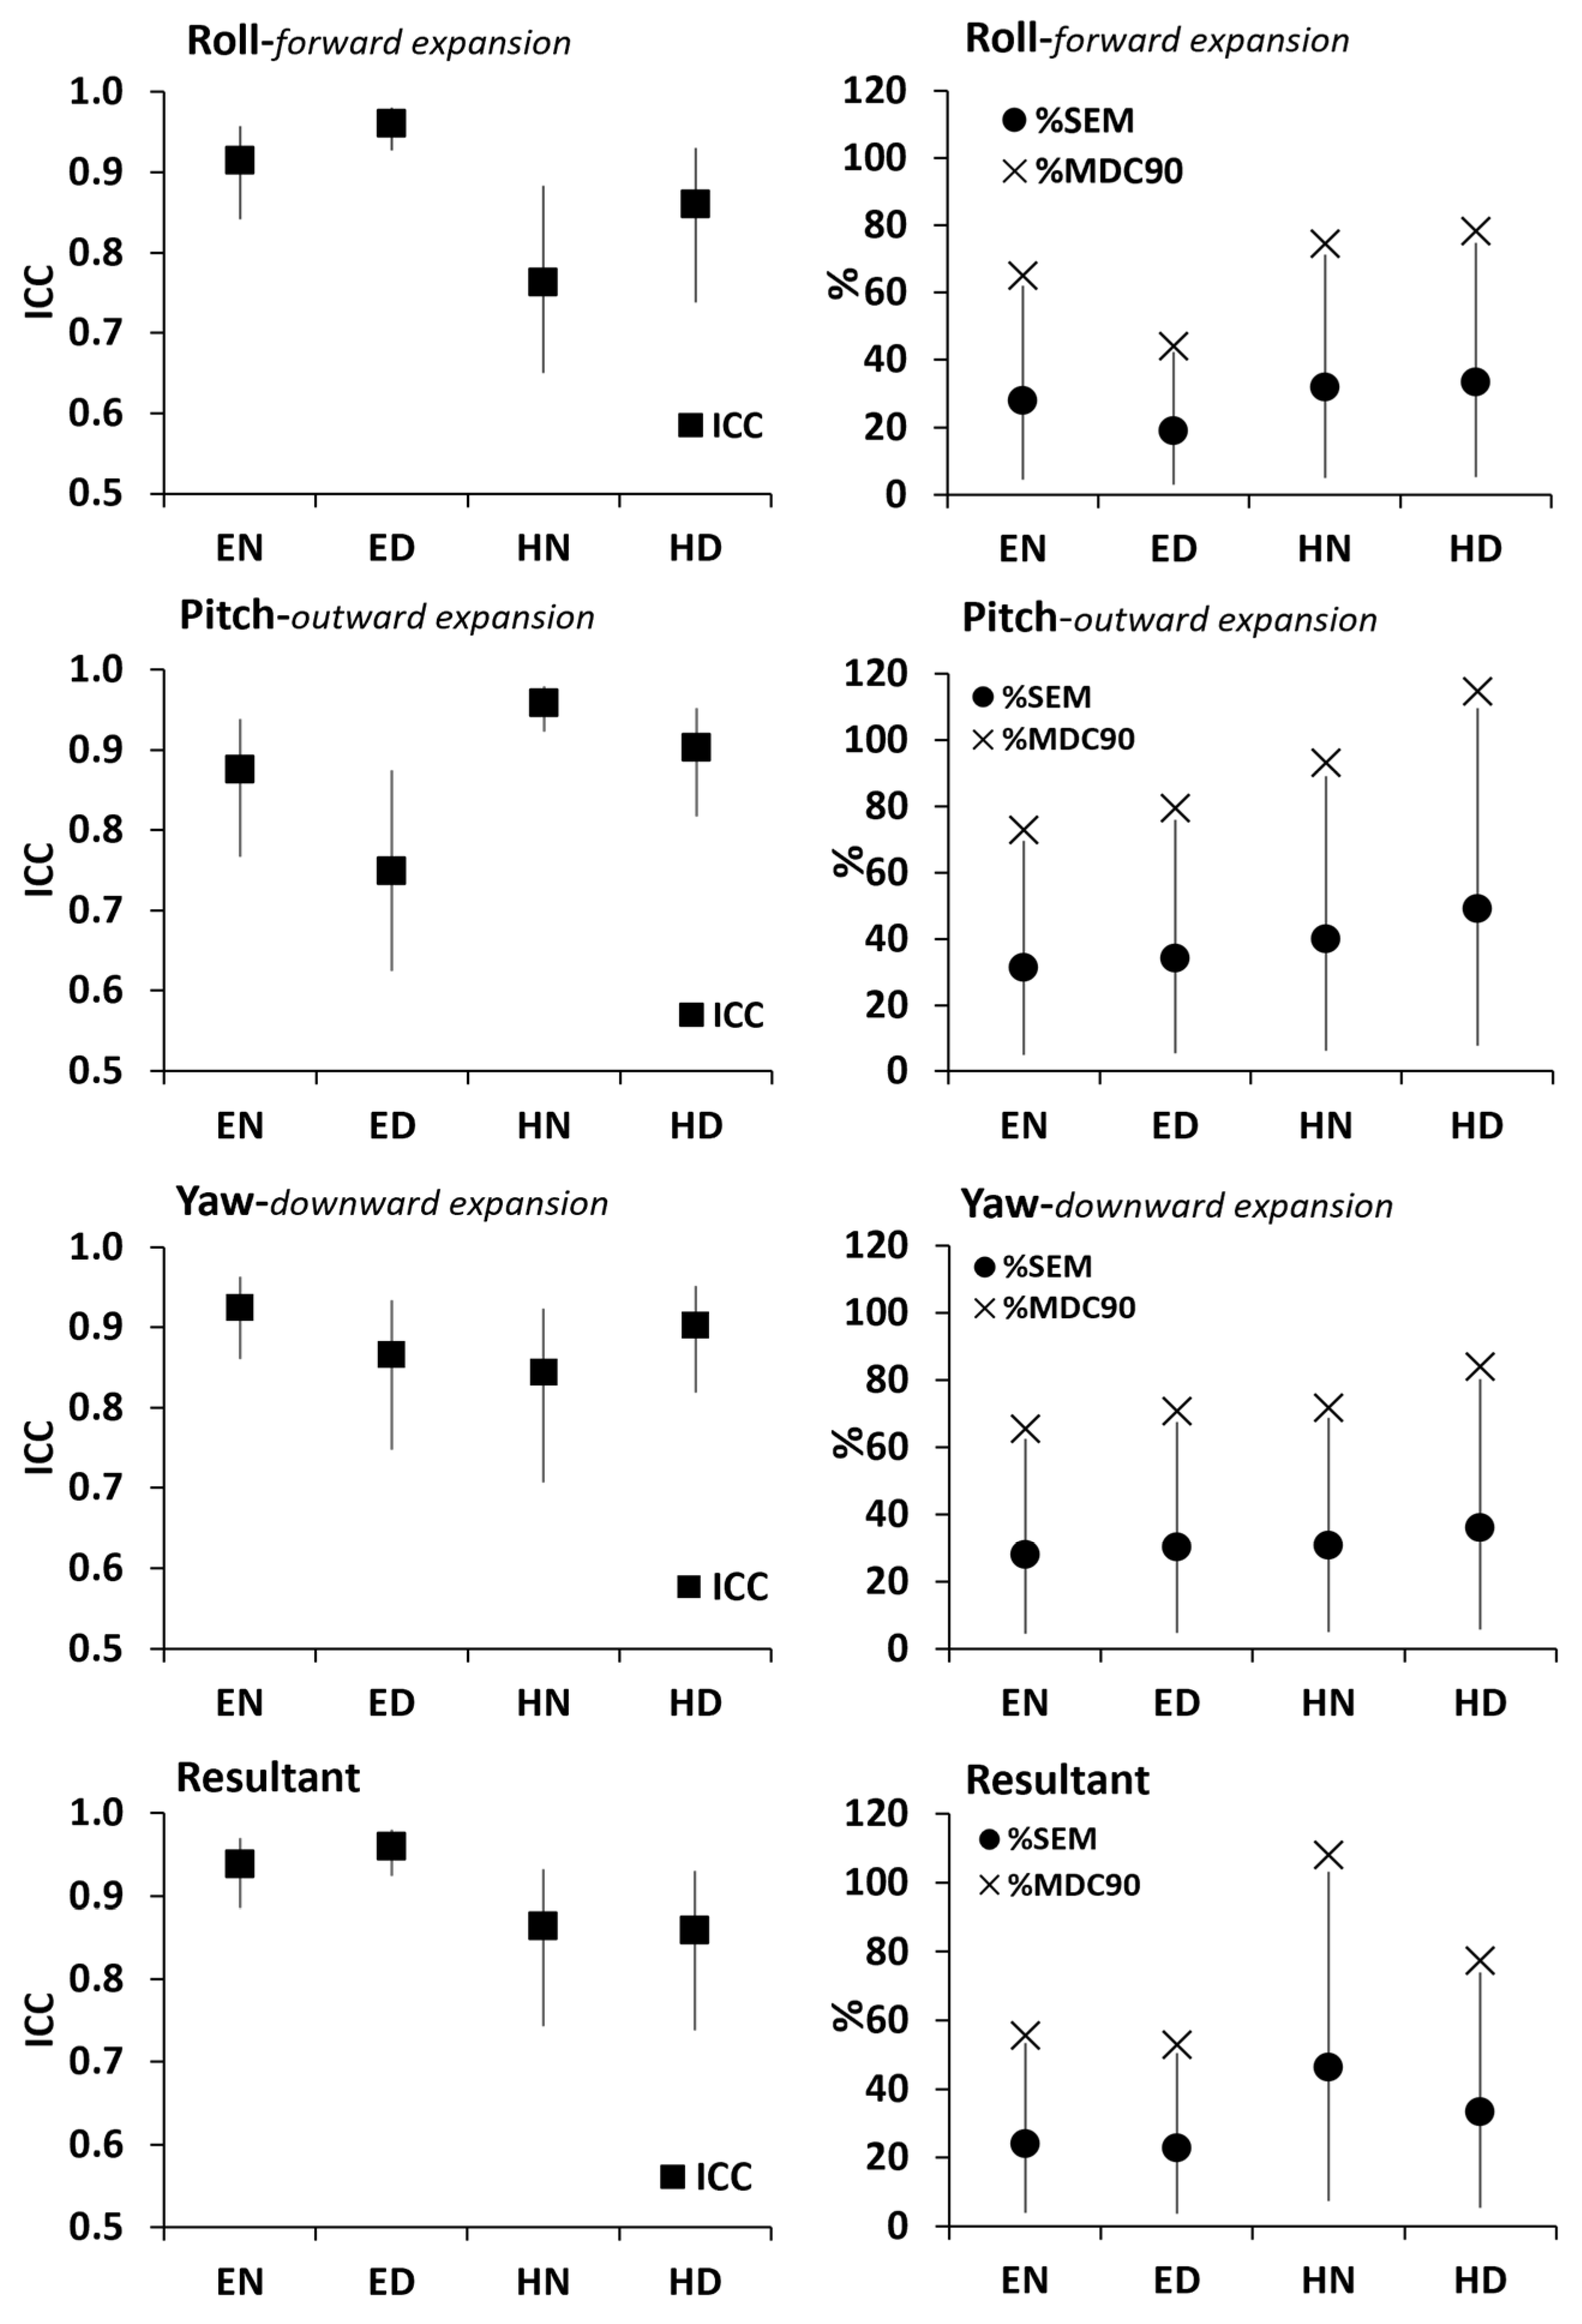
All ICCs (Figure 8-Right) were above 0.80 indicating excellent relative reliability of the AD path length in all three Euler angles as well as their resultants in all body stance X breathing type conditions.
3.6. Standard Error of Measurement and Minimal Detectable Change in AD Path
The %MDC90 was greater than the %SEM upper boundary limit (Figure 8-Left) indicating that the observed changes may be interpreted as “real” ones due to either body stance or due to breathing type.
4. Discussion
The purpose of this study was to apply inertial sensing to evaluate the effect of diaphragmatic versus normal breathing on the abdomen wall kinematics during head standing (HS). The initiative for the present study was that nowadays many people are encouraged or even challenged to practice HS as an atypical deviation from daily activity, (upsetting the evolved systemic adaptations for overcoming the effects of gravity), while concurrently practicing diaphragmatic breathing, the latter expected to further enhance the alleged health benefits of HS [7,8,9].
The present results, with no significant interaction between the body stance and the breathing type, verify a significant increase in the abdomen wall AD path length during diaphragmatic breathing compared to normal breathing, in both ES and HS (p < 0.001), across all three directions of abdominal expansion–compression. The results consolidate the visual criteria used to identify diaphragmatic breathing, that is, the greater displacement of the abdomen wall due to its inspiration-related expansion [10,11] followed by its active and intense, rather than the normal passive [12], flattening as the abdominal muscles contract against gravity to compress the viscera upward and inward.
Diaphragmatic breathing is known to affect the overall respiration mechanics [15] through diaphragm–related abdominal expansion. When breathing normally in the head-down position, the breathing mechanics are disturbed due to the reversed action of gravity on the ribcage (inspiratory direction: maximal gravity effect superseding the abdominal hydrostatic pressure, expiratory direction: reversed effect of gravity on the elastic recoil properties of the various contracting components of the respiratory muscles, less postural contraction of the respiratory muscles) [5].
While in HS, the lateral deviations in the thoracic spine may increase postural control difficulties as well as the spinal loads [39] adding to the disturbed normal breathing mechanics when gravity resists rather than aids the expiration phase. Foskolou et al. [14] report the postural stability differences between ES and HS in normal and diaphragmatic breathing. Overall, for normal and diaphragmatic breathing, HS appears to increase postural instability (anteroposterior and mediolateral) at about 8 to 9 times higher compared to ES [14]. Thus, in HS, the muscles have both a breathing and a postural role, such as the diaphragm and the abdominal muscles, and may prioritize their postural role to modulate the intra-thoracic and intra-abdominal pressure and therefore compromise the respiratory motion of the rib cage and the abdomen [11]. Indeed, the strong contraction of postural muscles in HS appears to play a major role in the greater air volume remaining in the lungs compared to hung head-down experiments [13].
One should also consider that the breathing waveform sensed by an accelerometer is a slow periodic variation (<1 Hz) with a weak amplitude, which is easily mixed with body movements (both signals are in the same frequency band [0, 1 Hz], so the person must stay still while taking measurements [28]. Although we may not exclude with absolute certainty the possibility of body movement interference, the signals of the present study have sustained an appropriate filtering process (passband at 0.1–0.5 cut-off frequencies) and agree with previously reported breathing waveforms [17,18,19,20,21,23].
Concerning the filter efficacy, it appears to have removed the data consisting of noise as shown by the improved SNR when comparing the pre- to post-filtering values. It must be noted though that even the pre-filtered SNR values appear to fall within the SNR range considered acceptable in breathing studies using a variety of breathing monitoring systems. Specifically, even 10 dB has been realized as an SNR limit above which the accuracy of results is consistently good [29]. Also, an SNR ≥ 14 dB is reported as producing a very low estimation error concerning the breathing rate using a Doppler radar system [29] and as being typical of clinically acknowledged equipment such as respiration-correlated computer tomography [30]. Also, an average SNR of 29.6 dB is reported for acoustic breathing signals [31]. To the best of our knowledge, there appears to be limited SNR information in breathing studies using inertial sensors. Phan et al. [28] using a sensor placed on the chest, suggest an adaptive rather than a fixed filter as potentially more effective regarding the SNR improvement; however, they do not report any SNR values. Overall, the average SNR of the present data, particularly those of the HS trials, was well within the commonly accepted SNR limits in previous breathing studies [29,30,31] and allowed us to assume a good efficacy of the applied filtering process. A potential consideration could be raised only for just a very small number of trials concerning solely the yaw AD signal during normal breathing in ES (sample signal provided in Figure 2 with an SNR at 10 dB).
One question that arises when inertial sensors are used to detect and evaluate breathing kinematics is the reliability of the results, which was also a concern of the present study. The reliability criteria themselves warrant careful computation and interpretation owing to the variety of computational models and the wide range of classification boundaries [35,37]. Furthermore, one should realize the different interpretations of the relative reliability (the degree to which individuals maintain their position in a sample over repeated measurements) versus absolute reliability indices (the degree to which repeated measurements vary for individuals) [37]. The present results are produced from AD time series of significant inter-trial temporal similarity, which together with the excellent relative reliability of the AD path length allow us to safely infer a high data reliability. The homogeneity of the testing conditions contributes to the reliability of the results [40,41]. Furthermore, despite the CV limitations as a reliability tool [42], the natural behavior reliability (expressed by %CVind [32,33]) was similar across experimental conditions which further enhances the overall data reliability.
Another issue that could affect the reliability of the results is the error of measurement, as any measured change reflects true change plus error. The error of measurement is the part of the obtained score that is unsystematic and random and due to chance, reflects the accumulated effects of all uncontrolled and unspecified influencing factors included in the obtained value [41]. When the error is great, wider confidence intervals apply to the observed difference, implying that the “true” change could be anywhere within the given range. The upper limit of this confidence interval helps to define another boundary of meaningful change. Theoretically, differences greater than this upper boundary limit would have less than a 5% chance of being changed due to chance (error) alone [36,41] and could therefore be confidently considered as a true difference due to the effect applied. Following this logic, the MDC also constitutes the lower boundary of a potentially meaningful change.
The acceptable error of measurement does not depend on the absolute SEM value, but should rather be considered with regards to the measured parameter, as well as with regards to the MDC of the measure under evaluation. To the best of our knowledge, there do not appear standardized specific criteria concerning the %SEM classification. As emphasized by Atkinson and Nevill [42], the higher the %SEM, the lower the absolute reliability and the lower the precision of the obtained results. A %SEM of 9–14% was classified by Jaworski et al. [43] as very good reliability (single-legged standing, Gyko inertial sensor). Pooranawatthanakul and Siriphorn [44] reported %SEM at about 16% in common ES balance tests (mobile phone accelerometer). The %SEM in the present study (ranging from 18.9 to 49.2% with an average, across-body stance and breathing type conditions) together with the about 5% higher %MDC90 than the upper boundary limit of the %SEM, allows us to safely assume that the observed differences reflect reliable as well as “real” changes.
One could argue for the use of inertial sensors rather than the gold standards for testing breathing function (spirometry and body plethysmography, Beck et al. [17]) due to the problems associated with the use of inertial sensors to detect and evaluate the breathing kinematics [20,24]. However, both spirometry and body plethysmography are rather uncomfortable as the person must breathe through a mouthpiece or a face mask with a sealed nose [17], an issue that initiated studies dated back to the middle of the 20th century to measure respiratory parameters by focusing on movements of the thorax [45]. Nowadays, inertial sensing of the breathing kinematics has been validated against plethysmography [17,19], spirometry [20], pneumotachography [21], and nasal pressure [16], whereas the body placement or motion artifact problems [20,24] appear to be effectively handled through elaborated signal-filtering techniques [17,23,25].
It is important to note that the accelerometer can introduce some systematic errors, even under identical experimental conditions [27]. However, we tried to eliminate the influence of external factors by maintaining the same experimental conditions for all subjects (conducting the data collection at fixed times of the day with some tolerance, monitoring air temperature and humidity to keep similar ambient conditions, and ensuring the absence of environmental sound or voice pollutants—a possible reason for a variety of oscillations).
One could also argue that the sensor body placement (abdominal rather than chest wall) as the body location is considered to affect the results. During normal breathing in ES, both the chest [16,17,19,20,22,23] and the abdomen wall [16,18,19,20,21,23] placements appear to effectively detect kinematic changes (inclination angle and rotation). However, the studies favoring the sensor placement on the chest wall [16,17,19,20,22,23] examine normal rather than diaphragmatic breathing, which justifies their choice for chest wall placement. Specifically, Karacocuk et al. [20] mention that in their experimental condition, abdominal breathing dominated instead of thoracic breathing, and they could not detect the abdominal breathing kinematic changes because the sensor was placed on the chest.
In the present study, the sensor was placed on the abdomen wall at the umbilicus level rather than closer to the rib cage applied in other studies [18,23]. Siqueira et al. [21] used 10 sensor positions (spread vertically as well as horizontally on the frontal body surface) to investigate the best locations that lead to good quality signals (3 sensors in the middle of the chest using the nipples as a reference, 3 sensors on the costal arch, and 3 sensors on the abdomen using the umbilicus as a reference, including the body position of the present study, and one sensor on the abdomen at the same height as the ones placed on the lower ends of the costal arch). Taking into consideration that Siqueira et al. [21] studied normal breathing in conventional body stances (standing, sitting, and lying), they reported as best locations those on the right body side (most likely due to the greater lung size on the right) and the apex of the costal arch. Nevertheless, as shown by Siqueira et al. [21], the sensor placement used in the present study is effective in detecting the kinematic changes in the body surface due to breathing, with improved efficacy in the lying than in the standing or sitting body stance. The rationale for placing the sensor near the umbilicus in the present study was that this is the anatomical level where the greatest abdomen expansion is expected during diaphragmatic inspiration both vertically and horizontally [20]. In addition, Karacocuk et al. [20] attributed their inability to detect the abdominal breathing contribution to their experimental results because their sensor was placed on the chest rather than the abdomen, the latter also avoiding the heart rate [28] influence on the signal. As both men and women were participants in the study (indeed, 72% of them were women), the abdomen rather than the chest location also allowed the avoidance of the potential breast [21] influence in the kinematic changes due to breathing. Potential biases emanating from the dominance of women participants may not be excluded as the breathing function is associated with differences due to gender (most likely due to their smaller size than men and possibly as pregnancy propaedeutics) [46]. However, considering all reliability indices (%CVind, ICC, %SEM, and %MDC90), we feel safe to state that neither the sensor placement nor the participants’ gender appears to have undermined the accuracy or the precision of the results.
5. Conclusions
In conclusion, the present study examined the effect of diaphragmatic breathing in the HS position in comparison to both normal breathing as well as ES. The results indicated a significant increase in the abdomen wall AD during diaphragmatic breathing compared to normal breathing in HS, whereas no significant interaction was observed between body stance and breathing type. This finding provides experimental and quantitative verifications of the visual criteria used to identify diaphragmatic breathing, i.e., the abdomen expansion and depression during the diaphragmatic inspiration and expiration phase, respectively. The increase in the AD path length in diaphragmatic breathing was significantly lower in HS than in ES most possibly due to the breathing mechanics alterations when the body is inverted head-down (mainly due to gravity-related differences associated with the interplay between the breathing and postural role of the diaphragm as the primary inspiratory muscle and the muscles of the abdomen wall as the primary expiratory muscles.
Across all body stance and breathing type conditions, the results appear to be highly reliable as shown by the temporal similarity of the AD time series obtained through the cross-correlation analysis, the natural behavior reliability examined through the %CVInd, the relative reliability measures examined through the ICC, and the absolute reliability examined through the %SEM. The small number of non-significant cross-correlations may not be explained as these did not yield a consistent pattern across pairs of trials or for AD direction, body stance, breathing type, or participant. Finally, the %MDC90 being consistently higher (about 5%) than the upper boundary limit of the %SEM allows us to safely conclude the AD differences as “real” changes due to diaphragmatic breathing, in both ES and HS. Our study contributes to research-based evidence concerning the concurrent practice of diaphragmatic breathing during HS, as, nowadays, many people are encouraged or even challenged to engage in this practice to further enhance the alleged benefits of HS.
Author Contributions
Conceptualization, E.R. and A.F.; methodology, E.R. and A.F.; formal analysis, E.R. and A.F.; investigation, E.R. and A.F.; data curation, E.R. and A.E.; writing—original draft preparation, E.R., A.E. and A.F.; writing—review and editing, E.R., A.E. and K.B.; visualization, A.E. and E.R.; supervision, E.R. and K.B.; project administration, K.B. and E.R. All authors have read and agreed to the published version of the manuscript.
Funding
This research received no external funding.
Institutional Review Board Statement
The study was conducted in accordance with the Declaration of Helsinki and approved by the Bioethics Committee of the School of Physical Education and Sport Science, National and Kapodistrian University of Athens, Greece (no. 1016/14/02/2018).
Informed Consent Statement
Informed consent was obtained from all subjects involved in the study.
Data Availability Statement
The data are not publicly available due to ethical restrictions.
Acknowledgments
We thank all participants for the contribution in this work.
Conflicts of Interest
The authors declare no conflict of interest.
Appendix A

Table A1.
Main effect (body stance and breathing type) and interaction (body stance and breathing type) statistics for the two-way repeated measures ANOVA concerning the angular displacement path length (AD path length) and the individual variability of the AD path (%CVind) for each one of the three Euler angles (roll, pitch, and yaw) as well as their resultants.
| F | Significance p Value | Partial Eta Squared | Cohen’s d Effect Size | Observed Power | ||
|---|---|---|---|---|---|---|
| Body Stance Main Effect | ||||||
| AD path length | Roll | 21.60 | 0.000 * | 0.444 | 1.79 | 0.99 |
| Pich | 23.82 | 0.000 * | 0.469 | 1.88 | 1.00 | |
| Yaw | 14.35 | 0.001 * | 0.347 | 1.46 | 0.95 | |
| Resultant | 22.52 | 0.000 * | 0.455 | 1.83 | 1.00 | |
| %CVind | Roll | 3.75 | 0.063 ns | 0.122 | 0.75 | 0.46 |
| Pich | 2.88 | 0.101 ns | 0.097 | 0.65 | 0.37 | |
| Yaw | 1.48 | 0.234 ns | 0.052 | 0.47 | 0.22 | |
| Resultant | 4.76 | 0.038 ns | 0.150 | 0.84 | 0.56 | |
| Breathing Type Main Effect | ||||||
| AD path length | Roll | 39.70 | 0.000 * | 0.595 | 2.43 | 1.00 |
| Pich | 64.23 | 0.000 * | 0.704 | 3.09 | 1.00 | |
| Yaw | 15.70 | 0.000 * | 0.368 | 1.53 | 0.97 | |
| Resultant | 35.75 | 0.000 * | 0.570 | 2.30 | 1.00 | |
| %CVind | Roll | 0.49 | 0.489 ns | 0.018 | 0.27 | 0.10 |
| Pich | 1.63 | 0.212 ns | 0.057 | 0.49 | 0.23 | |
| Yaw | 0.82 | 0.374 ns | 0.029 | 0.35 | 0.14 | |
| Resultant | 0.33 | 0.571 ns | 0.012 | 0.22 | 0.09 | |
| Body Stance * Breathing Type Interaction | ||||||
| AD path length | Roll | 0.10 | 0.754 ns | 0.004 | 0.12 | 0.06 |
| Pich | 0.85 | 0.364 ns | 0.031 | 0.36 | 0.15 | |
| Yaw | 0.72 | 0.404 ns | 0.026 | 0.33 | 0.13 | |
| Resultant | 0.12 | 0.734 ns | 0.004 | 0.13 | 0.06 | |
| %CVind | Roll | 1.22 | 0.279 ns | 0.043 | 0.43 | 0.19 |
| Pich | 0.51 | 0.483 ns | 0.018 | 0.27 | 0.11 | |
| Yaw | 0.22 | 0.640 ns | 0.008 | 0.18 | 0.07 | |
| Resultant | 5.74 | 0.024 ns | 0.175 | 0.92 | 0.64 | |
* Significant p value at p ≤ 0.05, ns non-significant p value at p ≤ 0.05. Commonly used interpretation of Cohen’s d effect size [47]: small (d = 0.2), medium (d = 0.5), and large (d = 0.8) based on benchmarks suggested by Cohen [48]. Another way to interpret Cohen’s d is the standard deviations (SDs) that the two groups differ between them, i.e., d = 0.05, d = 1, and d= 2, indicate, respectively, that the two group means differ by 0.5 SD, 1 SD, and 2SD Cohen [48].
Table A2.
Statistics for the stance effect of the one-way repeated measures ANOVA concerning the diaphragmatic to normal breathing ratio of the AD path for each one of the three Euler angles (roll, pitch, and yaw) as well as their resultants.
Table A2.
Statistics for the stance effect of the one-way repeated measures ANOVA concerning the diaphragmatic to normal breathing ratio of the AD path for each one of the three Euler angles (roll, pitch, and yaw) as well as their resultants.
| F | Significance p Value | Partial Eta Squared | Cohen’s d Effect Size | Observed Power | |
|---|---|---|---|---|---|
| Roll | 6.83 | 0.014 * | 0.202 | 1.00 | 0.71 |
| Pitch | 9.18 | 0.005 * | 0.254 | 1.17 | 0.83 |
| Yaw | 4.50 | 0.043 * | 0.143 | 0.82 | 0.53 |
| Resultant | 9.50 | 0.005 * | 0.259 | 1.18 | 0.84 |
* Significant p value at p ≤ 0.05, Commonly used interpretation of Cohen’s d effect size [47]: small (d = 0.2), medium (d = 0.5), and large (d = 0.8) based on benchmarks suggested by Cohen [48]. Another way to interpret Cohen’s d is the of standard deviations (SDs) that the two groups differ between them, i.e., d = 0.05, d = 1, d = 2, indicate, respectively, that the two group means differ by 0.5 SD, 1 SD, 2SD Cohen [48].
References
- Liu, H.; Xu, Q.; Xiang, X.; Liu, D.; Si, S.; Wang, L.; Lv, Y.; Liao, Y.; Yang, H. Case report: Passive handstand promotes cerebrovascular elasticity training and helps delay the signs of aging: A 40-year follow-up investigation. Front. Med. 2022, 9, 752076. [Google Scholar] [CrossRef] [PubMed]
- Manjunath, N.K.; Telles, S. Effects of sirsasana (headstand) practice on autonomic and respiratory variables. Indian J. Physiol. Pharmacol. 2003, 47, 34–42. Available online: https://ijpp.com/IJPP%20archives/2003_47_1/vol47_no1_orgn_artcl_2.htm (accessed on 10 August 2023). [PubMed]
- Rao, S. Metabolic cost of head-stand posture. J. Appl. Physiol. 1962, 17, 117–118. [Google Scholar] [CrossRef] [PubMed]
- Rao, S. Cardiovascular responses to head-stand posture. J. Appl. Physiol. 1963, 18, 987–990. [Google Scholar] [CrossRef] [PubMed]
- Rao, S. Respiratory responses to headstand posture. J. Appl. Physiol. 1968, 24, 697–699. [Google Scholar] [CrossRef] [PubMed]
- LeMarr, J.D.; Golding, A.L.; Kevin, D.; Crehan, K.D. Cardiorespiratory responses to inversion. Phys. Sportsmed. 1983, 11, 51–57. [Google Scholar] [CrossRef] [PubMed]
- Iyengar, B.K. Light on Yoga; Schocken Books: New York, NY, USA, 1966. [Google Scholar]
- Ma, X.; Yue, Z.-Q.; Gong, Z.-Q.; Zhang, H.; Duan, N.-Y.; Shi, Y.-T.; Wei, G.-X.; Li, Y.-F. The effect of diaphragmatic breathing on attention, negative affect and stress in healthy adults. Front. Psychol. 2017, 8, 234806. [Google Scholar] [CrossRef] [PubMed]
- Martarelli, D.; Cocchioni, M.; Scuri, S.; Pompei, P. Diaphragmatic breathing reduces exercise-induced oxidative stress. Evid. Based. Complement. Altern. Med. 2011, 2011, 932430. [Google Scholar] [CrossRef]
- De Troyer, A.; Estenne, M. Functional anatomy of the respiratory muscles. Clin. Chest Med. 1988, 9, 175–193. [Google Scholar] [CrossRef]
- Hodges, P.W.; Gandevia, S.C. Activation of the human diaphragm during a repetitive postural task. J. Physiol. 2000, 522, 165–175. [Google Scholar] [CrossRef]
- Fogarty, M.J.; Mantilla, C.B.; Sieck, G.C. Breathing: Motor Control of Diaphragm Muscle. Physiol 2018, 33, 113–126. [Google Scholar] [CrossRef] [PubMed]
- Agostoni, E.; Hyatt, R.E. Static behavior of the respiratory system. In Comprehensive Physiology, Supplement 12 Handbook of Physiology, the Respiratory System, Mechanics of Breathing; Maclem, P.T., Mead, J., Eds.; American Physiological Society: Bethesda, MD, USA, 1986; pp. 113–130. [Google Scholar] [CrossRef]
- Foskolou, A.; Emmanouil, A.; Boudolos, K.; Rousanoglou, E. Abdominal breathing effect on postural stability and the respiratory muscles’ activation during body stances used in fitness modalities. Biomechanics 2022, 2, 478–493. [Google Scholar] [CrossRef]
- Perry, S.F.; Similowski, T.; Klein, W.; Codd, J.R. The evolutionary origin of the mammalian diaphragm. Respir. Physiol. Neurobiol. 2010, 171, 1–16. [Google Scholar] [CrossRef] [PubMed]
- Bates, A.; Ling, M.; Mann, J.; Arvind, D.K. Respiratory rate and flow waveform estimation from tri-axial accelerometer data. In Proceedings of the 2010 International Conference on Body Sensor Networks, Singapore, 7–9 June 2010; IEEE Computer Society: Singapore, 2010; pp. 144–150. [Google Scholar] [CrossRef]
- Beck, S.; Laufer, B.; Krueger-Ziolek, S.; Moeller, K. Measurement of respiratory rate with inertial measurement units. Curr. Dir. Biomed. Eng. 2020, 6, 237–240. [Google Scholar] [CrossRef]
- Erfianto, B.; Rizal, A. IMU-based respiratory signal processing using cascade complementary filter. J. Sens. 2022, 2022, 7987159. [Google Scholar] [CrossRef]
- Hung, P.D.; Bonnet, S.; Guillemaud, R.; Castelli, E.; Yen, P.T.N. Estimation of respiratory waveform using an accelerometer. In Proceedings of the 5th IEEE International Symposium on Biomedical Imaging: From Nano to Macro, Paris, France, 14–17 May 2008; pp. 1493–1496. Available online: https://ieeexplore.ieee.org/document/4541291 (accessed on 10 August 2023).
- Karacocuk, G.; Höflinger, F.; Zhang, R.; Reindl, L.M.; Laufer, B.; Möller, K.; Röell, M.; Zdzieblik, D. Inertial sensor-based respiration analysis. IEEE Trans. Instrum. Meas. 2019, 68, 4268–4275. [Google Scholar] [CrossRef]
- Siqueira, A.; Spirandeli, F.; Moraes, R.; Zarzoso, V. Respiratory waveform estimation from multiple accelerometers: An optimal sensor number and placement analysis. IEEE J. Biomed. Health Inform. 2018, 23, 1507–1515. [Google Scholar] [CrossRef]
- Gaidhani, A.; Moon, K.S.; Ozturk, Y.; Lee, S.Q.; Youm, W. Extraction and analysis of respiratory motion using wearable inertial sensor system during trunk motion. Sensors 2017, 17, 2932. [Google Scholar] [CrossRef]
- Hughes, S.; Liu, H.; Zheng, D. Influences of sensor placement site and subject posture on measurement of respiratory frequency using triaxial accelerometers. Front Physiol. 2020, 11, 823. [Google Scholar] [CrossRef]
- Chu, M.; Nguyen, T.; Pandey, V.; Zhou, Y.; Pham, H.N.; Bar-Yoseph, R.; Radom-Aizik, S.; Jain, R.; Cooper, D.M.; Khine, M. Respiration rate and volume measurements using wearable strain sensors. NPJ Digit. Med. 2019, 2, 8. [Google Scholar] [CrossRef]
- Presti, D.L.; Massaroni, C.; Caponero, M.; Formica, D.; Schena, E. Cardiorespiratory monitoring using a mechanical and an optical system. In Proceedings of the IEEE International Symposium on Medical Measurements and Applications (MeMeA), Lausanne, Switzerland, 23–25 June 2021; pp. 1–6. [Google Scholar] [CrossRef]
- Lee, H.-Y.; Cheon, S.-H.; Yong, M.-S. Effect of diaphragm breathing exercise applied on the basis of overload principle. J. Phys. Ther. Sci. 2017, 29, 1054–1056. [Google Scholar] [CrossRef] [PubMed]
- Boiko, A.; Gaiduk, M.; Scherz, W.D.; Gentili, A.; Conti, M.; Orcioni, S.; Martínez Madrid, N.; Seepold, R. Monitoring of cardiorespiratory parameters during sleep using a special holder for the accelerometer sensor. Sensors 2023, 23, 5351. [Google Scholar] [CrossRef] [PubMed]
- Phan, D.H.; Bonnet, S.; Guillemaud, R.; Castelli, E.; Pham Thi, N.Y. Estimation of respiratory waveform and heart rate using an accelerometer. In Proceedings of the 30th Annual International Conference of the IEEE Engineering in Medicine and Biology Society, Vancouver, BC, Canada, 20–25 August 2008; pp. 4916–4919. [Google Scholar] [CrossRef]
- Droitcour, A.D.; Boric-Lubecke, O.; Kovacs, G.T.A. Signal-to-noise ratio in doppler radar system for heart and respiratory rate measurements. IEEE Trans. Microw. Theory Tech. 2009, 57, 2498–2507. [Google Scholar] [CrossRef]
- Heinz, C.; Reiner, M.; Belka, C.; Walter, F.; Söhn, M. Technical evaluation of different respiratory monitoring systems used for 4D CT acquisition under free breathing. J. Appl. Clin. Med. Phys. 2015, 16, 334–349. [Google Scholar] [CrossRef] [PubMed]
- Corbishley, P.; Rodriguez-Villegas, E. Breathing detection: Towards a miniaturized, wearable, battery-operated monitoring system. IEEE. Trans. Biomed. Eng. 2008, 55, 196–204. [Google Scholar] [CrossRef] [PubMed]
- Beaton, D.E.; Bombardier, C.; Katz, J.N.; Wright, J.G. A taxonomy for responsiveness. J. Clin. Epidemiol. 2001, 54, 1204–1217. [Google Scholar] [CrossRef] [PubMed]
- Dontje, M.L.; Dall, P.M.; Skelton, D.A.; Gill, J.M.R.; Chastin, S.F.M.; Seniors USP Team. Reliability, minimal detectable change and responsiveness to change: Indicators to select the best method to measure sedentary behaviour in older adults in different study designs. PLoS ONE 2018, 13, e0195424. [Google Scholar] [CrossRef] [PubMed]
- Derrick, T.R.; Thomas, J.M. Time-series analysis: The cross-correlation function. In Innovative Analyses of Human Movement, 1st ed.; Stergiou, N., Ed.; Human Kinetics Publishers: Champaign, IL, USA, 2004; pp. 189–205. [Google Scholar]
- McGraw, K.O.; Wong, S.P. Forming inferences about some intraclass correlation coefficients. Psychol. Methods 1996, 1, 30–46. [Google Scholar] [CrossRef]
- Pinsault, N.; Vuillerme, N. Test-retest reliability of centre of foot pressure measures to assess postural control during unperturbed stance. Med. Eng. Phys. 2009, 31, 276–286. [Google Scholar] [CrossRef]
- Fleiss, J.L. Reliability of measurement. In The Design and Analysis of Clinical Experiments; Fleiss, J.L., Ed.; Wiley: New York, NY, USA, 1986; pp. 1–32. [Google Scholar]
- Weir, J.P. Quantifying test-retest reliability using the intraclass correlation coefficient and the SEM. J. Strength Cond. Res. 2005, 19, 231–240. [Google Scholar] [CrossRef]
- Campos, M.H.; Giraldi, N.M.; Gentil, P.; de Lira, C.A.; Vieira, C.A.; de Paula, M.C. The geometric curvature of the spine during the sirshasana, the yoga’s headstand. J. Sports Sci. 2017, 35, 1134–1141. [Google Scholar] [CrossRef]
- Hopkins, W.G. Measures of reliability in sports medicine and science. Sports Med. 2000, 30, 1–15. [Google Scholar] [CrossRef]
- Furlan, L.; Sterr, A. The applicability of standard error of measurement and minimal detectable change to motor learning research-A behavioral study. Front. Hum. Neurosci. 2018, 12, 95. [Google Scholar] [CrossRef] [PubMed]
- Atkinson, G.; Nevill, A.M. Statistical methods for assessing measurement error (reliability) in variables relevant to sports medicine. Sports Med. 1998, 26, 217–238. [Google Scholar] [CrossRef]
- Jaworski, J.; Ambroży, T.; Lech, G.; Spieszny, M.; Bujas, P.; Żak, M.; ChwaŁa, W. Absolute and relative reliability of several measures of static postural stability calculated using a GYKO inertial sensor system. Acta Bioeng. Biomech. 2020, 22, 94–99. [Google Scholar] [CrossRef] [PubMed]
- Pooranawatthanakul, K.; Siriphorn, A. Comparisons of the validity and reliability of two smartphone placements for balance assessment using an accelerometer based application. Eur. J. Physiother. 2020, 22, 236–242. [Google Scholar] [CrossRef]
- Konno, K.; Mead, J. Measurement of the separate volume changes of rib cage and abdomen during breathing. J. Appl. Physiol. 1967, 22, 407–422. [Google Scholar] [CrossRef] [PubMed]
- LoMauro, A.; Aliverti, A. Sex differences in respiratory function. Breathe 2018, 14, 131–140. [Google Scholar] [CrossRef]
- Lakens, D. Calculating and reporting effect sizes to facilitate cumulative science: A practical primer for t-tests and ANOVAs. Front Psychol. 2013, 4, 863. [Google Scholar] [CrossRef]
- Cohen, J. Statistical Power Analysis for the Behavioral Sciences, 2nd ed.; Lawrence Erlbaum Associates Inc.: Mahwah, NJ, USA, 1988; pp. 24–27. [Google Scholar] [CrossRef]
Figure 1.
Men and women participants in the head-standing body stance. (A,B) during normal breathing and (C,D) during diaphragmatic breathing where the abdomen wall expansion is visible. The anatomical calibration of the sensor is described in the second paragraph of the data collection section.
Figure 1.
Men and women participants in the head-standing body stance. (A,B) during normal breathing and (C,D) during diaphragmatic breathing where the abdomen wall expansion is visible. The anatomical calibration of the sensor is described in the second paragraph of the data collection section.

Figure 2.
Sample pre- and post-filtering time series signals (raw and filtered, respectively), as well as after the offset removal, for the 3D angular displacement (roll, pitch, and yaw: forward, outward, and downward abdominal expansion, respectively) in erect standing during normal (top) and diaphragmatic (bottom) breathing.

Figure 3.
Sample pre- and post-filtering time series signals (raw and filtered, respectively), as well as after the offset removal, for the 3D angular displacement (roll, pitch, and yaw: forward, outward, and downward abdominal expansion, respectively) in head standing during normal (top) and diaphragmatic (bottom) breathing.

Figure 4.
Mean (SD) of the angular displacement (AD) path length of the roll, pitch, and yaw Euler angles as well as their resultant for each condition of body stance and breathing type. The anatomical expansion of the abdomen wall during diaphragmatic inspiration is noted. The body stance effect and breathing type effect were both significant (p ≤ 0.01 for all), with no significant interaction between them (p > 0.05). EN: Erect standing–Normal breathing, ED: Erect standing–Diaphragmatic breathing, HN: Head standing–Normal breathing, and HD: Head standing–Diaphragmatic breathing.

Figure 5.
Mean (SD) of the individual coefficient of variation (%CVind) (bottom) of the roll, pitch, and yaw Euler angles, as well as their resultant, for each condition of body stance and breathing type. The anatomical expansion of the abdomen wall during diaphragmatic inspiration is noted. Neither the main effects of body stance and breathing type nor their interaction were significant (p > 0.05). EN: Erect standing–Normal breathing, ED: Erect standing–Diaphragmatic breathing, HN: Head standing–Normal breathing, and HD: Head standing–Diaphragmatic breathing.

Figure 6.
Diaphragmatic to normal breathing ratio of the angular displacement (AD) path length in erect standing (E-D/N: black bars) and head standing (H-D/N: grey bars). The anatomical expansion of the abdomen wall during diaphragmatic inspiration is noted. The ratio indicates the times that the AD path was increased in diaphragmatic compared to normal breathing. * significant difference between E-D/N and H-D/N at p ≤ 0.05.

Figure 7.
Boxplots of the mean coefficient of cross-correlation between pairs of trials in each condition. The box indicates the interquartile range of the values (IQR: 50% of the values lie within 0.6745 standard deviation). The horizontal line in the box indicates the median and the x symbol indicates the mean. The whiskers extend up from the top of the box to the largest data element that is less than or equal to 1.5 times the IQR and down from the bottom of the box to the smallest data element that is larger than 1.5 times the IQR. The filled circles indicate values, with those outside the whiskers considered as outliers. The anatomical expansion of the abdomen wall during diaphragmatic inspiration is noted. EN: Erect standing–Normal breathing, ED: Erect standing–Diaphragmatic breathing, HN: Head standing–Normal breathing, and HD: Head standing–Diaphragmatic breathing. Overall, with a very small number of exceptions, the cross-correlations were significant (p ≤ 0.05).

Figure 8.
Right: Relative reliability of the AD path length (black squares indicate ICC with the vertical lines denoting the upper and lower bounds of its 95% confidence interval). Left: Absolute reliability of the AD path length (black circles indicate %SEM with the vertical lines denoting the upper and lower bounds of its 95% confidence interval) with the relative minimal detectable change (%MDC90) indicated by the × index. Results are presented for the roll, pitch, and yaw Euler angles as well as their resultants in EN: Erect standing–Normal breathing, ED: Erect standing–Diaphragmatic breathing, HN: Head standing–Normal breathing, and HD: Head standing–Diaphragmatic breathing.

Table 1.
Personal characteristics of the participants (N = 28).
| a/a | Gender | Age (y) | Body Mass (kg) | Body Height (m) | Body Mass Index (kg/m2) | * BMI Classification | Headstand History Experience | Headstand Practice Experience | Diaphragmatic Breathing Experience |
|---|---|---|---|---|---|---|---|---|---|
| S01 | F | 26 | 63.0 | 1.61 | 24.3 | Normal | 1–2 years | Personal Practice | <6 months |
| S02 | F | 25 | 57.5 | 1.68 | 20.4 | Normal | >8 years | Artistic Gymnastics | <1 year |
| S03 | M | 29 | 79.0 | 1.78 | 24.9 | Normal | >8 years | Artistic Gymnastics | <6 months |
| S04 | F | 21 | 55.0 | 1.60 | 21.5 | Normal | 5–7 years | Artistic Gymnastics | <6 months |
| S05 | F | 25 | 51.0 | 1.67 | 18.3 | Underweight | 5–7 years | Artistic Swimming | <1 year |
| S06 | M | 27 | 80.7 | 1.80 | 24.9 | Normal | <1 years | Personal Practice | <6 months |
| S07 | M | 34 | 68.3 | 1.67 | 24.5 | Normal | >8 years | Artistic Gymnastics | <6 months |
| S08 | F | 33 | 52.0 | 1.58 | 20.8 | Normal | 1–2 years | Yoga | 2–4 years |
| S09 | M | 41 | 72.0 | 1.82 | 21.7 | Normal | 2–4 years | Yoga | >8 years |
| S10 | F | 21 | 54.0 | 1.67 | 19.4 | Normal | 1–2 years | Yoga | 1–2 years |
| S11 | F | 37 | 64.0 | 1.67 | 22.9 | Normal | >8 years | Yoga | >8 years |
| S12 | F | 22 | 72.5 | 1.72 | 24.5 | Normal | >8 years | Rhythmic Gymnastics | <6 months |
| S13 | F | 18 | 60.0 | 1.60 | 23.4 | Normal | 2–4 years | Yoga | 2–4 years |
| S14 | M | 51 | 64.0 | 1.80 | 19.8 | Normal | 5–4 years | Yoga | 5–7 years |
| S15 | F | 22 | 65.0 | 1.70 | 22.5 | Normal | <1 years | Yoga | <1 year |
| S16 | F | 20 | 63.0 | 1.73 | 21.0 | Normal | 2–4 years | Yoga | 2–4 years |
| S17 | F | 20 | 54.0 | 1.64 | 20.1 | Normal | 2–4 years | Rhythmic Gymnastics | <6 months |
| S18 | F | 19 | 67.0 | 1.69 | 23.5 | Normal | >8 years | Rhythmic Gymnastics | <6 months |
| S19 | F | 19 | 62.0 | 1.72 | 21.0 | Normal | 5–7 years | Artistic Gymnastics | <6 months |
| S20 | M | 33 | 72.0 | 1.70 | 24.9 | Normal | 5–7 years | Yoga | >8 years |
| S21 | F | 18 | 66.0 | 1.79 | 20.6 | Normal | >8 years | Artistic Gymnastics | <6 months |
| S22 | F | 20 | 68.0 | 1.78 | 21.5 | Normal | >8 years | Rhythmic Gymnastics | 2–4 years |
| S23 | F | 20 | 49.5 | 1.59 | 19.6 | Normal | 2–4 years | Artistic Gymnastics | <6 months |
| S24 | M | 26 | 55.0 | 1.53 | 23.5 | Normal | >8 years | Artistic Gymnastics | >8 years |
| S25 | F | 18 | 57.0 | 1.62 | 21.7 | Normal | 2–4 years | Breakdance | <6 months |
| S26 | F | 23 | 49.7 | 1.64 | 18.5 | Underweight | >8 years | Artistic Gymnastics | <6 months |
| S27 | F | 22 | 58.4 | 1.65 | 21.5 | Normal | >8 years | Artistic Gymnastics | <6 months |
| S28 | M | 20 | 76.5 | 1.80 | 23.6 | Normal | 5–7 years | Personal Practice | <6 months |
* According to the World Health Organization, https://www.who.int/data/gho/data/themes/topics/topic-details/GHO/body-mass-index, accessed on 10 August 2023.
Table 2.
Signal to noise ratio pre- and post-bandpass (0.1 Hz–0.5 Hz) signal filtering *.
| Filtering Condition | Experimental Condition | Signal to Noise Ratio (dB) | |||
|---|---|---|---|---|---|
| Roll | Pitch | Yaw | Resultant | ||
| Pre-Filtering | EN | 13 | 14 | 10 | 12 |
| ED | 19 | 18 | 19 | 16 | |
| HN | 6 | 6 | 5 | 6 | |
| HD | 7 | 6 | 7 | 6 | |
| Post-Filtering | ED | 93 | 110 | 101 | 96 |
| HN | 47 | 41 | 38 | 36 | |
| HD | 44 | 39 | 44 | 37 | |
| EN | 79 | 81 | 69 | 64 | |
* Matlab 2022b, https://www.mathworks.com/help/signal/ref/bandpass.html, accessed on 24 December 2023.
Disclaimer/Publisher’s Note: The statements, opinions and data contained in all publications are solely those of the individual author(s) and contributor(s) and not of MDPI and/or the editor(s). MDPI and/or the editor(s) disclaim responsibility for any injury to people or property resulting from any ideas, methods, instructions or products referred to in the content. |
© 2024 by the authors. Licensee MDPI, Basel, Switzerland. This article is an open access article distributed under the terms and conditions of the Creative Commons Attribution (CC BY) license (https://creativecommons.org/licenses/by/4.0/).
Share and Cite
MDPI and ACS Style
Rousanoglou, E.; Foskolou, A.; Emmanouil, A.; Boudolos, K. Inertial Sensing of the Abdominal Wall Kinematics during Diaphragmatic Breathing in Head Standing. Biomechanics 2024, 4, 63-83. https://doi.org/10.3390/biomechanics4010005
AMA Style
Rousanoglou E, Foskolou A, Emmanouil A, Boudolos K. Inertial Sensing of the Abdominal Wall Kinematics during Diaphragmatic Breathing in Head Standing. Biomechanics. 2024; 4(1):63-83. https://doi.org/10.3390/biomechanics4010005
Chicago/Turabian StyleRousanoglou, Elissavet, Apostolina Foskolou, Analina Emmanouil, and Konstantinos Boudolos. 2024. "Inertial Sensing of the Abdominal Wall Kinematics during Diaphragmatic Breathing in Head Standing" Biomechanics 4, no. 1: 63-83. https://doi.org/10.3390/biomechanics4010005