
Transition Mutations in the hTERT Promoter Are Unrelated to Potential i-motif Formation in the C-Rich Strand
 , and
, and 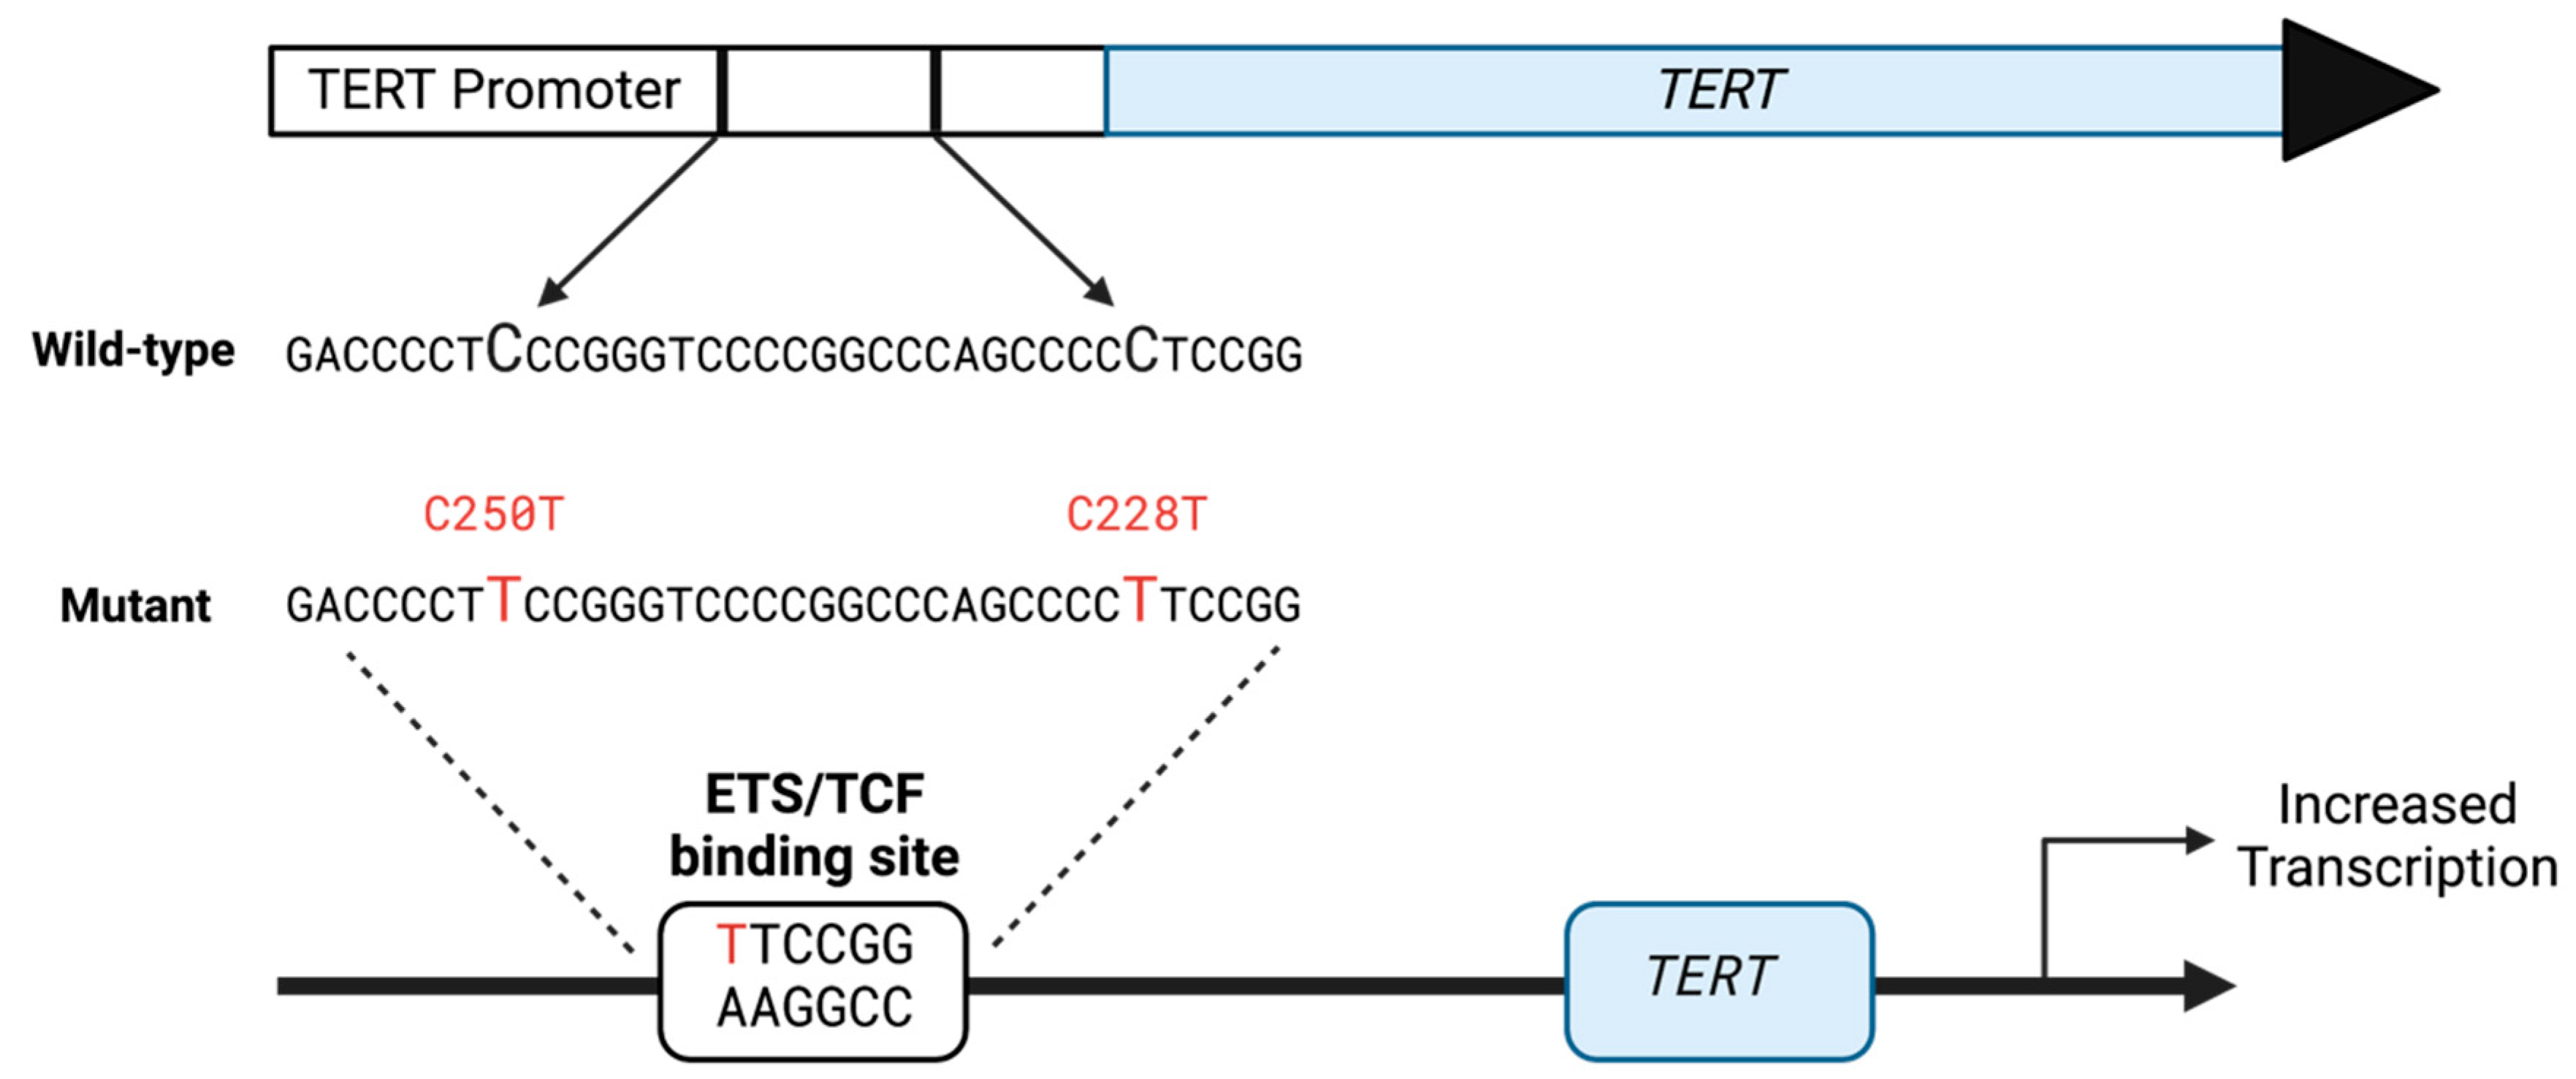
Abstract
:1. Introduction
2. Material and Methods
2.1. Computational Studies
2.2. Oligonucleotide Synthesis and Purification
2.3. Examination of Oligonucleotide Configurations in Aqueous Solution Using CD and UV
2.4. Oligonucleotide Incubation to Increase C-to-T Mutations
2.5. Detection of Cytosine Deamination by Sequencing
2.6. Statistical Analysis
3. Results and Discussion
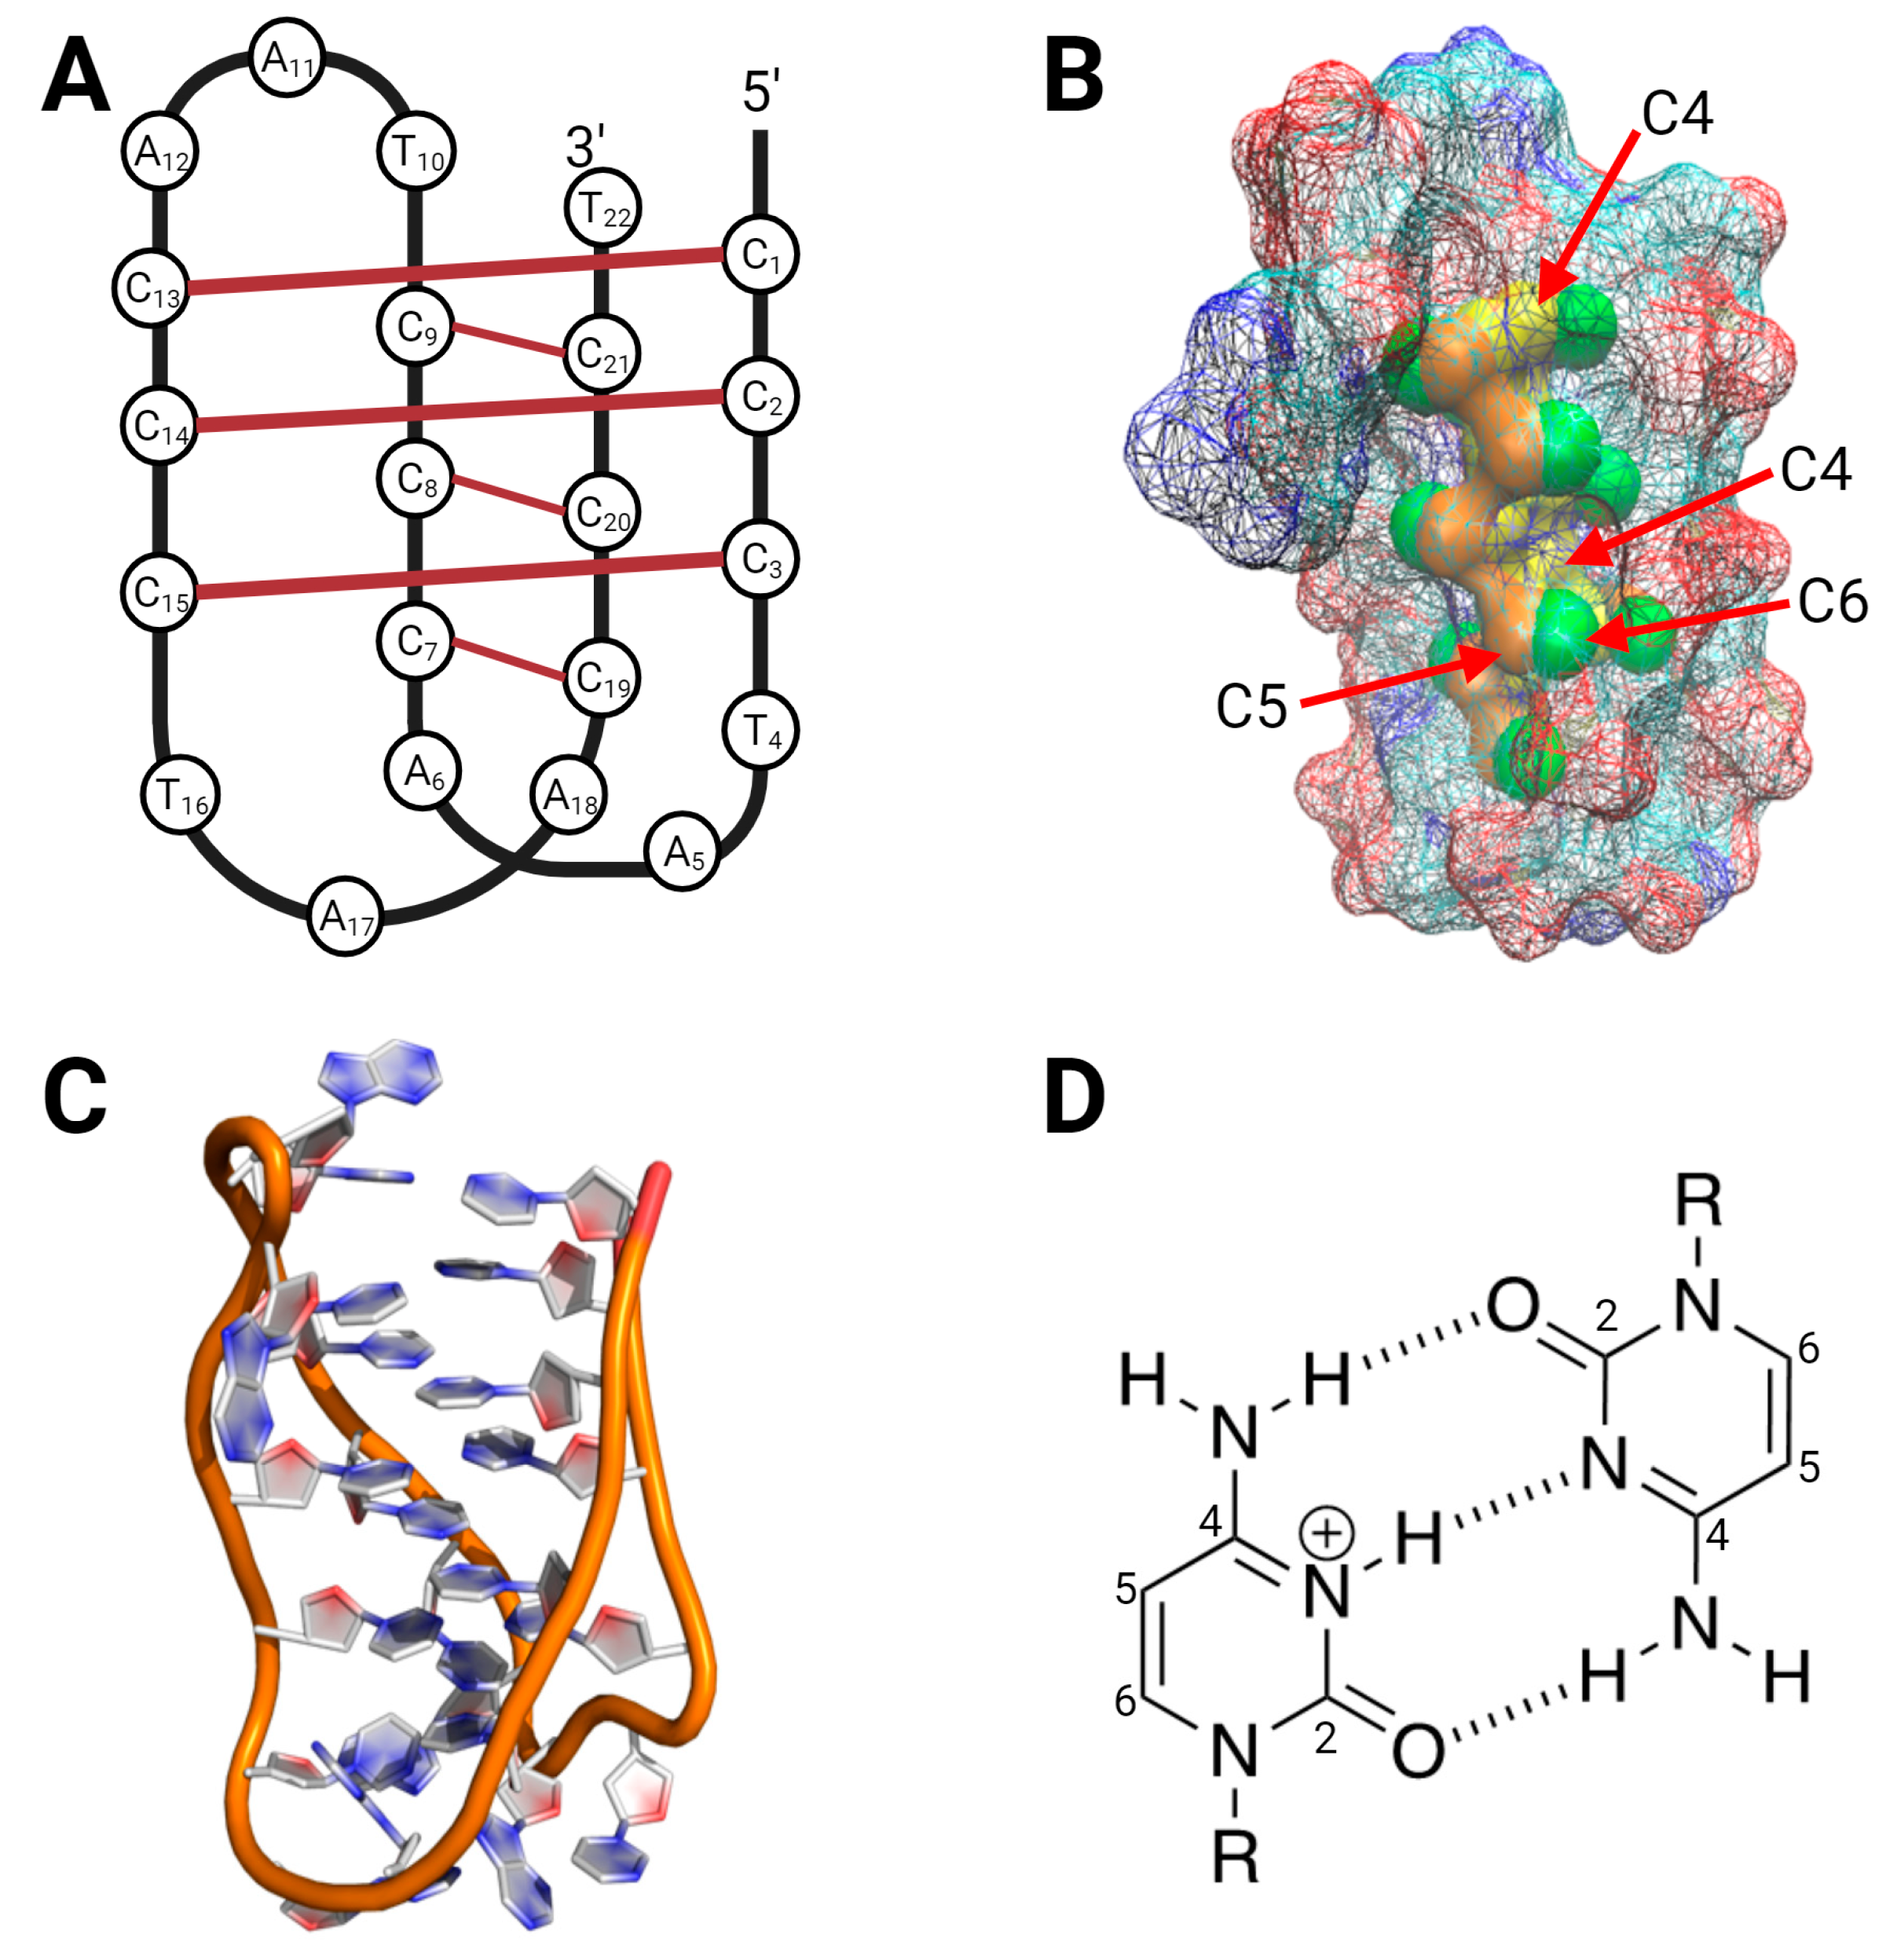
3.1. Oligonucleotide Computational Studies
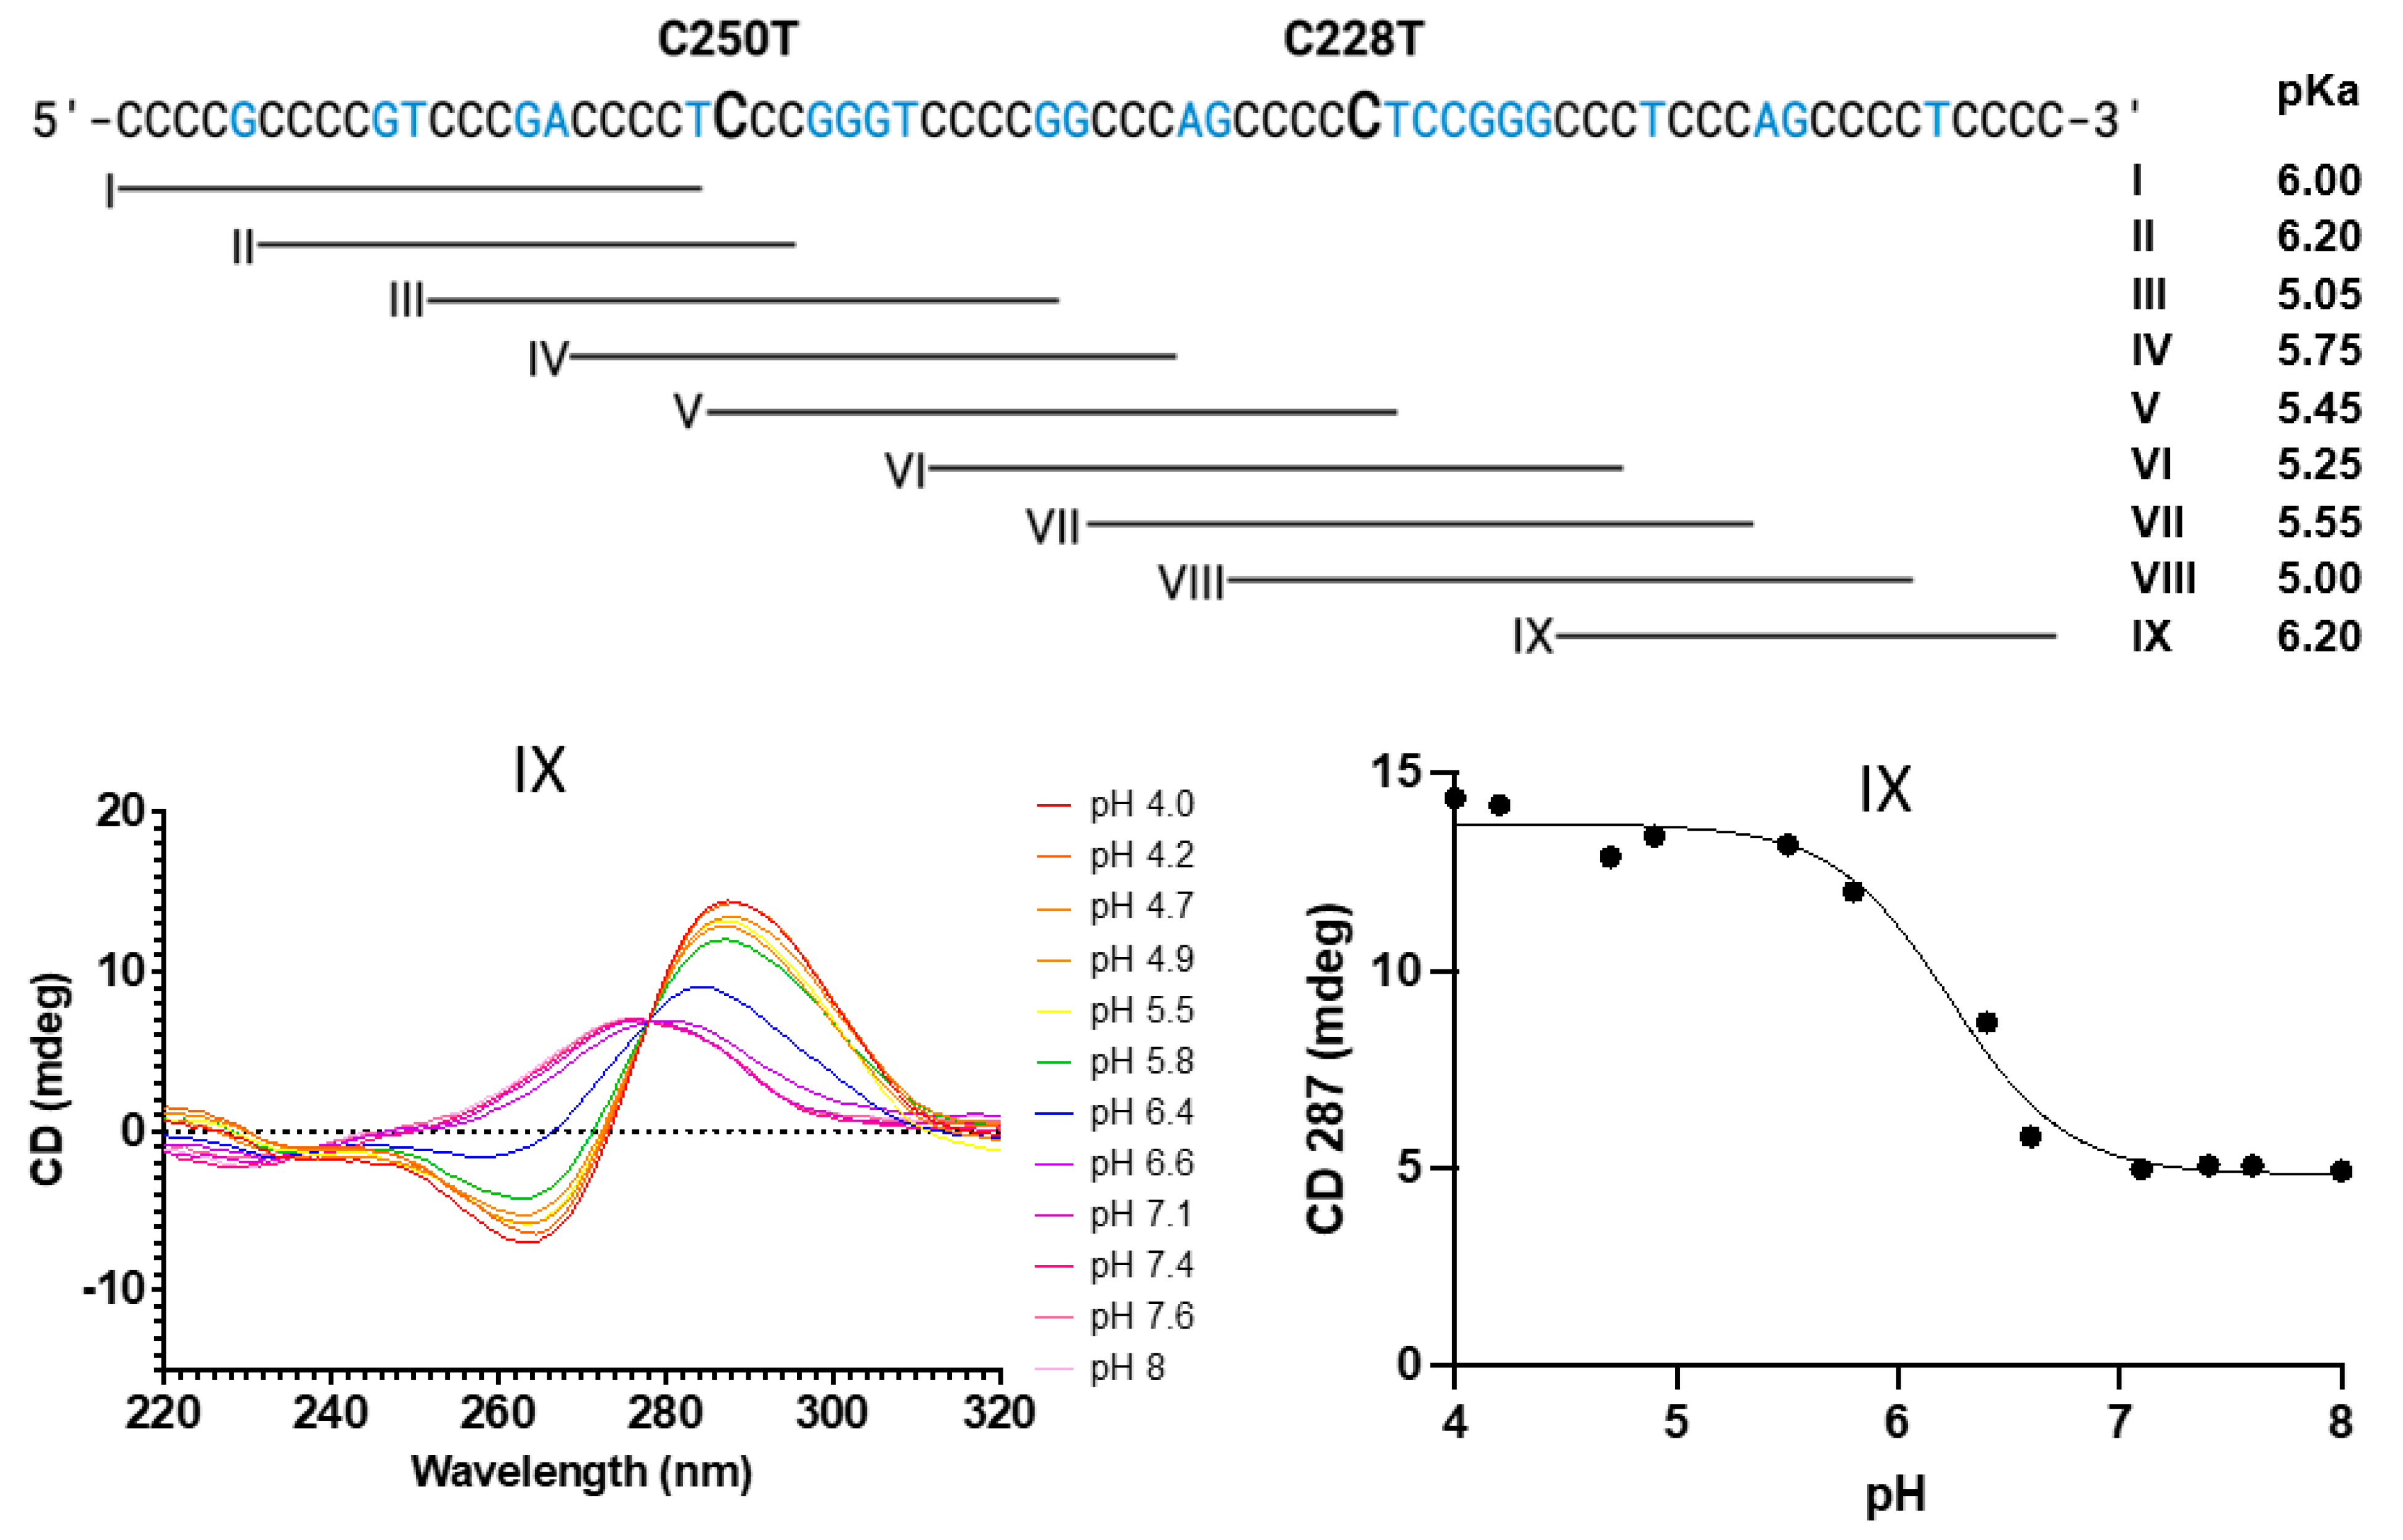
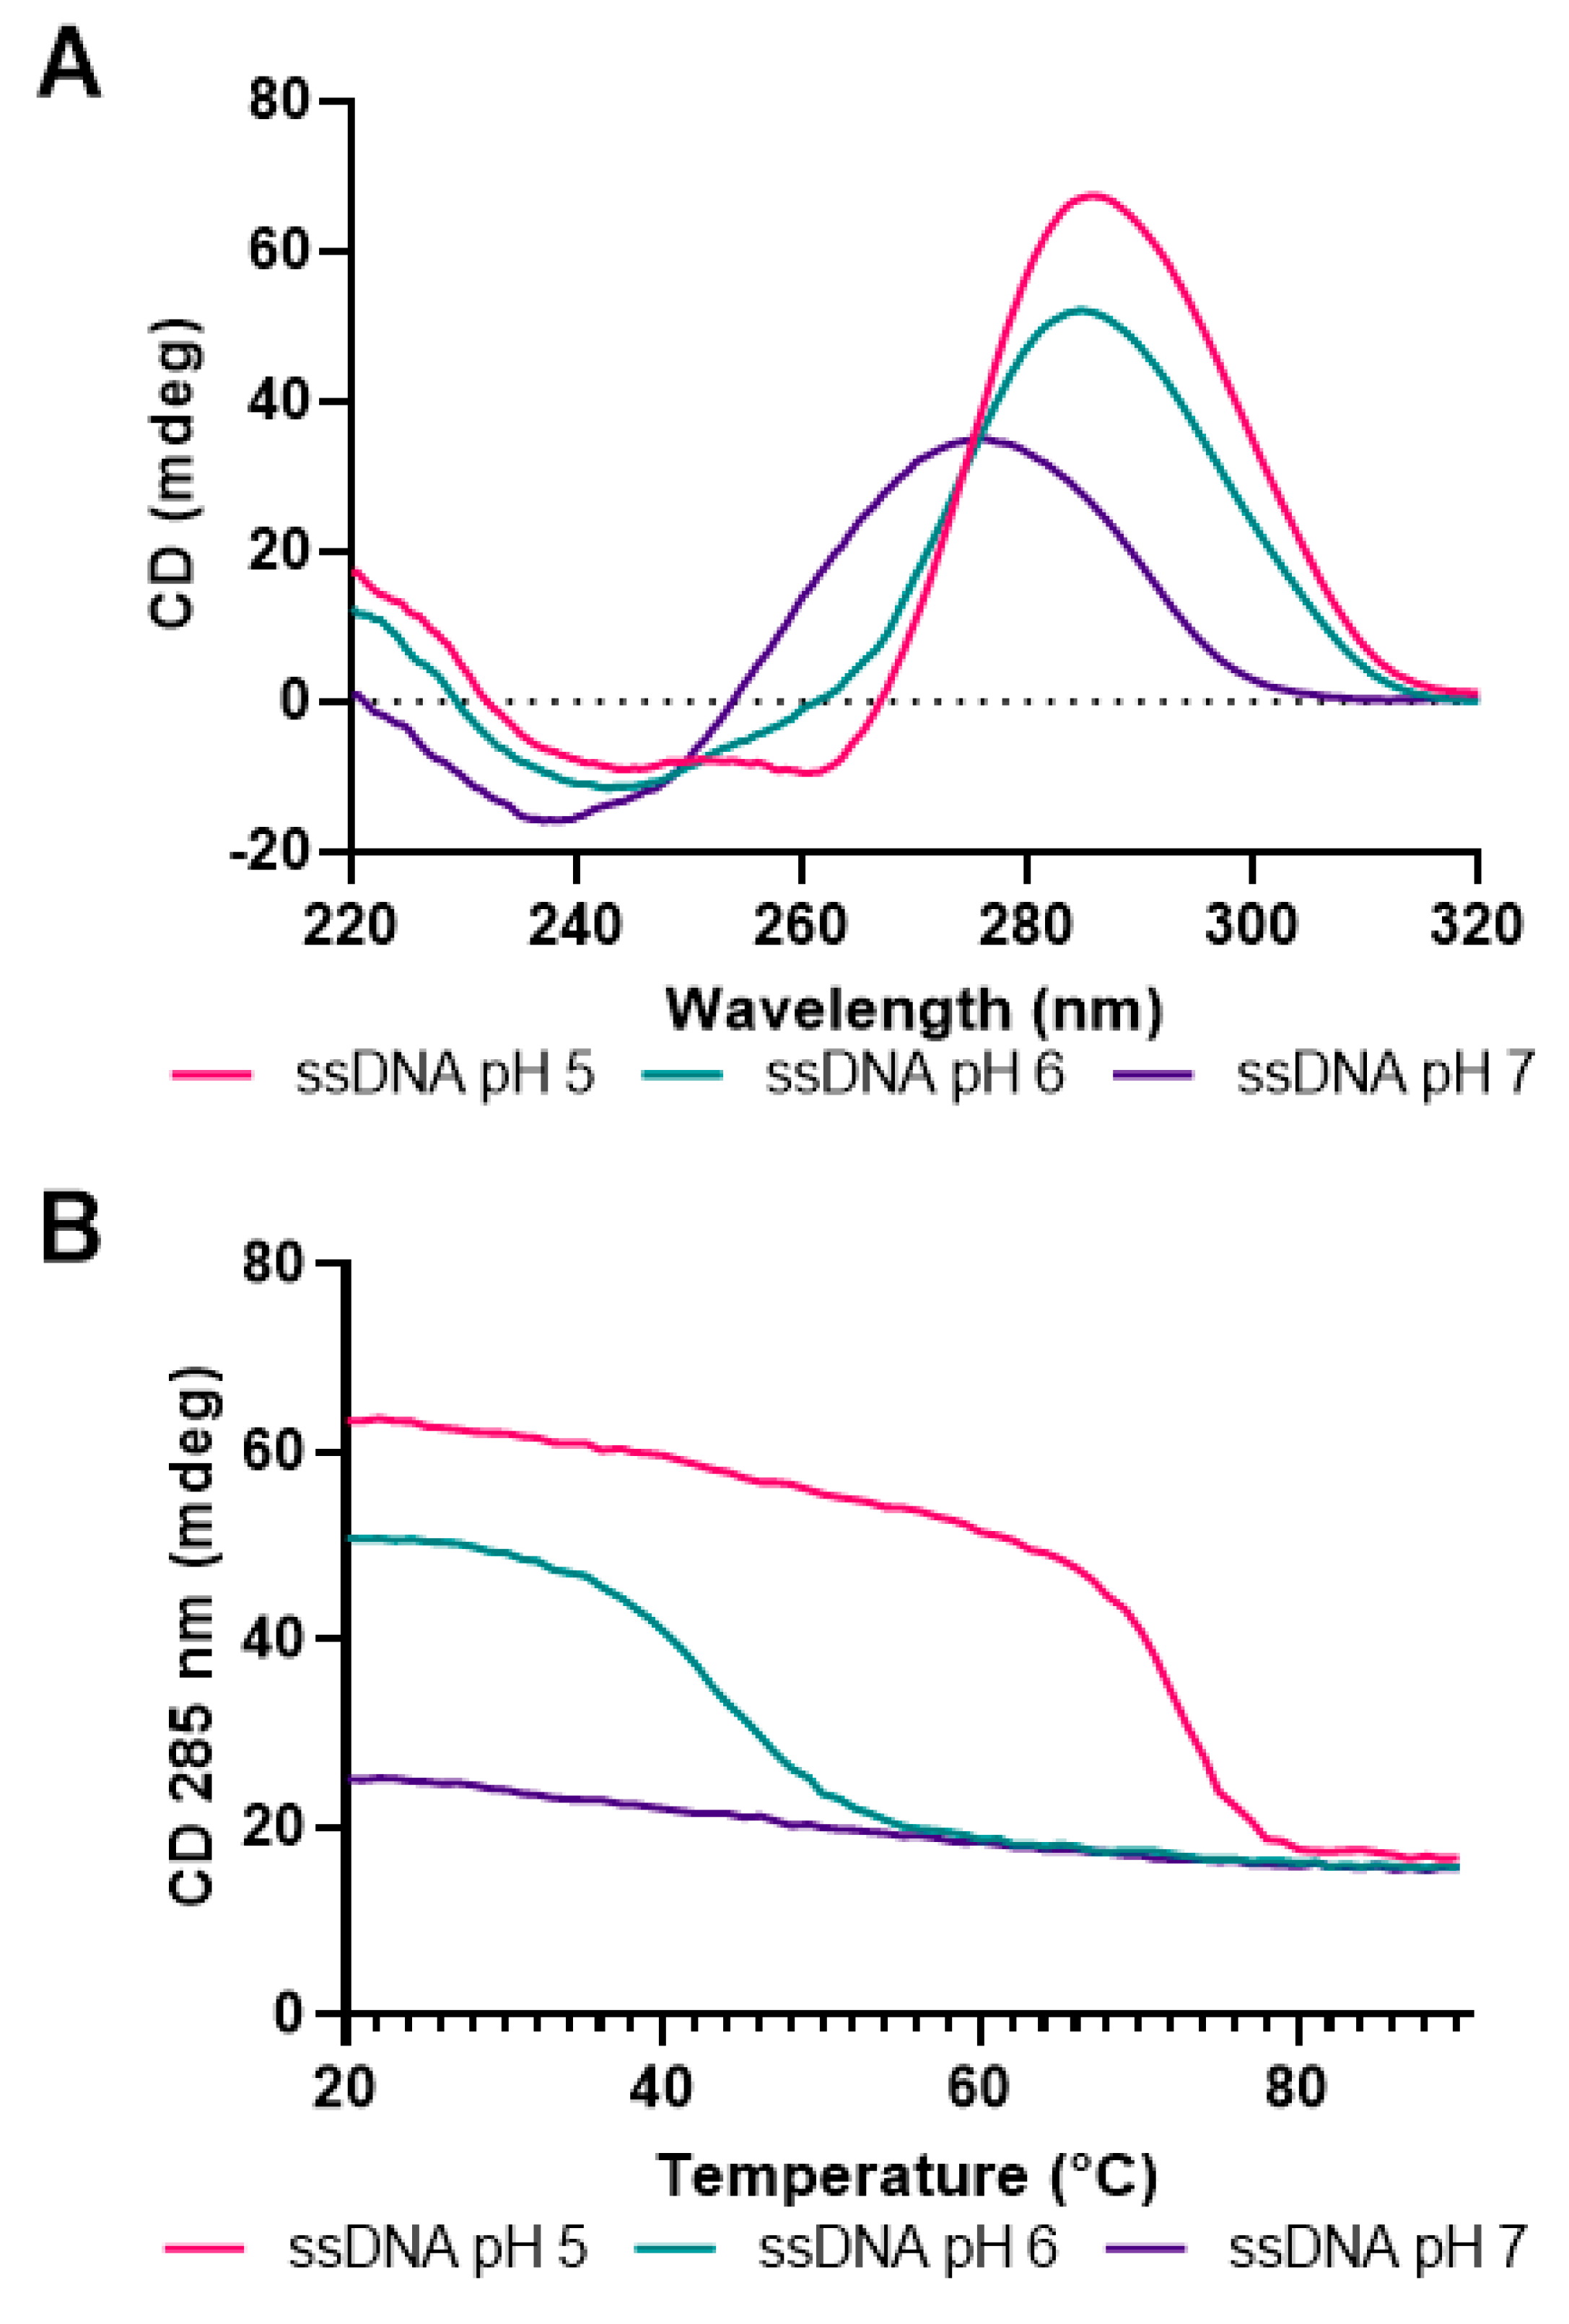
3.2. Formation of i-Motifs by Regions of the hTERT Promoter as Studied by UV and CD Spectroscopy
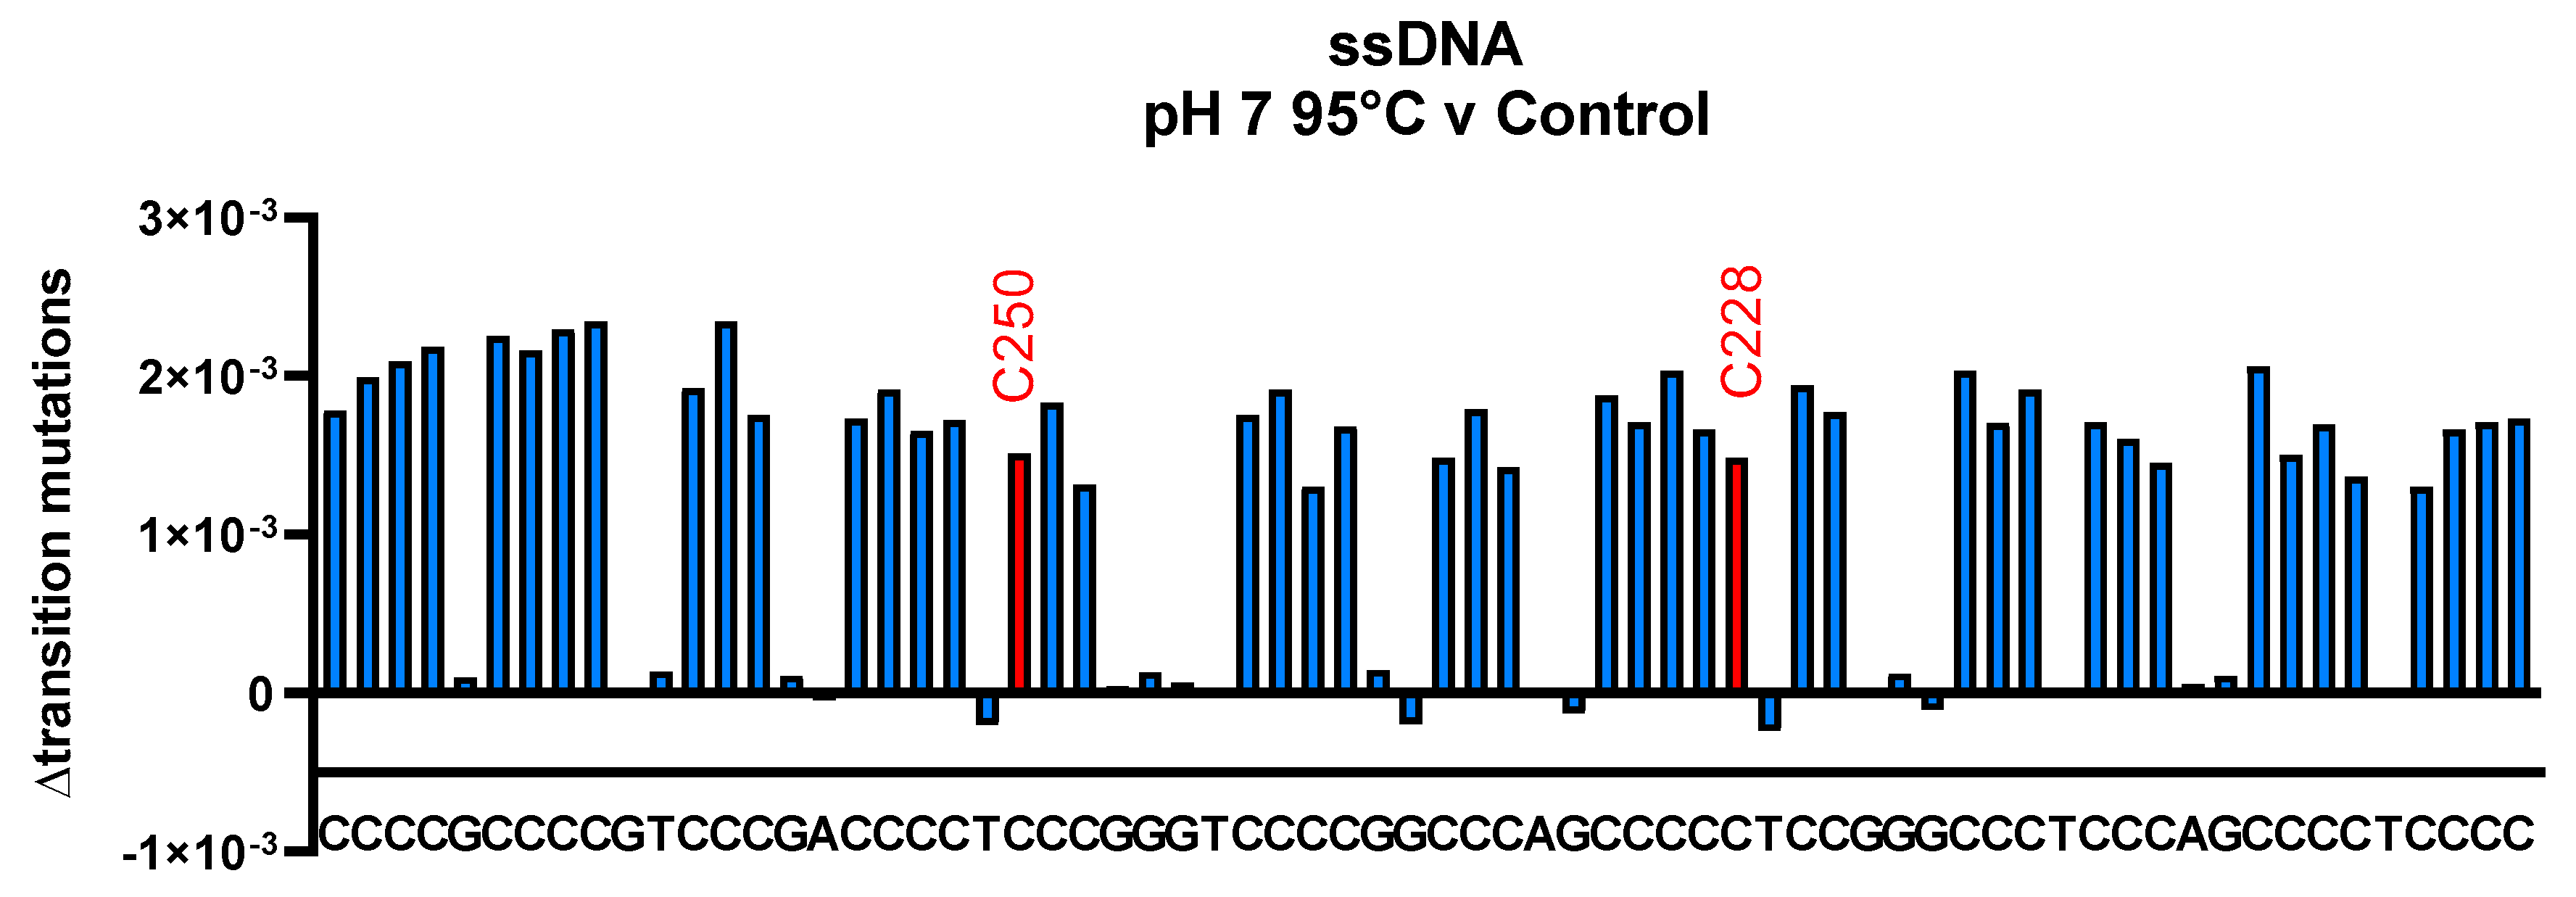
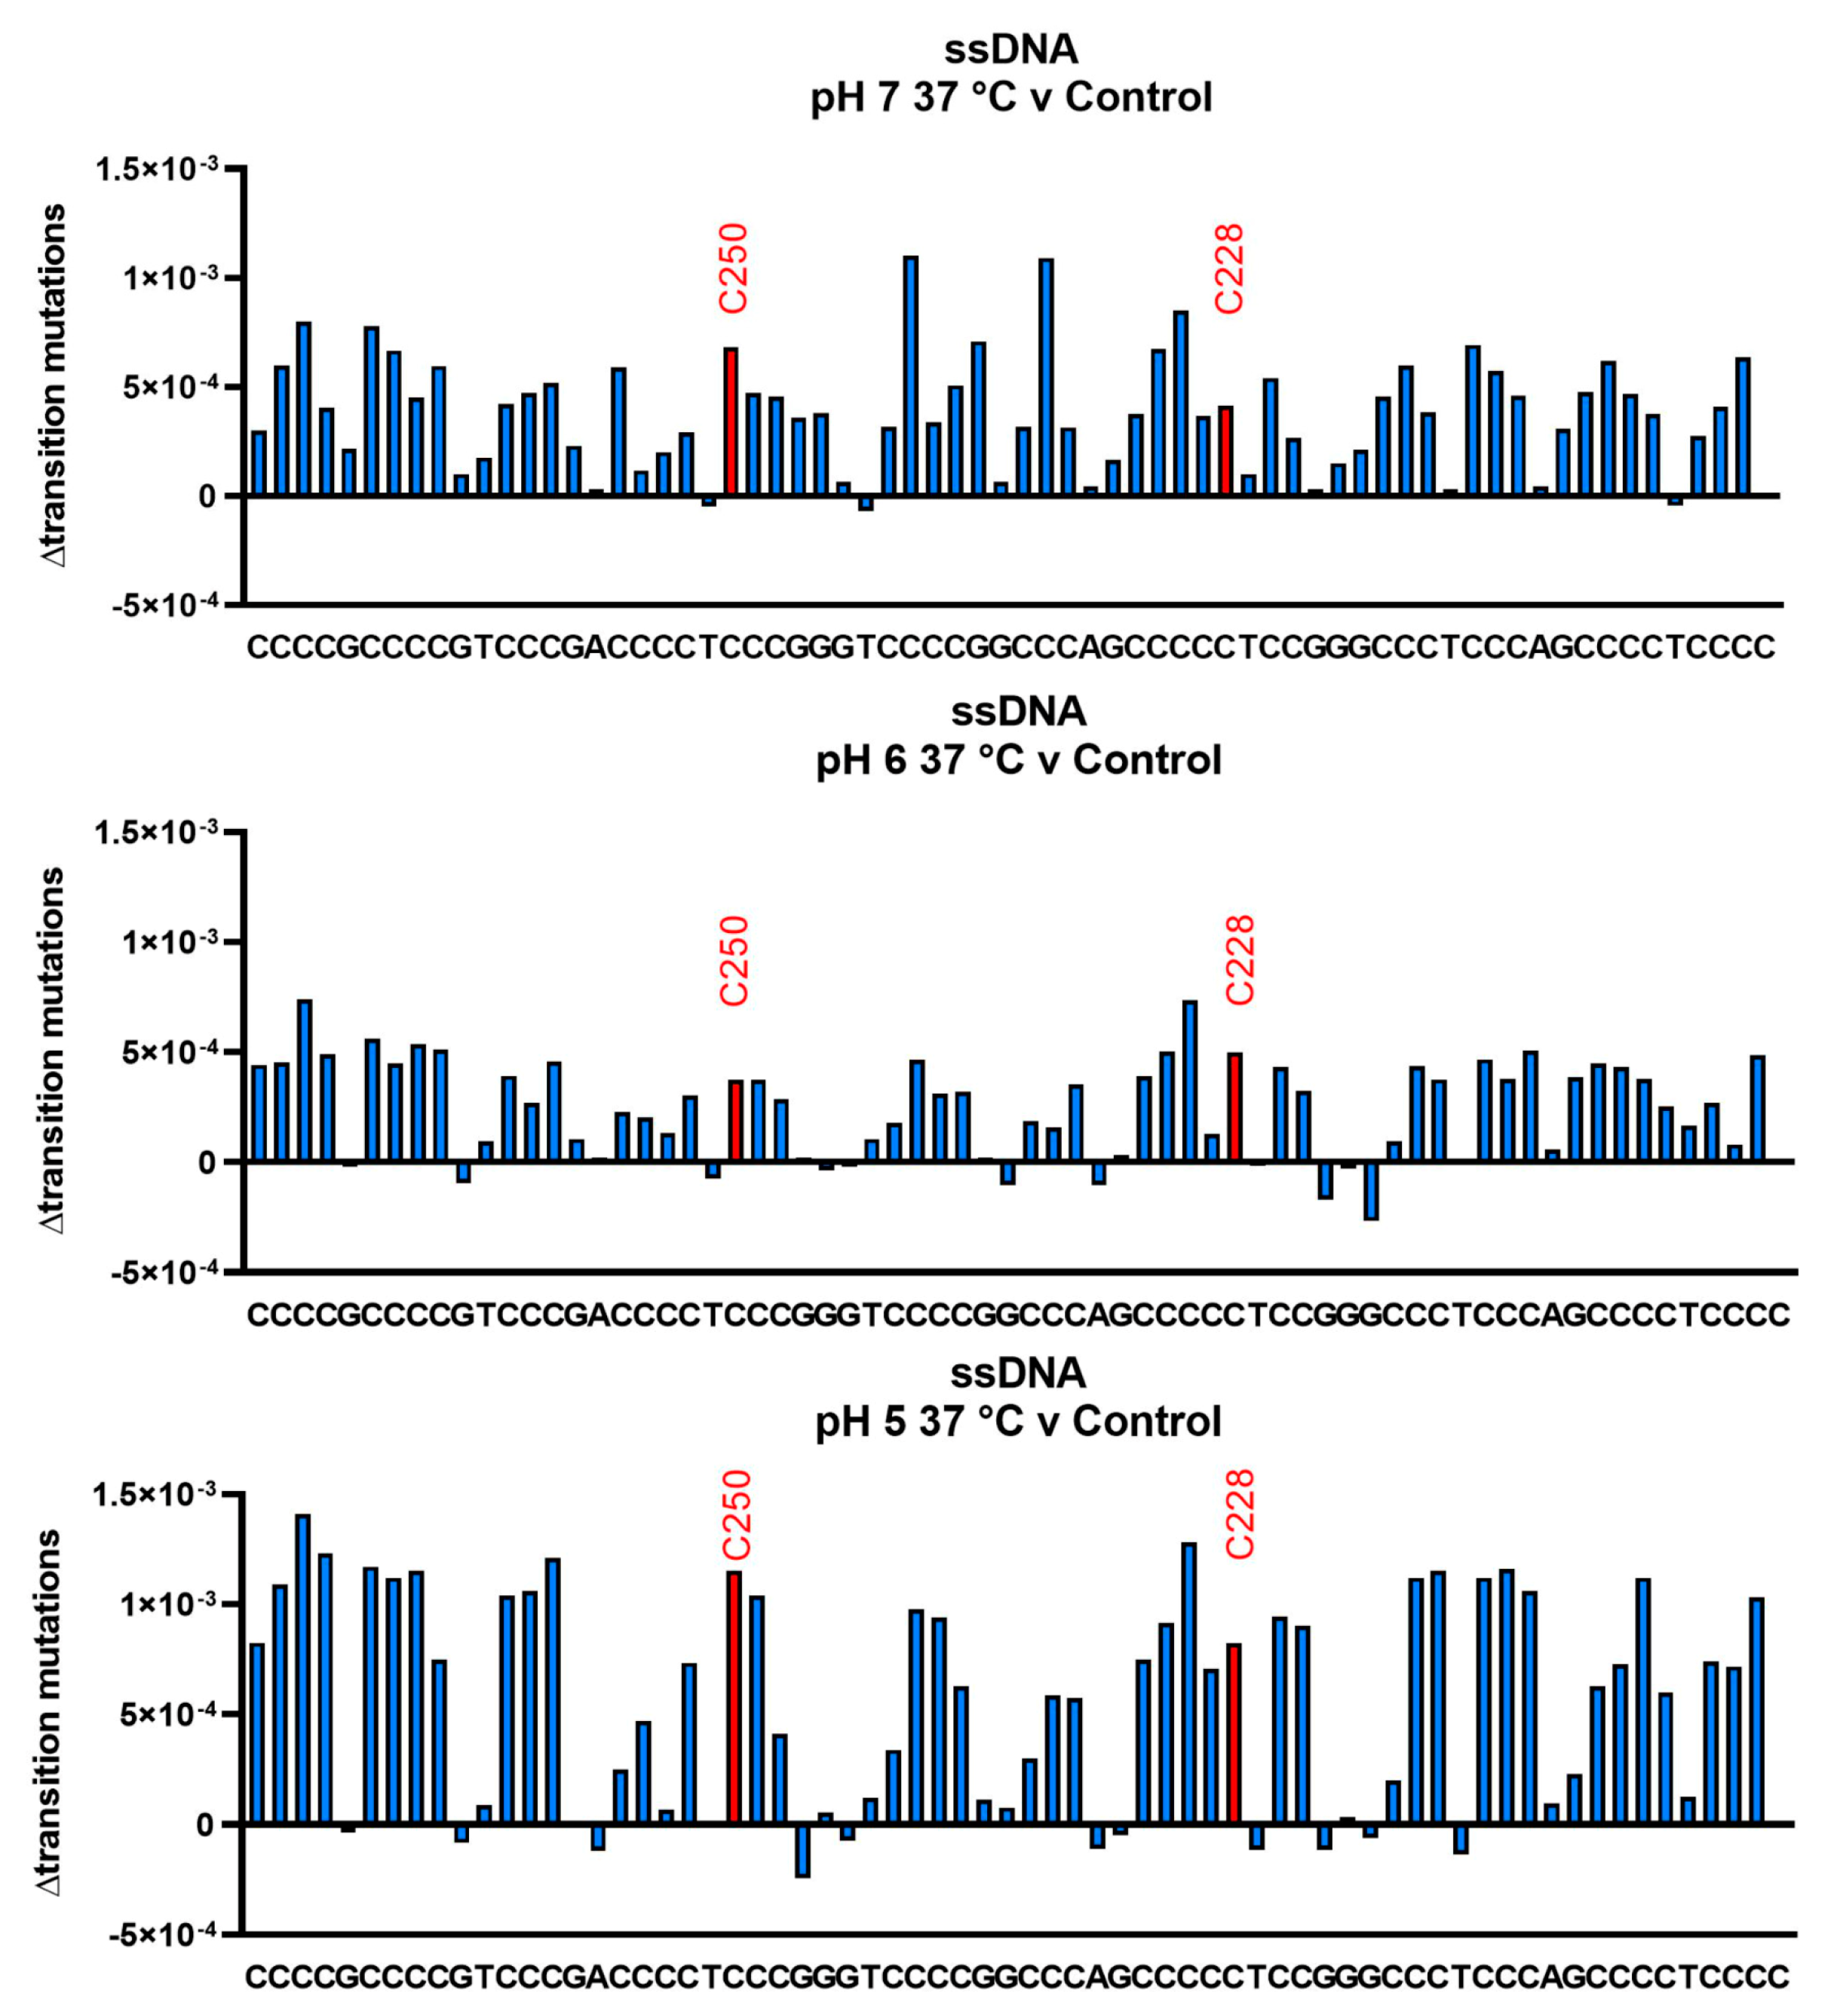
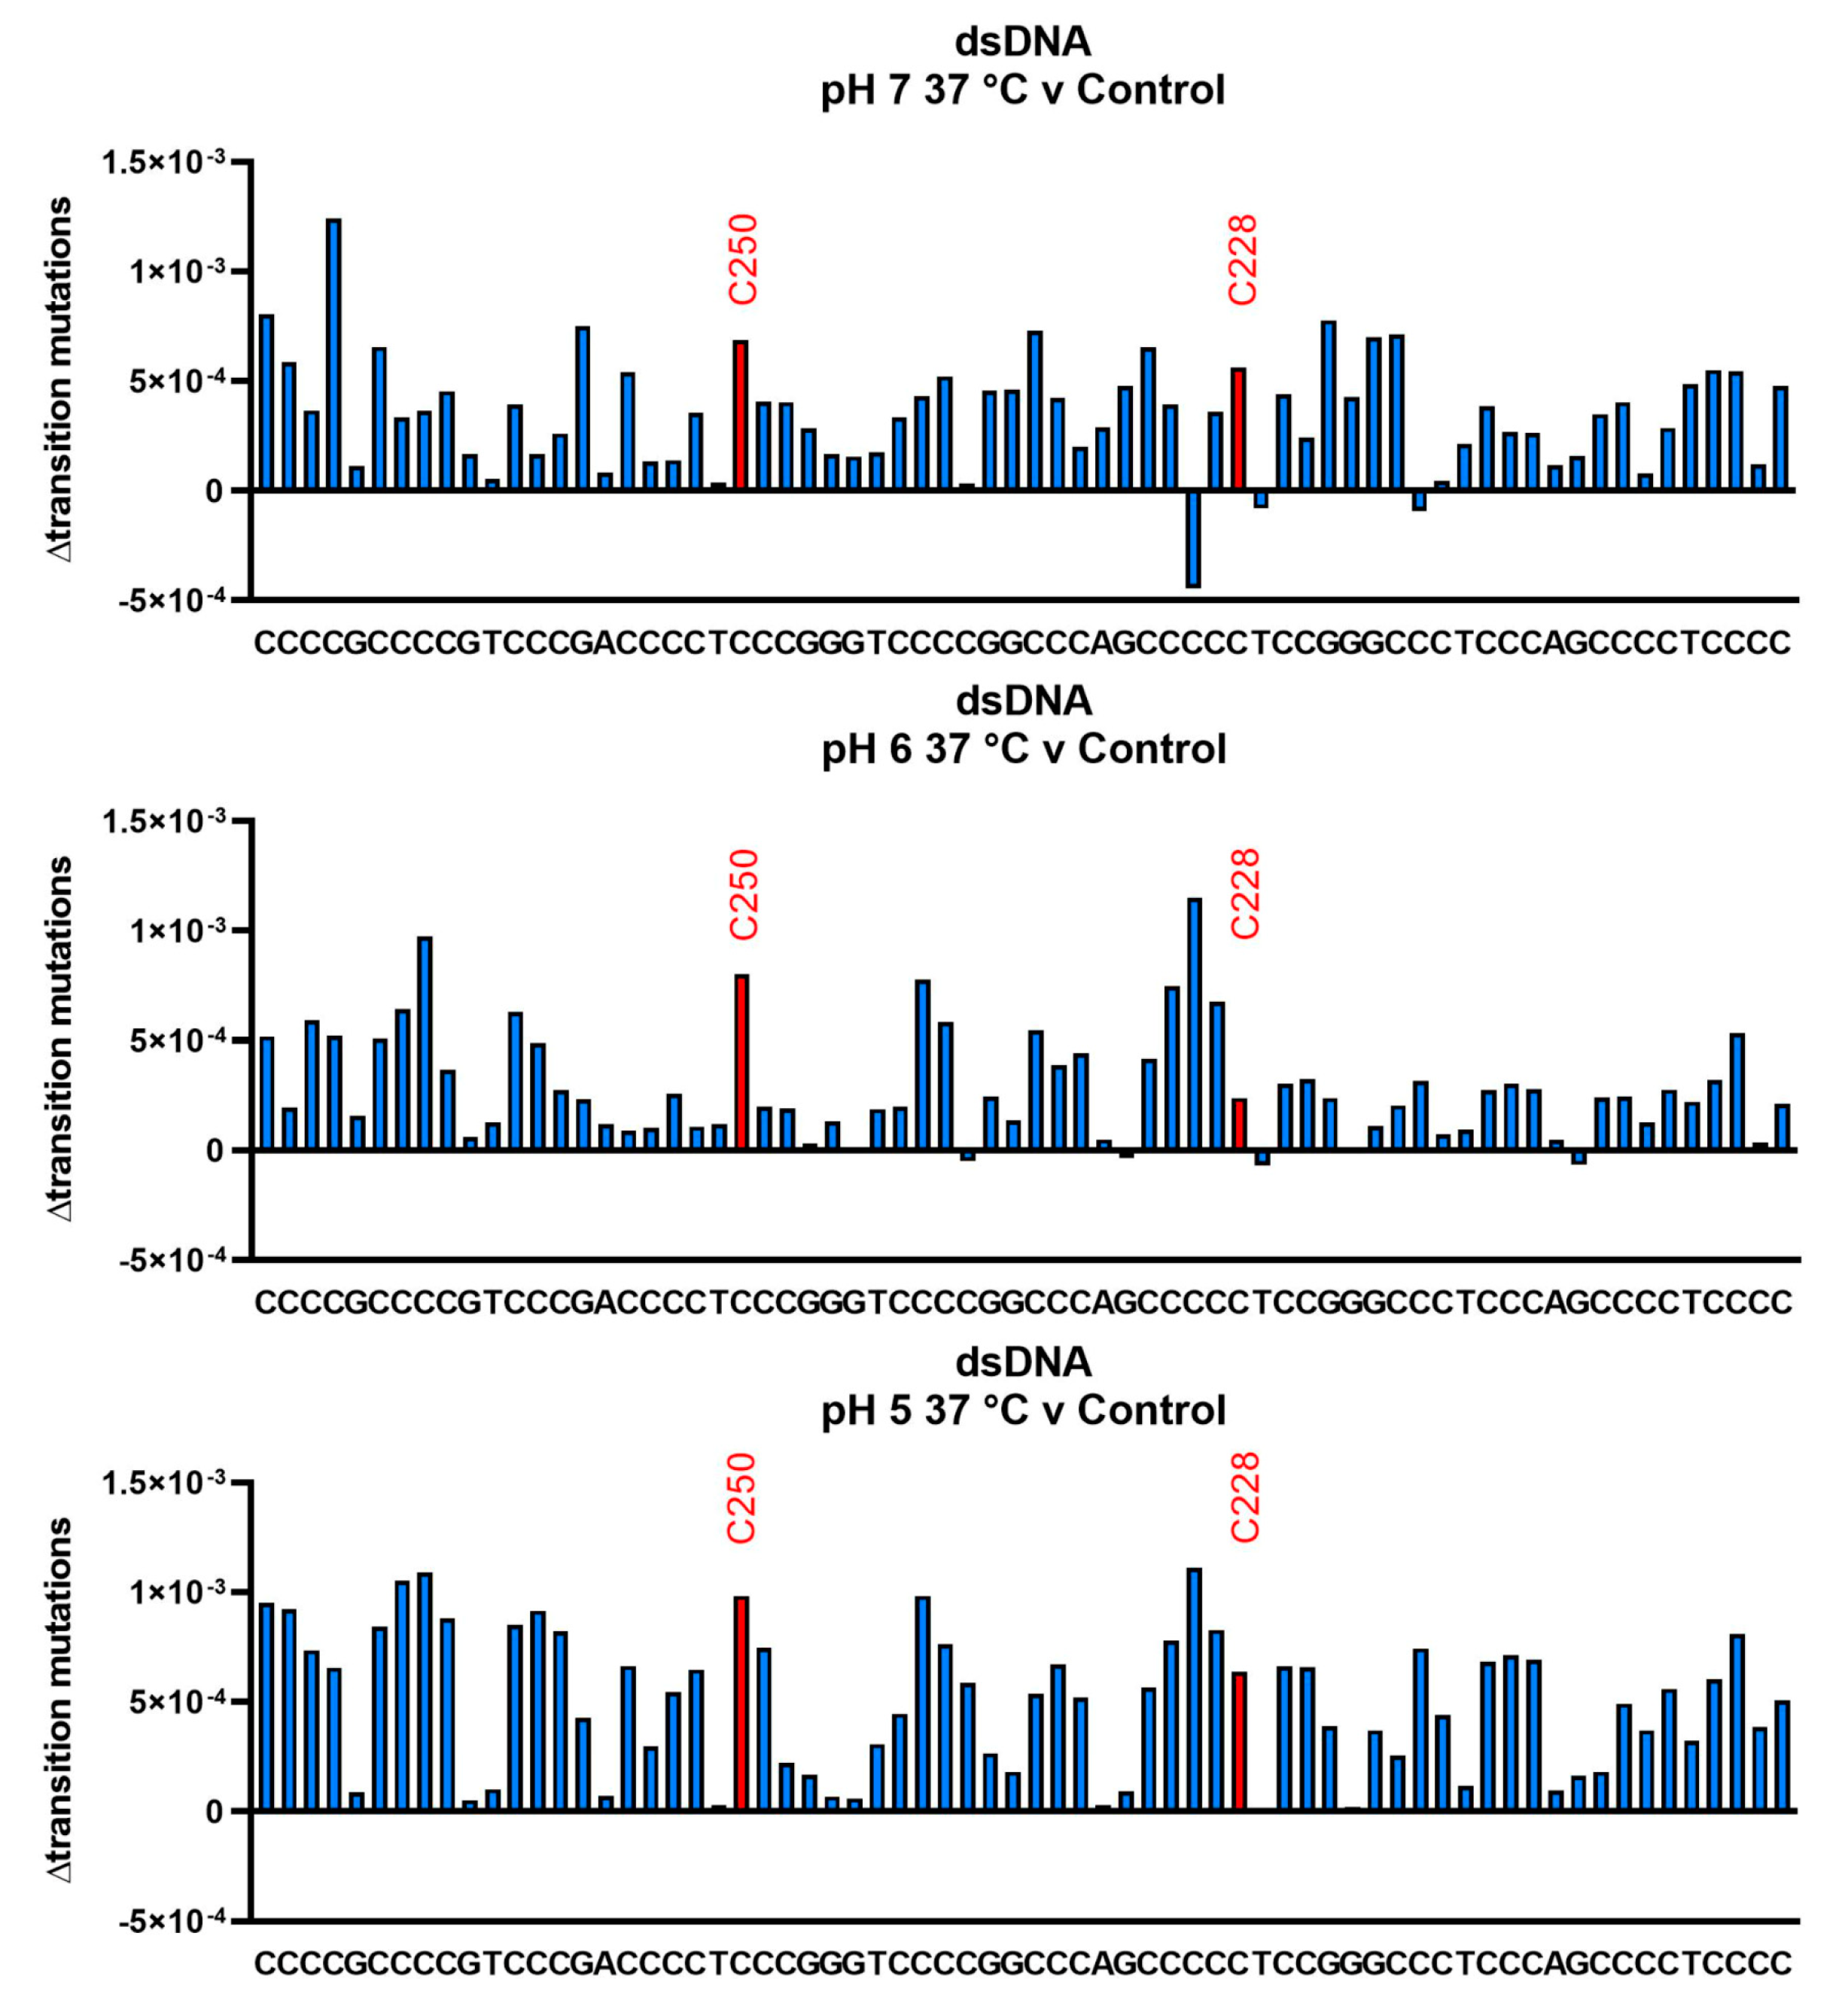
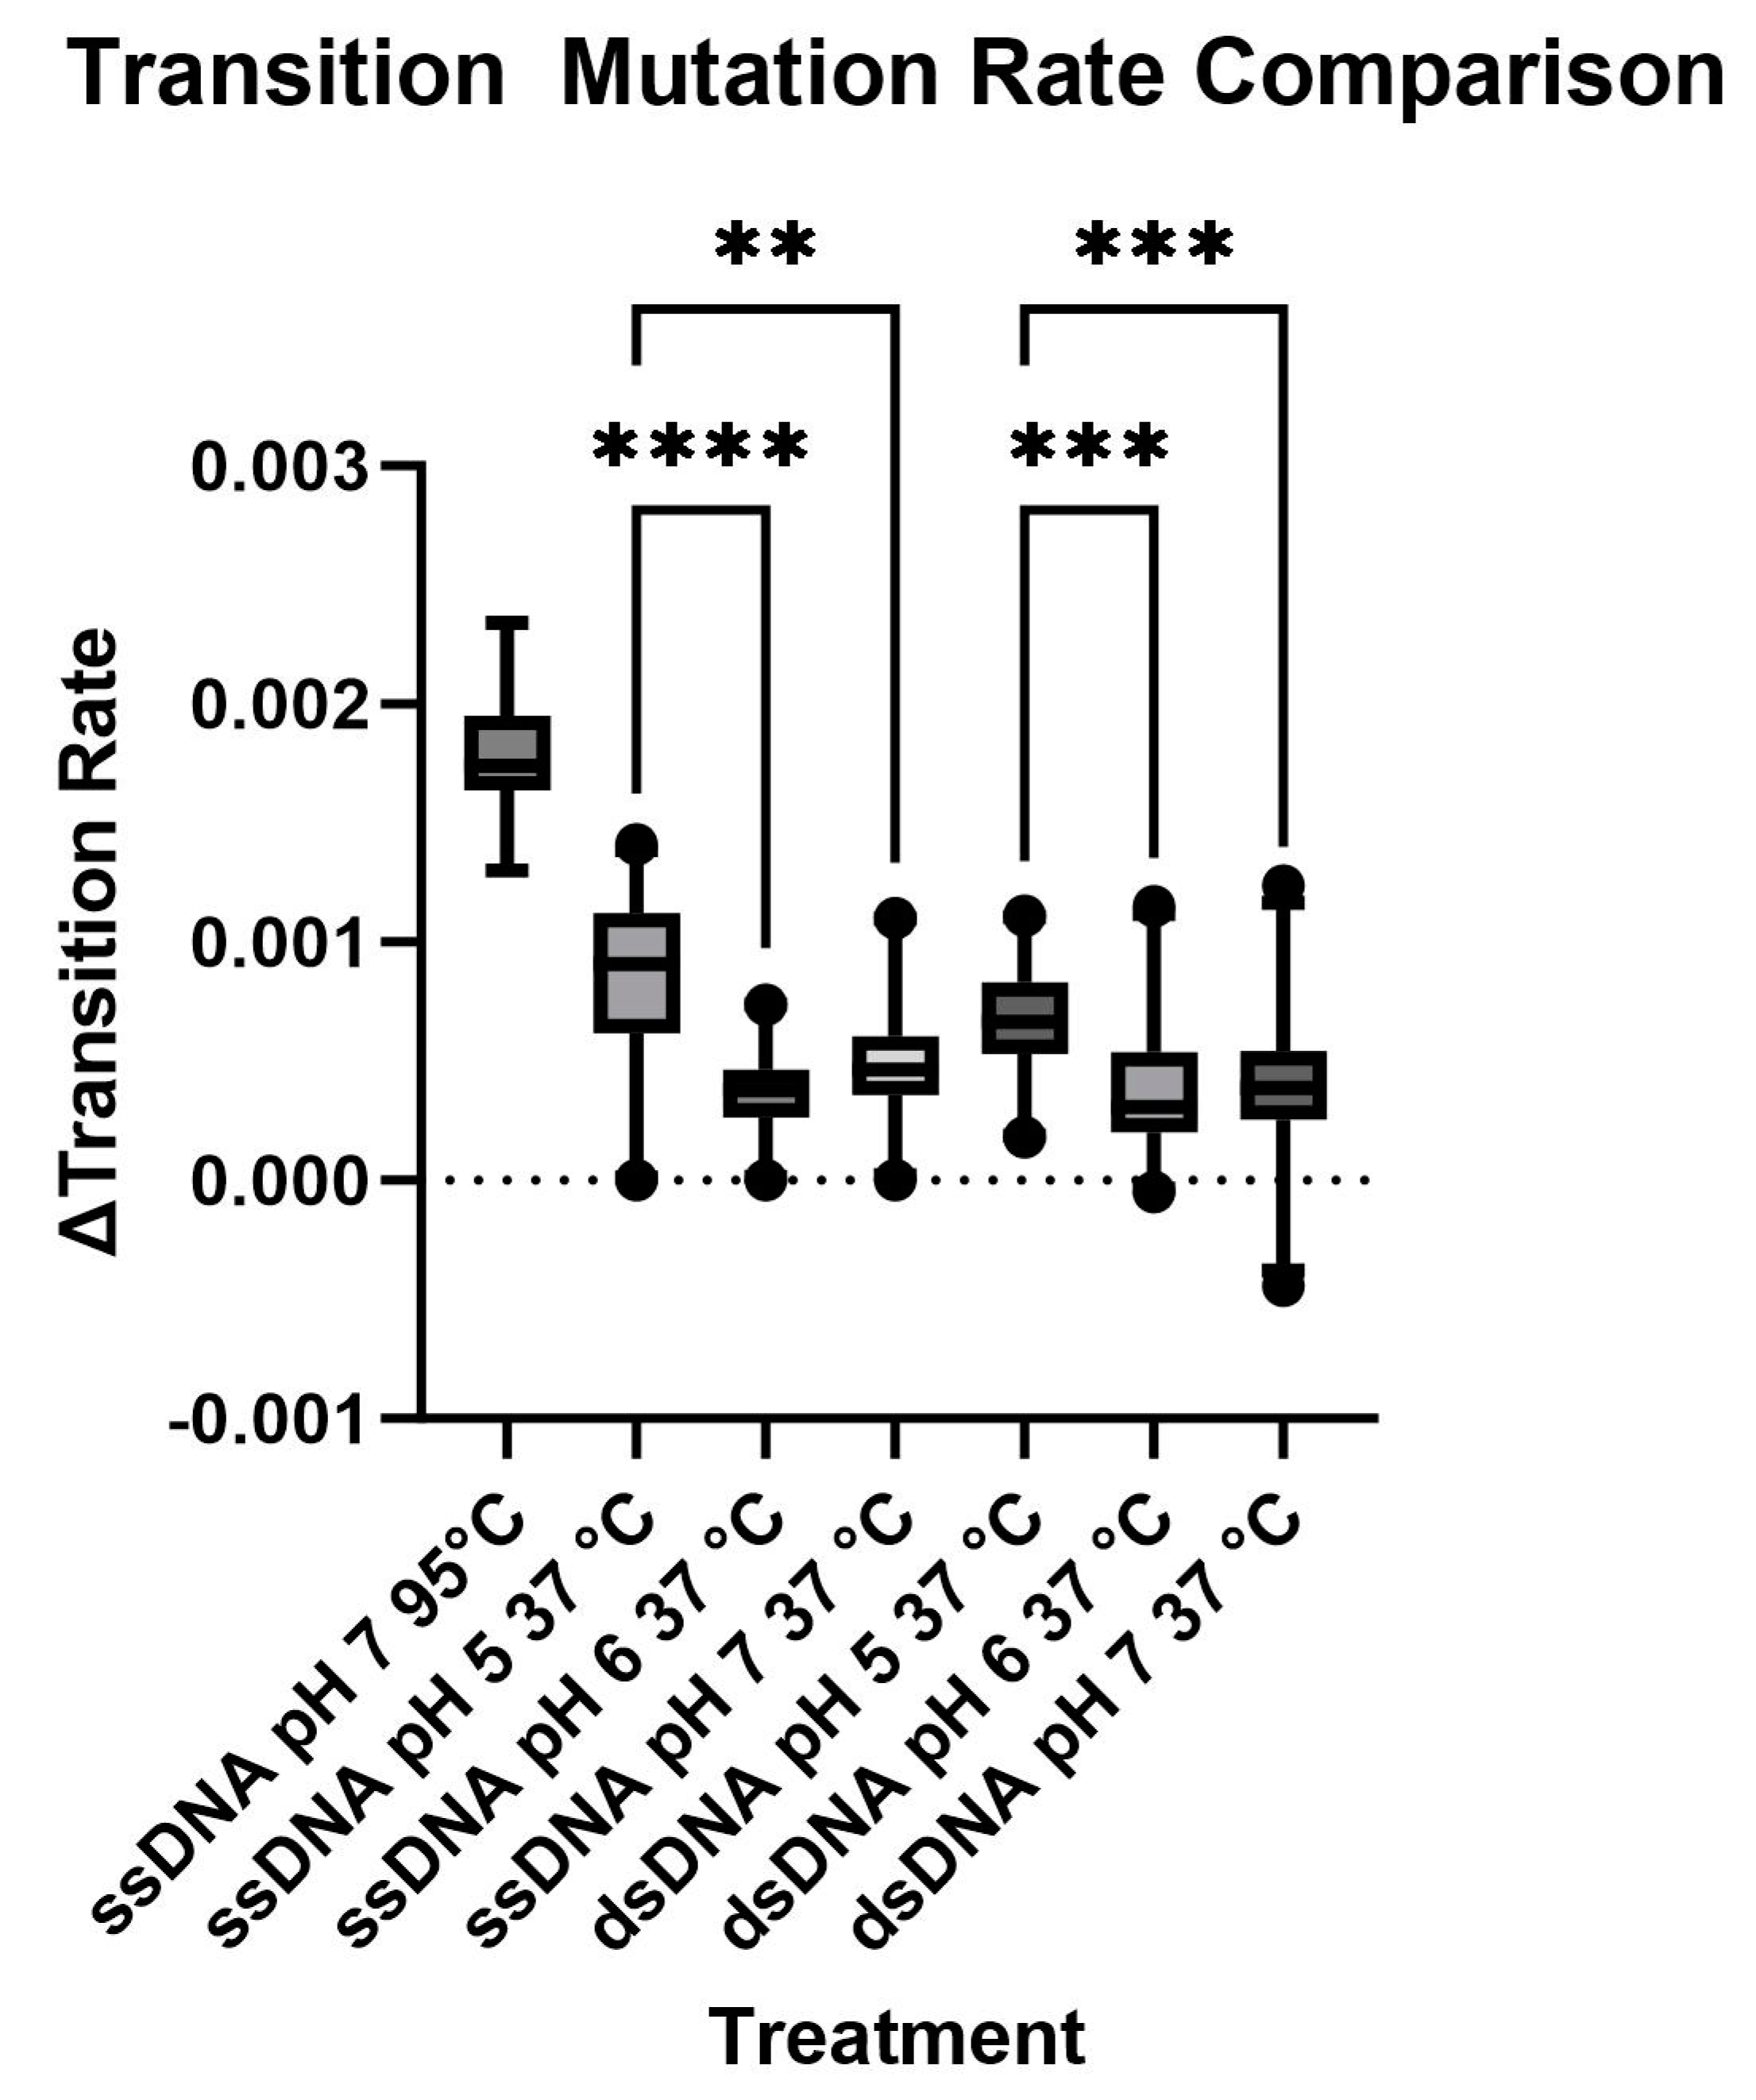
3.3. Cytosine Deamination as Measured by DNA Sequencing
4. Conclusions
Supplementary Materials
Author Contributions
Funding
Institutional Review Board Statement
Informed Consent Statement
Data Availability Statement
Acknowledgments
Conflicts of Interest
References
- Yuan, X.; Larsson, C.; Xu, D. Mechanisms Underlying the Activation of TERT Transcription and Telomerase Activity in Human Cancer: Old Actors and New Players. Oncogene 2019, 38, 6172–6183. [Google Scholar] [CrossRef]
- Barthel, F.P.; Wei, W.; Tang, M.; Martinez-Ledesma, E.; Hu, X.; Amin, S.B.; Akdemir, K.C.; Seth, S.; Song, X.; Wang, Q.; et al. Systematic Analysis of Telomere Length and Somatic Alterations in 31 Cancer Types. Nat. Genet. 2017, 49, 349–357. [Google Scholar] [CrossRef] [PubMed]
- Park, C.-K.K.; Lee, S.-T.T.S.-H.H.; Kim, J.Y.J.E.; Kim, J.Y.J.E.; Kim, T.M.; Lee, S.-T.T.S.-H.H.; Choi, S.H.; Park, S.-H.H.; Kim, I.H. Expression Level of HTERT Is Regulated by Somatic Mutation and Common Single Nucleotide Polymorphism at Promoter Region in Glioblastoma. Oncotarget 2014, 5, 3399–3407. [Google Scholar] [CrossRef]
- Simon, M.; Hosen, I.; Gousias, K.; Rachakonda, S.; Heidenreich, B.; Gessi, M.; Schramm, J.; Hemminki, K.; Waha, A.; Kumar, R. TERT Promoter Mutations: A Novel Independent Prognostic Factor in Primary Glioblastomas. Neuro. Oncol. 2015, 17, 45–52. [Google Scholar] [CrossRef] [PubMed]
- Labussière, M.; Di Stefano, A.L.; Gleize, V.; Boisselier, B.; Giry, M.; Mangesius, S.; Bruno, A.; Paterra, R.; Marie, Y.; Rahimian, A.; et al. TERT Promoter Mutations in Gliomas, Genetic Associations and Clinico-Pathological Correlations. Br. J. Cancer 2014, 111, 2024–2032. [Google Scholar] [CrossRef]
- Pierini, T.; Nardelli, C.; Lema Fernandez, A.G.; Pierini, V.; Pellanera, F.; Nofrini, V.; Gorello, P.; Moretti, M.; Arniani, S.; Roti, G.; et al. New Somatic TERT Promoter Variants Enhance the Telomerase Activity in Glioblastoma. Acta Neuropathol. Commun. 2020, 8, 145. [Google Scholar] [CrossRef] [PubMed]
- Heidenreich, B.; Kumar, R. TERT Promoter Mutations in Telomere Biology. Mutat. Res. Rev. Mutat. Res. 2017, 771, 15–31. [Google Scholar] [CrossRef]
- Huang, F.W.; Hodis, E.; Xu, M.J.; Kryukov, G.V.; Chin, L.; Garraway, L.A. Highly Recurrent TERT Promoter Mutations in Human Melanoma. Science 2013, 339, 957–959. [Google Scholar] [CrossRef] [PubMed]
- Horn, S.; Figl, A.; Rachakonda, P.S.; Fischer, C.; Sucker, A.; Gast, A.; Kadel, S.; Moll, I.; Nagore, E.; Hemminki, K.; et al. TERT Promoter Mutations in Familial and Sporadic Melanoma. Science 2013, 339, 959–961. [Google Scholar] [CrossRef]
- Palumbo, S.L.M.L.; Ebbinghaus, S.W.; Hurley, L.H. Formation of a Unique End-to-End Stacked Pair of G-Quadruplexes in the HTERT Core Promoter with Implications for Inhibition of Telomerase by G-Quadruplex-Interactive Ligands. J. Am. Chem. Soc. 2009, 131, 10878–10891. [Google Scholar] [CrossRef]
- Kendrick, S.; Kang, H.-J.J.; Alam, M.P.; Madathil, M.M.; Agrawal, P.; Gokhale, V.; Yang, D.; Hecht, S.M.; Hurley, L.H. The Dynamic Character of the BCL2 Promoter I-Motif Provides a Mechanism for Modulation of Gene Expression by Compounds That Bind Selectively to the Alternative DNA Hairpin Structure. J. Am. Chem. Soc. 2014, 136, 4161–4171. [Google Scholar] [CrossRef] [PubMed]
- Chalikian, T.V.; Liu, L.; Macgregor, R.B. Duplex-Tetraplex Equilibria in Guanine- and Cytosine-Rich DNA. Biophys. Chem. 2020, 267, 106473. [Google Scholar] [CrossRef] [PubMed]
- Cui, Y.; Kong, D.; Ghimire, C.; Xu, C.; Mao, H. Mutually Exclusive Formation of G-Quadruplex and i-Motif Is a General Phenomenon Governed by Steric Hindrance in Duplex DNA. Biochemistry 2016, 55, 2291–2299. [Google Scholar] [CrossRef] [PubMed]
- Lindahl, T.; Nyberg, B. Heat-Induced Deamination of Cytosine Residues in Deoxyribonucleic Acid. Biochemistry 1974, 13, 3405–3410. [Google Scholar] [CrossRef] [PubMed]
- Iengar, P. An Analysis of Substitution, Deletion and Insertion Mutations in Cancer Genes. Nucleic Acids Res. 2012, 40, 6401–6413. [Google Scholar] [CrossRef]
- Magewu, A.N.; Jones, P.A. Ubiquitous and Tenacious Methylation of the CpG Site in Codon 248 of the P53 Gene May Explain Its Frequent Appearance as a Mutational Hot Spot in Human Cancer. Mol. Cell Biol. 1994, 14, 4225–4232. [Google Scholar] [CrossRef]
- Baljinnyam, T.; Sowers, M.L.; Hsu, C.W.; Conrad, J.W.; Herring, J.L.; Hackfeld, L.C.; Sowers, L.C. Chemical and Enzymatic Modifications of 5-Methylcytosine at the Intersection of DNA Damage, Repair, and Epigenetic Reprogramming. PLoS ONE 2022, 17, e0273509. [Google Scholar] [CrossRef] [PubMed]
- Schmutte, C.; Yang, A.S.; Beart, R.W.; Jones, P.A. Base Excision Repair of U:G Mismatches at a Mutational Hotspot in the P53 Gene Is More Efficient than Base Excision Repair of T:G Mismatches in Extracts of Human Colon Tumors. Cancer Res. 1995, 55, 3742–3746. [Google Scholar] [PubMed]
- Theruvathu, J.A.; Darwanto, A.; Hsu, C.W.; Sowers, L.C. The Effect of Pot1 Binding on the Repair of Thymine Analogs in a Telomeric DNA Sequence. Nucleic Acids Res. 2014, 42, 9063–9073. [Google Scholar] [CrossRef]
- Pavlova, A.V.; Savitskaya, V.Y.; Dolinnaya, N.G.; Monakhova, M.V.; Litvinova, A.V.; Kubareva, E.A.; Zvereva, M.I. G-Quadruplex Formed by the Promoter Region of the HTERT Gene: Structure-Driven Effects on DNA Mismatch Repair Functions. Biomedicines 2022, 10, 1871. [Google Scholar] [CrossRef]
- Sowers, M.L.; Conrad, J.W.; Chang-Gu, B.; Cherryhomes, E.; Hackfeld, L.C.; Sowers, L.C. DNA Base Excision Repair Intermediates Influence Duplex–Quadruplex Equilibrium. Molecules 2023, 28, 970. [Google Scholar] [CrossRef] [PubMed]
- Shapiro, R.; Klein, R.S. The Deamination of Cytidine and Cytosine by Acidic Buffer Solutions. Mutagenic Implications. Biochemistry 1966, 5, 2358–2362. [Google Scholar] [CrossRef]
- Lindahl, T. Instability and Decay of the Primary Structure of DNA. Nature 1993, 362, 709–715. [Google Scholar] [CrossRef]
- Sowers, L.C.; David Sedwick, W.; Shaw, B.R. Hydrolysis of N3-Methyl-2′-Deoxycytidine: Model Compound for Reactivity of Protonated Cytosine Residues in DNA. Mutat. Res. 1989, 215, 131–138. [Google Scholar] [CrossRef] [PubMed]
- Schroeder, G.K.; Wolfenden, R. Rates of Spontaneous Disintegration of DNA and the Rate Enhancements Produced by DNA Glycosylases and Deaminases. Biochemistry 2007, 46, 13638–13647. [Google Scholar] [CrossRef] [PubMed]
- Garrett, E.R.; Tsau, J. Solvolyses of Cytosine and Cytidine. J. Pharm. Sci. 1972, 61, 1052–1061. [Google Scholar] [CrossRef] [PubMed]
- Ehrlich, M.; Norris, K.F.; Wang, R.Y.; Kuo, K.C.; Gehrke, C.W. DNA Cytosine Methylation and Heat-Induced Deamination. Biosci. Rep. 1986, 6, 387–393. [Google Scholar] [CrossRef]
- Frederico, L.A.; Kunkel, T.A.; Shaw, B.R. Cytosine Deamination in Mismatched Base Pairs. Biochemistry 1993, 32, 6523–6530. [Google Scholar] [CrossRef]
- Shen, J.C.; Rideout, W.M.; Jones, P.A. The Rate of Hydrolytic Deamination of 5-Methylcytosine in Double-Stranded DNA. Nucleic Acids Res. 1994, 22, 972–976. [Google Scholar] [CrossRef]
- Phan, A.T.; Guéron, M.; Leroy, J.L. The Solution Structure and Internal Motions of a Fragment of the Cytidine-Rich Strand of the Human Telomere. J. Mol. Biol. 2000, 299, 123–144. [Google Scholar] [CrossRef]
- Heinemann, U.; Alings, C.; Bansal, M. Double Helix Conformation, Groove Dimensions and Ligand Binding Potential of a G/C Stretch in B-DNA. EMBO J. 1992, 11, 1931–1939. [Google Scholar] [CrossRef]
- Humphrey, W.; Dalke, A.; Schulten, K. VMD: Visual Molecular Dynamics. J. Mol. Graph. 1996, 14, 33–38. [Google Scholar] [CrossRef] [PubMed]
- Zeraati, M.; Langley, D.B.; Schofield, P.; Moye, A.L.; Rouet, R.; Hughes, W.E.; Bryan, T.M.; Dinger, M.E.; Christ, D. I-Motif DNA Structures Are Formed in the Nuclei of Human Cells. Nat. Chem. 2018, 10, 631–637. [Google Scholar] [CrossRef] [PubMed]
- Gao, B.; Hou, X.-M. Opposite Effects of Potassium Ions on the Thermal Stability of I-Motif DNA in Different Buffer Systems. ACS Omega 2021, 6, 8976–8985. [Google Scholar] [CrossRef]
- Krueger, F.; Andrews, S.R.; Osborne, C.S. Large Scale Loss of Data in Low-Diversity Illumina Sequencing Libraries Can Be Recovered by Deferred Cluster Calling. PLoS ONE 2011, 6, e16607. [Google Scholar] [CrossRef]
- Shin, S.; Park, J. Characterization of Sequence-Specific Errors in Various next-Generation Sequencing Systems. Mol. Biosyst. 2016, 12, 914–922. [Google Scholar] [CrossRef] [PubMed]
- Pfeiffer, F.; Gröber, C.; Blank, M.; Händler, K.; Beyer, M.; Schultze, J.L.; Mayer, G. Systematic Evaluation of Error Rates and Causes in Short Samples in Next-Generation Sequencing. Sci. Rep. 2018, 8, 10950. [Google Scholar] [CrossRef]
- Ross, M.G.; Russ, C.; Costello, M.; Hollinger, A.; Lennon, N.J.; Hegarty, R.; Nusbaum, C.; Jaffe, D.B. Characterizing and Measuring Bias in Sequence Data. Genome Biol. 2013, 14, R51. [Google Scholar] [CrossRef] [PubMed]
- Motulsky, H.J.; Brown, R.E. Detecting Outliers When Fitting Data with Nonlinear Regression—A New Method Based on Robust Nonlinear Regression and the False Discovery Rate. BMC Bioinformatics 2006, 7, 123. [Google Scholar] [CrossRef]
- Mann, H.B.; Whitney, D.R. On a Test of Whether One of Two Random Variables Is Stochastically Larger than the Other. Ann. Math. Stat. 1947, 18, 50–60. [Google Scholar] [CrossRef]
- Kruskal, W.H.; Wallis, W.A. Use of Ranks in One-Criterion Variance Analysis. J. Am. Stat. Assoc. 1952, 47, 583–621. [Google Scholar] [CrossRef]
- Dunn, O.J. Multiple Comparisons Using Rank Sums. Technometrics 1964, 6, 241. [Google Scholar] [CrossRef]
- Rawitscher, M.; Sturtevant, J.M. The Heats of Ionization of Deoxynucleotides and Related Compounds. J. Am. Chem. Soc. 1960, 82, 3739–3740. [Google Scholar] [CrossRef]
- Fleming, A.M.; Ding, Y.; Rogers, R.A.; Zhu, J.; Zhu, J.; Burton, A.D.; Carlisle, C.B.; Burrows, C.J. 4n-1 Is a “Sweet Spot” in DNA i-Motif Folding of 2′-Deoxycytidine Homopolymers. J. Am. Chem. Soc. 2017, 139, 4682–4689. [Google Scholar] [CrossRef] [PubMed]
- Gehring, K.; Leroy, J.L.; Guéron, M. A Tetrameric DNA Structure with Protonated Cytosine.Cytosine Base Pairs. Nature 1993, 363, 561–565. [Google Scholar] [CrossRef]
- Leroy, J.L.; Guéron, M. Solution Structures of the I-Motif Tetramers of d(TCC), d(5methylCCT) and d(T5methylCC): Novel NOE Connections between Amino Protons and Sugar Protons. Structure 1995, 3, 101–120. [Google Scholar] [CrossRef] [PubMed]
- Rogers, R.A.; Fleming, A.M.; Burrows, C.J. Rapid Screen of Potential I-Motif Forming Sequences in DNA Repair Gene Promoters. ACS Omega 2018, 3, 9630–9635. [Google Scholar] [CrossRef] [PubMed]
- Rogers, R.A.; Meyer, M.R.; Stewart, K.M.; Eyring, G.M.; Fleming, A.M.; Burrows, C.J. Hysteresis in Poly-2′-Deoxycytidine i-Motif Folding Is Impacted by the Method of Analysis as Well as Loop and Stem Lengths. Biopolymers 2021, 112, e23389. [Google Scholar] [CrossRef]


Disclaimer/Publisher’s Note: The statements, opinions and data contained in all publications are solely those of the individual author(s) and contributor(s) and not of MDPI and/or the editor(s). MDPI and/or the editor(s) disclaim responsibility for any injury to people or property resulting from any ideas, methods, instructions or products referred to in the content. |
© 2023 by the authors. Licensee MDPI, Basel, Switzerland. This article is an open access article distributed under the terms and conditions of the Creative Commons Attribution (CC BY) license (https://creativecommons.org/licenses/by/4.0/).
Share and Cite
Conrad, J.W.; Sowers, M.L.; Yap, D.Y.; Cherryhomes, E.; Pettitt, B.M.; Khanipov, K.; Sowers, L.C. Transition Mutations in the hTERT Promoter Are Unrelated to Potential i-motif Formation in the C-Rich Strand. Biomolecules 2023, 13, 1308. https://doi.org/10.3390/biom13091308
Conrad JW, Sowers ML, Yap DY, Cherryhomes E, Pettitt BM, Khanipov K, Sowers LC. Transition Mutations in the hTERT Promoter Are Unrelated to Potential i-motif Formation in the C-Rich Strand. Biomolecules. 2023; 13(9):1308. https://doi.org/10.3390/biom13091308
Chicago/Turabian StyleConrad, James W., Mark L. Sowers, Dianne Y. Yap, Ellie Cherryhomes, B. Montgomery Pettitt, Kamil Khanipov, and Lawrence C. Sowers. 2023. "Transition Mutations in the hTERT Promoter Are Unrelated to Potential i-motif Formation in the C-Rich Strand" Biomolecules 13, no. 9: 1308. https://doi.org/10.3390/biom13091308