
Testing the Influence of Incomplete DNA Barcode Libraries on Ecological Status Assessment of Mediterranean Transitional Waters

 , ,
, ,  , , and
Abstract
:Simple Summary
Abstract
1. Introduction
2. Materials and Methods
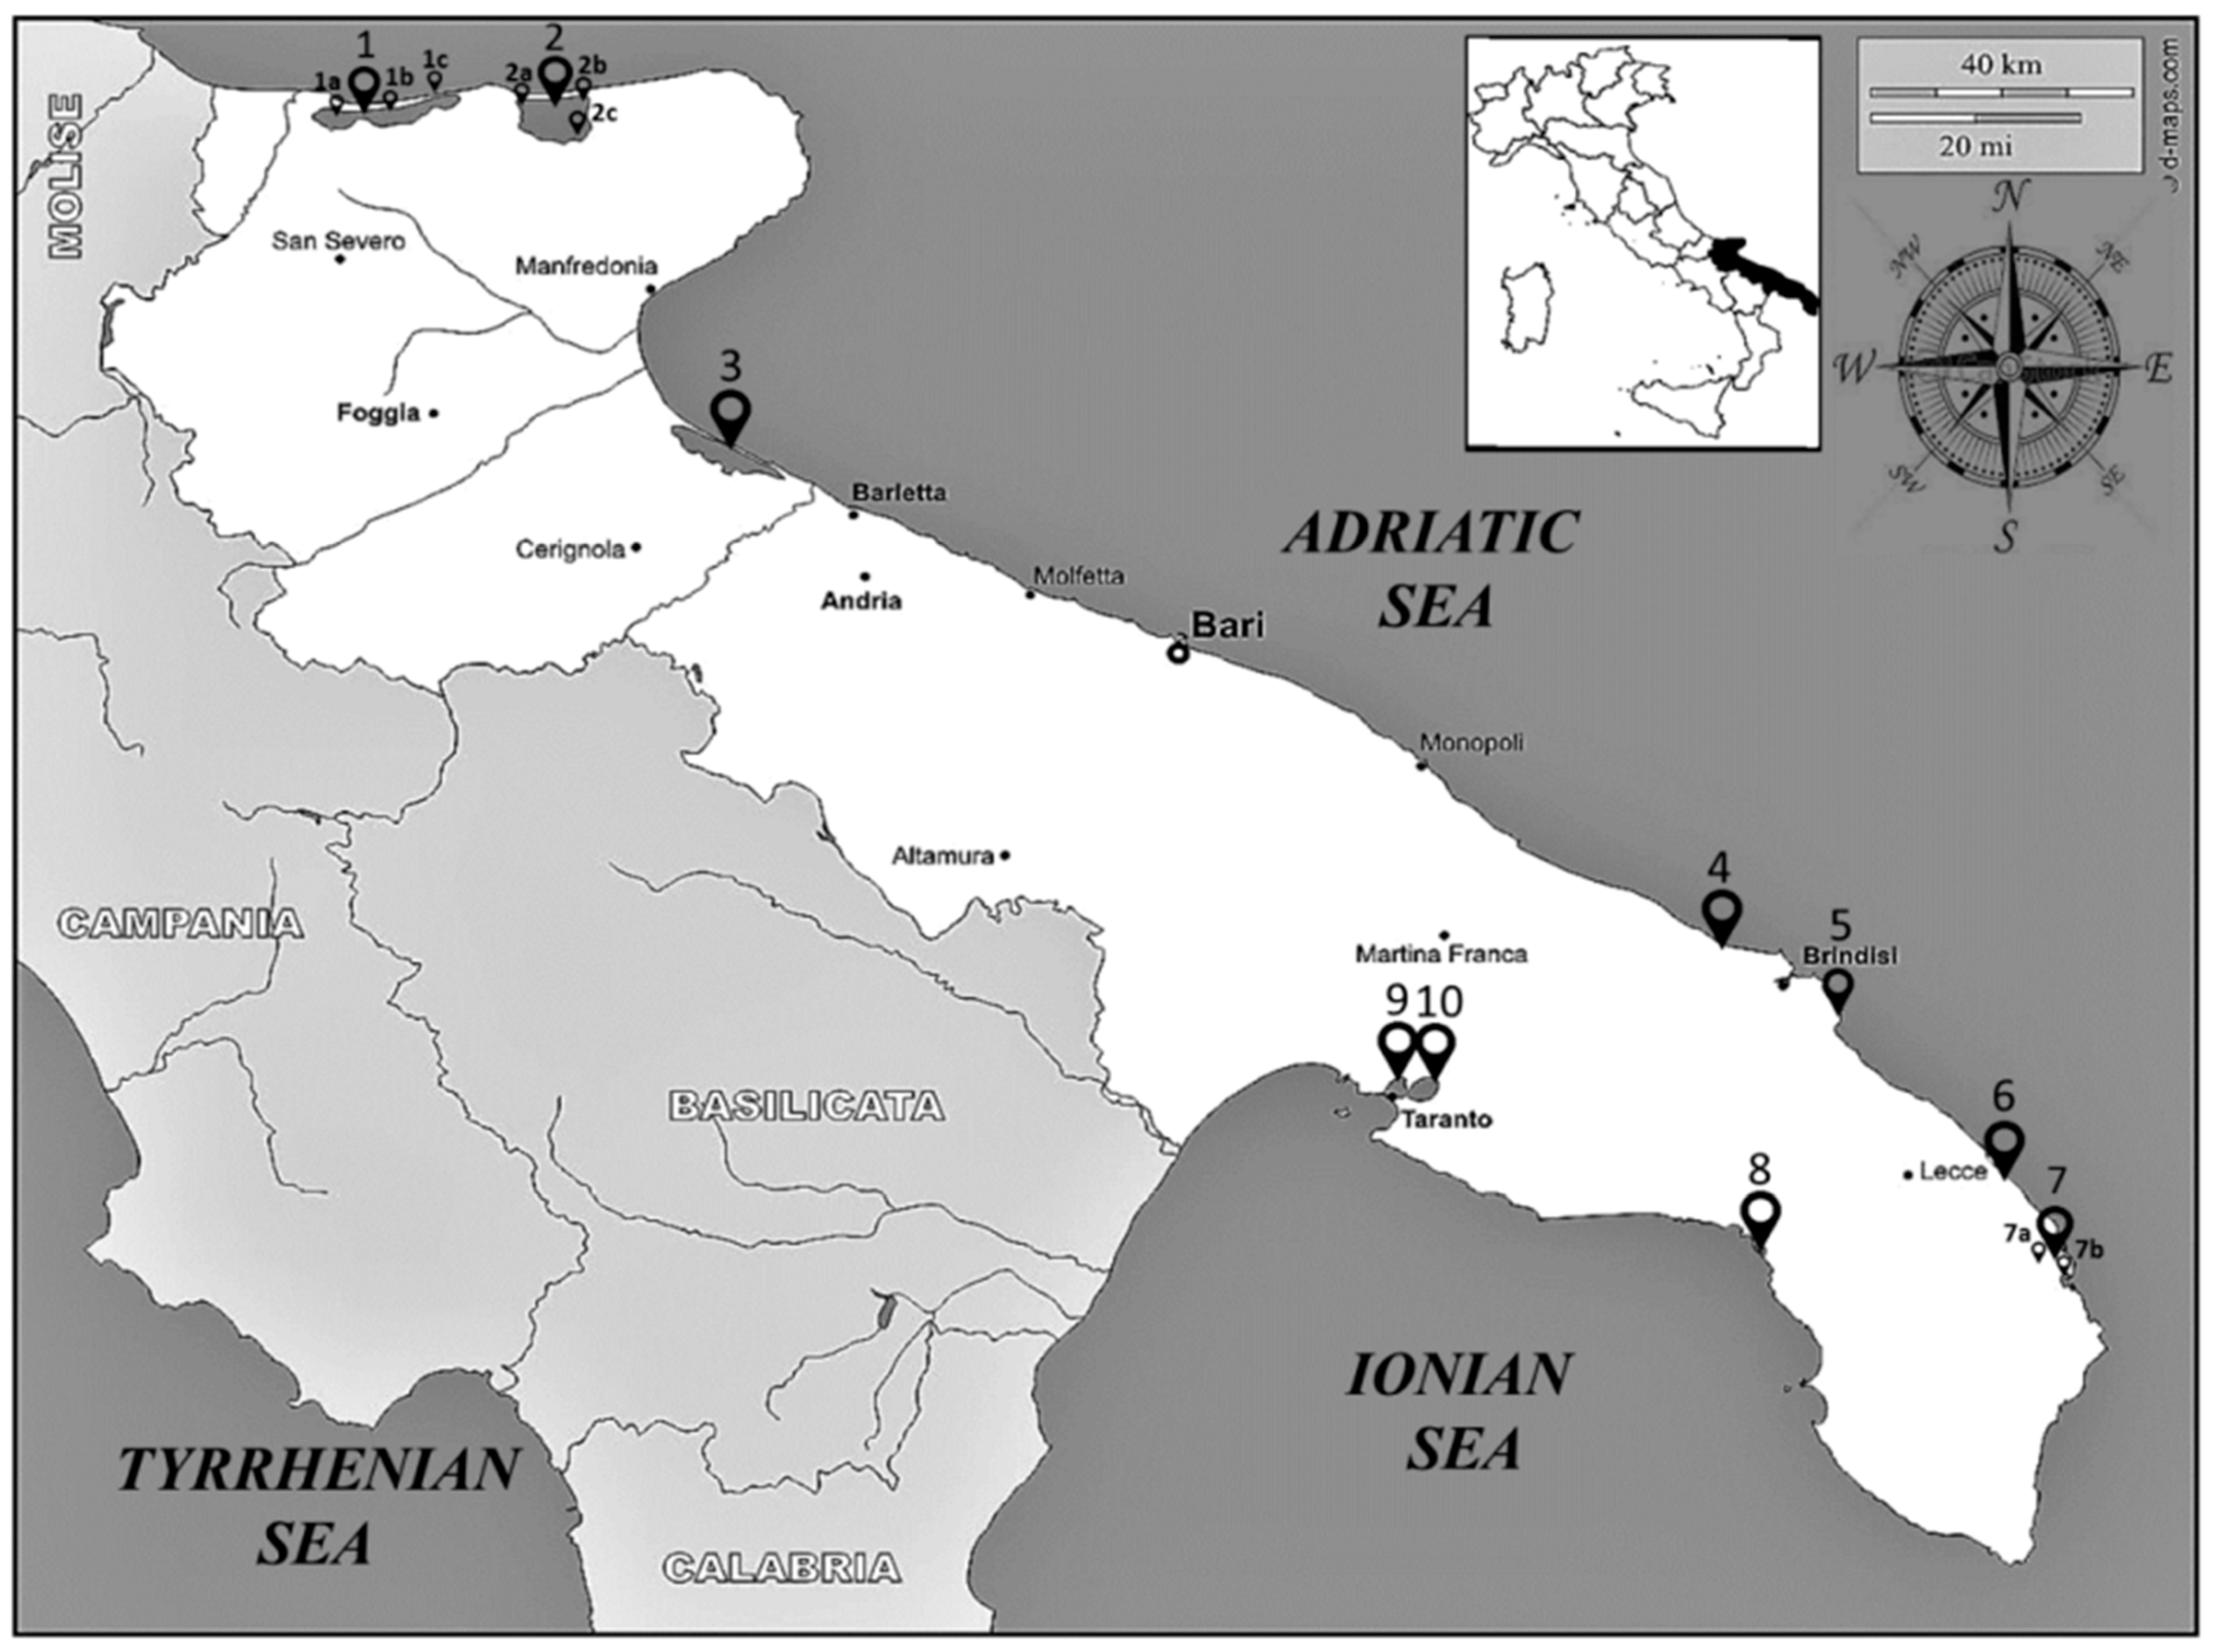
2.1. Benthic Macroinvertebrates Database
2.2. Descriptors, Ecological Indicators, and Correlations between Morphological and Reduced Databases
2.3. Species Delimitation Analysis
3. Results
3.1. Presence of Target Species in DNA Barcode Libraries
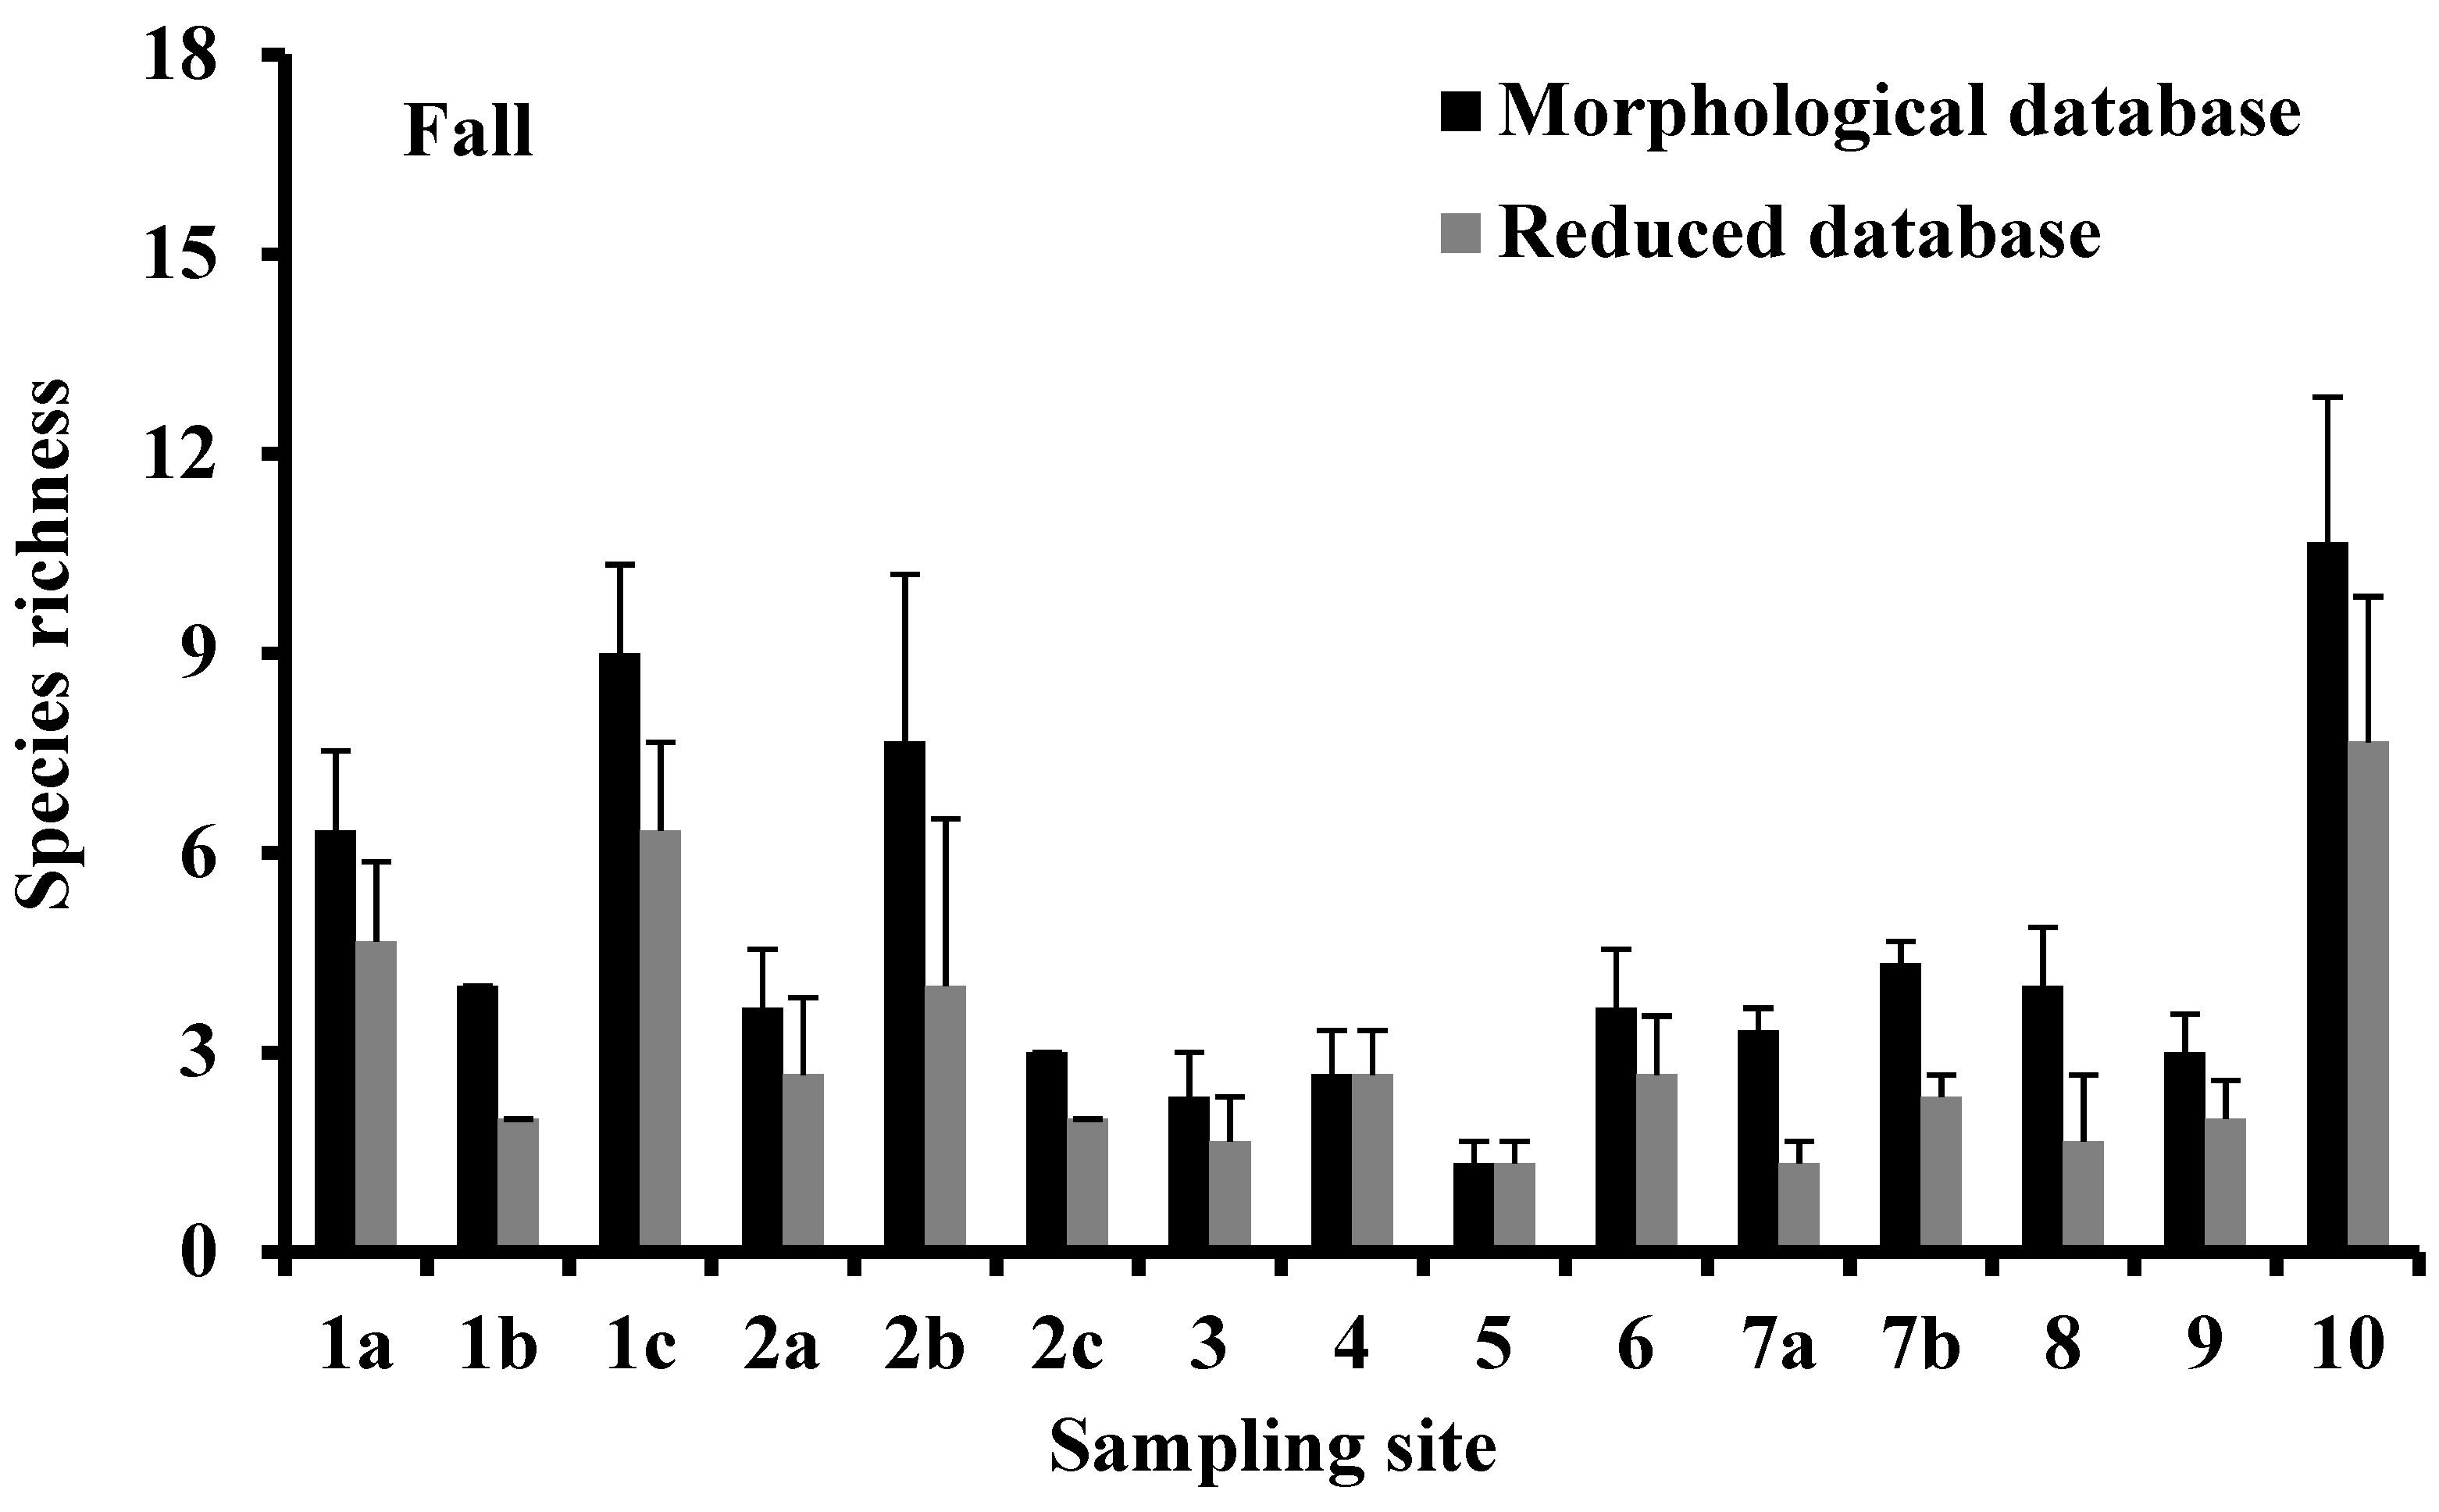
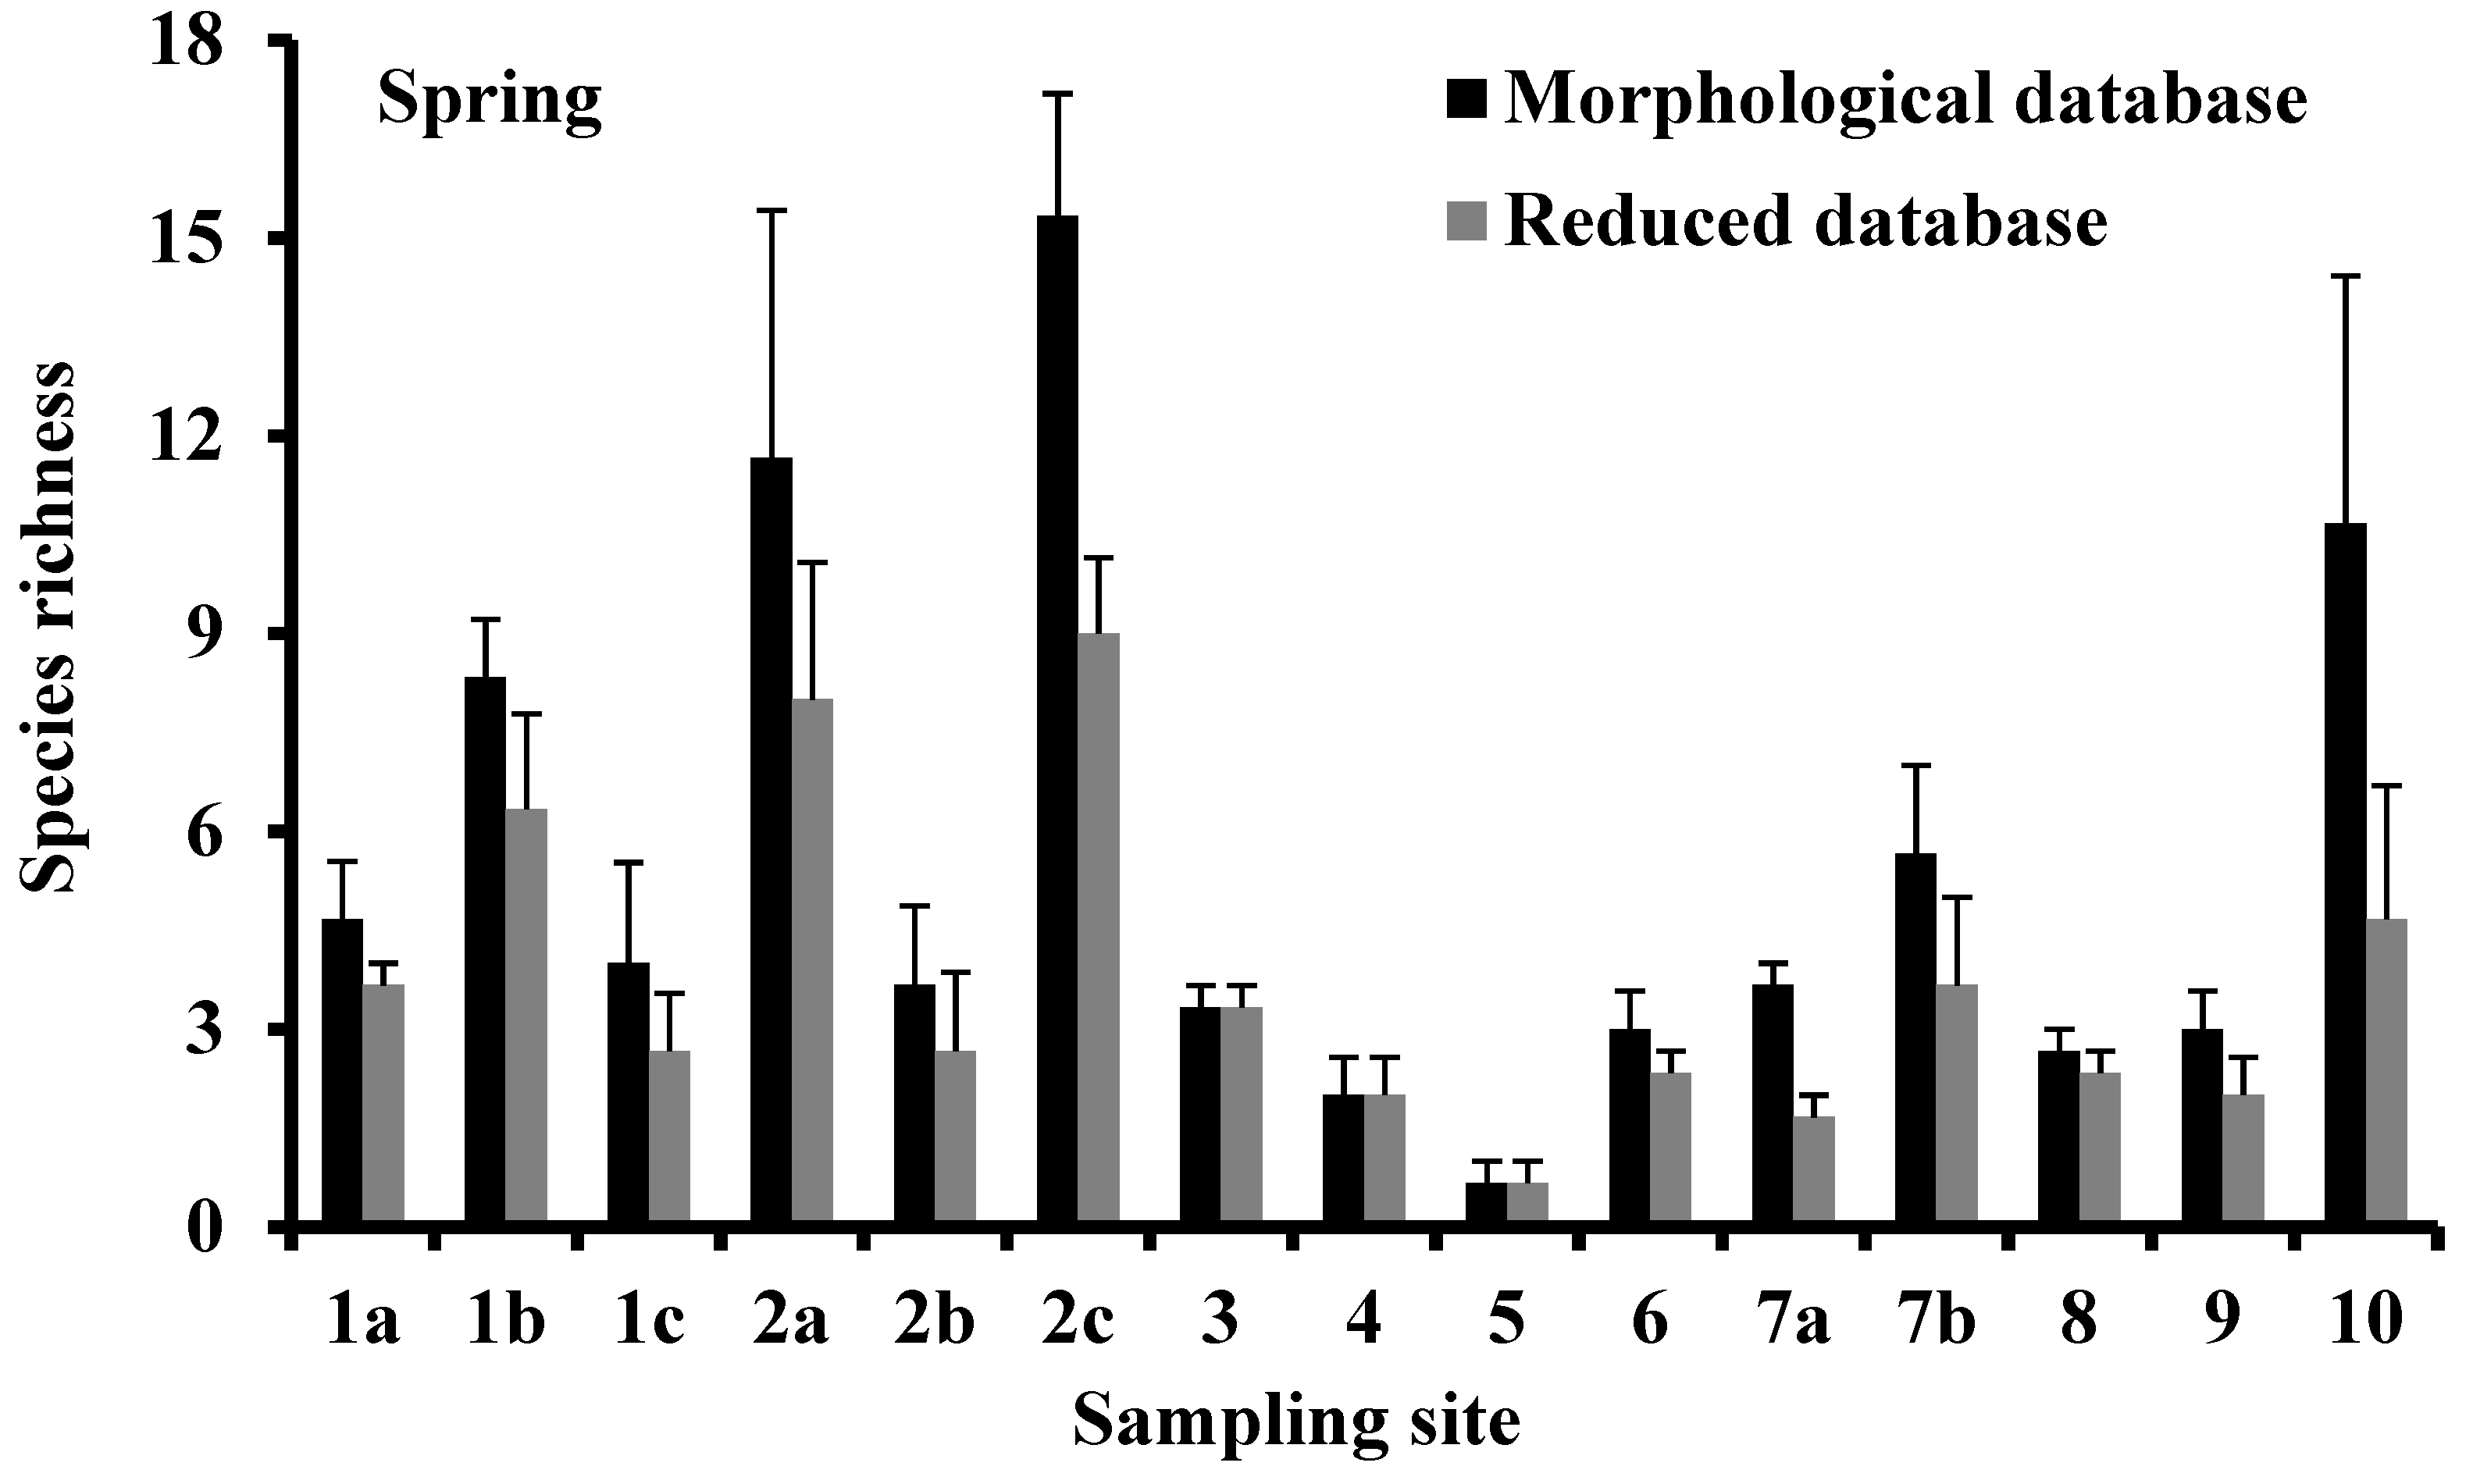
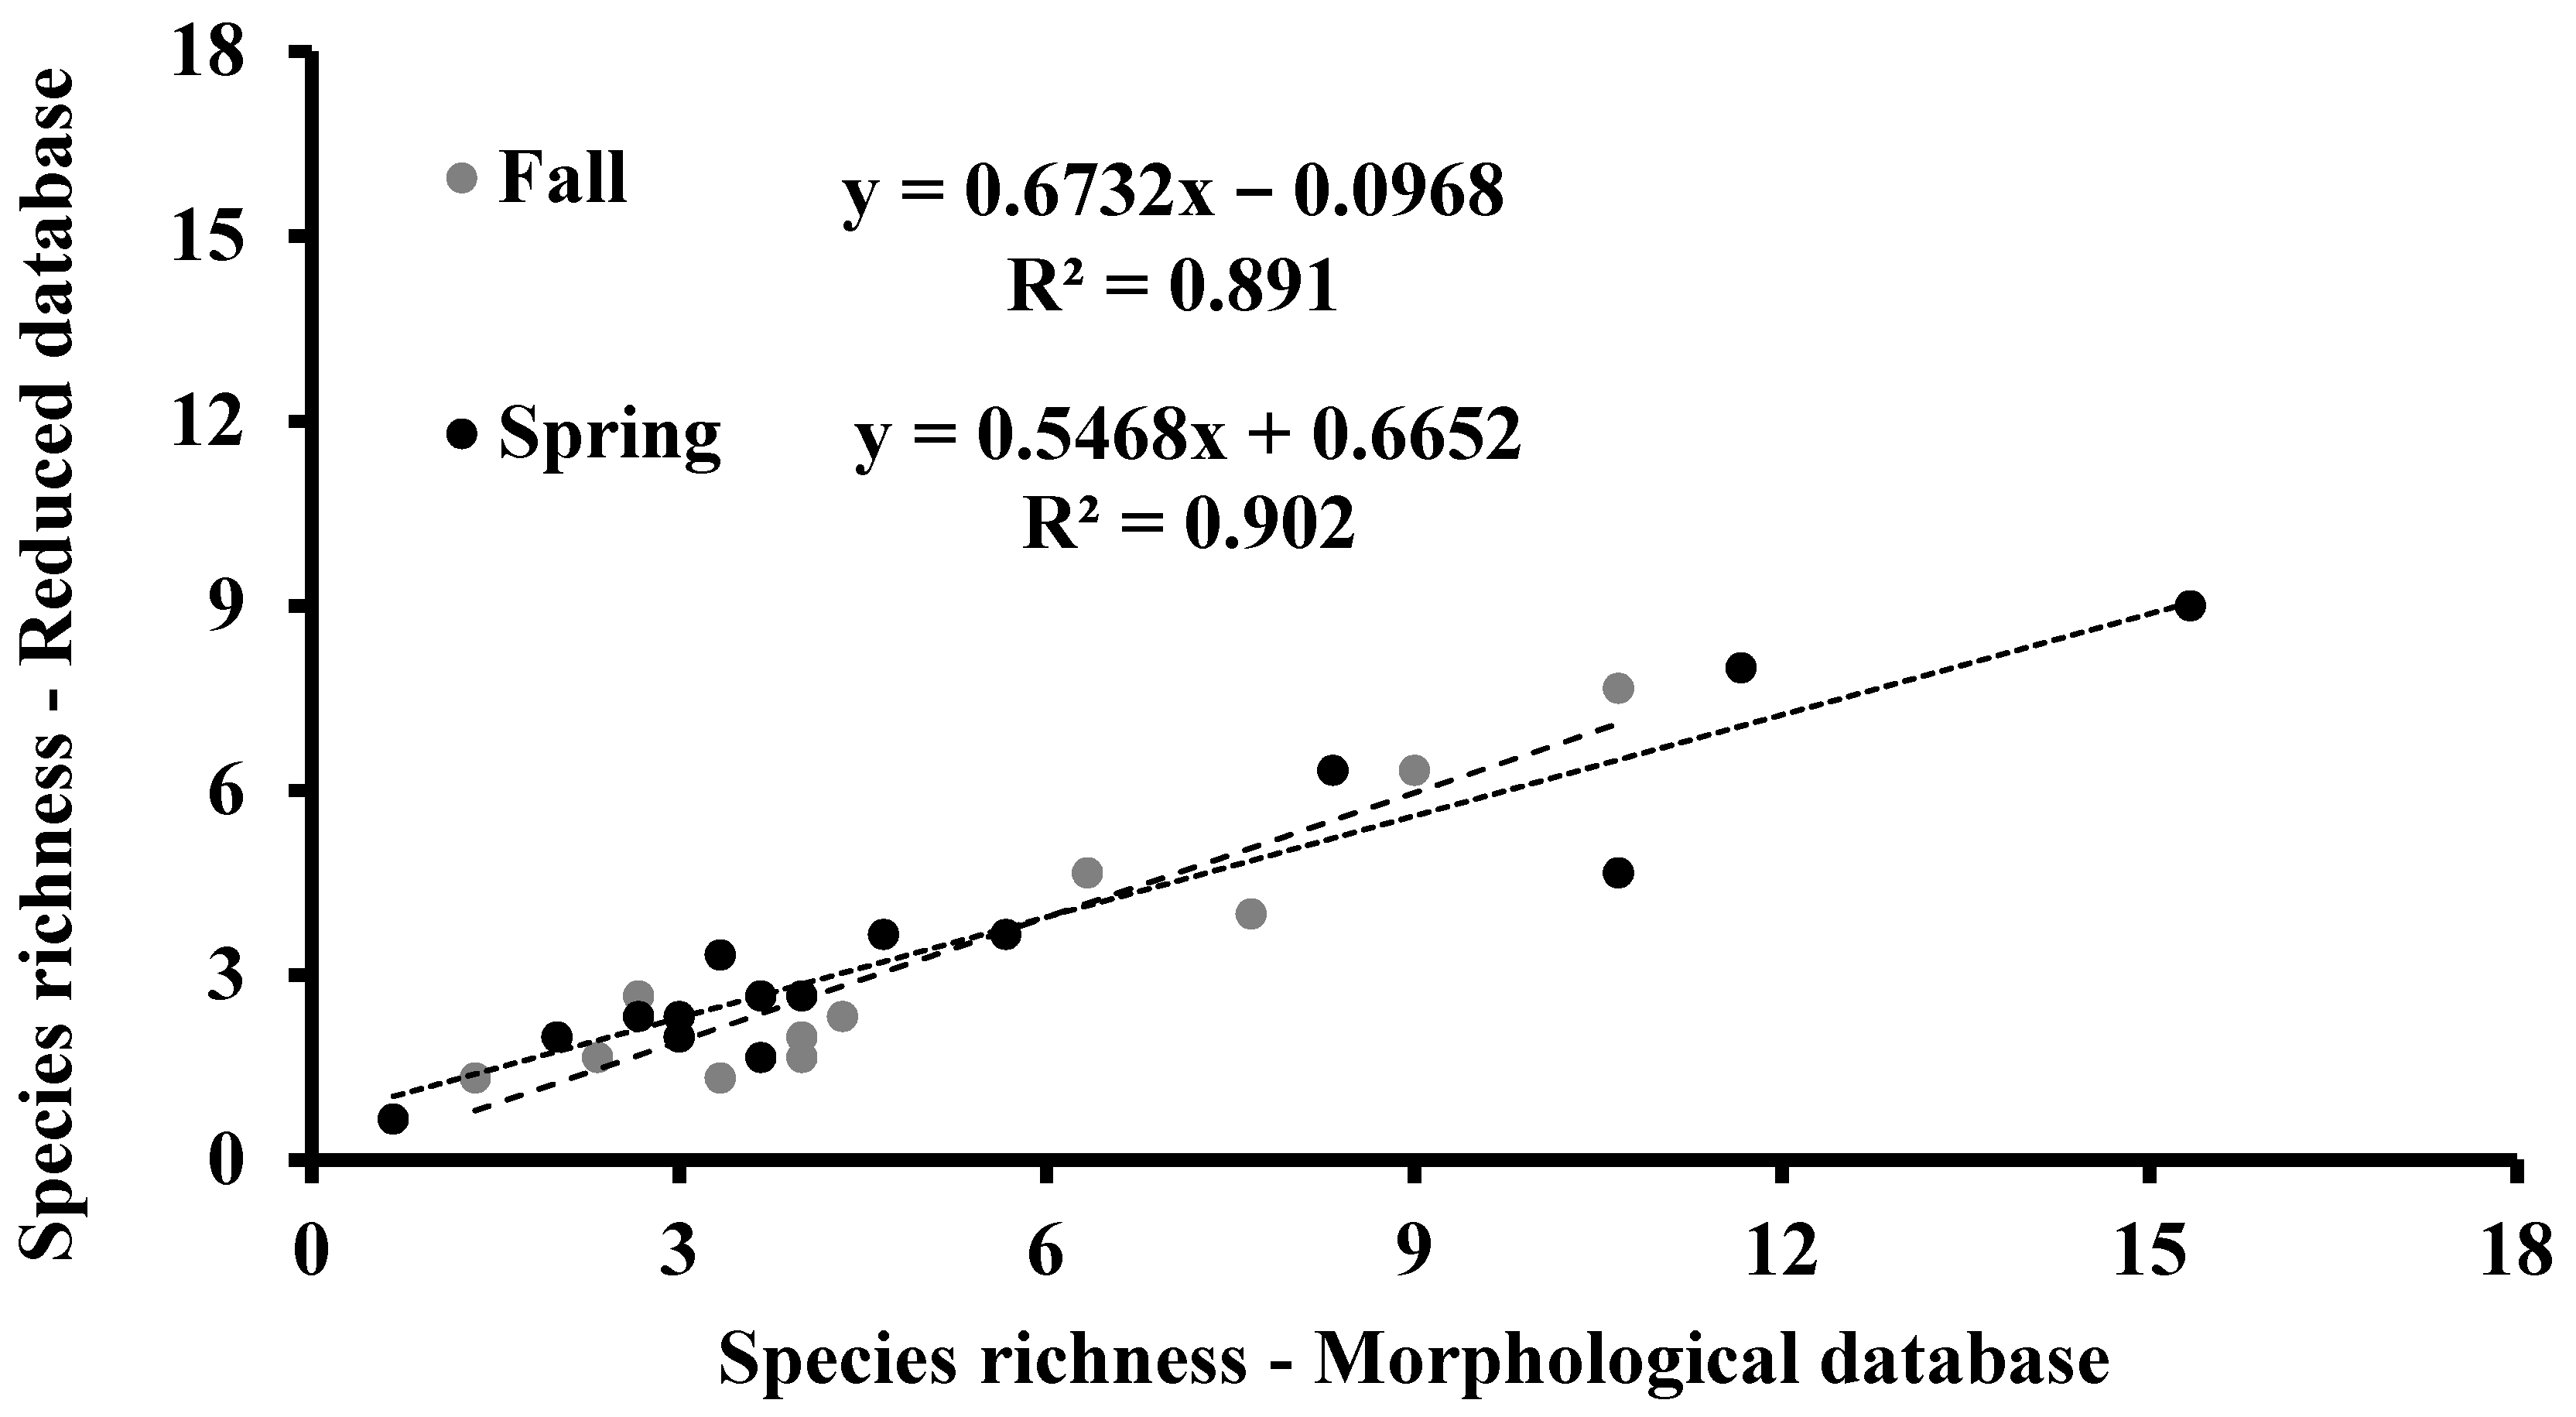
3.2. Species Richness
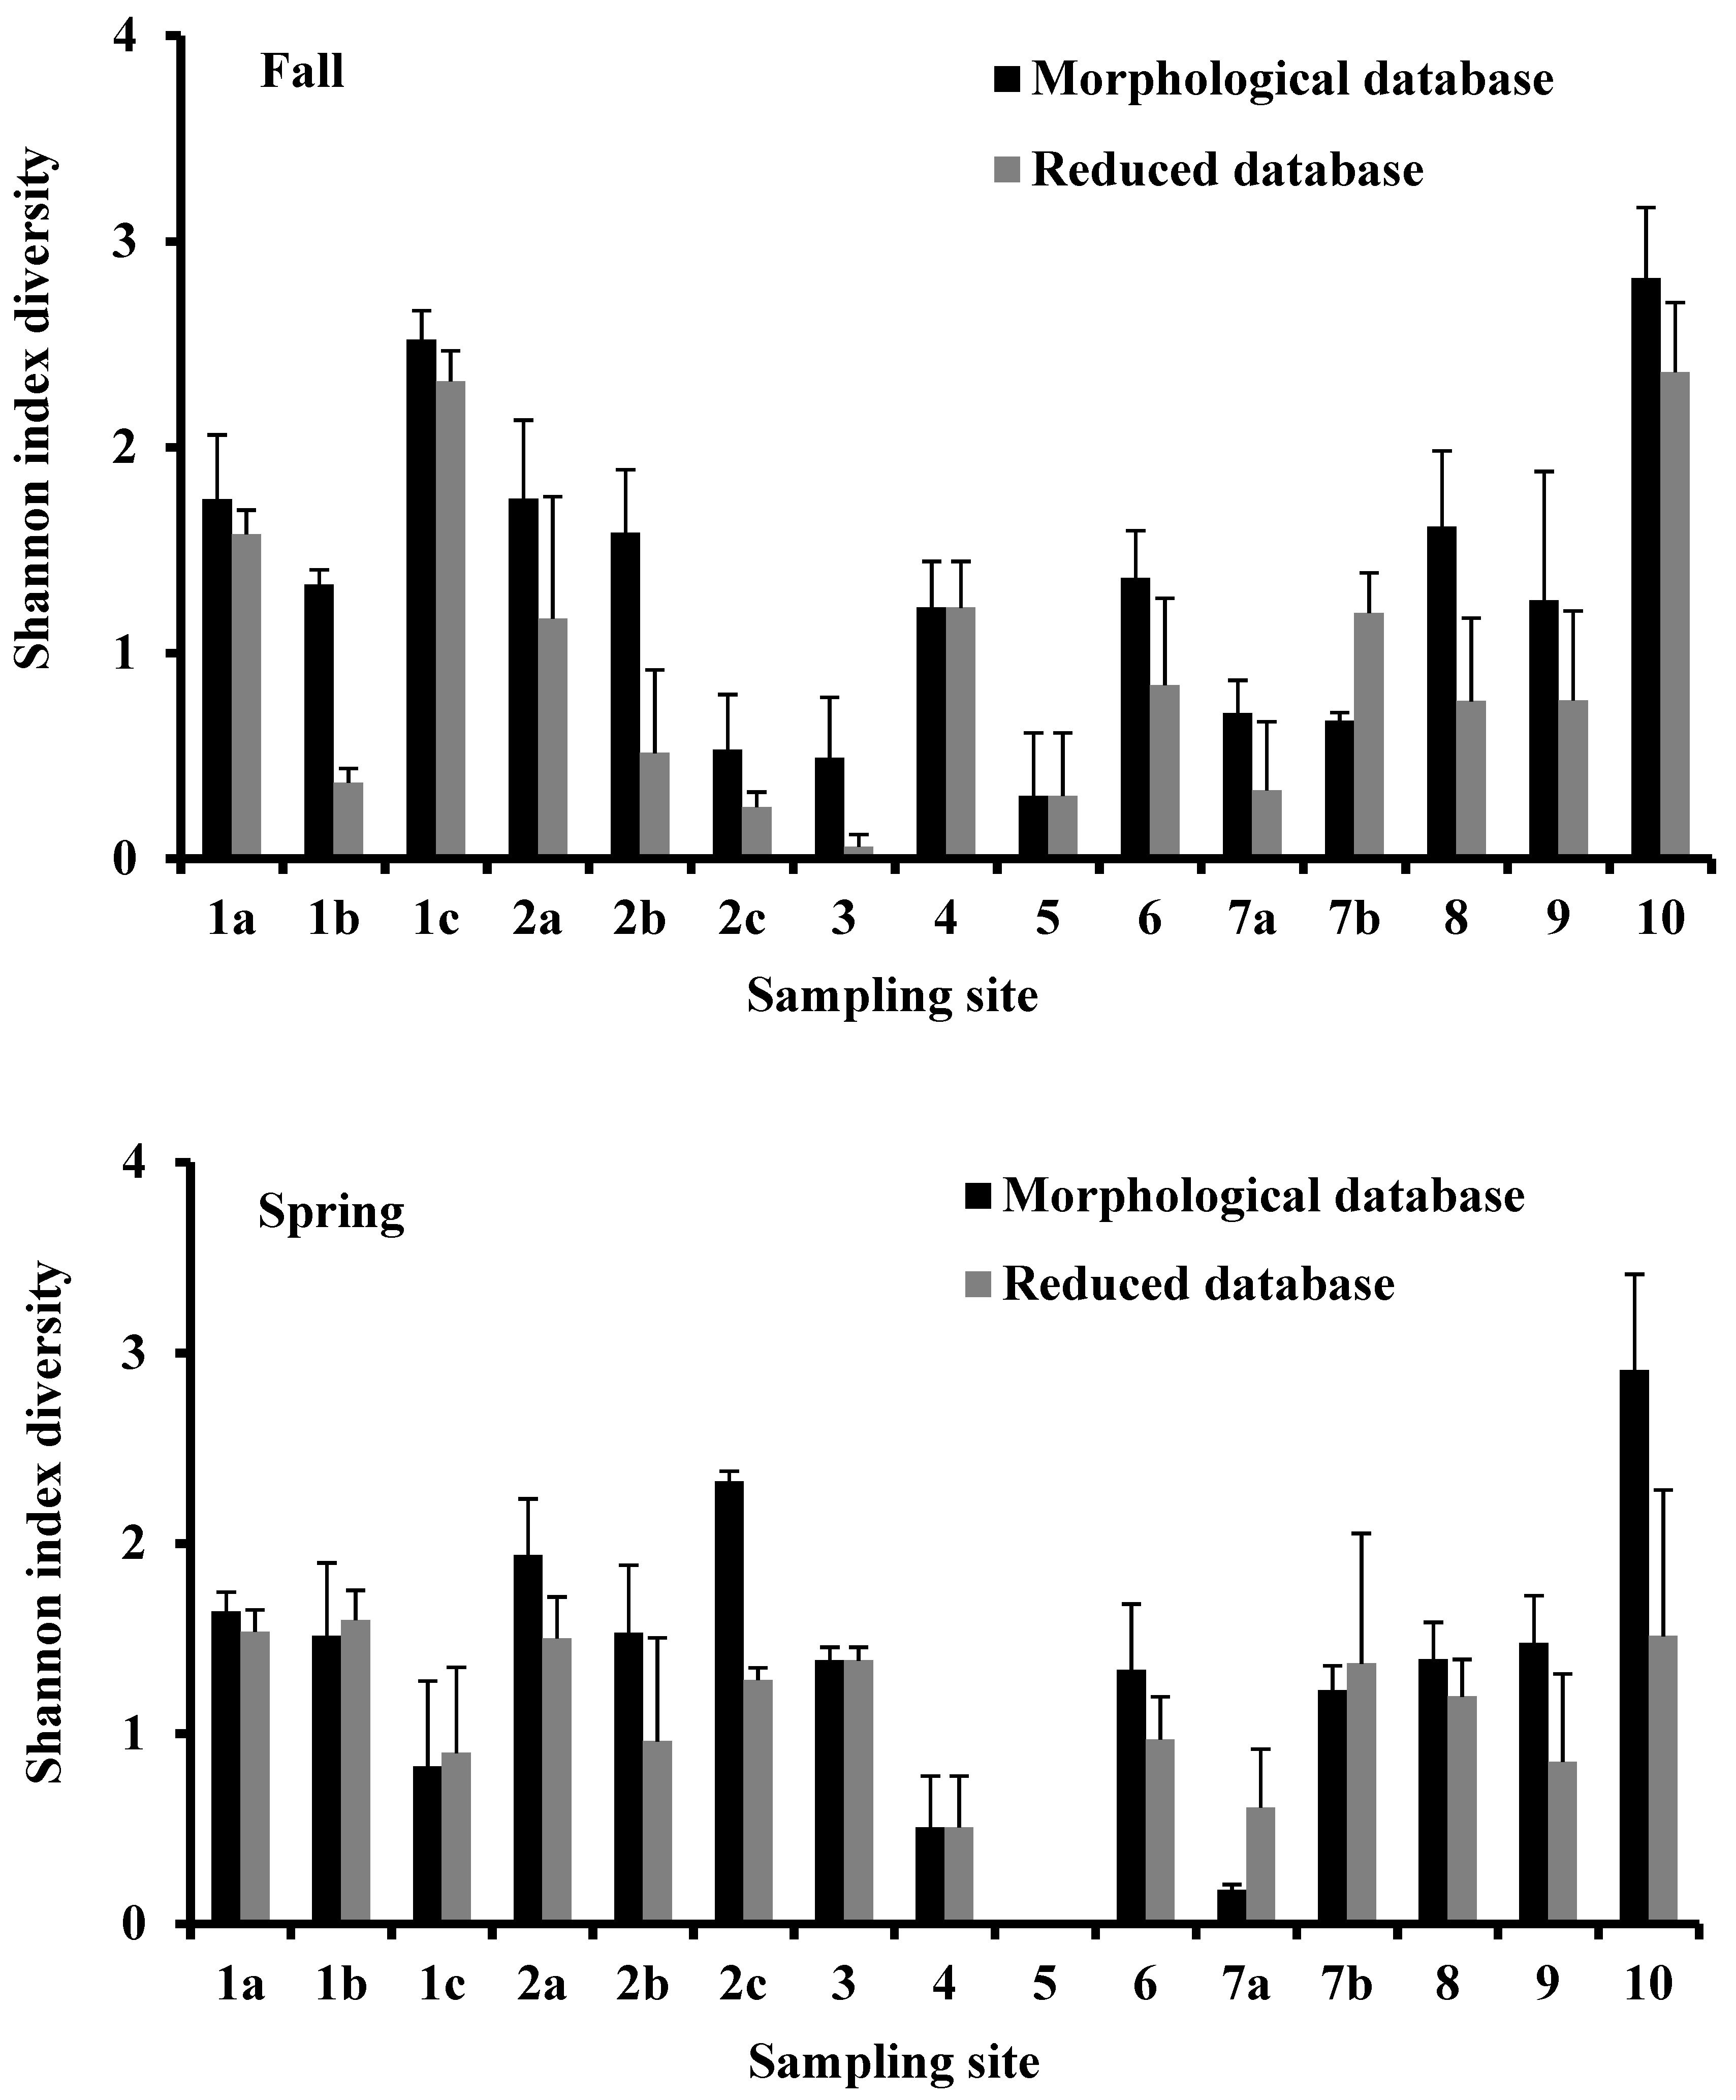
3.3. Shannon Diversity Index
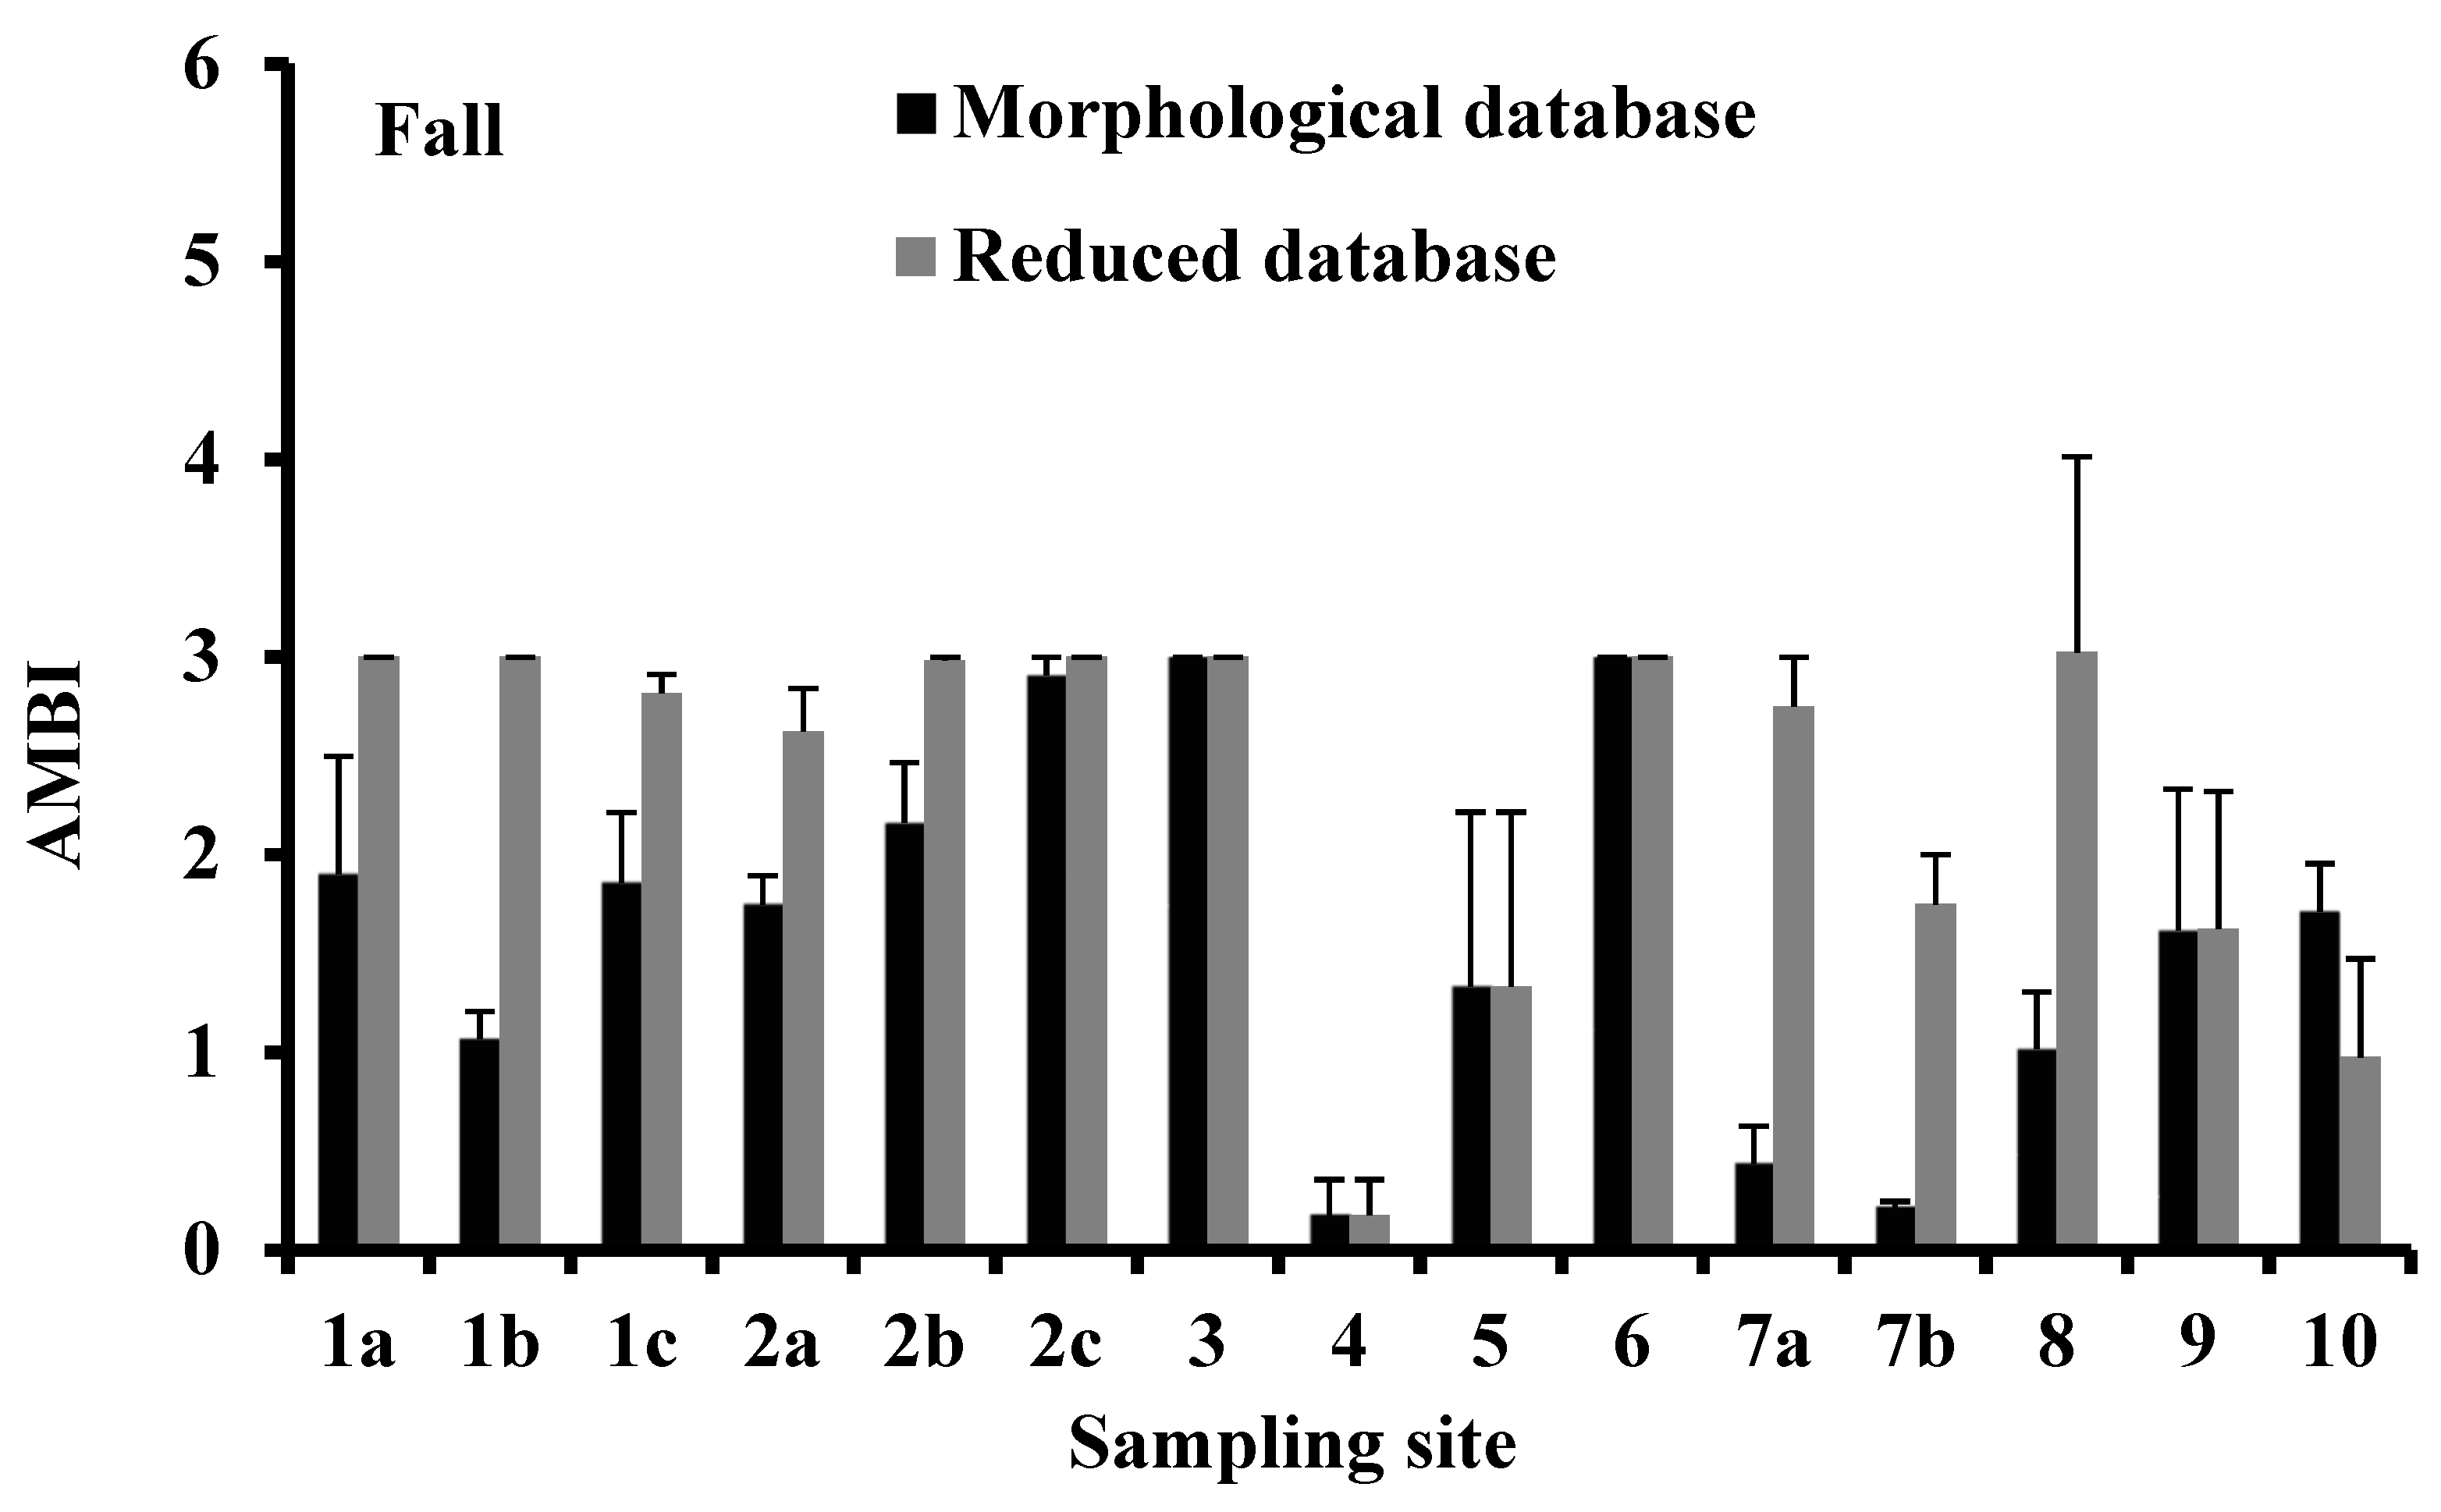
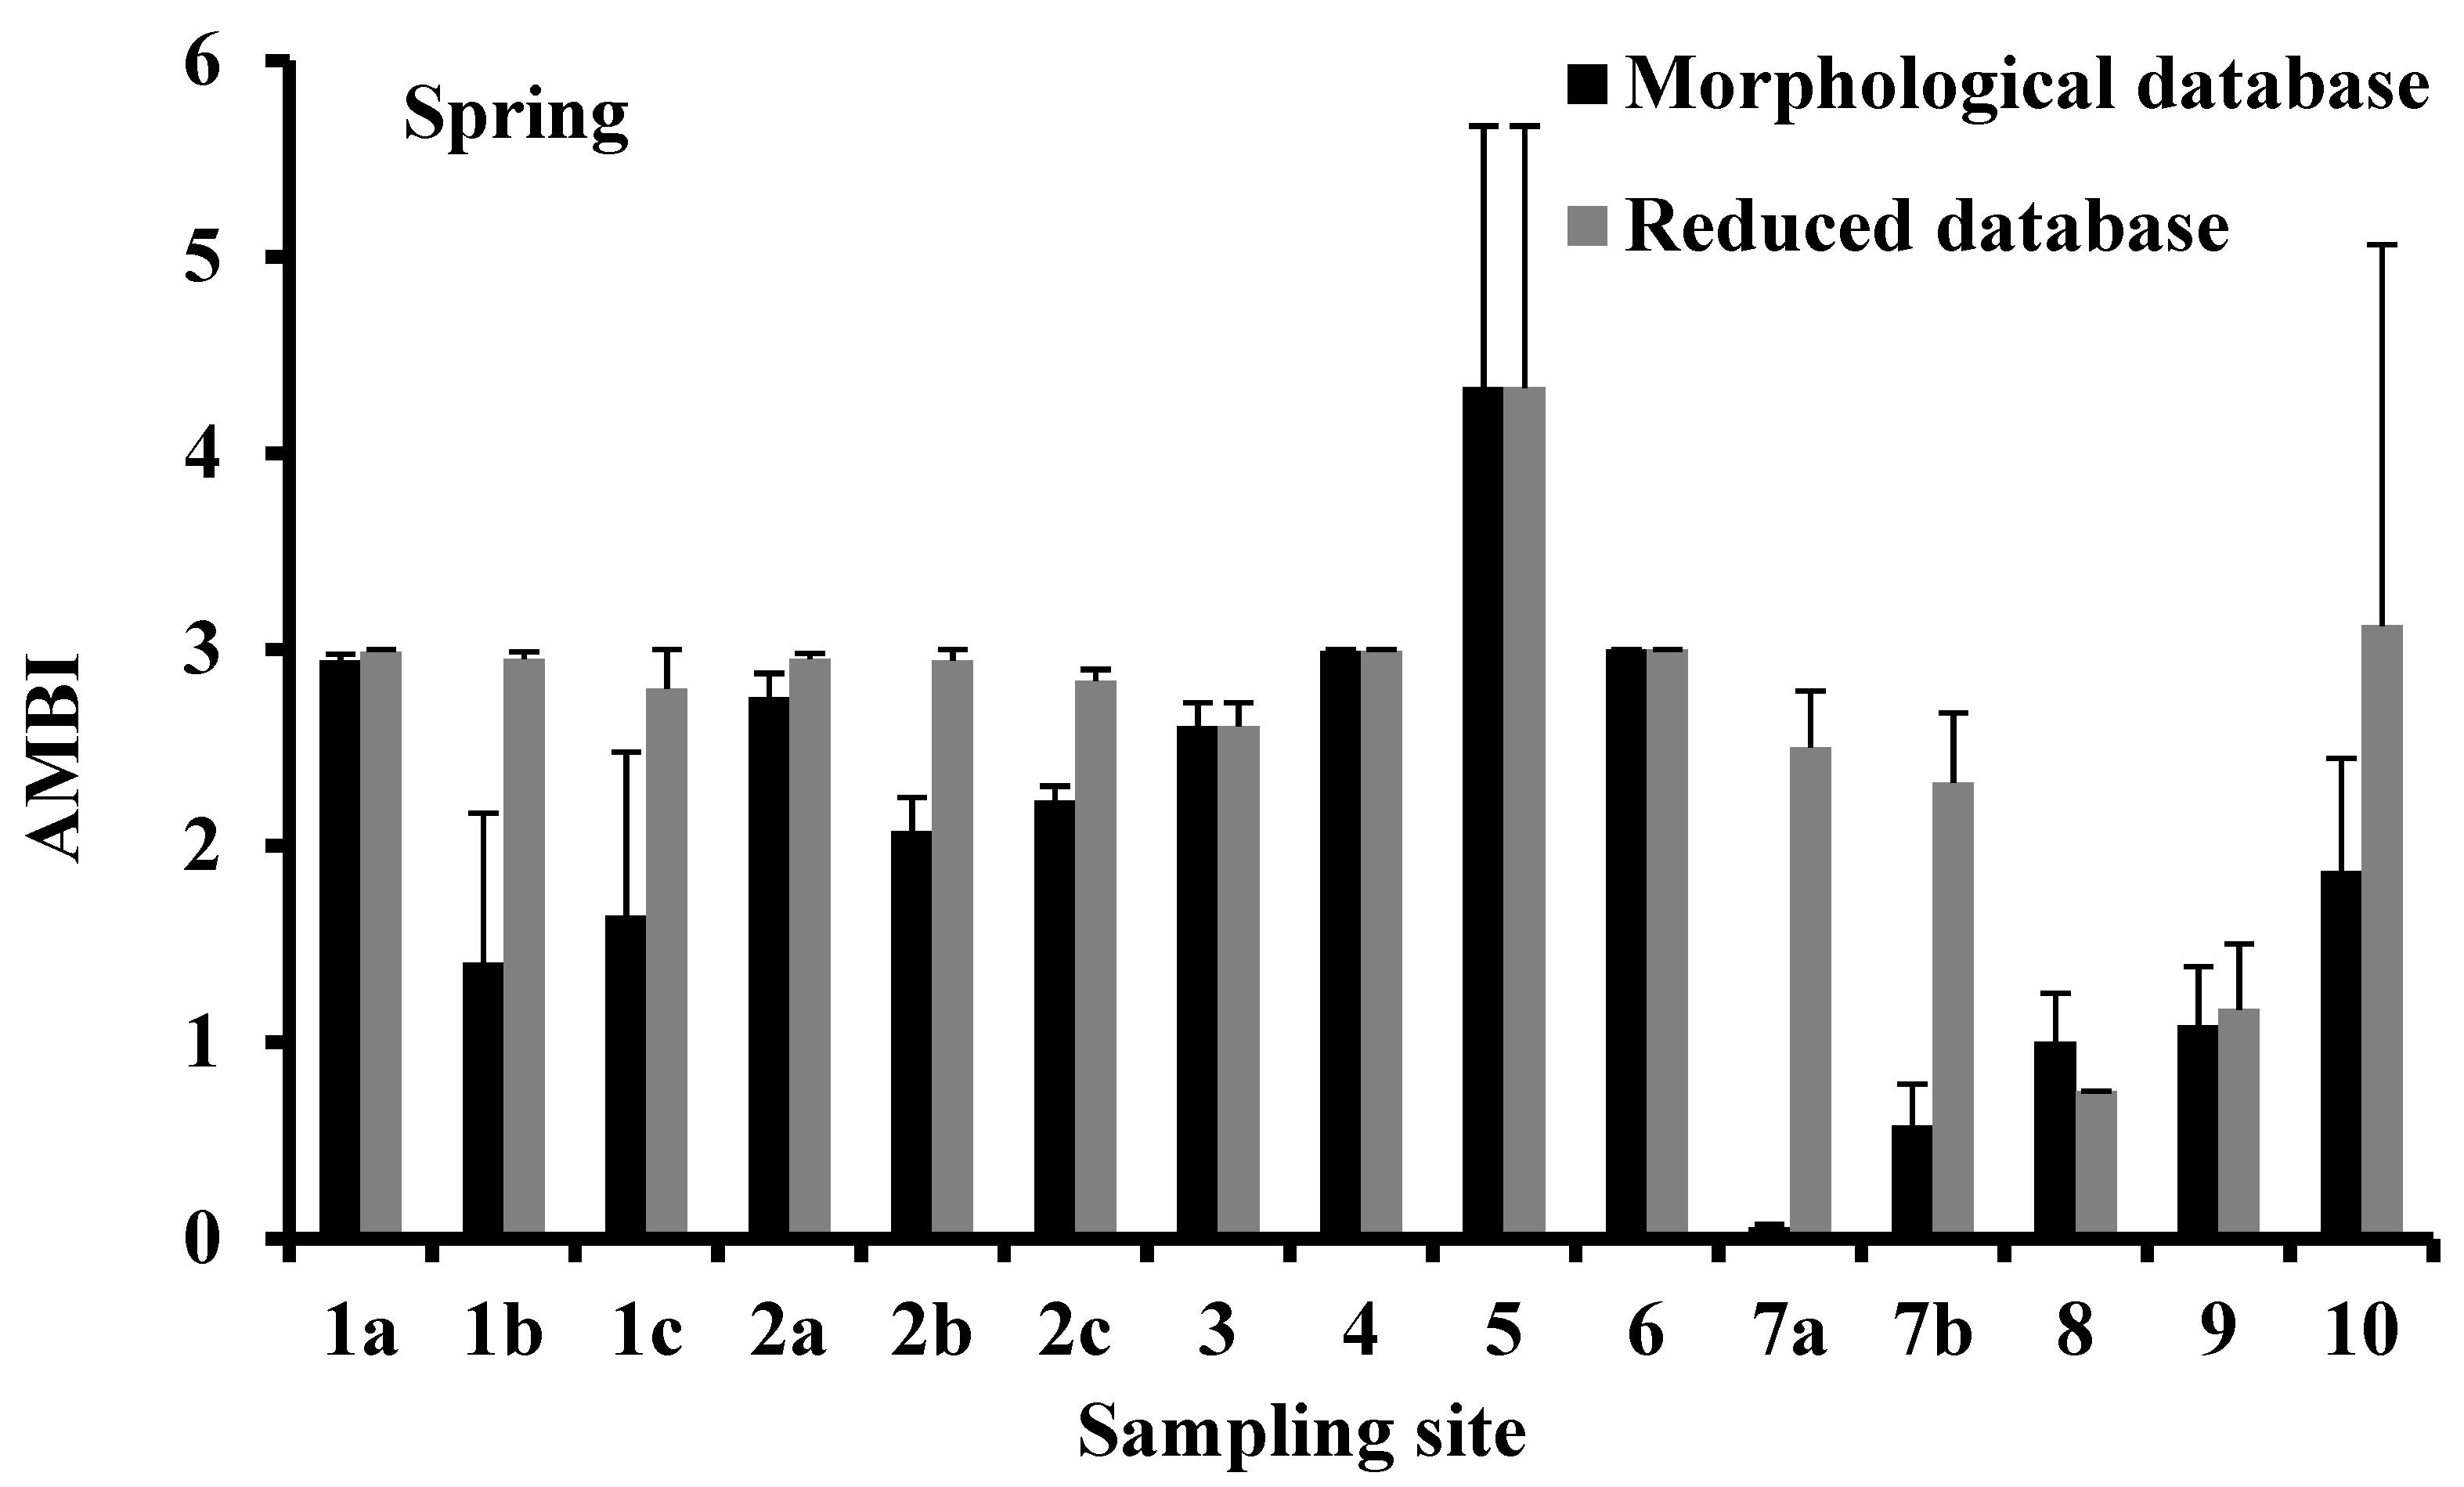
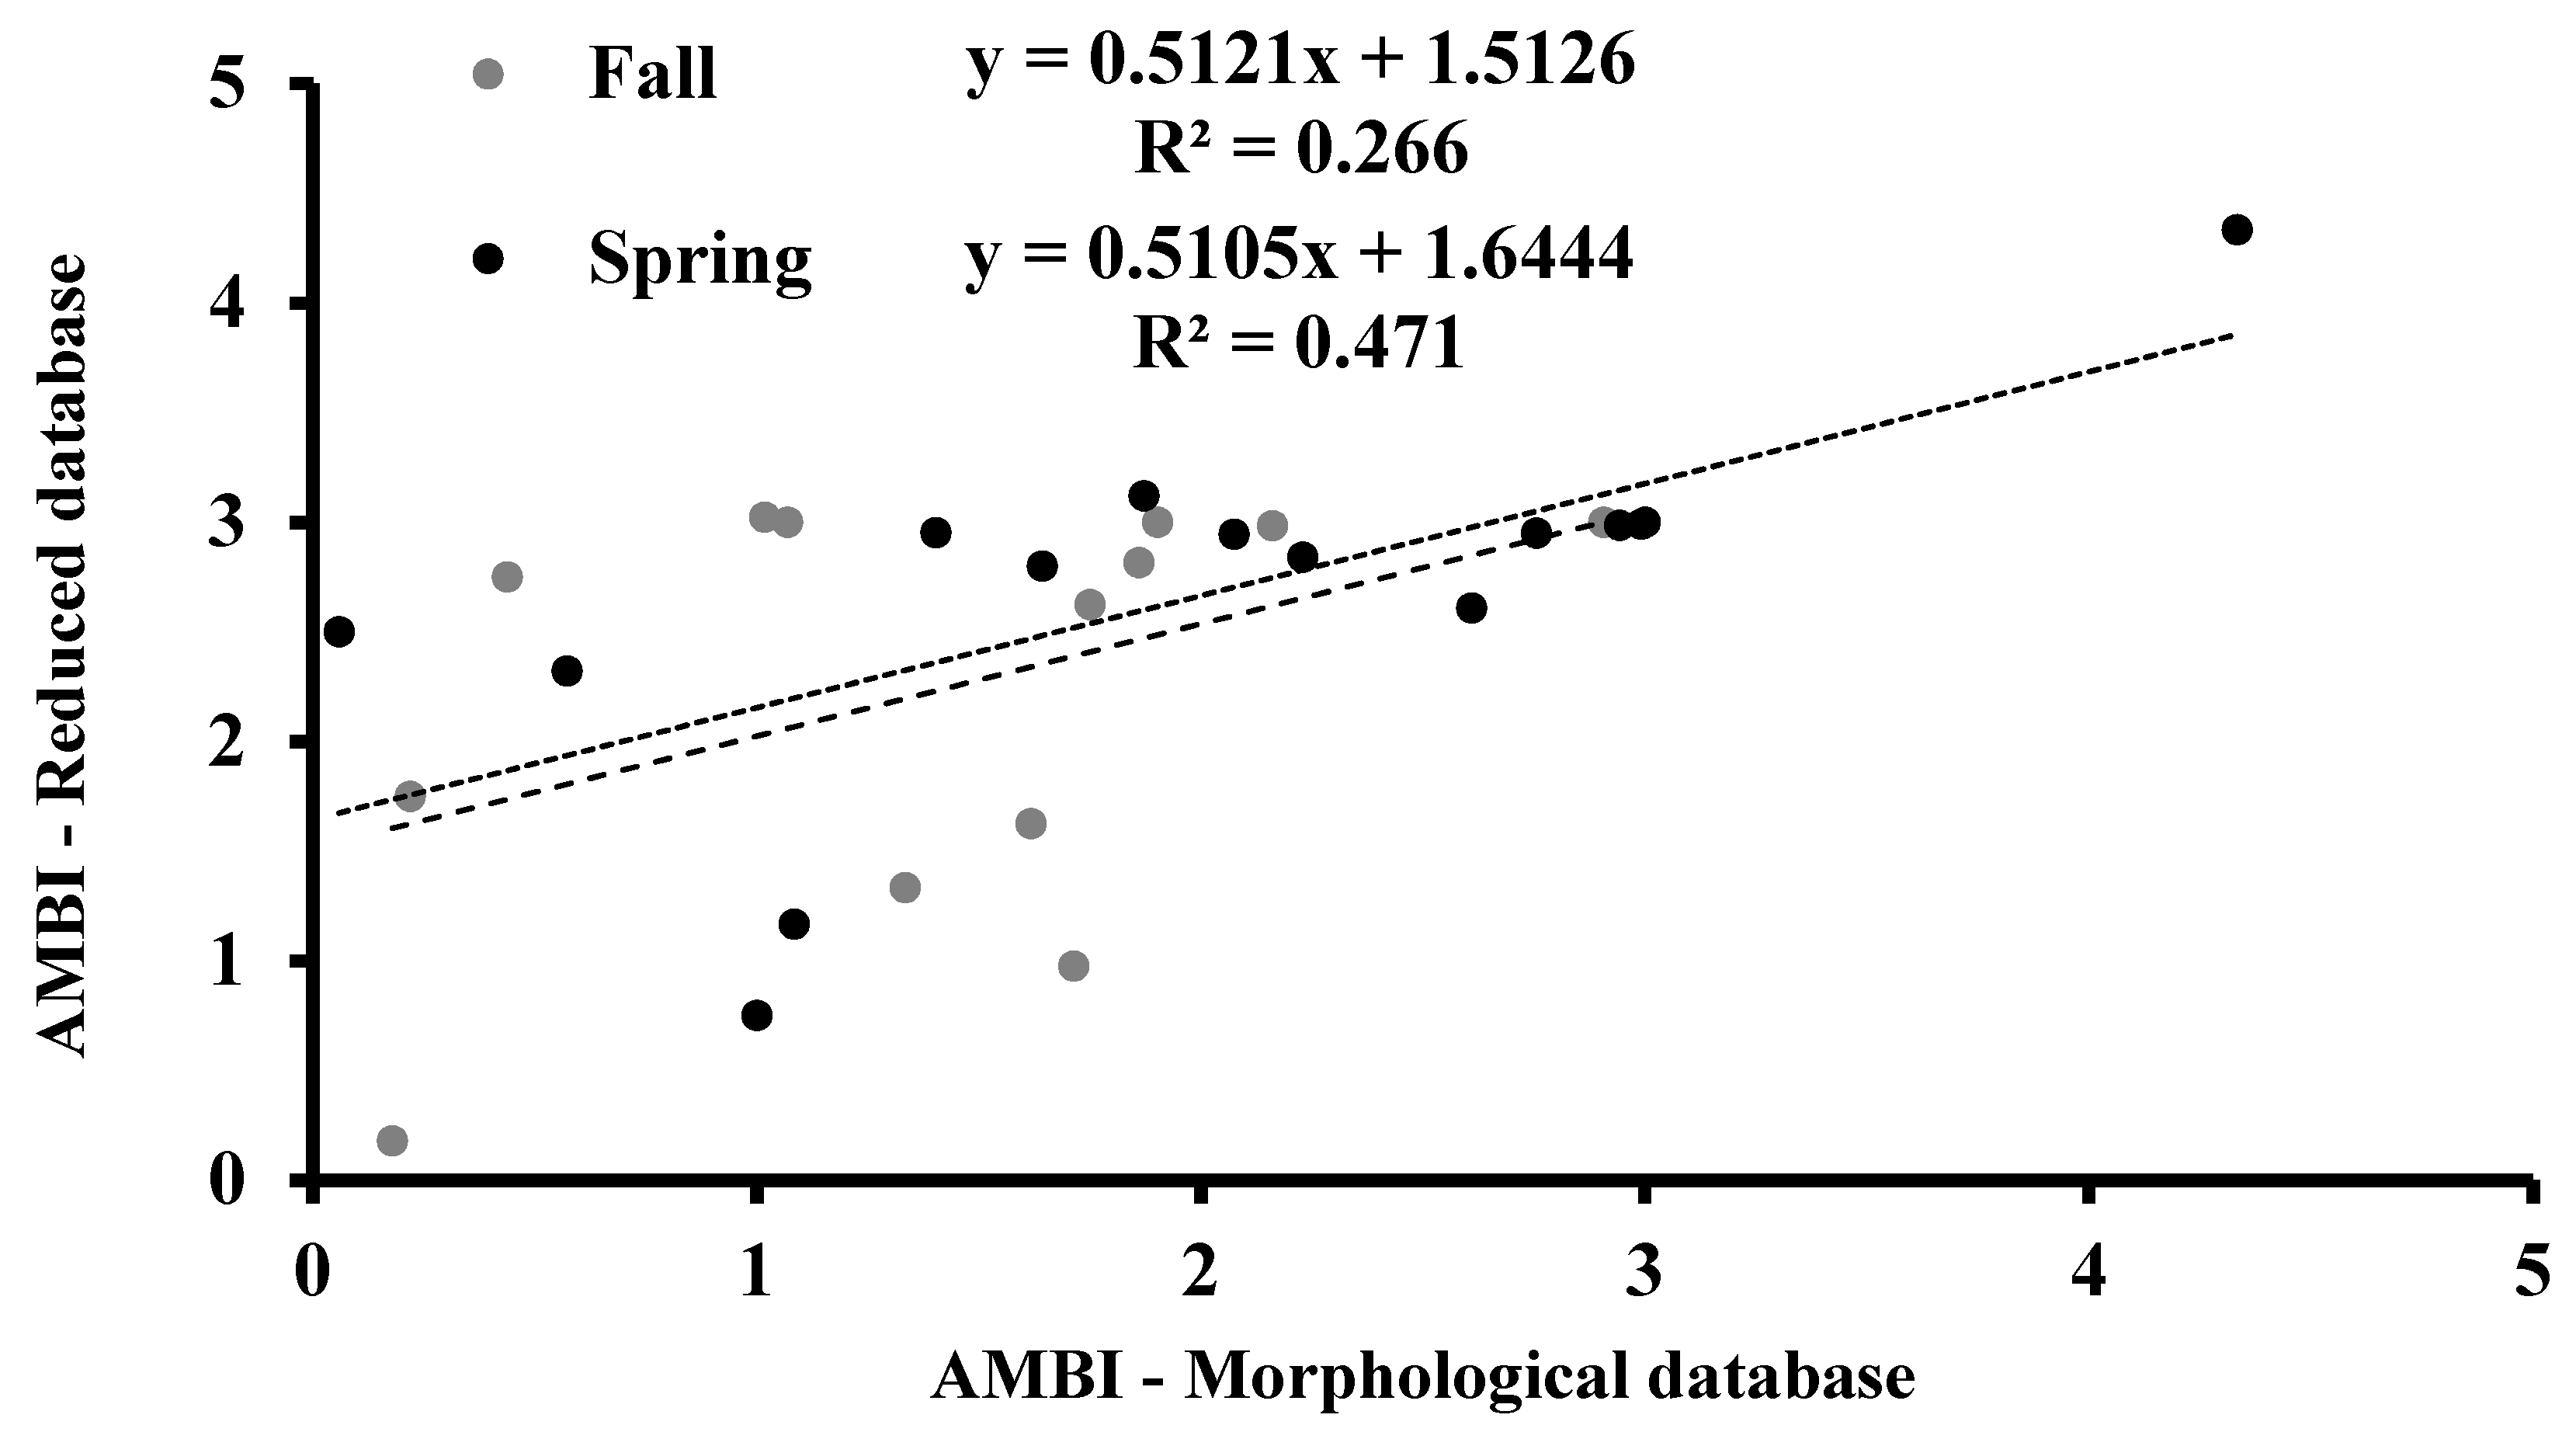
3.4. AMBI
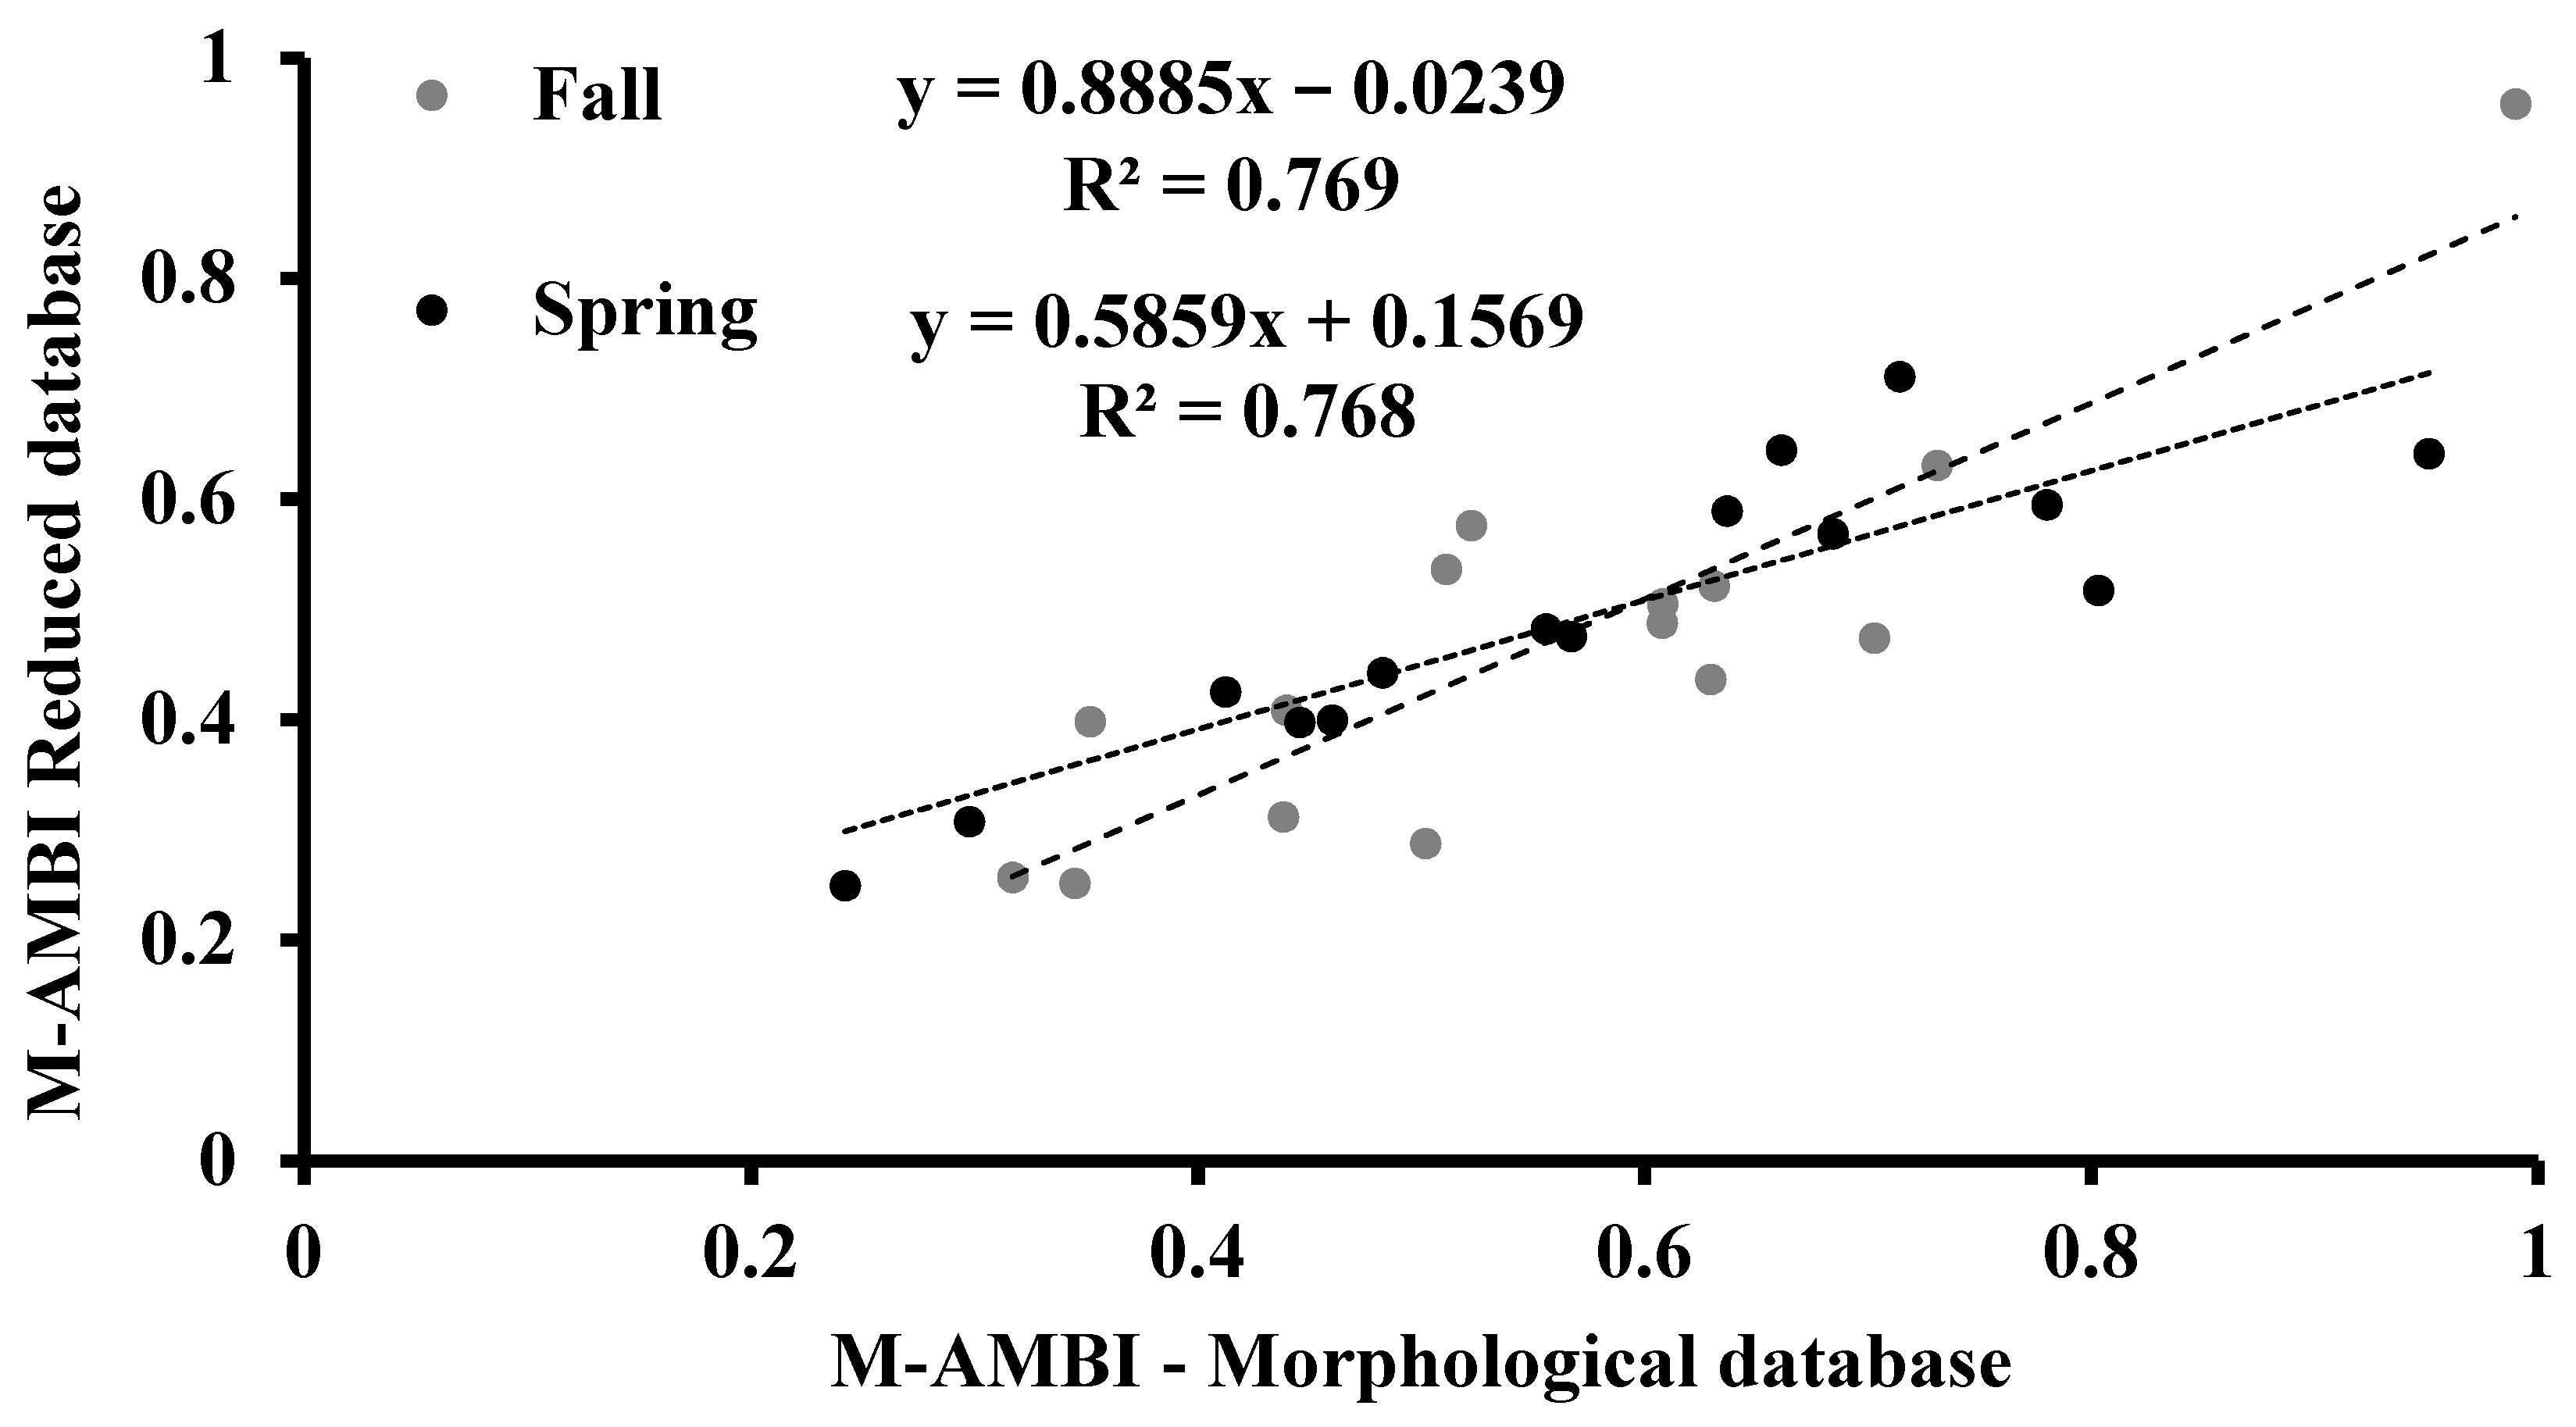
3.5. M-AMBI
3.6. Comparison of Ecological Quality Status Assignment to the Transitional Water Ecosystems Using Morphological and DNA Barcode Databases
3.7. Primers and DNA-Barcoded Region Analysis
3.8. Interspecific Genetic Distance Analysis
4. Discussion
5. Conclusions
Supplementary Materials
Author Contributions
Funding
Institutional Review Board Statement
Informed Consent Statement
Data Availability Statement
Acknowledgments
Conflicts of Interest
References
- Pawlowski, J.; Kelly-Quinn, M.; Altermatt, F.; Apothéloz-Perret-Gentil, L.; Beja, P.; Boggero, A.; Borja, A.; Bouchez, A.; Cordier, T.; Domaizon, I.; et al. The future of biotic indices in the ecogenomic era: Integrating (e)DNA metabarcoding in biological assessment of aquatic ecosystems. Sci. Total Environ. 2018, 637–638, 1295–1310. [Google Scholar] [CrossRef]
- Borja, A.; Franco, J.; Pérez, V. A Marine Biotic Index to Establish the Ecological Quality of Soft-Bottom Benthos Within European Estuarine and Coastal Environments. Mar. Pollut. Bull. 2000, 40, 1100–1114. [Google Scholar] [CrossRef]
- Simboura, N.; Zenetos, A. Benthic indicators to use in Ecological Quality classification of Mediterranean soft bottom marine ecosystems, including a new Biotic Index. Mediterr. Mar. Sci. 2002, 3, 77. [Google Scholar] [CrossRef] [Green Version]
- Bellino, A.; Mangano, M.C.; Baldantoni, D.; Russell, B.D.; Mannino, A.M.; Mazzola, A.; Vizzini, S.; Sarà, G. Seasonal patterns of biodiversity in Mediterranean coastal lagoons. Divers. Distrib. 2019, 25, 1512–1526. [Google Scholar] [CrossRef] [Green Version]
- Orfanidis, S.; Papathanasiou, V.; Sabetta, L.; Pinna, M.; Gigi, V.; Gounaris, S.; Tsiagga, E.; Nakou, K.; Theodosiou, T.H. Benthic macrophyte communities as bioindicators of transitional and coastal waters: Relevant approaches and tools. Transit. Waters Bull. 2007, 1, 45–49. [Google Scholar]
- Orfanidis, S.; Pinna, M.; Sabetta, L.; Stamatis, N.; Nakou, K. Variation of structural and functional metrics in macrophyte communities within two habitats of eastern Mediterranean coastal lagoons: Natural versus human effects. Aquat. Conserv. Mar. Freshw. Ecosyst. 2008, 18, S45–S61. [Google Scholar] [CrossRef]
- Ponti, M.; Vadrucci, M.R.; Orfanidis, S.; Pinna, M. Biotic indices for ecological status of transitional water ecosystems. Transit. Waters Bull. 2009, 3, 32–90. [Google Scholar]
- Pinto, R.; Patriício, J.; Baeta, A.; Fath, B.D.; Neto, J.M.; Marques, J.C. Review and evaluation of estuarine biotic indices to assess benthic condition. Ecol. Indic. 2009, 9, 1–25. [Google Scholar] [CrossRef] [Green Version]
- Elbrecht, V.; Vamos, E.E.; Meissner, K.; Aroviita, J.; Leese, F. Assessing strengths and weaknesses of DNA metabarcoding-based macroinvertebrate identification for routine stream monitoring. Methods Ecol. Evol. 2017, 8, 1265–1275. [Google Scholar] [CrossRef] [Green Version]
- Reizopoulou, S.; Nicolaidou, A. Index of size distribution (ISD): A method of quality assessment for coastal lagoons. Hydrobiologia 2007, 577, 141–149. [Google Scholar] [CrossRef]
- Logez, M.; Pont, D. Development of metrics based on fish body size and species traits to assess European coldwater streams. Ecol. Indic. 2011, 11, 1204–1215. [Google Scholar] [CrossRef]
- Lucena-Moya, P.; Pardo, I. An invertebrate multimetric index to classify the ecological status of small coastal lagoons in the Mediterranean ecoregion (MIBIIN). Mar. Freshw. Res. 2012, 63, 801–814. [Google Scholar] [CrossRef]
- Gessner, M.O.; Chauvet, E. A case for using litter breakdown to assess functional stream integrity. Ecol. Appl. 2002, 12, 498–510. [Google Scholar] [CrossRef]
- Pinna, M.; Sangiorgio, F.; Fonnesu, A.; Basset, A. Spatial variation of plant detritus processing in a Mediterranean river type: The case of River Tirso basin (Sardinia, Italy). J. Environ. Sci. 2003, 15, 227–240. [Google Scholar]
- Kominoski, J.S.; Pringle, C.M.; Ball, B.A.; Bradford, M.A.; Coleman, D.C.; Hall, D.B.; Hunter, M.D. Nonadditive effects of leaf litter species diversity on breakdown dynamics in a detritus-based stream. Ecology 2007, 88, 1167–1176. [Google Scholar] [CrossRef] [PubMed]
- Wallace, J.B.; Webster, J.R.; Cuffney, T.F. Stream detritus dynamics: Regulation by invertebrate consumers. Oecologia 1982, 53, 197–200. [Google Scholar] [CrossRef]
- Wissinger, S.A.; Perchik, M.E.; Klemmer, A.J. Role of animal detritivores in the breakdown of emergent plant detritus in temporary ponds. Freshw. Sci. 2018, 3, 826–835. [Google Scholar] [CrossRef]
- Di Sabatino, A.; Cicolani, B.; Miccoli, F.P.; Cristiano, G. Plant detritus origin and microbial–detritivore interactions affect leaf litter breakdown in a Central Apennine (Italy) cold spring. Aquat. Ecol. 2020, 54, 495–504. [Google Scholar] [CrossRef]
- Wu, W.; Huang, H.; Biber, P.; Bethel, M. Litter decomposition of Spartina alterniflora and Juncus roemerianus: Implications of climate change in salt marshes. J. Coast. Res. 2017, 33, 372–384. [Google Scholar] [CrossRef]
- Bozinovic, F.; Munoz, J.L.P.; Cruz-Neto, A.P. Intraspecific variability in the basal metabolic rate: Testing the food habits hypothesis. Physiol. Biochem. Zool. 2007, 80, 452–460. [Google Scholar] [CrossRef] [PubMed]
- Di Sabatino, A.; Cristiano, G.; Pinna, M.; Lombardo, P.; Miccoli, F.P.; Marini, G.; Vignini, P.; Cicolani, B. Structure, functional organization and biological traits of macroinvertebrate assemblages from leaf-bags and benthic samples in a third-order stream of Central Apennines (Italy). Ecol. Indic. 2014, 46, 84–91. [Google Scholar] [CrossRef]
- Silow, E.A.; In-Hye, O. Aquatic ecosystem assessment using exergy. Ecol. Indic. 2004, 4, 189–198. [Google Scholar] [CrossRef]
- Rosenberg, D.M.; Resh, V.H. Introduction to Freshwater Biomonitoring and Benthic Macroinvertebrates. In Freshwater Biomonitoring and Benthic Macroinvertebrates; Rosenberg, D.M., Resh, V.H., Eds.; Chapman/Hall: New York, NY, USA, 1993; pp. 1–9. [Google Scholar]
- Basset, A.; Barbone, E.; Rosati, I.; Vignes, F.; Breber, P.; Specchiulli, A.; D’Adamo, R.; Renzi, M.; Focardi, S.; Ungaro, N.; et al. Resistance and resilience of ecosystem descriptors and properties to dystrophic events: A study case in a Mediterranean lagoon. Transit. Waters Bull. 2013, 7, 1–22. [Google Scholar]
- Dauer, D.M. Biological criteria, environmental health and estuarine macrobenthic community structure. Mar. Pollut. Bull. 1993, 26, 249–257. [Google Scholar] [CrossRef]
- Petchey, O.L.; Belgrano, A. Body-size distributions and size-spectra: Universal indicators of ecological status? Biol. Lett. 2010, 6, 434–437. [Google Scholar] [CrossRef] [Green Version]
- Sharma, K.K.; Chowdhary, S. Macroinvertebrate assemblages as biological indicators of pollution in a Central Himalayan River, Tawi (JK). Int. J. Biodivers. Conserv. 2011, 3, 167–174. [Google Scholar] [CrossRef]
- Pinna, M.; Janzen, S.; Franco, A.; Specchia, V.; Marini, G. Role of habitats and sampling techniques on macroinvertebrate descriptors and ecological indicators: An experiment in a protected Mediterranean lagoon. Ecol. Indic. 2017, 83, 495–503. [Google Scholar] [CrossRef]
- Barbone, E.; Rosati, I.; Pinna, M.; Basset, A. Taxonomic and dimensional structure of benthic macroinvertebrate guilds in the Margherita di Savoia Salt Pans (Italy). Transit. Waters Bull. 2007, 1, 21–31. [Google Scholar] [CrossRef]
- Pawlowski, M.B.; Branstrator, D.K.; Hrabik, R. Major shift in the phenology of crustacean biomass in western Lake Superior associated with temperature anomaly. J. Great Lakes Res. 2018, 44, 788–797. [Google Scholar] [CrossRef]
- Aylagas, E.; Borja, A.; Pochon, X.; Zaiko, A.; Keeley, N.; Bruce, K.; Hong, P.; Ruiz, G.M.; Stein, E.D.; Theroux, S.; et al. Translational Molecular Ecology in practice: Linking DNA-based methods to actionable marine environmental management. Sci. Total Environ. 2020, 744, 140780. [Google Scholar] [CrossRef]
- Hajibabaei, M.; Shokralla, S.; Zhou, X.; Singer, G.A.C.; Baird, D.J. Environmental barcoding: A next-generation sequencing approach for biomonitoring applications using river benthos. PLoS ONE 2011, 6, e17497. [Google Scholar] [CrossRef] [Green Version]
- Carew, M.E.; Pettigrove, V.J.; Metzeling, L.; Hoffmann, A.A. Environmental monitoring using next generation sequencing: Rapid identification of macroinvertebrate bioindicator species. Front. Zool. 2013, 10, 45. [Google Scholar] [CrossRef] [Green Version]
- Elbrecht, V.; Leese, F. Can DNA-Based Ecosystem Assessments Quantify Species Abundance? Testing Primer Bias and Biomass-Sequence Relationships with an Innovative Metabarcoding Protocol. PLoS ONE 2015, 10, e0130324. [Google Scholar] [CrossRef] [PubMed]
- Elbrecht, V.; Leese, F. Validation and development of COI metabarcoding primers for freshwater macroinvertebrate bioassessment. Front. Environ. Sci. 2017, 5, 11. [Google Scholar] [CrossRef] [Green Version]
- Leese, F.; Altermatt, F.; Bouchez, A.; Ekrem, T.; Hering, D.; Meissner, K.; Mergen, P.; Pawlowski, J.; Piggott, J.J.; Rimet, F.; et al. DNAqua-Net: Developing new genetic tools for bioassessment and monitoring of aquatic ecosystems in Europe. Res. Ideas Outcomes 2016, 2, e11321. [Google Scholar] [CrossRef] [Green Version]
- Hering, D.; Borja, A.; Jones, J.I.; Pont, D.; Boets, P.; Bouchez, A.; Bruce, K.; Drakare, S.; Hänfling, B.; Kahlert, M.; et al. Implementation options for DNA-based identification into ecological status assessment under the European water framework directive. Water Res. 2018, 138, 192–205. [Google Scholar] [CrossRef]
- Beentjes, K.K.; Speksnijder, A.G.C.L.; Schilthuizen, M.; Schaub, B.E.; Van Der Hoorn, B.B. The influence of macroinvertebrate abundance on the assessment of freshwater quality in The Netherlands. Metabarcoding Metagenom. 2018, 2, e26744. [Google Scholar] [CrossRef] [Green Version]
- Hebert, P.D.; Cywinska, A.; Ball, S.L.; de Waard, J.R. Biologcal identifications through DNA barcodes. Proc. Biol. Sci. 2003, 270, 313–321. [Google Scholar] [CrossRef] [Green Version]
- Sweeney, B.W.; Battle, J.M.; Jackson, J.K.; Dapkey, T. Can DNA barcodes of stream macroinvertebrates improve descriptions of community structure and water quality? J. N. Am. Benthol. Soc. 2011, 30, 195–216. [Google Scholar] [CrossRef]
- Kress, W.J.; García-Robledo, C.; Uriarte, M.; Erickson, D.L. DNA barcodes for ecology, evolution, and conservation. Trends Ecol. Evol. 2015, 30, 25–35. [Google Scholar] [CrossRef] [PubMed]
- Aylagas, E.; Borja, A.; Rodriguez-Ezpeleta, N. Environmental status assessment using DNA metabarcoding: Towards a genetics based Marine Biotic Index (gAMBI). PLoS ONE 2014, 9, e90529. [Google Scholar] [CrossRef] [Green Version]
- Leray, M.; Knowlton, N. DNA barcoding and metabarcoding of standardized samples reveal patterns of marine benthic diversity. Proc. Natl. Acad. Sci. USA 2015, 112, 2076–2081. [Google Scholar] [CrossRef] [Green Version]
- Aylagas, E.; Borja, Á.; Muxika, I.; Rodríguez-Ezpeleta, N. Adapting metabarcoding-based benthic biomonitoring into routine marine ecological status assessment networks. Ecol. Indic. 2018, 95, 194–202. [Google Scholar] [CrossRef]
- Weigand, H.; Beermann, A.J.; Čiampor, F.; Costa, F.O.; Csabai, Z.; Duarte, S.; Geigerg, M.F.; Grabowski, M.; Rimet, F.; Rulik, B.; et al. DNA barcode reference libraries for the monitoring of aquatic biota in Europe: Gap-analysis and recommendations for future work. Sci. Total Environ. 2019, 678, 499–524. [Google Scholar] [CrossRef] [PubMed]
- Specchia, V.; Tzafesta, E.; Marini, G.; Scarcella, S.; D’Attis, S.; Pinna, M. Gap Analysis for DNA Barcode Reference Libraries for Aquatic Macroinvertebrate Species in the Apulia Region (Southeast of Italy). J. Mar. Sci. Eng. 2020, 8, 538. [Google Scholar] [CrossRef]
- Kelly, R.P.; Closek, C.J.; O’Donnell, J.L.; Kralj, J.E.; Shelton, A.O.; Samhouri, J.F. Genetic and manual survey methods yield different and complementary views of an ecosystem. Front. Mar. Sci. 2017, 3, 283. [Google Scholar] [CrossRef] [Green Version]
- Leite, B.; Vieira, P.; Teixeira, M.; Lobo-Arteaga, J.; Hollatz, C.; Borges, L.; Duarte, S.; Troncoso, J.; Costa, F. Gap-analysis and annotated reference library for supporting macroinvertebrate metabarcoding in Atlantic Iberia. Reg. Stud. Mar. Sci. 2020, 36, 101307. [Google Scholar] [CrossRef]
- Elbrecht, V.; Leese, F. PrimerMiner: An r package for development and in silico validation of DNA metabarcoding primers. Methods Ecol. Evol. 2016, 8, 622–626. [Google Scholar] [CrossRef]
- Kozlov, A.M.; Darriba, D.; Flouri, T.; Morel, B.; Stamatakis, A. RAxML-NG: A fast, scalable, and user-friendly tool for maximum likelihood phylogenetic inference. Bioinformatics 2019, 35, 4453–4455. [Google Scholar] [CrossRef] [Green Version]
- Zhang, J.; Kapli, P.; Pavlidis, P.; Stamatakis, A. A general species delimitation method with applications to phylogenetic placements. Bioinformatics 2013, 29, 2869–2876. [Google Scholar] [CrossRef] [Green Version]
- White, B.P.; Pilgrim, E.M.; Boykin, L.M.; Stein, E.D.; Mazor, R.D. Comparison of four species-delimitation methods applied to a DNA barcode data set of insect larvae for use in routine bioassessment. Freshw. Sci. 2014, 33, 338–348. [Google Scholar] [CrossRef]
- Saitou, N.; Nei, M. The neighbor-joining method: A new method for reconstructing phylogenetic trees. Mol. Biol. Evol. 1987, 4, 406–425. [Google Scholar] [CrossRef] [PubMed]
- Tamura, K.; Nei, M.; Kumar, S. Prospects for inferring very large phylogenies by using the neighbor-joining method. Proc. Natl. Acad. Sci. USA 2004, 101, 11030–11035. [Google Scholar] [CrossRef] [Green Version]
- Zharkikh, A.; Li, W.H. Statistical properties of bootstrap estimation of phylogenetic variability from nucleotide sequences: II. Four taxa without a molecular clock. J. Mol. Evol. 1992, 35, 356–366. [Google Scholar] [CrossRef]
- Cerca, J.; Meyer, C.; Purschke, G.; Struck, T.H. Delimitation of cryptic species drastically reduces the geographical ranges of marine interstitial ghost-worms (Stygocapitella; Annelida, Sedentaria). Mol. Phylogenet. Evol. 2019, 143, 106663. [Google Scholar] [CrossRef]
- Jungcurt, T.; Bocksberger, G.; Brüggemann, W.; Berberich, T. Phylogenetic relationship and molecular taxonomy of African grasses of the genus Panicum inferred from four chloroplast DNA-barcodes and nuclear gene sequences. J. Plant Res. 2012, 126, 363–371. [Google Scholar] [CrossRef]
- Lee, T.R.C.; Anderson, S.J.; Tran-Nguyen, L.T.T.; Sallam, N.; Le Ru, B.P.; Conlong, D.; Powell, K.; Ward, A.; Mitchell, A. Towards a global DNA barcode reference library for quarantine identifications of lepidopteran stemborers, with an emphasis on sugarcane pests. Sci. Rep. 2019, 9, 7039. [Google Scholar] [CrossRef]
- Pinto, M.; Ojala-Barbour, R.; Brito, J.; Menchaca, A.; Carvalho, A.L.; Weksler, M.; Amato, G.; Lee, T. Rodents of the eastern and western slopes of the Tropical Andes: Phylogenetic and taxonomic insights using DNA barcodes. Therya 2018, 9, 15–27. [Google Scholar] [CrossRef] [Green Version]
- Peña, V.; De Clerck, O.; Afonso-Carrillo, J.; Ballesteros, E.; Bárbara, I.; Barreiro, R.; Le Gall, L. An integrative systematic approach to species diversity and distribution in the genusMesophyllum(Corallinales, Rhodophyta) in Atlantic and Mediterranean Europe. Eur. J. Phycol. 2014, 50, 20–36. [Google Scholar] [CrossRef]
- Silva, F.; Wiedenbrug, S. Integrating DNA barcodes and morphology for species delimitation in the Corynoneura group (Diptera: Chironomidae: Orthocladiinae). Bull. Entomol. Res. 2014, 104, 65–78. [Google Scholar] [CrossRef] [PubMed]
- Liu, J.; Jiang, J.; Song, S.; Tornabene, L.; Chabarria, R.; Naylor, G.J.P.; Li, C. Multilocus DNA barcoding–Species Identification with Multilocus Data. Sci. Rep. 2017, 7, 16601. [Google Scholar] [CrossRef] [PubMed] [Green Version]


| Lagoon/Sampling Site | Fall | Spring | ||
|---|---|---|---|---|
| Morphological Database | Reduced Database | Morphological Database | Reduced Database | |
| 1a | Moderate | Poor | Poor | Poor |
| 1b | Poor | Bad | Moderate | Moderate |
| 1c | Moderate | Moderate | Poor | Poor |
| 2a | Poor | Poor | Good | Good |
| 2b | Moderate | Poor | Poor | Poor |
| 2c | Bad | Bad | Good | Moderate |
| 3 | Bad | Bad | Bad | Bad |
| 4 | Poor | Poor | Bad | Bad |
| 5 | Bad | Bad | Bad | Bad |
| 6 | Bad | Bad | Bad | Bad |
| 7a | Bad | Bad | Bad | Bad |
| 7b | Poor | Poor | Moderate | Moderate |
| 8 | Moderate | Bad | Moderate | Moderate |
| 9 | Poor | Moderate | Moderate | Poor |
| 10 | High | High | Good | Moderate |
Publisher’s Note: MDPI stays neutral with regard to jurisdictional claims in published maps and institutional affiliations. |
© 2021 by the authors. Licensee MDPI, Basel, Switzerland. This article is an open access article distributed under the terms and conditions of the Creative Commons Attribution (CC BY) license (https://creativecommons.org/licenses/by/4.0/).
Share and Cite
Pinna, M.; Saccomanno, B.; Marini, G.; Zangaro, F.; Kabayeva, A.; Khalaj, M.; Shaimardan, L.; D’Attis, S.; Tzafesta, E.; Specchia, V. Testing the Influence of Incomplete DNA Barcode Libraries on Ecological Status Assessment of Mediterranean Transitional Waters. Biology 2021, 10, 1092. https://doi.org/10.3390/biology10111092
Pinna M, Saccomanno B, Marini G, Zangaro F, Kabayeva A, Khalaj M, Shaimardan L, D’Attis S, Tzafesta E, Specchia V. Testing the Influence of Incomplete DNA Barcode Libraries on Ecological Status Assessment of Mediterranean Transitional Waters. Biology. 2021; 10(11):1092. https://doi.org/10.3390/biology10111092
Chicago/Turabian StylePinna, Maurizio, Benedetta Saccomanno, Gabriele Marini, Francesco Zangaro, Akbota Kabayeva, Mina Khalaj, Laura Shaimardan, Simona D’Attis, Eftychia Tzafesta, and Valeria Specchia. 2021. "Testing the Influence of Incomplete DNA Barcode Libraries on Ecological Status Assessment of Mediterranean Transitional Waters" Biology 10, no. 11: 1092. https://doi.org/10.3390/biology10111092