
Machine Learning and Regression Analysis to Model the Length of Hospital Stay in Patients with Femur Fracture

 , , , ,
Abstract
:1. Introduction
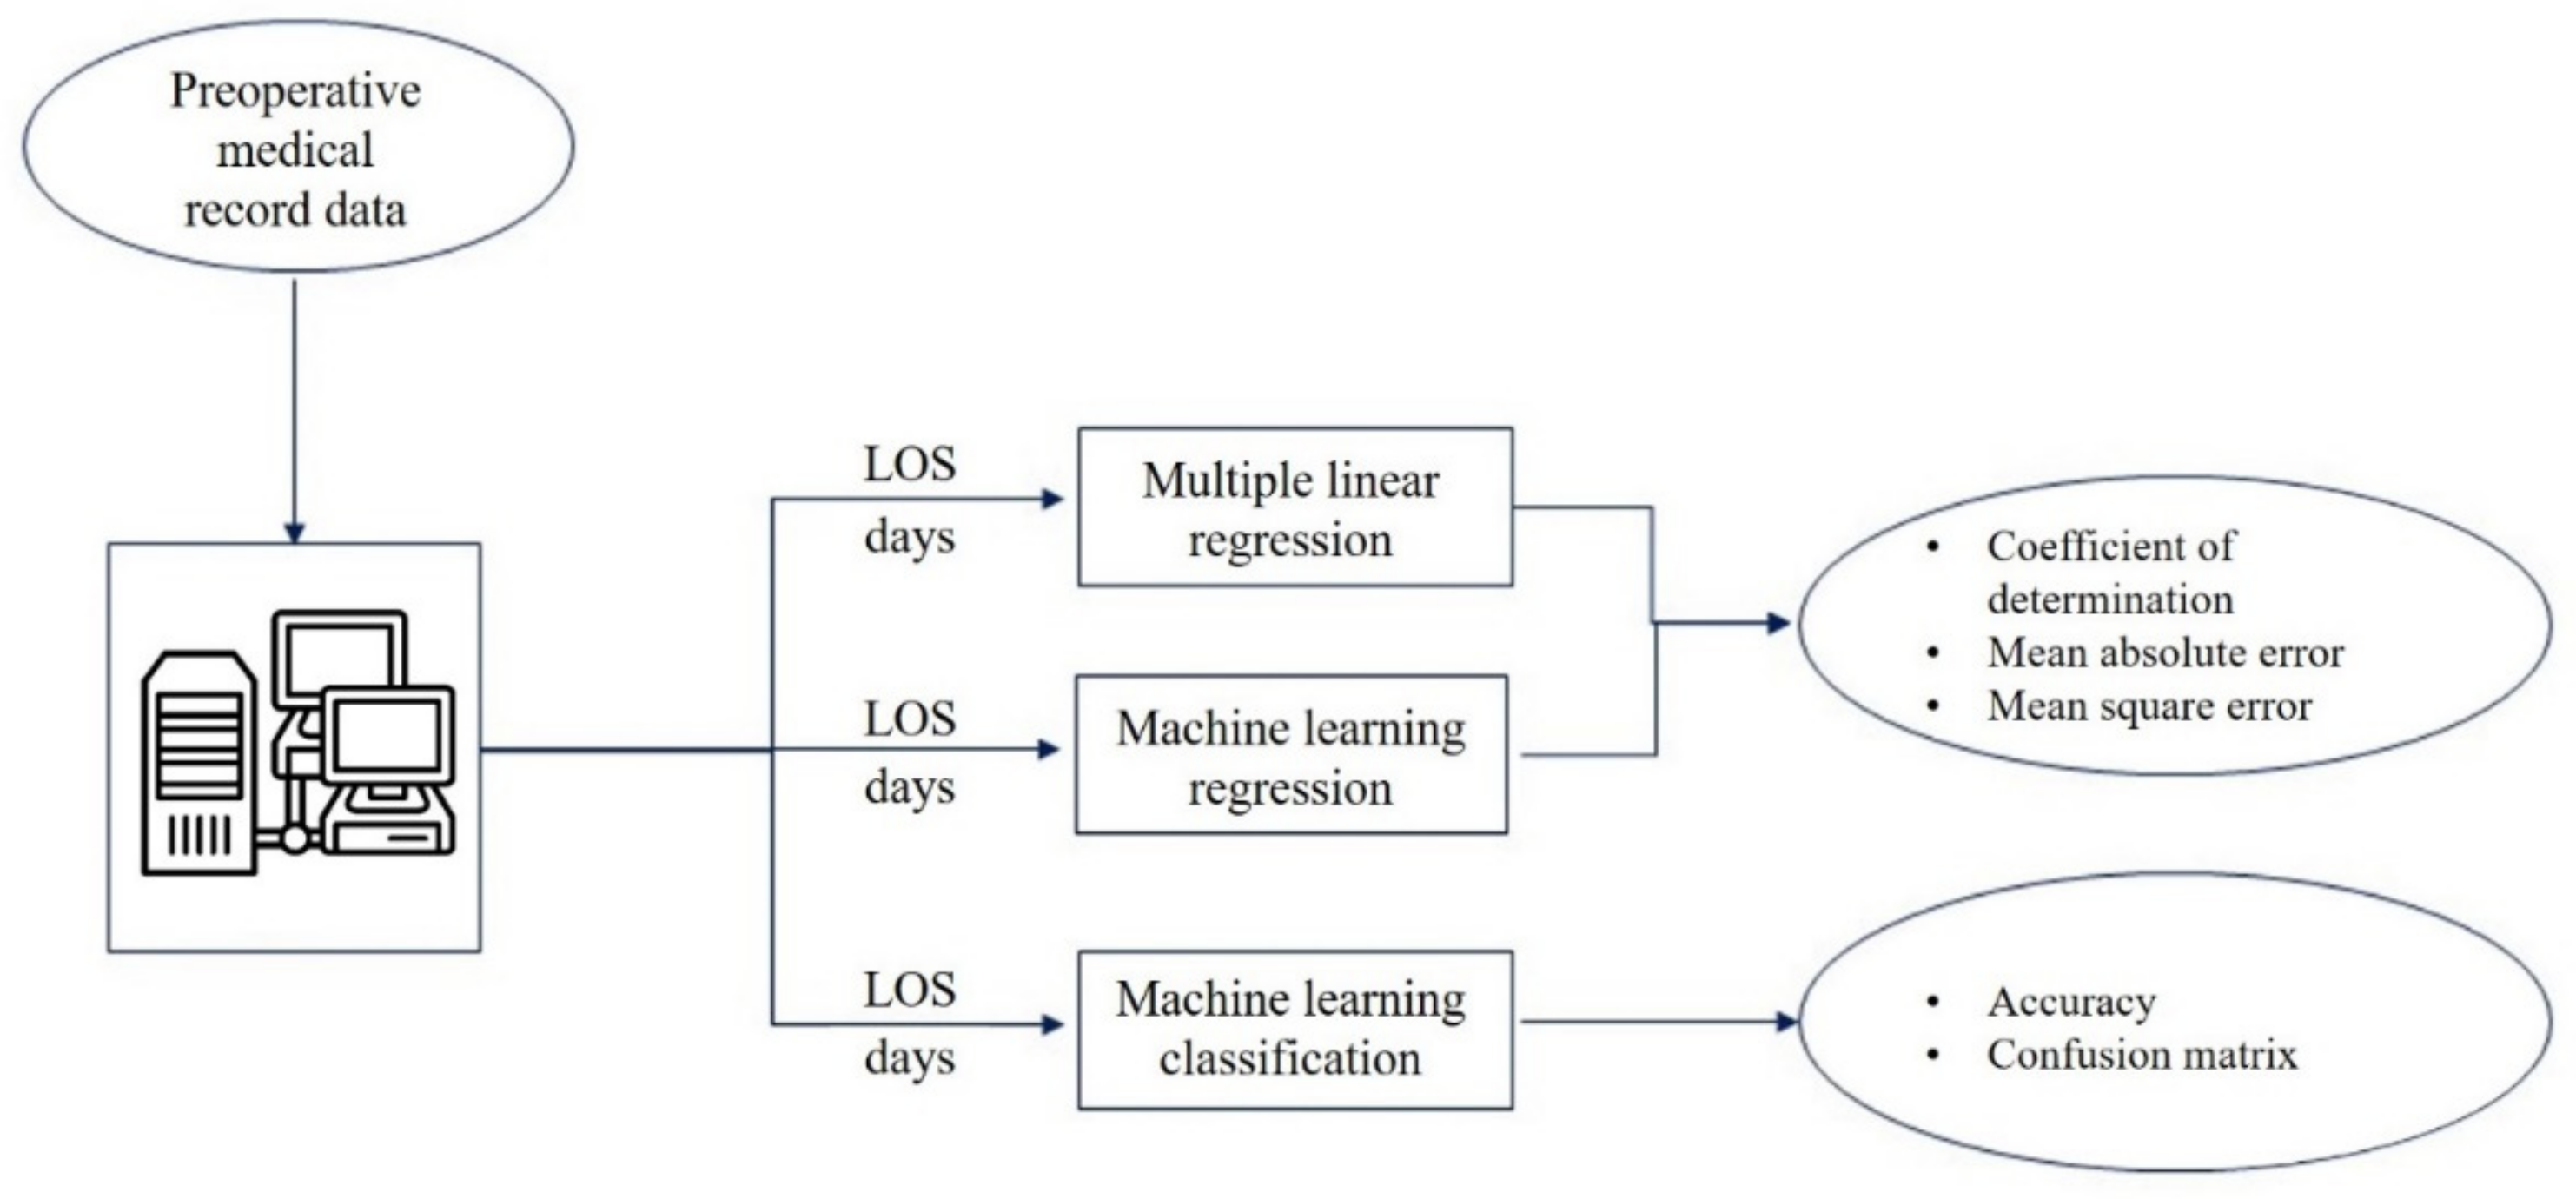
2. Materials and Methods
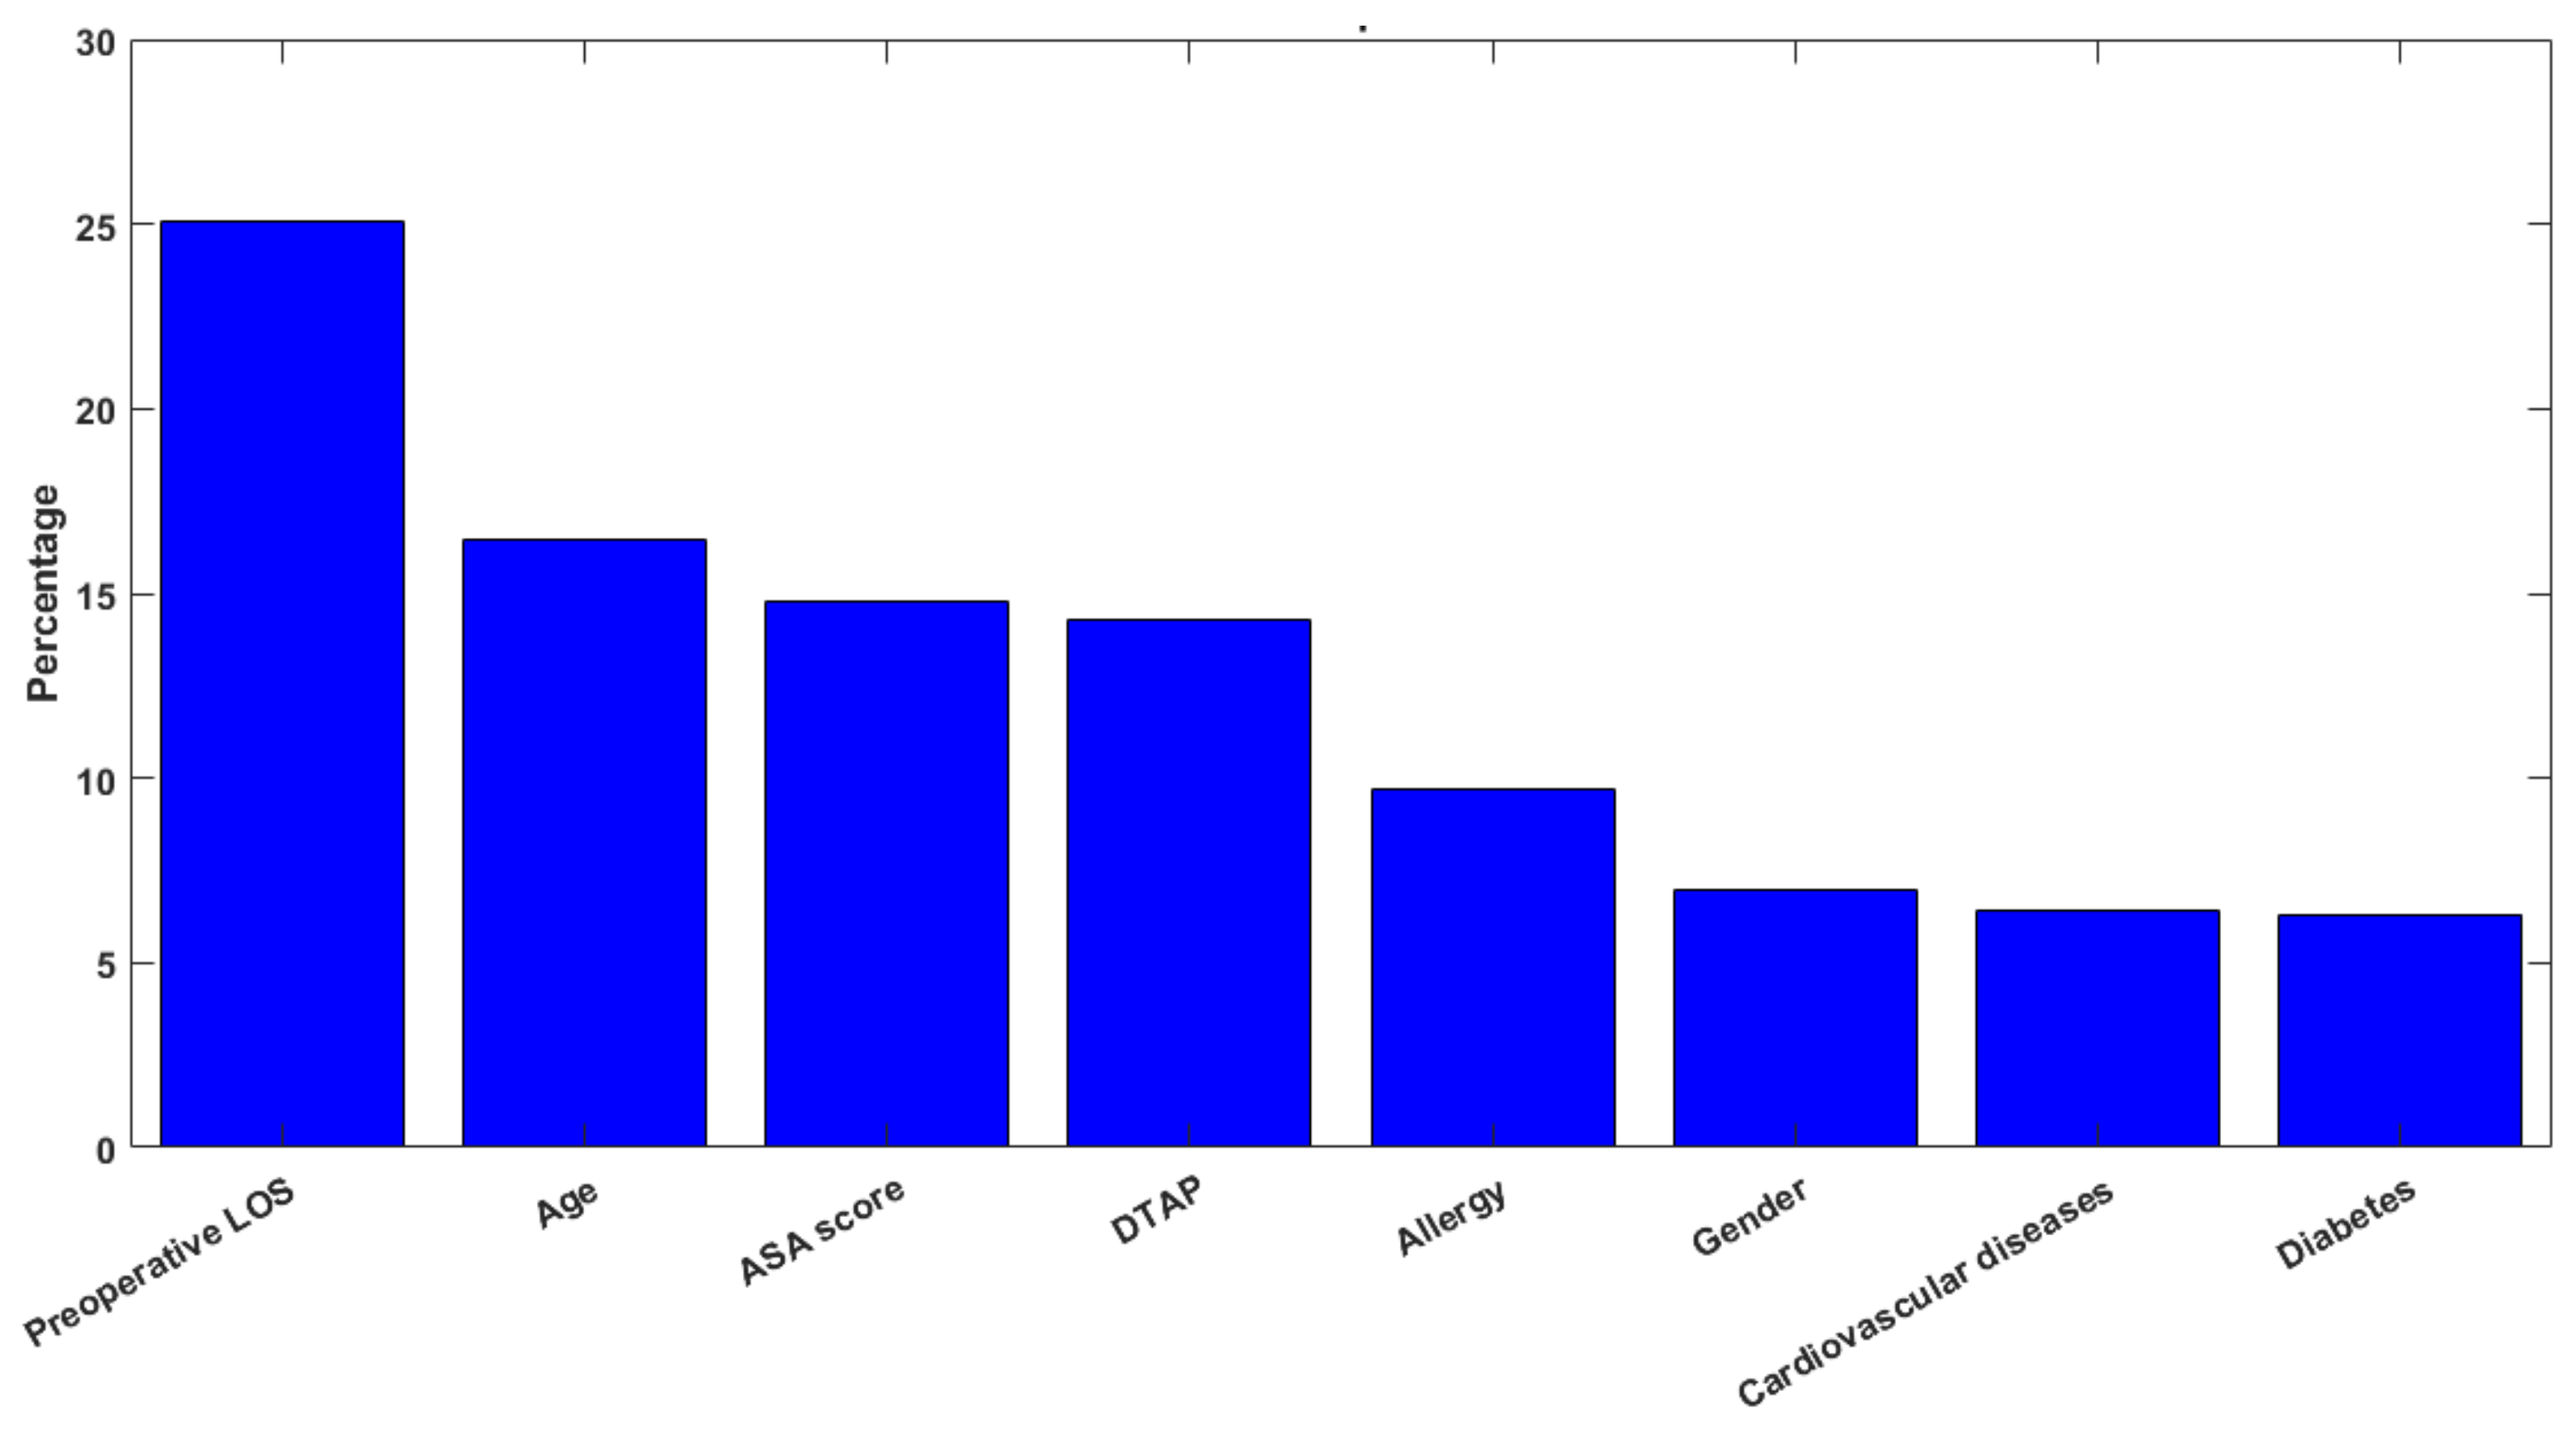
2.1. Dataset
- Over 65 years of age;
- Primary or secondary discharge diagnosis: femur fracture.
- Polytrauma;
- Cancer as a primary or secondary diagnosis;
- Voluntary discharge;
- Death.
- Demographic information:
- ∘
- Age.
- Timing information:
- ∘
- Date and time of admission;
- ∘
- Date and time of surgery;
- ∘
- Date and time of discharge.
- Admission modality:
- ∘
- Standard hospitalization;
- ∘
- Hospitalization through the dedicated DTAP for femur fractures.
- Comorbid conditions:
- ∘
- None;
- ∘
- Allergies;
- ∘
- Diabetes;
- ∘
- Cardiovascular disease.
- Risk variables:
- ∘
- American Society of Anesthesiologists (ASA) score.
- Biomedical engineers;
- An expert clinician in health management;
- The directors of the two departments of orthopaedics at the A. Cardarelli Hospital;
- The former director of the Complex Operative Unity of Health Planning and Programming at the A. Cardarelli Hospital;
- The Chief Medical Officer of the A. Cardarelli Hospital.
2.2. The Diagnostic–Therapeutic–Assistance Path
- The early hospital assistance phase, which includes all preoperative exams and transfer to the orthopaedic pavilion;
- The phase of perioperative management, which includes the anaesthesiologist evaluation, antibiotic prophylaxis and the acquisition of informed consent to be ready for surgery;
- The postoperative phase and the predischarge period, which includes a rehabilitative treatment conducted by a multidisciplinary team (surgeon, physiotherapist, nurses and social worker).
2.3. Multiple Linear Regression Model
- That the relationship between the independent and dependent variables is linear;
- That there is no multicollinearity in the data;
- That the values of the residuals are independent;
- That the variance in the residuals is constant;
- That the values of the residuals are normally distributed;
- That there are no influential cases biasing the model.
2.4. Machine Learning Analysis
3. Results
4. Discussion and Conclusions
Supplementary Materials
Author Contributions
Funding
Institutional Review Board
Informed Consent Statement
Data Availability Statement
Conflicts of Interest
References
- Rossini, M.; Piscitelli, P.; Fitto, F.; Camboa, P.; Angeli, A.; Guida, G.; Adami, S. Incidence and Socioeconomic Burden of Hip Fractures in Italy. Reumatismo 2005, 57, 97–102. [Google Scholar] [CrossRef] [PubMed] [Green Version]
- Kim, S.-M.; Yeom, J.-W.; Song, H.K.; Hwang, K.-T.; Hwang, J.-H.; Yoo, J.-H. Lateral Locked Plating for Distal Femur Fractures by Low-Energy Trauma: What Makes a Difference in Healing? Int. Orthop. 2018, 42, 2907–2914. [Google Scholar] [CrossRef] [PubMed]
- Hip Fracture: Evidence Update March 2013: A Summary of Selected New Evidence Relevant to NICE Clinical Guideline 124 ‘The Management of Hip Fracture in Adults’ (2011); National Institute for Health and Clinical Excellence (UK): London, UK, 2013.
- Colais, P.; Di Martino, M.; Fusco, D.; Perucci, C.A.; Davoli, M. The Effect of Early Surgery after Hip Fracture on 1-Year Mortality. BMC Geriatr. 2015, 15, 141. [Google Scholar] [CrossRef] [PubMed] [Green Version]
- Nyholm, A.M.; Gromov, K.; Palm, H.; Brix, M.; Kallemose, T.; Troelsen, A. Danish Fracture Database Collaborators Time to Surgery Is Associated with Thirty-Day and Ninety-Day Mortality After Proximal Femoral Fracture: A Retrospective Observational Study on Prospectively Collected Data from the Danish Fracture Database Collaborators. J. Bone Joint Surg. Am. 2015, 97, 1333–1339. [Google Scholar] [CrossRef] [Green Version]
- Pietrantonio, F.; Scotti, E. Internal Medicine Network: A New Way of Thinking Hospital-Territory Integration and Public-Private Partnership. Ital. J. Med. 2017, 11, 85–94. [Google Scholar] [CrossRef]
- Schrijvers, G.; van Hoorn, A.; Huiskes, N. The Care Pathway: Concepts and Theories: An Introduction. Int. J. Integr. Care 2012, 12, e192. [Google Scholar] [CrossRef]
- Zhang, Y.; Padman, R.; Patel, N. Paving the COWpath: Learning and Visualizing Clinical Pathways from Electronic Health Record Data. J. Biomed. Inform. 2015, 58, 186–197. [Google Scholar] [CrossRef] [Green Version]
- Carradori, T.; Bravi, F.; Butera, D.S.; Iannazzo, E.; Valpiani, G.; Wienand, U. Continuity of care in oncology. Quantitative analysis of data from patients treated in two different settings in Emilia—Romagna. Recenti Prog. Med. 2017, 108, 288–293. [Google Scholar] [CrossRef]
- Antony, J.; Forthun, S.C.; Trakulsunti, Y.; Farrington, T.; McFarlane, J.; Brennan, A.; Dempsey, M. An Exploratory Study into the Use of Lean Six Sigma to Reduce Medication Errors in the Norwegian Public Healthcare Context. Leadersh. Health Serv. Bradf. Engl. 2019, 32, 509–524. [Google Scholar] [CrossRef] [Green Version]
- Akifuddin, S.; Khatoon, F. Reduction of Complications of Local Anaesthesia in Dental Healthcare Setups by Application of the Six Sigma Methodology: A Statistical Quality Improvement Technique. J. Clin. Diagn. Res. JCDR 2015, 9, ZC34–ZC38. [Google Scholar] [CrossRef]
- Arafeh, M.; Barghash, M.A.; Haddad, N.; Musharbash, N.; Nashawati, D.; Al-Bashir, A.; Assaf, F. Using Six Sigma DMAIC Methodology and Discrete Event Simulation to Reduce Patient Discharge Time in King Hussein Cancer Center. J. Healthc. Eng. 2018, 2018, 3832151. [Google Scholar] [CrossRef] [PubMed] [Green Version]
- Ricciardi, C.; Sorrentino, A.; Improta, G.; Abbate, V.; Latessa, I.; Perrone, A.; Triassi, M.; Dell’aversana Orabona, G. A Health Technology Assessment between Two Pharmacological Therapies through Six Sigma: The Case Study of Bone Cancer. TQM J. 2020, 32. ahead-of-print. [Google Scholar] [CrossRef]
- Ponsiglione, A.M.; Ricciardi, C.; Improta, G.; Orabona, G.D.; Sorrentino, A.; Amato, F.; Romano, M. A Six Sigma DMAIC Methodology as a Support Tool for Health Technology Assessment of Two Antibiotics. Math. Biosci. Eng. 2021, 18, 3469–3490. [Google Scholar] [CrossRef] [PubMed]
- Tesfahun, E.; Kumie, A.; Beyene, A. Developing Models for the Prediction of Hospital Healthcare Waste Generation Rate. Waste Manag. Res. J. Int. Solid Wastes Public Clean. Assoc. ISWA 2016, 34, 75–80. [Google Scholar] [CrossRef]
- Chatterjee, K.; Chatterjee, K.; Kumar, A.; Shankar, S. Healthcare Impact of COVID-19 Epidemic in India: A Stochastic Mathematical Model. Med. J. Armed Forces India 2020, 76, 147–155. [Google Scholar] [CrossRef]
- Gingras, G.; Guertin, M.-H.; Laprise, J.-F.; Drolet, M.; Brisson, M. Mathematical Modeling of the Transmission Dynamics of Clostridium Difficile Infection and Colonization in Healthcare Settings: A Systematic Review. PLoS ONE 2016, 11, e0163880. [Google Scholar] [CrossRef]
- Arianti, M.D.; Prijambodo, J.; Wujoso, H. Relationships between Age, Sex, Laboratory Parameter, and Length of Stay in Patients with Dengue Hemorrhagic Fever. J. Epidemiol. Public Health 2019, 4, 307–313. [Google Scholar] [CrossRef]
- Liu, Y.-H.; Su, H.-H.; Tsai, Y.-W.; Hou, Y.-Y.; Chang, K.-P.; Chi, C.-C.; Lin, M.-Y.; Wu, P.-H. Initial Factors Influencing Duration of Hospital Stay in Adult Patients with Peritonsillar Abscess. Clin. Exp. Otorhinolaryngol. 2017, 10, 115–120. [Google Scholar] [CrossRef] [Green Version]
- Trunfio, T.A.; Scala, A.; Vecchia, A.D.; Marra, A.; Borrelli, A. Multiple Regression Model to Predict Length of Hospital Stay for Patients Undergoing Femur Fracture Surgery at “San Giovanni Di Dio e Ruggi d’Aragona” University Hospital. In Proceedings of the 8th European Medical and Biological Engineering Conference, Portorož, Slovenia, 29 November–3 December 2020; Jarm, T., Cvetkoska, A., Mahnič-Kalamiza, S., Miklavcic, D., Eds.; Springer International Publishing: Cham, Switzerland, 2021; pp. 840–847. [Google Scholar]
- Bhardwaj, R.; Nambiar, A.R.; Dutta, D. A Study of Machine Learning in Healthcare. In Proceedings of the 2017 IEEE 41st Annual Computer Software and Applications Conference (COMPSAC), Turin, Italy, 4–8 July 2017; Volume 2, pp. 236–241. [Google Scholar]
- Improta, G.; Ponsiglione, A.M.; Parente, G.; Romano, M.; Cesarelli, G.; Rea, T.; Russo, M.; Triassi, M. Evaluation of Medical Training Courses Satisfaction: Qualitative Analysis and Analytic Hierarchy Process. In Proceedings of the 8th European Medical and Biological Engineering Conference, Portorož, Slovenia, 29 November–3 December 2020; Jarm, T., Cvetkoska, A., Mahnič-Kalamiza, S., Miklavcic, D., Eds.; Springer International Publishing: Cham, Switzerland, 2021; pp. 518–526. [Google Scholar]
- Wiens, J.; Shenoy, E.S. Machine Learning for Healthcare: On the Verge of a Major Shift in Healthcare Epidemiology. Clin. Infect. Dis. 2018, 66, 149–153. [Google Scholar] [CrossRef] [Green Version]
- Donisi, L.; Cesarelli, G.; Balbi, P.; Provitera, V.; Lanzillo, B.; Coccia, A.; D’Addio, G. Positive Impact of Short-Term Gait Rehabilitation in Parkinson Patients: A Combined Approach Based on Statistics and Machine Learning. Math. Biosci. Eng. MBE 2021, 18, 6995–7009. [Google Scholar] [CrossRef]
- Chowriappa, P.; Dua, S.; Todorov, Y. Introduction to Machine Learning in Healthcare Informatics. In Machine Learning in Healthcare Informatics; Dua, S., Acharya, U.R., Dua, P., Eds.; Intelligent Systems Reference Library; Springer: Berlin/Heidelberg, Germany, 2014; pp. 1–23. ISBN 978-3-642-40017-9. [Google Scholar]
- Ricciardi, C.; Ponsiglione, A.M.; Converso, G.; Santalucia, I.; Triassi, M.; Improta, G. Implementation and Validation of a New Method to Model Voluntary Departures from Emergency Departments. Math. Biosci. Eng. 2021, 18, 253–273. [Google Scholar] [CrossRef] [PubMed]
- Ricciardi, C.; Jónsson, H.; Jacob, D.; Improta, G.; Recenti, M.; Gíslason, M.K.; Cesarelli, G.; Esposito, L.; Minutolo, V.; Bifulco, P.; et al. Improving Prosthetic Selection and Predicting BMD from Biometric Measurements in Patients Receiving Total Hip Arthroplasty. Diagnostics 2020, 10, 815. [Google Scholar] [CrossRef] [PubMed]
- Scrutinio, D.; Ricciardi, C.; Donisi, L.; Losavio, E.; Battista, P.; Guida, P.; Cesarelli, M.; Pagano, G.; D’Addio, G. Machine Learning to Predict Mortality after Rehabilitation among Patients with Severe Stroke. Sci. Rep. 2020, 10, 20127. [Google Scholar] [CrossRef]
- Ricciardi, C.; Valente, A.S.; Edmund, K.; Cantoni, V.; Green, R.; Fiorillo, A.; Picone, I.; Santini, S.; Cesarelli, M. Linear Discriminant Analysis and Principal Component Analysis to Predict Coronary Artery Disease. Health Inform. J. 2020, 26, 2181–2192. [Google Scholar] [CrossRef] [PubMed] [Green Version]
- Ponsiglione, A.M.; Cosentino, C.; Cesarelli, G.; Amato, F.; Romano, M. A Comprehensive Review of Techniques for Processing and Analyzing Fetal Heart Rate Signals. Sensors 2021, 21, 6136. [Google Scholar] [CrossRef]
- Fiscon, G.; Weitschek, E.; Cialini, A.; Felici, G.; Bertolazzi, P.; De Salvo, S.; Bramanti, A.; Bramanti, P.; De Cola, M.C. Combining EEG Signal Processing with Supervised Methods for Alzheimer’s Patients Classification. BMC Med. Inform. Decis. Mak. 2018, 18, 35. [Google Scholar] [CrossRef]
- Fiscon, G.; Weitschek, E.; Felici, G.; Bertolazzi, P.; De Salvo, S.; Bramanti, P.; De Cola, M.C. Alzheimer’s Disease Patients Classification through EEG Signals Processing. In Proceedings of the 2014 IEEE Symposium on Computational Intelligence and Data Mining (CIDM), Orlando, FL, USA, 9–12 December 2014; pp. 105–112. [Google Scholar]
- Ponsiglione, A.M.; Romano, M.; Amato, F. A Finite-State Machine Approach to Study Patients Dropout from Medical Examinations. In Proceedings of the 2021 IEEE 6th International Forum on Research and Technology for Society and Industry (RTSI), Naples, Italy, 6–9 September 2021; pp. 289–294. [Google Scholar]
- Ricciardi, C.; Cuocolo, R.; Cesarelli, G.; Ugga, L.; Improta, G.; Solari, D.; Romeo, V.; Guadagno, E.; Maria, C.L.; Cesarelli, M. Distinguishing Functional from Non-Functional Pituitary Macroadenomas with a Machine Learning Analysis. In XV Mediterranean Conference on Medical and Biological Engineering and Computing—MEDICON 2019, Proceedings of MEDICON 2019, Coimbra, Portugal, 26–28 September 2019; Henriques, J., de Carvalho, P., Neves, N., Eds.; Springer: Cham, Switzerland, 2020; Volume 76, pp. 1822–1829. [Google Scholar]
- Ricciardi, C.; Cantoni, V.; Green, R.; Improta, G.; Cesarelli, M. Is It Possible to Predict Cardiac Death? Springer: Cham, Switzerland, 2020; Volume 76, ISBN 978-3-030-31635-8. [Google Scholar]
- Ricciardi, C.; Improta, G.; Amato, F.; Cesarelli, G.; Romano, M. Classifying the Type of Delivery from Cardiotocographic Signals: A Machine Learning Approach. Comput. Methods Programs Biomed. 2020, 196, 105712. [Google Scholar] [CrossRef]
- Ponsiglione, A.M.; Amato, F.; Romano, M. Multiparametric Investigation of Dynamics in Fetal Heart Rate Signals. Bioengineering 2022, 9, 8. [Google Scholar] [CrossRef]
- Mena, L.J.; Orozco, E.E.; Felix, V.G.; Ostos, R.; Melgarejo, J.; Maestre, G.E. Machine Learning Approach to Extract Diagnostic and Prognostic Thresholds: Application in Prognosis of Cardiovascular Mortality. Comput. Math. Methods Med. 2012, 2012, e750151. [Google Scholar] [CrossRef]
- Di Castelnuovo, A.; Bonaccio, M.; Costanzo, S.; Gialluisi, A.; Antinori, A.; Berselli, N.; Blandi, L.; Bruno, R.; Cauda, R.; Guaraldi, G.; et al. Common Cardiovascular Risk Factors and In-Hospital Mortality in 3894 Patients with COVID-19: Survival Analysis and Machine Learning-Based Findings from the Multicentre Italian CORIST Study. Nutr. Metab. Cardiovasc. Dis. 2020, 30, 1899–1913. [Google Scholar] [CrossRef]
- Rajliwall, N.S.; Davey, R.; Chetty, G. Machine Learning Based Models for Cardiovascular Risk Prediction. In Proceedings of the 2018 International Conference on Machine Learning and Data Engineering (iCMLDE), Sydney, NSW, Australia, 3–7 December 2018; pp. 142–148. [Google Scholar]
- Sánchez-Cabo, F.; Rossello, X.; Fuster, V.; Benito, F.; Manzano, J.P.; Silla, J.C.; Fernández-Alvira, J.M.; Oliva, B.; Fernández-Friera, L.; López-Melgar, B.; et al. Machine Learning Improves Cardiovascular Risk Definition for Young, Asymptomatic Individuals. J. Am. Coll. Cardiol. 2020, 76, 1674–1685. [Google Scholar] [CrossRef]
- Wang, G.; Zhang, Y.; Li, S.; Zhang, J.; Jiang, D.; Li, X.; Li, Y.; Du, J. A Machine Learning-Based Prediction Model for Cardiovascular Risk in Women with Preeclampsia. Front. Cardiovasc. Med. 2021, 8, 736491. [Google Scholar] [CrossRef] [PubMed]
- Ponsiglione, A.M.; Cesarelli, G.; Amato, F.; Romano, M. Optimization of an Artificial Neural Network to Study Accelerations of Foetal Heart Rhythm. In Proceedings of the 2021 IEEE 6th International Forum on Research and Technology for Society and Industry (RTSI), Naples, Italy, 6–9 September 2021; pp. 159–164. [Google Scholar]
- Cabitza, F.; Locoro, A.; Banfi, G. Machine Learning in Orthopedics: A Literature Review. Front. Bioeng. Biotechnol. 2018, 6, 75. [Google Scholar] [CrossRef] [Green Version]
- Ramkumar, P.N.; Haeberle, H.S.; Bloomfield, M.R.; Schaffer, J.L.; Kamath, A.F.; Patterson, B.M.; Krebs, V.E. Artificial Intelligence and Arthroplasty at a Single Institution: Real-World Applications of Machine Learning to Big Data, Value-Based Care, Mobile Health, and Remote Patient Monitoring. J. Arthroplasty 2019, 34, 2204–2209. [Google Scholar] [CrossRef] [PubMed]
- Baig, M.M.; Hua, N.; Zhang, E.; Robinson, R.; Spyker, A.; Armstrong, D.; Whittaker, R.; Robinson, T.; Ullah, E. A Machine Learning Model for Predicting Risk of Hospital Readmission within 30 Days of Discharge: Validated with LACE Index and Patient at Risk of Hospital Readmission (PARR) Model. Med. Biol. Eng. Comput. 2020, 58, 1459–1466. [Google Scholar] [CrossRef] [PubMed]
- Dogu, E.; Albayrak, Y.E.; Tuncay, E. Length of Hospital Stay Prediction with an Integrated Approach of Statistical-Based Fuzzy Cognitive Maps and Artificial Neural Networks. Med. Biol. Eng. Comput. 2021, 59, 483–496. [Google Scholar] [CrossRef]
- Ramkumar, P.N.; Navarro, S.M.; Haeberle, H.S.; Karnuta, J.M.; Mont, M.A.; Iannotti, J.P.; Patterson, B.M.; Krebs, V.E. Development and Validation of a Machine Learning Algorithm After Primary Total Hip Arthroplasty: Applications to Length of Stay and Payment Models. J. Arthroplasty 2019, 34, 632–637. [Google Scholar] [CrossRef]
- Navarro, S.M.; Wang, E.Y.; Haeberle, H.S.; Mont, M.A.; Krebs, V.E.; Patterson, B.M.; Ramkumar, P.N. Machine Learning and Primary Total Knee Arthroplasty: Patient Forecasting for a Patient-Specific Payment Model. J. Arthroplasty 2018, 33, 3617–3623. [Google Scholar] [CrossRef]
- Karnuta, J.M.; Navarro, S.M.; Haeberle, H.S.; Billow, D.G.; Krebs, V.E.; Ramkumar, P.N. Bundled Care for Hip Fractures: A Machine-Learning Approach to an Untenable Patient-Specific Payment Model. J. Orthop. Trauma 2019, 33, 324–330. [Google Scholar] [CrossRef]
- Ramkumar, P.N.; Karnuta, J.M.; Navarro, S.M.; Haeberle, H.S.; Scuderi, G.R.; Mont, M.A.; Krebs, V.E.; Patterson, B.M. Deep Learning Preoperatively Predicts Value Metrics for Primary Total Knee Arthroplasty: Development and Validation of an Artificial Neural Network Model. J. Arthroplast. 2019, 34, 2220–2227.e1. [Google Scholar] [CrossRef]
- Dogu, E.; Albayrak, Y.E. Criteria Evaluation for Pricing Decisions in Strategic Marketing Management Using an Intuitionistic Cognitive Map Approach. Soft Comput. 2018, 22, 4989–5005. [Google Scholar] [CrossRef]
- Dogu, E.; Albayrak, Y.E.; Tuncay, E. An Integrated Decision Support System for Hospital Management: Statistical-Based Fuzzy Cognitive Maps. J. Mult. Valued Log Soft Comput 2020, 34, 527–552. [Google Scholar]
- Ricciardi, C.; Fiorillo, A.; Valente, A.S.; Borrelli, A.; Verdoliva, C.; Triassi, M.; Improta, G. Lean Six Sigma Approach to Reduce LOS through a Diagnostic-Therapeutic-Assistance Path at A.O.R.N. A. Cardarelli. TQM J. 2019, 31, 657–672. [Google Scholar] [CrossRef]
- Improta, G.; Ricciardi, C.; Borrelli, A.; D’Alessandro, A.; Verdoliva, C.; Cesarelli, M. The Application of Six Sigma to Reduce the Pre-Operative Length of Hospital Stay at the Hospital Antonio Cardarelli. Int. J. Lean Six Sigma Print 2019, 11, 555–576. [Google Scholar] [CrossRef]
- National Institute for Health and Care Excellence (NICE) Hip Fracture: Management. Clinical Guideline CG124; National Institute for Health and Care Excellence: London, UK, 2011. [Google Scholar]
- Azienda Ospedaliera di Rilievo Nazionale Antonio Cardarelli di Napoli Percorso Assistenziale per Fratture Di Femore Nel Paziente Anziano. Available online: http://www.ospedalecardarelli.it/doc/1092/137431/DOCUMENT_FILE_137431.pdf (accessed on 12 January 2021).
- Frattura Del Collo Del Femore: Proporzione Di Interventi Chirurgici Entro 2 Giorni. Available online: https://www.sanita24.ilsole24ore.com/pdf2010/Editrice/ILSOLE24ORE/QUOTIDIANO_SANITA/Online/_Oggetti_Correlati/Documenti/2015/11/18/femore.pdf?uuid=ACmVZobB (accessed on 12 January 2021).
- Tiryaki, S.; Aydın, A. An Artificial Neural Network Model for Predicting Compression Strength of Heat-Treated Woods and Comparison with a Multiple Linear Regression Model. Constr. Build. Mater. 2014, 62, 102–108. [Google Scholar] [CrossRef]
- Williams, M.; Grajales, C.; Kurkiewicz, D. Assumptions of Multiple Regression: Correcting Two Misconceptions. Pract. Assess. Res. Eval. 2019, 18, 11. [Google Scholar] [CrossRef]
- Recenti, M.; Ricciardi, C.; Gìslason, M.; Edmunds, K.; Carraro, U.; Gargiulo, P. Machine Learning Algorithms Predict Body Mass Index Using Nonlinear Trimodal Regression Analysis from Computed Tomography Scans. In Proceedings of the XV Mediterranean Conference on Medical and Biological Engineering and Computing—MEDICON, Coimbra, Portugal, 26–28 September 2019; Henriques, J., Neves, N., de Carvalho, P., Eds.; Springer International Publishing: Cham, Switzerland, 2020; pp. 839–846. [Google Scholar]
- Liaw, A.; Wiener, M.C. Classification and Regression by Random Forest. R news. 2002, 2, 18–22. [Google Scholar]
- Broomhead, D.S.; Lowe, D. Radial Basis Functions, Multi-Variable Functional Interpolation and Adaptive Networks; Royal Signals and Radar Establishment Malvern: Malvern, UK, 2018. [Google Scholar]
- Hastie, T.; Tibshirani, R.; Friedman, J. The Elements of Statistical Learning: Data Mining, Inference, and Prediction, Second Edition; Springer Series in Statistics; Springer: New York, NY, USA, 2009; ISBN 978-0-387-84857-0. [Google Scholar]
- Suykens, J.A.K.; Vandewalle, J. Least Squares Support Vector Machine Classifiers. Neural Process. Lett. 1999, 9, 293–300. [Google Scholar] [CrossRef]
- Anguita, D.; Ghio, A.; Greco, N.; Oneto, L.; Ridella, S. Model Selection for Support Vector Machines: Advantages and Disadvantages of the Machine Learning Theory. In Proceedings of the 2010 International Joint Conference on Neural Networks (IJCNN), Barcelona, Spain, 18–23 July 2010; pp. 1–8. [Google Scholar]
- Mierswa, I. Controlling Overfitting with Multi-Objective Support Vector Machines. In Proceedings of the 9th Annual Conference on Genetic and Evolutionary Computation, London, UK, 7–11 July 2007; Association for Computing Machinery: New York, NY, USA, 2007; pp. 1830–1837. [Google Scholar]
- D’Addio, G.; Ricciardi, C.; Improta, G.; Bifulco, P.; Cesarelli, M. Feasibility of Machine Learning in Predicting Features Related to Congenital Nystagmus; Springer: Cham, Switzerland, 2020; Volume 76, ISBN 978-3-030-31635-8. [Google Scholar]
- Romeo, V.; Cuocolo, R.; Ricciardi, C.; Ugga, L.; Cocozza, S.; Verde, F.; Stanzione, A.; Napolitano, V.; Russo, D.; Improta, G.; et al. Prediction of Tumor Grade and Nodal Status in Oropharyngeal and Oral Cavity Squamous-Cell Carcinoma Using a Radiomic Approach. ANTICANCER Res. 2020, 40, 271–280. [Google Scholar] [CrossRef]
- Nayyar, A.; Gadhavi, L.; Zaman, N. Chapter 2—Machine Learning in Healthcare: Review, Opportunities and Challenges. In Machine Learning and the Internet of Medical Things in Healthcare; Singh, K.K., Elhoseny, M., Singh, A., Elngar, A.A., Eds.; Academic Press: Cambridge, MA, USA, 2021; pp. 23–45. ISBN 978-0-12-821229-5. [Google Scholar]
- Shailaja, K.; Seetharamulu, B.; Jabbar, M.A. Machine Learning in Healthcare: A Review. In Proceedings of the 2018 Second International Conference on Electronics, Communication and Aerospace Technology (ICECA), Coimbatore, India, 29–31 March 2018; pp. 910–914. [Google Scholar]
- Scala, A.; Ponsiglione, A.M.; Loperto, I.; Della Vecchia, A.; Borrelli, A.; Russo, G.; Triassi, M.; Improta, G. Lean Six Sigma Approach for Reducing Length of Hospital Stay for Patients with Femur Fracture in a University Hospital. Int. J. Environ. Res. Public. Health 2021, 18, 2843. [Google Scholar] [CrossRef]


| Variables | Categories | N | LOS (Days) [Average ± SD] | p-Value |
|---|---|---|---|---|
| Age (years) | <75 | 225 | 11.46 ± 5.527 | 0.399 |
| 75–90 | 720 | 11.21 ± 5.071 | ||
| >90 | 137 | 10.79 ± 4.538 | ||
| Allergies | Yes | 138 | 11.79 ± 5.609 | 0.153 |
| No | 944 | 11.12 ± 5.025 | ||
| Cardiovasculardiseases | Yes | 897 | 11.36 ± 4.987 | 0.002 |
| No | 185 | 10.48 ± 5.601 | ||
| Diabetes | Yes | 268 | 11.56 ± 5.657 | 0.291 |
| No | 814 | 11.40 ± 5.162 | ||
| ASA score | I-II | 94 | 9.21 ± 3.970 | <0.001 |
| III-IV | 988 | 11.39 ± 5.242 | ||
| DTAP | No | 534 | 13.21 ± 5.126 | <0.001 |
| Yes | 548 | 9.25 ± 4.259 |
| Multiple Linear Regression | Random Forests | MLP | RBF Network | SVM | |
|---|---|---|---|---|---|
| R2 | 0.610 | 0.507 | 0.584 | 0.616 | 0.610 |
| Mean absolute error | 3.987 | 2.45 | 2.109 | 2.077 | 2.000 |
| Mean squared error | 11.624 | 11.949 | 10.075 | 9.302 | 9.268 |
| Variables | Regression | t | p-Value |
|---|---|---|---|
| Intercept | 3.42 | 2.24 | 0.02 |
| Age | −0.01 | −0.85 | 0.39 |
| ASA score | 1.22 | −0.76 | 0.45 |
| Diabetes | −0.21 | −0.75 | 0.45 |
| Cardiovascular diseases | −0.25 | 3.83 | 0.001 |
| Allergies | 0.04 | 0.11 | 0.91 |
| Preoperative LOS | 1.03 | 27.77 | <0.001 |
| DTAP | 0.35 | 1.23 | 0.22 |
| RF | MLP | RBF Network | SVM | |
|---|---|---|---|---|
| Accuracy (%) | 81.1 | 82.3 | 83.5 | 81.1 |
| The best confusion matrix (RBF network) | ||||
| Real/Predicted | 1 | 2 | 3 | 4 |
| 1 | 154 | 12 | 0 | 0 |
| 2 | 29 | 108 | 1 | 0 |
| 3 | 1 | 5 | 17 | 0 |
| 4 | 1 | 2 | 4 | 0 |
Publisher’s Note: MDPI stays neutral with regard to jurisdictional claims in published maps and institutional affiliations. |
© 2022 by the authors. Licensee MDPI, Basel, Switzerland. This article is an open access article distributed under the terms and conditions of the Creative Commons Attribution (CC BY) license (https://creativecommons.org/licenses/by/4.0/).
Share and Cite
Ricciardi, C.; Ponsiglione, A.M.; Scala, A.; Borrelli, A.; Misasi, M.; Romano, G.; Russo, G.; Triassi, M.; Improta, G. Machine Learning and Regression Analysis to Model the Length of Hospital Stay in Patients with Femur Fracture. Bioengineering 2022, 9, 172. https://doi.org/10.3390/bioengineering9040172
Ricciardi C, Ponsiglione AM, Scala A, Borrelli A, Misasi M, Romano G, Russo G, Triassi M, Improta G. Machine Learning and Regression Analysis to Model the Length of Hospital Stay in Patients with Femur Fracture. Bioengineering. 2022; 9(4):172. https://doi.org/10.3390/bioengineering9040172
Chicago/Turabian StyleRicciardi, Carlo, Alfonso Maria Ponsiglione, Arianna Scala, Anna Borrelli, Mario Misasi, Gaetano Romano, Giuseppe Russo, Maria Triassi, and Giovanni Improta. 2022. "Machine Learning and Regression Analysis to Model the Length of Hospital Stay in Patients with Femur Fracture" Bioengineering 9, no. 4: 172. https://doi.org/10.3390/bioengineering9040172