
Using Geometric Morphometric Analysis of Magnetic Resonance Imaging to Assess the Anatomy of the Eustachian Tube in Children with and without Otitis Media

Abstract
:
1. Introduction
2. Materials and Methods
3. Results
4. Discussion
5. Conclusions
6. Limitations and Future Directions
Supplementary Materials
Author Contributions
Funding
Institutional Review Board Statement
Informed Consent Statement
Data Availability Statement
Acknowledgments
Conflicts of Interest
References
- Chonmaitree, T.; Revai, K.; Grady, J.J.; Clos, A.; Patel, J.A.; Nair, S.; Fan, J.; Henrickson, K.J. Viral upper respiratory tract infection and otitis media complication in young children. Clin. Infect. Dis. 2008, 46, 815–823. [Google Scholar] [CrossRef] [PubMed]
- Winther, B.; Doyle, W.J.; Alper, C.M. A high prevalence of new onset otitis media during parent diagnosed common colds. Int. J. Pediatr. Otorhinolaryngol. 2006, 70, 1725–1730. [Google Scholar] [CrossRef] [PubMed]
- Heikkinen, T. Role of viruses in the pathogenesis of acute otitis media. Pediatr. Infect. Dis. J. 2000, 19, S17–S23. [Google Scholar] [CrossRef]
- Alho, O.P.; Koivu, M.; Sorri, M. What is an ‘otitis-prone’ child? Int. J. Pediatr. Otorhinolaryngol. 1991, 21, 201–209. [Google Scholar] [CrossRef]
- Alho, O.-P.; Koivu, M.; Sorri, M.; Rantakallio, P. The occurrence of acute otitis media in infants. A life-table analysis. Int. J. Pediatr. Otorhinolaryngol. 1991, 21, 7–14. [Google Scholar] [CrossRef]
- Teele, D.W.; Klein, J.O.; Rosner, B.A. Epidemiology of otitis media in children. Ann. Otol. Rhinol. Laryngol. 1980, 89, 5–6. [Google Scholar] [CrossRef] [PubMed]
- Dewey, K.G.; Heinig, M.J.; Nommsen-Rivers, L.A. Differences in morbidity between breast-fed and formula-fed infants. J. Pediatr. 1995, 126, 696–702. [Google Scholar] [CrossRef]
- Bentdal, Y.E.; Nafstad, P.; Karevold, G.; Kværner, K.J. Acute otitis media in schoolchildren: Allergic diseases and skin prick test positivity. Acta Otolaryngol. 2007, 127, 480–485. [Google Scholar] [CrossRef]
- Bluestone, C.D. Impact of evolution on the eustachian tube. Laryngoscope 2008, 118, 522–527. [Google Scholar] [CrossRef]
- Proctor, B. Anatomy of the Eustachian Tube. Arch. Otolaryngol. 1973, 97, 2–8. [Google Scholar] [CrossRef]
- Proctor, B. Embryology and Anatomy of the Eustachian Tube. J. Craniofacial Surg. 1967, 86, 503–514. [Google Scholar] [CrossRef]
- Shim, H.J.; Choi, A.Y.; Yoon, S.W.; Kwon, K.H.; Yeo, S.G. The value of measuring eustachian tube aeration on temporal bone ct in patients with chronic otitis media. Clin. Exp. Otorhinolaryngol. 2010, 3, 59–64. [Google Scholar] [CrossRef]
- Elner, Å.; Ingelstedt, S.; Ivarsson, A. The normal function of the eustachian tube: A study of 102 cases. Acta Otolaryngol. 1971, 72, 320–328. [Google Scholar] [CrossRef] [PubMed]
- Seibert, J.W.; Danner, C.J. Eustachian tube function and the middle ear. Otolaryngol. Clin. N. Am. 2006, 39, 1221–1235. [Google Scholar] [CrossRef] [PubMed]
- Alper, C.M.; Teixeira, M.S.; Swarts, J.D. Correlations between videoendoscopy and sonotubometry of eustachian tube opening during a swallow. Laryngoscope 2016, 126, 2778–2784. [Google Scholar] [CrossRef] [PubMed]
- Alper, C.M.; Teixeira, M.S.; Swarts, J.D.; Doyle, W.J. Quantitative description of eustachian tube movements during swallowing as visualized by transnasal videoendoscopy. JAMA Otolaryngol. Head Neck Surg. 2015, 141, 160–168. [Google Scholar] [CrossRef]
- Alper, C.M.; Teixeira, M.S.; Swarts, J.D. Eustachian tube function in adults with ventilation tubes inserted for otitis media with effusion. J. Int. Adv. Otol. 2018, 14, 255–262. [Google Scholar] [CrossRef]
- Honjo, I.; Okazaki, N.; Kumazawa, T. Opening mechanism of the eustachian tube. A clinical and experimental study. Ann. Otol. Rhinol. Laryngol. Suppl. 1980, 89, 25–27. [Google Scholar] [CrossRef]
- Honjo, I.; Okazaki, N.; Kumazawa, T. Experimental study of the eustachian tube function with regard to its related muscles. Acta Otolaryngol. 1979, 87, 84–89. [Google Scholar] [CrossRef]
- Huang, M.H.S.; Lee, S.T.; Rajendran, K. A Fresh Cadaveric Study of the Paratubal Muscles: Implications for Eustachian Tube Function in Cleft Palate. Plast. Reconstr. Surg. 1997, 100, 833–842. [Google Scholar] [CrossRef]
- Rood, S.R.; Doyle, W.J. Morphology of tensor veli palatini, tensor tympani, and dilatator tubae muscles. Ann. Otol. Rhinol. Laryngol. 1978, 87, 202–210. [Google Scholar] [CrossRef] [PubMed]
- Gremba, A.P.; Weinberg, S.M.; Swarts, J.D.; Casselbrant, M.L. Craniofacial shape in children with and without a positive otitis media history. Int. J. Pediatr. Otorhinolaryngol. 2016, 84, 110–115. [Google Scholar] [CrossRef] [PubMed]
- Tarabichi, M.; Najmi, M. Visualization of the eustachian tube lumen with Valsalva computed tomography. Laryngoscope 2015, 125, 724–729. [Google Scholar] [CrossRef] [PubMed]
- Yoshida, H.; Kobayashi, T.; Morikawa, M.; Hayashi, K.; Tsujii, H.; Sasaki, Y. CT imaging of the patulous eustachian tube—Comparison between sitting and recumbent positions. Auris Nasus Larynx 2003, 30, 135–140. [Google Scholar] [CrossRef] [PubMed]
- Pagano, A.S.; Laitman, J.T. Three-Dimensional Geometric Morphometric Analysis of the Nasopharyngeal Boundaries and Its Functional Integration with the Face and External Basicranium Among Extant Hominoids. Anat. Rec. 2015, 298, 85–106. [Google Scholar] [CrossRef] [PubMed]
- Pagano, A.S.; Márquez, S.; Laitman, J.T. Reconstructing the Neanderthal Eustachian Tube: New Insights on Disease Susceptibility, Fitness Cost, and Extinction. Anat. Rec. 2019, 302, 2109–2125. [Google Scholar] [CrossRef]
- Pagano, A.S.; Wang, E.; Yuan, D.; Fischer, D.; Bluestone, C.; Marquez, S.; Laitman, J. Cranial Indicators Identified for Peak Incidence of Otitis Media. Anat. Rec. 2017, 300, 1721–1740. [Google Scholar] [CrossRef]
- Alper, C.M.; Rath, T.J.; Teixeira, M.S.; Swarts, J.D. A Novel Imaging Method for the Cartilaginous Eustachian Tube Lumen: Computerized Tomography During the Forced Response Test. Ann. Otol. Rhinol. Laryngol. 2018, 127, 13–20. [Google Scholar] [CrossRef]
- Smith, M.E.; Scoffings, D.J.; Tysome, J.R. Imaging of the Eustachian tube and its function: A systematic review. Neuroradiology 2016, 58, 543–556. [Google Scholar] [CrossRef]
- Terzi, S.; Beyazal Çeliker, F.; Özgür, A.; Çeliker, M.; Beyazal, M.; Demirci, M.; Dursun, E. The evaluation of eustachian tube paratubal structures using magnetic resonance imaging in patients with chronic suppurative otitis media. Acta Otolaryngol. 2016, 136, 673–676. [Google Scholar] [CrossRef]
- Oshima, T.; Kikuchi, T.; Hori, Y.; Kawase, T.; Kobayashi, T. Magnetic resonance imaging of the eustachian tube cartilage. Acta Otolaryngol. 2008, 128, 510–514. [Google Scholar] [CrossRef] [PubMed]
- Alper, C.M.; Sabo, D.L.; Doyle, W.J. Validation by magnetic resonance imaging of tympanometry for diagnosing middle ear effusion. Otolaryngol. Head Neck Surg. 1999, 121, 523–527. [Google Scholar] [CrossRef] [PubMed]
- Alper, C.M.; Doyle, W.J. MRI validation of the accuracy of tympanometric gradient for the diagnosis of OME. Br. J. Audiol. 1999, 33, 233–239. [Google Scholar] [CrossRef]
- Shprintzen, R.J.; Croft, C.B. Abnormalities of the eustachian tube orifice in individuals with cleft palate. Int. J. Pediatr. Otorhinolaryngol. 1981, 3, 15–23. [Google Scholar] [CrossRef] [PubMed]
- Maue-Dickson, W.; Dickson, D.R.; Rood, S.R. Anatomy of the Eustachian Tube and Related Structures in Age-Matched Human Fetuses with and without Cleft Palate. Trans. Am. Acad. Ophthalmol. Otolarygngol. 1976, 82, 159–164. [Google Scholar]
- Takasaki, K.; Takahashi, H.; Miyamoto, I.; Yoshida, H.; Yamamoto-Fukuda, T.; Enatsu, K.; Kumagami, H. Measurement of Angle and Length of the Eustachian Tube on the CT Using Multiplanar Reconstruction Technique. Laryngoscope 2007, 117, 1251–1254. [Google Scholar] [CrossRef]
- Wald, E.R. Acute otitis media and acute bacterial sinusitis. Clin. Infect. Dis. 2011, 52, S277–S283. [Google Scholar] [CrossRef]
- Mills, R.P.; Irani, B.S.; Vaughan-Jones, R.J.; Padgham, N.D. Maxillary sinusitis in children with otitis media with effusion. J. Laryngol. Otol. 1994, 108, 842–844. [Google Scholar] [CrossRef]
- Güçlü, O.; Şahin, E.M.; Tekin, K.; Dereköy, F.S. Evaluation of nasal airways by objective methods in chronic otitis media. Eur. Arch. Oto-Rhino-Laryngol. 2013, 270, 1263–1266. [Google Scholar] [CrossRef]
- Zelditch, M.L.; Swiderski, D.L.; Sheets, H.D. Geometric Morphometrics for Biologists: A Primer; Academic Press: New York, NY, USA, 2012. [Google Scholar]
- Bookstein, F.L. Morphometric Tools for Landmark Data: Geometry and Biology; Cambridge University Press: Cambridge, UK, 1997. [Google Scholar]
- Bluestone, C. Eustachian Tube: Structure, Function, and Role in Otitis Media; PMPH-USA: Shelton, CT, USA, 2005; pp. 67–90. [Google Scholar]
- Teixeira, M.S.; Banks, J.; Swarts, J.D.; Alper, C.M.; Doyle, W.J. Eustachian tube opening measured by sonotubometry is poorer in adults with a history of past middle ear disease. Int. J. Pediatr. Otorhinolaryngol. 2014, 78, 593–598. [Google Scholar] [CrossRef]
- Sapci, T.; Mercangoz, E.; Evcimik, M.F.; Karavus, A.; Gozke, E. The evaluation of the tensor veli palatini muscle function with electromyography in chronic middle ear diseases. Eur. Arch. Oto-Rhino-Laryngol. 2008, 265, 271–278. [Google Scholar] [CrossRef] [PubMed]
- Matsune, S.; Sando, I.; Takahashi, H. Insertion of the tensor veli palatini muscle into the eustachian tube cartilage in cleft palate cases. Ann. Otol. Rhinol. Laryngol. 1991, 100, 439–446. [Google Scholar] [CrossRef] [PubMed]
- Dayan, J.H.; Smith, D.; Oliker, A.; Haring, J.; Cutting, C.B. A virtual reality model of eustachian tube dilation and clinical implications for cleft palate repair. Plast. Reconstr. Surg. 2005, 116, 236–241. [Google Scholar] [CrossRef] [PubMed]
- George, T.N.; Kotlarek, K.J.; Kuehn, D.P.; Sutton, B.P.; Perry, J.L. Differences in the tensor veli palatini between adults with and without cleft palate using high-resolution 3-dimensional magnetic resonance imaging. Cleft Palate-Craniofacial J. 2018, 55, 697–705. [Google Scholar] [CrossRef] [PubMed]


| Bone Landmark | Abbr. | Location | Definition | Description | Figure |
|---|---|---|---|---|---|
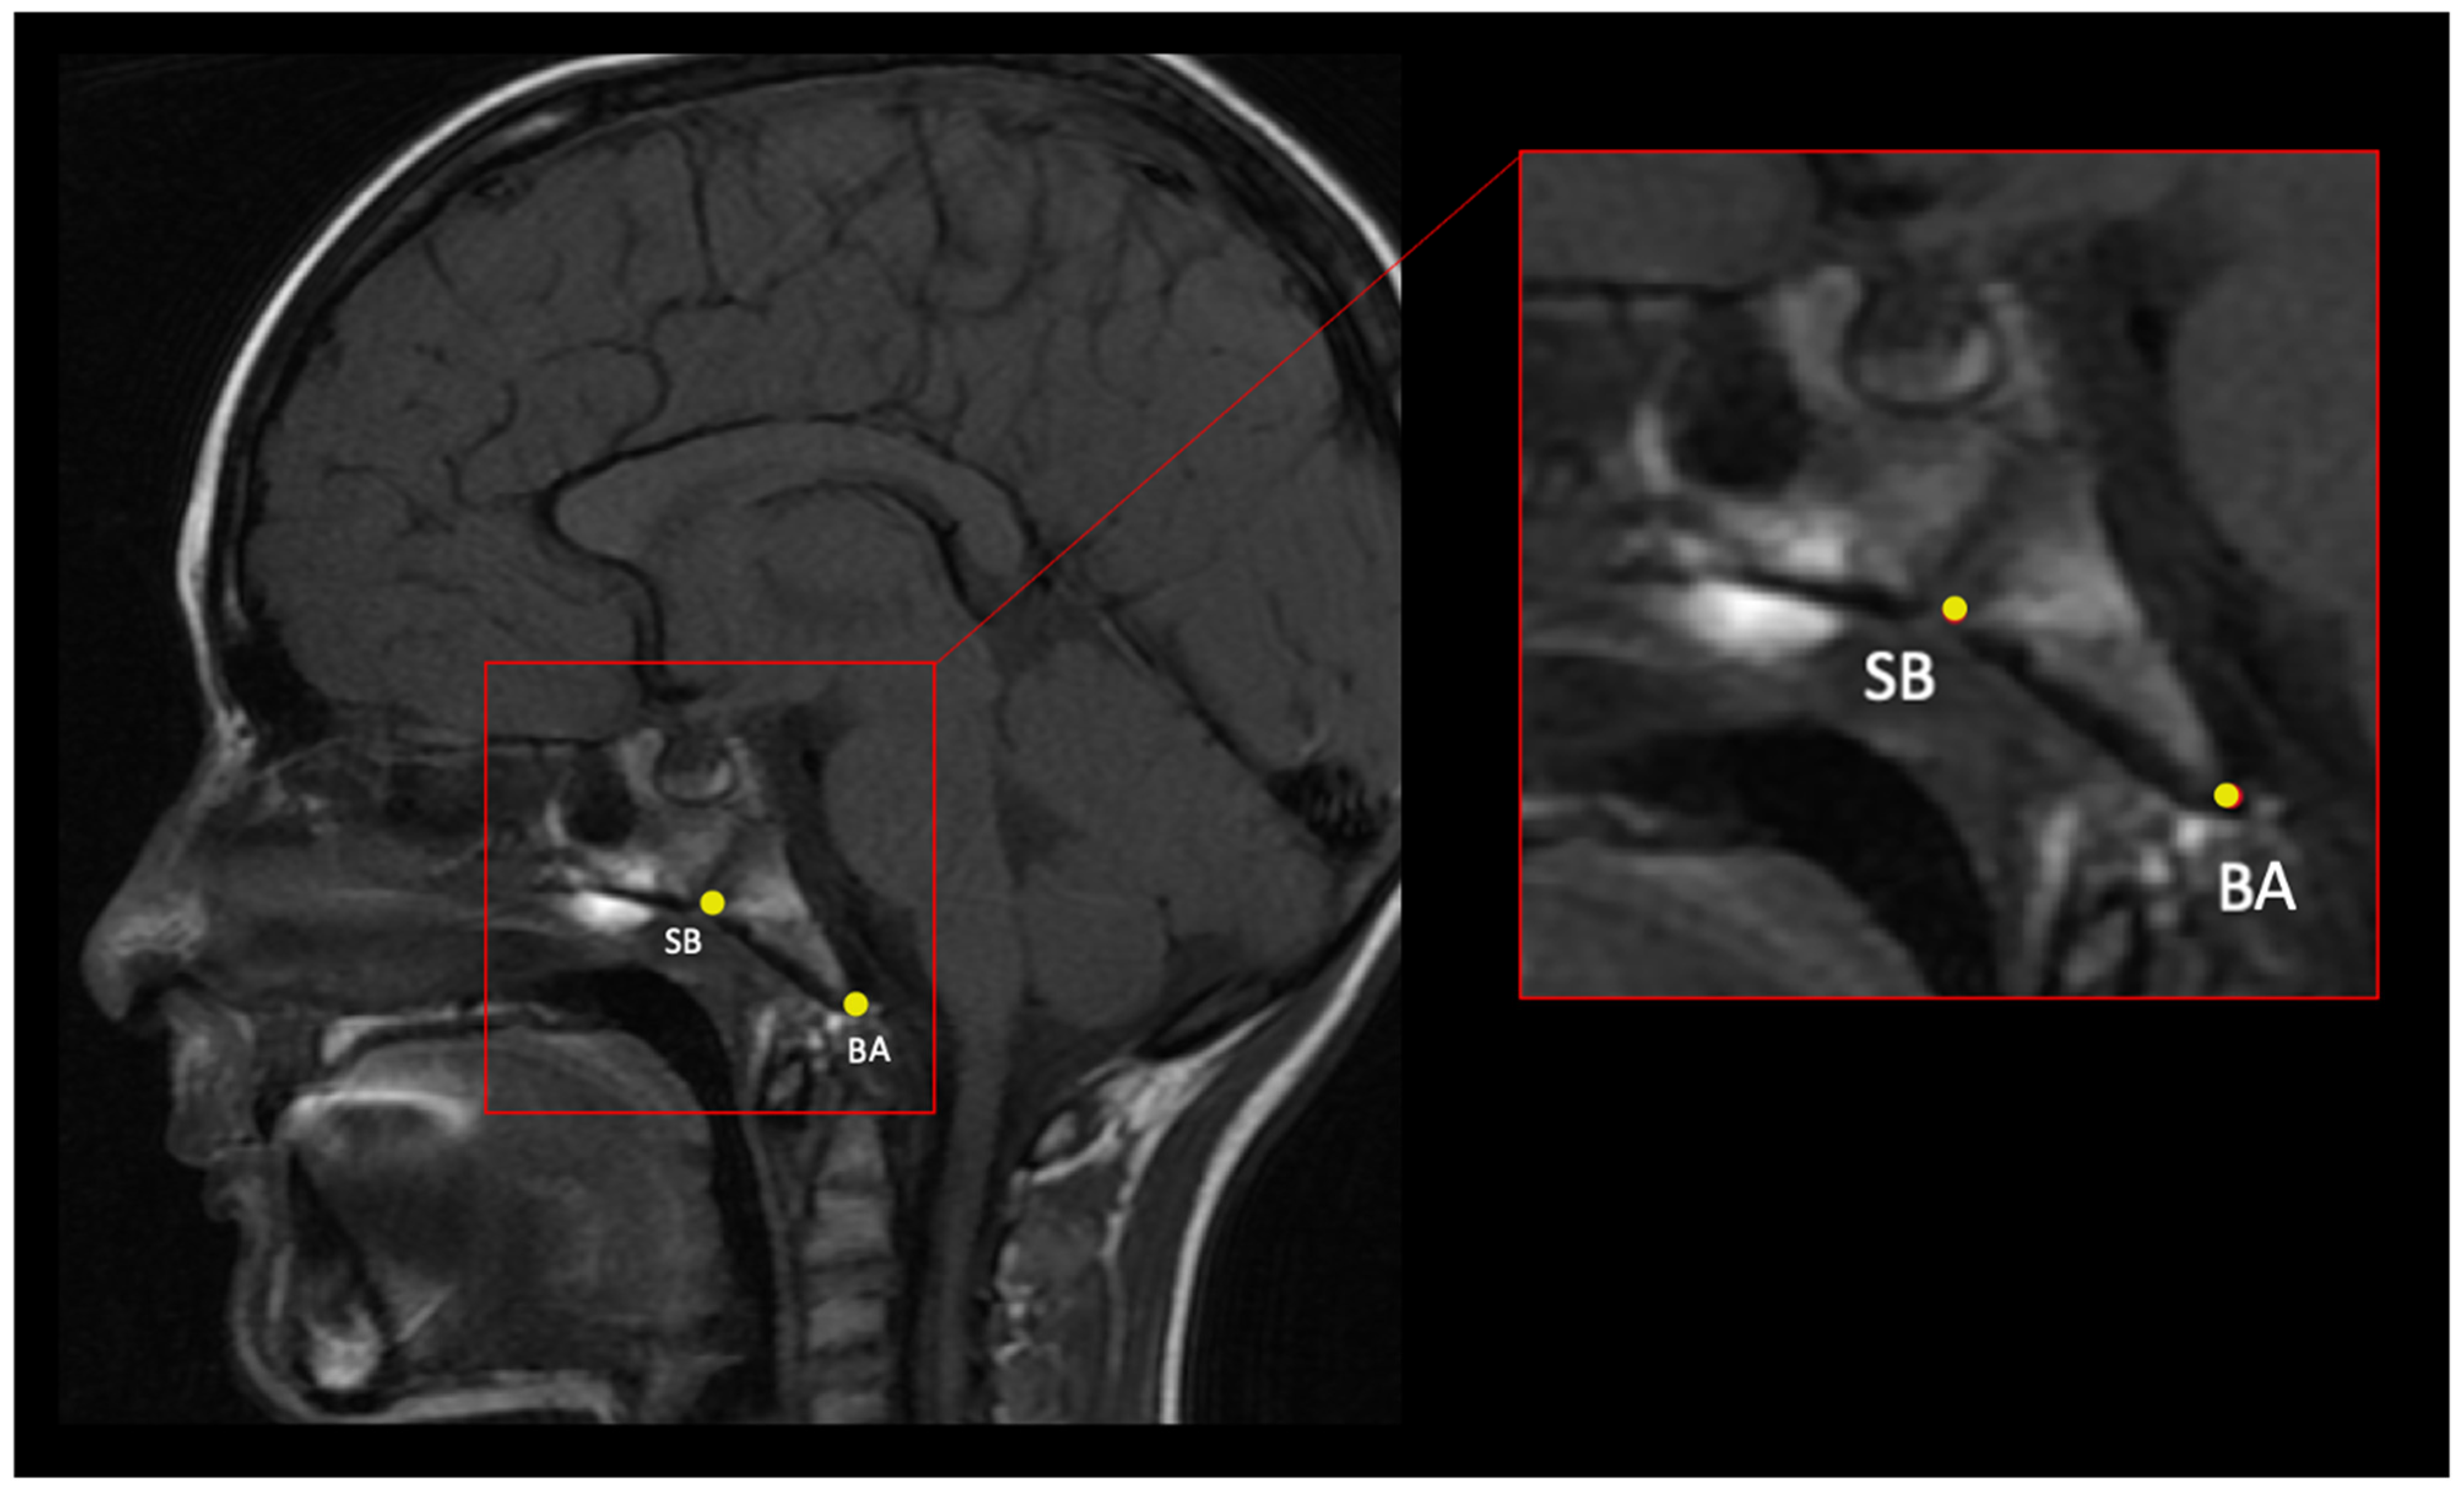
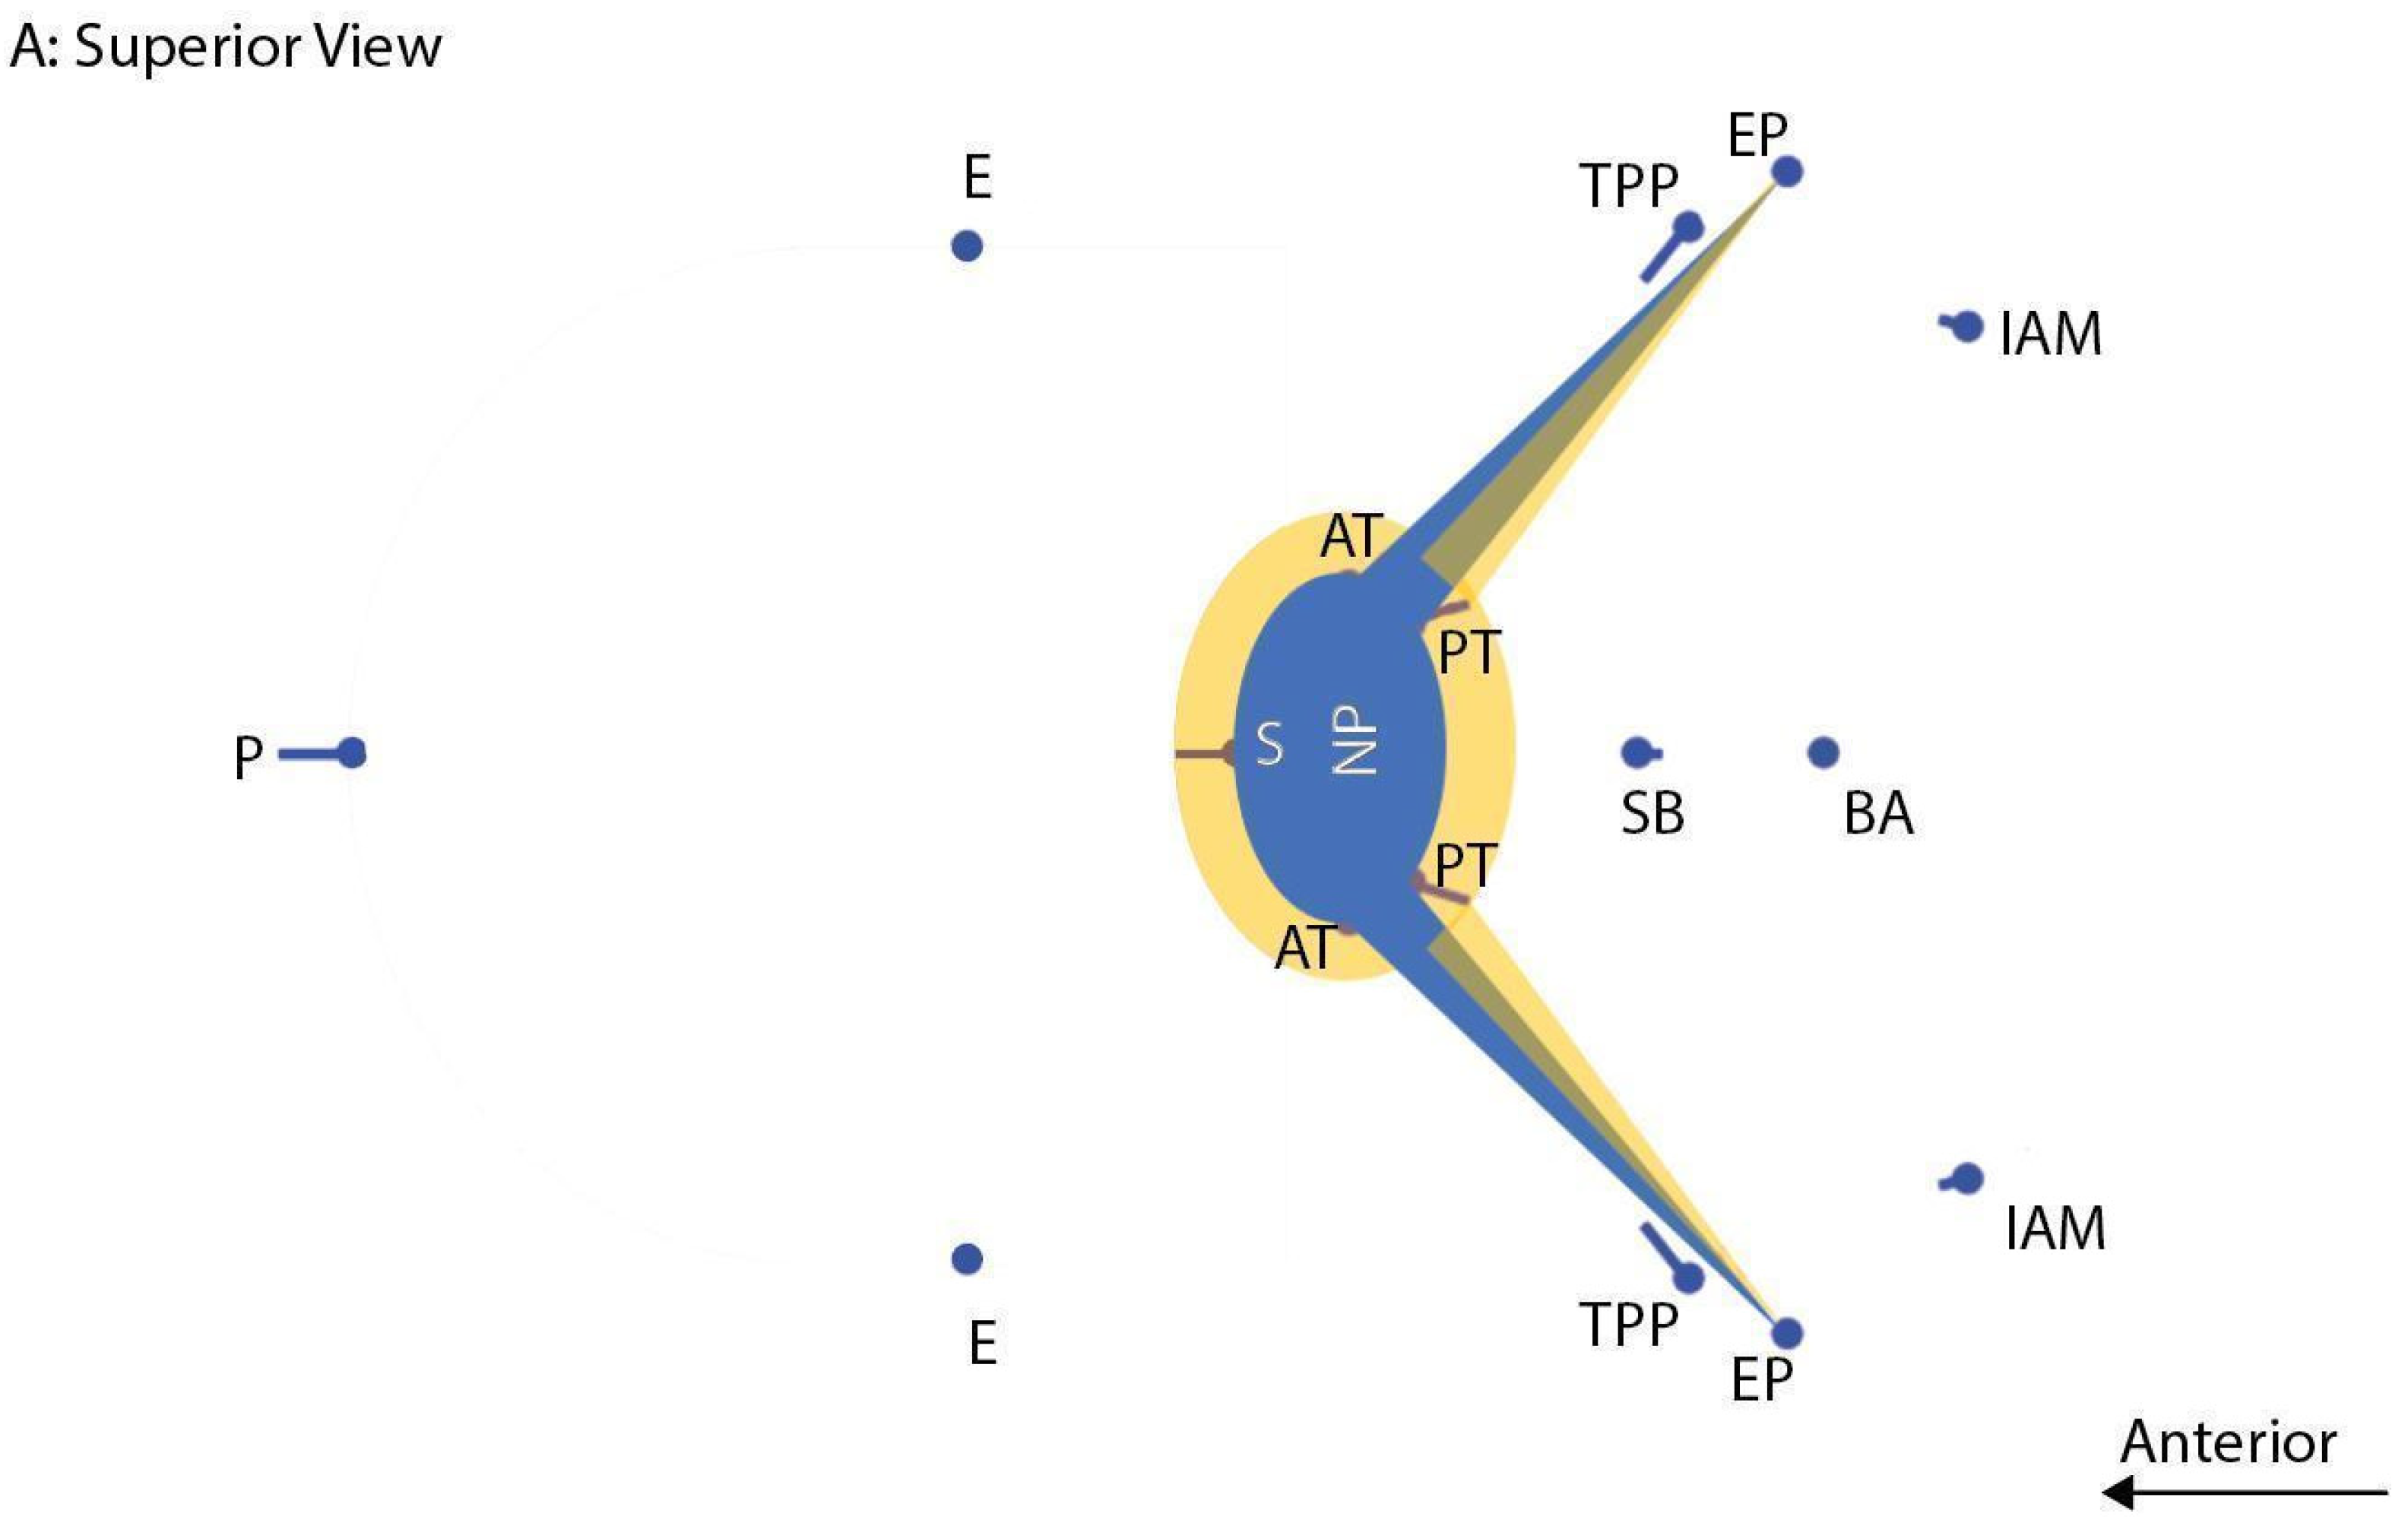
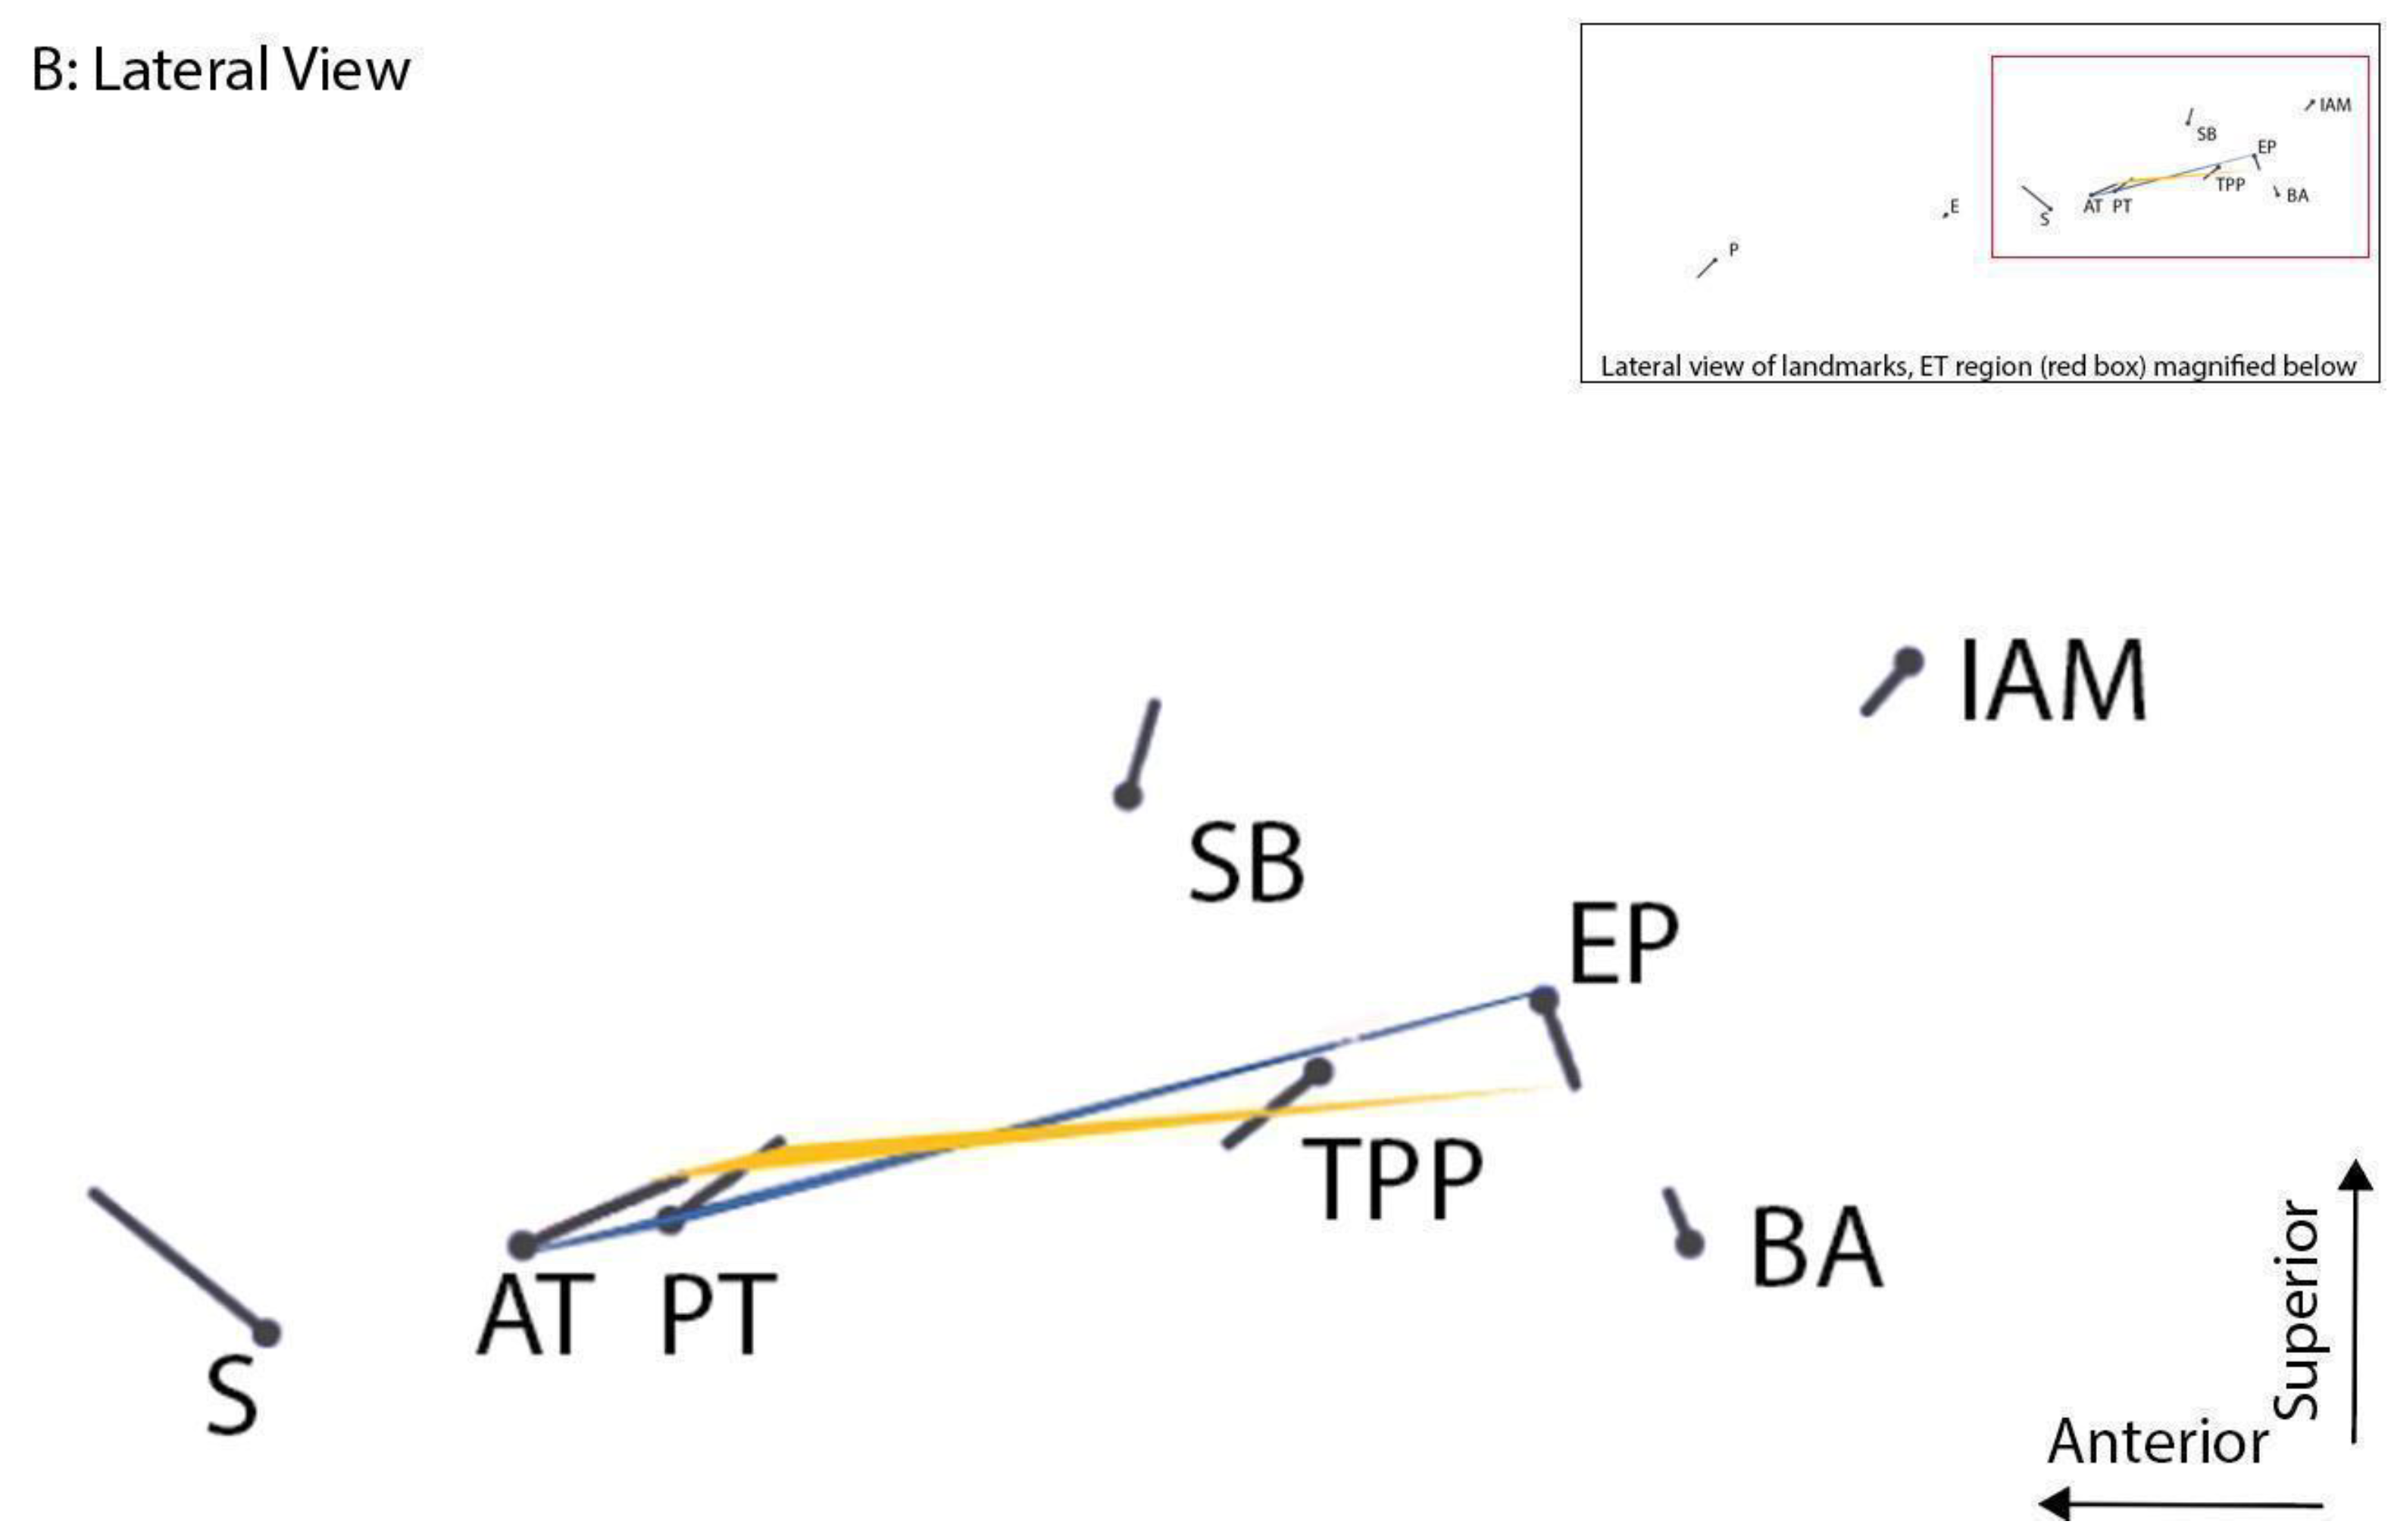
| Sphenobasion | SB | Midline | Midline of spheno-occipital synchondrosis | In a midsagittal plane, identify the clivus and place the landmark on the superior border of the clivus on the external surface in between the sphenoid and occipital bones; this is a cartilaginous plate in children. | Figure 2 |
| Basion (exo-basion) | BA | Midline | Midline of anterior foramen magnum | In a midsagittal plane, identify the most inferior–posterior point on the clivus. | Figure 2 |
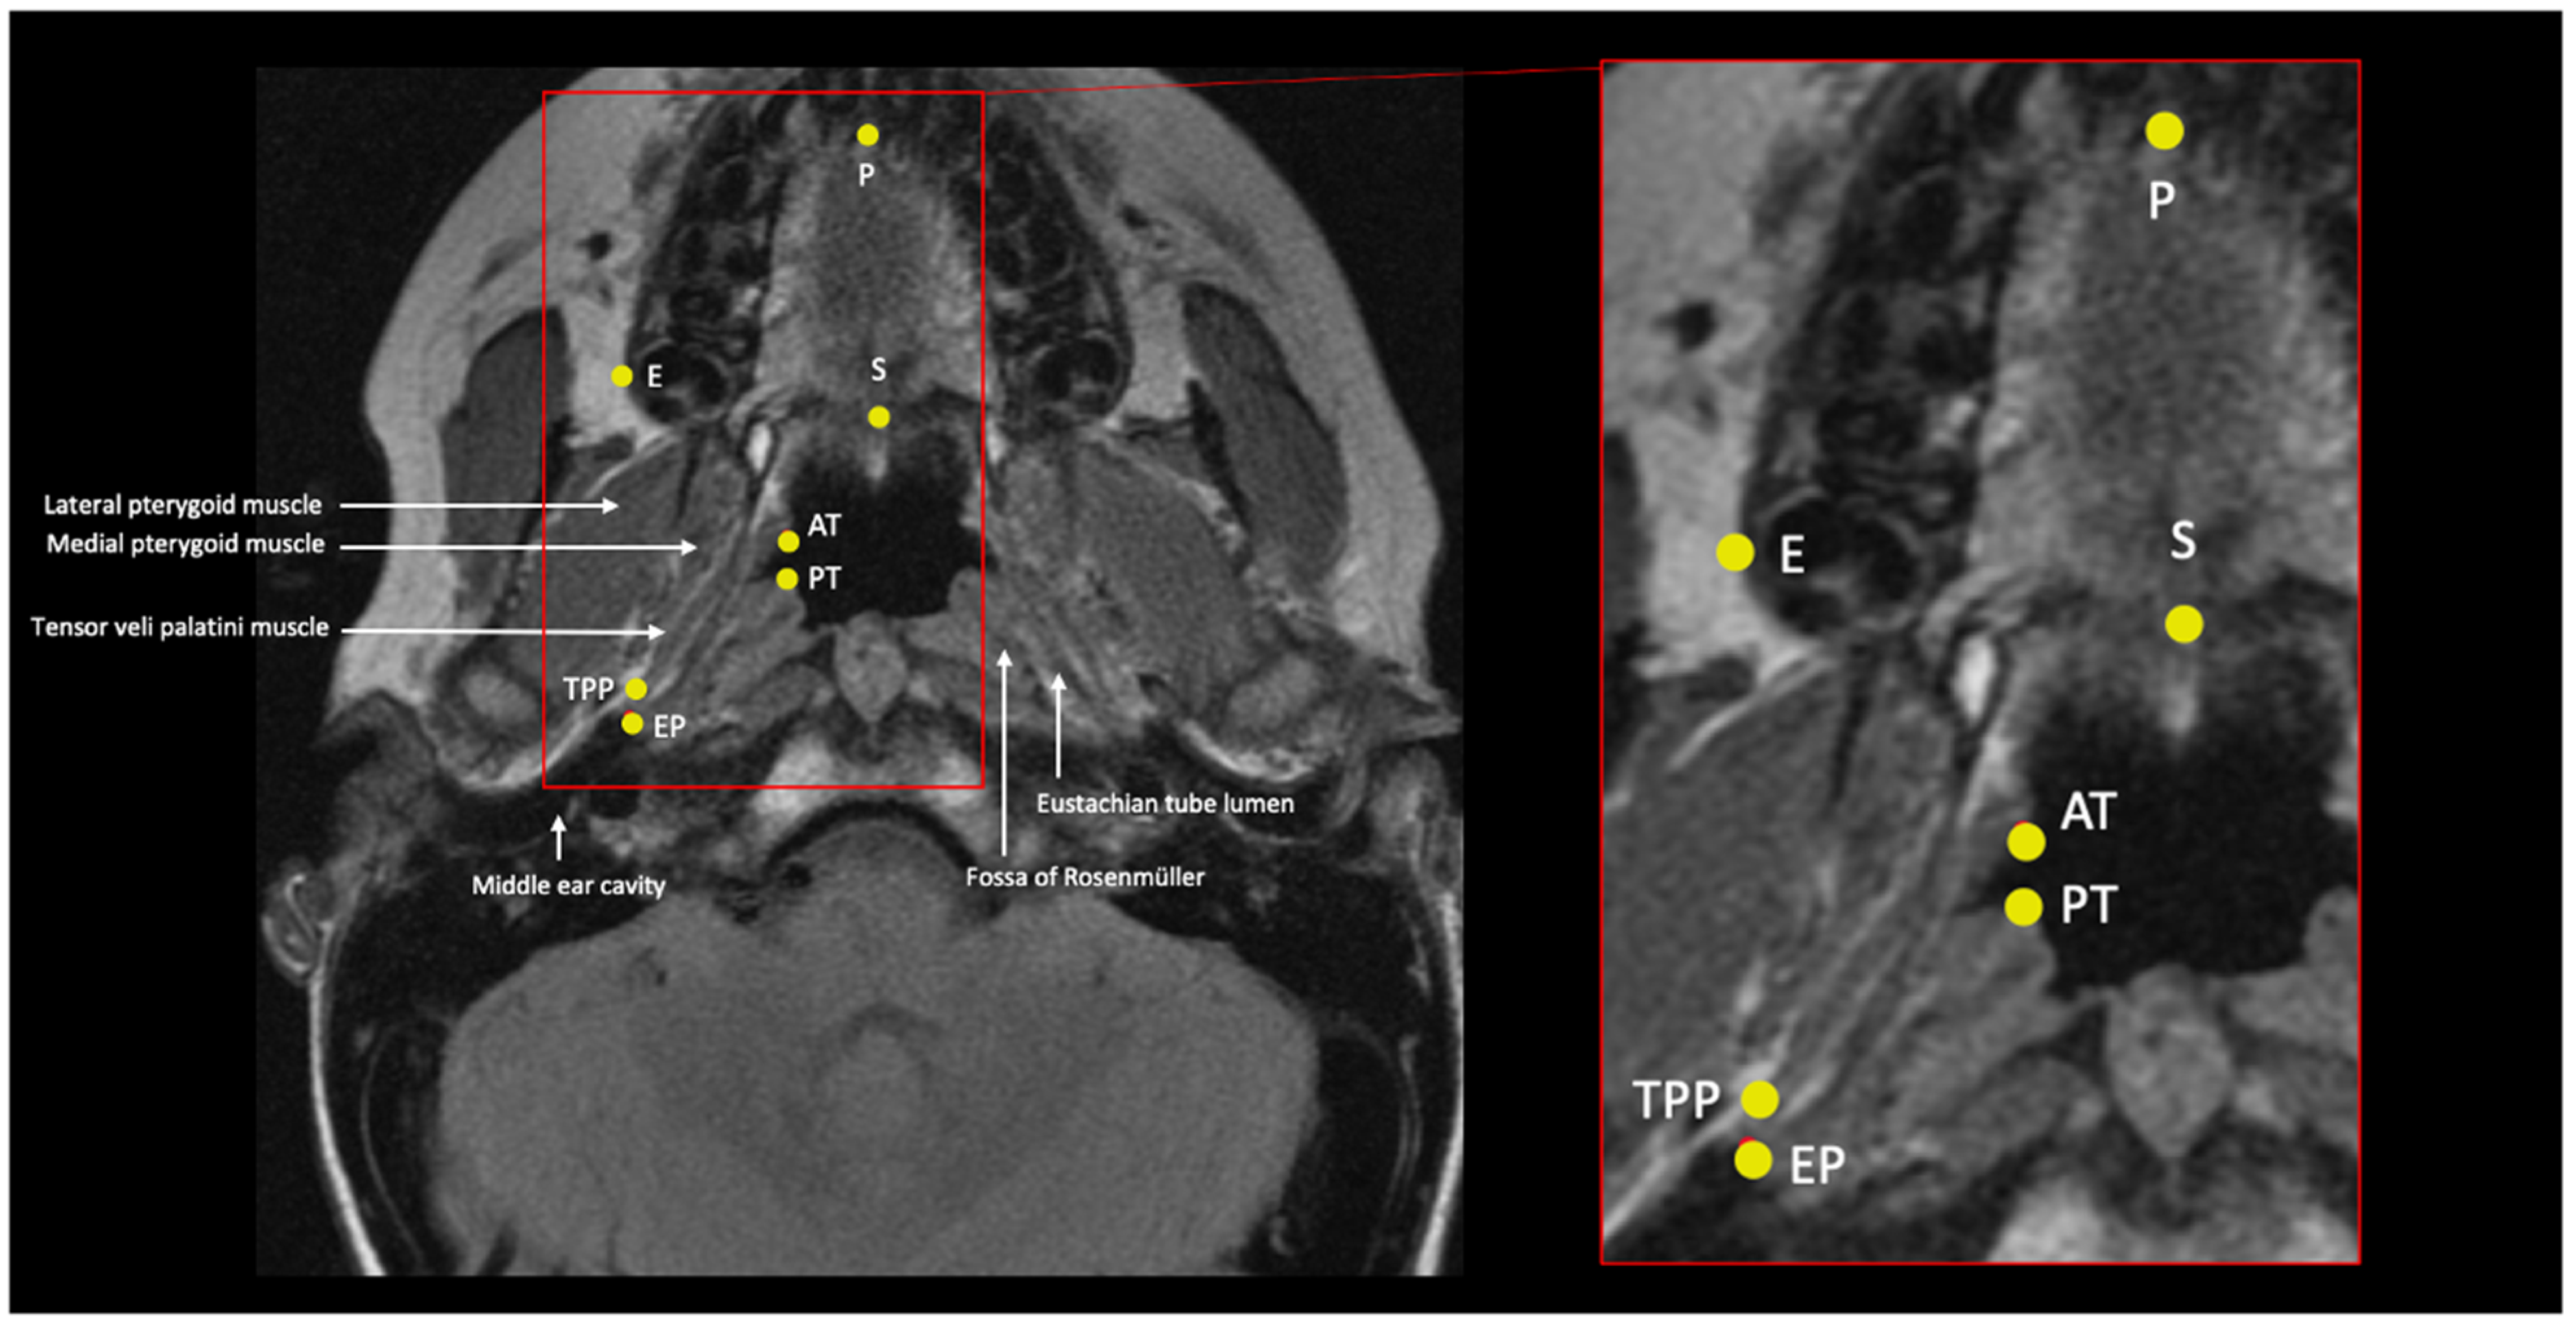
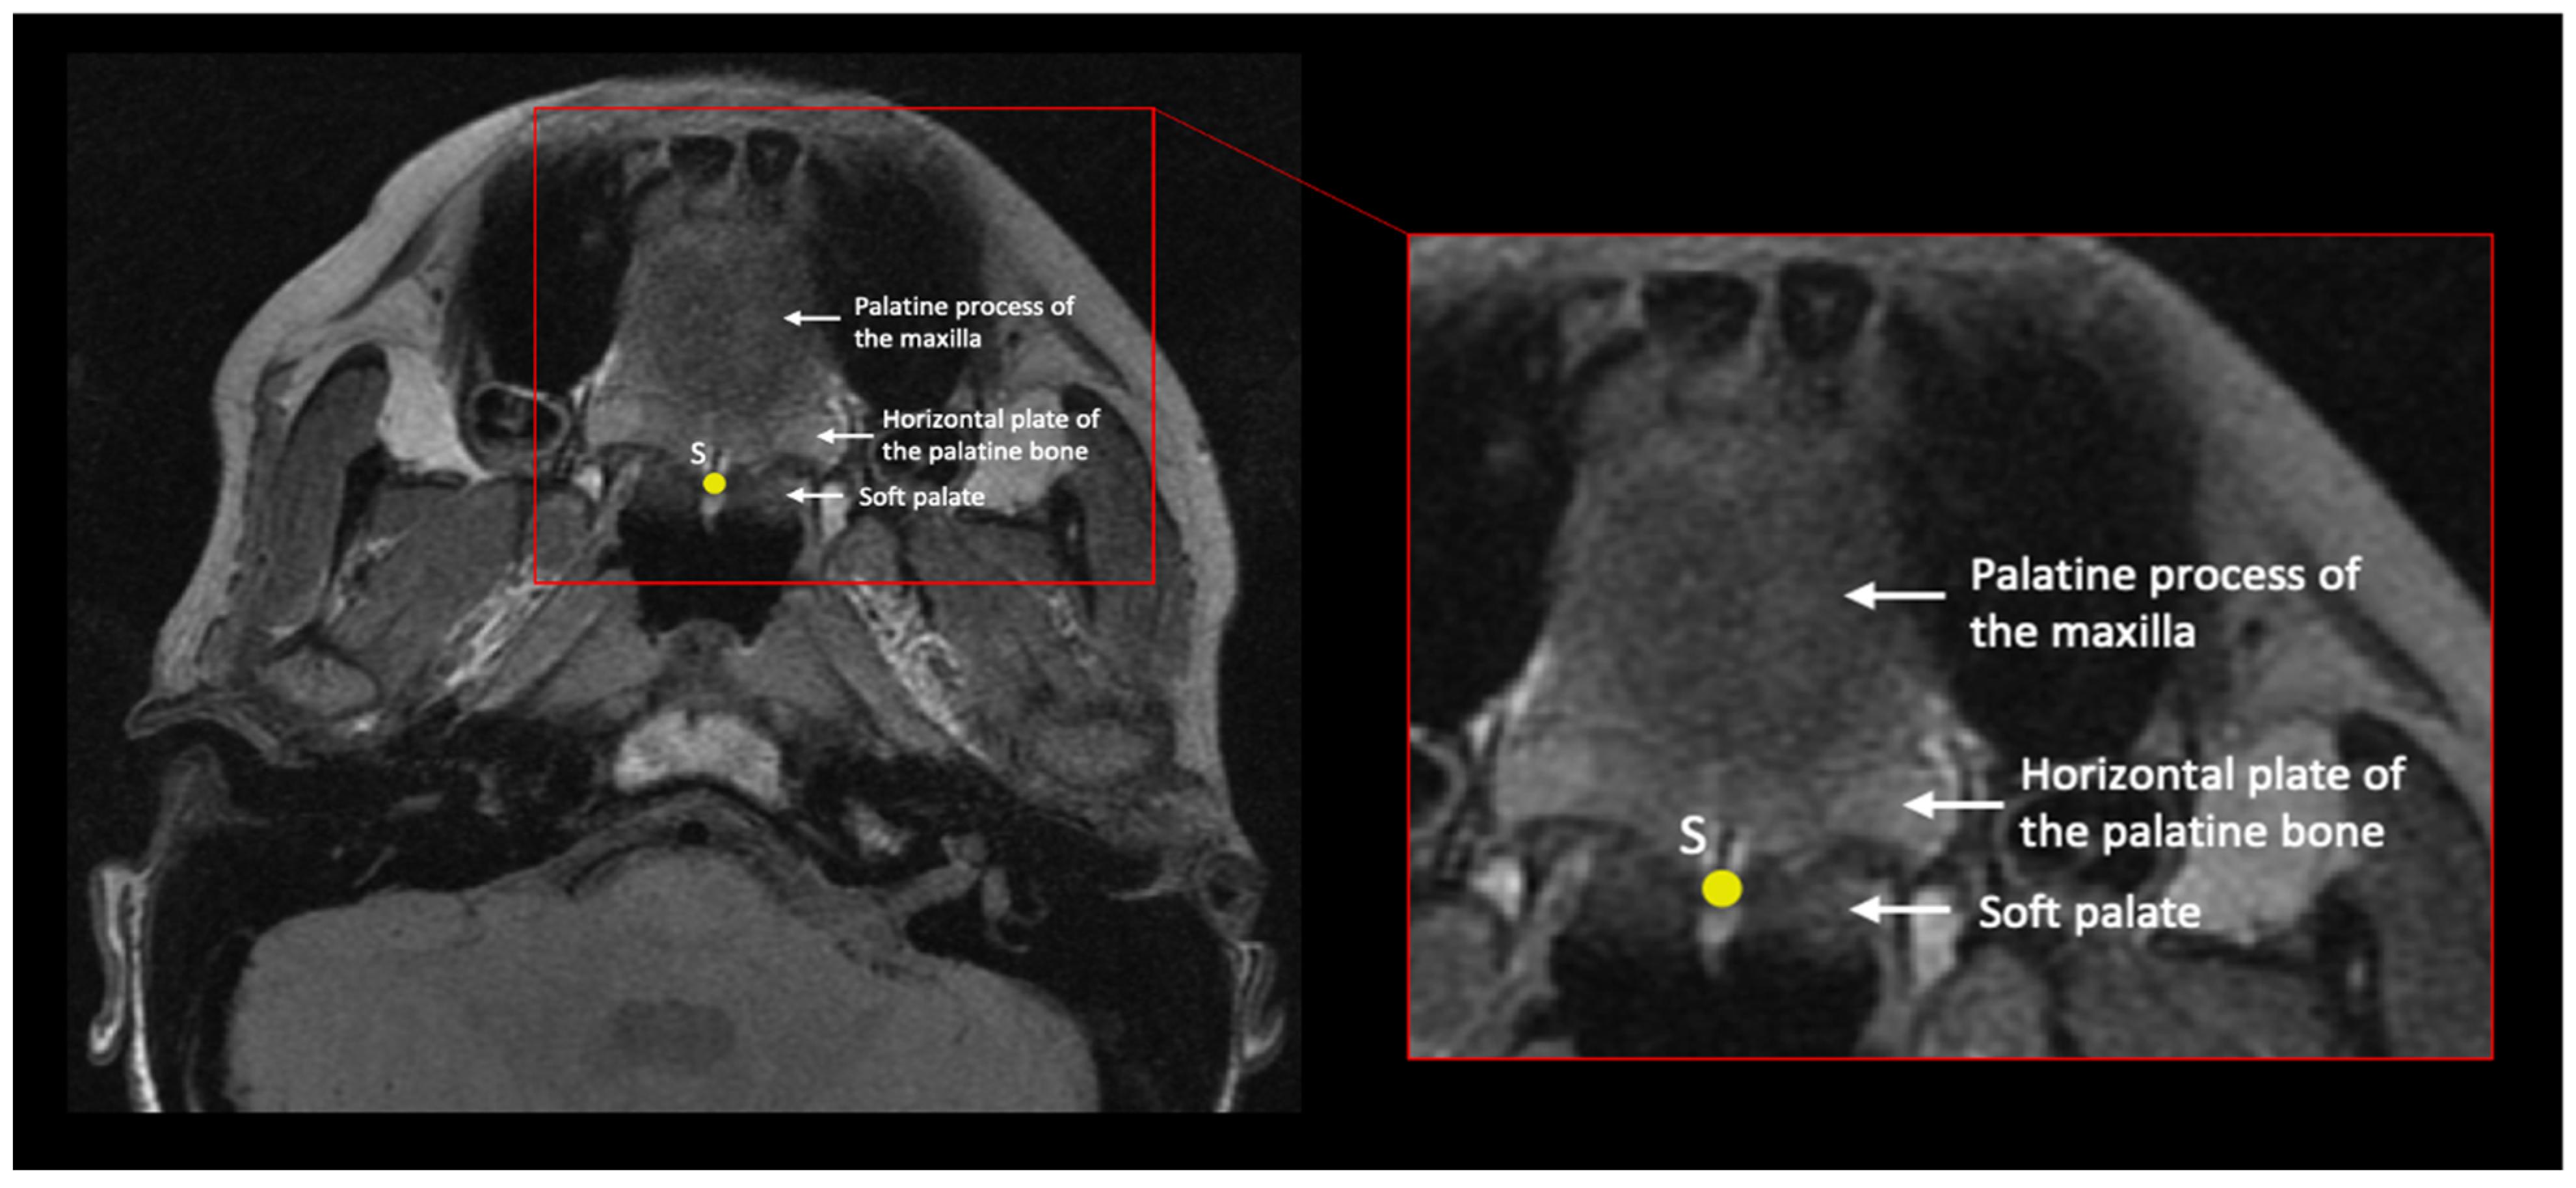
| Staphylion | S | Midline | Posterior maxillary spine | In the oblique axial plane, identify the slice that contains the maxillary palatine process and palatine bones; these form the hard palate. Place the landmark on the most posteromedial point of the palatine palate. | Figure 4 and Figure 5 |
| Prosthion (endoprosthion) | P | Midline | Midline of the anterior palate | In the oblique axial plane, identify the slice that contains the cementoenamel junction of the upper central incisors (the cross-section of the incisors will be oval). Place the landmark on the lingual surface of the palate between the right and left upper central incisors at the level of the cementoenamel junction. | Figure 4 |
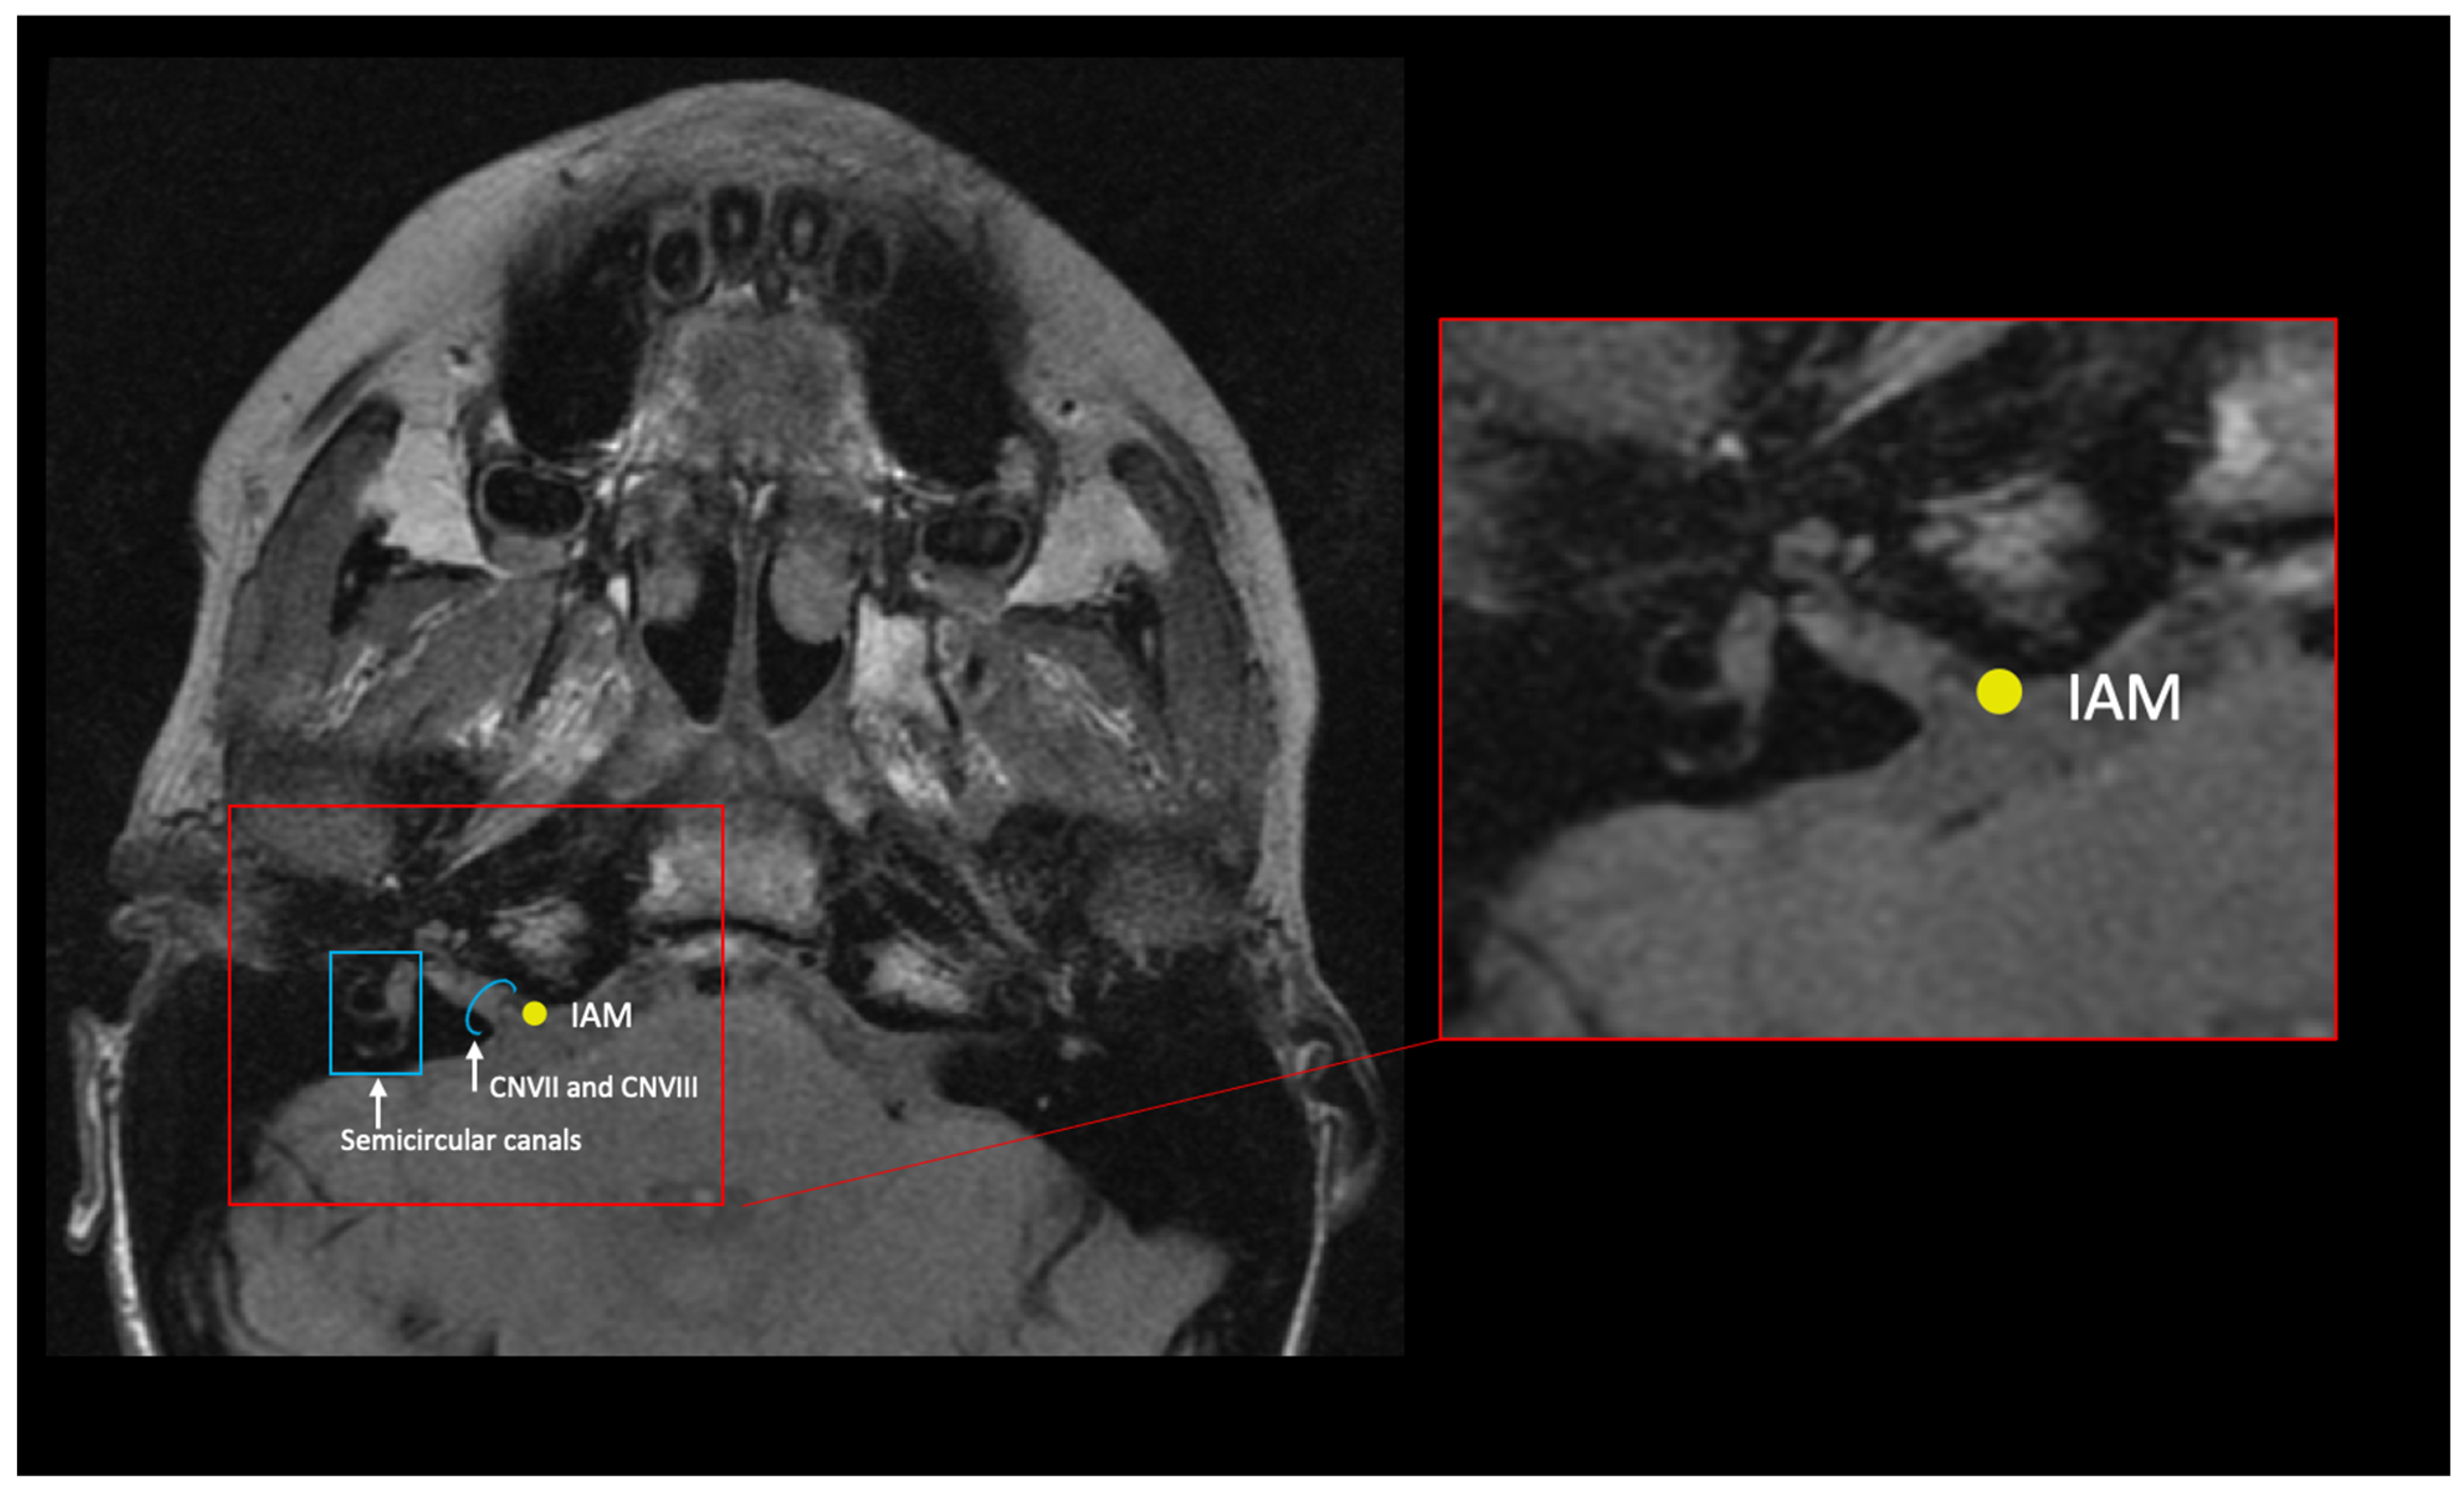
| Internal acoustic meatus | IAM | Right and left | Internal opening of the petrous temporal bone | In the oblique axial plane, identify the facial and vestibulocochlear nerves emerging from the brainstem and follow the nerves medially. Locate the point of greatest curvature at the anterior entry to the IAM. | Figure 3 |
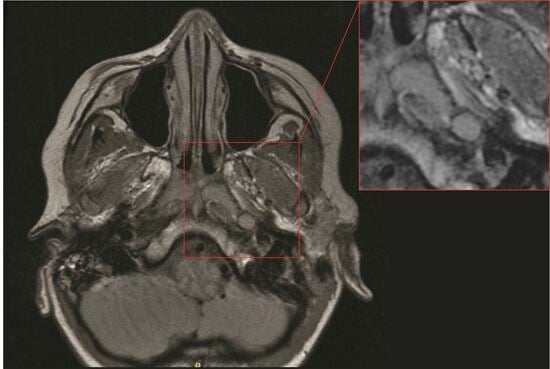
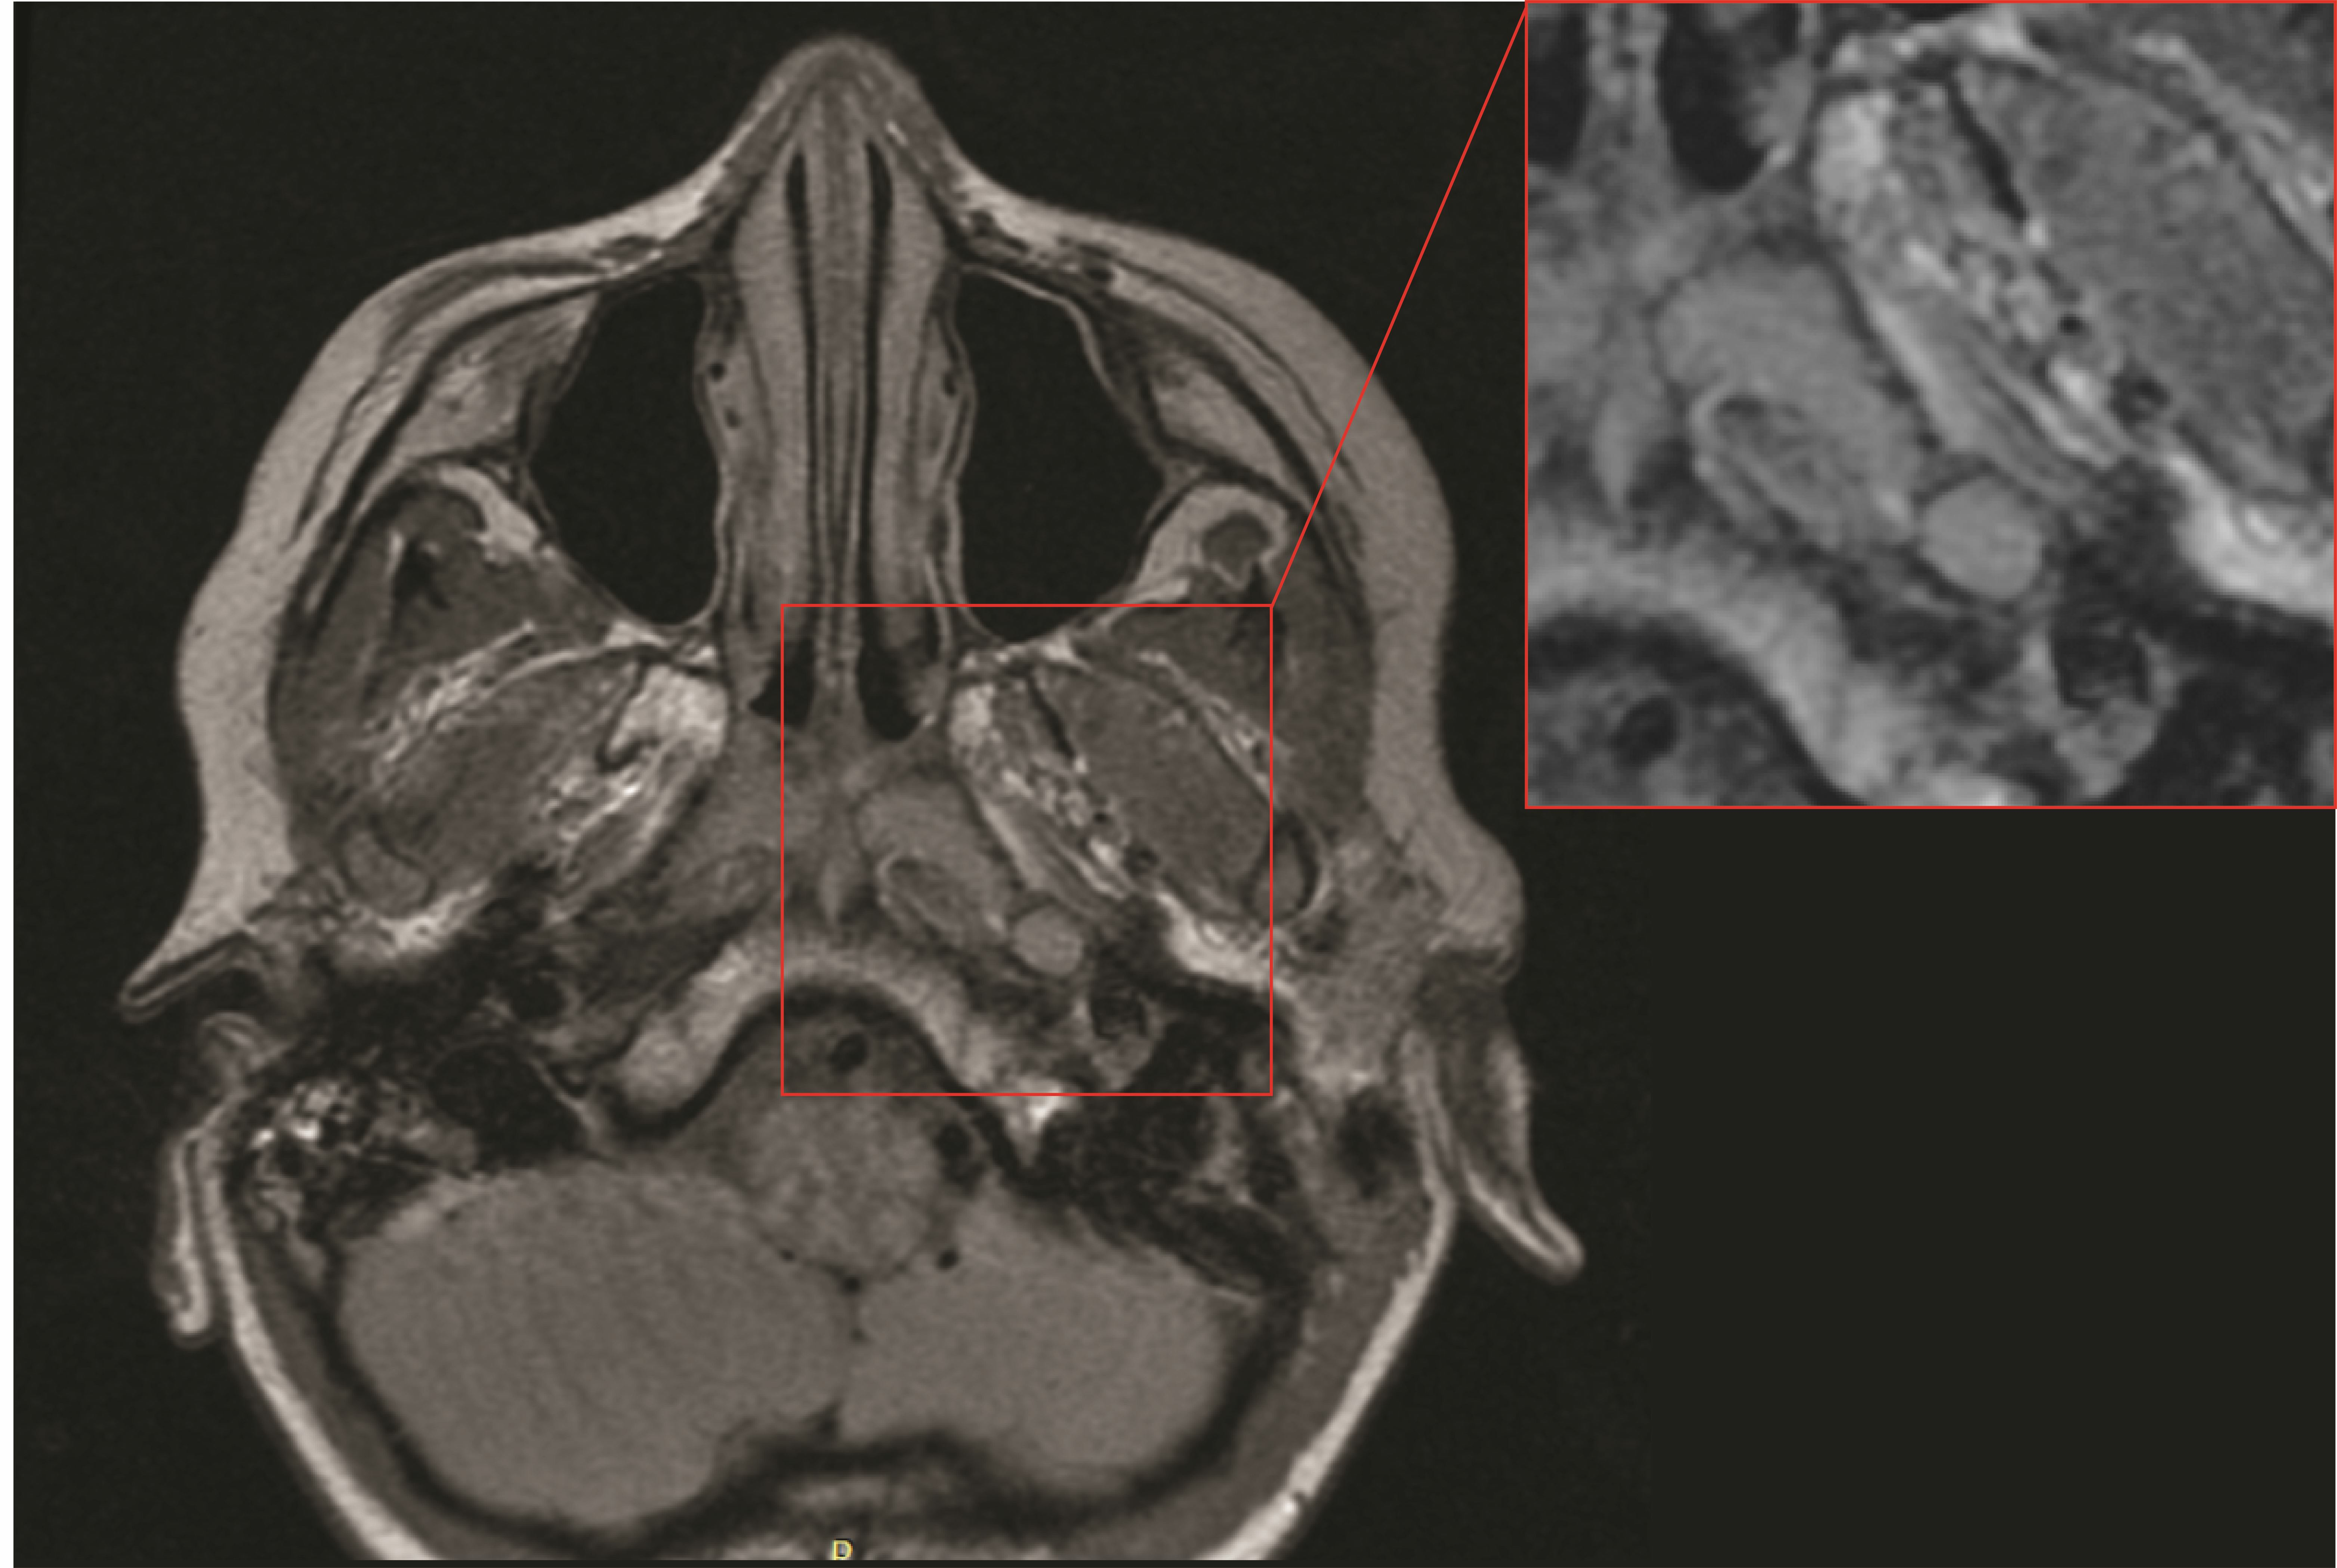
| Eustachian point | EP | Right and left | Junction of bony and cartilaginous ET | In the oblique axial plane, identify the external acoustic meatus, and follow the space into the middle ear cavity, and place the landmark at the most anteromedial opening. | Figure 4 |
| Proximal tensor veli palatini attachment point | TPP | Right and left | Origin of the TVP muscle at the skull base | In the oblique axial plane, identify the TVP muscle fibers and follow them proximally (toward the cranial base), and place the landmark at the most proximal insertion. | Figure 4 |
| Anterior torus tubarius | AT | Right and left | Anterior border of the distal ET | In the oblique axial plane, identify anterior and posterior medial ends of the nasopharyngeal orifice of the ET. | Figure 4 |
| Posterior torus tubarius | PT | Right and left | Posterior border of the distal ET | Figure 4 | |
| Ectomolare | E | Right and left | Most lateral point on the exterior surface of the alveolus | In the oblique axial plane, identify the slice with the widest alveolus and palate. Place the landmark on the external surface of the alveolus at the widest point. | Figure 4 |
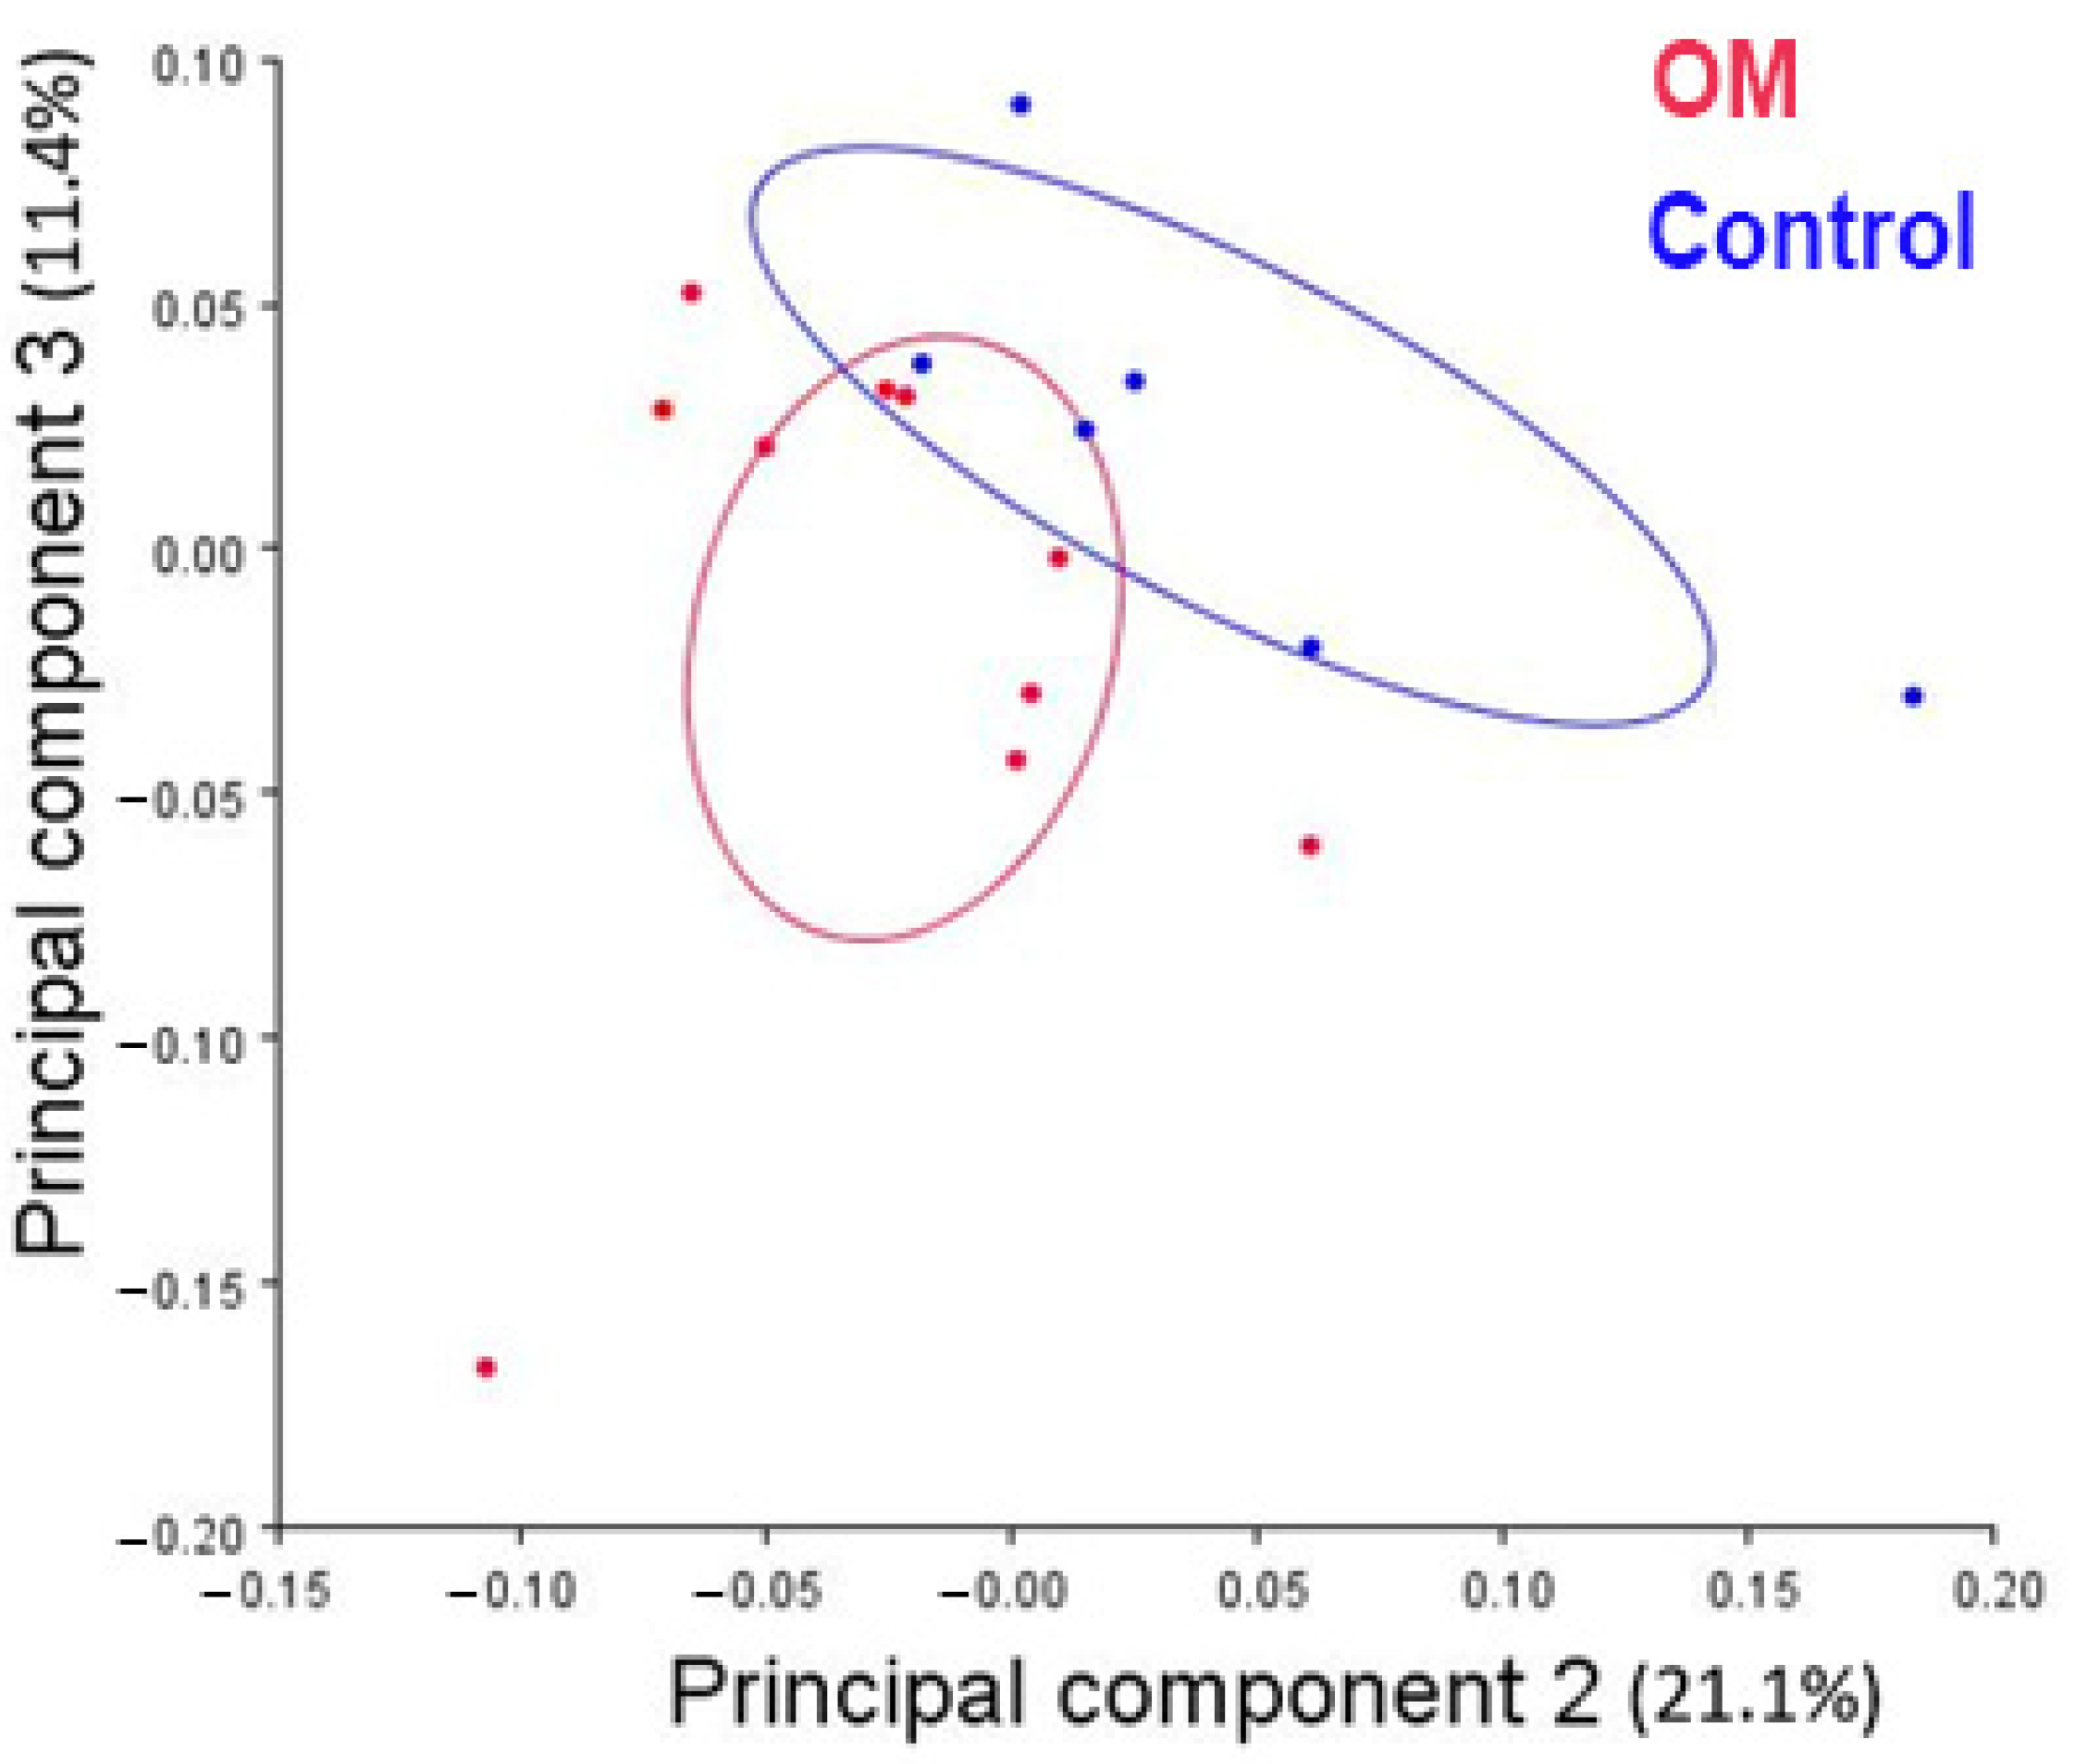
| PC | % Variance | Total Variance | Cranial Base | Eustachian | Torus Tubarius |
|---|---|---|---|---|---|
| 1 | 29.8 | 29.8 | Wide (medial/lateral) | Lateral | Anterior |
| 2 | 21.1 | 50.9 | Tall (superior/inferior) | Inferior | High |
| 3 | 11.4 | 62.3 | Short | Inferior | Posterior, superior |
Disclaimer/Publisher’s Note: The statements, opinions and data contained in all publications are solely those of the individual author(s) and contributor(s) and not of MDPI and/or the editor(s). MDPI and/or the editor(s) disclaim responsibility for any injury to people or property resulting from any ideas, methods, instructions or products referred to in the content. |
© 2023 by the authors. Licensee MDPI, Basel, Switzerland. This article is an open access article distributed under the terms and conditions of the Creative Commons Attribution (CC BY) license (https://creativecommons.org/licenses/by/4.0/).
Share and Cite
Fricano, E.E.; Gremba, A.P.; Teixeira, M.S.; Swarts, J.D.; Alper, C.M. Using Geometric Morphometric Analysis of Magnetic Resonance Imaging to Assess the Anatomy of the Eustachian Tube in Children with and without Otitis Media. Bioengineering 2023, 10, 1115. https://doi.org/10.3390/bioengineering10101115
Fricano EE, Gremba AP, Teixeira MS, Swarts JD, Alper CM. Using Geometric Morphometric Analysis of Magnetic Resonance Imaging to Assess the Anatomy of the Eustachian Tube in Children with and without Otitis Media. Bioengineering. 2023; 10(10):1115. https://doi.org/10.3390/bioengineering10101115
Chicago/Turabian StyleFricano, Ellen E., Allison P. Gremba, Miriam S. Teixeira, J. Douglas Swarts, and Cuneyt M. Alper. 2023. "Using Geometric Morphometric Analysis of Magnetic Resonance Imaging to Assess the Anatomy of the Eustachian Tube in Children with and without Otitis Media" Bioengineering 10, no. 10: 1115. https://doi.org/10.3390/bioengineering10101115